
Modeling the Performance Degradation of a High-Temperature PEM Fuel Cell
by
 , and
, and
Mengfan Zhou
1, 
Steffen Frensch
1,
Vincenzo Liso
1 ,
,
Na Li
1, 
Simon Lennart Sahlin
1,
Giovanni Cinti
2 and
and
Samuel Simon Araya
1,*
1
AAU Energy, Aalborg University, 9220 Aalborg Øst, Denmark
2
Department of Engineering, University of Perugia, Via G. Duranti 93, 06125 Perugia, Italy
*
Author to whom correspondence should be addressed.
Energies 2022, 15(15), 5651; https://0-doi-org.brum.beds.ac.uk/10.3390/en15155651
Submission received: 22 June 2022
/
Revised: 28 July 2022
/
Accepted: 2 August 2022
/
Published: 4 August 2022
(This article belongs to the Special Issue Advances in Hydrogen Energy Ⅱ)
Abstract
:In this paper, the performance of a high-temperature polymer electrolyte membrane fuel cell (HT-PEMFC) was modeled using literature data. The paper attempted to combine different sources from the literature to find trends in the degradation mechanisms of HT-PEMFCs. The model focused on the activation and ohmic losses. The activation losses were defined as a function of both Pt agglomeration and loss of catalyst material. The simulations revealed that the loss of electrochemical active surface area (ECSA) was a major contributor to the total voltage loss. The ohmic losses were defined as a function of changes of acid doping level in time. The loss of conductivity increased significantly on a percentage basis over time, but its impact on the overall voltage degradation was fairly low. It was found that the evaporation of phosphoric acid caused the ohmic overpotential to increase, especially at temperatures above 180 °C. Therefore, higher temperatures can lead to shorter lifetimes but increase the average power output over the lifetime of the fuel cell owing to a higher performance at higher temperatures. The lifetime prognosis was also made at different operating temperatures. It was shown that while the fuel cell performance increased linearly with increasing temperature at the beginning of its life, the voltage decay rate increased exponentially with an increasing temperature. Based on an analysis of the voltage decay rate and lifetime prognosis, the operating temperature range between 160 °C and 170 °C could be said to be optimal, as there was a significant increase in performance compared to lower operating temperatures without too much penalty in terms of lifetime.
1. Introduction
With the expansion of power-to-X (PtX) technologies [1], especially for the production of renewable methanol from renewable electricity and CO2 [2], high temperature polymer electrolyte membrane fuel cells (HT-PEMFC) are gaining rising attention as candidates to readily utilize this easy-to-transport renewable liquid fuel [3]. Therefore, they are being explored for various applications, such as backup [4], auxiliary power units (APU) [5], micro-combined heat and power generation (CHP) [6], automotive (both as range extenders and main power units) [7,8] and for maritime applications [9].
One of the main practical advantages of HT-FEMFCs compared to low-temperature PEM fuel cells (LT-PEMFC) is their ability to operate on reformate gas instead of pure hydrogen, without the need for a prepurification step. HT-PEM fuel cells can tolerate CO poisoning of up to 30,000 ppm and sulfur contamination of up to 20 ppm compared to a maximum of 30 ppm and less than 10 ppm, respectively, in low-temperature PEM fuel cells (LT-PEMFC) [10]. Therefore, among fuel cell systems based on a reformate fuel, HT-PEMFCs can allow a more compact configuration as there is no need for either gas cleaning or humidification. This also means that the existing fuel distribution infrastructure can be utilized with only minor modifications for renewable liquid fuels, such as methanol. From a system point of view, operating at higher temperatures also comes with easier heat management and better options for waste heat recovery for increased system efficiency [11]. One major drawback compared to low-temperature PEM fuel cells (LT-PEMFC) is the accelerated degradation as a result of the higher operating temperatures. It is also known that HT-PEMFCs degrade faster under cycling operation modes, such as load cycling [12], potential cycling [13], thermal cycling and start/stop cycling, which can exacerbate the degradation of an HT-PEMFC [12,14]. However, cycling is also detrimental to LT-PEMFCs. Borup et al. [15] investigated whether the number of cycles or the time at high potentials was crucial for voltage degradation due to the cycling of LT-PEMFCs, and found that the number of cycles determined the degradation more than the dwell time at high potentials.
The break-in phase in HT-PEMFC, where the cell is operated at controlled operating conditions at the beginning of its life, is crucial for the voltage decay rate throughout the fuel cell lifetime and can last more than 100 h [16,17]. Generally, following the break-in phase, a voltage degradation of a fuel cell can be divided into three regions according to Buchi et al. [18]: a steep decrease in performance that seems to be of logarithmic behavior, followed by a moderate decay rate and a mostly linear phase, and a final phase of a steep and exponential increase of the voltage decay rate eventually leading to cell failure. The initial logarithmic behavior followed by a more linear decrease was also found by Schmidt and Baurmeister [19], who called it a “typical” behavior, and similar trend with at least two different regions of voltage degradation rates can be observed in [20,21].
There are different degradation mechanisms by which the above mentioned nonideal operating conditions, such as cycling operation mode affect the voltage decay rate. One such mechanism is the loss of active catalyst area, which is an important degradation mechanism in fuel cells since platinum is used as catalyst. Therefore, any improvement connected to a more efficient and longer use of the Pt catalyst, has an important financial impact, since this contributes significantly to the overall cost of a fuel cell. Particle coalescence, which is the phenomenon by which the nanoscale platinum particles grow over time, was found to be a major contributor to the loss of electrochemical surface area (ECSA) [21]. This can be caused by thermal sintering in the form of particle agglomeration or Ostwald ripening [22]. Ostwald ripening is also found to be favored at elevated temperatures as a result of the thermodynamically driven process that occurs spontaneously as larger particles are energetically favorable over smaller particles [23]. The same can be said for particle agglomeration, where smaller Pt particles migrate and agglomerate to form bigger particles. It has been reported that the formation of soluble ions such as Pt2+ is an important mechanism that leads to catalyst degradation [24].
The loss of membrane conductivity is another important degradation mechanism that can be caused by the degradation of the polymer membrane via the dehydration of the phosphoric acid at higher temperatures and chemical oxidative degradation at higher potentials [25]. This can weaken the mechanical stability of the membrane and exacerbate phosphoric acid (PA) loss from the polybenzimidazole (PBI) membrane through evaporation and through acid movement from the membrane to the catalyst layer (CL) [26]. Furthermore, membrane thinning as a result of these mechanisms can facilitate cross-leakage of the reactant gases [26]. The conductivity of the membrane is determined by several parameters including temperature, acid doping level (DL) and relative humidity [27], where higher levels of all these parameters favor the membrane conductivity. However, compared to Nafion® in LT-PEMFCs, the relative humidity has much less influence on the conductivity of PBI membranes [28,29].
The data in the literature about the effect of contaminated fuel were found to be inconsistent and not sufficient for a proper comparison due to different fuel compositions and varying experimental methods used. Kannan et al. [30] worked with a simulated reformate but followed a unique cycle pattern that is hard to compare to other works. Schmidt [31] experimented with fuel that besides hydrogen consisted of water vapor, CO2, CO and sulfur, but they did not find any difference in voltage decay compared to just hydrogen and water vapor. Nonetheless, the work of Moçotéguy et al. [32,33] suggests that a reformate as a fuel leads to a higher degradation compared to pure hydrogen. It has to be considered that their studies were carried out on a stack level, which might also negatively influence degradation as it includes stack losses distributed over the number of cells. The main degradation mechanism when operating under contaminated fuel can be said to lower catalyst utilization due to the impurities covering the active catalyst area [34].
In this work, a literature survey on the HT-PEMFC degradation mechanisms was done and a lifetime prognosis model that can help predict degradation patterns was prepared. Literature data on Pt particle agglomeration and Pt loss were used to model the degradation due to activation losses, and data on membrane conductivity loss due to phosphoric acid loss were used to simulate the ohmic losses. Moreover, a data-based empirical model for the voltage decay rate was developed and analyzed for different operating temperatures. Table 1 shows a summary of the literature survey on degradation data for HT-PEMFCs, some of which have been used in the current modeling work.
2. Modeling Approach
The aim of this work was to find trends from the literature and obtain some mathematical expressions for the known degradation mechanisms. Therefore, the degradation model and submodels in this paper were based on a literature survey on degradation mechanisms and rates. The investigated mechanisms and the modeling approach are summarized in this section. The data collected from the literature on HT-PEMFC degradation that are summarized in Table 1 were used as the basis for the modeling work. In the table, std represents standard operating conditions, which are the conditions recommended by BASF for MEA break-in and consequently the most commonly used during durability experiments. These conditions are a temperature of 160 °C, current density of 0.2 , pressure of 1 atm and anode and cathode stoichiometric ratios of 1.2 and 2, respectively.
A data-based degradation model was developed in MATLAB/SIMULINK. The parameters that influence voltage degradation were identified, and among them it was found that temperature was the most available data in the literature, and therefore, the most suitable parameter to model. The loss of electrochemical active area (ECSA) and the loss of conductivity are important degradation mechanisms in HT-PEMFCs. Therefore, based on the data and the knowledge of the chemical and physical processes that cause these degradation mechanisms, a mechanistic model was developed. Below, the model development steps, tools and assumptions are described.
The model consisted of a performance model, which developed into a degradation model. First, the degradation was described mechanistically based on the mechanisms that caused it and afterwards a fully empirical model based on voltage decay rates was suggested. The work focused on a cell-level degradation, and therefore, possible deviations due to stack behavior were not considered. The following assumptions were used throughout this paper [43]:
- There are no gradients, i.e., all parameters are considered uniform across the cell.
- All fluids are ideal and well mixed.
- The product water at the cathode is in vapor phase.
- The anode overpotential is neglected.
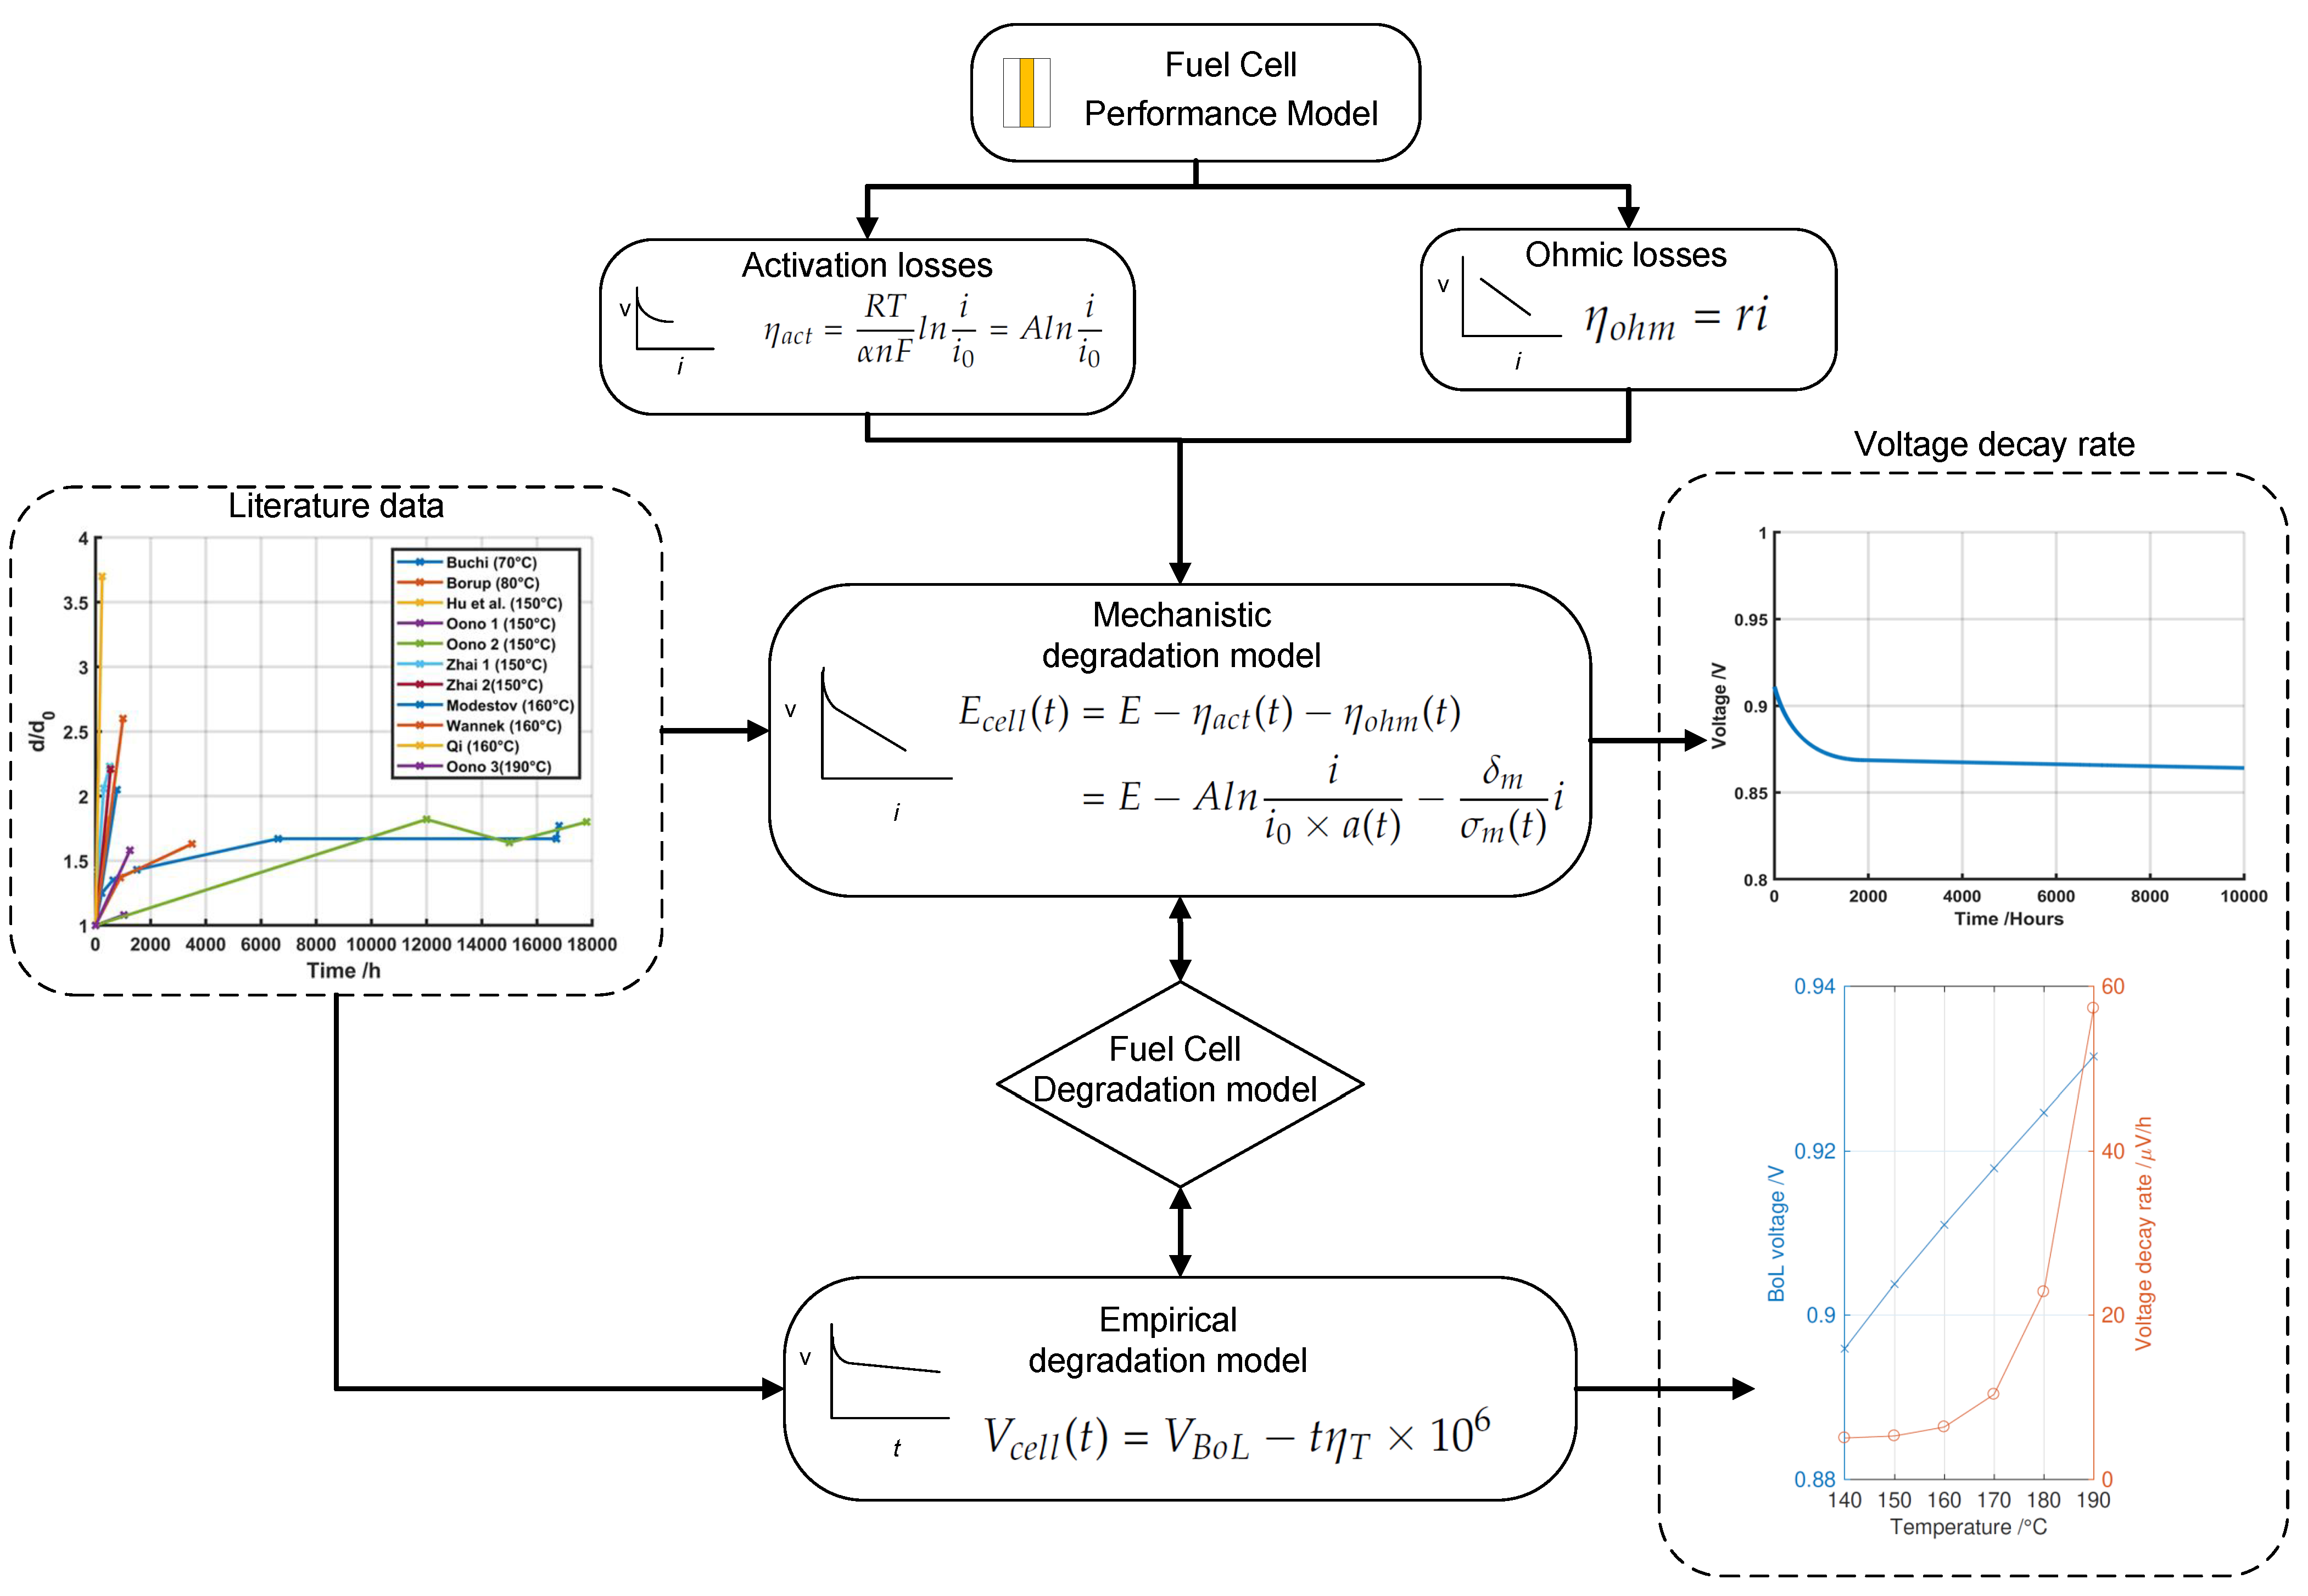
The modeling approach used in the current work is summarized in Figure 1.
2.1. Fuel Cell Performance Model
The proposed model was based on the Nernst potential lowered by voltage losses [44]. The current work focused on the activation and ohmic losses. The concentration overpotential was not implemented in the model as it was less pronounced at the previously defined standard operating conditions. Moreover, mass transport problems can be mitigated by increasing the stoichiometric ratios [45]. The Nernst potential was calculated according to [44]:
where is the reversible cell voltage (V), R is the universal gas constant (), T is the operating temperature (), n is the number of electrons, F is the Faraday constant (), and Q is the reaction quotient. The reversible cell voltage is a function of temperature:
where is the reversible cell voltage at standard conditions and is a temperature coefficient, [46]. The temperature coefficient was derived from the temperature dependence of and the reaction quotient and Q was calculated as:
where the numerator is the product activities, , each raised to the power of their stoichiometric coefficient and the denominator is the reactants’ activities, , each raised to the power of their stoichiometric coefficient . All activities refer to a time t.
2.1.1. Activation Losses
The activation losses were calculated according to Tafel’s equation, shown in Equation (4).
where is the charge transfer coefficient, i is the current density (A/cm2), is the exchange current density (A/cm2) and A is the Tafel slope (V).
The oxygen reduction at the cathode is the slowest activation process in the fuel cell and limits the rate of charge transfer [47], whereas the reaction kinetics at the anode are orders of magnitudes faster in terms of exchange current density [48]. Therefore, the anodic activation overpotential was neglected. The exchange current density was a function of temperature and acid concentration. The implementation was done according to [43], where the acid concentration was expressed as the mole fraction of phosphorous pentoxide (P2O5) as shown in Equation (5). It increases with increasing temperature and decreasing acid concentration. Even though the charge transfer coefficient depends on temperature [49], in the current work it was considered as a constant at 0.5 due to inconsistent literature data where it varied between 0.2 and 0.8 under similar conditions [29,50]. Generally, a high disagreement for both exchange current density and charge transfer coefficient can be noticed in the literature [34,43,46,49]. The exchange current density was defined as follows [43]:
where is the molar fraction of P2O5, and a and b are coefficients for exchange current density, given by = 6.8462 × 10, = −2.2910 × 10, = 7.9650 and = 2.1203.
2.1.2. Ohmic Losses
The ohmic overpotential was implemented in the form of Ohm’s Law, Equation (6), which in this work was assumed to refer to the membrane resistance alone and neglected the contribution of the catalyst layer (CL) and gas diffusion layer (GDL).
where r is the area specific resistance (), which is a function of temperature and acid doping level (DL).
2.2. Degradation Model
The degradation was modeled according to two approaches: a mechanical–chemical model based on the theory of the processes that occur in a fuel cell and an empirical model based on data from the literature on voltage decay rates. The mechanistic degradation model included the voltage degradation due to the loss of catalyst activity and due to the loss of conductivity, i.e., activation and ohmic losses, respectively. These are the two main overpotentials and they represent a sufficient basis for fuel cell degradation at lower load operations. Any degradation due to a higher concentration loss was neglected. Therefore, the model was limited to the low current density region and a sufficiently high stoichiometric ratio had to be ensured in order to minimize mass transport losses.
The empirical model was based on voltage decay rates collected from the literature data (see Table 1). As temperature was found to have a major influence on voltage degradation and was fairly well researched compared to other parameters, it was the parameter that was used in the empirical model. It also influences both particle agglomeration and phosphoric acid evaporation.
The degradation model was constructed such that it only described decreasing performance over time, i.e., the typical activation phase (break-in) that a fuel cell undergoes at the beginning of life and that actually results in a performance increase (of up to 5–15% in some cases) was not described [17,33]. Time 0 h was assumed at the point of maximum performance, even if the cell may have already operated for some time. Furthermore, events such as emergency stops or maintenance time were not specifically modeled. However, since the literature data used in this work did not correct the data with respect to these events [33,36], it can be said that the influence was already included in the data.
Finally, the degradation here was considered to be irreversible, and even though there are ways to counter degradation, such as reconditioning the fuel cell or replacing components, no measures were taken to repair or revert degradation in the studies considered for this work.
2.2.1. Mechanical–Chemical Degradation Model
Activation Losses
The loss of catalytic activity was modeled through the loss of ECSA. This work focused on the modeling of the mechanisms of catalyst particle agglomeration and catalyst mass loss. It was assumed that ECSA loss only affected the activation overpotential, which was modeled as a function of the Tafel slope, the current density and the exchange current density (see Equation (4)). Moreover, the model only considered the cathode as these mechanisms were found to mainly occur there [15,51,52]. The Tafel slope was assumed to be constant at constant operating conditions, which meant that at a fixed output current, the parameter that could change with time was the current density. This approach introduced a degradation factor as a function of time that was multiplied by the current density and therefore made the activation overpotential a function of time as follows:
where is the degradation factor that describes the ratio of ECSA per unit geometric area and is therefore dimensionless. In this work, the decrease of this ratio as a result of changing catalyst characteristics caused by particle agglomeration and catalyst loss was modeled. Platinum particle agglomeration describes an increase in the mean particle diameter of the particles, where a higher number of particles with smaller diameters are transformed into fewer particles with a bigger diameter. The model only considered the mean diameter of all particles.
In the modeled ratio, the geometric area, denoted by , was the footprint of the MEA in , calculated by multiplying the length by the height of the cell, while ECSA was the actual electrochemically active area that provides potential triple phase boundaries for the chemical reaction. Both were connected through the surface roughness, which was here defined as ECSA/ and therefore equal to a. Due to manufacturing processes and the behavior of nanoscale particles, the size of the particles influences the ECSA significantly. Hence, the catalyst was modeled as the relationship of the surface area per unit volume of a spherical particle, given in Equation (9). This assumption was a simplification to reduce the complexity of the model, which was also used in the literature and was believed to result in sufficiently small errors for the purpose of this model [34,50].
where is the surface area per unit volume of a spherical Pt particle (), is the particle surface area (), V is the particle volume (), r is the particle radius (cm) and d is the particle diameter (cm).
Similarly, the surface area per unit mass of Pt was calculated through the density as:
where is the specific platinum surface area () and is the density of platinum, g/cm3. The relationship between the geometric area and the platinum mass was given through the loading:
where is the Pt loading (). By combining Equations (10) and (11), a factor that relates the ECSA to the geometrical area based on characteristics of the platinum catalyst could be found:
In other words, assuming a constant Pt density of g/cm3, the amount of ECSA per unit geometric area could be calculated, and therefore, the degradation factor could be obtained for given platinum loading and the particle diameter. This way, the change in diameter with time was more straightforward and represented particle agglomeration. As the diameter increased, the specific surface area per unit mass decreased and so did the ECSA, resulting in an increase in activation losses. In this work, empirical data of particle evolution were used to describe the Pt particle growth.
The other identified mechanism that affects the activation losses is the loss and lower utilization of active catalyst material. Through mass conservation, it can be stated that the total mass of platinum in the system has to be maintained:
With respect to the initial platinum loading, the relevant active catalyst mass was therefore determined through:
where is the utilization factor.
The active mass can be considered attached to the carbon support and the lost mass is detached or relocated where it cannot be utilized as a catalyst anymore. The usable attached mass is furthermore reduced by a utilization factor, leading to the active mass. The utilization factor accounts for the partial coverage of the surface by carbon. A reason for detachment and partial coverage can be found in carbon corrosion. With the loss of active catalyst material, the loading per unit geometric area decreases. This model considered the decrease of platinum loading to cover all causes of catalyst material loss.
Together with particle agglomeration, the degradation factor for the time-dependent activation overpotential becomes:
This allowed us to model the time dependency of the activation loss due to particle agglomeration and catalyst material loss.
Ohmic Losses
Conductivity is considered to be only associated to ohmic losses, i.e., the activation overpotential is not affected [53]. The only contributor to the ohmic overpotential degradation in this model was the membrane and as the mechanism contributing to the loss of conductivity of the membrane, phosphoric acid (PA) leaching was implemented as acid evaporation. Similar to the other parameters, the break-in phase, where the conductivity might increase due to the evaporation of excess PA, was not modeled [18,27].
Therefore, the ohmic overpotential could be modeled as a function of time as follows:
where r(t), and are the area specific resistance i (), membrane thickness () and membrane conductivity (), respectively. A linear dependence on the temperature is suggested, and to obtain the conductivity as a function of both temperature and acid doping level, a multiple regression was carried out. The best fit was found according to Equation (17) with the parameters in Table 2 and an value of 0.9958. In this work, it was assumed that the membrane only consisted of PBI and HPO.
where is the acid doping level per repeat units of PBI (PRU) defined as:
where , and are the molar mass of PA (M = 98 g/mol), molar mass of PBI (M = 308 g/mol) and area specific mass of species i (g/cm2), respectively.
The area specific mass of phosphoric acid in the membrane as a function of time can be expressed as:
where and are the initial specific mass (g/cm2) and the evaporation rate of PA (g/cm2h), respectively. For example, an initial DL of 5 and an area specific mass of 6 g/cm2 PBI would lead to a specific mass of PA of 9.55 g/cm2. These evaporation values represent a realistic estimate of the membrane parameters [53] and were found to depend on temperature. Unlike the assumption made on the catalyst degradation and the activation overpotentials, here, both anode and cathode sides were considered, with the cathode evaporation being more dominant.
Additionally, the thickness of the membrane was assumed to be constant, although it was acknowledged that membrane thinning could occur. Generally, PBI conductivity (S/cm) is a function of the acid doping level, temperature, pressure and relative humidity [54]. However, since PA is the main proton conduction medium in PA-doped PBI membranes, the influence of RH was neglected in this work.
Finally, based on Equation (7) a time-dependent cell voltage considering both activation losses and ohmic losses could be expressed as:
where a(t), the degradation factor for the time-dependent activation overpotential, is given in Equation (15) and and are the membrane thickness (cm) and membrane conductivity (S/cm), respectively.
2.2.2. Temperature Dependence of Voltage Degradation
The second approach modeled the voltage decay rate as a function of temperature. The dependence of the degradation rate on temperature under steady-state operation (a fit based on literature data) could be expressed as:
where is the voltage decay rate (). The voltage decay rate as a function of temperature was then used to calculate the cell voltage over time as:
where is the cell voltage at the beginning of its life.
If the contribution of the ohmic losses are neglected and it is assumed that the activation overpotential is responsible for the total voltage degradation, Equation (23) can be solved, for an alternative approach of calculating the activation overpotential.
In order to further compare this empirical model with the mechanistic model in this work, a hypothetical ECSA loss factor f can be calculated according to Equation (24) with all variables having the same meaning as in Equation (4).
Compared to Equation (4), the factor f can be interpreted as a decrease in ECSA at a constant voltage decay rate.
3. Results and Discussion
The aim of this modeling work was to obtain trends for the main degradation mechanisms of HT-PEMFCs using data collected from the literature. First, a sensitivity analysis was carried out in order to identify crucial parameters. If not stated otherwise, the simulations were carried using the parameters in Table 3.
3.1. Activation Losses
3.1.1. Particle Agglomeration
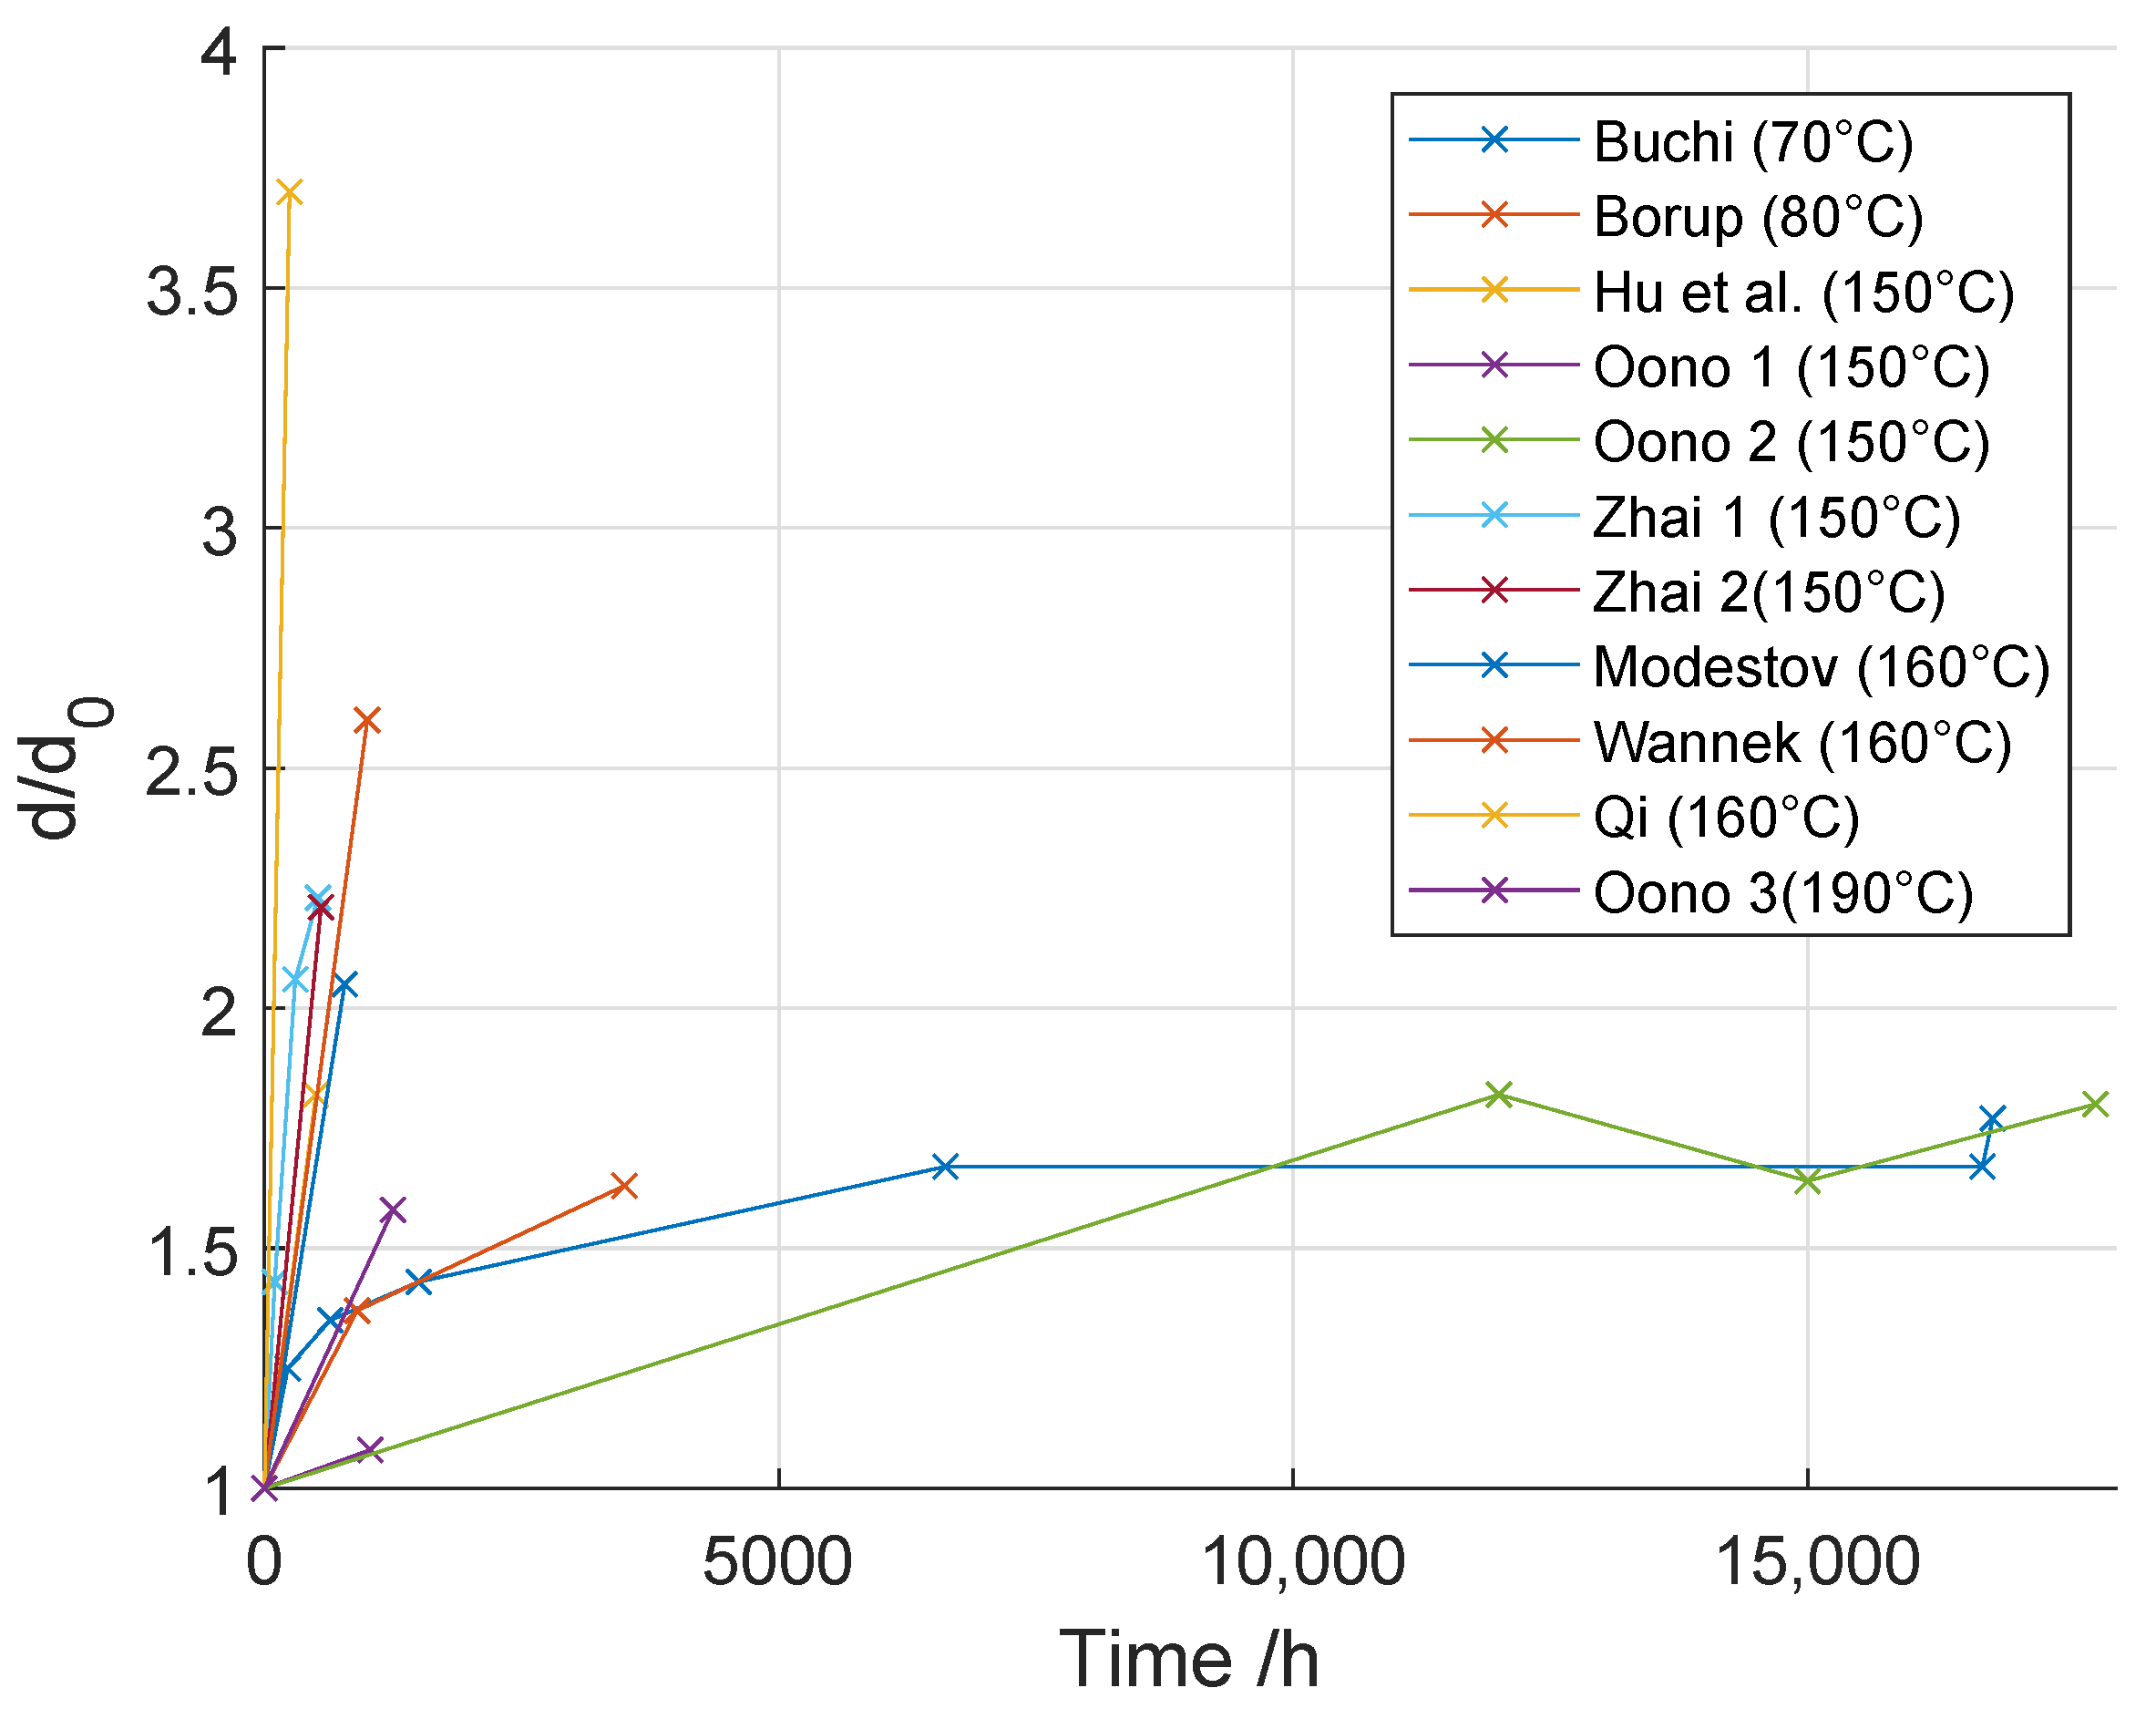
The investigation of Pt particle diameter evolution over time and a comparison of the effects of different operating conditions are scarce in the literature. Figure 2 shows the experimental results of the evolution of the diameter with respect to the initial size over time that was calculated from the available literature data. The data were at fixed operating temperatures and included data from low-temperature PEMFCs for comparison. Since the initial mean particle diameter might be different for the different sources, only the evolution of the ratio of the diameter with respect to the initial size were calculated and plotted over time.
It can be seen that there is a tendency of a faster and higher agglomeration at elevated temperatures, which is to be expected due to favorable conditions for particle agglomeration. A logarithmic trend can be observed from the two low-temperature experiments (Buchi (70 °C) [18] and Borup (80 °C) [15]). Their findings are coherent in their magnitude compared to other values in the field. Other experiments carried out at high temperature do not obviously suggest the same evolution, but some at least show the same tendency. Zhai et al. [17] discussed the same trend in their work. As it can be seen, the mean diameter grew rapidly within the first 300 h and already started to flatten out during the last 220 h of their experiment. They stated that the ECSA (measured by CV) decreased by about 55% within the first 300 h, followed by another 5% during the following 210 h and then remained unaltered for the remainder of the tests. Following these trends, it seems that the particle agglomeration flattens out already in the early stages of the experiments.
In an experiment outside the fuel cell context, Bett et al. [57] investigated platinum particle growth on a carbon support under varying operation parameters, such as temperature, potential and platinum loading. They investigated the evolution of the mass-specific surface area over time and found the same logarithmic behavior, where, after a steep decrease of the surface area due to particle growth, the rate approached zero and remained constant. The terminal mass-specific surface area was found to be dependent on the temperature but not on platinum loading and higher temperatures led to a lower surface area.
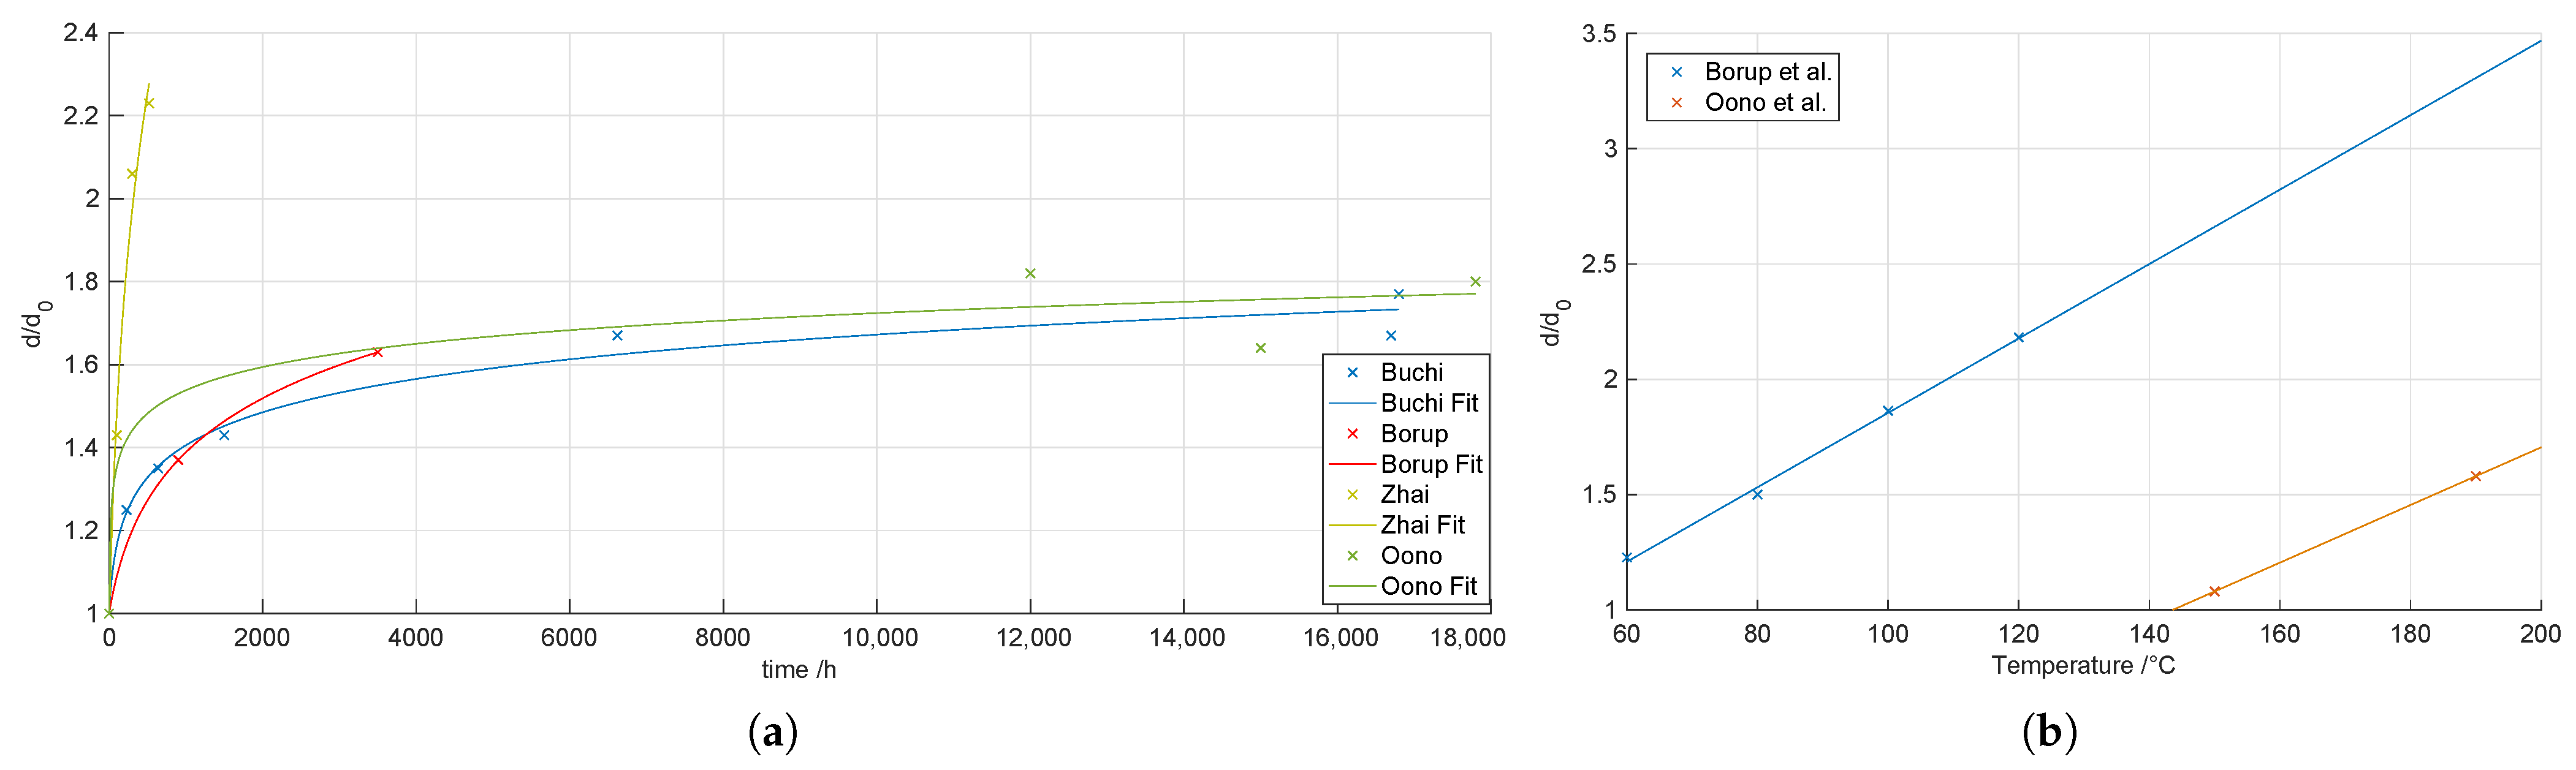
Hansen et al. [22] investigated the mechanisms behind the sintering of nanoparticles. They found that the dispersion of a catalyst decreased in stages, first mainly due to Ostwald ripening, then due to agglomeration and agglomeration contributions. They concluded particle growth at high temperatures (900 °C) continued for several thousands of hours, but for processes at lower temperatures it was more likely to reach a quasi-equilibrium state. HT-PEM fuel cells operate at relatively low temperatures, which makes reaching a quasi-equilibrium state a fair assumption in this context. Therefore, a logarithmic behavior was decided to be sufficient for the model, Equation (25). This logarithmic fit of the evolution of the particle diameter in time is shown in Figure 3a. The lowest value for the fit was 0.9522, for [26].
Additionally, two comparative studies for particle growth under different temperatures from two studies are shown in Figure 3b. Borup et al. [15] carried out an experiment in a low temperature regime. The probe was exposed to 1500 potential cycles from 0.1 V to 0.96 V for each temperature step between 60 °C and 120 °C. One cycle lasted 20 min, which corresponds to 500 h for the complete experiment. Oono et al. [39] also investigated the temperature effect on particle growth. Their experiment was carried out in steady-state operation at 0.2 A/cm2 and elevated temperatures. It can be seen that the results vary considerably. The findings of [39] are not in accordance with what the results from [15] would suggest for those temperatures. However, it can be noticed that the ratios vary with a similar magnitude according to the temperature difference in both publications, i.e., the high temperature experiments show a ratio increase of 0.50 over a temperature difference of 40 °C after a comparable time span. Between 60 °C– 100 °C and 80 °C– 120 °C, the ratio increases by 0.64 and 0.68, respectively, and the plots of the data suggest a linear dependence between temperature and particle growth, given in Equation (26):
Finally, a multiple regression was carried out in order to obtain the diameter as a function of both time and temperature. The fit was implemented as a polynomial with three degrees for the logarithmic time dependency and one degree for the linear temperature dependency. The resulting formula to calculate the diameter ratio can be seen in Equation (27), which was found to describe the small quantity of data best.
Although the R value of 0.9570 is fairly high and suggests an accurate fit, the value has to be handled with care. Due to the third-degree polynomial description of the logarithm, the curve flattens and eventually decreases after the steep increase at the beginning. The polynomial was chosen due to the limited fitting options with so few data. The fit itself only described the first phase sufficiently; afterwards the growth rate was held constant according to the long-term behavior by a memory block construction in MATLAB/Simulink.
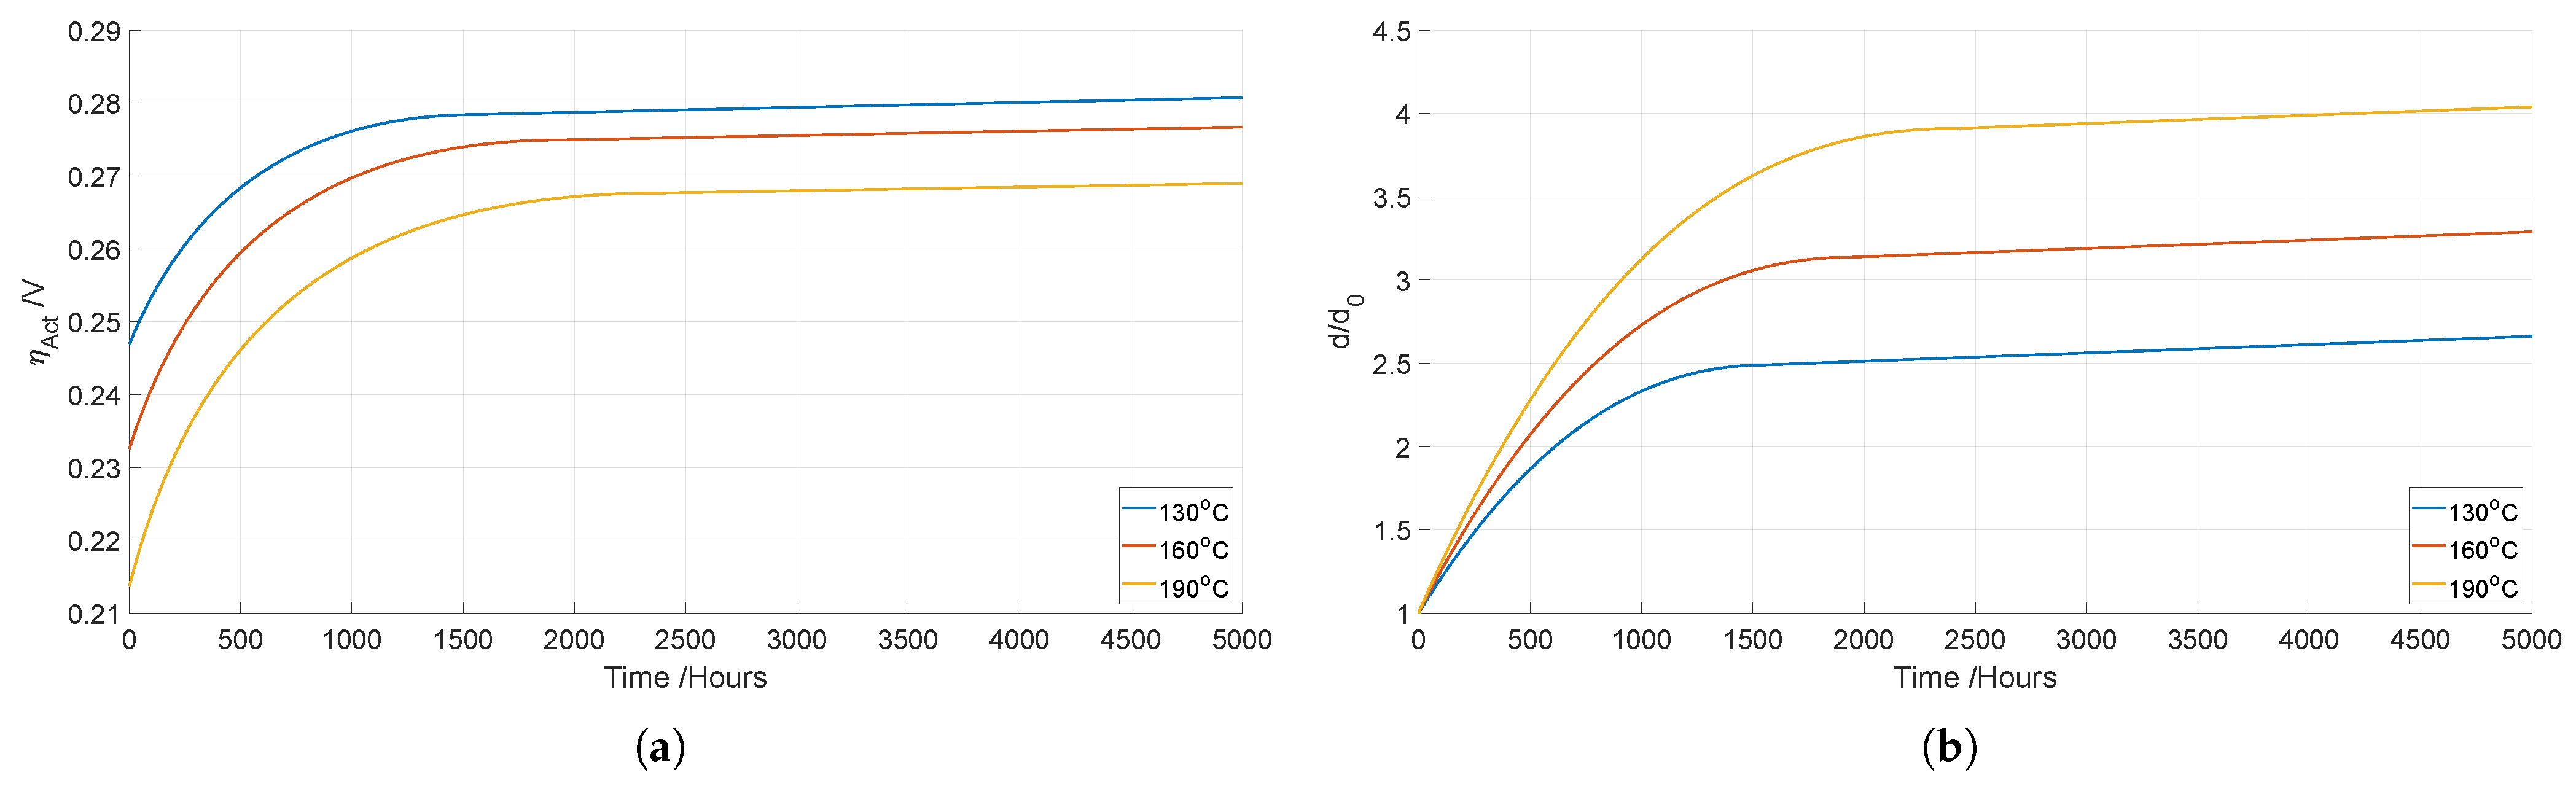
Figure 4a shows the activation overpotential for three different temperatures over time. The initial voltage loss decreases with increasing temperature from almost 0.25 V at 130 °C to a little more than 0.21 V at 190 °C. Although the difference decreases with time, the higher temperature is always favorable. The reason for this is most likely the enhanced reaction kinetics at higher temperatures. On the other hand, the Pt particle diameter that describes Pt agglomeration increases with an increase in operating temperature as shown in Figure 4b. Therefore, the higher operating temperature increases the fuel cell performance by increasing the fuel cell reaction kinetics, but at the same time, it exacerbates Pt agglomeration.
3.1.2. Loss of Active Catalyst Material
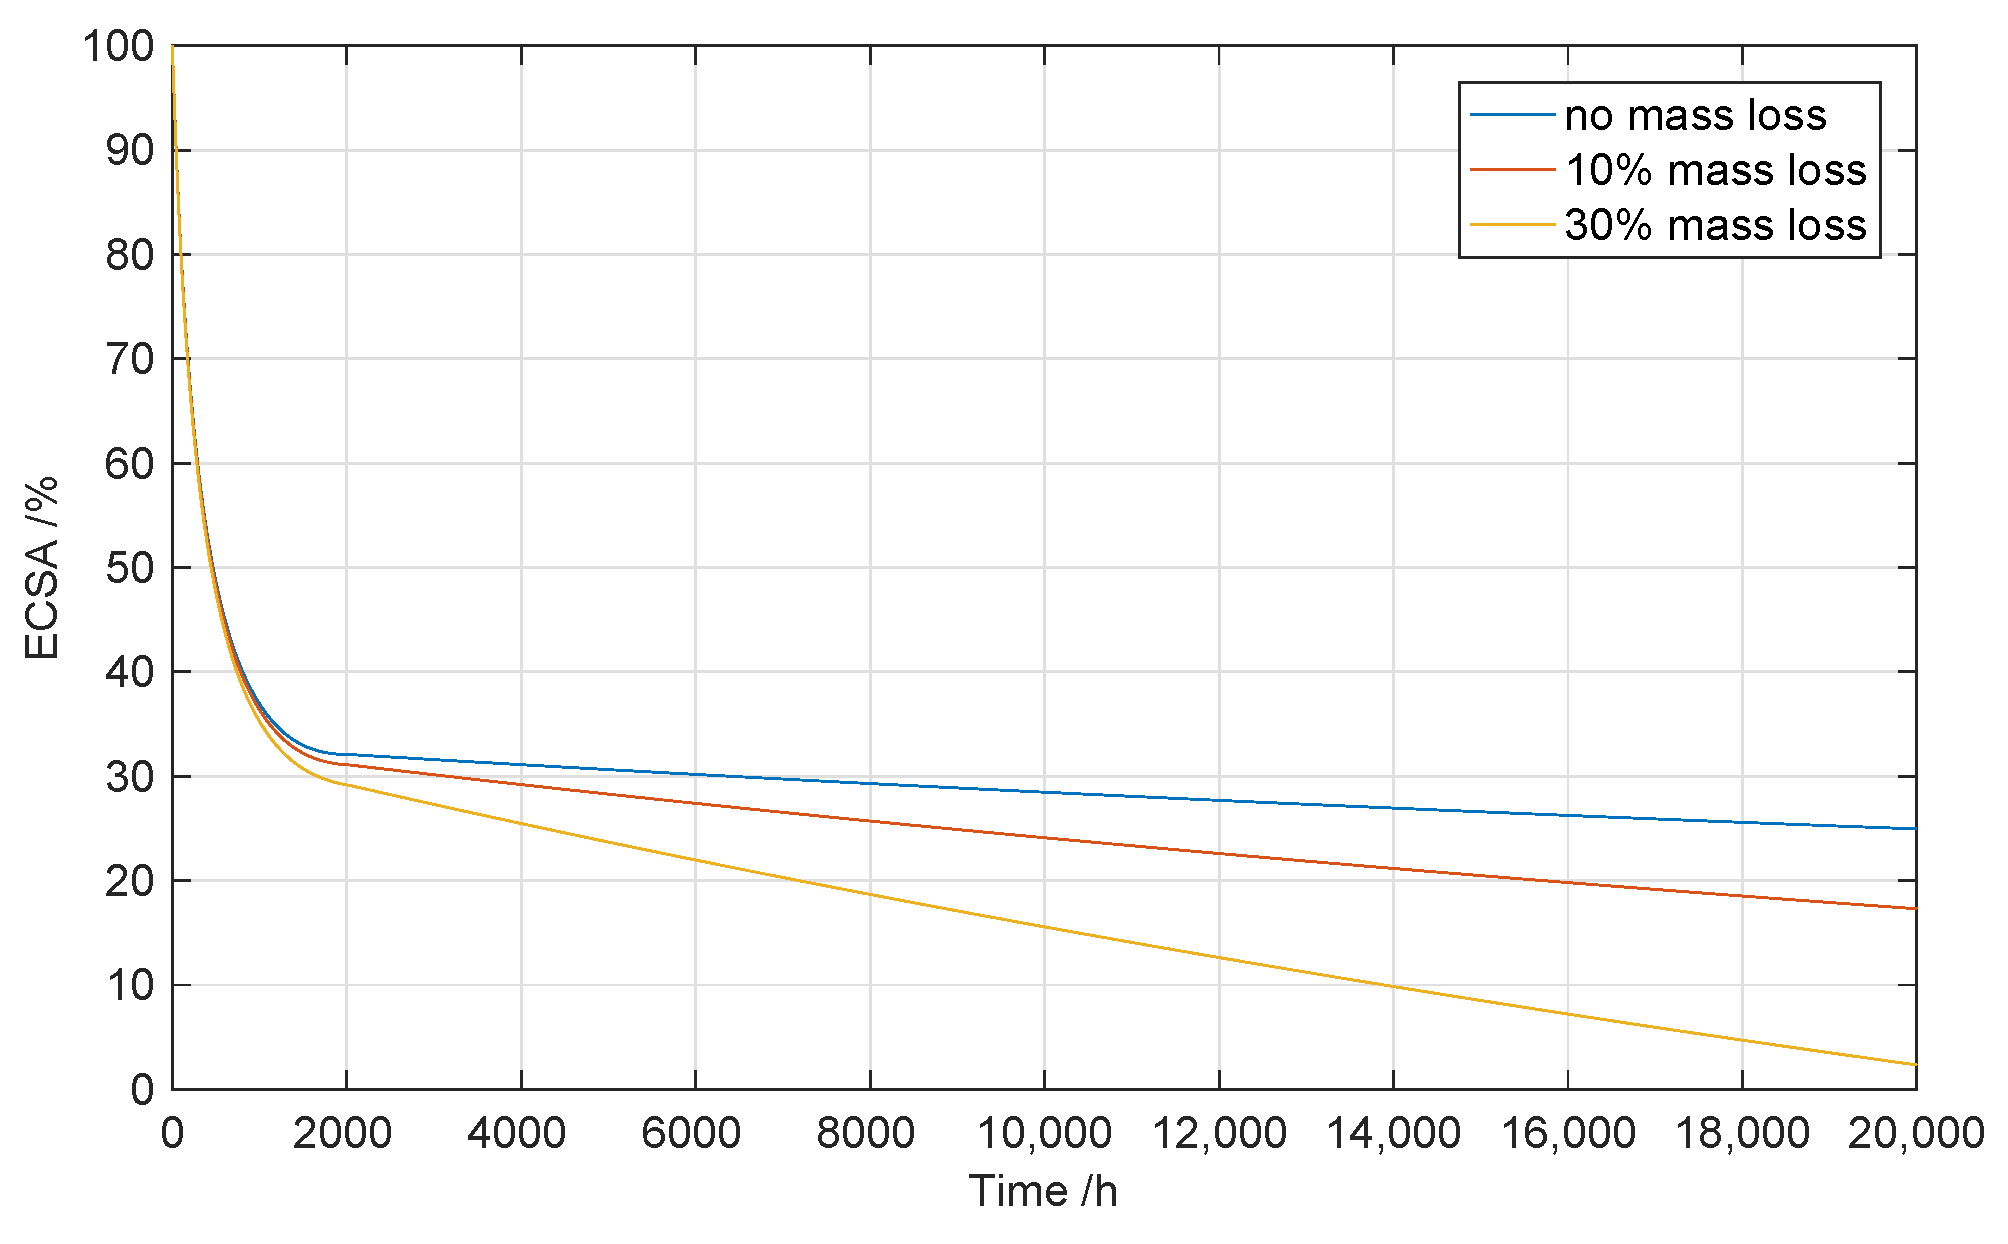
Another contributor to the loss of ECSA, and hence, to activation losses, considered in this work was the loss of catalyst material, which was modeled according to Equation (14). Figure 5 shows the contribution of the catalyst mass loss to the total loss of ECSA over 20,000 h of operation. To achieve this the ECSA loss due to particle agglomeration was assumed constant in Equation (15) for the entire duration and different catalyst mass losses were considered.
It can be seen that particle agglomeration alone already decreases the ECSA to 25% after 20,000 h. Assuming a loss of active catalyst mass of 10%, the ECSA becomes less than 20% of the initial value and the loss of platinum accounts for around 8% of the total ECSA loss. This suggests that the loss of active catalyst material might not contribute considerably to the total loss of ECSA and that other Pt degradation mechanisms, such as Pt agglomeration and coalescence may play more important roles in the activation losses over time.
3.2. Ohmic Losses
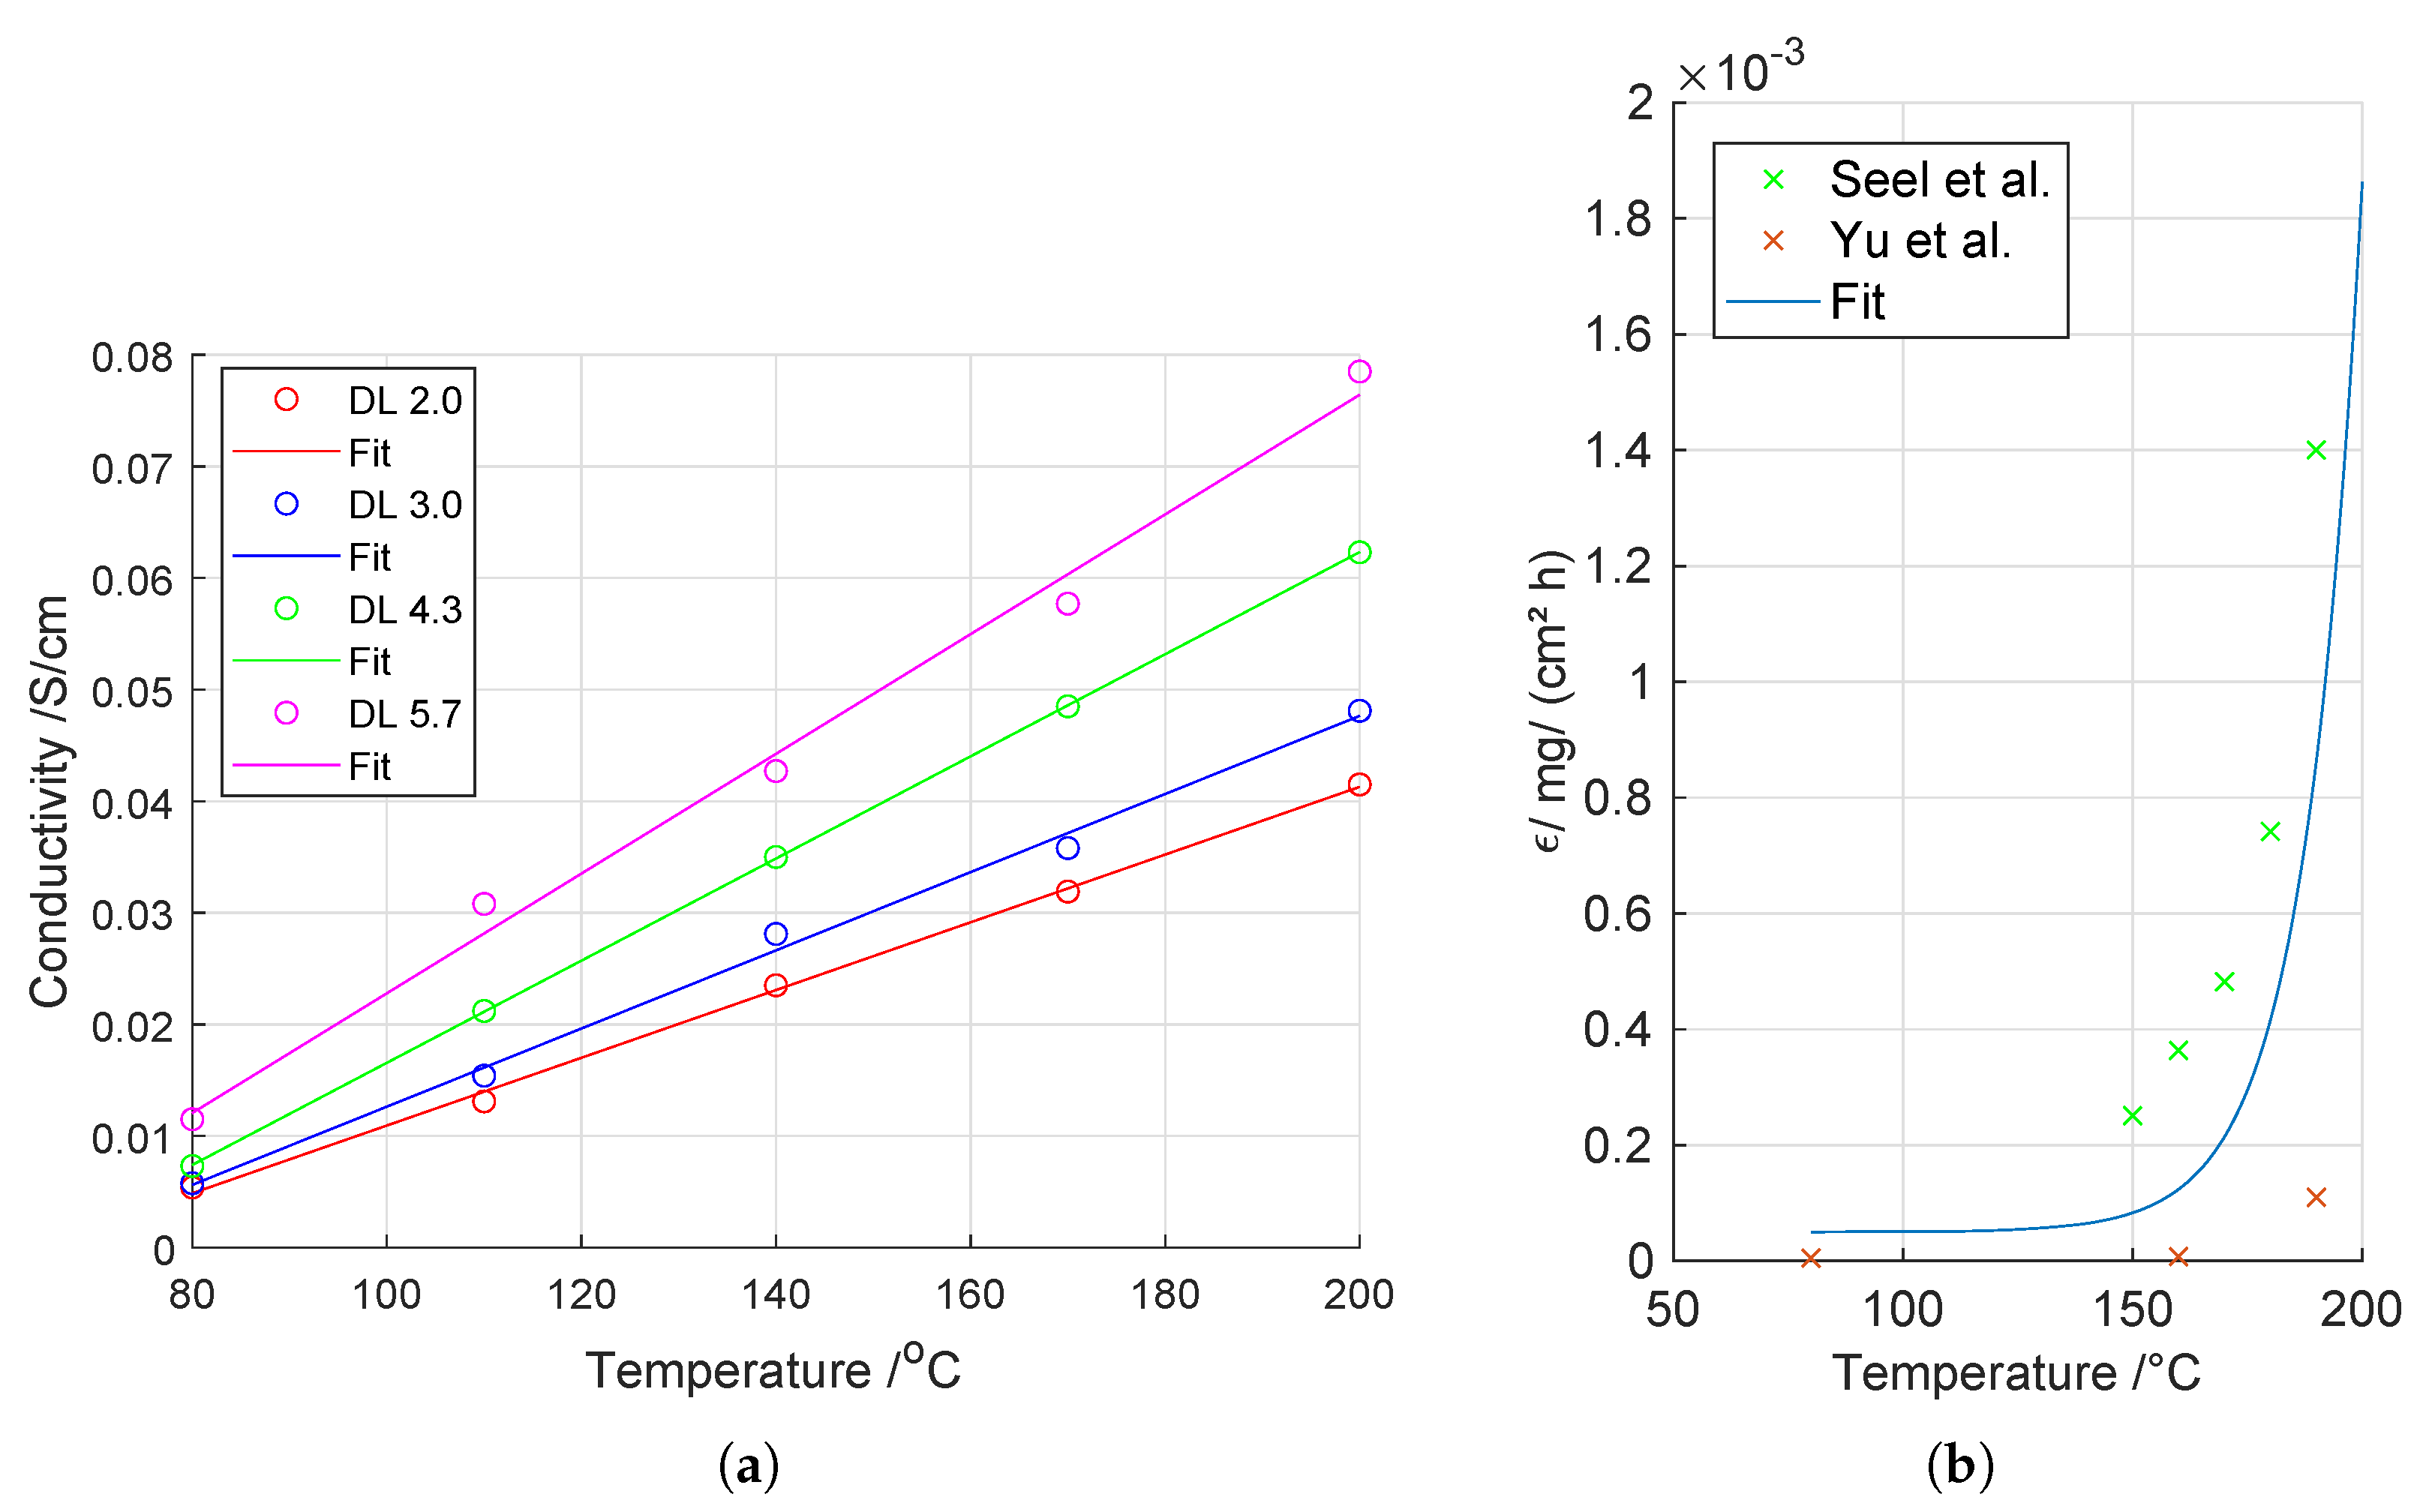
As already described, the evolution of ohmic losses in time was modeled as a function of membrane conductivity, which in turn is a function of temperature and acid doping level, Equation (17). The effect of the relative humidity (RH) was neglected throughout this work and more focus was given to the effect of the acid loss as the main proton conduction medium. A detailed study about the conductivity of PBI/H3PO4 was carried out by [27]. The results are recreated in Figure 6a. The RH was set to 20% for 80 °C and 110 °C, 10% for 140 °C and 5% for 170 °C and 200 °C.
Figure 6b shows the results of two PA evaporation experiments along with a fit of Equation (17). A deviation from the experimental data can be seen in Figure 6b, which can be attributed to the fact that the experimental data used from the two different literature sources deviated significantly from each other.
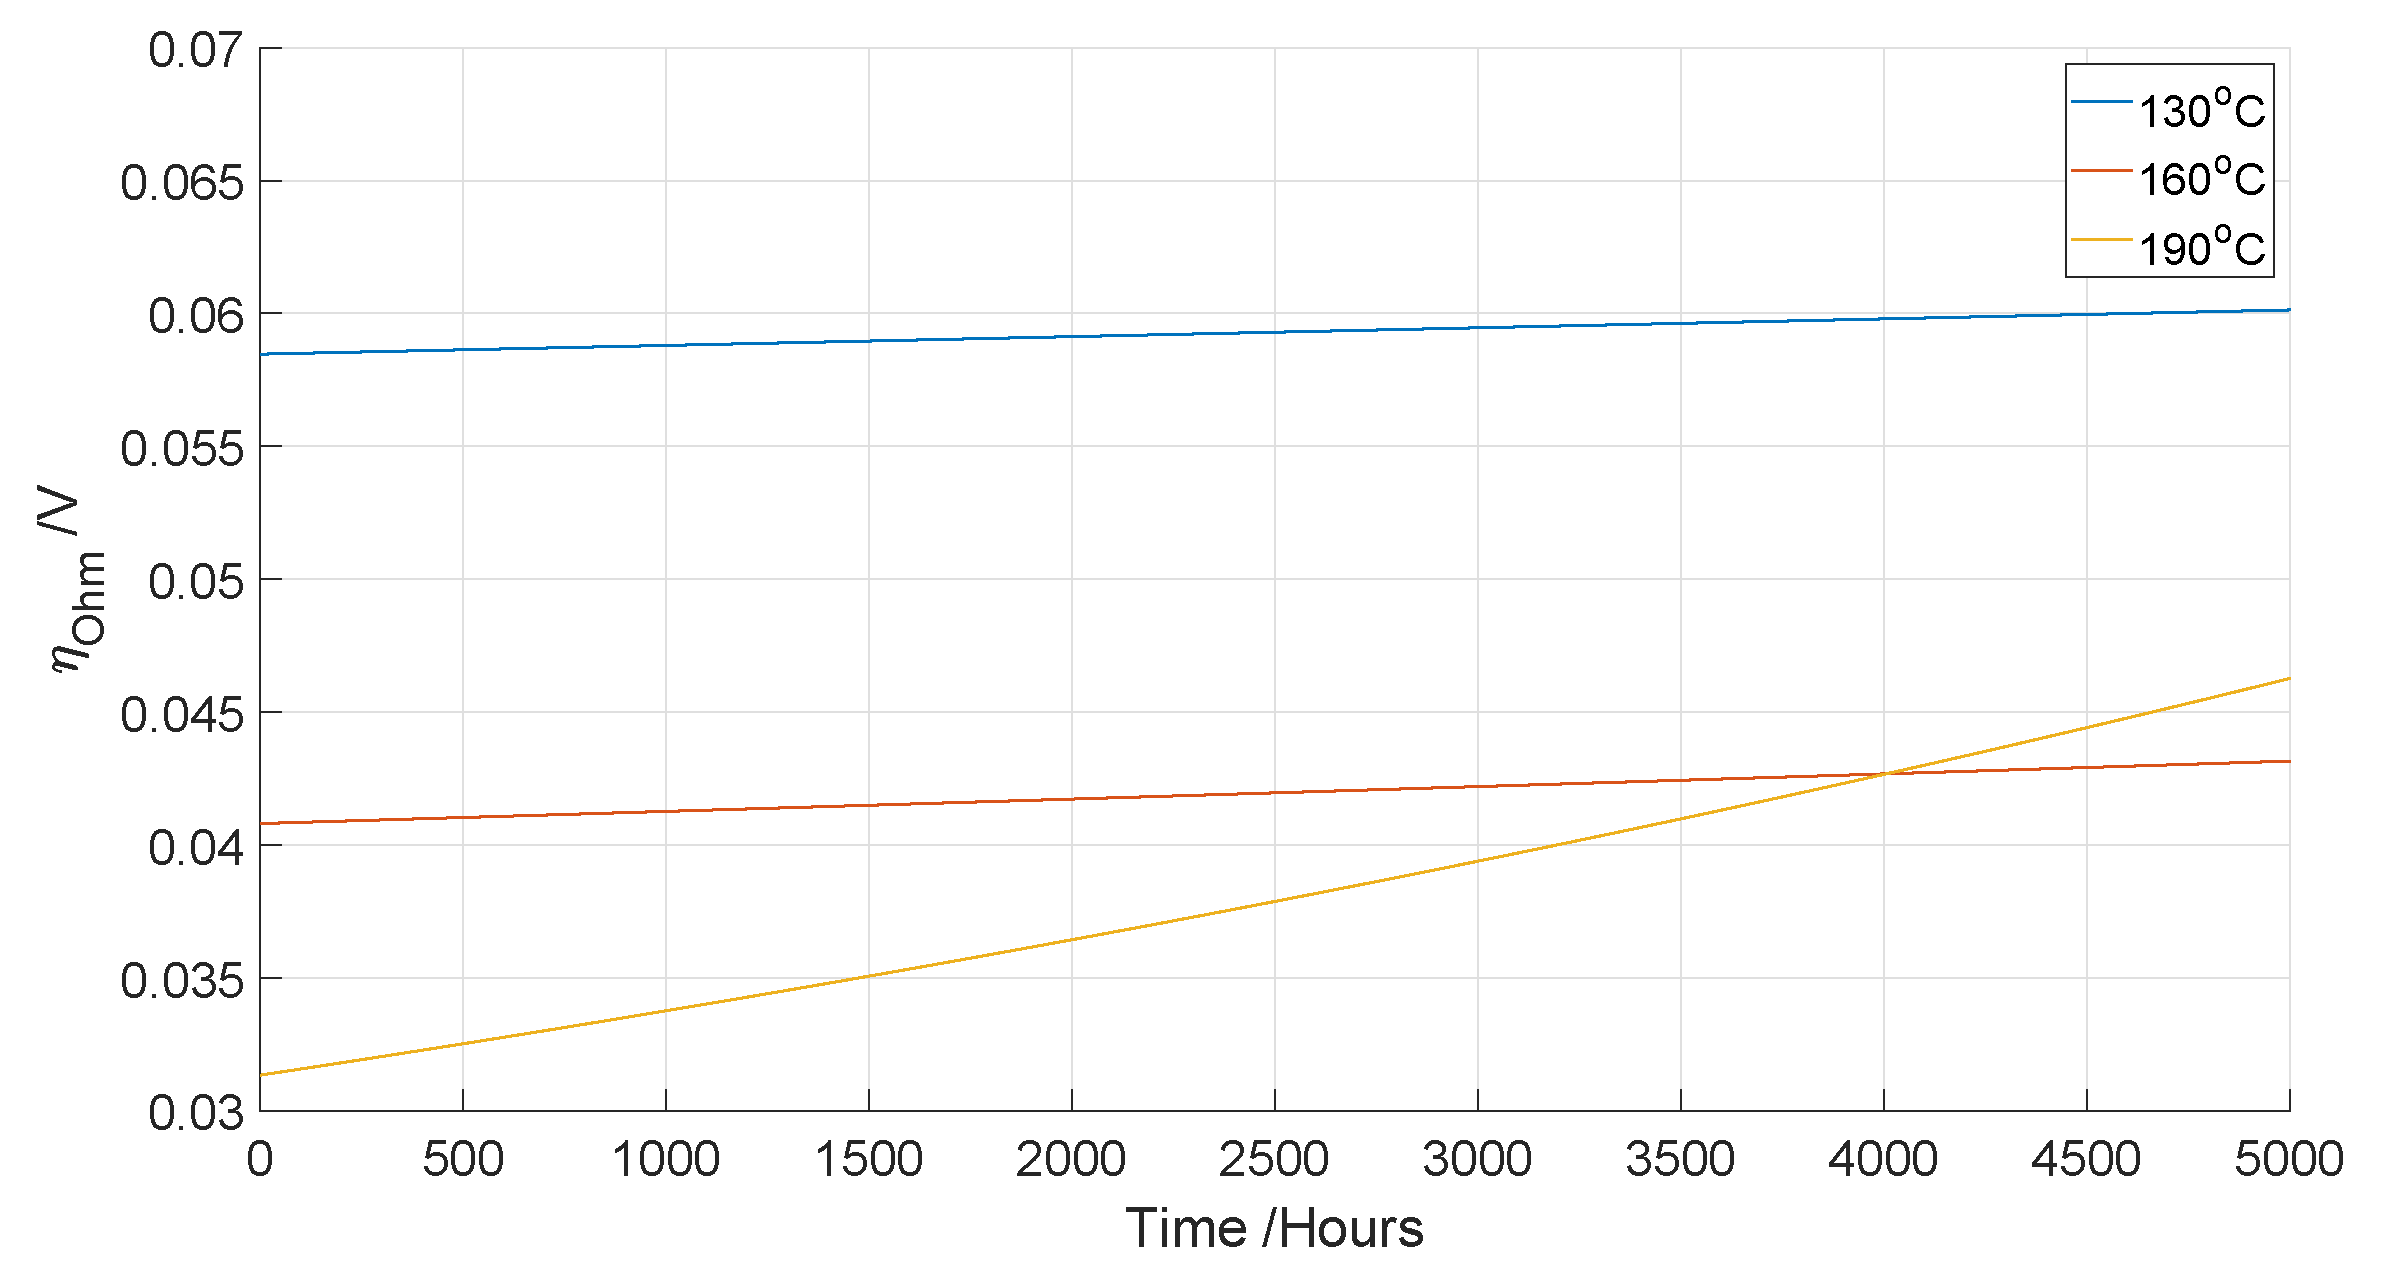
The evolution of the ohmic overpotential over time for different temperatures can be seen in Figure 7. The results show higher ohmic losses at lower temperatures at the beginning of life due to a better membrane conductivity at higher temperatures. At the beginning, the overpotential caused by ohmic losses is lowest at 190 °C at around 0.03 V, which is half as big as the loss at 130 °C. With time, the evaporation of phosphoric acid causes the ohmic overpotential to increase, which is significantly more pronounced at temperatures of 180 °C and above. This leads the ohmic loss at 190 °C to exceed the loss at 160 °C after 4000 h. This confirms that higher operating temperatures, especially above 190 °C, can degrade the fuel cell fast while resulting in a significant performance enhancement at the beginning of life.
3.3. Cell Voltage Degradation
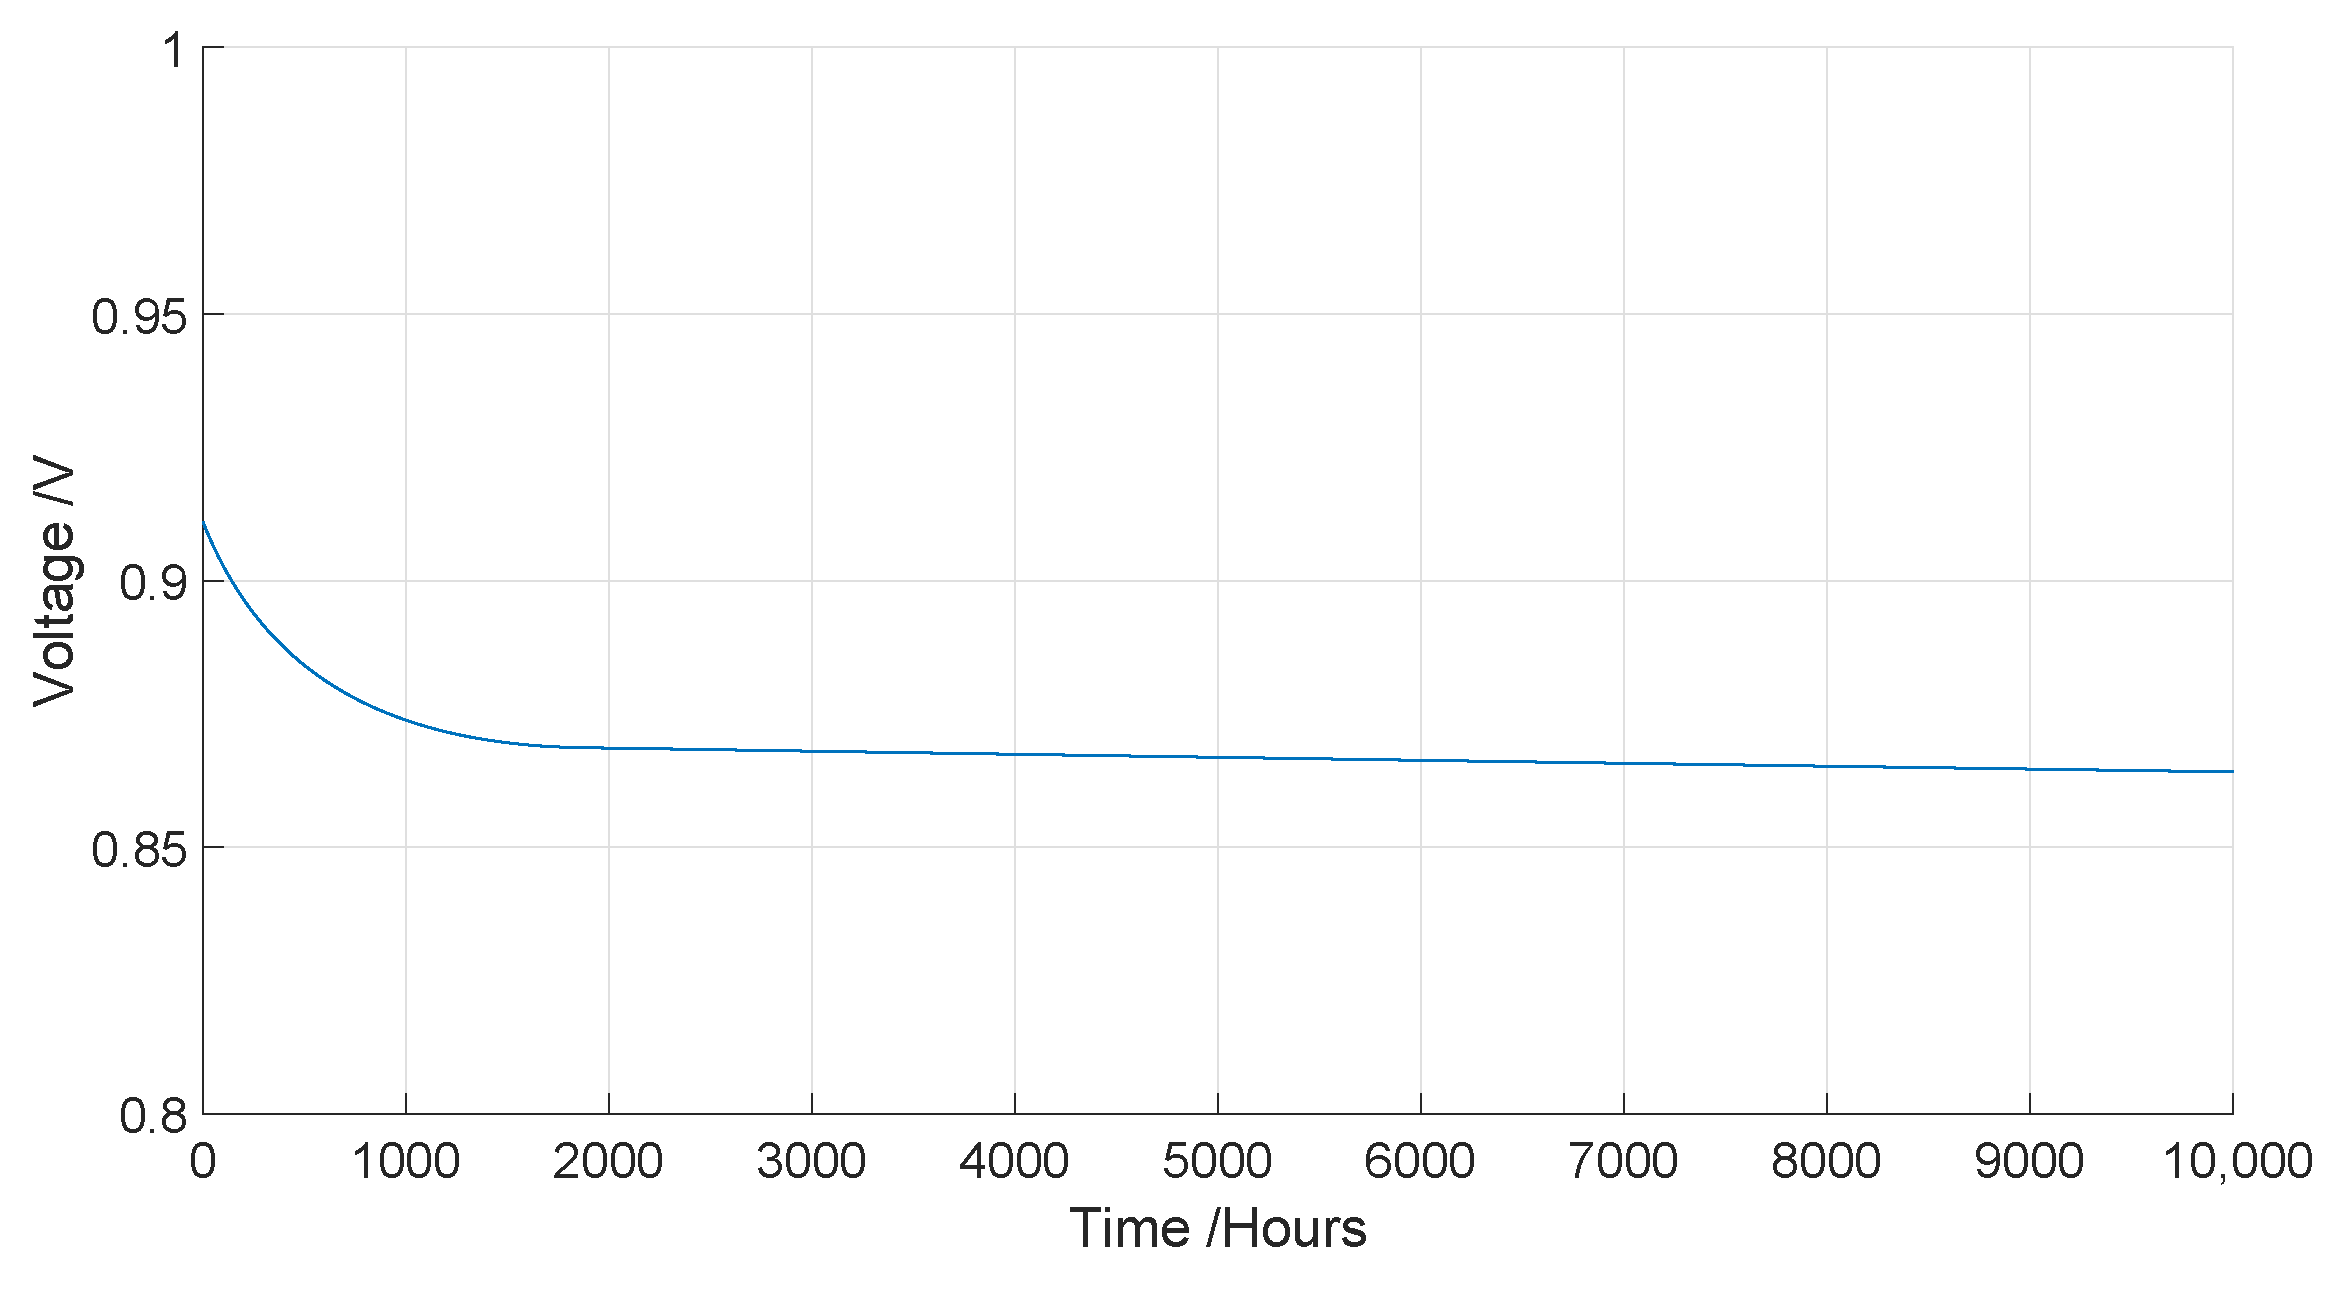
The simulated cell voltage over time at 160 °C is shown in Figure 8, which summarizes the overall degradation given by Equation (20). The simulation reveals a trend that is in good agreement with what is found in the literature [18], with a steep decrease until approximately 1500 h, followed by a linear decrease.
3.4. Effect of Temperature on Voltage Degradation
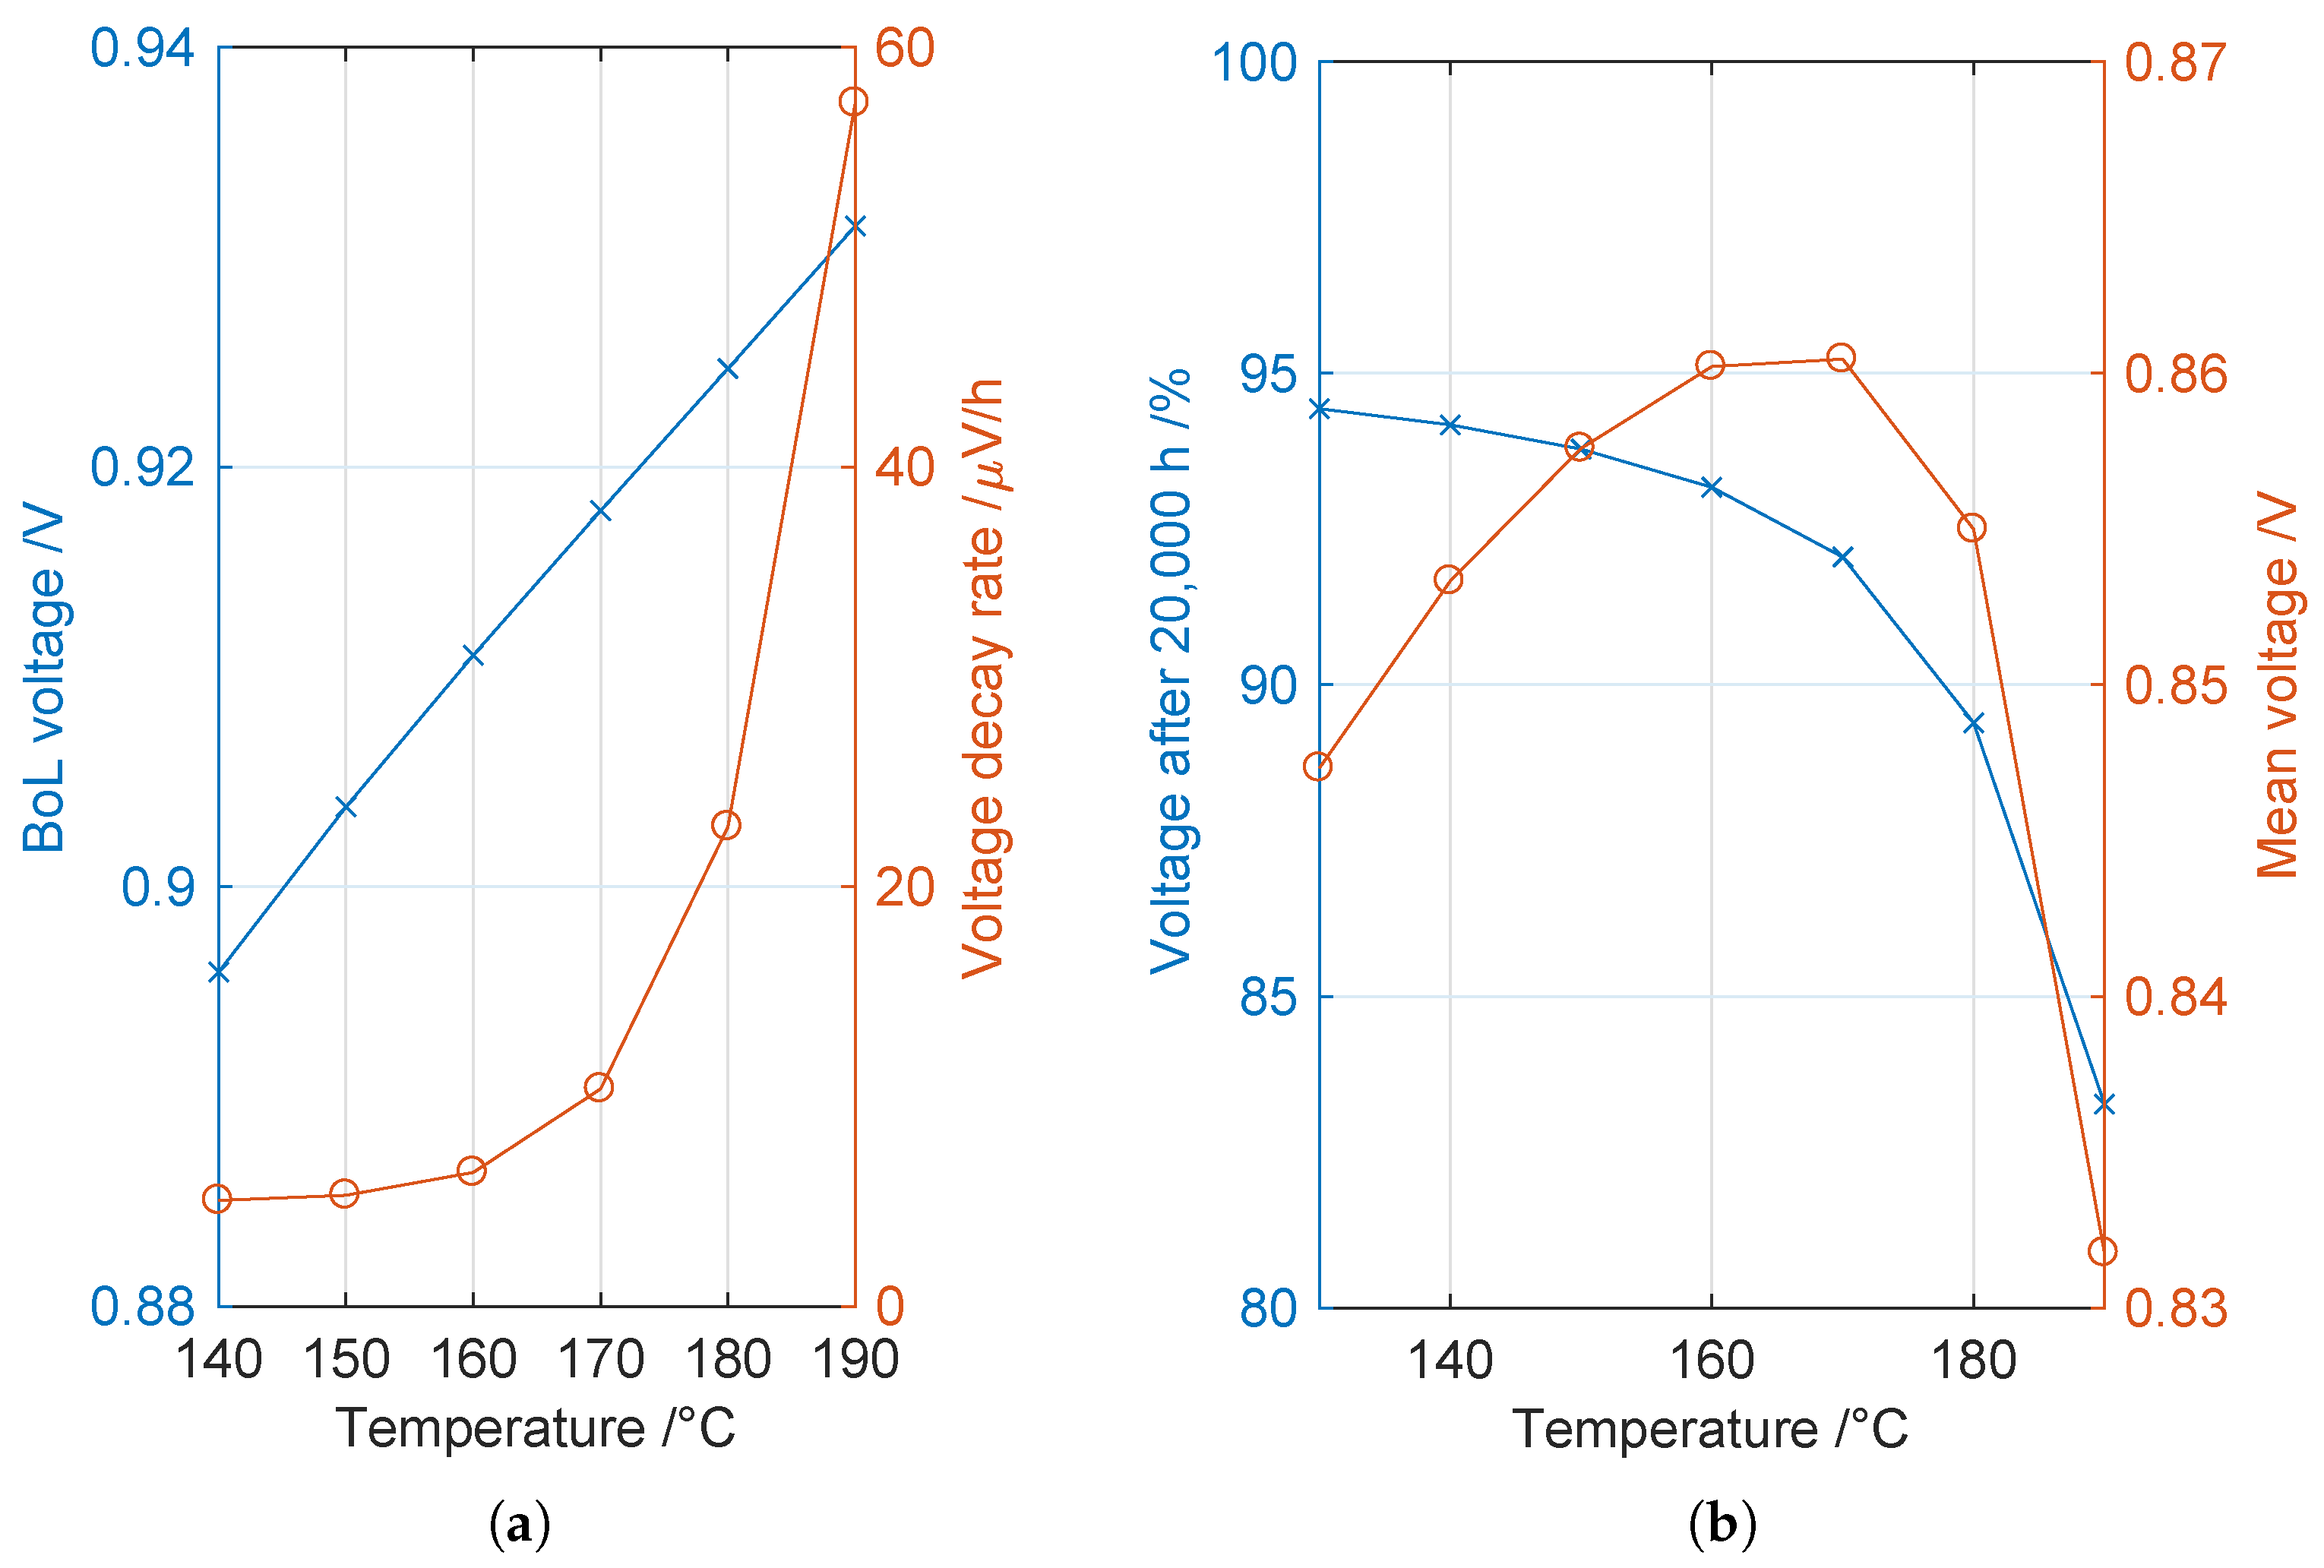
This section presents the results of the model introduced in Section 2.2.2. The beginning of life (BoL) voltage and degradation rate are plotted as a function of temperature in Figure 9. It can be observed that the BoL performance of the fuel cell increases somewhat linearly with temperature, while the voltage decay rate increases exponentially with increasing temperature, i.e., the voltage decay rate increases only mildly until around 160 °C and then increases dramatically for higher temperature operations. This is also visible in Figure 9b, where the end of life (EoL) voltage after 20,000 h decreases with increasing temperature, while the mean voltage over the lifetime of the fuel cell increases with the temperature until 160 °C, then plateaus until 170 °C to then dramatically decrease for higher operating temperatures to lower values at 190 °C than at 140 °C. These two graphs show that the operating temperature range between 160 °C and 170 °C can be said optimal, as there is a significant increase in performance compared to lower operating temperatures without too much penalty in terms of durability. The trade-off between higher performance and higher degradation that should be considered when increasing the fuel cell operating temperatures was already known from experimental experience. However, to the knowledge of the authors these trends were not described mathematically and the optimal temperatures being between 160 °C and 170 °C were only a rule of thumb based on experience. Therefore, the predictions obtained herein can be used to optimize the fuel cell operating conditions over its lifetime.
4. Conclusions
The aim of this work was to find trends from the literature and obtain mathematical expressions for some of the known degradation mechanisms. A degradation model based on literature survey was developed in this paper. An HT-PEMFC performance model was first developed, and the voltage degradation based on the major influencing operating parameters and underlying mechanisms was added. The model confirmed the patterns of the existing knowledge about the degradation mechanisms in HT-PEMFCs. Moreover, based on literature data, time-dependent mathematical expressions were obtained for the main contributors to the performance degradation of the fuel cell, namely, activation losses and ohmic losses.
In the model, the loss of ECSA and the loss of membrane conductivity were implemented in the form of catalyst particle coalescence and acid evaporation, respectively. The simulations revealed that the ECSA loss was a major contributor to the total voltage loss, while the loss of conductivity increased significantly on a percentage basis over time, although it still had a fairly low impact on the overall voltage degradation.
The effect of temperature on the voltage decay rate was also investigated and it could be concluded that durability decreased with increasing operating temperature. It was shown that while the fuel cell performance increased linearly with increasing temperature at the beginning of the cell’s life, the voltage decay rate increased exponentially with increasing temperature. Based on the analysis of the voltage decay rate, the operating temperature range between 160 °C and 170 °C could be said optimal, as this range was characterized by a significant increase in performance compared to lower operating temperatures (<140 °C) without too much penalty in terms of lifetime such as that seen at the high temperature ranges (>180 °C).
In conclusion, fuel cell degradation is affected by several parameters. Hence, a degradation model and lifetime prognosis that accounts for the different causes can help to evaluate the feasibility of the technology in different applications.
Author Contributions
Conceptualization, S.S.A. and S.F.; methodology, S.F., S.S.A., V.L. and N.L.; software, S.F., M.Z., S.S.A., V.L. and N.L.; validation, S.F., M.Z., S.S.A., V.L. and N.L.; formal analysis, S.F., M.Z., S.S.A., V.L., S.L.S. and N.L.; investigation, S.F., M.Z., S.S.A., V.L., S.L.S. and N.L.; resources, S.S.A.; data curation, S.F., M.Z., V.L. and N.L.; writing—original draft preparation, M.Z., S.F., S.S.A., V.L. and N.L.; writing—review and editing, M.Z., S.F., S.S.A., V.L., N.L., S.L.S. and G.C.; visualization, M.Z. and V.L.; supervision, S.S.A. and V.L.; project administration, S.S.A., V.L. and G.C.; funding acquisition, S.S.A. All authors have read and agreed to the published version of the manuscript.
Funding
This research was funded by the Danish Energy Technology Development and Demonstration Program (EUDP) through the COmmercial BReakthrough of Advanced fuel cells (COBRA Drive) project (grant number 64018-0118) and the MFC MultiGen project (grant number 64020-2073).
Institutional Review Board Statement
Not applicable.
Informed Consent Statement
Not applicable.
Data Availability Statement
Data used in the current work are from the literature and all sources can be found in the references list.
Conflicts of Interest
The authors declare no conflict of interest. The funders had no role in the design of the study; in the collection, analyses, or interpretation of data; in the writing of the manuscript, or in the decision to publish the results.
Abbreviations
The following abbreviations are used in this manuscript:
| APU | Auxiliary power units |
| BOL | Beginning of life |
| CL | Catalyst layer |
| DL | Acid doping level |
| EOL | End of life |
| ECSA | Electrochemical active surface area |
| GDL | Gas diffusion layer |
| HT-PEMFC | High-temperature proton exchange membrane fuel cells |
| LT-PEMFC | Low-temperature proton exchange membrane fuel cells |
| OCV | Open circuit voltage |
| PA | Phosphoric acid |
| PBI | Polybenzimidazole |
| PtX | Power-to-X |
| RH | Relative humidity |
| CHP | Micro-combined heat and power generation |
| Greek Letters | |
| Charge transfer coefficient | |
| Density, | |
| Voltage decay rate, | |
| Conductivity, | |
| Evaporation rate of PA, | |
| Overpotential, | |
| Thickness, | |
| Gas stoichiometric ratio | |
| Symbols | |
| Degradation factor | |
| Reactants activities | |
| Products activities | |
| A | Tafel slope, |
| Geometric area of the MEA, | |
| Particle surface area, | |
| Coefficients for exchange current density | |
| d | Particle diameter, |
| Reversible cell voltage, | |
| F | Faraday constant, |
| i | Current density, |
| Exchange current density, | |
| Temperature coefficient | |
| Pt loading, | |
| Total mass of platinum, | |
| Phosphoric acid specific mass, | |
| M | Molecular weight, |
| n | Number of electrons |
| Q | Reaction quotient, |
| r | Particle radius (Equation (9)), |
| r | Membrane resistance, |
| Area specific resistance, | |
| R | Universal gas constant, |
| Specific platinum surface area, | |
| t | Time, |
| T | Temperature, |
| Utilization factor | |
| Reactants stoichiometric coefficient | |
| Products stoichiometric coefficient | |
| V | Particle volume, |
| Molar fraction of P2O5 |
References
- Goldmann, A.; Sauter, W.; Oettinger, M.; Kluge, T.; Schröder, U.; Seume, J.R.; Friedrichs, J.; Dinkelacker, F. A Study on Electrofuels in Aviation. Energies 2018, 11, 392. [Google Scholar] [CrossRef] [Green Version]
- Cui, X.; Kær, S.K. Thermodynamic analyses of a moderate-temperature process of carbon dioxide hydrogenation to methanol via reverse water-gas shift with in situ water removal. Ind. Eng. Chem. Res. 2019, 58, 10559–10569. [Google Scholar] [CrossRef]
- Araya, S.S.; Liso, V.; Cui, X.; Li, N.; Zhu, J.; Sahlin, S.L.; Jensen, S.H.; Nielsen, M.P.; Kær, S.K. A Review of The Methanol Economy: The Fuel Cell Route. Energies 2020, 13, 596. [Google Scholar] [CrossRef] [Green Version]
- Martinho, D.L.; Araya, S.S.; Sahlin, S.L.; Liso, V.; Li, N.; Berg, T.L. Modeling a Hybrid Reformed Methanol Fuel Cell & Battery System for Telecom Backup Applications. Energies 2022, 15, 3218. [Google Scholar] [CrossRef]
- Liu, Y.; Lehnert, W.; Janßen, H.; Samsun, R.C.; Stolten, D. A review of high-temperature polymer electrolyte membrane fuel-cell (HT-PEMFC)-based auxiliary power units for diesel-powered road vehicles. J. Power Sources 2016, 311, 91–102. [Google Scholar] [CrossRef]
- Loreti, G.; Facci, A.L.; Ubertini, S. High-Efficiency Combined Heat and Power through a High-Temperature Polymer Electrolyte Membrane Fuel Cell and Gas Turbine Hybrid System. Sustainability 2021, 13, 12515. [Google Scholar] [CrossRef]
- Automotive—Advent Technologies. Available online: https://www.advent.energy/automotive/ (accessed on 22 July 2022).
- Automotive—Blue World Technologies. Available online: https://www.blue.world/markets/automotive/ (accessed on 22 July 2022).
- Commercial collaboration between Tuco Marine and Blue World Technologies—Blue World Technologies. Available online: https://www.blue.world/commercial-collaboration-between-tuco-marine-and-blue-world-technologies/ (accessed on 22 July 2022).
- Araya, S.S.; Zhou, F.; Liso, V.; Sahlin, S.L.; Vang, J.R.; Thomas, S.; Gao, X.; Jeppesen, C.; Kær, S.K. A comprehensive review of PBI-based high temperature PEM fuel cells. Int. J. Hydrogen Energy 2016, 41, 21310–21344. [Google Scholar] [CrossRef]
- Haider, R.; Wen, Y.; Ma, Z.F.; Wilkinson, D.P.; Zhang, L.; Yuan, X.; Song, S.; Zhang, J. High temperature proton exchange membrane fuel cells: Progress in advanced materials and key technologies. Chem. Soc. Rev. 2021, 50, 1138–1187. [Google Scholar] [CrossRef]
- Li, J.; Yang, L.; Wang, Z.; Sun, H.; Sun, G. Degradation study of high temperature proton exchange membrane fuel cell under start/stop and load cycling conditions. Int. J. Hydrogen Energy 2021, 46, 24353–24365. [Google Scholar] [CrossRef]
- Bandlamudi, V.; Bujlo, P.; Linkov, V.; Pasupathi, S. The Effect of Potential Cycling on High Temperature PEM Fuel Cell with Different Flow Field Designs. Fuel Cells 2019, 19, 231–243. [Google Scholar] [CrossRef]
- Leader, J.O.; Yue, Y.; Walluk, M.R.; Trabold, T.A. Voltage degradation of high-temperature PEM fuel cells operating at 200C under constant load and start-stop conditions. Int. J. Hydrogen Energy 2022, 47, 18820–18830. [Google Scholar] [CrossRef]
- Borup, R.L.; Davey, J.R.; Garzon, F.H.; Wood, D.L.; Inbody, M.A. PEM fuel cell electrocatalyst durability measurements. J. Power Sources 2006, 163, 76–81. [Google Scholar] [CrossRef]
- Hu, J.; Zhang, H.; Zhai, Y.; Liu, G.; Yi, B. 500h Continuous aging life test on PBI/H3PO4 high-temperature PEMFC. Int. J. Hydrogen Energy 2006, 31, 1855–1862. [Google Scholar] [CrossRef]
- Zhai, Y.; Zhang, H.; Liu, G.; Hu, J.; Yi, B. Degradation Study on MEA in H3PO4/PBI High-Temperature PEMFC Life Test. J. Electrochem. Soc. 2007, 154, B72–B76. [Google Scholar] [CrossRef]
- Büchi, F.; Inaba, M.; Schmidt, T. Polymer Electrolyte Fuel Cell Durability; Springer: New York, NY, USA, 2009; Volume 1, pp. 1829–1841. [Google Scholar] [CrossRef]
- Schmidt, T.J.; Baurmeister, J. Properties of high-temperature PEFC Celtec®-P 1000 MEAs in start/stop operation mode. J. Power Sources 2008, 176, 428–434. [Google Scholar] [CrossRef]
- Cleghorn, S.J.C.; Mayfield, D.K.; Moore, D.a.; Moore, J.C.; Rusch, G.; Sherman, T.W.; Sisofo, N.T.; Beuscher, U. A polymer electrolyte fuel cell life test: 3 years of continuous operation. J. Power Sources 2006, 158, 446–454. [Google Scholar] [CrossRef]
- Prokop, M.; Drakselova, M.; Bouzek, K. Review of the experimental study and prediction of Pt-based catalyst degradation during PEM fuel cell operation. Curr. Opin. Electrochem. 2020, 20, 20–27. [Google Scholar] [CrossRef]
- Hansen, T.W.; Delariva, A.T.; Challa, S.R.; Datye, A.K. Sintering of catalytic nanoparticles: Particle migration or ostwald ripening? Accounts Chem. Res. 2013, 46, 1720–1730. [Google Scholar] [CrossRef]
- Yata, K.; Tamaguchi, T. Ostwald Ripening of Silver in Lead-Borosilicate Glass. Materials Science Forum 1993, 126–128, 643–646. [Google Scholar] [CrossRef]
- Okonkwo, P.C.; Ige, O.O.; Barhoumi, E.M.; Uzoma, P.C.; Emori, W.; Benamor, A.; Abdullah, A.M. Platinum degradation mechanisms in proton exchange membrane fuel cell (PEMFC) system: A review. Int. J. Hydrogen Energy 2021, 46, 15850–15865. [Google Scholar] [CrossRef]
- Liu, G. Progress of high temperature polybenzimidazole proton exchange membrane: A systematic review. J. Phys. Conf. Ser. 2021, 2076, 012032. [Google Scholar] [CrossRef]
- Oono, Y.; Sounai, A.; Hori, M. Long-term cell degradation mechanism in high-temperature proton exchange membrane fuel cells. J. Power Sources 2012, 210, 366–373. [Google Scholar] [CrossRef]
- He, R.; Li, Q.; Xiao, G.; Bjerrum, N.J. Proton conductivity of phosphoric acid doped polybenzimidazole and its composites with inorganic proton conductors. J. Membr. Sci. 2003, 226, 169–184. [Google Scholar] [CrossRef]
- Li, Q. High Temperature Proton Exchange Membranes for Fuel Cells. Ph.D. Thesis, Technical University of Denmark, Kongens Lyngby, Denmark, 2005. [Google Scholar]
- Oono, Y.; Sounai, A.; Hori, M. Prolongation of lifetime of high temperature proton exchange membrane fuel cells. J. Power Sources 2013, 241, 87–93. [Google Scholar] [CrossRef]
- Kannan, A.; Kabza, A.; Scholta, J. Long term testing of start-stop cycles on high temperature PEM fuel cell stack. J. Power Sources 2015, 277, 312–316. [Google Scholar] [CrossRef]
- Schmidt, T.J. Durability and Degradation in High-Temperature Polymer Electrolyte Fuel Cells. ECS Trans. 2006, 1, 19–31. [Google Scholar] [CrossRef]
- Moçotéguy, P.; Ludwig, B.; Scholta, J.; Barrera, R.; Ginocchio, S. Long term testing in continuous mode of HT-PEMFC based H3PO4/PBI celtec-PMEAs for μ-CHP applications. Fuel Cells 2009, 9, 325–348. [Google Scholar] [CrossRef]
- Moçotéguy, P.; Ludwig, B.; Scholta, J.; Nedellec, Y.; Jones, D.J.; Rozière, J. Long-term testing in dynamic mode of HT-PEMFC H3PO4/PBI celtec-P based membrane electrode assemblies for micro-CHP applications. Fuel Cells 2010, 10, 299–311. [Google Scholar] [CrossRef]
- Moradi, M.; Moheb, A.; Javanbakht, M.; Hooshyari, K. Experimental study and modeling of proton conductivity of phosphoric acid doped PBI-Fe2TiO5 nanocomposite membranes for using in high temperature proton exchange membrane fuel cell (HT-PEMFC). Int. J. Hydrogen Energy 2016, 41, 2896–2910. [Google Scholar] [CrossRef]
- BASF. Celtec MEAs; Technical Report; BASF: Ludwigshafen, Germany, 2008. [Google Scholar]
- Galbiati, S.; Baricci, A.; Casalegno, A.; Marchesi, R. Degradation in phosphoric acid doped polymer fuel cells: A 6000 h parametric investigation. Int. J. Hydrogen Energy 2013, 38, 6469–6480. [Google Scholar] [CrossRef]
- Simon Araya, S.; Juhl Andreasen, S.; Venstrup Nielsen, H.; Knudsen Kær, S. Investigating the effects of methanol-water vapor mixture on a PBI-based high temperature PEM fuel cell. Int. J. Hydrogen Energy 2012, 37, 18231–18242. [Google Scholar] [CrossRef]
- Modestov, A.; Tarasevich, M.; Filimonov, V.; Zagudaeva, N. Degradation of high temperature MEA with PBI-H3PO4 membrane in a life test. Electrochim. Acta 2009, 54, 7121–7127. [Google Scholar] [CrossRef]
- Oono, Y.; Fukuda, T.; Sounai, A.; Hori, M. Influence of operating temperature on cell performance and endurance of high temperature proton exchange membrane fuel cells. J. Power Sources 2010, 195, 1007–1014. [Google Scholar] [CrossRef]
- Schmidt, T.J.; Baurmeister, J. Durability and Reliability in High-Temperature Reformed Hydrogen PEFCs. ECS Trans. 2006, 3, 861–869. [Google Scholar] [CrossRef]
- Wannek, C.; Konradi, I.; Mergel, J.; Lehnert, W. Redistribution of phosphoric acid in membrane electrode assemblies for high-temperature polymer electrolyte fuel cells. Int. J. Hydrogen Energy 2009, 34, 9479–9485. [Google Scholar] [CrossRef]
- Wannek, C.; Kohnen, B.; Oetjen, H.F.; Lippert, H.; Mergel, J. Durability of ABPBI-based MEAs for high temperature PEMFCs at different operating conditions. Fuel Cells 2008, 8, 87–95. [Google Scholar] [CrossRef]
- Vang, J.R. HTPEM Fuel Cell Impedance: Mechanistic Modelling and Experimental Characterisation. Ph.D. Thesis, Department of Energy Technology, Aalborg University, Aalborg, Denmark, 2014. [Google Scholar]
- O’Hayre, R.; Cha, S.; Colella, W.; Prinz, F.B. Fuel Cell Fundamentals; John Wiley & Sons, Ltd.: Hoboken, NJ, USA, 2016. [Google Scholar] [CrossRef]
- Sahlin, S.L.; Araya, S.S.; Andreasen, S.J.; Kær, S.K. Electrochemical Impedance Spectroscopy (EIS) Characterization of Reformate-operated High Temperature PEM Fuel Cell Stack. Int. J. Power Energy Res. 2017, 1, 20–40. [Google Scholar] [CrossRef]
- Zhang, J.; Xie, Z.; Zhang, J.; Tang, Y.; Song, C.; Navessin, T.; Shi, Z.; Song, D.; Wang, H.; Wilkinson, D.P.; et al. High temperature PEM fuel cells. J. Power Sources 2006, 160, 872–891. [Google Scholar] [CrossRef]
- Lee, J.M.; Han, H.; Jin, S.; Choi, S.M.; Kim, H.J.; Seo, M.H.; Kim, W.B. A Review on Recent Progress in the Aspect of Stability of Oxygen Reduction Electrocatalysts for Proton-Exchange Membrane Fuel Cell: Quantum Mechanics and Experimental Approaches. Energy Technol. 2019, 7, 1900312. [Google Scholar] [CrossRef]
- Chugh, S.; Chaudhari, C.; Sonkar, K.; Sharma, A.; Kapur, G.; Ramakumar, S. Experimental and modelling studies of low temperature PEMFC performance. Int. J. Hydrogen Energy 2020, 45, 8866–8874. [Google Scholar] [CrossRef]
- de Beer, C.; Barendse, P.; Pillay, P.; Rengaswamy, R.; Bullecks, B. Derivation of an equivalent electrical circuit model for degradation mechanisms in high temperature pem fuel cells in performance estimation. In Proceedings of the 2014 IEEE Energy Conversion Congress and Exposition (ECCE), Pittsburgh, PA, USA, 14–18 September 2014; pp. 4583–4590. [Google Scholar] [CrossRef]
- Kim, M.; Kang, T.; Kim, J.; Sohn, Y.J. One-dimensional modeling and analysis for performance degradation of high temperature proton exchange membrane fuel cell using PA doped PBI membrane. Solid State Ionics 2014, 262, 319–323. [Google Scholar] [CrossRef]
- Qi, Z.; Buelte, S. Effect of open circuit voltage on performance and degradation of high temperature PBI-H3PO4 fuel cells. J. Power Sources 2006, 161, 1126–1132. [Google Scholar] [CrossRef]
- Lim, I.S.; Park, J.Y.; Kang, D.G.; Choi, S.H.; Kang, B.; Kim, M.S. Numerical study for in-plane gradient effects of cathode gas diffusion layer on PEMFC under low humidity condition. Int. J. Hydrogen Energy 2020, 45, 19745–19760. [Google Scholar] [CrossRef]
- Oono, Y.; Sounai, A.; Hori, M. Influence of the phosphoric acid-doping level in a polybenzimidazole membrane on the cell performance of high-temperature proton exchange membrane fuel cells. J. Power Sources 2009, 189, 943–949. [Google Scholar] [CrossRef]
- Mader, J.; Xiao, L.; Schmidt, T.J.; Benicewicz, B.C. Polybenzimidazole/Acid Complexes as High-Temperature Membranes. In Fuel Cells II, Advances in Polymer Science; Scherer, G.G., Ed.; Springer: Berlin/Heidelberg, Germany, 2008; Volume 216, pp. 63–124. [Google Scholar] [CrossRef]
- Hu, J.; Zhang, H.; Zhai, Y.; Liu, G.; Hu, J.; Yi, B. Performance degradation studies on PBI/H3PO4 high temperature PEMFC and one-dimensional numerical analysis. Electrochim. Acta 2006, 52, 394–401. [Google Scholar] [CrossRef]
- Zhai, Y.; Zhang, H.; Xing, D.; Shao, Z.G. The stability of Pt/C catalyst in H3PO4/PBI PEMFC during high temperature life test. J. Power Sources 2007, 164, 126–133. [Google Scholar] [CrossRef]
- Bett, J.; Kinoshita, K.; Stonehart, P. Crystallite growth of platinum dispersed on graphitized carbon black. J. Catal. 1974, 35, 307–316. [Google Scholar] [CrossRef]
- Seel, D.C.; Benicewicz, B.C.; Xiao, L.; Schmidt, T.J. High-Temperature Polybenzimidazole-Based Membranes; John Wiley & Sons, Inc.: Hoboken, NJ, USA, 2009; Volume 5–6, pp. 1–13. [Google Scholar]
- Yu, S.; Xiao, L.; Benicewicz, B.C. Durability Studies of PBI-based High Temperature PEMFCs. Fuel Cells 2008, 8, 165–174. [Google Scholar] [CrossRef]
Figure 1.
A flow chart of the modeling approach in the current work.

Figure 2.
Evolution of d/d over time from the literature data. Data obtained from Buchi (70 °C) [18], Borup (80 °C) [15], Hu (150 °C) [55], Oono 1 (150 °C) [39], Oono 2 (150 °C) [26], Zhai 1 (150 °C) [56], Zhai 2 (150 °C) [17], Modestov (160 °C) [38], Wannek (160 °C) [42], Qi (160 °C) [51] and Oono 3 (190 °C) [29].

Figure 3.
Evolution of d/d and its dependence on temperature. (a) Logarithmic fit of d/d over time. (b) Ratio d/d as a function of temperature. Data from Büchi et al. [18], Zhai et al. [56] and Borup et al. [15] were obtained after 1500 cycles (∼500 h), and data from Oono et al. [39] were obtained after 1029 h and 1250 h at 150 °C and 190 °C, respectively.

Figure 4.
Temperature dependency of activation losses over time. (a) Activation overpotential over time as a function of temperature. (b) Diameter relative to the initial diameter over time as a function of temperature.
Figure 4.
Temperature dependency of activation losses over time. (a) Activation overpotential over time as a function of temperature. (b) Diameter relative to the initial diameter over time as a function of temperature.

Figure 5.
Contribution of catalyst mass loss to ECSA loss.

Figure 6.
Temperature dependency of ohmic losses over time. (a) Conductivity of PBI–HPO at different operating conditions together with fits (recreated from [27]). (b) Phosphoric acid evaporation rate as a function of temperature. Data from Seel et al. [58] and Yu et al. [59].

Figure 7.
Ohmic overpotential over time as a function of temperature.

Figure 8.
Cell voltage over time at 160 °C.

Figure 9.
Voltage decay rates vs. temperature. (a) BoL voltage and decay rates as a function of temperature. (b) Cell voltage after 20,000 h and mean operating voltage as a function of temperature.
Figure 9.
Voltage decay rates vs. temperature. (a) BoL voltage and decay rates as a function of temperature. (b) Cell voltage after 20,000 h and mean operating voltage as a function of temperature.


Table 1.
Literature survey of HT-PEMFC degradation data. std represents recommended standard operating conditions (160 °C, 0.2 , 1 atm, / = 1.2/2), ss is steady state operation, t is time (durability test), T is temperature, cyc is cycling operation and reformate refers to the hydrogen-rich gas produced during methanol-steam reforming process.
| Reference | Investigated Parameter | Voltage Decay Rate | T | i | / | Cycling/Steady State | Fuel | Duration | MEA |
|---|---|---|---|---|---|---|---|---|---|
| (μV/h) | (°C) | (A/cm2) | (h) or (Number of Cycles) | ||||||
| BASF [35] | t | 6 | std | std | std | ss | H2 | ||
| cycle | 47 | std | std | n/a | 2 h on/2 h off | H2 | 200 cyc | P1000 | |
| cycle | 35 | std | std | n/a | 2 h on/2 h off | H2 | 200 cyc | P1100W | |
| Galbiati et al. [36] | t | 8.6 | std | std | std | ss | H2 | 950 h | P2100 |
| T | 19 | 180 | std | std | ss | H2 | 400 h | P2100 | |
| i | 4.5 | std | 0.4 | std | ss | H2 | 800 h | P2100 | |
| 8.5 | std | std | 1.2/4 | ss | H2 | 800 h | P2100 | ||
| Hu et al. [16] | t | 150 | 150 | 0.64 | n/a | ss | H2 | 500 h | own |
| Simon Araya et al. [37] | t | 5 | std | 0.22 | 1.2/4 | ss | H2 | 123 h | Celtec-P |
| fuel impurities | 900 | std | 0.22 | 1.2/4 | ss | 5% CH3OH/H2O | 400 h | Celtec-P | |
| fuel impurities | 3400 | std | 0.22 | 1.2/4 | ss | 8% CH3OH/H2O | 200h | Celtec-P | |
| Modestov et al. [38] | t | 25 | std | std | 1.3/1.8 | ss | H2 | 780 h | own |
| Moçotéguy et al. [32] | t | 41 | std | 0.4 | 1.4/2 | ss | reformate | 1105 h | P1000 |
| Moçotéguy et al. [33] | t | 35 | std | std | std | ss | reformate | total: ∼650 h | P1000 |
| cycling | 139/117 | std | 0.2/0.4 | std | 6 h 0.2/6 h 0.4 | reformate | P1000 | ||
| cycling | 54/26 | std | 0.2/0.4 | std | 12 h 0.2/12 h 0.4 | reformate | P1000 | ||
| cycling | 67 | std | std | std | 12 h on/12 h off | reformate | P1000 | ||
| Oono et al. [39] | T | 3.6 | 150 | std | 3.7/3.7 | ss | H2 | >16,000 h | own |
| T | 13 | 170 | std | 3.7/3.7 | ss | H2 | 6400 h | own | |
| T | 59 | 190 | std | 3.7/3.7 | ss | H2 | 1220 h | own | |
| Oono et al. [26,29] | t | 3 (t < 14,000 h); 9 (t > 14,000 h) | 150 | std | 3.7/3.7 | ss | H2 | 17,860 h | FuMA-Tech |
| Schmidt and Baurmeister [40] | t | 20 | 180 | std | std | ss | H2 + H2O | ∼200 h | P1000 |
| fuel impurities | 20 | 180 | std | std | ss | reformate | 200 h | P1000 | |
| fuel impurities | 20 | 180 | std | std | ss | reformate + Sulfur | 3200 h | P1000 | |
| Schmidt and Baurmeister [19] | t | 5 | std | std | std | ss | H2 | 6.000 h | P1000 |
| cycle | 11 | std | std | std | 12 h on/12 h off | H2 | 240 cyc | P1000 | |
| Kannan et al. [30] | t | 13.25 | 140 | 0.25 | 1.25/2.5 | ss | reformate | >1600 h | P1100W |
| i/cycling | 11 | 120–180 | 0.03 | 1.25/2.5 | cyc | reformate | 4160 h, 1562 cyc | P1100W | |
| i/cycling | 26 | 120–180 | 0.25 | 1.25/2.5 | cyc | reformate | P1100W | ||
| i/cycling | 133 | 120–180 | OCV | 1.25/2.5 | cyc | reformate | P1100W | ||
| Wannek et al. [41] | t | std | std | 2/2 | ss | H2 | 1000 h | custom FuMA-Tech | |
| Wannek et al. [42] | t | 25 | std | st | 2/2 | ss | H2 | >1000 h | FuMA-Tech |
| t | 20 | std | std | 2/2 | ss | H2 | order of hundreds | FuMA-Tech | |
| i/cycling | 180 | std | std | 2/2 | load variation | H2 | FuMA-Tech | ||
| cycling | 120 | std | std | 2/2 | off 1/d | H2 | FuMA-Tech |
Table 2.
Coefficients for fitting Equation (17), conductivity of PBI–HPO at different operating conditions (data from [27]).
| −0.005812 | |
| 0.0001675 | |
| −0.007636 | |
| 6.518 × 10 | |
| 0.0005617 | |
| 0.9958 |
Table 3.
Parameters used in this model if not stated otherwise.
| Parameter | Value | Unit | |
|---|---|---|---|
| Charge transfer coefficient | 0.5 | ||
| Cell area | 45 | ||
| Membrane thickness | 1 × 10 | m | |
| DL | Acid doping level | 5 | PRU |
| I | Cell current | 9 | A |
| L | Initial PBI loading | 6 | |
| L | Initial platinum loading | 0.75 | |
| m | Loss of active Pt | 0 | mg/( × h) |
| p | Pressure (pan = pcat) | 1 | atm |
| u | Utilization | 1 | |
| W | PA concentration | 0.95 | |
| Anode feed | 100% H2 | ||
| Cathode feed | 21% O2 (air) | ||
| i | Current density | 0.2 |
Publisher’s Note: MDPI stays neutral with regard to jurisdictional claims in published maps and institutional affiliations. |
© 2022 by the authors. Licensee MDPI, Basel, Switzerland. This article is an open access article distributed under the terms and conditions of the Creative Commons Attribution (CC BY) license (https://creativecommons.org/licenses/by/4.0/).
Share and Cite
MDPI and ACS Style
Zhou, M.; Frensch, S.; Liso, V.; Li, N.; Sahlin, S.L.; Cinti, G.; Simon Araya, S. Modeling the Performance Degradation of a High-Temperature PEM Fuel Cell. Energies 2022, 15, 5651. https://0-doi-org.brum.beds.ac.uk/10.3390/en15155651
AMA Style
Zhou M, Frensch S, Liso V, Li N, Sahlin SL, Cinti G, Simon Araya S. Modeling the Performance Degradation of a High-Temperature PEM Fuel Cell. Energies. 2022; 15(15):5651. https://0-doi-org.brum.beds.ac.uk/10.3390/en15155651
Chicago/Turabian StyleZhou, Mengfan, Steffen Frensch, Vincenzo Liso, Na Li, Simon Lennart Sahlin, Giovanni Cinti, and Samuel Simon Araya. 2022. "Modeling the Performance Degradation of a High-Temperature PEM Fuel Cell" Energies 15, no. 15: 5651. https://0-doi-org.brum.beds.ac.uk/10.3390/en15155651
Note that from the first issue of 2016, this journal uses article numbers instead of page numbers. See further details here.