
Assessing the Contribution of Natural Gas Exploitation to the Local Economic Growth in China


1
School of Economics and Management, Southwest University of Science and Technology, Mianyang 621010, China
2
Business School, Wuchang University of Technology, Wuhan 430223, China
*
Author to whom correspondence should be addressed.
Energies 2022, 15(16), 5853; https://0-doi-org.brum.beds.ac.uk/10.3390/en15165853
Submission received: 4 July 2022
/
Revised: 31 July 2022
/
Accepted: 9 August 2022
/
Published: 12 August 2022
(This article belongs to the Special Issue Low-Carbon Consumption and Production towards Carbon Neutrality in China)
Abstract
:This study investigates whether natural gas exploitation is a blessing or a curse for provincial and prefecture economic growth. This study employs regression models and synthetic control methods (SCM) to investigate the research question based on hybrid panel and time-series data from 1993 to 2015 from 14 prefecture cities in Sichuan province in China. Based on the provincial data of Sichuan, the regression results show that natural gas exploitation is a curse for the provincial economic development of Sichuan because of the negative associations between gas resources and economic performance, for which the increasing rent-seeking in the province may partially account. However, the SCM results find that the local economy of Dazhou city may benefit from its sufficient natural gas resources in the short run, but it is not sustainable. Meanwhile, the gas resource has no significant contributions to the regional economic growth of Sichuan overall, which is partially attributed to the fact that resource exploitation has no significant spillover effects on some sustainable contributors, such as education, innovation, and others. The practical implication for the economic governors is that the resource-consumed economic route is not sustainable, although it may drive local economic growth in the short run.
1. Introduction
Recently, discussions on the relationship between resource consumption and economic development are prevailing. Some scholars agree that abundant natural resources may promote economic growth [1,2,3,4], and evidence from Botswana, Norway, and others support this point of view [5,6]. However, some studies suggest that the countries and regions with rich resources have lower economic growth rates than those with insufficient resources [7,8]. Based on the industrial evidence of oil and mineral, Gelb [7] and Auty [8] reveal the sluggish economic development in the regions with abundant resources and document that abundant natural resources in a country may, in turn, lead to its economic recession toward negative growth under certain conditions. On the contrary, some resource-limited countries, such as Singapore and Korea, have rapid economic growth.
The theoretical studies on natural resources and economic growth have made significant progress in recent years, particularly regarding resource development affecting technological innovation [9], system reform [9,10,11], comparative advantage and industrial structure [12,13,14], and other factors related to the quality of long-term economic growth, such as human capital accumulation and wealth distribution [15,16,17,18,19]. In terms of long-term economic growth, these studies find that most resource-dominated countries benefit from blessing resources in the early stage, which means that resource discovery may contribute to rapid economic growth in the short run. Some countries, such as Australia and Malaysia, benefit from their natural resource exports to take advantage of foreign exchanges and technologies, which may accumulate favorable conditions, such as infrastructure construction, human capital cultivation, and social governance innovation, to balance their economic development in the long run [20].
On the contrary, some research suggests it is not always, particularly for more resource-rich countries or regions. The existing studies have documented many examples that resource development hinders economic development [21]. Fleming-Muñoz [22] supports this point of view with more detailed evidence. In addition, it appears in different sectors. Matsuyama [23] reveals that resource discovery may encourage farmers in some agricultural countries to go to manufacturing industries when the employment market is booming, thus which inhibits the initial development of agricultural productivity. Following Auty [24], Sachs and Warner [25,26] further investigated the relationship between resource discovery and low economic growth and suggested that the countries with abundant resources develop slower than the resource-poor countries, which is hard to explain economic development from the perspective of resource abundance. Nevertheless, no direct evidence shows that the omitted geographical or climatic variables can explain this phenomenon or other unobserved growth barriers.
By summarizing the previous empirical studies, it was found that with the improvement of measurement methods and theories, more and more scholars agree that the phenomenon of resource development affecting economic growth does exist at the regional level. They carried out some studies on the possible communication channels. However, few people have regarded recent resource discovery as an emerging factor to study under the existing local economic system and market environment. This study bridges this gap and has two strands of significance. First, this paper studies the impact of natural resources on economic growth in the synthetic control method (SCM), which better addresses the endogeneity issue than traditional estimation methods. Secondly, local policy-related factors as a cause of resource barriers are detected by mechanism tests, which suggest that resource discovery drives economic growth to a certain extent due to the local political structure and unique policy environment.
To address this research question, this study uses the event evaluation method and regression models with panel data, which were collected from Dazhou in Sichuan province—a natural gas abundant city in China—to study whether the high local economic growth of 13% per year benefits from the exploitation of natural gas resources in recent years. The event analysis method is employed to further study the research question instead of identifying the distinction between resource-rich and resource-poor cities due to data limitations in some regions. It shows that the local economy is expected to develop further by reducing rent-seeking caused by resource development, encouraging innovation, and enhancing human capital. Meanwhile, abundant resources may facilitate regional economic development when human resources, education, and other essential elements develop synchronously.
2. Literature Review
The relationship between resource development and national economic growth has been extensively discussed. In 1984, Corden proposed the “Dutch Disease” theory, which argued that booming resource-related industries considerably suppressed the development of other industries and eventually restrained economic growth [27]. In addition to the idea, Humphreys et al. [5] document that expanding resource-dominated industries in resource-rich areas may potentially squeeze out human capital, resulting in opportunism behaviors and rent-seeking activities. The extensive expansion unbalances economic development toward a low-growth dilemma with the increasing pressure on the ecological environment.
Studies focusing on the developing countries in Southeast Asia and Latin America show a negative association between natural resources and economic growth [28,29]. Angrist and Kugler [30] suggest that with more resource development, more per capita GDP decline in some Latin American countries. However, natural resources are viewed as a desired means to obtain wealth in some undeveloped countries. Costa [31] presents a similar finding based on oil resources in developing countries. Sachs and Warner [32,33] initially identified the transmission mechanism accounting for why resource development inhibited economic growth. Natural resources restrained the development of innovations, education, and foreign investment in developing countries. In addition, their finding denied the role of the political system in the transmission mechanism.
In terms of the micro-and macro-factors determinants, in the long run, Xu and Hu [34] argue that human capital investment has a threshold effect on resource development and economic growth because significant investments in human capital can not only offset the negative impact of natural resources on economic growth, but can also effectively allocate funds to improve enterprises’ productivity, and eventually promote economic development. From a macro perspective, Boyce et al. [35] reveal that the fundamental reason for the different effects of resources on economic growth is the increasing supplies and demands on resources in various regional markets and the mismatch with local institutions. Furthermore, Kjetil [36] finds that the governmental jurisdiction system may facilitate resource-driven economic growth. These points of view are in line with others. Therefore, the economic benefits of resources result from favorable market mechanisms, which ultimately affect economic growth.
In terms of economic institutions, China has different economic institutions from others. The Chinese government plays a significant role in economic development, so the institutional factors have to be considered when discussing the contribution of resource development to economic growth. For instance, Deng et al. [37] reveal that the benefits of resource development are positively associated with economic growth, and some institutional factors adjust the relationship. Meanwhile, Mehlum et al. [38] document that institutional factors play a significant role in accounting for resource development and restricting economic growth sustainability.
Some research further studied and explored the causes and effects of the different relationships between them and attributes to the great division of labor system and regional heterogeneity across the world. Especially in some cities and counties, the differences are more significant. For instance, the Center–Periphery theory attributes the different effects of resource development to the world division of labor system [39]. Murshed [40] argues that the natural resource centralized production and profit model is more likely to breed rent-seeking activities. Isham et al. [41] suggest that the export of resources worsens the foreign trade conditions of a nation. Other kinds of theory, such as Dutch disease theory [42], crowding-out effect on education, innovation, investment, and resource erosion to a political system [43,44,45,46], show a similar viewpoint.
Meanwhile, these findings vary with the different empirical methods. Most studies use traditional panel data processing methods to analyze the relationship between resource enrichment and economic growth. For instance, endogenous problems are incurred when GDP closely related variables are used to measure the natural resource richness index [10,14]. Sun and Si [47] argue that dynamic panel data are unsuitable for investigating the relationship compared to cross-sectional data, denying the negative association between resource development and economic growth. Cao et al. [48] argue the financial threshold effect of resource endowment on economic growth mechanism and find that the positive impact of resource development is associated with the level of the regional financial industry. In addition, employing a spatial dynamic panel data model, Xu et al. [49] suggest that the regional economic disparity in northeast China is due to the regional location with different environmental regulations and economic policies rather than resource endowment, which means the inhibitory effect of resource development on economic growth is complicated. In terms of variable selections, Guo et al. [50] employ the spatial agglomeration of the resource industry instead of a traditional index to measure the richness of natural resources and find a negative relationship between the resource industry’s spatial agglomeration and regional agglomeration economic growth.
To sum up, the existing research is mainly based on the primary panel data regression models to analyze the contributions of resource development to economic growth. These methods inevitably have issues with control variables, explanatory variables, and the selection of regression methods. This paper applies the synthetic control method to study the relationship between resources and economic developments in Sichuan province in China to overcome the lack of control variables and the corresponding endogeneity. Further, based on mechanism analysis, we introduce a perspective of rent-seeking and human resources and find that the critical determinants by which resources bring a curse or blessing are the institutional structure and environmental policies.
3. Data
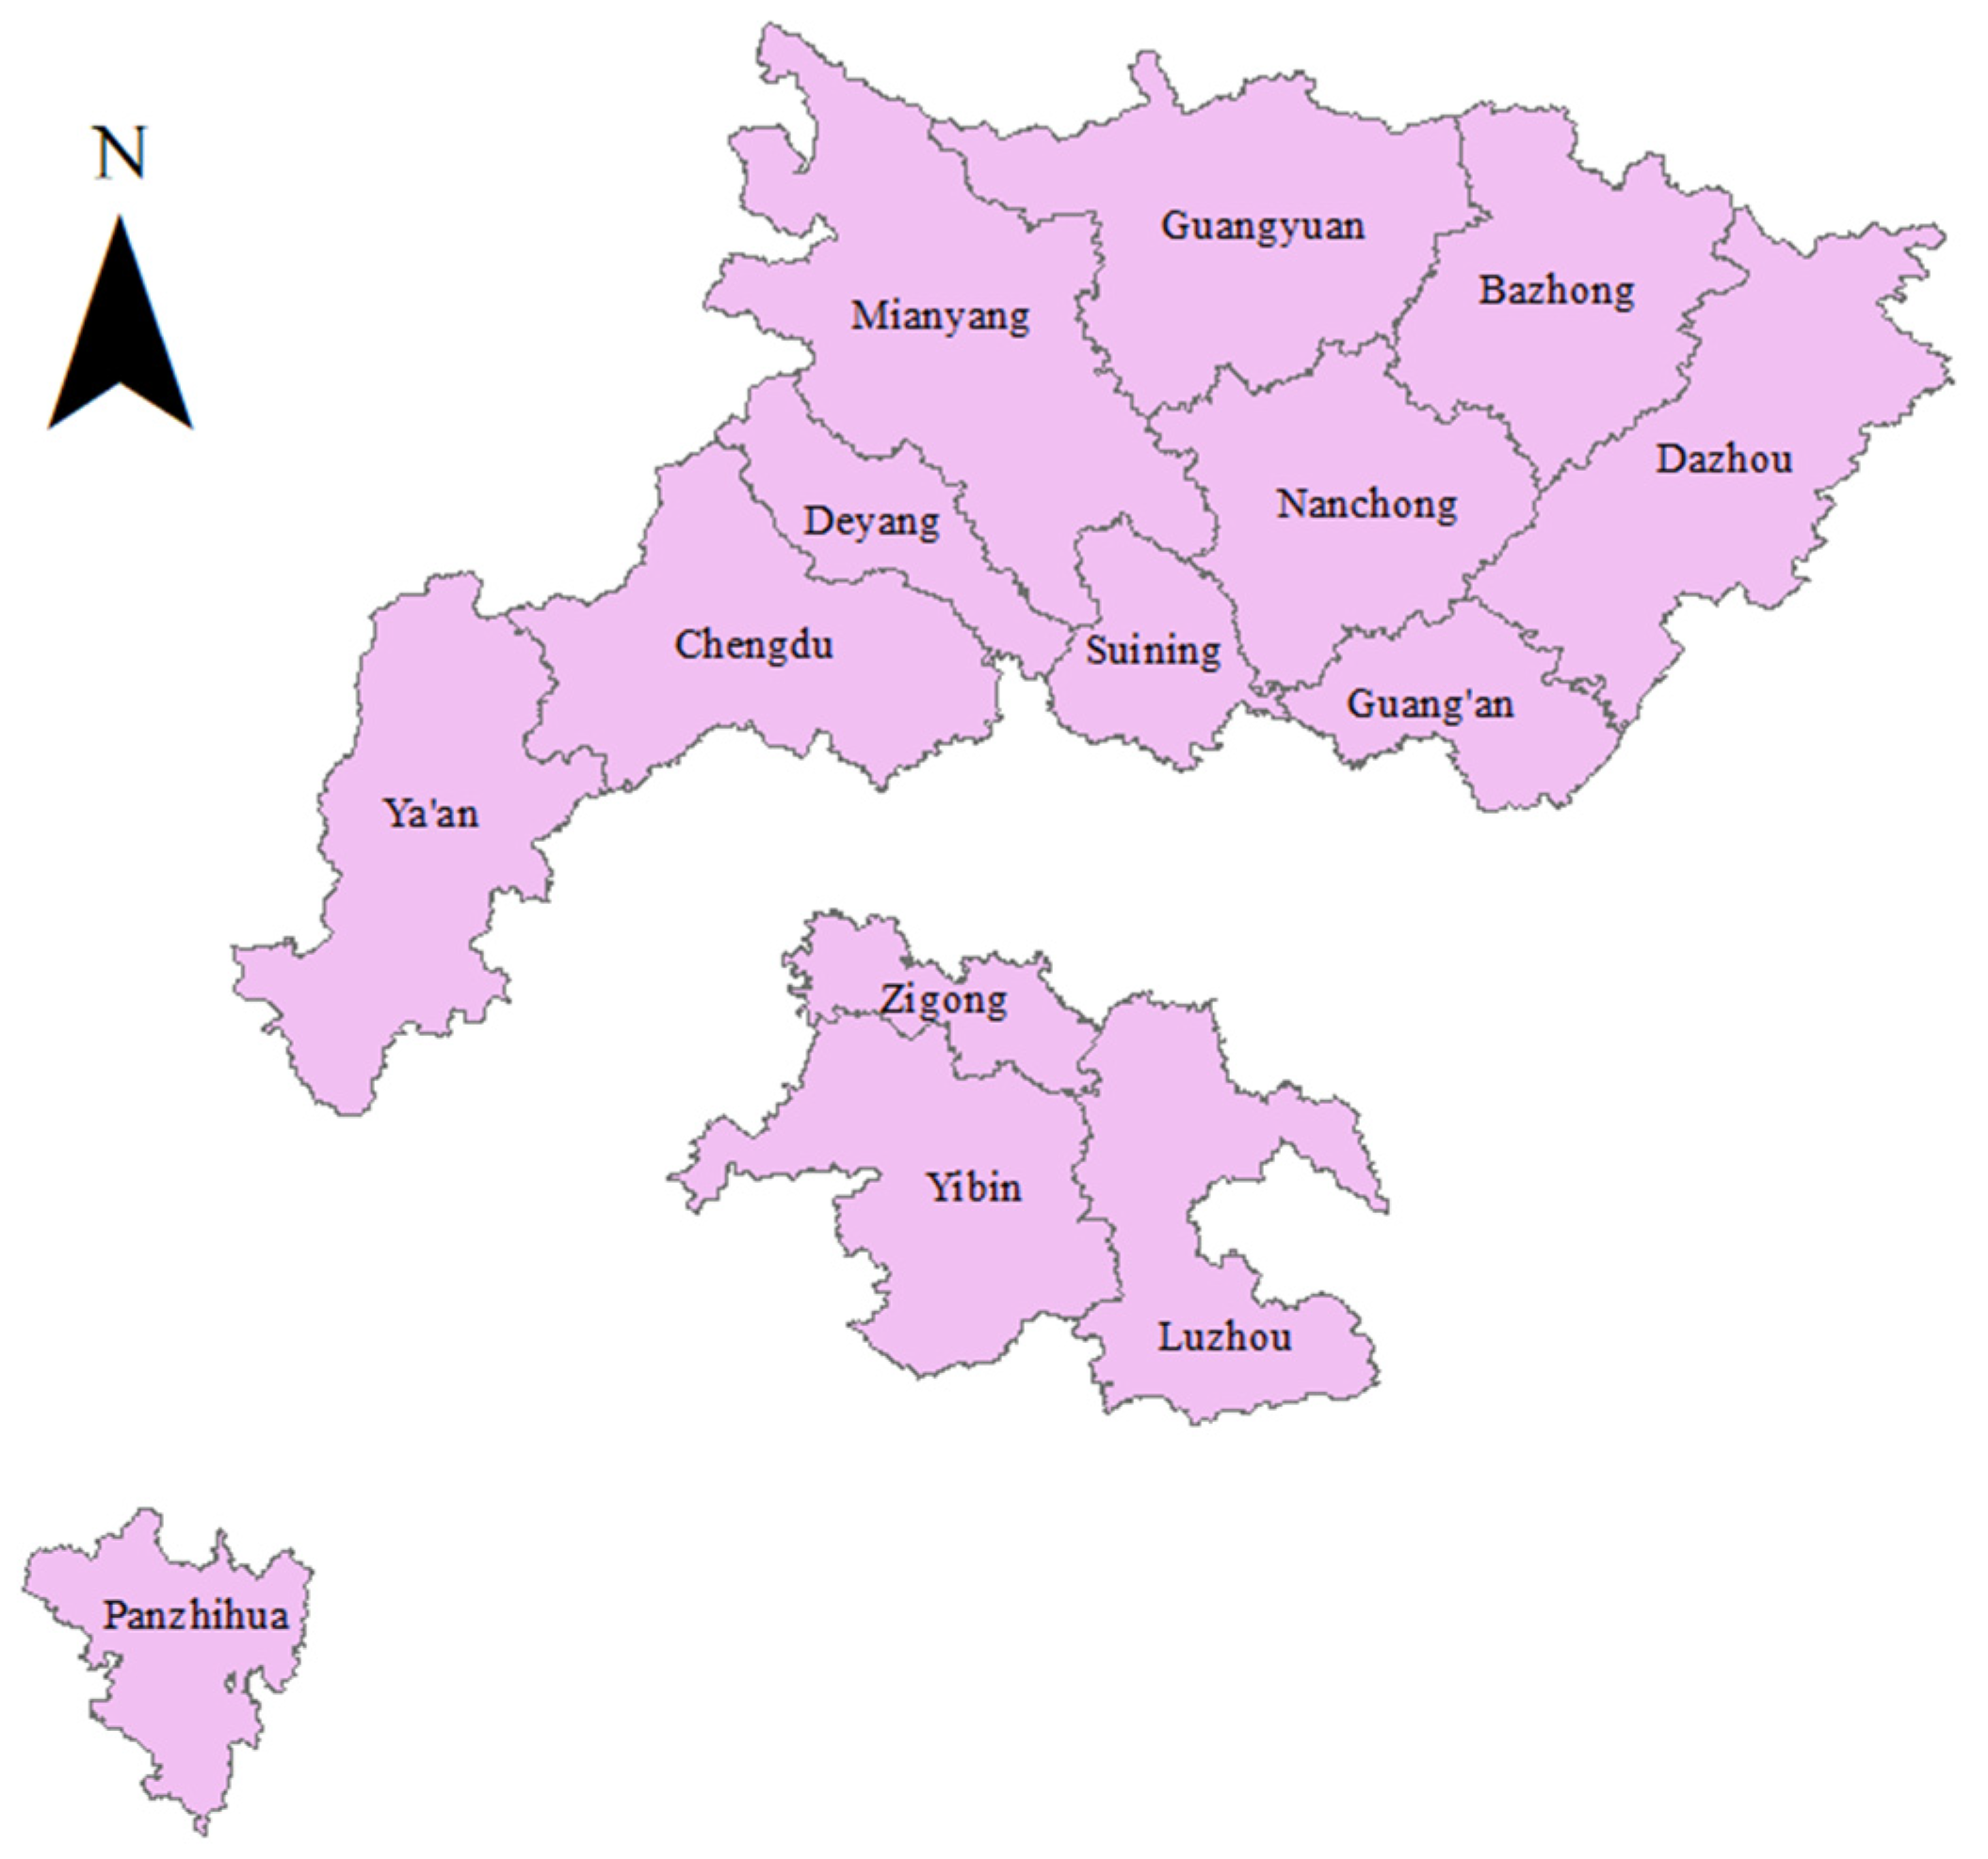
This paper collected data from 14 cities in Sichuan province during1993 to 2015. Due to the change of administrative divisions and the lack of data, the 14 cities shown in Figure 1 are retained. Dazhou city is located in the northeast of Sichuan Province. The actual per capita GDP data, the scientific research personnel of government departments and their expenditures, and the technical development personnel of large and medium-sized industrial enterprises and their research and development (R&D) expenses were gathered from the Statistical Yearbooks of Sichuan Province in these years.
The measurement of human capital is measured by the entropy value of educational cost to the number of students in elementary school, middle school, and university. Innovation is measured by the government investment in research and development (R&D). Some missing data have been supplemented by linear interpolation. These kinds of data are described in Table 1. The extreme value difference in the data is mainly due to the significant difference in economic variables among cities in the province. As the follow-up analysis requires mutual fitting between samples, only the abnormal observation data are excluded without tailing.
4. Methods
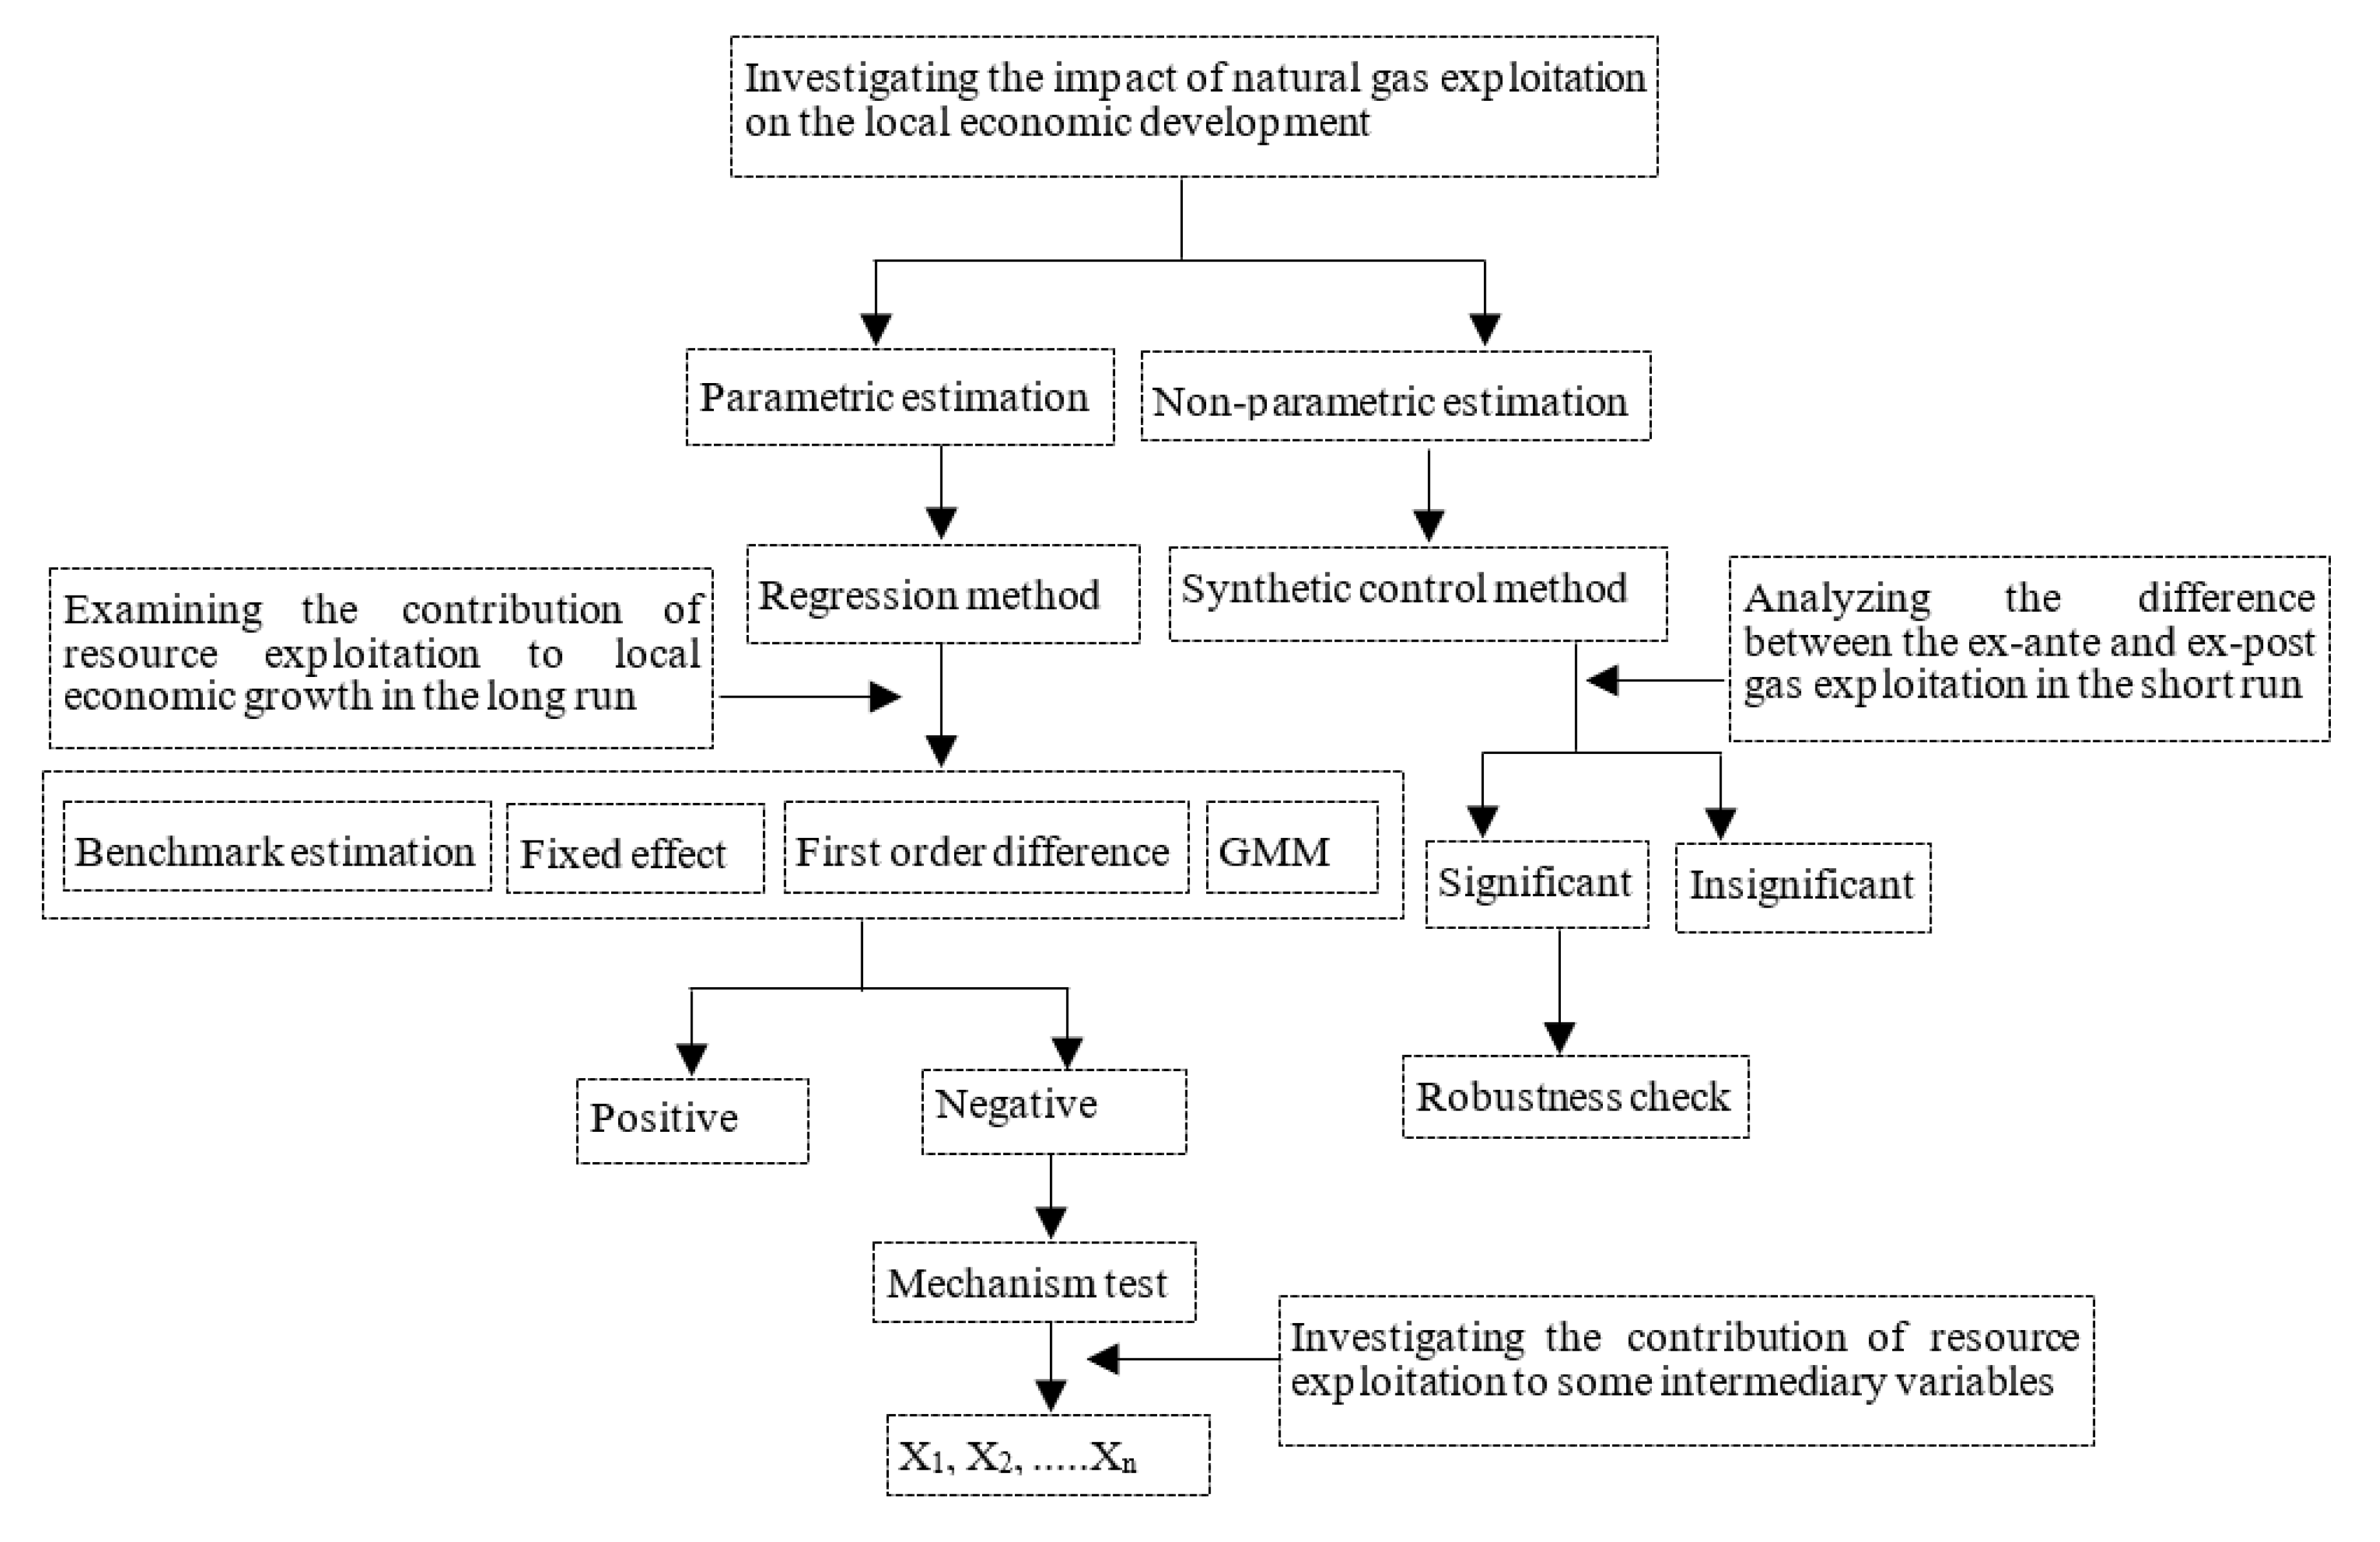
This study adopts both parametric and non-parametric methods to evaluate the contribution of natural gas exploitation to local economic growth. Figure 2 outlines a methodology mind-map. First of all, regression models are used for parametric estimation to investigate how extent natural gas exploitation contributes to the provincial economy of Sichuan. We conclude whether the contribution is positive by comparing results from three models: fixed effect, first-order difference, and generalized method of moments (GMM), and comparing them with those from the benchmark model. Secondly, the Synthetic control method as the non-parametric estimation is used to evaluate the difference in the local economic performance between the ex-ante and ex-post gas events in Dazhou city. Then, a robustness check follows to confirm the results. Thirdly, following the regression results, a mechanism test is adopted to investigate how extent the gas event is associated with some intermediary variables that may indirectly impact the local economic performance in the long run.
4.1. Regression Method Estimation
This study aims to explore how resource exploitation impacts local economic development in Sichuan province. First, a benchmark regression model is adopted to investigate how the most significant variables determine the local economy. Then, the resource intensity variable is then included in the regression model as an independent variable to test the relationship between resource development and economic growth. Furthermore, the first-order difference method is used to re-estimate by introducing lnresource lag to deal with the endogeneity between economic growth and the causal identification of the number of employees in the mining industry. Lastly, with the extended data span, two-way causality may be dominated endogeneity in identifying variables; differential GMM introduces the lag term to estimate and eliminate the endogenous factors.
According to previous empirical research [51,52], income is proposed as a dependent variable measured by GDP per capita. As innovation (innova) may contribute to economic development [51,52], thus, it is included in the model as an independent variable and measured by the entropy weight method, precisely by the scientific research personnel and their expenditures on government departments and the technical development personnel and their R&D expenditures of large and medium-sized industrial enterprises.
As Boyce et al. [35] suggested, human capital (hcapital) is a significant factor of economic growth in the long run, measured by the number of students in elementary schools, middle schools, and universities, the cost of education through the entropy weight method. Since resources drive economic growth mainly in mining, raw ore processing, and other related manufacturing industries, the number of employees in these sectors is considered. The number of mining employees is the resource measure for the long-term continuous statistics of resource exploitation [28]. As the mining industry is greatly affected by the macro environment and has apparent periodicity (China’s mining employment dropped by 41.72% from 1994 to 2002 and then increased by 44.10% in 2010 [49]), the trend in the number of people in the mining industry is processed to smooth out the periodic disturbance and make it better fit the resource intensity.
To avoid heteroscedasticity and improve data stability, the logarithm was taken for the independent and dependent variables. Putting the variable above into the Cobb-Douglas production function, a benchmark model is set below:
lnincomeit = β0 + β1lninnovait + β2lnhcapitalit + β3lnlaborit + β4lninvestit + εit
Furthermore, the resources variable was added to test the impact of the natural gas exploitation on the local economy of Dazhou in Sichuan province. An updated regression model is developed below:
where βi is the elastic coefficient of the corresponding explanatory variable.
lnincomeit = β0 + β1lninnovait + β2lnhcapitalit + β3lnlaborit + β4lninvestit + β5lnresourceit + εit
4.2. Synthetic Control Method
According to Abadie and Gardeazabal [53], SCM is a method to synthesize a control group as the counterfactual substitute of the experimental group from the sample pool in addition to the research object; it is highly similar to the experimental group before the event and compares the trend after the event with the experimental group to evaluate the impact of the event or policy. Because only Dazhou has discovered many natural gas resources during the research period, this paper uses other 13 cities in Sichuan province as the sample pool to fit Dazhou.
Suppose y is the result variable observed in region i in time t, and it is the result variable that region i has not received policy intervention simultaneously. The superscript N means that region i has not been interfered with.
δt represents the time-fixed effect, which is not affected by gas field development events and does not change within the time. Zi represents the observable covariates not affected by the gas field development events in different regions. θ’t is an unknown parameter vector representing the unobservable fixed effect of region i. λ’t stands by the unobservable time-varying common effect. Error εit means the random impact of each region.
The weight vector of the control region is W = (W2…Wj+1). If there are j regions in total, and each region’s weight is Wj, the sum of all of the weights of the other 13 cities in Sichuan Province is 1 (). The goal is to fit a mixed group similar to that of Dazhou. Choose a weight W, and make X0W close to X1. In other words, when X0 is weighted, the economic characteristics of the composite control area should be as close as possible to those of Dazhou.
This equation is used to gauge the distance. X0 represents the eigenvectors of the other 13 regions in the province before implementing the policy. X1 is the eigenvector of Dazhou before the implementation of the policy. V is the diagonal matrix, which reflects the relative importance of the prediction variables to the result variables, and determines the optimal weight W by minimizing the absolute value. The minimum mean square prediction error determines whether the absolute value is minimum.
X0W, the most accurate synthetic control group, is measured using the weight W, which is most similar to the Dazhou-fitted. Observe the difference between X1 (Dazhou) and Dazhou city after discovering natural gas resources to determine the impact of natural gas resources.
Since its inception, the SCM method has been widely used in policy and event research. Its advantage is that it uses the counterfactual framework to study the difference between the treatment and control groups, which overcomes the endogeneity. The SCM method has achieved good results in the study of events such as the establishment of special economic zones in China [54], the Basque country [53], and the Wenchuan earthquake [55]. Its main purpose is to fit the possible development path of the sample group that has not experienced the event’s impact in a certain period through closely related other regions and take this as the comparison group and the facts to study the event’s effect.
4.3. Mechanism Test
As previous research suggested, human capital input is a significant factor in economic growth in the long run [35]. Additionally, institutional factors play an important role in accounting for the fact that resource development restricts the sustainability of economic growth [38]. Natural resources restrain innovation development in developing countries [32,33]. It is supposed that resource exploitation has no significant spillover and rent-seeking effects on some sustainable contributors, such as education, innovation, etc. A further study by mechanism test is recommended to figure out this question. Thus, the research question is examined further from three perspectives: rent-seeking, human capital input, and innovation performance in the local.
As the centralized production and profit model of natural resources is more likely to breed rent-seeking activities [40], and the Chinese government plays a significant role in economic development, rent-seeking is considered when discussing the contribution of resource development to economic growth. Rent-seeking (rent) represents the quality of the local institutional system. This study uses rent-seeking indicators to evaluate the quality of regional institutions and the effect of policy implementation, which accordingly observe the impact of natural resource development on rent-seeking. This relationship can be measured by the composite control method, in which rent-seeking is included as an explained variable and other relevant indicators as the control variables.
The numbers of official crimes are weighted and measured by the entropy weight method, including approval of arrest, arrest, prosecution, paid compensation, and direct investigation by procuratorial organizations. The related data were collected from the China City Statistical Yearbook, Sichuan Province Statistical Yearbook, and the municipal procuratorates’ annual reports. The missing data have been supplemented by the linear interpolation method.
This research takes human capital input as an evaluation variable and others as a control variable to investigate the relationship between local human capital input and resource development.
Innovation positively enhances regional production capacity and promotes regional economic development in the long run [51,52]. Including innovation as an explained variable and others as the control variables, this study uses the composite control method to investigate the impact of resource development on innovation.
5. Results
5.1. Regression Model Results
Table 2 shows the negative relationships between human capital input and economic growth and resource exploitation in Sichuan province, which means resource exploitation cannot facilitate economic growth. However, both variables (investment and labor) positively affect economic growth in all models. Similarly, innovation is also a positive factor driving the local economy in models (1)–(3), except (4), particularly in model (3) with a coefficient of 0.456. This is because the Dazhou Puguang Gas Field received investment and preparation for production in 2006. The resource intensity measurement fails to fully reflect the immediate impact of resource intensity caused by the Puguang Gas Field Event.
This research studies the event further in the following to investigate the relationship and transmission mechanism between resource utilization and economic growth in Dazhou.
5.2. The SCM Results
Because the Puguang Gas Field in Dazhou received investment and began production in 2006, this event has impacted the local economy. First of all, this study employs a counterfactual framework to investigate further the impact of resource development on economic growth. Secondly, the composite control method tests the event’s impact on economic growth. Economic growth is viewed as an evaluation variable and actual per capita output as an index to measure economic growth.
According to Abadie and Gardeazabal [53], and following the benchmark estimation results above, this study selects a series of forecast variables that affect economic growth, including innovation, investment, human capital input, and labor [29,56]. A natural logarithm was used to deal with the indexes to eliminate the possible heteroscedasticity.
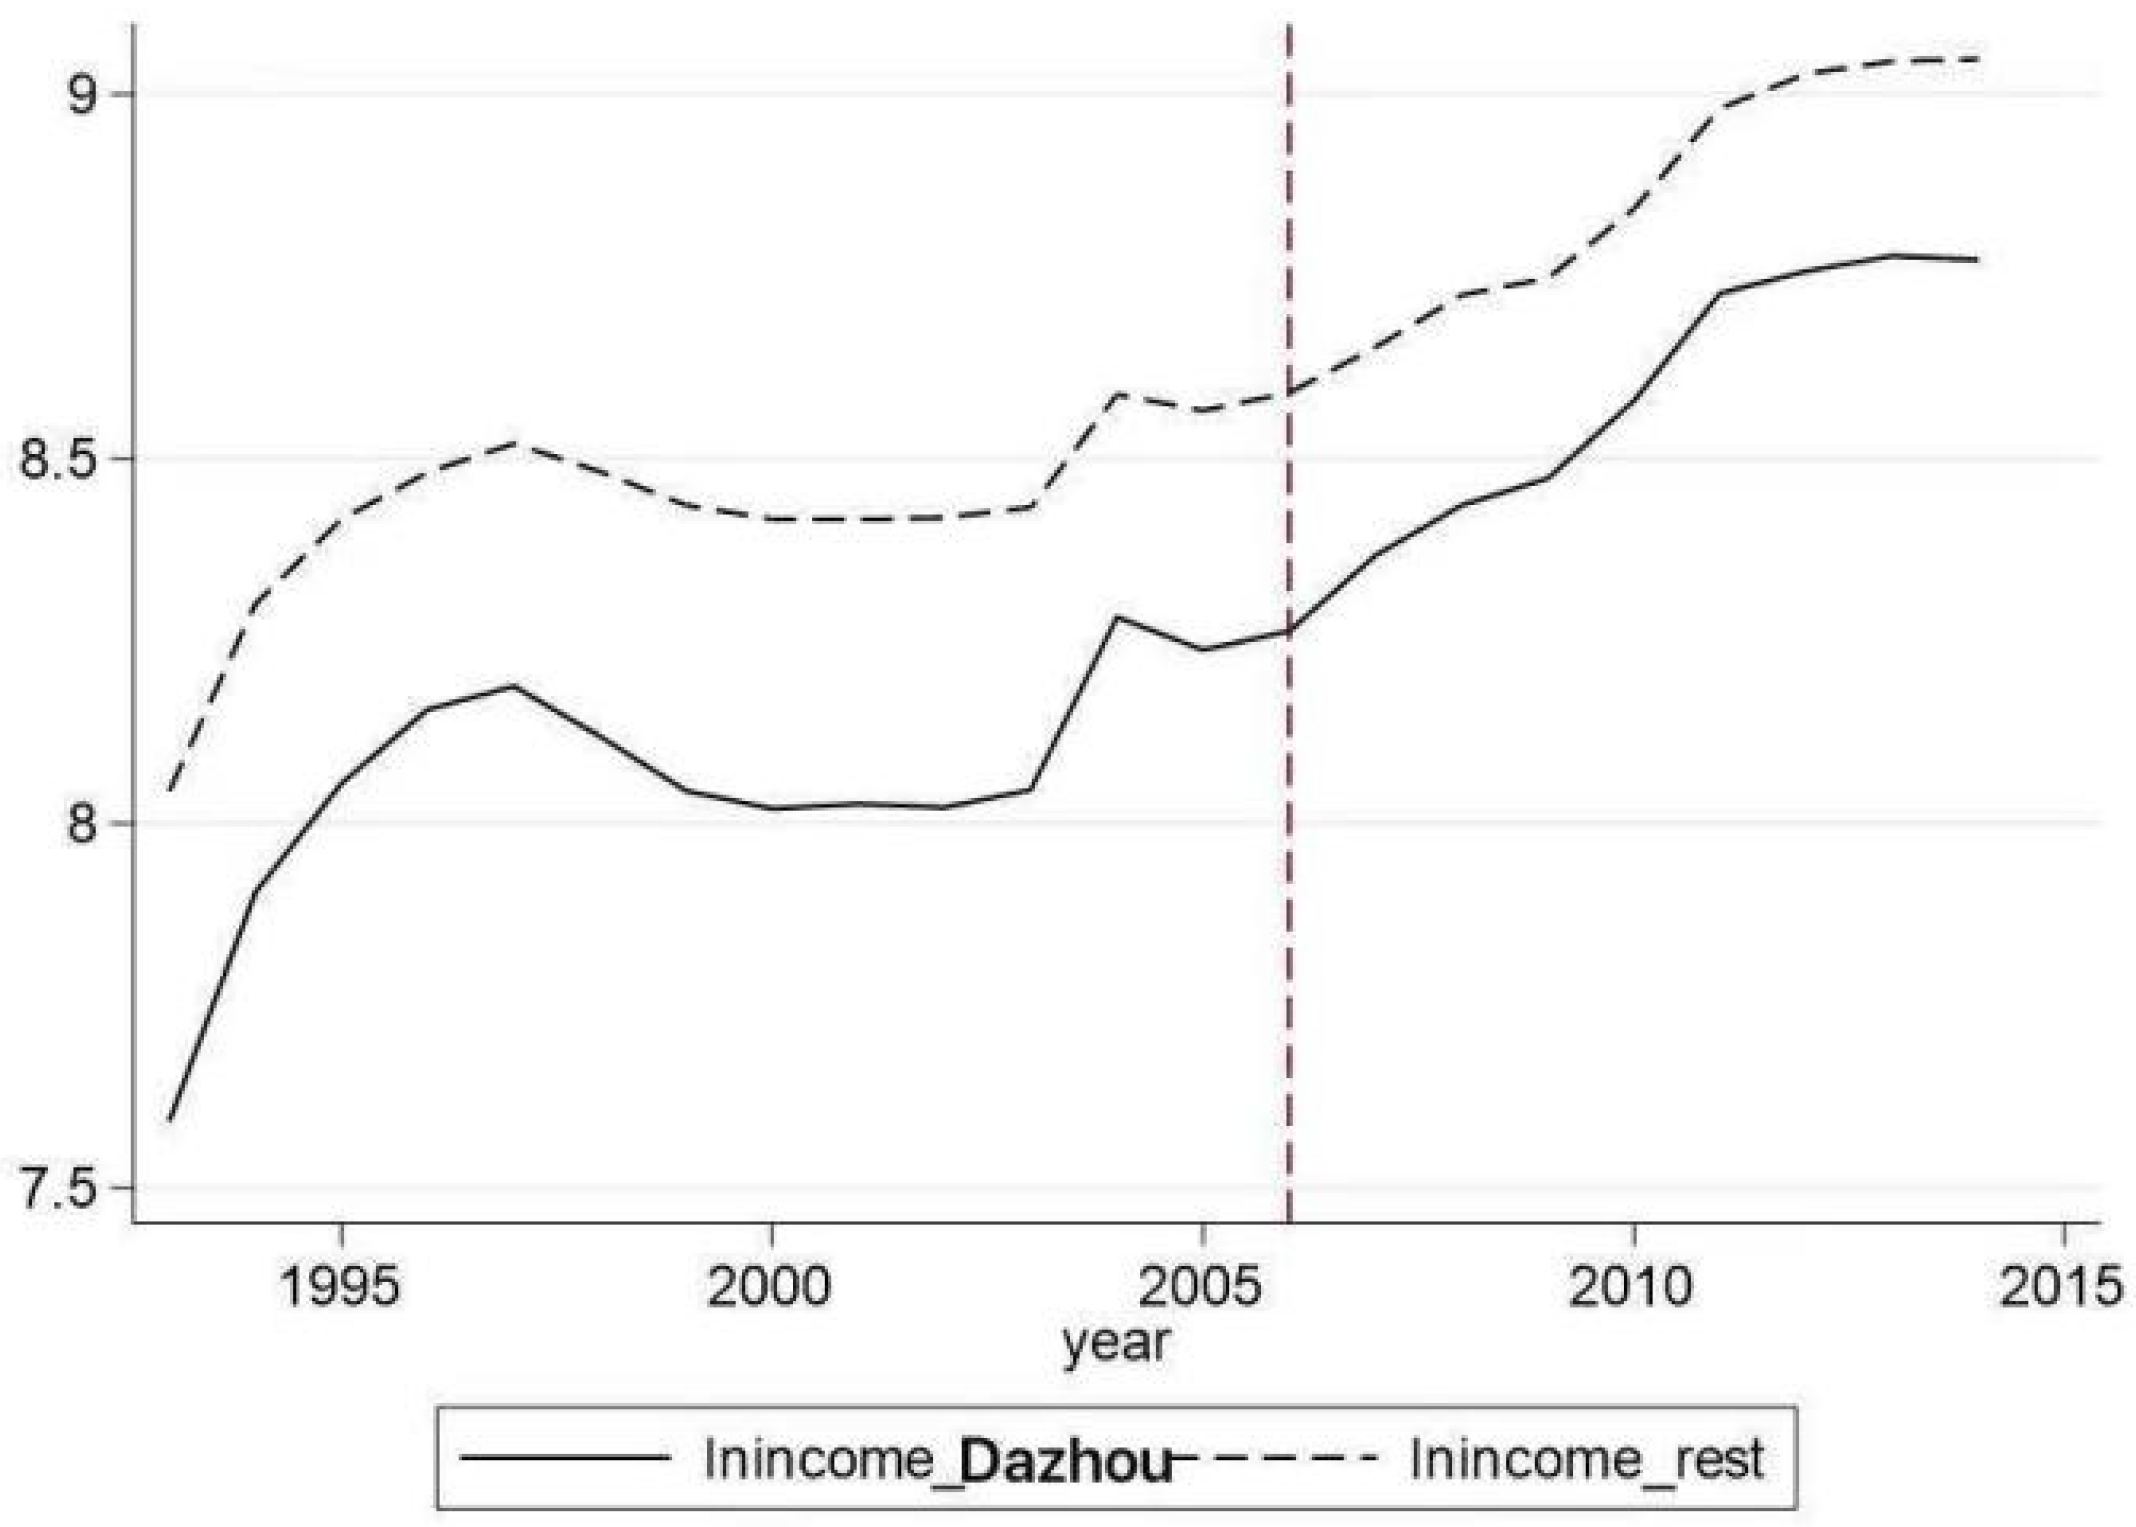
Figure 3 compares the average economic growth of Dazhou with that of the other 13 prefecture-level cities (hereinafter referred to as the remaining cities) in Sichuan. The development of the logarithm of per capita real output in Dazhou and the logarithm of per capita real output in the remaining cities before the composite control group is formed. The solid line represents the growth trend of per capita real output in Dazhou, and the dotted line represents the growth trend of average per capita real output in the remaining cities. Both showed a significant growth trend from 1993 to 2015, but there was a big gap between them, saying the average economic growth of the remaining cities was much higher than that of Dazhou during the period. Additionally, this gap shrunk after 2006 when the local natural gas was discovered in the city (the vertical dotted line is the time node of natural gas developed and utilized).
Because the standard counterfactual methods, DID and PSM, need to find a control group with the same trend as the experimental group before the event, this matching method is not robust because of various endogenous problems. Consequently, the composite control method gives the remaining cities corresponding weights to synthesize a more accurate control group and form an excellent counterfactual framework. Dazhou is used as the treatment group and the remaining cities as the control group.
Table 3 compares the real and composite values of the four prediction variables from 1993 to 2005 before the gas event. The difference between the natural and the mixed values was slight during the period. The contrast of other variables was less than 0.4, except lninnova. The synthetic city path could fit the real Dazhou and act as a suitable counterfactual contrast before the event.
The original control group is given corresponding weights by the synthetic control method. Then the synthetic cities are constructed to reference the real Dazhou. Table 4 shows the corresponding weights assigned to seven cities in Sichuan (Panzhihua, Deyang, Guangyuan, Suining, Nanchong, Guang’an, and Bazhong). Most of the seven cities used to synthesize “synthetic cities” are adjacent to Dazhou, which further verifies the rationality of studying the impact of this event with the SCM. By comparing Figure 1, we can see that Guangyuan and Bazhong are close to Dazhou in terms of geographical location, which may be the reason for their high weight. Surprisingly, Sichuan, as a robust provincial capital in the traditional sense, Chengdu, as the provincial capital, has not been able to gain weight. In contrast, the “remote” Panzhihua, as a conventional steel industry city, has received a certain weight.
Based on the weights, the control group is synthesized. The fitting trend of the real Dazhou and the synthetic cities is presented in Figure 4. It shows the logarithmic growth trend of per capita real output in Dazhou compared with that obtained by the SCM. The solid line represents the growing trend of the real output per capita in Dazhou. In contrast, the dotted line represents the increasing real output per capita trend in the synthetic cities. The vertical dotted line represents the time node of the city’s natural gas well development and utilization. Before the natural gas event, the two paths almost wholly overlapped, and the synthetic cities almost copied the real growth path of Dazhou. After 2006, the gap between the real city and the synthetic cities gradually widened, and the growth path of the synthetic cities was slightly lower than that of the real city.
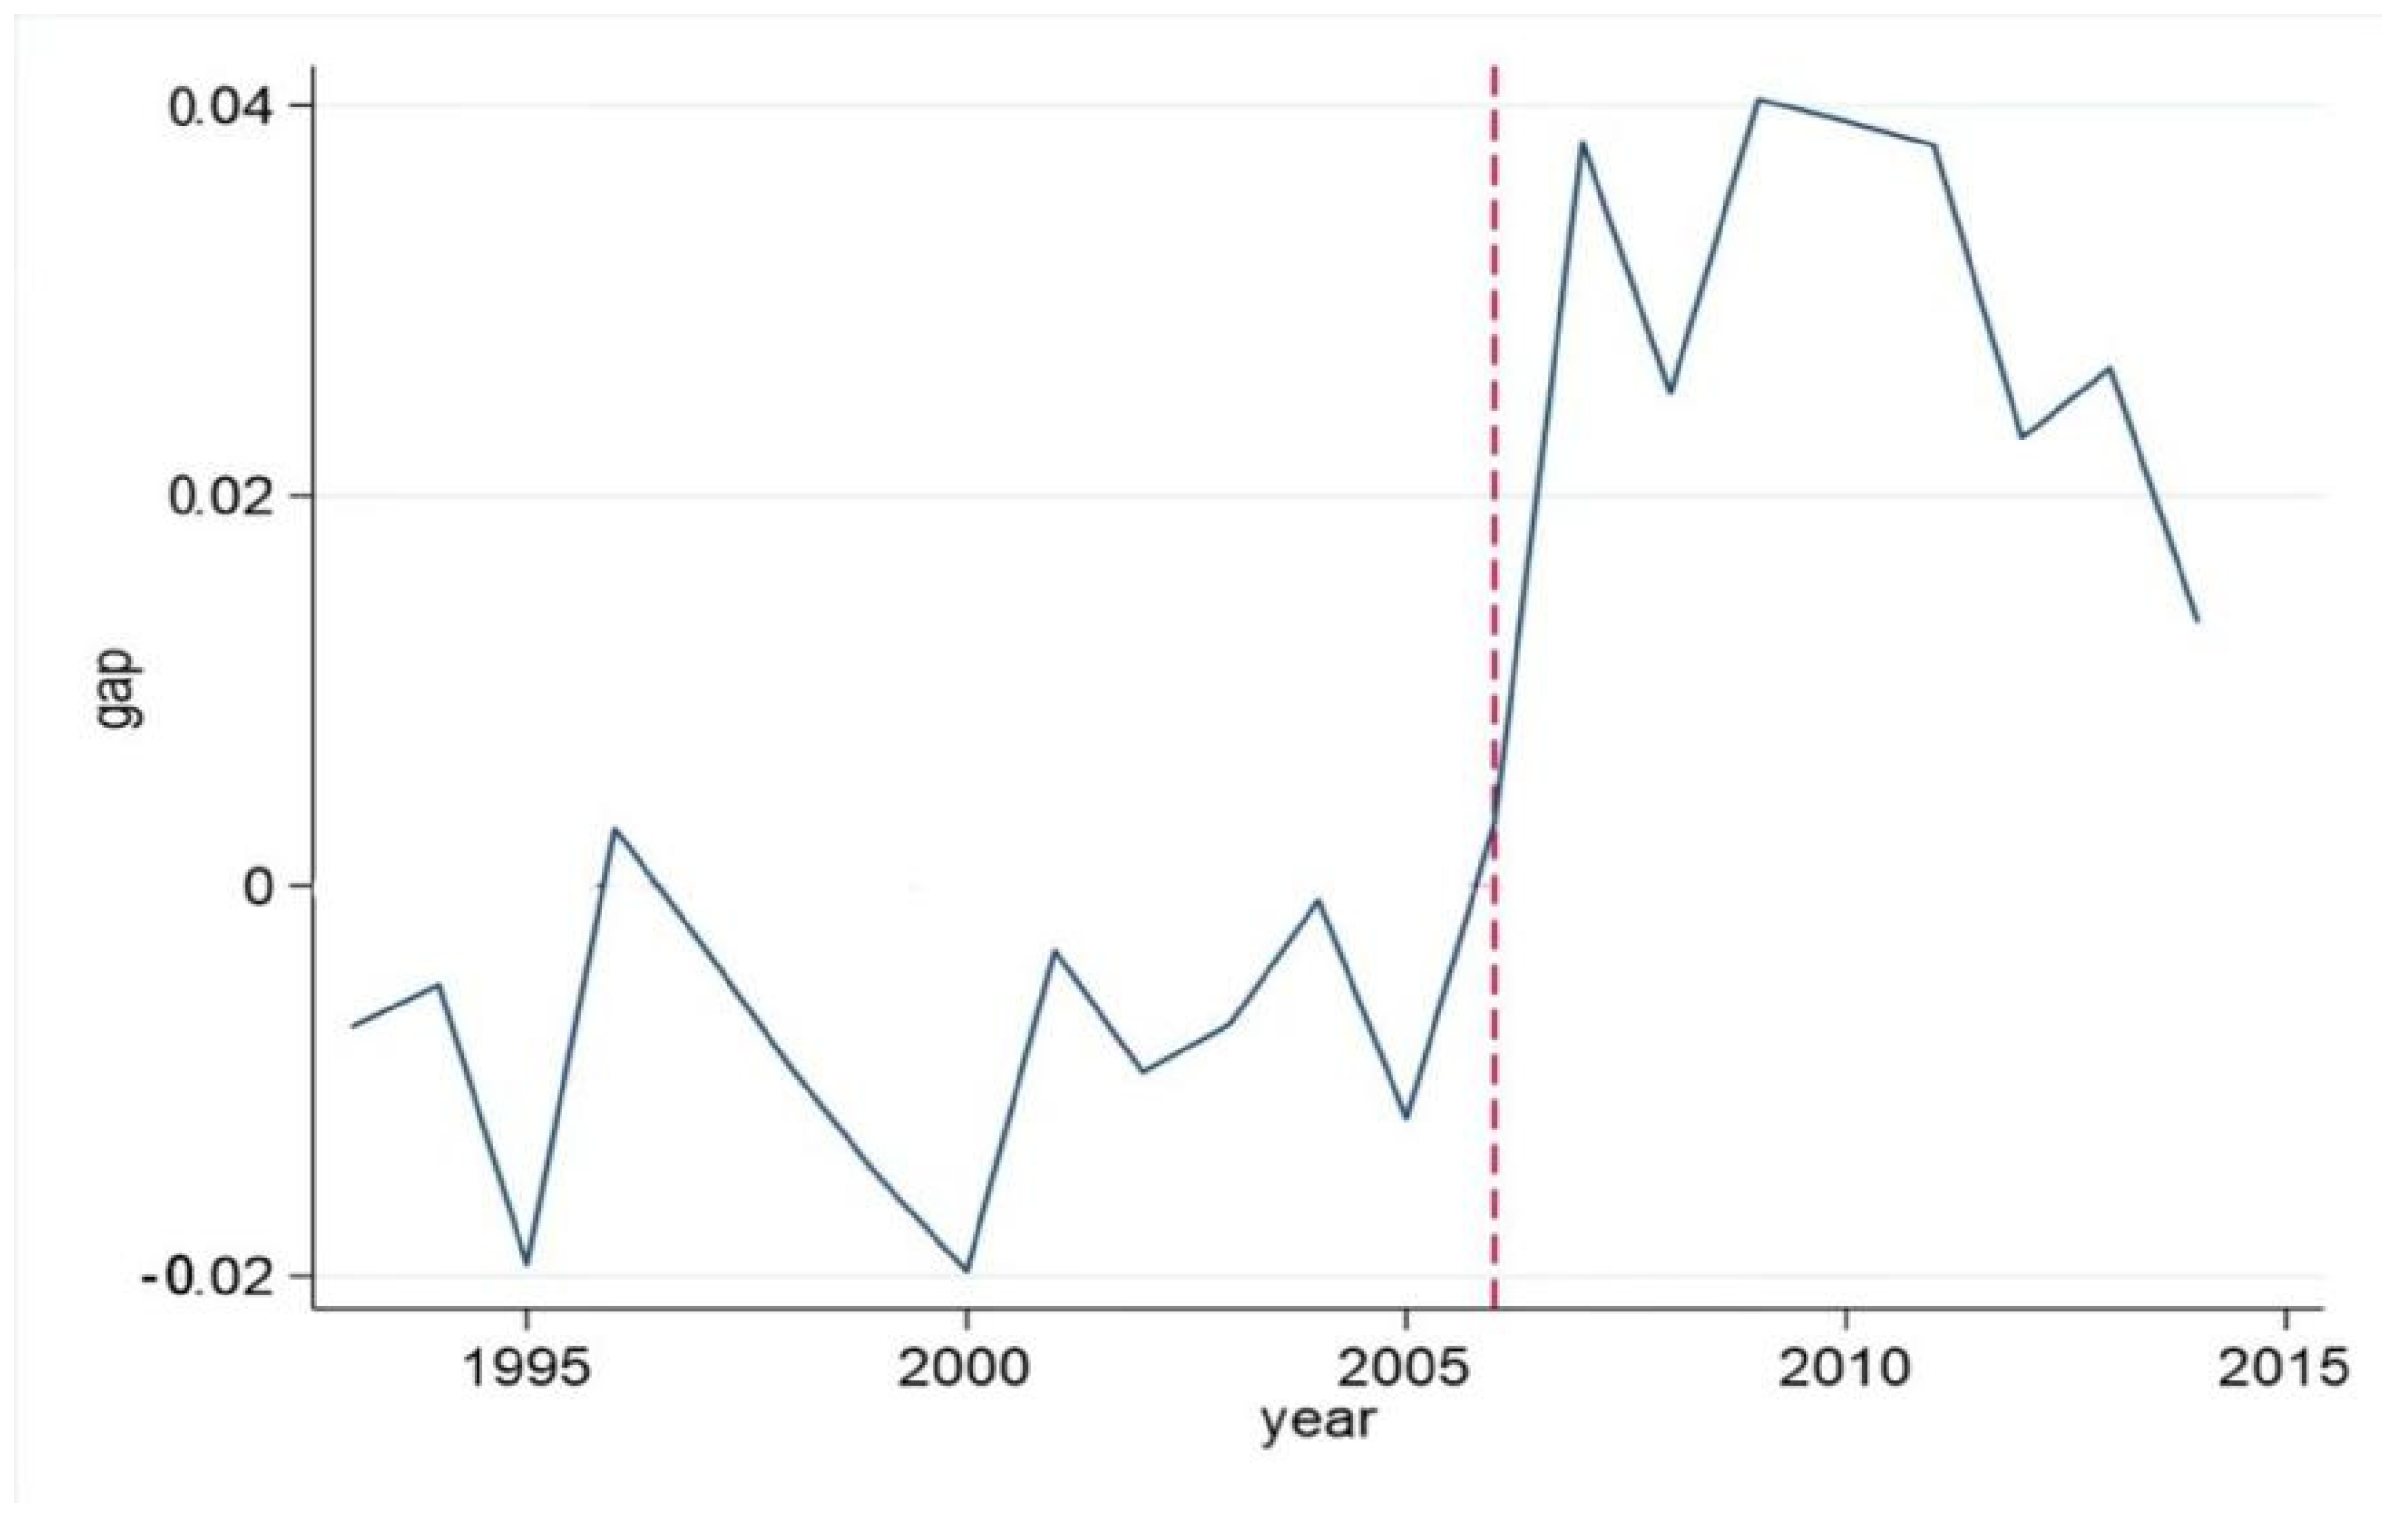
Having a close look at the gap, Figure 5 more intuitively displays the gap in per capita real output between Dazhou and the synthetic cities from 1993 to 2014. From 1993 to 2006, the interval ranged from −0.02 to 0.01, mainly fluctuating between 0 and −0.02. After the gas project in 2006, the fluctuation became significantly severe from 0 to 0.04. Before the natural gas development, the economic growth path of Dazhou was slightly lower than that of the synthetic cities. On the contrary, this phenomenon reversed after 2006 (denoted by the vertical dotted line), and the gap enlarged significantly. Dazhou went beyond the synthetic cities in terms of per capita output growth, but the robust growth remained in the very short run. After 2009 peaked at around 0.04, the gap line went down and potentially continued, indicating natural gas exploitation’s limited contribution to economic development.
Therefore, the natural gas exploitation in Dazhou positively affects the local economic growth in the short run, but it is not sustainable.
5.3. Robustness Test
This study uses a Placebo Test to examine further the effectiveness of natural resource development on local economic growth. Following Abadie et al. [57], the non-parametric estimation results were obtained using the composite control method, a preferred approach for statistical inference with a small sample size, similar to this research. As Abadie et al. [58] suggested, it is feasible to take other control units in the synthetic control group that do not perform in an experimental group and carry out the Placebo Test one by one to identify the differences between the real values of all experimental groups and the synthetic control group and compare all of the placebo results.
According to Abadie’s method [58], when conducting the placebo test, if the distribution of the mean prediction standard deviation of Dazhou is significantly different from that of the remaining cities, it means that the resource discovery in Dazhou is significant. The standard deviation of the average forecast of a region before 2006 (the square root of the square of the gap between the logarithm of per capita real output and the logarithm of predicted per capita real output) is relatively large, which means that the model has a poor degree of fitting for the region. The role of using the gap after 2006 for comparison is relatively weak. The root-mean-square prediction error of Dazhou before 2006 is 0.0069769. The areas with a root-mean-square prediction error of more than two times Dazhou have been removed from the control group.
According to the prediction error of Dazhou, represented by the thick solid line in Figure 6, the average standard deviation is more than that of Dazhou. Figure 6A shows that the regions where the average standard deviation is more than five times that of Dazhou because the root-mean-square prediction error of Dazhou before 2006 is smaller than that of other regions. After 2006 (denoted by the vertical dotted line), the absolute value of the gap is not as apparent as that of other regions. Still, the fitting condition of many regions before 2006 is poor, so these regions cannot participate in comparing the impact of events. Furthermore, Figure 6B shows the regions where the average forecast standard deviation, which is more than twice that of Dazhou because the regions where the average forecast standard deviation is more than that of Dazhou. In terms of fitting degrees, there is a significant gap between Dazhou and others, whether before 2006 or after. The robustness test suggests that the economic growth driven by the natural gas event is essential because of the positive impact of resource endowment on the Dazhou economy. Therefore, the event test analysis results are relatively stable, and the discovery of natural gas resources substantially contributes to the local economic growth of Dazhou.
5.4. Results of Mechanism Test
Figure 7 compares rent-seeking growth between real Dazhou and the synthetic cities before and after 2006. The local rent-seeking phenomenon existed and became more prominent from 1995 to 2010. The gap between them gradually became larger starting in 2006 and shrunk in around 2010. The rent-seeking level increased quickly and was much more significant in Dazhou than in the synthetic cities after 2006. These results showed that the natural gas program drove the local economy and stimulated local rent-seeking; this result is partially associated with the growth trend after 2006 in Figure 4 because the natural gas project promoted the local economy, and the growing economy bred rent-seeking. To sum up, the natural gas event significantly impacted rent-seeking, possibly due to the Chinese unique institutional system in terms of the policy environment, legal regulation, and local policy implementation.
Figure 8 compares the growth of human capital input between the real Dazhou and the synthetic cities. Both had a noticeable growth trend, which was very flat, although it increased slightly after 2006. This means that the natural gas project had a minimal impact on the local human capital development. Meanwhile, the real Dazhou performed better than the synthetic cities because the solid line (Dazhou) went beyond the dotted line (the synthetic cities) since 2000. The gap between them was almost unchanged. Therefore, the contribution of regional natural resource development to human capital input is statistically insignificant because of the flat performance of human capital.
According to the comparison of innovation investment growth between real Dazhou and the synthetic cities in Figure 9, before 2006, the fitting degree of real Dazhou and the synthetic cities was high, and the gap was small. Still, the interval after 2006 was significantly larger than that before 2006. Furthermore, real Dazhou has performed better than synthetic cities since 2007. Therefore, there is a remarkable relationship between the development of natural gas resources and the local innovation capability in Dazhou. Understandably, the local technology was upgraded by natural gas projects with some new technologies, which facilitated the development of other local industries and drove economic growth.
Therefore, the gas project called for new technologies and pushed the local technologies forward, which could eventually promote local economic development. All in all, these results demonstrate that regional resource development breeds rent-seeking and has no spillover effect on economic sustainability.
6. Discussion
This study investigates the contribution of natural gas exploitation to the local economic performance of Sichuan province and Dazhou city, which shows a negative relationship between resource exploitation and economic growth in Sichuan province. This may be because resources restrained the development of innovations, education, foreign investment, and long-term economic factors. Future research is expected to prove this hypothesis. This finding aligns with Sachs and Warner [32,33], based on national economic data from developing counties. Our research is regarded as a further study of theirs and presents more focused data on a province.
On the contrary, Dazhou, a prefecture-level city where the natural gas project is located, finds that the gas project positively affects local economic growth in the short run, but it is not sustainable. This finding is consistent with previous findings. As Deng et al. [37] suggested, the local economy may benefit from the outputs of the local natural resources in the short run. Isham et al. [41] indicate that the export of resources worsens the foreign trade conditions of a nation. Similarly, the local economy would also become worse in the long run.
The two distinct findings should be explained by Xu et al. [49], which suggest that the regional economic disparity in northeast China is due to the restricted location with different environmental regulations and economic policies rather than resource endowment, which means the inhibitory effect of resource development on economic growth is complicated. Further research is expected to confirm it.
Furthermore, this research finds that the natural gas event had a significant impact on rent-seeking, possibly due to the Chinese unique institutional system in terms of the policy environment, legal regulation, and the local policy implementation, which result in the institutionally rooted rent-seeking [59]. As Murshed [40] argued, the centralized production and profit model of natural resources are more likely to breed rent-seeking activities. Thus, the negative result from regression estimation could be explained by institutional rent-seeking.
The flat performance of human capital indicates that local resource exploitation does not impact human capital input. This could be attributed to the expansion of the resource-dominated industries in resource-rich areas may potentially squeeze out human capital, resulting in opportunism behaviors and rent-seeking activities. Humphreys et al. [5] support this discussion, but differently, some research finds resource export may facilitate national human capital cultivation [20].
Moreover, this research evidences that the local gas exploitation improves regional innovation, partly because more advanced technologies were brought into the region for the gas exploitation. Other studies suggest that natural resources restrain innovation development in developing countries [32,33].
Therefore, natural resources, including gas, coal, minerals, etc., are very scarce, and over-exploration will ruin the ecosystem’s stability. Although the local economy may benefit from the local natural resources in the short run, it is not a sustainable development because some environmental disasters such as tornados and flooding are incurred when the resources are over-explored, and the ecosystem is destroyed. As such, the institutional policies should encourage technology innovation to improve the efficiency of resource development and usage and maintain the ecosystem in balance. Additionally, improving the pricing mechanism of resource-based products should be an alternative approach to balance the relationship between economic development and resource exploration, and the prices should fully reflect the scarcity of resources. Particularly, these institutional policies include implementing fiscal and tax policies, building some fair and competitive resource markets, restricting resource export, etc.
Last but not least, the government should play a key role in cultivating human capital accumulation and encourage investments in technological innovations, which are sustainable momentum to drive national and global economic growth. Currently, human capital is decoupled from the resource development in China, particularly in areas with rich natural resources. Accordingly, under-developed human capital inhibits technology innovation and industrial upgrading.
7. Conclusions
This study investigates whether natural gas exploitation is a blessing or a curse for provincial and prefecture economic growth. Based on hybrid panel and time-series data from 1993 to 2015 from 14 prefecture cities in Sichuan province in China, this study employs regression models and synthetic control methods to investigate the long-term and short-term relationships. By constructing a counterfactual framework, this study studies the impact of resource discovery on economic growth in a specific policy and economic environment and deduces the relevant mechanisms, which provides a fresh perspective for the empirical study of the relationship between resource discovery and economic growth, and also provides ideas for guiding resources to benefit economic growth and overcome the curse in a specific social environment. The main conclusions are as follows.
Firstly, based on the local data of Sichuan, the results from the parametric estimations indicate that both variables of resource exploitation and human capital accumulation are negatively associated with the regional economic development of Sichuan in the long run (see Table 2). In contrast, both factors of investment and labor are positively related to long-term economic growth in Sichuan province.
Differently, based on the data of the prefecture-level city of Dazhou in Sichuan, parametric estimations show that gas exploitation contributes to the local economic growth of Dazhou city in the short run (see Figure 4 and Figure 5).
Finally, the findings from the mechanism test suggest that natural resource development has no noticeable impact on local human capital accumulation. Still, this project introduces some advanced technologies into the region and drives local innovation in the short run and rent-seeking. Meanwhile, this gas project breeds more rent-seeking in the short run (see Figure 7, Figure 8 and Figure 9).
Author Contributions
Conceptualization, C.P. and D.F.; methodology, C.P. and D.F.; software, H.L.; validation, C.P. and D.F.; formal analysis, C.P. and H.L.; investigation, C.P.; resources, D.F.; data curation, C.P.; Writing—Original draft preparation, C.P.; Writing—Review and editing, H.L.; visualization, H.L.; supervision, C.P.; project administration, H.L. All authors have read and agreed to the published version of the manuscript.
Funding
This research was funded by the Consulting Research Project of the Chinese Academy of Engineering (No. 2020-DFZD-01). The Open Fund of Sichuan Province Cyclic Economy Research Center (No. XHJJ-2001).
Institutional Review Board Statement
Not applicable.
Informed Consent Statement
Not applicable.
Data Availability Statement
The data may be available with the corresponding author upon request.
Conflicts of Interest
The authors declare no conflict of interest.
References
- Habakkuk, H.J. American and British Technology in the Nineteenth Century; Cambridge University Press: Cambridge, UK, 1962. [Google Scholar]
- Wright, G. The origins of American industrial success 1789–1940. Am. Econ. Rev. 1990, 80, 651–668. [Google Scholar]
- De Long, B.J.; Williamson, J.G. Natural Resources and Convergence in the Nineteenth and Twentieth Centuries; Harvard University: Cambridge, MA, USA, 1994. [Google Scholar]
- Bardini, C. Without coal in the age of steam: A factor-endowment explanation of the Italian industrial lag before World War I. J. Econ. Hist. 1997, 57, 633–653. [Google Scholar] [CrossRef]
- Humphreys, M.; Sachs, J.F.; Stiglitz, J.E. Escaping the Resource Curse; Columbia University Press: New York, NY, USA, 2007. [Google Scholar]
- Boschini, A.D.; Pettersson, J.; Roine, J. Resource curse or not: A question of appropriability. Scand. J. Econ. 2007, 109, 593–617. [Google Scholar] [CrossRef]
- Gelb, A.H. Associates, Windfall Gains: Blessing or Curse? Oxford University Press: New York, NY, USA, 1988. [Google Scholar]
- Auty, R.M. Resource-Based Industrialization: Sowing the Oil in Eight Developing Countries; Oxford University Press: New York, NY, USA, 1990. [Google Scholar]
- Cohen, P.J.; Lawless, S.; Dyer, M.; Morgan, M.; Saeni, E.; Teioli, H.; Kantor, P. Understanding adaptive capacity and capacity to innovate in social-ecological systems: Applying a gender lens. Ambio 2016, 45, 309–321. [Google Scholar] [CrossRef] [PubMed]
- Konte, M. A curse or a blessing? Natural resources in a multiple growth regimes analysis. Appl. Econ. 2013, 45, 3760–3769. [Google Scholar] [CrossRef]
- Chang, C.P.; Hao, Y. Environmental performance, corruption and economic growth: Global evidence using a new data set. Appl. Econ. 2017, 49, 498–514. [Google Scholar] [CrossRef]
- Measham, T.G.; Walton, A.; Graham, P.; Fleming-Muñoz, D.A. Living with resource booms and busts: Employment scenarios and resilience to unconventional gas cyclical effffects in Australia. Ener. Res. Soc. Sci. 2019, 56, 101221. [Google Scholar] [CrossRef]
- Liu, Y. Energy production and regional economic growth in China: A more comprehensive analysis using a panel model. Energies 2013, 6, 1409–1420. [Google Scholar] [CrossRef]
- Stevens, P.; Dietsche, E. Resource curse: An analysis of causes, experiences and possible ways forward. Energy Policy 2008, 36, 56–65. [Google Scholar] [CrossRef]
- Fischer, A.P. Pathways of adaptation to external stressors in coastal natural-resource-dependent communities: Implications for climate change. World Dev. 2018, 108, 235–248. [Google Scholar] [CrossRef]
- Arezki, R.; Sy, A.; Gylfason, T. Beyond the curse: Policies to harness the power of natural resources. Afri. Growth Agenda 2015, 10, 12–14. [Google Scholar]
- Satti, S.L.; Farooq, A.; Loganathan, N.; Shahbaz, M. Empirical evidence on the resource curse hypothesis in oil abundant economy. Econ. Model. 2014, 42, 421–429. [Google Scholar] [CrossRef]
- Papyrakis, E. A development curse: Formal vs informal activities in resource-dependent economies. Int. J. Soc. Econ. 2014, 41, 244–264. [Google Scholar] [CrossRef]
- Karl, Y.; Chen, Z. Resource abundance and financial development: Evidence from China. Resour. Policy 2011, 36, 72–79. [Google Scholar]
- Doraisami, A. Has Malaysia really escaped the resources curse? A closer look at the political economy of oil revenue management and expenditures. Resour. Policy 2015, 45, 98–108. [Google Scholar] [CrossRef]
- Havranek, T.; Horvath, R.; Zeynalov, A. Natural Resources and Economic Growth: A Meta-Analysis. World Dev. 2016, 88, 134–151. [Google Scholar] [CrossRef]
- Fleming, D.A.; Measham, T.G.; Paredes, D. Understanding the resource curse (or blessing) across national and regional scales: Theory, empirical challenges and an application. Aust. J. Agri. Resour. Econ. 2015, 59, 624–639. [Google Scholar] [CrossRef]
- Matsuyama, K. Agricultural productivity, comparative advantage, and economic growth. J. Econ. Theory 1992, 58, 317–334. [Google Scholar] [CrossRef]
- Auty, R.M. Sustaining Development in Mineral Economies: The Resource Curse Thesis; Routledge: London, UK, 1993. [Google Scholar]
- Sachs, J.D.; Warner, A.M. Natural Resource Abundance and Economic Growth (December 1995); NBER Working Paper No. W5398; Oxford University Press: Oxford, UK, 2000. [Google Scholar]
- Sachs, J.D.; Warner, A.M. Natural resources and economic development: The curse of natural resources. Eur. Econ. Rev. 2001, 45, 827–838. [Google Scholar] [CrossRef]
- Corden, W.M. Booming sector and Dutch disease economics: Survey and consolidation. Oxf. Econ. Pap. 1984, 36, 359–380. [Google Scholar] [CrossRef]
- Kim, M.J.; Park, S.Y.; Sang, Y.J. An empirical test for Okun’s law using a smooth time-varying parameter approach: Evidence from East Asian countries. Appl. Econ. Lett. 2015, 22, 788–795. [Google Scholar] [CrossRef]
- Blanco, L.; Grier, R. Natural resource dependence and the accumulation of physical and human capital in Latin America. Resour. Policy 2012, 37, 281–295. [Google Scholar] [CrossRef]
- Angrist, J.D.; Kugler, A.D. Rural windfall or a new Resource curse? Coca, income, and civil conflict in Colombia. Rev. Econ. Stat. 2008, 90, 191–215. [Google Scholar] [CrossRef]
- de Medeiros Costa, H.K.; dos Santos, E.M. Institutional analysis and the “resource curse” in developing countries. Energy Policy 2013, 63, 788–795. [Google Scholar] [CrossRef]
- Saches, J.D.; Warner, A.M. Fundamental sources of long-run growth. Am. Econ. Rev. 1997, 87, 184–188. [Google Scholar]
- Saches, J.D.; Warner, A.M. The big push, natural resource booms and growth. J. Dev. Econ. 1999, 59, 43–76. [Google Scholar] [CrossRef]
- Xu, Y.; Hu, Y. The relationship between economic development mode and natural resource advantages in Inner Mongolia: An empirical analysis based on the resource curse hypothesis. Resour. Sci. 2010, 32, 2391–2399. [Google Scholar]
- Boyce, J.R.; Emery, J.H. Is a negative correlation between resource abundance and growth sufficient evidence that there is a “resource curse”? Resour. Policy 2010, 36, 1–13. [Google Scholar] [CrossRef]
- Kjetil, B. Resource curse and ower balance: Evidence from oil-rich countries. World Dev. 2012, 40, 1308–1316. [Google Scholar]
- Deng, T.; Ma, M.; Cao, J. Tourism resource development and long-term economic growth: A resource curse hypothesis approach. Tour. Econ. 2014, 20, 923–938. [Google Scholar] [CrossRef]
- Mehlum, H.; Moene, K.; Torvik, R. Institutions and the resource curse. Econ. J. 2006, 116, 1–20. [Google Scholar] [CrossRef]
- Robinson, J.; Torvik, R.; Verdier, T. Political foundations of the resource curse: A simplification and a comment. J. Dev. Econ. 2014, 106, 194–198. [Google Scholar] [CrossRef]
- Murshed, S.M. When Does Natural Resource Abundance Lead to a Resource Curse? Working Discussion Papers. Available online: https://ageconsearch.umn.edu/record/24137 (accessed on 12 January 2022).
- Isham, J.; Woolcock, M.; Pritchett, L.; Busby, G. The varieties of resource experience: Natural resource export structures and the political economy of economic growth. World Bank Econ. Rev. 2005, 19, 141–174. [Google Scholar] [CrossRef]
- Asea, P.K.; Lahiri, A. The precious bane. J. Econ. Dynam. Contr. 1999, 23, 823–849. [Google Scholar] [CrossRef]
- Gylfason, T. Natural resources, education and economic development. Eur. Econ. Rev. 2001, 45, 847–859. [Google Scholar] [CrossRef]
- Papyrakis, E.; Gerlagh, R. Resource abundance and economic growth in the United States. Eur. Econ. Rev. 2007, 51, 1011–1039. [Google Scholar] [CrossRef]
- Krueger, A.O. The political economy of the rent-seeking society. Am. Econ. Rev. 1974, 64, 291–303. [Google Scholar]
- Torvik, R. Natural resources, rent seeking and welfare. J. Dev. Econ. 2002, 67, 455–470. [Google Scholar] [CrossRef]
- Sun, D.; Si, M. On resource abundance and China’s regional economic growth: A query on resource curse hypothesis. J. Zhongnan Univ. Econ. Law 2012, 1, 84–89. [Google Scholar]
- Cao, S.; Hu, D.; Zhao, W.; Mo, Y.; Chen, S. Monitoring spatial patterns and changes of ecology, production, and living land in Chinese urban agglomerations: 35 years after reform and opening up, where, how and why? Sustainability 2017, 9, 766. [Google Scholar] [CrossRef]
- Xu, X.L.; Xu, X.F.; Chen, Q.; Che, Y. The research on generalized regional “resource curse” in China’s new normal stage. Resour. Policy 2016, 49, 12–19. [Google Scholar] [CrossRef]
- Guo, J.; Zheng, X.; Song, F. The resource curse and its transmission channels: An empirical investigation of Chinese cities’ panel data. Emerg. Mark. Financ. Trade 2016, 52, 1325–1334. [Google Scholar]
- Tang, C.; Irfan, M.; Razzaq, A.; Dagar, V. Natural resources and financial development: Role of business regulations in testing the resource-curse hypothesis in ASEAN countries. Resour. Policy 2022, 76, 102612. [Google Scholar] [CrossRef]
- Yao, X.; Wang, H.; Shao, S.; Li, X.; Guo, Z. “Booster” or “obstacle”: Can coal capacity cut policies moderate the resource curse effect? Evidence from Shanxi (China). Resour. Policy 2022, 75, 102437. [Google Scholar] [CrossRef]
- Abadie, A.; Gardeazabal, J. The economic costs of conflict: A case study of the basque country. Am. Econ. Rev. 2003, 93, 113–132. [Google Scholar] [CrossRef]
- Yang, J.G.; Zhou, L.L.; Zou, H.F. Evaluation of the economic growth effect of the establishment of special economic zones in China—Analysis Based on the synthetic control method. Econ. Perspect. 2017, 1, 41–51. [Google Scholar]
- Yan, S.; Li, Z.; Zhang, M. The long-run indirect effects of natural disasters on economic growth:analysis of synthetic control method based on county level data of Wenchuan Earthquake stricken areas. China Popul. Resour. Environ. 2019, 29, 117–126. [Google Scholar]
- Fan, R.; Fang, Y.; Park, S.Y. Resource abundance and economic growth in China. China Econ. Rev. 2012, 23, 704–719. [Google Scholar] [CrossRef]
- Abadie, A.; Diamond, A.; Hainmueller, J. Synthetic control methods for comparative case studies: Estimating the effect of California’s tobacco control program. J. Am. Stat. Assoc. 2010, 105, 493–505. [Google Scholar] [CrossRef]
- Abadie, A.; Diamond, A.; Hainmueller, J. Comparative politics and the synthetic control method. Am. J. Polit. Sci. 2014, 59, 495–510. [Google Scholar] [CrossRef]
- Su, C.; Littlefield, J.E. Entering Guangxi: A business ethical dilemma in mainland China? J. Bus Ethics 2001, 33, 199–210. [Google Scholar]
Figure 1.
Geographic location map of the sample City.

Figure 2.
Mind-map of research methodology.

Figure 3.
Comparison of average economic growth between Dazhou and other cities.

Figure 4.
Economic growth comparison between real Dazhou and the synthetic cities.

Figure 5.
The logarithmic real GDP per capita gap between real and synthetic cities.

Figure 6.
(A,B) Distribution of five times of prediction errors in Dazhou and other regions.

Figure 7.
Comparison of rent-seeking between real Dazhou and the synthetic cities before and after 2006.
Figure 7.
Comparison of rent-seeking between real Dazhou and the synthetic cities before and after 2006.

Figure 8.
Comparison of human capital between real Dazhou and the synthetic cities before and after 2006.
Figure 8.
Comparison of human capital between real Dazhou and the synthetic cities before and after 2006.

Figure 9.
Comparison of innovation capacity between real Dazhou and the synthetic cities before and after 2006.
Figure 9.
Comparison of innovation capacity between real Dazhou and the synthetic cities before and after 2006.


Table 1.
Descriptive statistics of each variable index.
| Variable | Samples | Definition | Measurements | Literature | Mean Value | Stand. Deviation | Mini. Value | Max. Value |
|---|---|---|---|---|---|---|---|---|
| income | 308 | Economic Development | GDP/Resident No. | [51,52] | 6193.7 | 3743.7 | 1480.0 | 18,685.0 |
| innova | 308 | Innovation Measurement | Government expenditure on scientific research | [27] | 61,838.5 | 198,909.0 | 4.5 | 1,542,515.0 |
| hcapital | 308 | Human Capital Measurement | Entropy value of educational cost to student number | [13,18] | 139,143 | 127,568 | 50,223 | 933,757 |
| labor | 308 | Number of employees in the secondary industry | Per capita school age | [44] | 53.73 | 47.81 | 9.24 | 313.71 |
| invest | 308 | Actual fixed assets investment | Government infrastructure investment | [46,47] | 256.33 | 552.40 | 6.14 | 4369.19 |
| resource | 308 | Number of employees in mining industry | Number of employees in mining industry | [28] | 4.438 | 4.431 | 0.105 | 22.558 |
Table 2.
Panel estimation of resource development and economic growth.
| Variables | Benchmark Estimation (1) | Fixed Effect (2) | First Order Difference Estimation (3) | GMM (4) |
|---|---|---|---|---|
| lninnova | 0.072 *** | 0.072 *** | 0.099 | −0.005 |
| (0.009) | (0.009) | (0.073) | (0.004) | |
| lnhcapital | −0.022 | −0.022 | −0.548 *** | −0.042 *** |
| (0.021) | (0.021) | (0.195) | (0.007) | |
| lnlabor | 0.110 ** | 0.110 ** | 0.0795 | 0.040 ** |
| (0.050) | (0.051) | (0.301) | (0.018) | |
| lninvest | 0.1759 *** | 0.176 *** | 0.456 ** | 0.036 *** |
| (0.018) | (0.018) | (0.161) | (0.007) | |
| lnresource | - | −0.002 | −0.278 | −0.009 * |
| (0.006) | (0.180) | (0.005) | ||
| Prob > F | 0.000 | 0.000 | 0.000 | 0.000 |
| R2 | 0.207 | 0.205 | 0.349 | 0.349 |
*, **, *** is significant at 1%, 5%, 10% level, respectively.
Table 3.
Comparison of predictive variables.
| Treated | Synthetic | |
|---|---|---|
| lnhcapital | 10.95235 | 11.08178 |
| lninvest | 3.505339 | 3.271839 |
| lnlabor | 3.783438 | 3.418702 |
| lninnova | 7.982632 | 7.093164 |
Table 4.
Weight of original control group.
| Panzhihua | Deyang | Guangyuan | Suining | Nanchong | Guang’an | Bazhong | |
|---|---|---|---|---|---|---|---|
| Weight | 0.051 | 0.037 | 0.063 | 0.189 | 0.116 | 0.313 | 0.232 |
Publisher’s Note: MDPI stays neutral with regard to jurisdictional claims in published maps and institutional affiliations. |
© 2022 by the authors. Licensee MDPI, Basel, Switzerland. This article is an open access article distributed under the terms and conditions of the Creative Commons Attribution (CC BY) license (https://creativecommons.org/licenses/by/4.0/).
Share and Cite
MDPI and ACS Style
Peng, C.; Feng, D.; Long, H. Assessing the Contribution of Natural Gas Exploitation to the Local Economic Growth in China. Energies 2022, 15, 5853. https://0-doi-org.brum.beds.ac.uk/10.3390/en15165853
AMA Style
Peng C, Feng D, Long H. Assessing the Contribution of Natural Gas Exploitation to the Local Economic Growth in China. Energies. 2022; 15(16):5853. https://0-doi-org.brum.beds.ac.uk/10.3390/en15165853
Chicago/Turabian StylePeng, Cheng, Dianzhuang Feng, and Hai Long. 2022. "Assessing the Contribution of Natural Gas Exploitation to the Local Economic Growth in China" Energies 15, no. 16: 5853. https://0-doi-org.brum.beds.ac.uk/10.3390/en15165853
Note that from the first issue of 2016, this journal uses article numbers instead of page numbers. See further details here.