Article

Sensitivity Analysis of Influencing Factors of Gas Pipelines with Corrosion Defects under the Action of Landslides

1
School of Petroleum Engineering, Yangtze University, Wuhan 430100, China
2
Key Laboratory of Drilling and Production Engineering for Oil and Gas, Wuhan 430100, China
3
Gudao Oil Production Plant, Shengli Oilfield Company of Sinopec, Dongying 257231, China
4
Shengli Oilfield Petroleum Development Center Co., Ltd., Dongying 257100, China
5
CNOOC Safety & Technology Services Co., Ltd., Beijing 100070, China
*
Author to whom correspondence should be addressed.
Submission received: 8 August 2022 / Revised: 28 August 2022 / Accepted: 2 September 2022 / Published: 11 September 2022
(This article belongs to the Special Issue Shale Oil and Gas Accumulation Mechanism)

Abstract

:
Sensitivity analysis aids in determining important factors affecting pipeline safety. Sensitivity analysis of stress inside gas pipelines with corrosion defects in a landslide region can provide a theoretical basis for the safe operation of pipelines. This study considered an X80 high-grade steel gas pipeline model with corrosion defects using finite element analysis (ABAQUS software) under lateral landslide conditions. Particularly, we studied the six major engineering elements of soil cohesion to understand the stress variations in buried gas pipelines and performed a sensitivity analysis of each influencing parameter. The calculation results revealed that all the factors influencing the stress in corroded gas pipelines during landslide conditions were positively correlated to the internal pipe stress, except for the axial position of corrosion defects. The factors in the descending order of influence on the sensitivity coefficient are stated as follows: landslide displacement, axial position of corrosion defect, soil cohesion, depth of corrosion defect, pressure, and length of corrosion defect. The results of this study will aid in the design and implementation of such pipelines in mountainous or other landslide-prone terrains.

1. Introduction

Several kinds of topography and landforms exist in China, especially in the southwestern mountainous regions and the northwestern Loess Plateau, where landslide disasters are common during the onset of monsoon [1]. The China–Myanmar oil and gas pipeline project is vital to ensure the energy security of China. Because more than 80% of the natural gas pipelines of this project are situated in the mountainous regions, landslide disasters are a frequent occurrence [2]. For instance, in 2016 and 2017, two consecutive landslides occurred near the Shazi Town, Qinglong section of the China–Myanmar natural gas pipeline, causing the pipeline to break, leak, and burn in this section, severely damaging the pipeline production safety and the lives of residents in the neighboring areas [3,4]. Because the China–Myanmar natural gas pipeline was put into operation in 2013, it has been in service for nearly 10 years. China’s existing natural gas pipeline has a service life of about 15 years and it is nearing the end of its life. Moreover, long-distance gas pipelines inevitably corrode over their prolonged service period [5,6,7]; therefore, we are entering a period of increased risk of pipeline defects. In addition, due to the natural harsh environment, extreme climatic conditions (annual average precipitation of about 5000 mm), existence of adverse factors such as changeable geographical environment, water in the soil, and influence of alkali, salt, and stray currents, the pipeline’s entire anticorrosive layer is damaged, which will lead to electrochemical reactions and stress corrosion of the pipeline body. The existence of these factors will lead to pipe perforation and pipeline failure accidents. Pipeline failures caused by corrosion further endanger the safe operation of such pipelines [8,9]. Many scholars have studied the impact of disasters on oil and gas resources [10,11,12,13]; however, the impact of landslide disasters and corrosion on pipelines must be further studied.
In terms of the mechanical response of gas pipelines under the action of landslides, Rajani et al. [14] and Orourke et al. [15] studied the mechanical response of pipelines under lateral landslides based on a simplified method and the R-O model, respectively. Additionally, Zhang et al. [16], Zhang et al. [17], and Zhao et al. [18] used finite element analysis methods to characterize the mechanical behavior of buried pipelines crossing the landslide area, considering the interaction between pipe and soil, and analyzing the landslide soil parameters, pipeline parameters, and influence of landslide scale on the mechanical behavior of buried pipelines. Katebi [19] and Liang et al. [20] conducted an in-depth numerical analysis of the mechanical response of the pipeline under various load conditions; however, they neglected the mechanical response of the pipeline at multiple intercepting components. Zang et al. [21] and Cao et al. [22] used finite element software (ABAQUS) to investigate the influence of landslide and pipeline factors on the buried pipeline in the landslide section.
Considering the analysis and research of pipelines with corrosion defects, Ahammed [23] studied the influencing factors of the failure pressure of the pipeline through finite element simulation analysis. Chen et al. [24] and Sun et al. [25] proposed an evaluation method to predict the failure pressure of X80 pipeline interaction corrosion defects based on the finite element method. Cui and Cao [26] verified the accuracy of the fitted formula to evaluate the failure pressure of medium- and high-strength corrosion pipelines. Shuai et al. [27] fitted the formula predicting the failure pressure of defective pipelines to validate the numerical formula with the test results. Zhou et al. [28] considered X80 and X100 double-etched pipelines as the research objects, established a finite element model through ABAQUS, and studied the influence of defect length, defect depth, and corrosion spacing on the failure pressure of the pipeline.
Existing research on the failure pressure of pipelines with defects primarily focus on analyzing the influence of factors, such as defect size, defect shape, and defect location, on the failure pressure of pipelines, mostly under conditions that do not consider landslides. To study the impact of landslides on pipelines, buried pipelines are fundamentally used as models to characterize the effects of landslide scale, pipeline factors, and soil properties on the stress and deformation of pipelines, excluding corrosion conditions. Currently, only a handful of scholars have investigated the failure pressure of defective pipelines under the action of landslides. Although Xu [29] studied pipelines with volume defects under the action of landslides, the studied pipelines were X60 steel with large-diameter development. Thus, the characteristics of X80 pipeline should be studied under similar conditions.
Existing research has comprehensively identified the factors affecting the pipeline stress in landslide disasters and corrosion, but sensitivity analyses have not been conducted on the factors influencing the pipeline stress. Thus, to evaluate the stress of gas pipelines with corrosion defects under landslide disasters, we performed finite element analysis using ABAQUS in this study. In addition, we performed a comparative analysis on the sensitivity of pipeline stress on various factors for risk assessment, prevention, and control of gas pipelines with defects under landslide disasters. The current research aims to provide a relevant foundation for disaster mitigation and engineering design.

2. Mechanical Analysis of Pipeline in Lateral Landslide

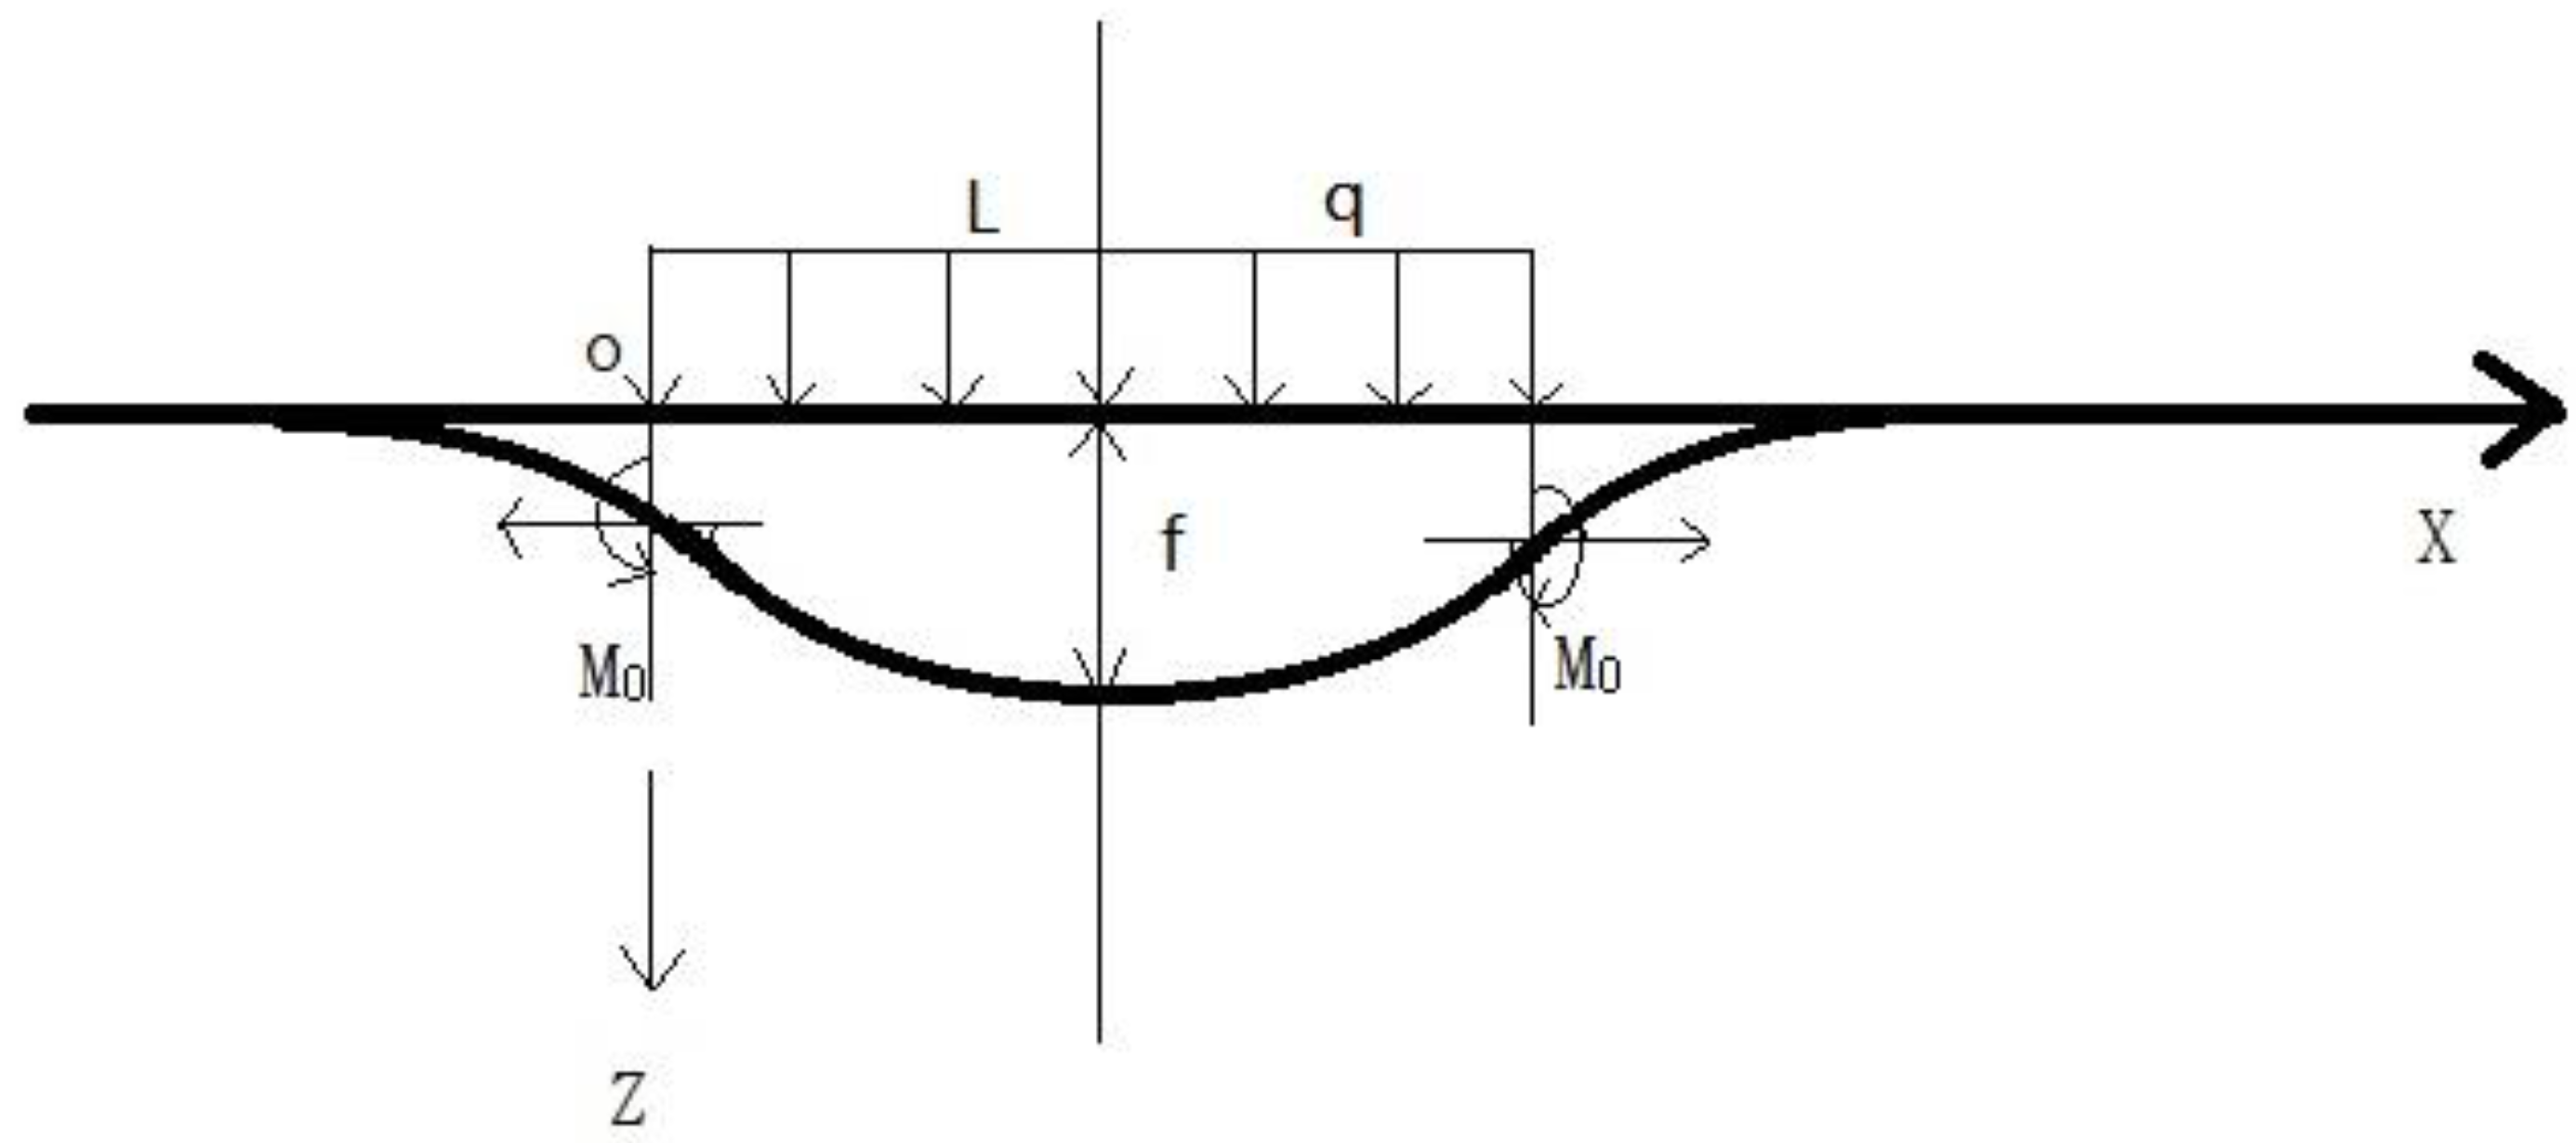
2.1. Mechanical Models and Basic Assumptions

For the convenience of calculation, it is necessary to simplify the mechanical model of the pipeline and assume the following:
  • The pipe is continuously and evenly distributed along the axis;
  • The landslide thrust force on the pipeline is evenly distributed along the buried pipeline;
  • The pipe in the landslide as a beam bending problem.
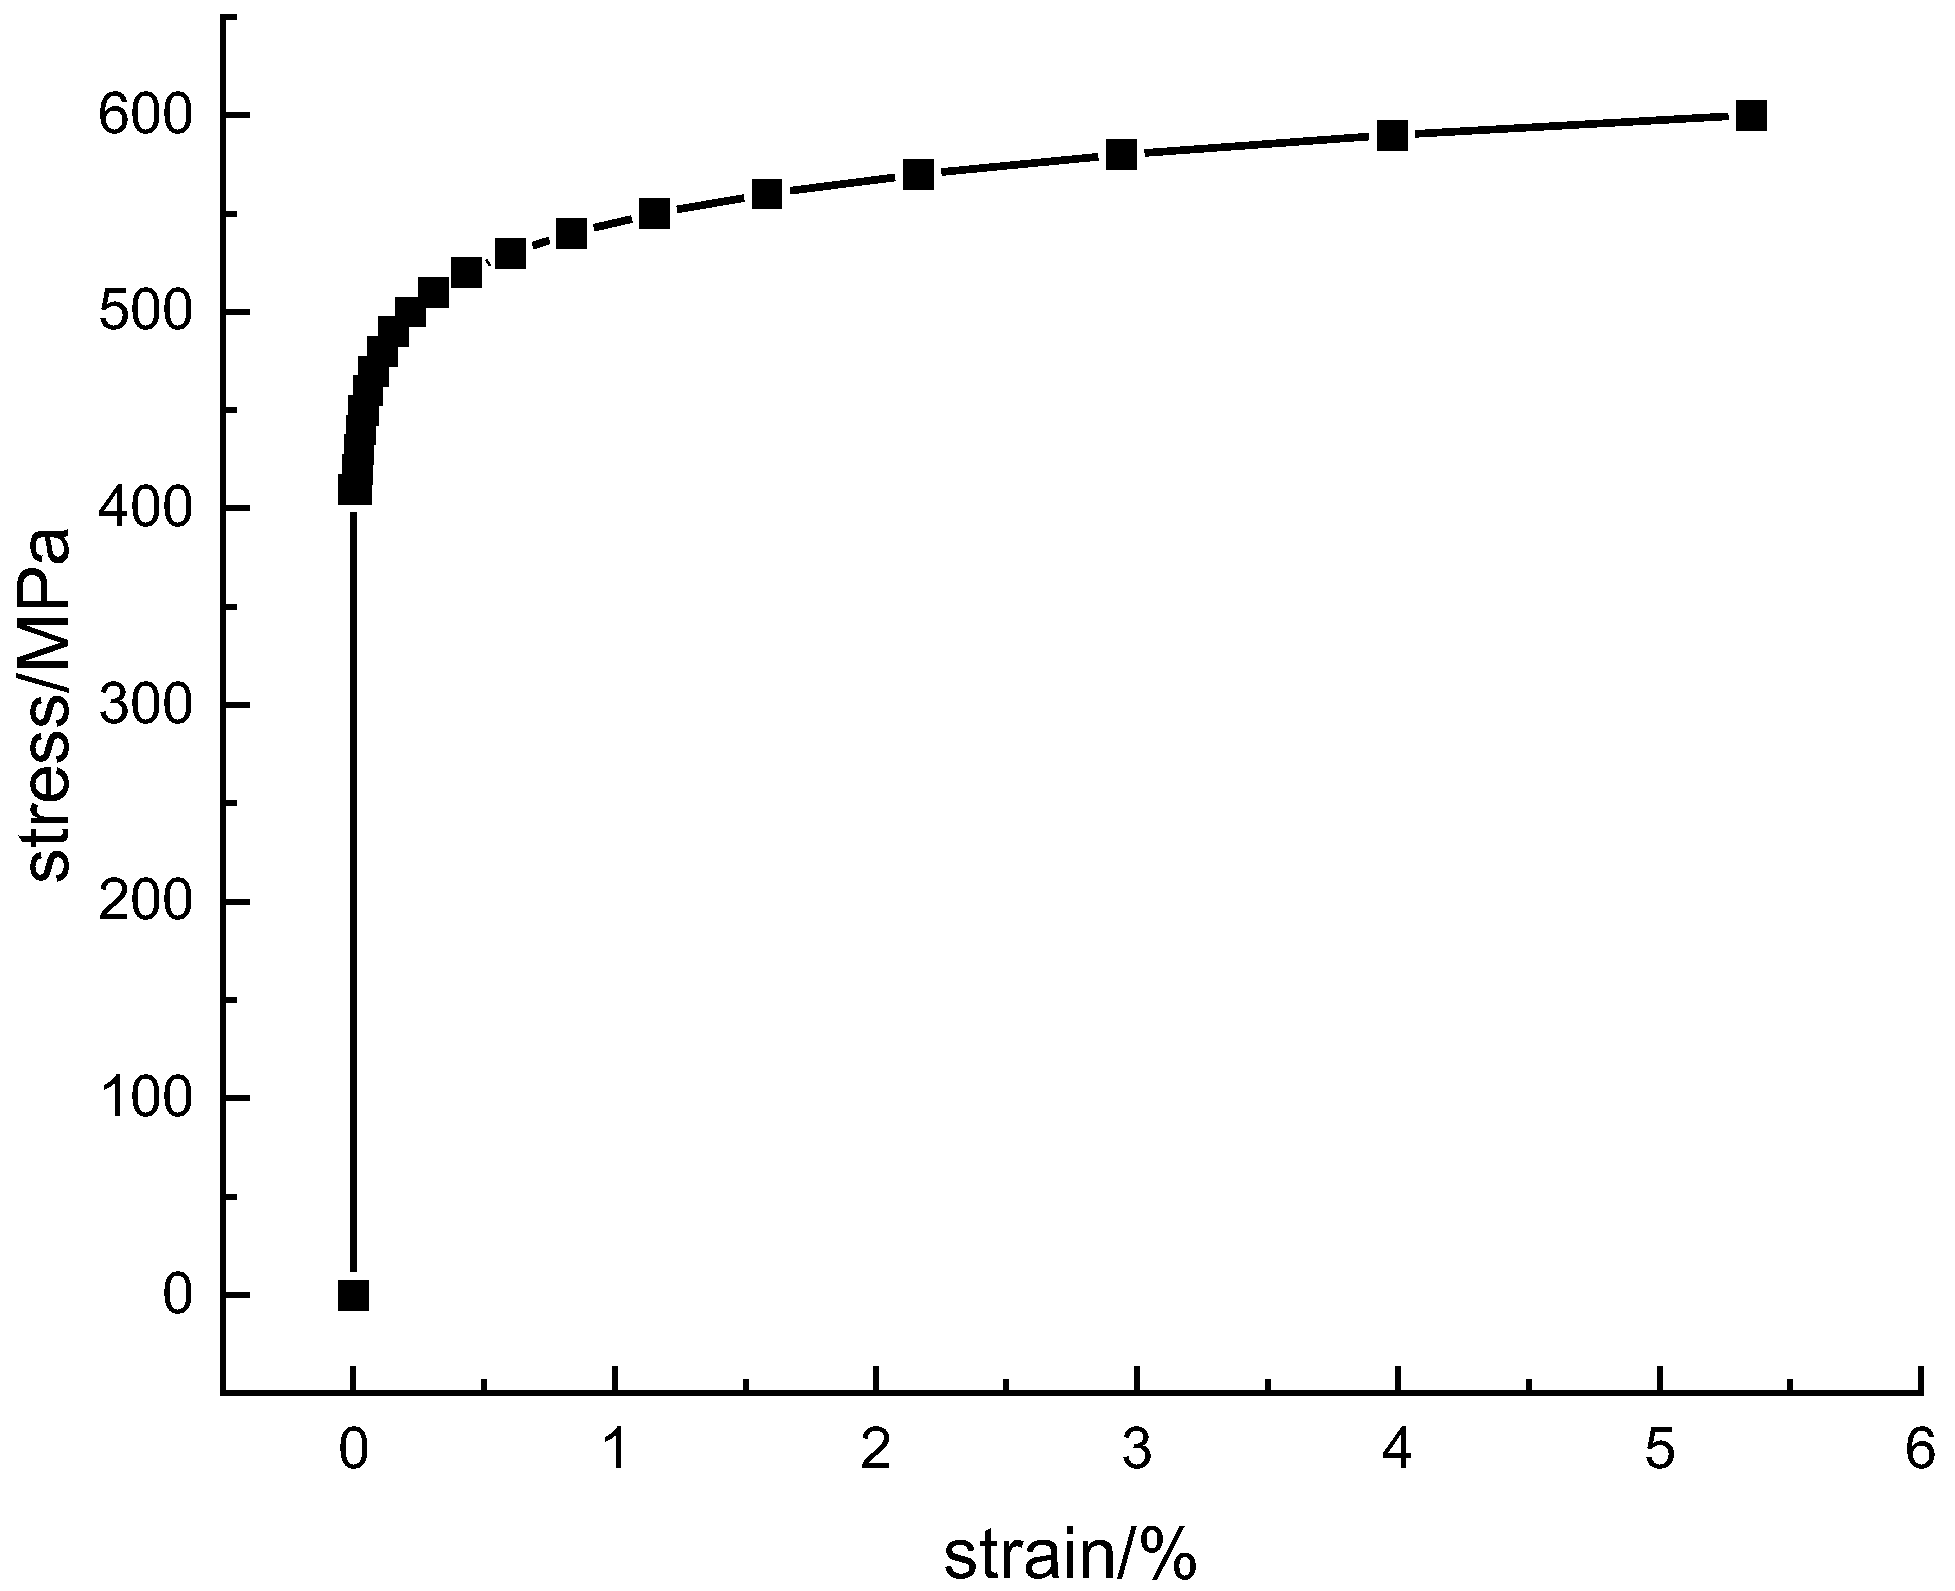
  • The pipeline stress-strain curve is still the true stress-strain curve.
The simplified mechanical model is shown in Figure 1.

2.2. Solution of Transverse Landslide Pipeline Mechanics

The differential equation of pipe bending is as follows:
E I d 2 y d x 2 = P y w + M 0 q l x 2 + q x 2 2
where
  • E : Modulus of elasticity, Pa;
  • I : Moment of inertia, m4;
  • P : Longitudinal force of pipeline section, N;
  • y : Pipeline deflection, m;
  • w : Deflection at the section, m;
  • M 0 : Bending moment on section, N · m ;
  • l : Pipeline span length, m;
  • q : Lateral pressure under soil collapse, Pa;
  • x: Length ratio of pipe;
Bending moment at the end of pipe:
M 0 = q l 2 P α 2 q l k 0 D q k p t h k l 2 4 α 3 k 0 D + k p t h k l 2
where
  • k: Soil resistance coefficient, MPa/m2;
  • M0: Bending moment at end of pipe, KN·m;
The bending moment at the midpoint of the pipe is as follows:
M c = M 0 + q k 2 c h k l 2 q k 2
where
Mc: Bending moment at midpoint of pipe; KN·m;
Deflection at midpoint of pipe:
f = q l 2 8 P 1 P M 0 + q k 2 c h k l 2 1 c h k l 2 + w 0
Deflection of pipe end point:
w 0 = α q l + 2 α M 0 / k 0 D
α = k 0 D 4 E I
where
  • k 0 : Resistance coefficient, N / m 3 ;
  • D : Pipe diameter, m.

3. Establishment of Gas Pipeline Model with Corrosion Defects under the Action of Landslide

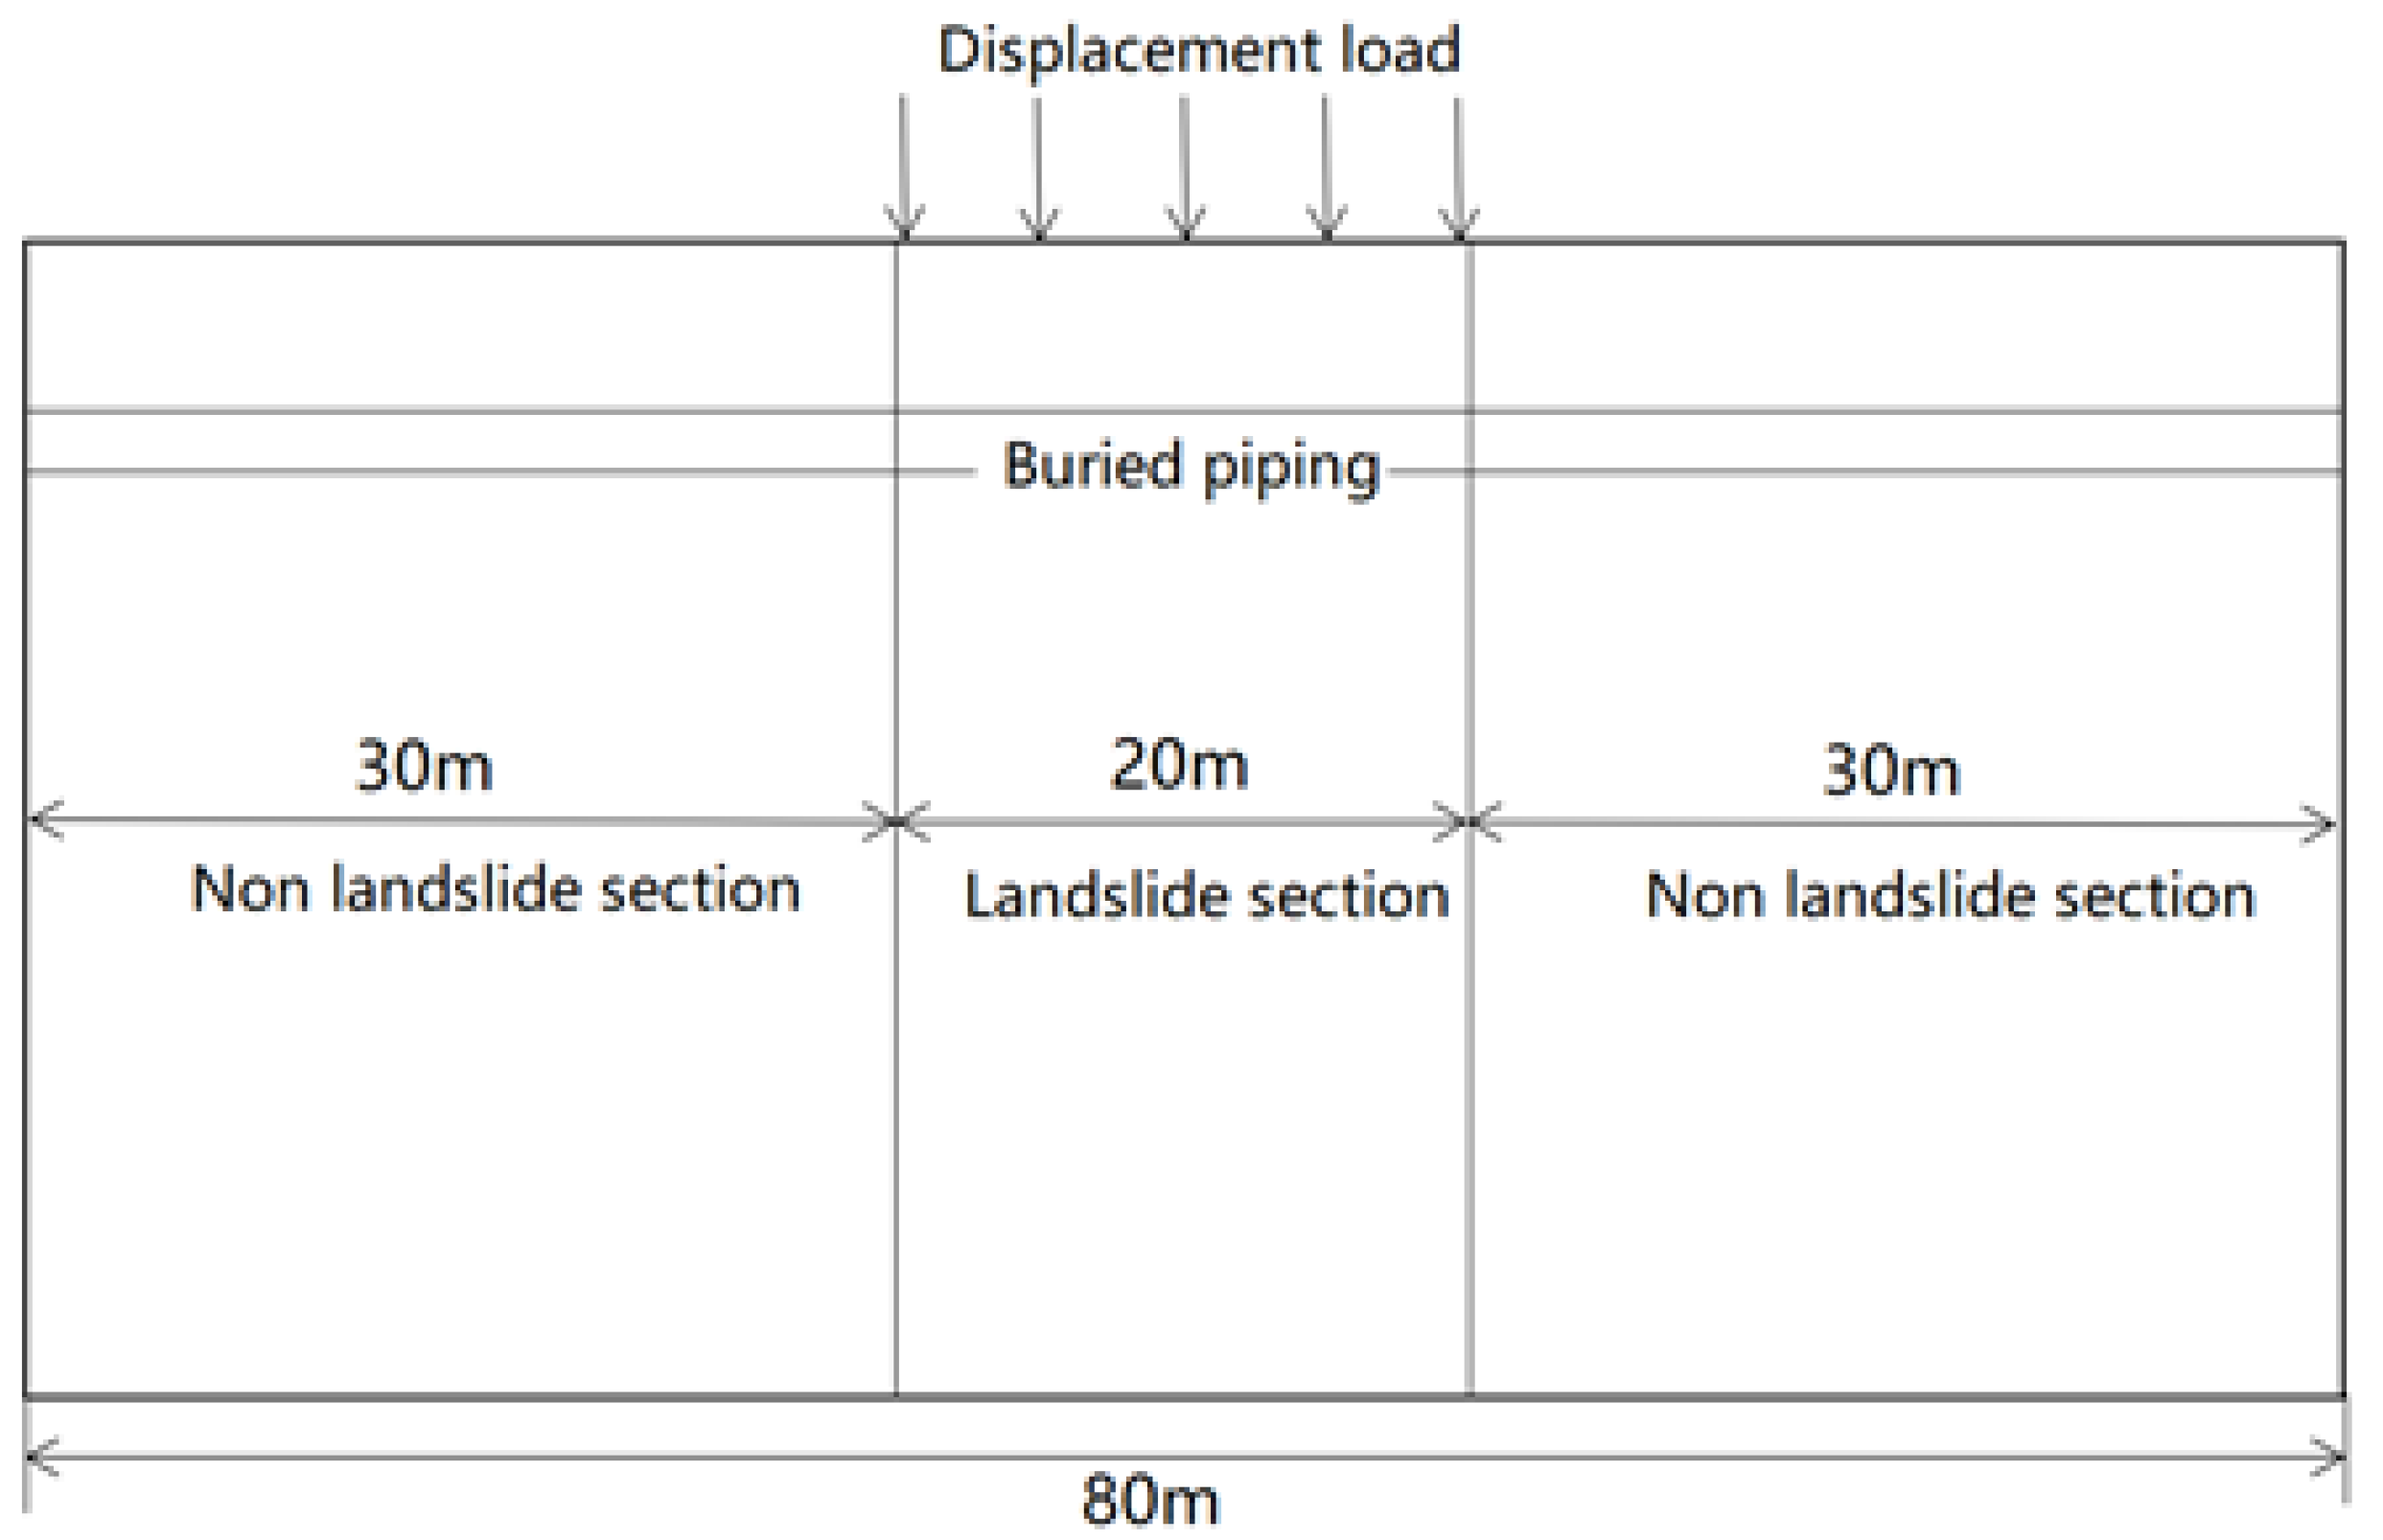
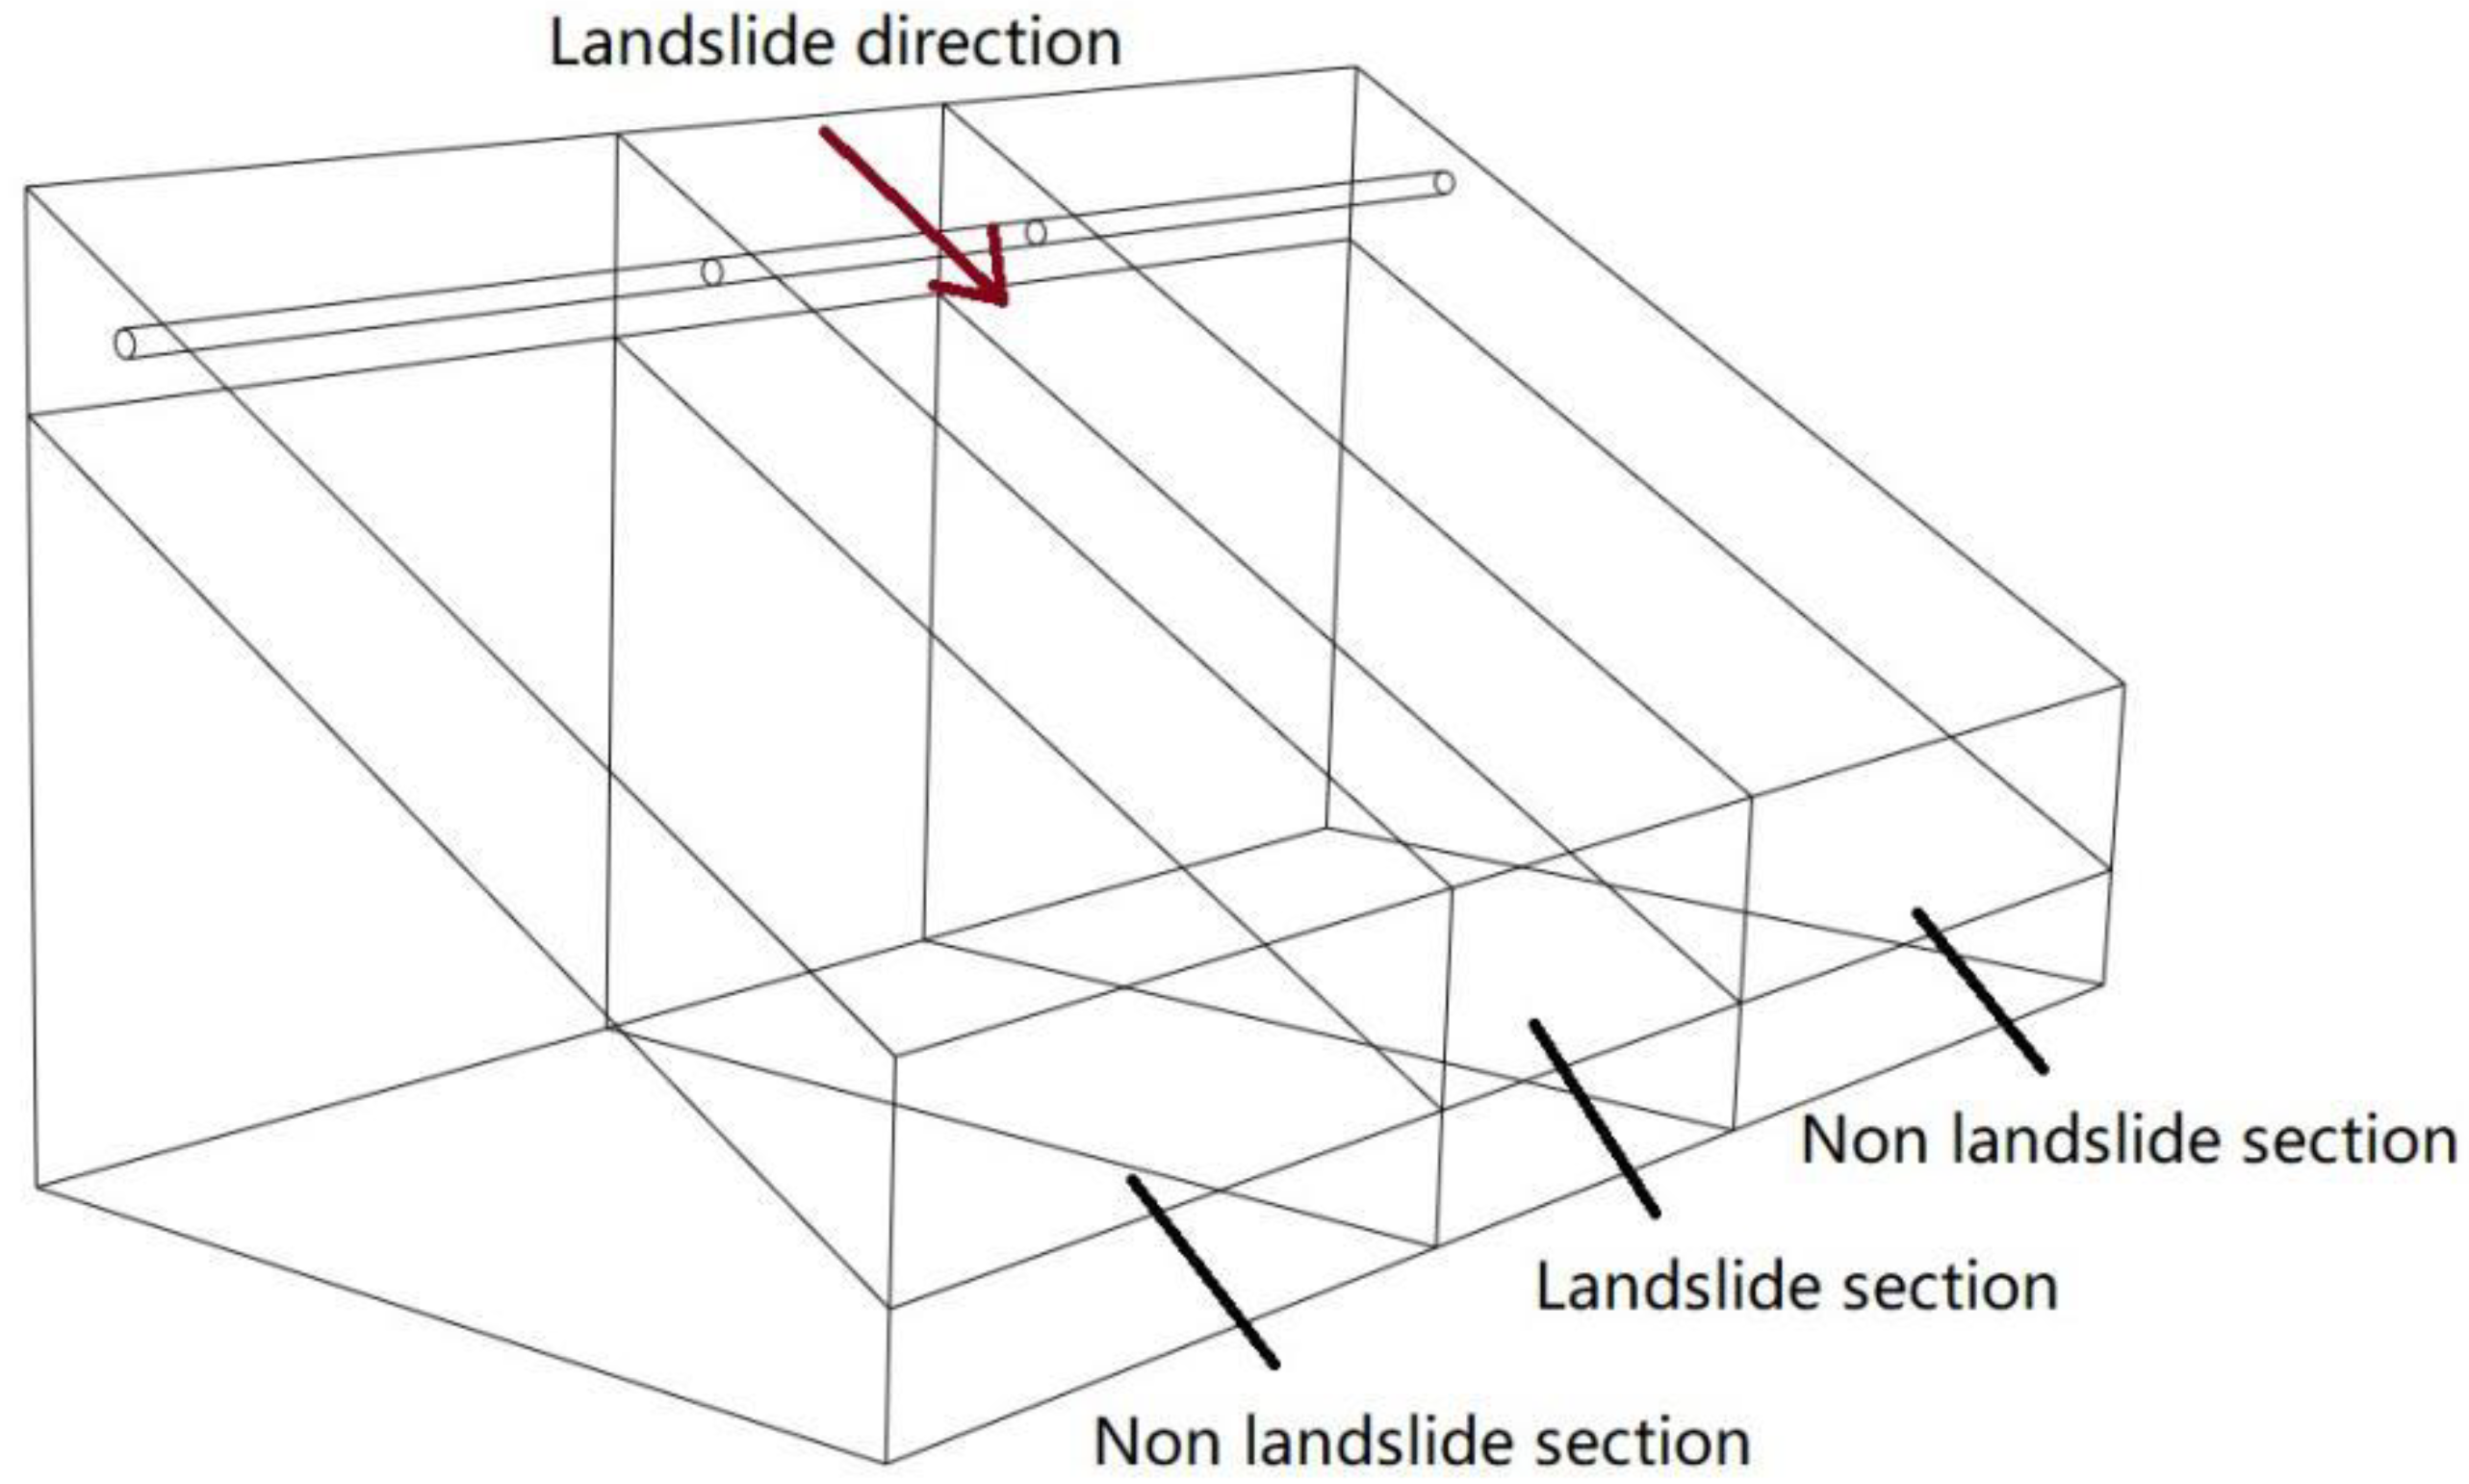
3.1. Establishment of Soil Model

The schematic of the soil model proposed in this study is illustrated in Figure 1 and Figure 2. Overall, the soil body is 80 m wide and can be categorized into two components—the lower component of the soil body, including the soil bedrock, and the upper component, constituting the landslide body, further divided into non-sliding and sliding components. In particular, the sliding component is 20 m wide, and the non-sliding component on both sides is 30 m wide. The area around the Qinglong section of the China-Myanmar natural gas pipeline in western Guizhou, Shazizhen had two consecutive landslides in 2016 and 2017. The angle of the two landslides was about 25–35° [3]; therefore, the landslide angle was taken as 30° for convenient calculation. The thickness of the landslide body was 8 m. The 3D view of the landslide model is shown in Figure 3. The basic parameters are listed in Table 1 [30]. The Mohr–Coulomb model was adopted for the landslide soil, and the bedrock of the landslide soil was considered an elastomer material. Accordingly, we consulted relevant literature to select a hard contact and penalty functions with face-to-face discrete methods to describe the normal and tangential contact existing between pipes and soils [22,31,32,33].
A finite element model was established to study the deformation and failure mechanism of the pipeline during interaction between the pipeline and landslide body, and the influence of other secondary factors was neglected. Therefore, we considered the following assumptions for the model: (1) the direct influence of other objective factors, such as temperature variations and external vibrations on the pipeline, was not considered; (2) the mechanical and physical properties of the soil along with the pipeline were presumed to be uniformly distributed along all axes of the pipeline; (3) only landslides were considered under the action of safe and normal transportation of pipelines.

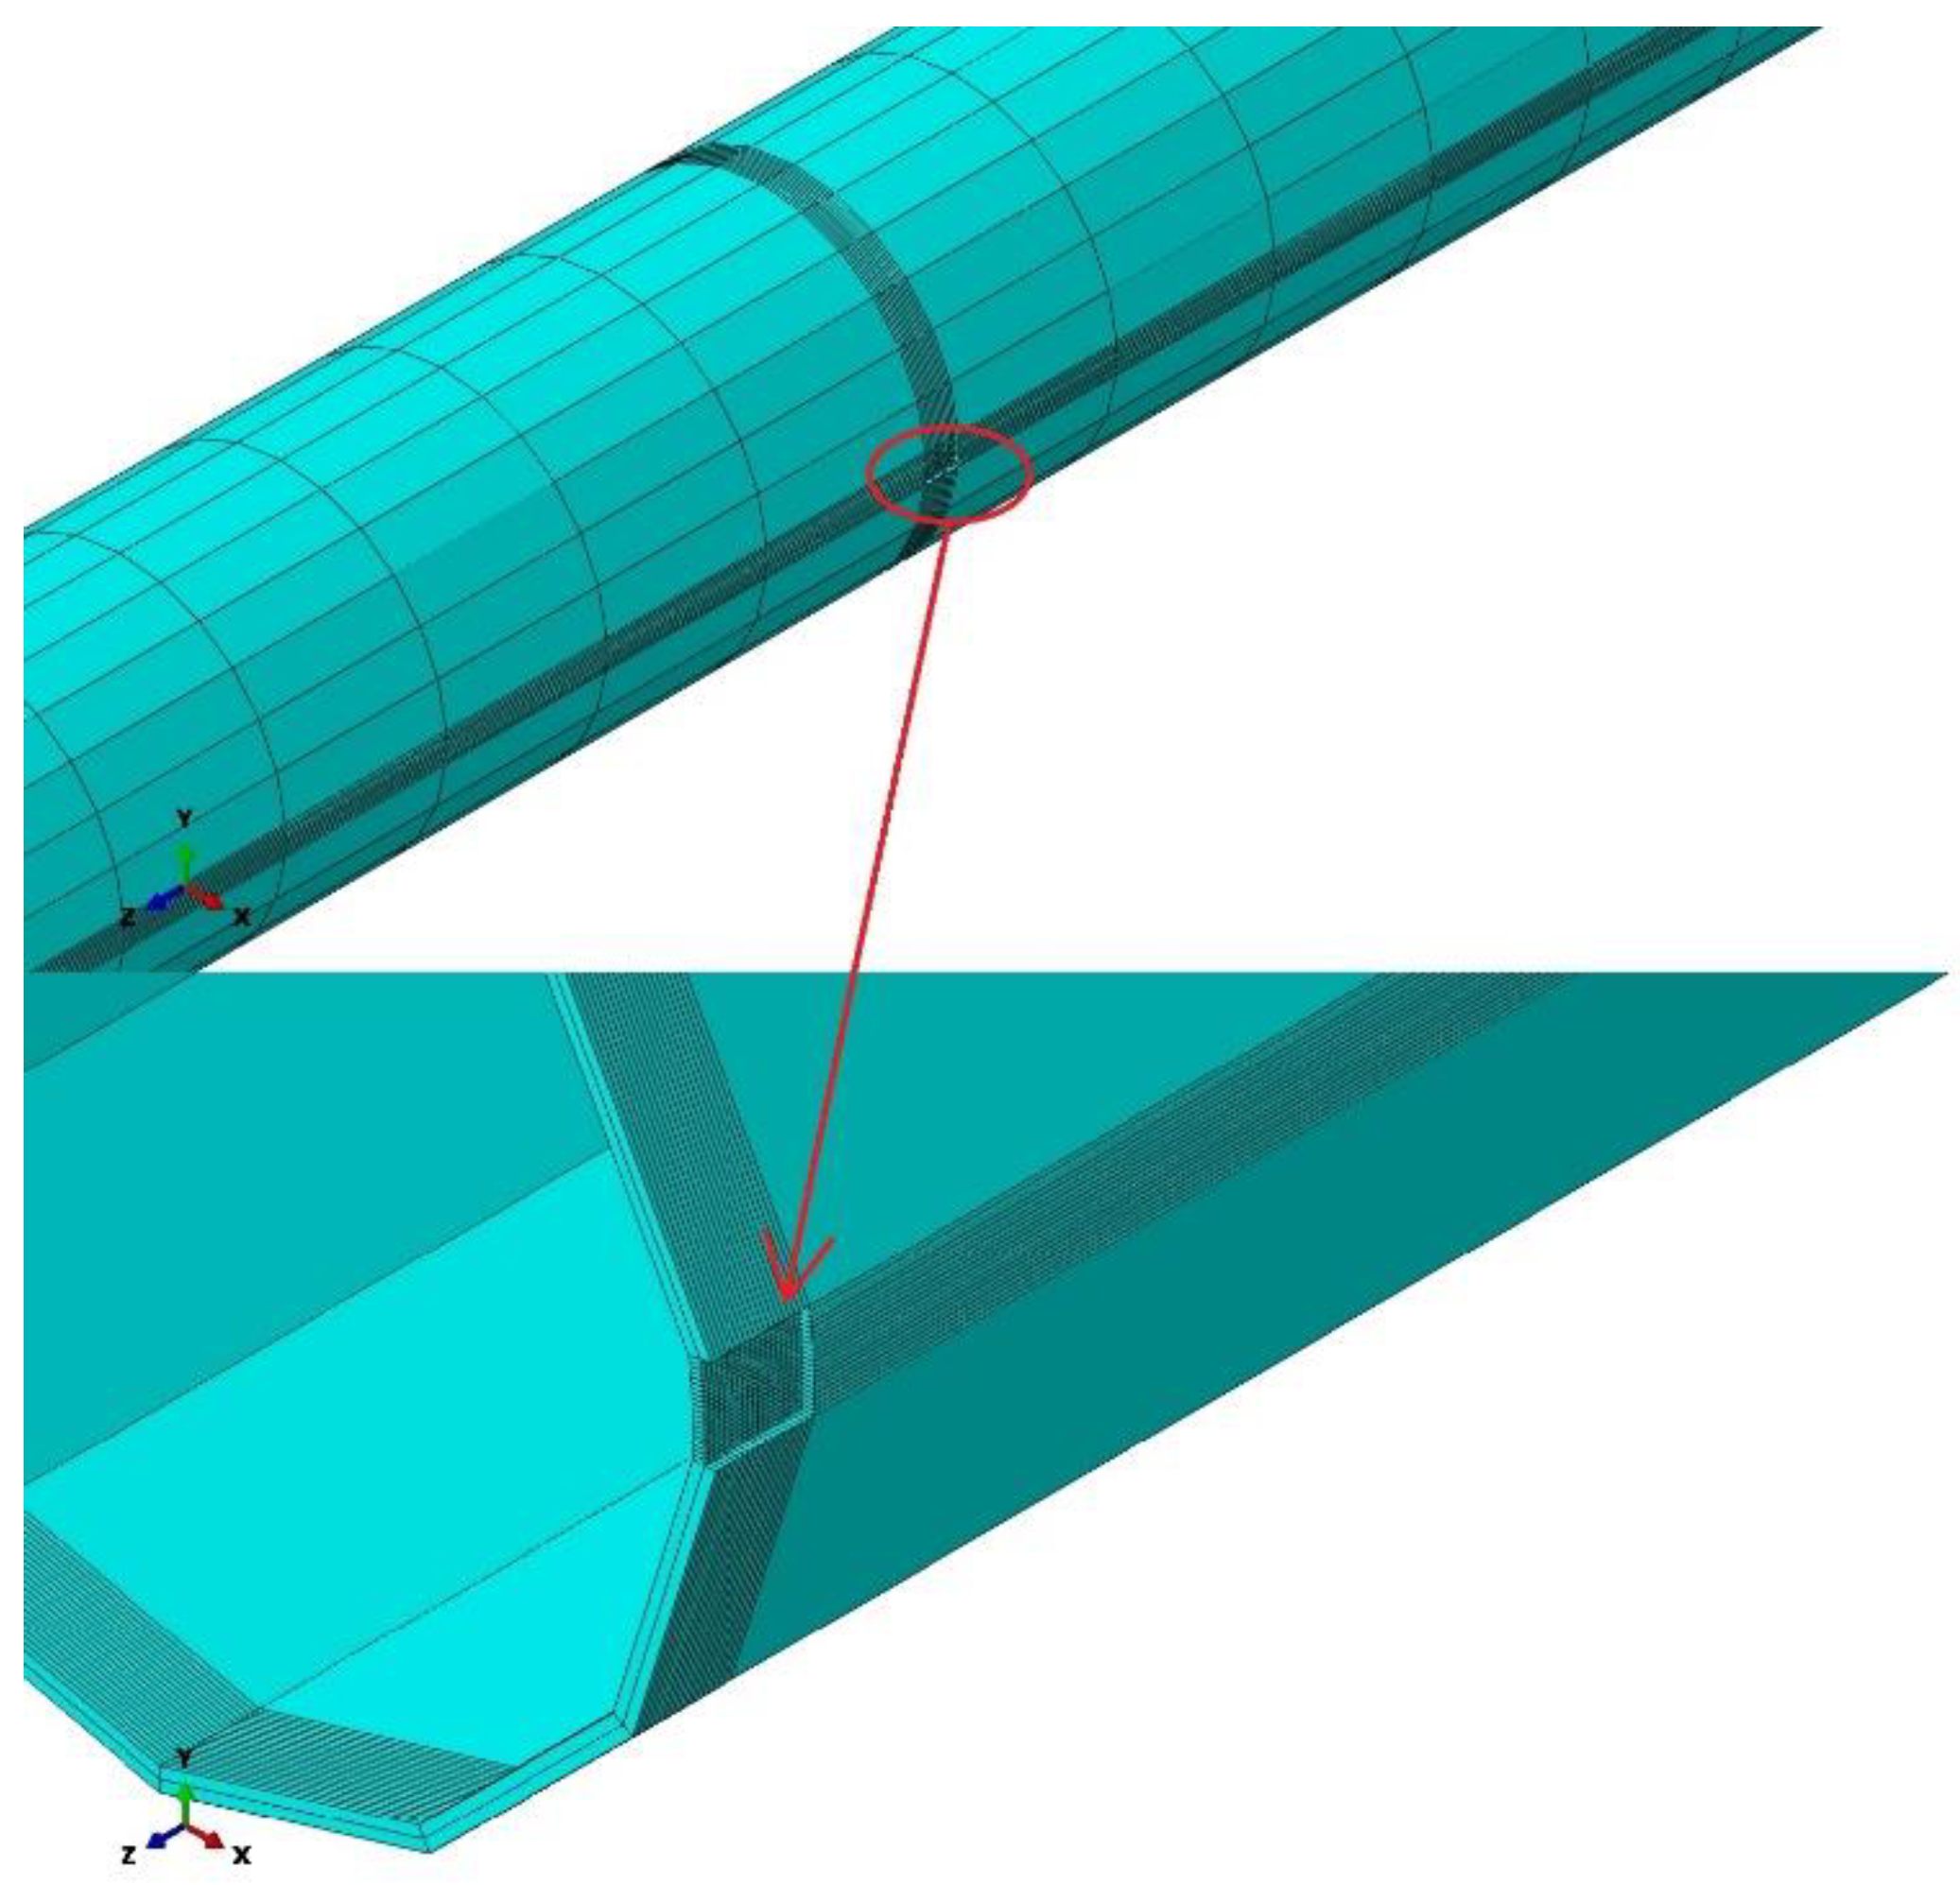
3.2. Establishment of Pipeline Model

This study took the data on the Qinglong section of Western Guizhou of the China-Myanmar natural gas pipeline as an example. We considered X80 grade steel pipe as the research object with a diameter of 1016 mm and wall thickness of 22 mm. The true stress-strain curve of X80 steel is shown in Figure 4, and the buried depth of the pipeline was set to 2.0 m. The basic parameters of the pipeline are shown in Table 2.

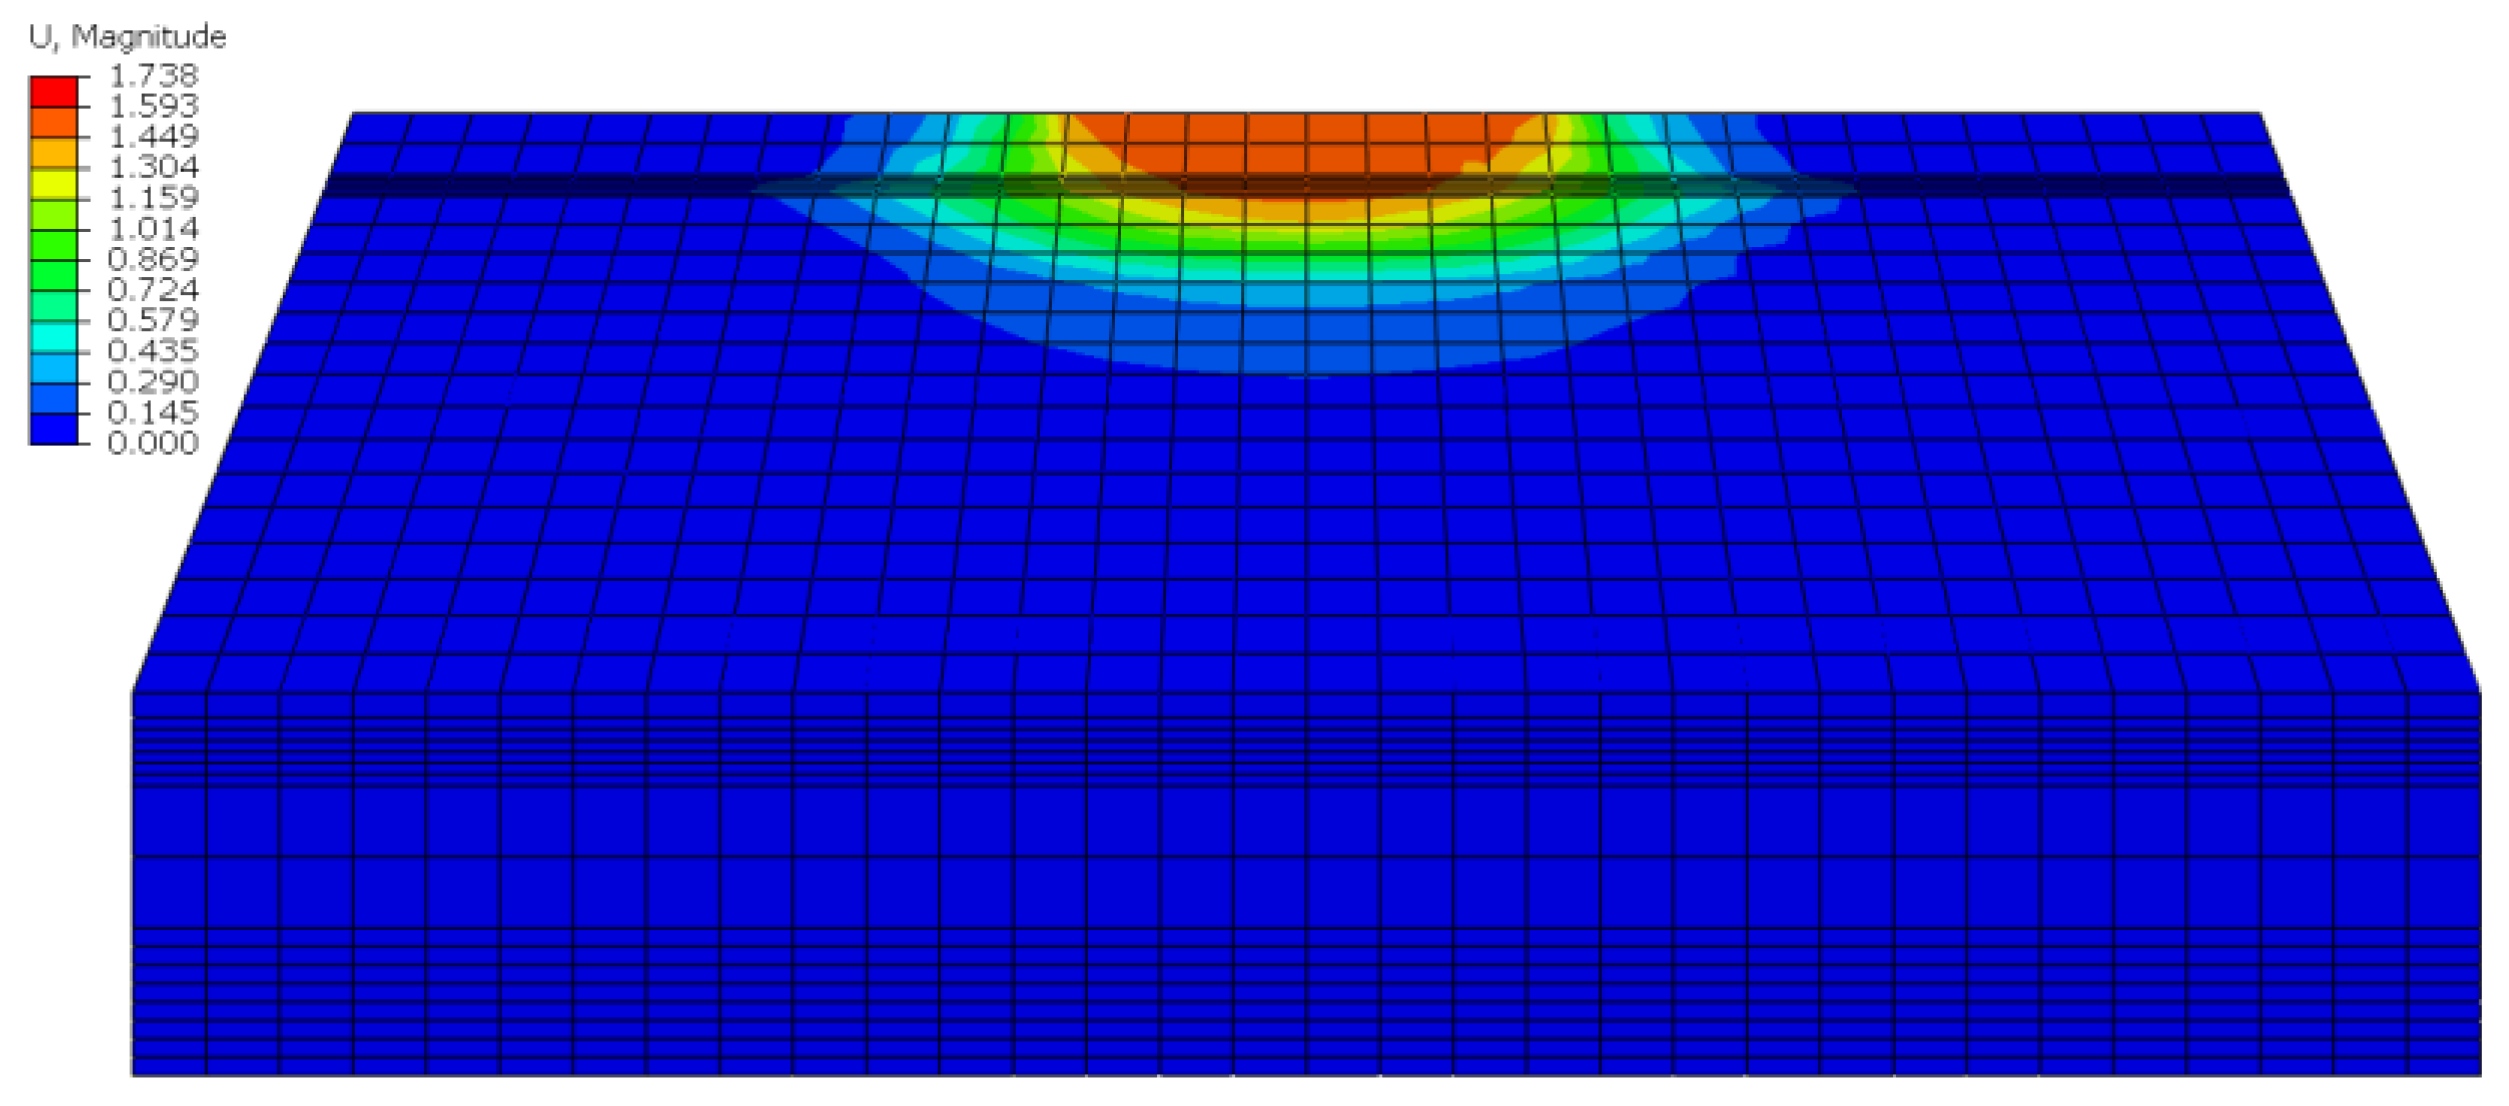
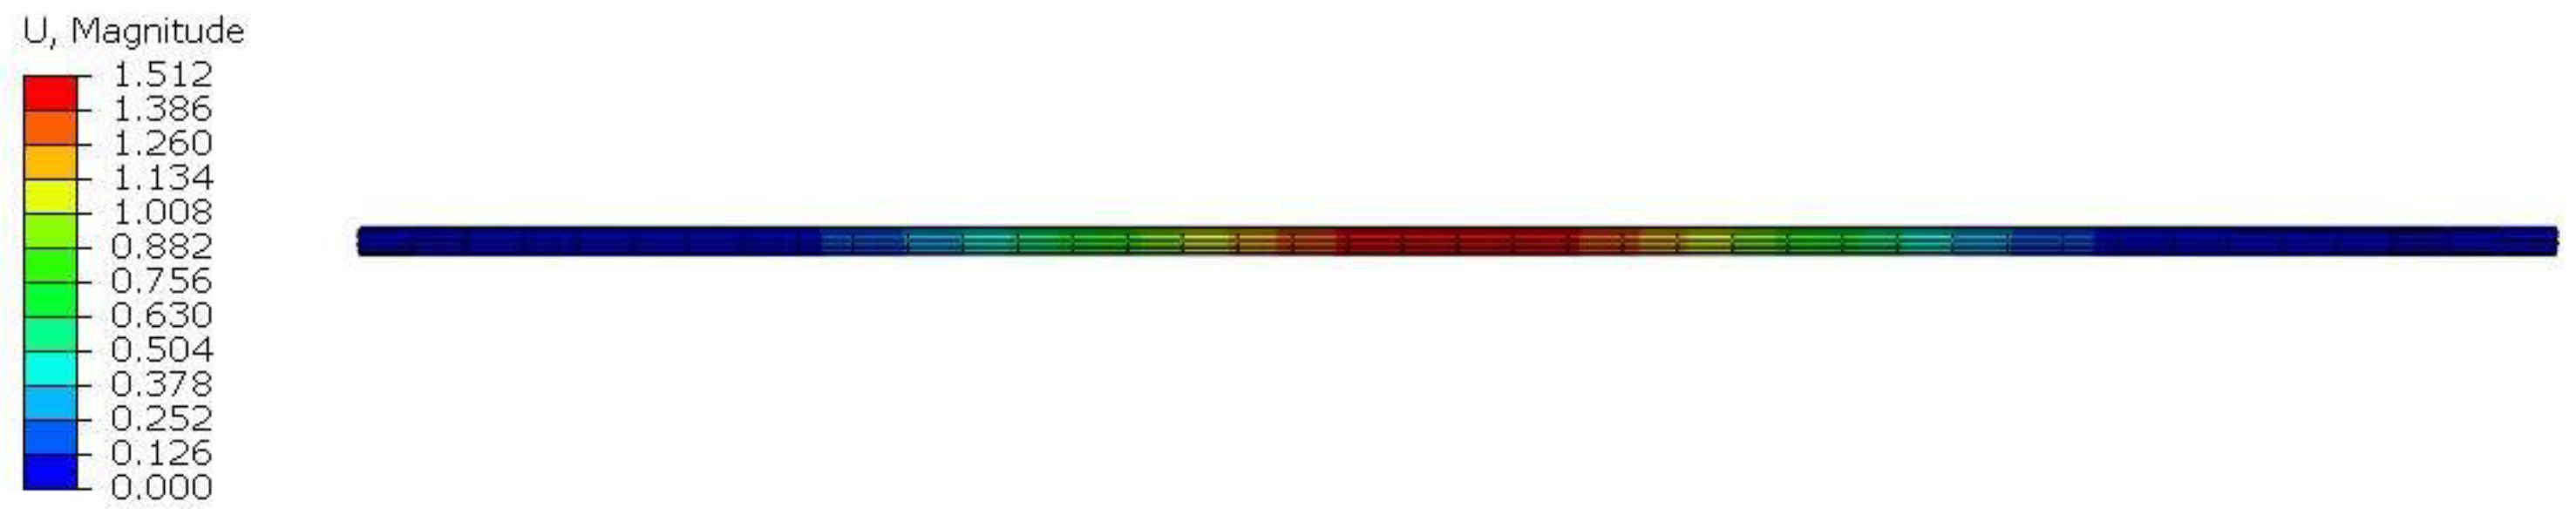
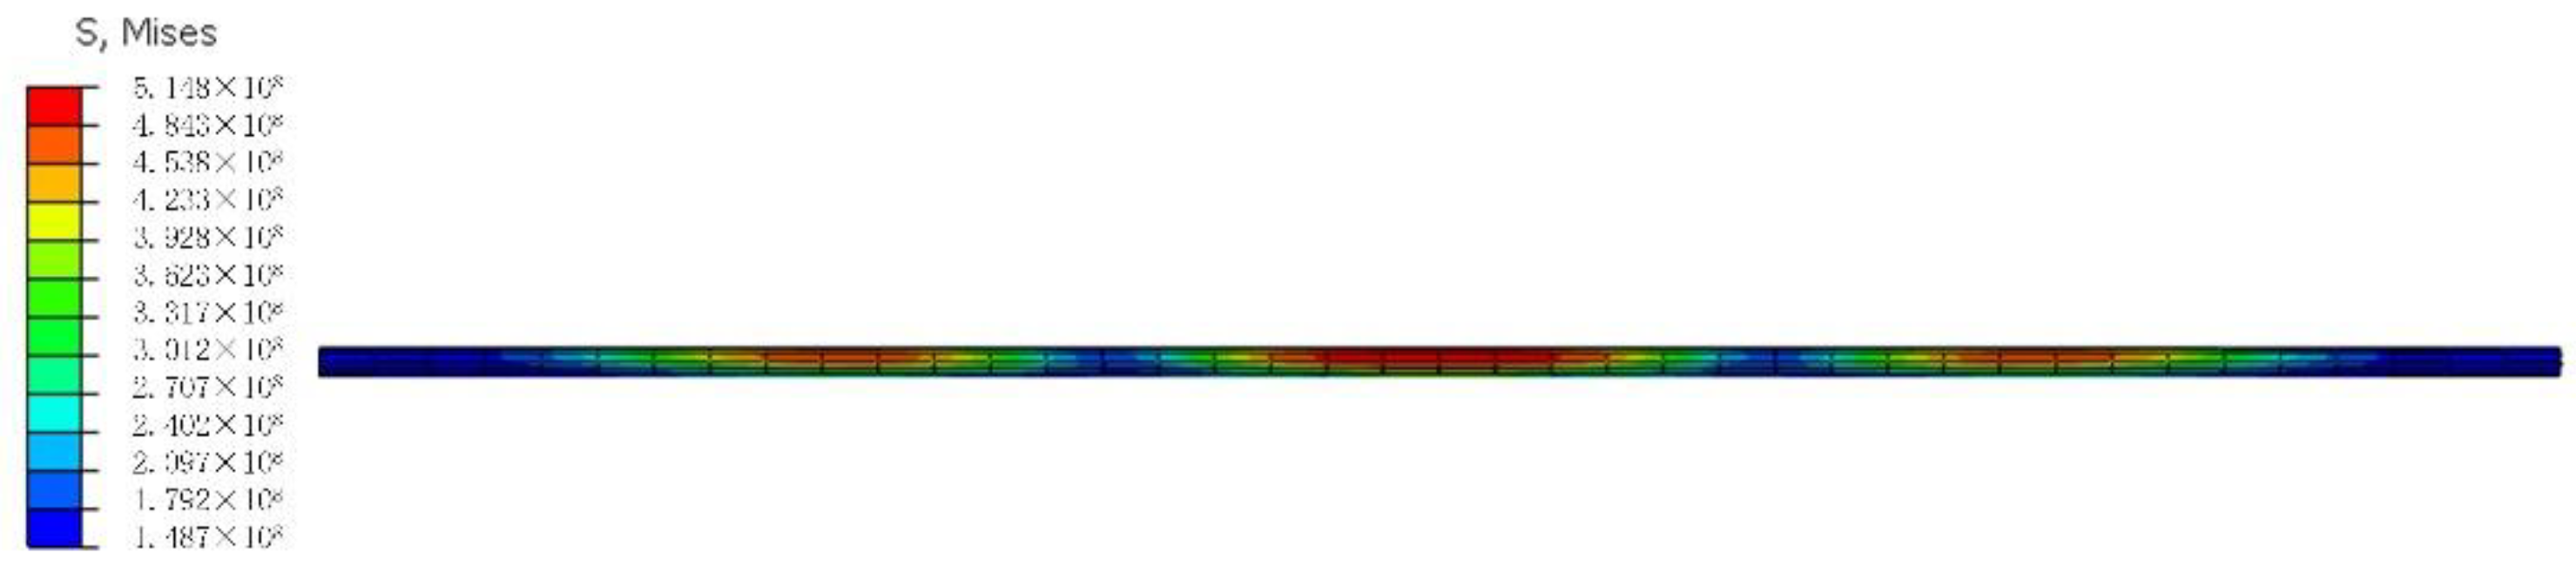
3.3. Mesh Division and Boundary Condition Setting

The model in this study was divided into meshes, and the meshes of the pipe–soil contact area were locally refined to ensure the accuracy of the solution results in this area. In case the soil was meshed, the contact region between the soil and pipeline, as well as the soil in the vicinity of the pipeline, were densified or divided into cubes for meshing. The side of the cube was divided into a unit of 0.08 m. During meshing, a unit was divided in intervals of 0.1 m along the circumferential direction of the pipe and 1 m in the pipe axial position. The meshing of the soil and the contact region between the soil and pipeline in the finite element pipeline model are described in Figure 5.
The ultimate bending of the pipe was observed if the length of the soil behind the pipe was more than five times the pipe diameter. Therefore, in the current model, the distance between the pipeline and the rear face was set as 3.5 m. In addition, the boundary conditions of the pipeline model and landslide soil were set as follows: full constraints applied to the bottom of the soil bedrock; axial constraints applied to both sections of the pipeline, including the left and right ends of the landslide; and displacement loads applied to the rear end of the soil to represent the soil sliding.

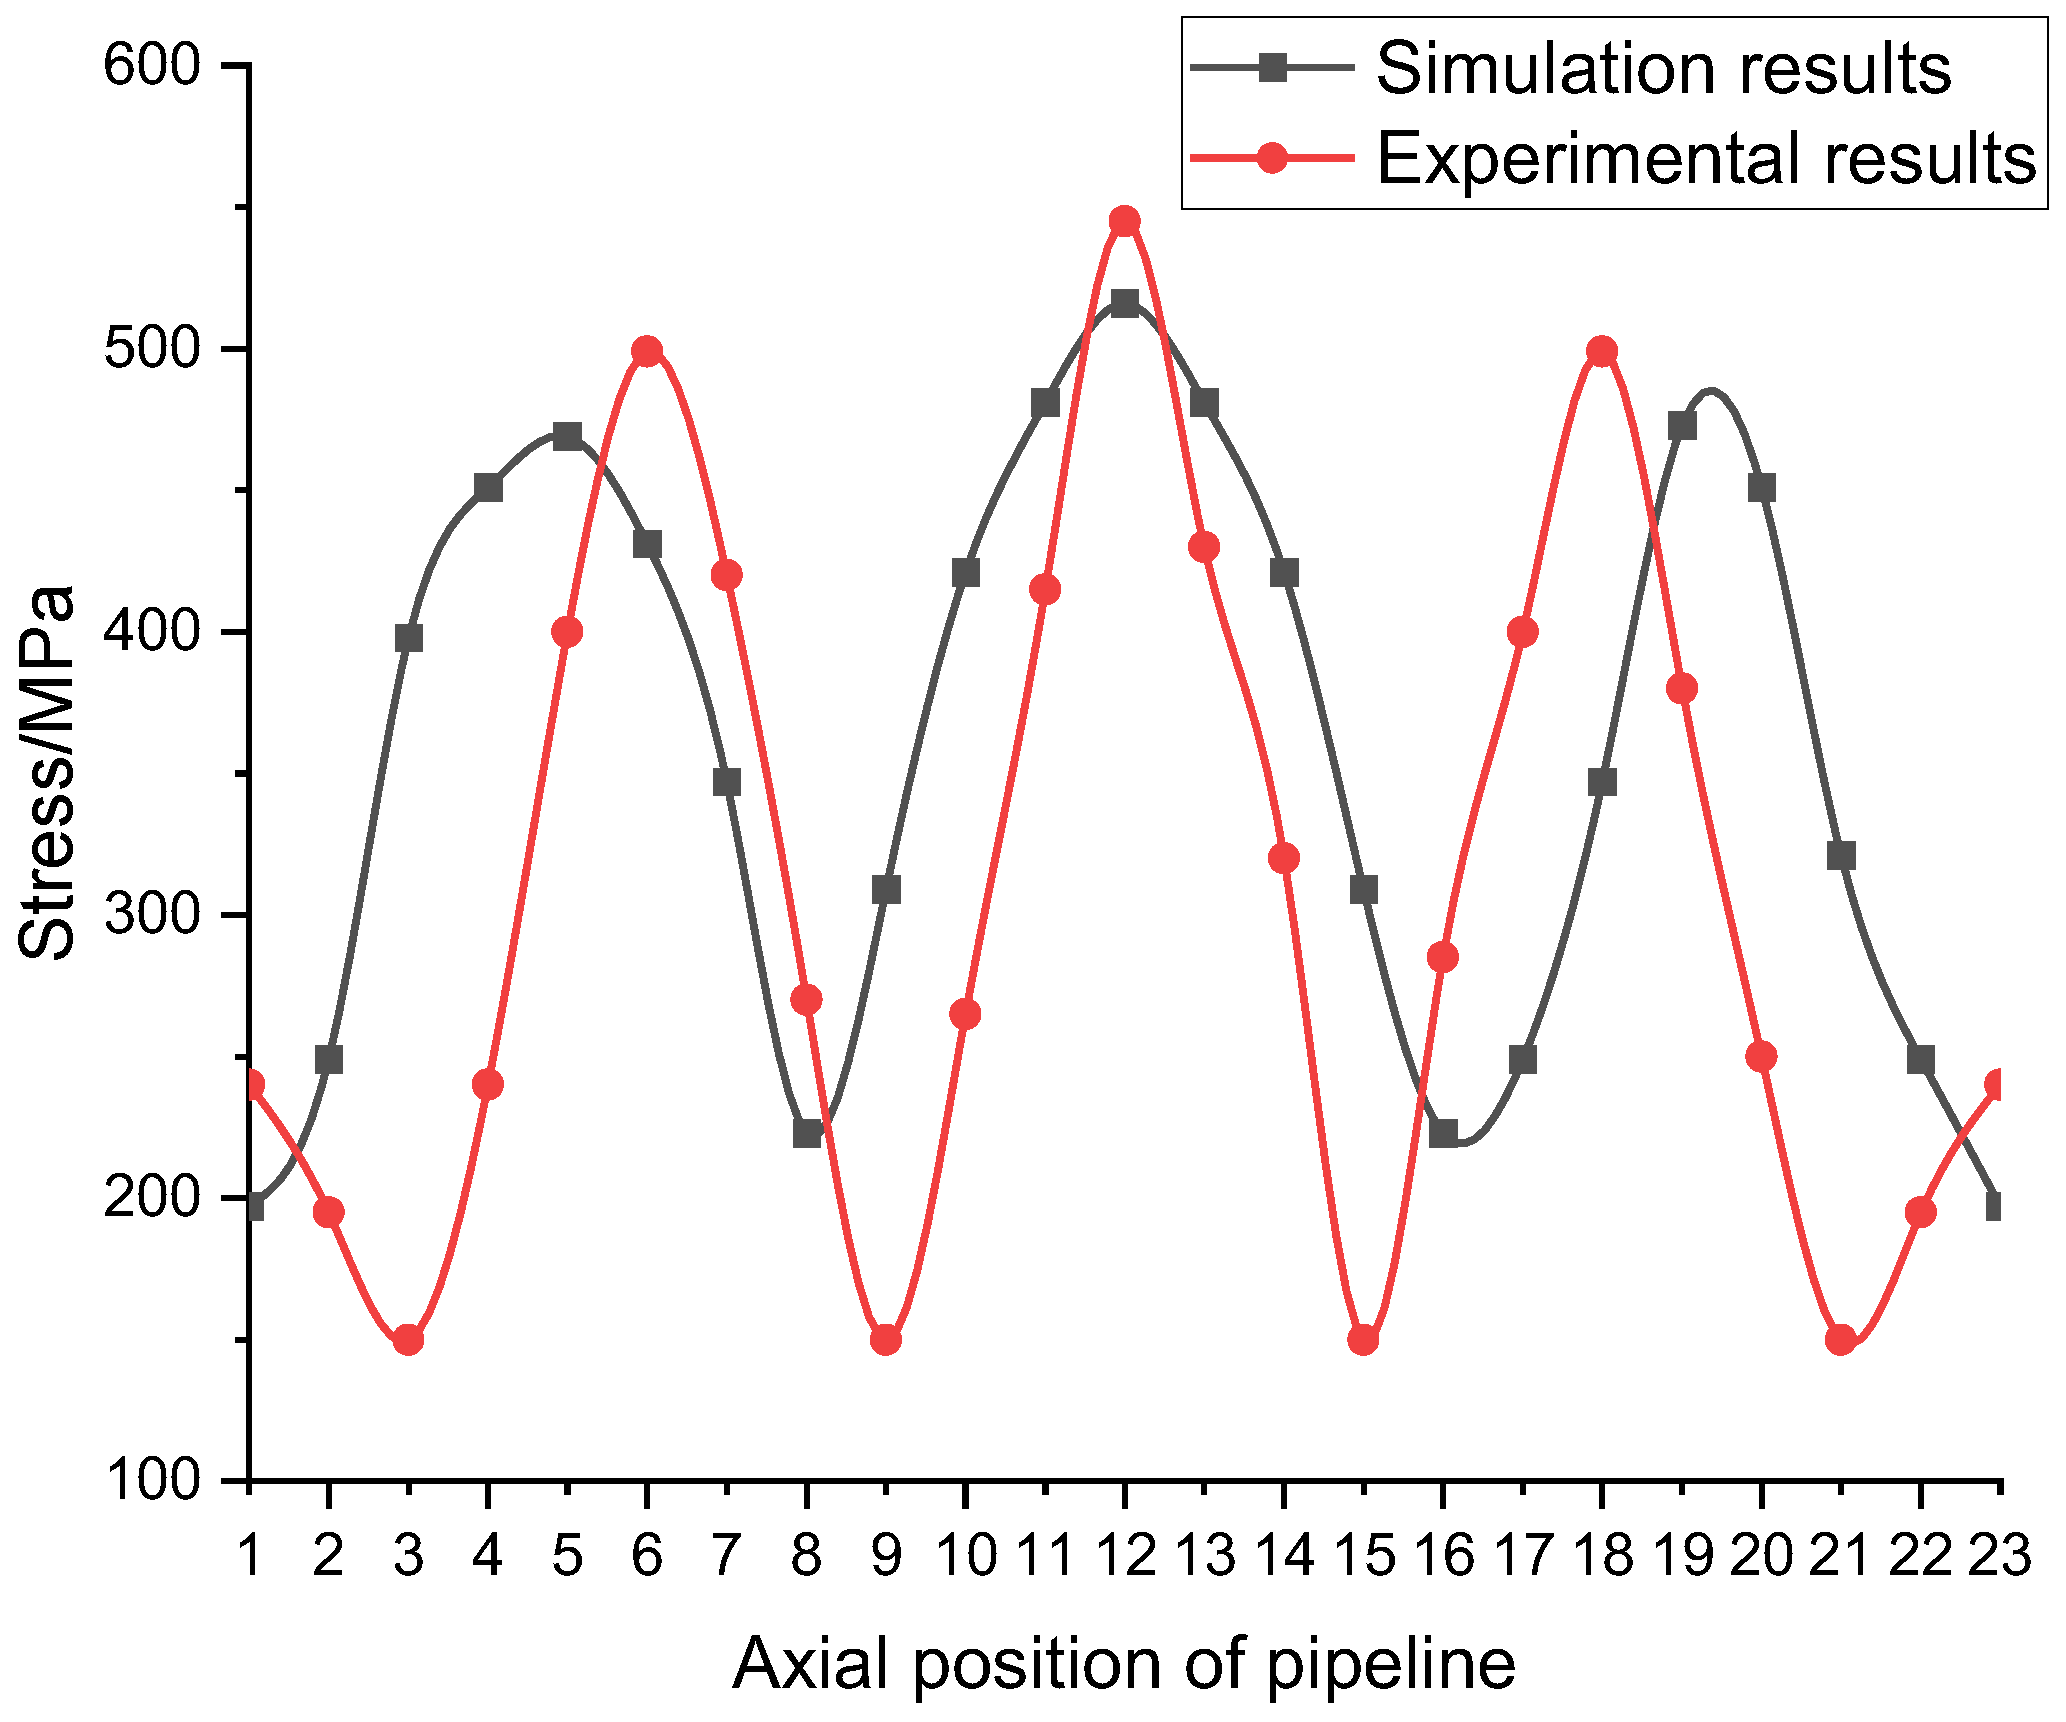
3.4. Model Validation

The developed model was verified with comparison to the stress variations reported in the literature [30]. Accordingly, the lateral landslide displacement of the finite element model was set to 1 m with an operating pressure of 10 MPa, and the stress variations were calculated. The calculated soil and pipeline displacement cloud diagrams are presented in Figure 6 and Figure 7, and the pipeline stress cloud diagram is depicted in Figure 8.
Under similar conditions reported in related literature, 23 points along the axial direction of the pipeline were considered as the analysis object and the simulation results were compared with the variations observed in pipeline stress [34]. The comparison results are depicted in Figure 9, which demonstrates that the stress variation trend of the pipe in the axial position obtained under simulation was overall consistent with the experimental results. The maximum von Mises stress of the pipeline was 514.8 MPa, less than the yield strength of 530 MPa, corresponding to the safe operation of the pipeline.

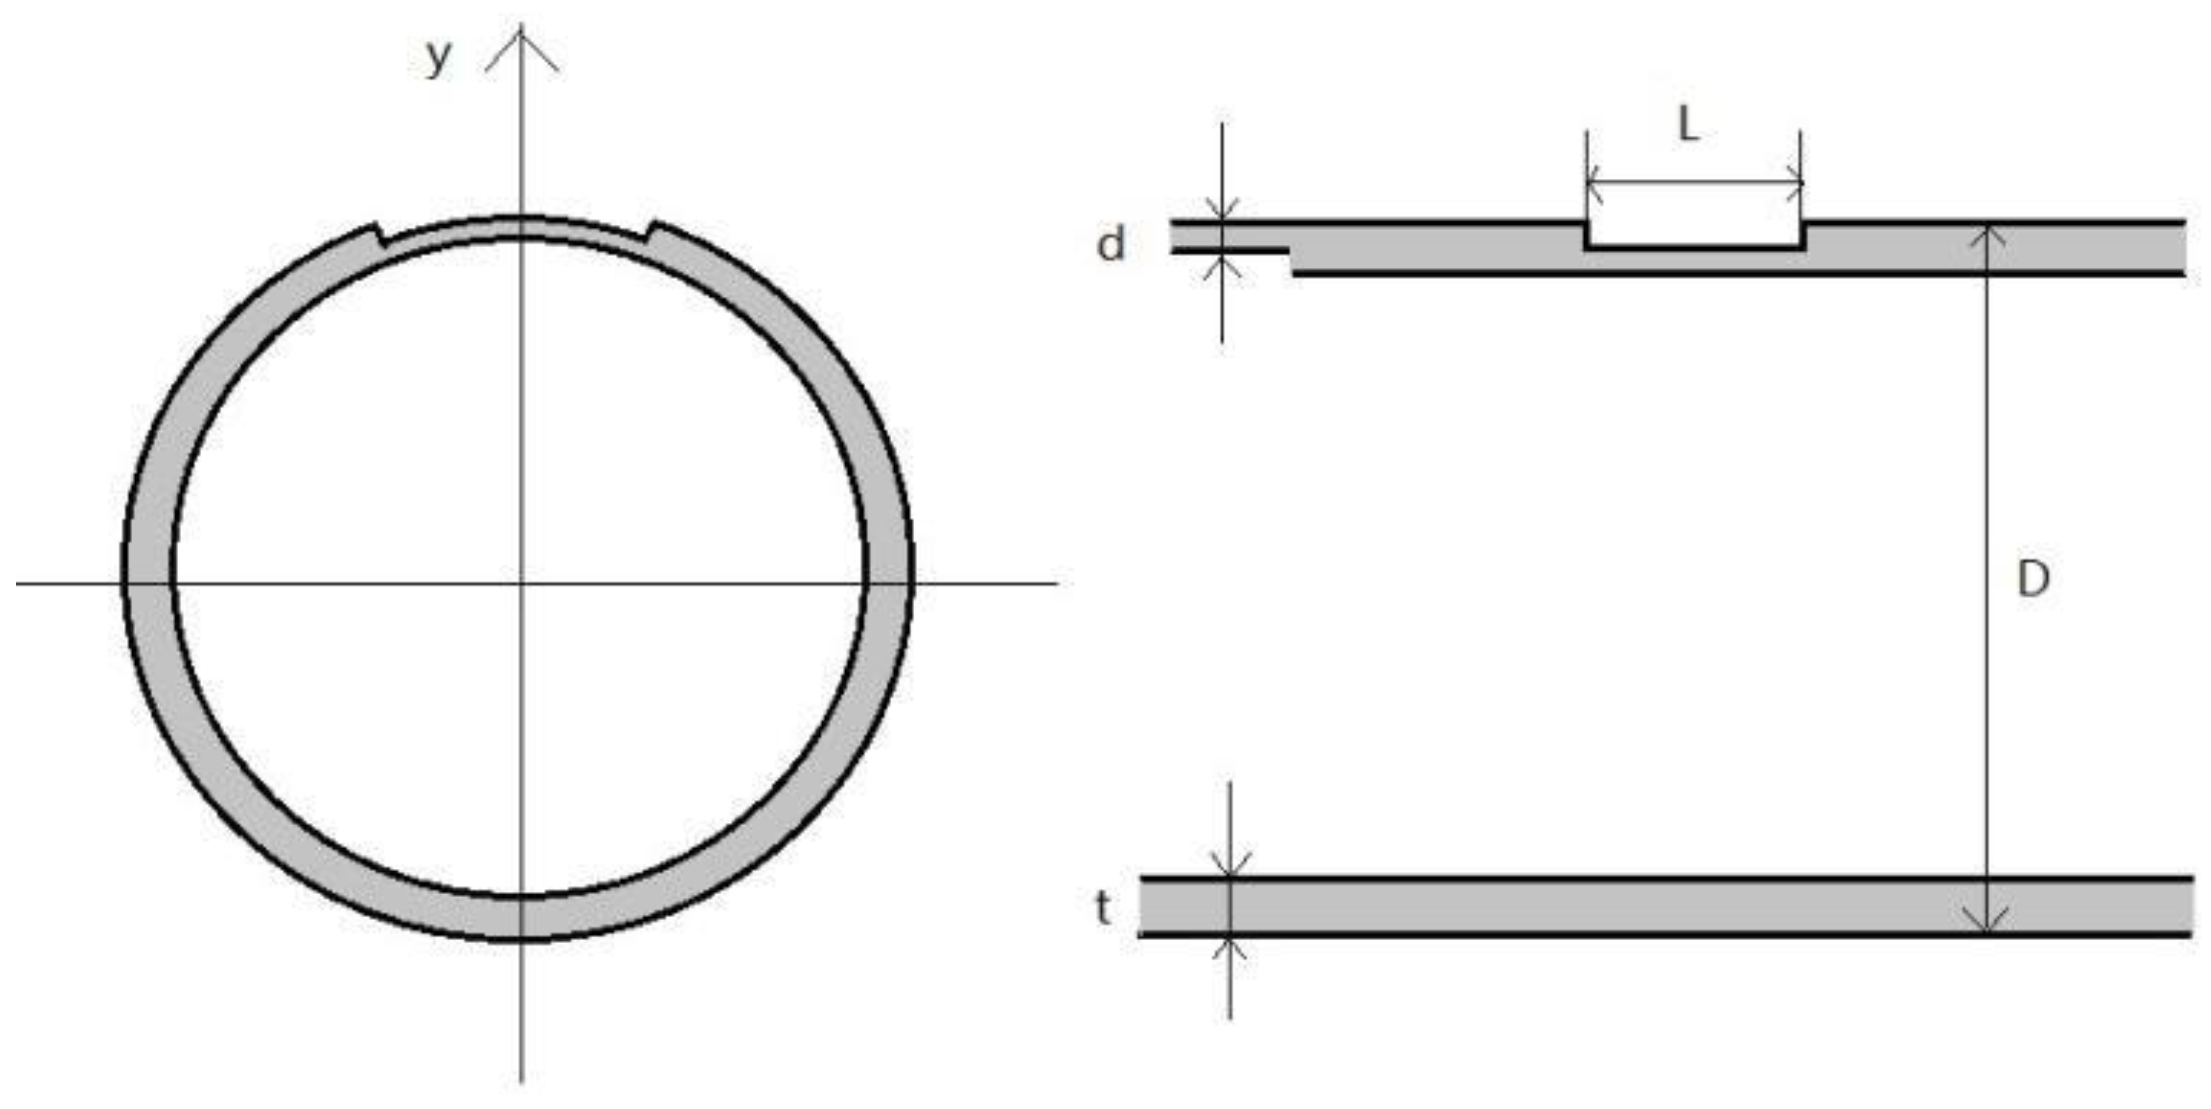
3.5. Establishment of Pipeline Model with Defects

According to relevant research theories, the calculation cost and numerical convergence must usually be considered in the process of finite element modeling [26]. Therefore, it is generally necessary to simplify the geometry of defects. At present, the commonly used simplified defect geometry models are divided into the following four types: (1) uniform wall thickness model, (2) flat bottom model, (3) spherical model, and (4) cylindrical model. For the pipeline with corrosion defects established herein, the uniform wall thickness defect model was adopted. A schematic illustration of the corroding pipes is shown in Figure 10, and the grid division diagram of pipeline defects is shown in Figure 11.
The corrosion was localized corrosion caused by the harsh natural environment. Therefore, the corrosion was simplified to rectangular uniform wall thickness corrosion, which is more accurate and simpler than other simplified models. The corrosion defect size of the pipeline was as follows: the length was 400 mm, central angle was 20°, and depth was 10 mm.
According to existing literature [29], the corrosion behavior of a pipeline under the action of landslide defects can be combined with the finite element analysis of the pipeline.

3.6. Sensitivity Analysis Method

3.6.1. Analysis

To establish a system model, the functional relationship between the system characteristics and influencing factors was considered. We aimed to determine the datum parameter set according to the specific problems in this study. During analysis of the impact of specific parameter x k on system characteristics, the datum parameter presumed the datum value and remained constant. In addition, x k was varied within a certain range. At this instant, the system characteristic was y = f x 1 * , x 2 * ,   x k ,   x n * , and the influence of a single parameter on the system characteristic was investigated.

3.6.2. Dimensionless Treatment

In an actual system, the influencing factors are often various physical quantities with varying dimensions. Therefore, the sensitivities of various influencing factors were compared based on dimensionless parameters. Accordingly, this study defined the dimensionless sensitivity function and sensitivity factor; i.e., the ratio of the relative error δ y of system y to the relative error δ x k of parameter x k is defined as the sensitivity function N k x k of the parameter.
The relative error of system y is as follows:
δ y = Δ y y *
The relative error of parameters x k is as follows:
δ x k = Δ x k x k *
The sensitivity function is as follows:
N k x k = Δ y / y * Δ x k / x k * = Δ y Δ x k x k * y * , k = 1 , 2 ,   n ,
where
  • N k x k : Sensitivity coefficient of factors to the system;
  • x k * : Benchmark value of factor setting;
  • y * : Response value of factor at reference value.
The size of N k x k indicates the sensitivity of the factor. A small value of N k x k weakens the sensitivity of the element, consequently reducing the influence of the element on the target. In contrast, the influence of the element on the target increases with the sensitivity of the element.

4. Stress Sensitivity Analysis of Pipeline with Corrosion Defects under Landslide

4.1. Sensitivity Factor Analysis

The influencing factors of a landslide on the stress of a gas transmission pipeline with corrosion defects primarily refer to the defect length, defect depth, defect axial position, pressure in the pipe, displacement of landslide mass, and cohesion of soil mass. The setting of reference values for the sensitivity analysis is listed in Table 3.
Based on the established finite element model of a gas transmission pipeline with corrosion defects under the action of landslide, the maximum von Mises stress value of the pipeline was calculated using the reference values presented in Table 3; the influencing factors of the model were varied with ±10%, ±20%, ±30%, ±40%, and ±50% of the reference value. The maximum von Mises stress value of the pipeline was calculated, and the sensitivity coefficients of various influencing factors were evaluated according to the sensitivity coefficient analysis method.
Multiple influencing factors demonstrated the same number of variations over time, and the maximum von Mises stress of the gas transmission pipeline with corrosion defects varied under the landslide action. Considering ±10%, ±20%, ±30%, ±40%, and ±50% of the reference value as the influencing factors of the variation model, the maximum von Mises stress value of the pipeline calculated using the developed finite element model is presented in Table 4. The sensitivity analysis diagram of influencing factors drawn according to the calculation results is depicted in Figure 9.
As shown in Figure 12, all factors except the axial position of corrosion defects were positively correlated to the stress in the gas transmission pipeline with corrosion defects under landslide action.
  • Corrosion length
The maximum von Mises stress of gas pipelines containing corrosion defects under the action of landslide increased with the corrosion length, but the growth trend was not prominent. Table 5 shows the model parameters when the defect length changes. In the case of −50% variation of influence parameters, the maximum von Mises stress of the pipeline was 516.3 MPa. In contrast, the maximum von Mises stress of the pipeline was 517.8 MPa in case of 50% variation of influence parameters, corresponding to a variation of only 1.5 MPa. Moreover, the variation in the maximum von Mises stress of the gas transmission pipeline was almost equal to that in corrosion length. As observed, the variations in corrosion defect length slightly influenced the maximum von Mises stress of the pipeline in a certain range.
  • Corrosion depth
The maximum von Mises stress of gas pipelines containing corrosion defects under the action of landslide increased with the corrosion depth with a prominent growth trend. For a defect depth between 5 and 9 mm, the increase in the maximum von Mises stress value of the pipeline was 0.1 MPa, which increased further with the corrosion depth. The stress value increased by 0.12% for a depth between 5 and 10 mm. For a depth between 10 and 15 mm, the stress value increased by 1.01%, indicating that the corrosion depth was within 10 mm, with the defect depth having minimal influence on the stress value of the gas pipeline. The threat to the safe operation of the pipeline increased when the corrosion depth exceeded 10 mm. Table 6 shows the model parameters when the defect depth changes.
  • Axial position of corrosion defects
The maximum von Mises stress of gas transmission pipelines with corrosion defects under the action of landslide decreased with the increase in axial position of defects. As the distance between the defect and middle length of the pipeline increased, the reduction in the maximum von Mises stress of the pipeline was 1.1, 1.8, 1.6, 2.2, 3.2, 2.2, 0, 0.2, 0.2, and 0 MPa, displaying a trend of initial increase with subsequent decrease. When the axial position of the defect was 2.5 and 5.5 m, the stress was reduced by 2.34%, while it reduced by only 0.8% between 5.5 and 7.5 m. These results indicated that the pipeline is prone to be damaged if the corrosion defect is in proximity to the center of the landslide. At the junction of the landslide section and non-landslide section, the corrosion defects exerted less destructive force on the pipeline. Table 7 shows the model parameters when the axial position of the defect changes.
  • Internal pressure of pipeline
In increase in the internal pressure gradually increased the maximum von Mises stress of the gas pipelines with corrosion defects under landslide conditions. Table 8 shows the model parameters when the pressure inside the pipeline changes.
  • Landslide displacement
The conclusion of landslide displacement is similar to that of internal pressure. As the landslide displacement increased from 1 to 3 m, the maximum von Mises stress of the pipeline increased in the following progression: 2.6, 2.8, 3.5, 3.4, 3.8, 4.6, 5.4, 7, 7.2, 9. Although the maximum von Mises stress of the pipeline increased, the stress growth diminished with every 0.2 m advance of the landslide displacement. Table 9 shows the model parameters when the landslide displacement changes.
  • Soil cohesion
During landslide, the maximum von Mises stress of gas pipelines with corrosion defects increases with the factor of soil cohesion. As the cohesion of soil increased from 10 to 30 KPa, the maximum von Mises stress of the pipeline increased by 0.5, 0.9, 0.9, 1.1, 1.6, 1.8, 2.3, 2.5, and 3.6 MPa. Although the maximum von Mises stress of the pipeline increased, the extent of the increase reduced with the addition of every 2 KPa in soil cohesion. Table 10 Model parameters when soil cohesion changes.
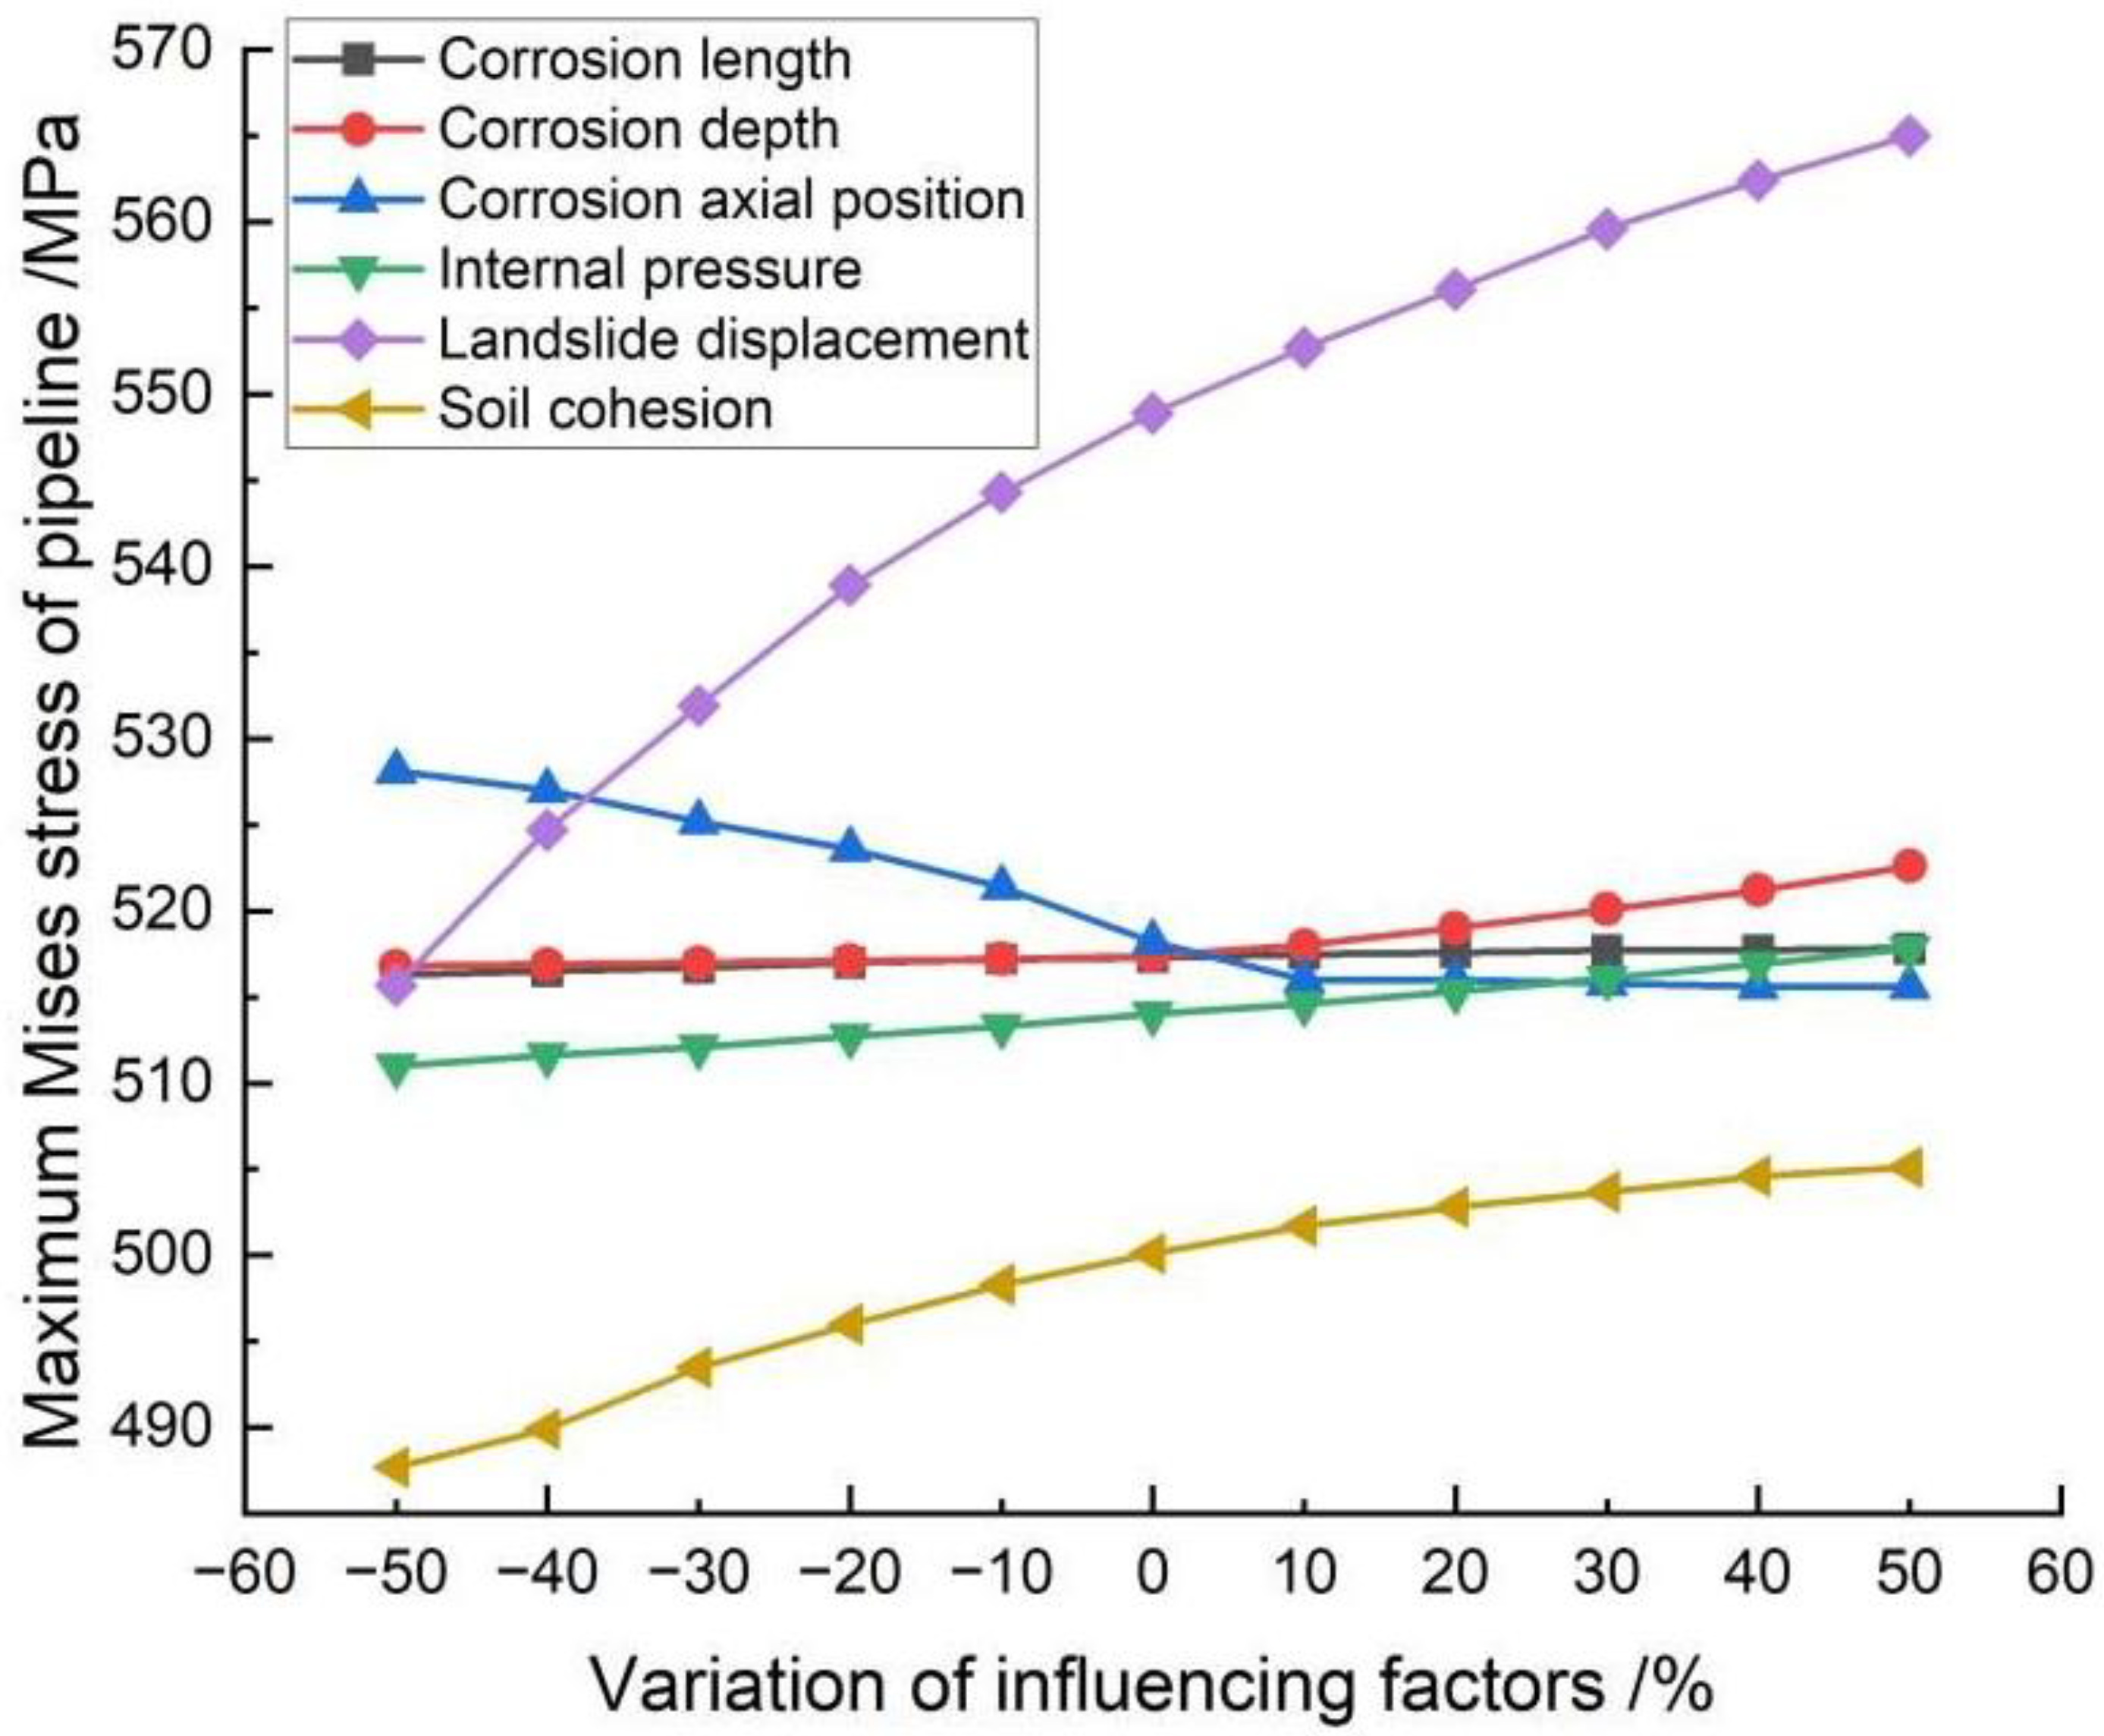
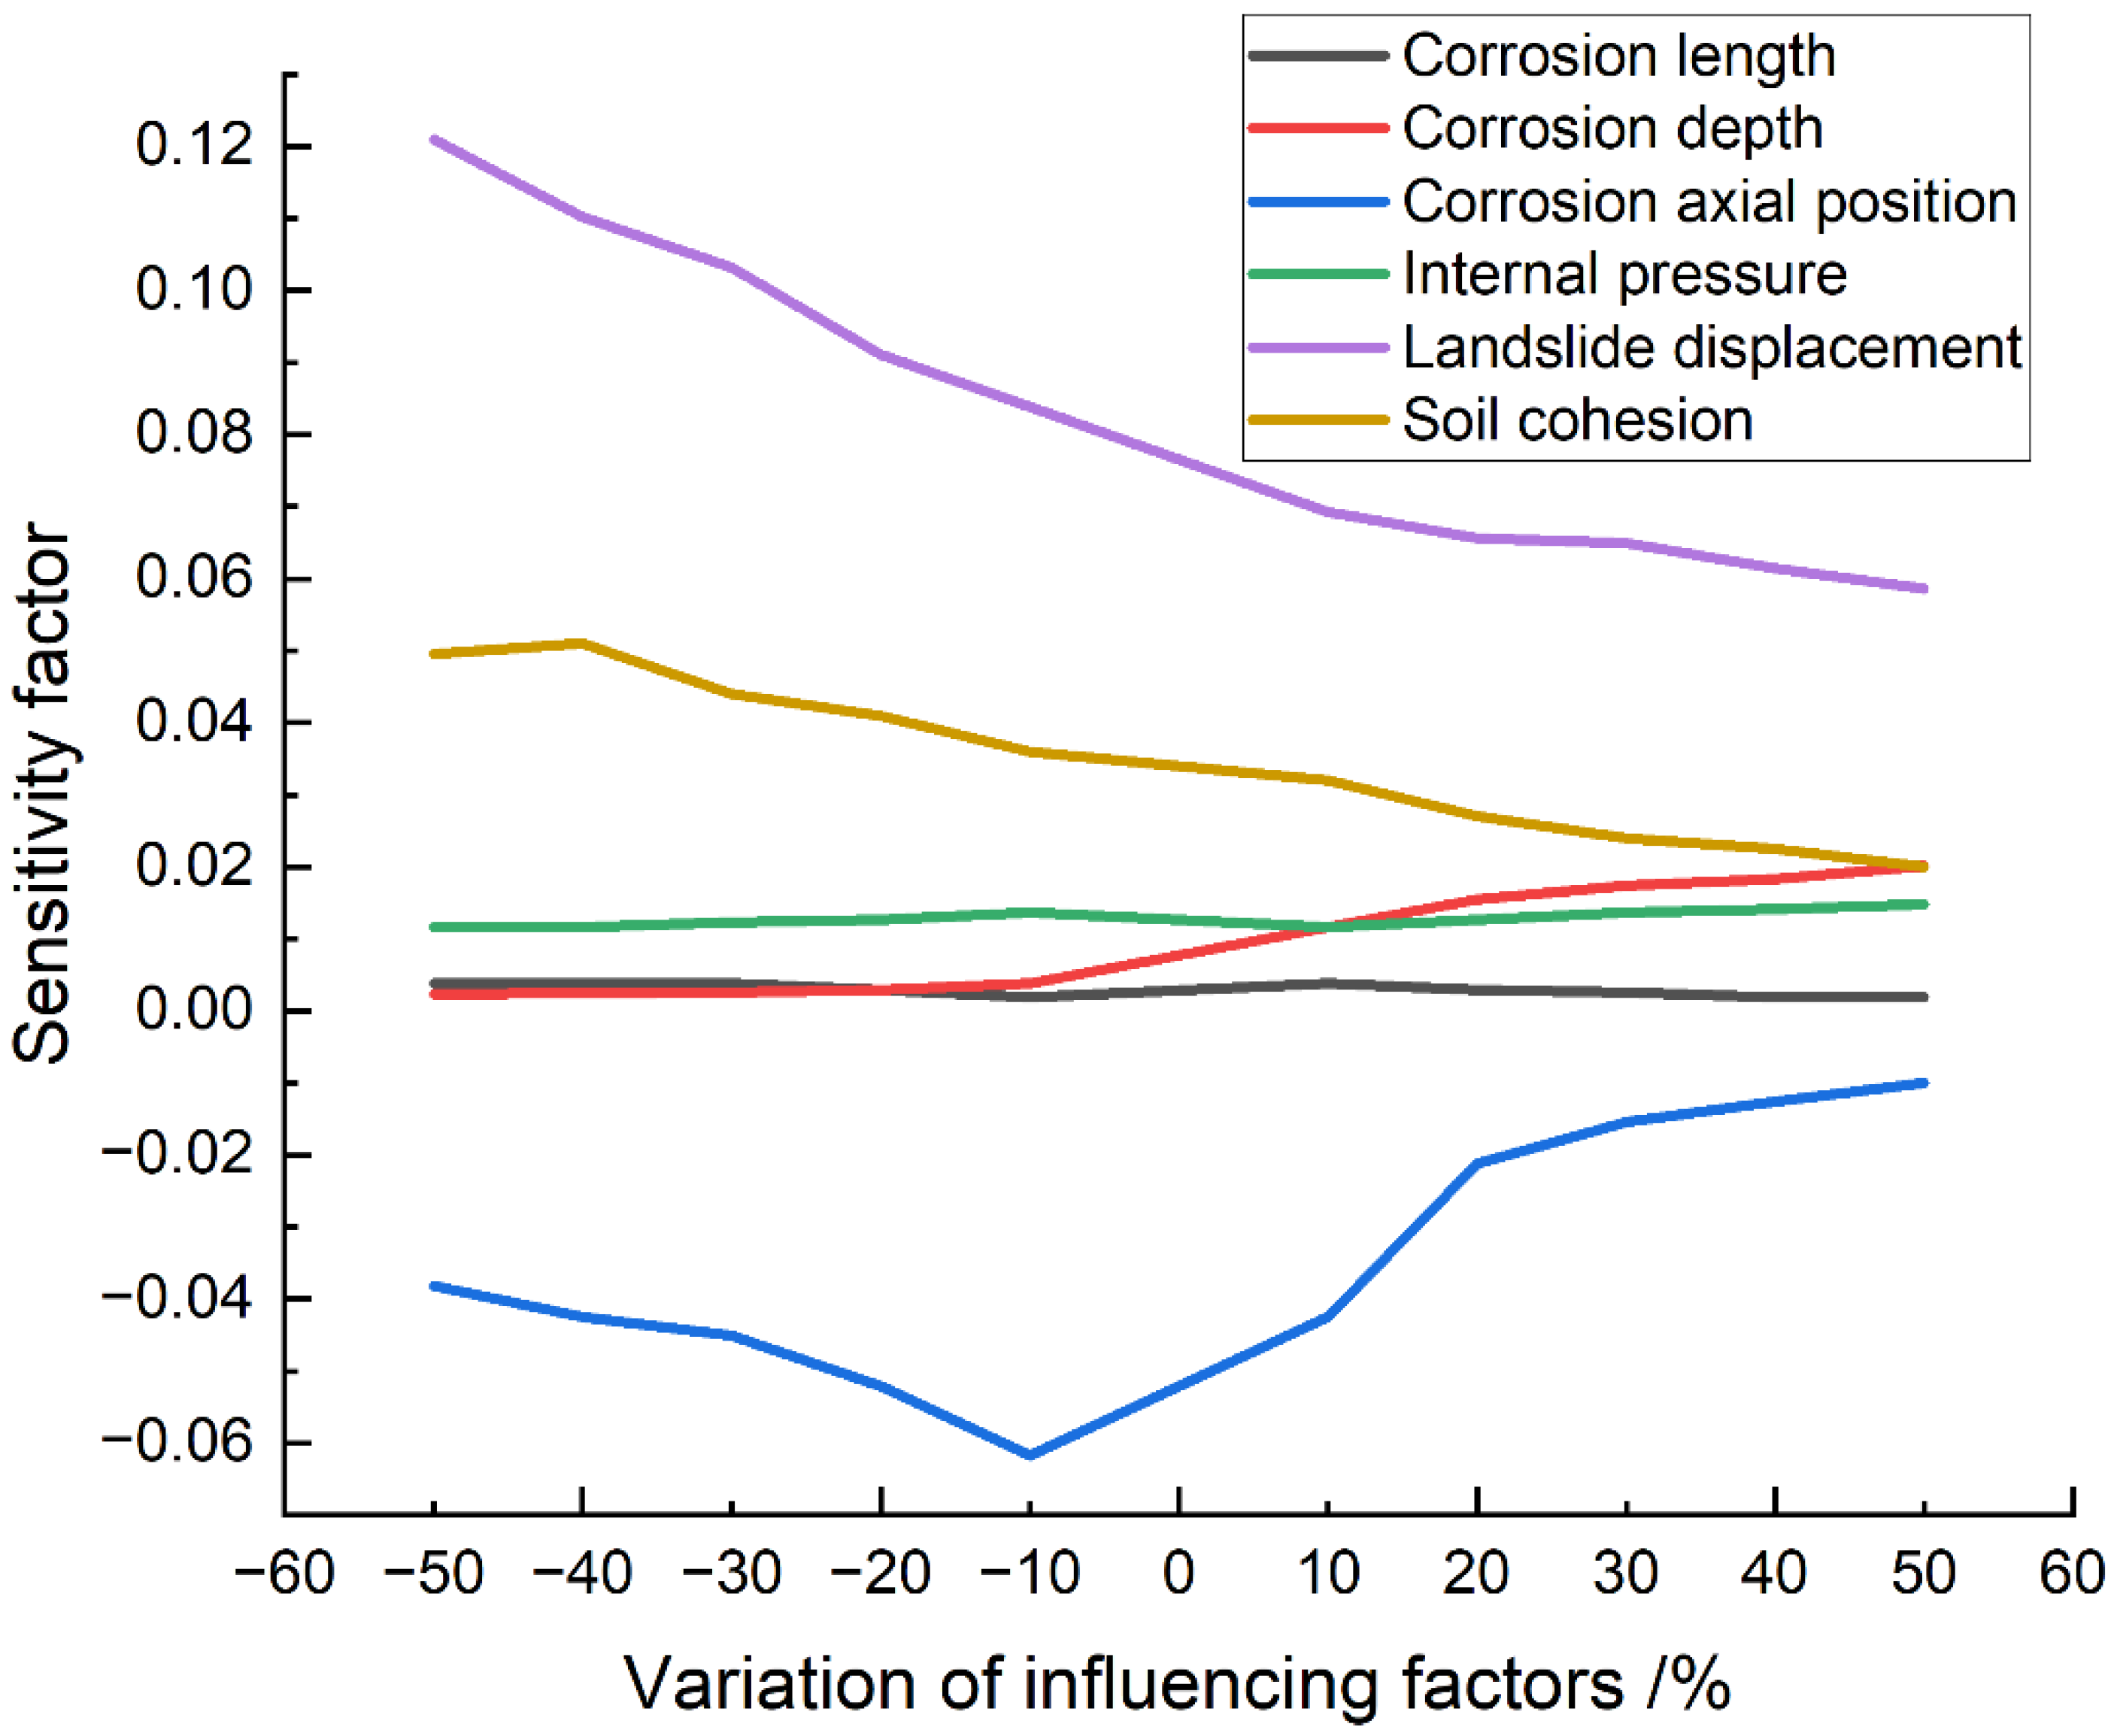
  • Based on the sensitivity coefficient equation (Equation (9)), the variations of influencing factors and stress (Table 4) were substituted for calculation. Consequently, the sensitivity coefficient values of all influencing factors were obtained as presented in Table 11, and the variation plot of sensitivity coefficients is depicted in Figure 13.
The stress of the gas transmission pipeline with corrosion defects under landslide conditions were analyzed according to the variations in sensitivity with regard to the influencing factors, as presented in Table 11 and Figure 13. The details are given below:
  • Corrosion length
    The sensitivity coefficient of the pipeline stress under defect length initially decreased, but subsequently increased with the corrosion length. In particular, the sensitivity coefficient varied from 0.0019 to 0.0039, thereby implying minimal influence of the increasing corrosion length on the stress of the gas transmission pipeline.
  • Corrosion depth
    The sensitivity coefficient of the pipeline stress with respect to defect depth increased with the corrosion defect depth. Particularly, the sensitivity coefficient ranged from 0.0023 to 0.0201, indicating the influence of the defect depth on increasing the stress in the gas transmission pipeline, but the promoting trend was not prominent.
  • Corrosion axial position
    As the axial position of corrosion was situated farther away from the center of the landslide, the sensitivity coefficient of pipeline stress to the axial position of corrosion decreased at first but subsequently increased, and the variations in sensitivity coefficient ranged from −0.0618 to −0.0100.
  • Internal pressure
    With the continuous increase in pipeline internal pressure, the sensitivity coefficient of pipeline stress initially increased, then decreased, before finally increasing again. The sensitivity coefficient varied from 0.0117 to 0.0148, suggesting less influence of pressure in the pipeline on the stress of the gas transmission pipeline.
  • Landslide displacement
    With the increasing landslide displacement, the sensitivity coefficient of the pipeline stress reduced with respect to landslide displacement. The sensitivity coefficient varied from 0.0587 to 0.1210, indicating that the influence of displacement evidently reduced the influence on the stress of the gas transmission pipeline.
  • Soil cohesion
    As the soil cohesion increased, the sensitivity coefficient of pipeline stress with respect to soil cohesion decreased. Specifically, the sensitivity coefficient varied from 0.0510 to 0.0200, indicating the diminishing influence of soil cohesion on pipeline stress.
    According to the above analysis based on the calculation results of sensitivity coefficients, the descending order of sensitivity coefficient for each influencing factor can be stated as follows: landslide displacement, corrosion axial position, soil cohesion, corrosion depth, internal pressure, and corrosion length.

4.2. Protection and Treatment of Landslide Pipeline

As discussed in Section 4.2, landslide displacement poses the greatest impact on defective pipelines. Therefore, to design and select the pipeline route, first, the regions prone to geological disasters and those with greater hazards must be avoided. For unavoidable cases, targeted prevention and control measures must be implemented to eliminate hidden dangers [35]. To prevent and control landslide disasters, comprehensive prevention and control measures are required in combination with treatment and monitoring. Accordingly, the techniques of slope cutting and slope protection should be adopted to reduce the weight of soil at the back end of landslide mass. The soil in the sliding section is pressurized at the slope toe of the anti-sliding section, and the anti-sliding force increased with the weight of the anti-sliding section. Subsequently, intercepting and drainage ditches should be constructed to avoid the accumulation of surface water on the slope surface of the landslide section along with the discharge of surface water adjacent to the slope in the vicinity of the landslide. Thus, anti-slide piles must be constructed adjacent to the pipeline and retaining walls must be set to support the landslide mass. Ultimately, the landslide mass should be monitored for warnings and alerts.
In addition to landslide, the axial position of corrosion defects posed the most significant impact on the pipeline. Therefore, pipeline anticorrosion work must be conducted appropriately in addition to the protective measures against landslides. More importantly, the pipeline situated at positions prone to landslide require more anticorrosion measures than the pipeline at the general position. For instance, pipes with strong corrosion resistance reasonably use anti-corrosion coating and apply cathodic protection technology. If it is impossible to implement avoidance measures in landslide areas including potentially unstable slope areas, selected pipelines must be employed to improve the performance and increase the ability of pipelines to withstand landslide disasters.

5. Conclusions

In this study, to determine the maximum von Mises stress of the pipeline under various influencing factors, a finite element model of gas transmission pipelines was developed with corrosion defects under the action of landslide. In addition, the single-factor sensitivity analysis method was employed to analyze the influencing factors, and the following conclusions were obtained.
  • The effect of corrosion defect length on maximum von Mises stress was not significant within a certain range. When the defect depth exceeded 10 mm, the threat to the safe operation of the pipeline increased. The closer the corrosion defect is to the center of the landslide, the more easily the pipeline is damaged.
  • Excluding the axial position of corrosion defects, all influencing factors were positively correlated to the stress inside the gas transmission pipeline with corrosion defects during a landslide.
  • Based on the calculation results of sensitivity coefficients under the conditions set in this study, the sensitivity coefficients of corrosion defect length, corrosion defect depth, corrosion defect axial position, internal pressure, landslide displacement, and soil cohesion were 0.002, 0.0181, 0.0518, 0.0031, 0.0623, and 0.031, respectively. The descending order of the sensitivity coefficient for each influencing factor is as follows: landslide displacement, corrosion axial position, soil cohesion, corrosion depth, internal pressure, and corrosion length.
  • Sensitivity analyses of each influencing factor of corroded defective gas transmission pipelines under a landslide were carried out to provide theoretical references for the design and prevention of pipeline engineering in landslide areas.
  • Considering the optimization of calculation and cost saving, the model was simplified appropriately. This paper focused on the study of single corrosion defects without considering fluid-structure interaction and multiple corrosion defects.

Author Contributions

Conceptualization, X.G., Y.Z. and Y.Q.; methodology, X.G., Y.Z., C.H., X.L. and H.Z.; software, X.G., Y.Z., H.Z. and R.Z.; validation, C.H., X.L., R.Z. and Y.Q.; formal analysis, X.G. and Y.Z.; data curation, X.G. and H.Z.; writing—original draft preparation, X.G., Y.Z., C.H. and X.L.; writing—review and editing, X.G., Y.Z., C.H., X.L. and H.Z.; visualization, X.G., Y.Z., C.H., X.L. and R.Z.; project administration, X.G.; funding acquisition, X.G. All authors have read and agreed to the published version of the manuscript.

Funding

This research was funded by China Petroleum Science & Technology Innovation Fund, grant number 2017D-5007-0606.

Data Availability Statement

We acknowledge source data from the literature “Stress Analysis of Buried Pipeline Subjected to Landslide. Gas & Heat (2014), 34(12): 11–16.” [34], published by Jiao, Z.L.; Gu, H.W.; Guo, J.; and Liu, Y.

Conflicts of Interest

The authors declare no conflict of interest.

References

  1. Li, M. Mechanical Characteristics Analysis of Crossing Soil Landslide Steel Pipeline and Anti-Slide Pile Reinforcement. Master’s Thesis, University of Jinan, Jinan, China, 2021. [Google Scholar]
  2. Wang, P.; Jiang, Y.L.; Liu, Y.J. Management and practice of geological disaster prevention and control project of China My-anmar oil and gas pipeline (Myanmar section). China Pet. Chem. Std. Qual. 2021, 41, 92–94. [Google Scholar]
  3. He, W.; Li, H.; Jia, L.; Li, S.; Yao, G. Deformation monitoring and mechanism analysis on landslide along China–Myanmar Natural Gas Pipeline: Case of Shazi Town Landslide in west of Guizhou Province. Yangtze River 2020, 51, 138–143. [Google Scholar]
  4. Shin, S.; Lee, G.; Ahmed, U.; Lee, Y.; Na, J.; Han, C. Risk-based underground pipeline safety management considering corrosion effect. J. Hazard. Mater. 2018, 342, 279–289. [Google Scholar] [CrossRef]
  5. Totlani, M.K.; Athavale, S.N. Electroless nickel for corrosion control in chemical, oil and gas industries. Corros. Rev. 2000, 18, 155–180. [Google Scholar] [CrossRef]
  6. Qin, C.; Li, J.; Yan, M.; Yu, J. Analysis of failure probability of urban underground gas pipelines under corrosion effect. Nat. Gas Ind. 2015, 35, 85–89. [Google Scholar] [CrossRef]
  7. Cui, K.; Yan, M.; Wang, X.; Li, M. Corrosion defect assessment and maintenance decision-making of a gas transmission pipeline. Corros. Prot. 2019, 40, 682–686+691. [Google Scholar]
  8. Yang, Y.; Gu, X.; Zhang, X.; Cao, P.; Xang, X.; Li, H. Study on residual strength of high-grade X100 gas pipeline with double point corrosion defects. Corros. Prot. 2021, 42, 48–53. [Google Scholar]
  9. Chen, P.W.; Wang, F.H.; Wang, S.M. Analysis of residual strength of X70 pipeline steel with corrosion defects. Corros. Prot. 2011, 32, 150–152. [Google Scholar]
  10. Zhao, B.; Li, Z.; Gao, C.; Tang, Y. Identification of Complex Fluid Properties in Condensate Gas Reservoirs Based on Gas–Oil Ratio Parameters Calculated by Optimization Mathematical Model. Front. Energy Res. 2022, 10, 863776. [Google Scholar] [CrossRef]
  11. Wang, X.; Liu, Y.; Hou, J.; Li, S.; Kang, Q.; Sun, S.; Ji, L.; Sun, J.; Ma, R. The relationship between synsedimentary fault activity and reservoir quality—A case study of the Ek1 formation in the Wang Guantun area, China. Interpretation 2020, 8, SM15–SM24. [Google Scholar] [CrossRef]
  12. Wang, X.; Zhou, X.; Li, S.; Zhang, N.; Ji, L.; Lu, H. Mechanism Study of Hydrocarbon Differential Distribution Controlled by the Activity of Growing Faults in Faulted Basins: Case Study of Paleogene in the Wang Guantun Area, Bohai Bay Basin, China. Lithosphere 2022, 2021, 7115985. [Google Scholar] [CrossRef]
  13. Wang, X.; Hou, J.; Li, S.; Dou, L.; Song, S.; Kang, Q.; Wang, D. Insight into the nanoscale pore structure of organic-rich shales in the Bakken Formation, USA. J. Pet. Sci. Eng. 2020, 191, 107182. [Google Scholar] [CrossRef]
  14. Rajani, B.B.; Robertson, P.K.; Morgenstern, N.R. Simplified design methods for pipelines subject to transverse and longitudinal soil movements. Can. Geotech. J. 1995, 32, 309–323. [Google Scholar] [CrossRef]
  15. O’Rourke, M.J.; Liu, X.J.; Flores-Berrones, R. Steel Pipe Wrinkling due to Longitudinal Permanent Ground Deformation. J. Transp. Eng. 1995, 121, 443–451. [Google Scholar] [CrossRef]
  16. Zhang, J.; Liang, Z.; Han, C. Mechanical Behavior Analysis of the Buried Steel Pipeline Crossing Landslide Area. J. Press. Vessel Technol. 2016, 138, 051702. [Google Scholar] [CrossRef]
  17. Zhang, S.-Z.; Li, S.-Y.; Chen, S.-N.; Wu, Z.-Z.; Wang, R.-J.; Duo, Y.-Q. Stress analysis on large-diameter buried gas pipelines under catastrophic landslides. Pet. Sci. 2017, 14, 579–585. [Google Scholar] [CrossRef]
  18. Zhao, Z.C.; Ao, B.; Luo, Z.; Xia, M. Study on stress of shallow landslide on natural gas pipeline oil–gas field. Surf. Eng. 2020, 39, 35–40. [Google Scholar]
  19. Katebi, M.; Maghoul, P.; Blatz, J. Numerical analysis of pipeline response to slow landslides: Case study. Can. Geotech. J. 2019, 56, 1779–1788. [Google Scholar] [CrossRef]
  20. Liang, Z.; Yang, Q.; Zhang, J.; Zhu, B. Mechanical Analysis of Buried Polyethylene Pipelines under Ground Overload. J. Fail. Anal. Prev. 2019, 19, 193–203. [Google Scholar] [CrossRef]
  21. Zang, X.; Gu, X.; Wang, Q.; Cao, P. Study on finite element model of buried pipeline impacted by deep circular arc landslide. Energy Chem. Ind. 2020, 41, 65–70. [Google Scholar]
  22. Cao, P.; Gu, X.; Zang, X.; Lian, H.; Mou, W.; Guo, Y. Effect of lateral landslide in frozen soil area on strain of the buried pipeline. China Petro. Mach. 2020, 48, 141–146. [Google Scholar]
  23. Ahammed, M.; Melchers, R.E. Reliability estimation of pressurised pipelines subject to localised corrosion defects. Int. J. Press. Vessel. Pip. 1996, 69, 267–272. [Google Scholar] [CrossRef]
  24. Chen, Y.; Zhang, H.; Zhang, J.; Liu, X.; Li, X.; Zhou, J. Failure assessment of X80 pipeline with interacting corrosion defects. Eng. Fail. Anal. 2015, 47, 67–76. [Google Scholar] [CrossRef]
  25. Sun, M.; Li, X.; Liu, J. Determination of Folias Factor for Failure Pressure of Corroded Pipeline. J. Press. Vessel Technol. 2020, 142, 031802. [Google Scholar] [CrossRef]
  26. Cui, M.; Cao, X. Impact of corrosion defects on failure pressure of medium-high strength oil-gas pipelines. Acta Pet. Sin. 2012, 33, 1086–1092. [Google Scholar] [CrossRef]
  27. Shuai, J.; Zhang, C.; Chen, F. Prediction of failure pressure in corroded pipelines based on non-linear finite element analysis. Acta Pet. Sin. 2008, 29, 933–937. [Google Scholar] [CrossRef]
  28. Zhou, R.; Gu, X.; Bi, S.; Wang, J. Finite element analysis of the failure of high-strength steel pipelines containing group corrosion defects. Eng. Fail. Anal. 2022, 136, 106203. [Google Scholar] [CrossRef]
  29. Xu, P.F. Research on Residual Strength Evaluation Technology of Gas Pipeline Containing Volume Defects under Landslide. Master’s Thesis, Southwest Petroleum University, Chengdu, China, 2018. [Google Scholar]
  30. Yang, H.Y. Study on the Interaction between the Natural Gas Pipeline and Landslide and the Safety Assessment Model. Master’s Thesis, Chengdu University of Technology, Chengdu, China, 2020. [Google Scholar]
  31. Cocchetti, G.; Di Prisco, C.P.; Galli, A. Soil–pipeline interaction along unstable slopes: A coupled three-dimensional approach. Part 2: Numerical analyses. Can. Geotech. J. 2009, 46, 1289–1304. [Google Scholar] [CrossRef]
  32. Huang, L.; Sheng, Y.; Hu, X.; Wang, S. Interactions between the pipeline and soils in permafrost regions: A review. J. Glaciol. Geocryol. 2017, 39, 112–122. [Google Scholar] [CrossRef]
  33. Zhang, J.M.; Qu, G.Z.; Jin, H.J. Estimates on thermal effects of the China–Russia crude oil pipeline in permafrost regions. Cold Reg. Sci. Technol. 2010, 64, 243–247. [Google Scholar] [CrossRef]
  34. Jiao, Z.; Gu, H.; Guo, J.; Liu, Y. Stress analysis of buried pipeline subjected to landslide. Gas Heat 2014, 34, 11–16. [Google Scholar]
  35. Liu, Y.J.; Cao, W.M. Analysis and prevention of landslide in Ruokai mountain area of China Myanmar oil and gas pipeline. Metall. Mater. 2021, 41, 175–176. [Google Scholar]
Figure 1. Lateral landslide pipe force diagram.
Energies 15 06640 g001
Figure 2. Schematic illustration of soil model.
Energies 15 06640 g002
Figure 3. Three-dimensional view of landslide model.
Energies 15 06640 g003
Figure 4. True stress–strain curve of X80 steel.
Energies 15 06640 g004
Figure 5. Schematic illustration of mesh division.
Energies 15 06640 g005
Figure 6. Displacement cloud map of soil mass.
Energies 15 06640 g006
Figure 7. Displacement cloud map of pipeline.
Energies 15 06640 g007
Figure 8. Stress nephogram of buried pipeline.
Energies 15 06640 g008
Figure 9. Schematic illustration of pipeline model verification.
Energies 15 06640 g009
Figure 10. Schematic illustration of corroded pipe.
Energies 15 06640 g010
Figure 11. Corrosion defect pipeline model and grid diagram.
Energies 15 06640 g011
Figure 12. Sensitivity analysis of influencing factors.
Energies 15 06640 g012
Figure 13. Variation diagram of sensitivity coefficient.
Energies 15 06640 g013
Table 1. Relevant parameters of lateral landslide soil.
ParameterDensity
ρ, kg·m−3
Poisson’s Ratio
ν
Elastic Modulus
E, MPa
Internal Friction Angle
ψ, °
Soil Cohesion
c, kPa
Friction Coefficient
Μ
Landslide1.900 × 1030.42020200.4
Soil bedrock2.040 × 1030.3532.5---
ψ: Internal friction angle, dip angle of shear strength line in σ–τ coordinate plane; Μ: Friction coefficient, ratio of frictional force between two surfaces to vertical force acting on one surface; ν: Poisson’s ratio, ratio of transverse and axial normal strains of a material under unidirectional tension or compression; c: Soil cohesion, attraction between adjacent parts of the same substance, kPa; E: Elastic modulus, its stress and stress should become directly proportional during the elastic deformation stage of a material, MPa.
Table 2. Basic parameters of pipeline model.
PipePipe Diameter
D, mm
Wall Thickness
t, mm
Density
ρ, kg·m−3
Elastic Modulus
E, MPa
Poisson’s Ratio
ν
Pressure
P, MPa
Minimum
Yield Pressure
SMYS, MPa
X801016227800206,0000.310530
Table 3. Reference values of sensitivity analysis.
Influence FactorDefect Length
L, mm
Defect Depth d, mmAxial Position of Defect
z, m
Internal Pressure of Pipeline
P, MPa
Landslide Displacement
S, m
Soil Cohesion
c, KPa
Reference value4001058220
Table 4. Summary of maximum von Mises stress of pipeline (MPa).
Variation of Influencing Parameters (%)L, mm σ max D, mm σ max Z, m σ max P, MPa σ max S, m σ max c, KPa σ max
−50200516.35516.82.5528.14.0511.01.0515.710487.7
−40240516.56516.93.0527.04.8511.61.2524.712489.9
−30280516.77517.03.5525.25.6512.11.4531.914493.5
−20320517.08517.14.0523.66.4512.71.6538.916496.0
−10360517.29517.24.5521.47.2513.31.8544.318498.3
10400517.310517.45.0518.28.0514.02.0548.920500.1
20440517.511518.05.5516.08.8514.62.2552.722501.7
30480517.612519.06.0516.09.6515.32.4556.124502.8
40520517.713520.16.5515.810.4516.12.6559.626503.7
50560517.714521.27.0515.611.2516.92.8562.428504.6
−50600517.815522.67.5515.612.0517.83.0565.030505.1
Table 5. Model parameters for varying defect length.
Influence FactorDefect Length
L, mm
Defect Depth
d, mm
Axial Position
of Defect
z, m
Internal Pressure of Pipeline
P, MPa
Landslide Displacement
S, m
Soil Cohesion
c, KPa
Reference value−50% D–50% D1058220
Table 6. Model parameters for varying defect depth.
Influence FactorDefect Length
L, mm
Defect Depth
d, mm
Axial Position
of Defect
z, m
Internal Pressure of Pipeline
P, MPa
Landslide Displacement
S, m
Soil Cohesion
c, KPa
Reference value400−50% t–50% t58220
Table 7. Model parameters for varying axial position of defect.
Influence FactorDefect Length
L, mm
Defect Depth
d, mm
Axial Position
of Defect
z, m
Internal Pressure of Pipeline
P, MPa
Landslide Displacement
S, m
Soil Cohesion
c, KPa
Reference value40010−50% z–50% z8220
Table 8. Model parameters for varying internal pipeline pressure.
Influence FactorDefect Length
L, mm
Defect Depth
d, mm
Axial Position
of Defect
z, m
Internal Pressure of Pipeline
P, MPa
Landslide Displacement
S, m
Soil Cohesion
c, KPa
Reference value400105−50% P–50% P220
Table 9. Model parameters for varying landslide displacement.
Influence FactorDefect Length
L, mm
Defect Depth
d, mm
Axial Position
of Defect
z, m
Internal Pressure of Pipeline
P, MPa
Landslide Displacement
S, m
Soil Cohesion
c, KPa
Reference value4001058−50% S–50% S20
Table 10. Model parameters for varying soil cohesion.
Influence FactorDefect Length
L, mm
Defect Depth
d, mm
Axial Position
of Defect
z, m
Internal Pressure of Pipeline
P, MPa
Landslide Displacement
S, m
Soil Cohesion
c, KPa
Reference value40010582−50% c–50% c
Table 11. Sensitivity coefficients for various influencing factors.
Variation of Influencing Parameters, %Corrosion LengthCorrosion DepthCorrosion Axial PositionInternal PressureDisplacementSoil Cohesion
−500.00390.0023−0.03820.01170.12100.0496
−400.00390.0024−0.04250.01170.11020.0510
−300.00390.0026−0.04500.01230.10320.0440
−200.00290.0029−0.05210.01260.09110.0410
−100.00190.0039−0.06180.01360.08380.0360
100.00390.0116−0.04250.01170.06920.0320
200.00290.0155−0.02120.01260.06560.0270
300.00260.0174−0.01540.01360.06500.0240
400.00190.0184−0.01250.01410.06150.0225
500.00190.0201−0.01000.01480.05870.0200
Publisher’s Note: MDPI stays neutral with regard to jurisdictional claims in published maps and institutional affiliations.

