1. Introduction
In recent years, the frequent occurrence of ultra-high voltage (UHV) reactor defects has adversely affected the reliability of the power grid [
1,
2]. Researchers developed a variety of on-line monitoring methods to avoid sudden accidents. For equipment with windings such as reactors and transformers [
3,
4,
5,
6], devices and diagnosis research based on oil chromatography, ultrasound, vibration, pulse current, fluorescent optical fiber et al. have been carried out [
7,
8,
9,
10].
Scholars carried out extensive research on defect diagnosis based on state information. Aiming at defect diagnosis of high voltage shunt reactors, H. Ma proposed a feature extraction and fault pattern recognition method focusing on transformer vibration signal. Based on empirical wavelet transform (EWT) and multi-scale mathematical morphological spectrum, the feature of transformer vibration signal is extracted. The kernel k-means clustering algorithm is used for fault pattern recognition [
11,
12]. Focusing on information of oil chromatography, T. Kari studied the transformer fault diagnosis algorithm based on the support vector machine [
13]. J. Dai used deep belief network to analyze oil chromatographic data [
14]. Y. Zhang proposed an algorithm combined with AdaBoost and cost-sensitive methods [
15]. Jawad Faiz et al. combined neural network and chaos algorithm to analyze oil chromatographic data. The researchers above have achieved good results [
16]. A method based on partial discharge phase distribution (PRPD) statistical characteristics and particle swarm optimization–support vector machine (PSO-SVM) was proposed to analyze the PD data of laboratory artificial defect models. The results also showed that this method effectively removed pulse interference and obtained oilpaper-insulated multi-partial discharge power pulses [
17]. Although the above methods have greatly enhanced the recognition capability, the level of improvement is limited because a single sensor may not be able to obtain enough information, and the fault diagnosis method that relies on data from a single sensor may be missed and misjudged defected. However, different monitoring information sources provide various data structures and even different diagnosis models [
18]. Hence, incorporating all the symptoms in monitoring information is difficult.
To address these challenges, multi-sensor information fusion methods have been applied in the field of transformer fault diagnosis. (i) These include methods such as the fuzzy set and rough set (RS) theories [
19,
20,
21]. However, the descriptions of uncertain information in these methods largely depend on the complete information of the training data. Notably, incomplete and uncertain symptom information in diagnostic tasks (even in fault samples) can result from the limitations of the test conditions, (ii) such as the conditions of deep belief network (DBN) [
22]. However, a high-performance DBN classifier requires a large amount of multi-source training data. Due to the low failure probability of transformers in utilities, few fault samples of power transformers are available [
23], (iii) such as the Dempster–Shafer (DS) evidence theory [
24]. However, when different types of sensors provide conflicting diagnostic results, fusion failure may occur. To solve this problem, weights have been given to each sensor before information fusion [
25]. Nevertheless, the assignment of weight for sensors is quite difficult and not accurate because of the lack of empirical evidence.
In summary, most of the current methods are not capable of addressing the incomplete information in a diagnostic task and discriminating the fault type of transformer by multi-source information is still a big challenge. In addition, there are still some difficult problems in engineering applications: (i) many studies are carried out in laboratories with good electromagnetic environments, which is different from the strong noise environment on the spot. The separation method of noise and signal in the field needs to be further studied. (ii) There are many kinds of noise during the restart stage of the field transformer after shutdown, such as vibration, operating overvoltage, electromagnetism and so on, which are prone to false alarm. (iii) The basic data of the above diagnosis research are mostly obtained from the laboratory model. The amount of field data is small, and the equivalence between the laboratory model and the real defect of the reactor is doubtful. To solve the above problems, this paper proposes an acoustoelectric fusion high voltage reactor acquisition system and defect diagnosis method based on reactor pulse current and ultrasonic detection signal.
Firstly, the envelope peak signal output by the acoustoelectric sensor is used as the basic data for detection to reduce the sampling requirements of the system. Secondly, a data-filling method for missing PD information based on k-nearest neighbors (KNN) is proposed to fill in the missing data. Then, an adaptive noise reduction method is proposed, and a noise threshold calculation method is given for the field operating sensor. Finally, a joint analysis method of acoustic-electrical signals based on correlation significance is established to judge whether a discharge event occurs or not based on correlation significance. The algorithm verification research based on ultra-high voltage (UHV) reaction is carried out, and the results show that this method realizes accurate early warning of the HV reactor based on field data.
2. Framework of Acoustoelectric Joint Detection Method
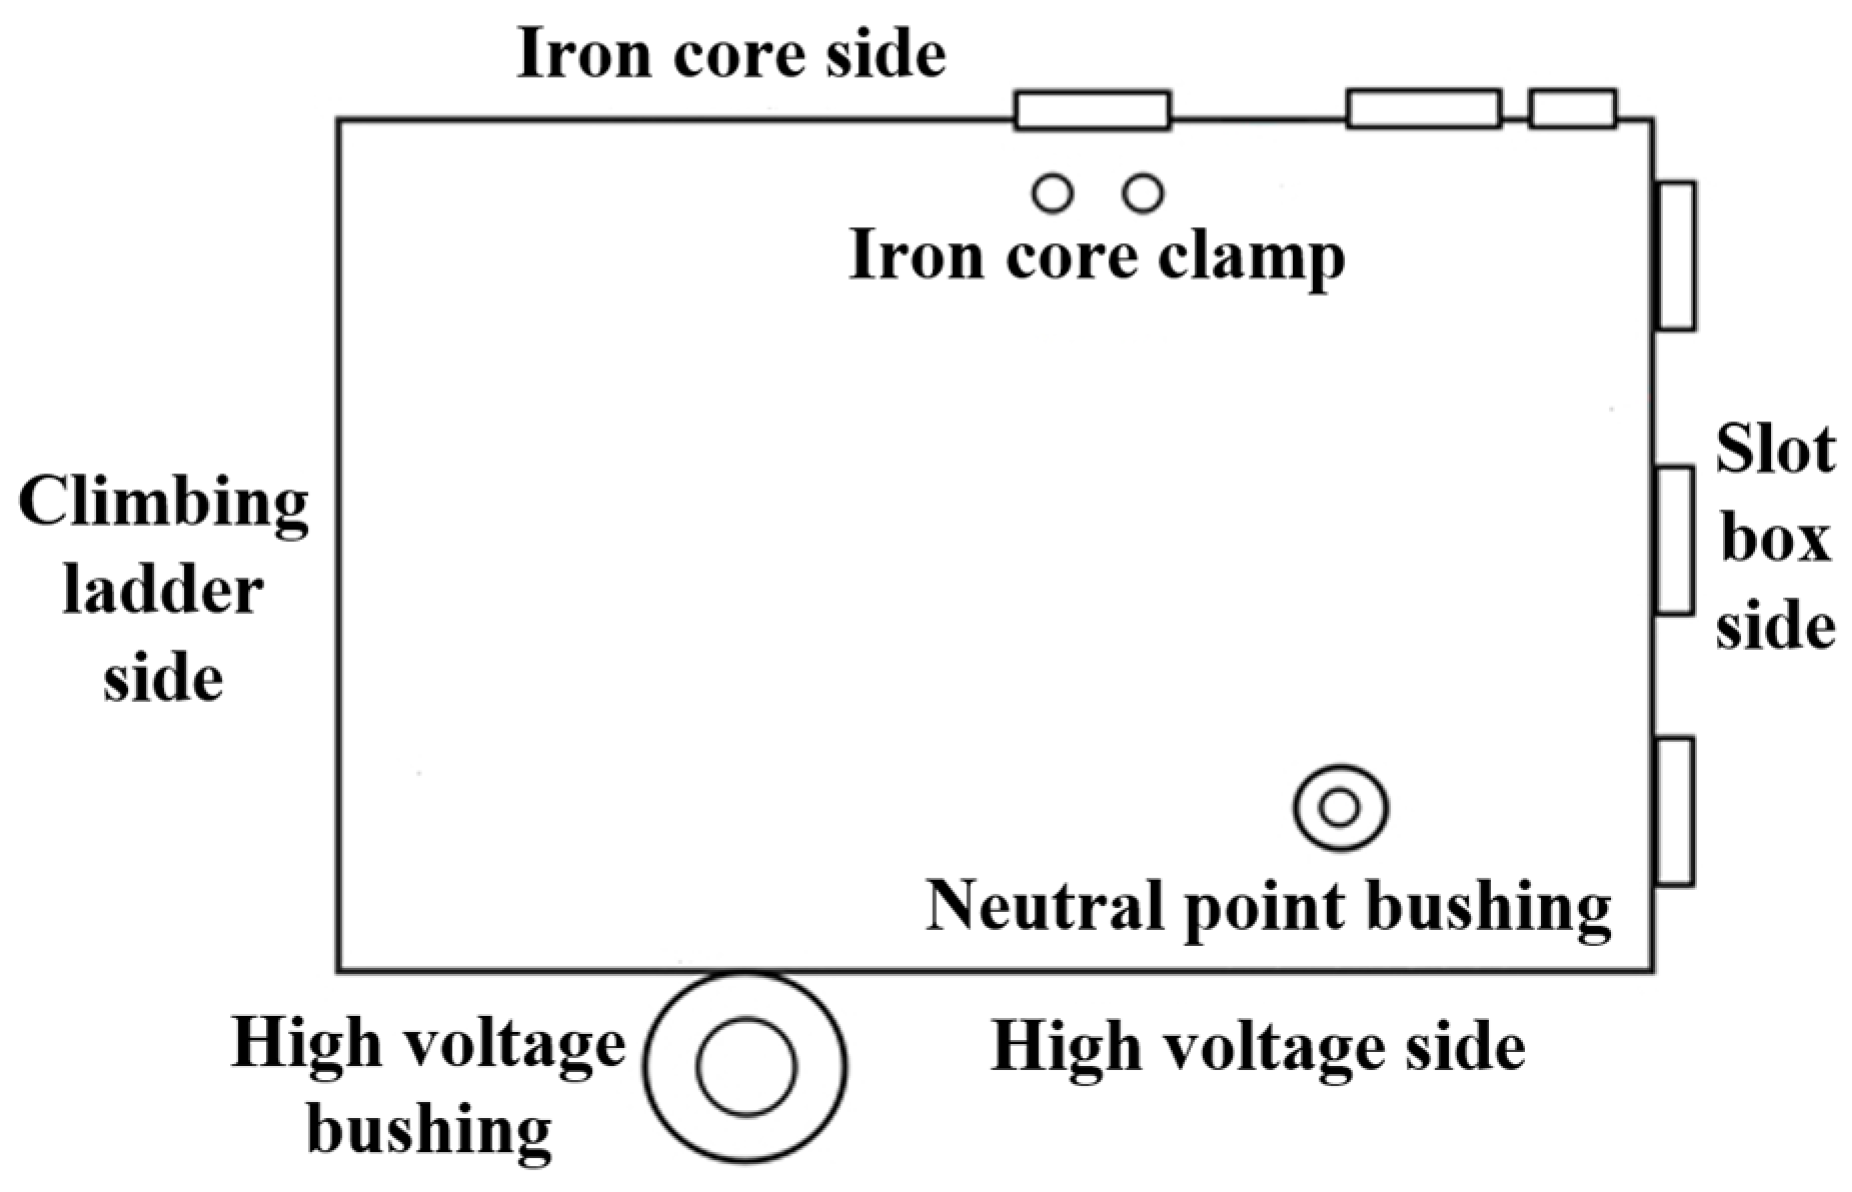
The installation scheme of the acoustoelectric sensor proposed in this paper is shown in
Figure 1. High-frequency pulse current sensors are arranged in the lead-off line of the iron core and the clamp to monitor fault of the transformer. Ultrasonic sensors are arranged on the high voltage side of the transformer, and on the climbing ladder side, the iron core side, the slot box side, and the bushings. The comprehensive monitoring of the high voltage reactor is realized by the arrangement above.
Measurement results are connected to the acquisition device through a coaxial cable. The acoustoelectric fusion defect diagnosis method proposed in this paper is based on the envelope peak signal from the acoustoelectric sensors. The envelope detection method will not be repeated here, please refer to the reference [
26] for description. By the analog circuit data conditioning of envelope detection and numerical comparison, the peak output
Ii (mV) of the pulse current sensors and the peak output
USi (mV) of the ultrasonic sensors are obtained every 15 min, where
i is the sensor number.
A large amount of data collected on the spot reveal problems such as missing data, serious false alarm, poor anti-interference ability and so on, giving a perplexing fault diagnosis.
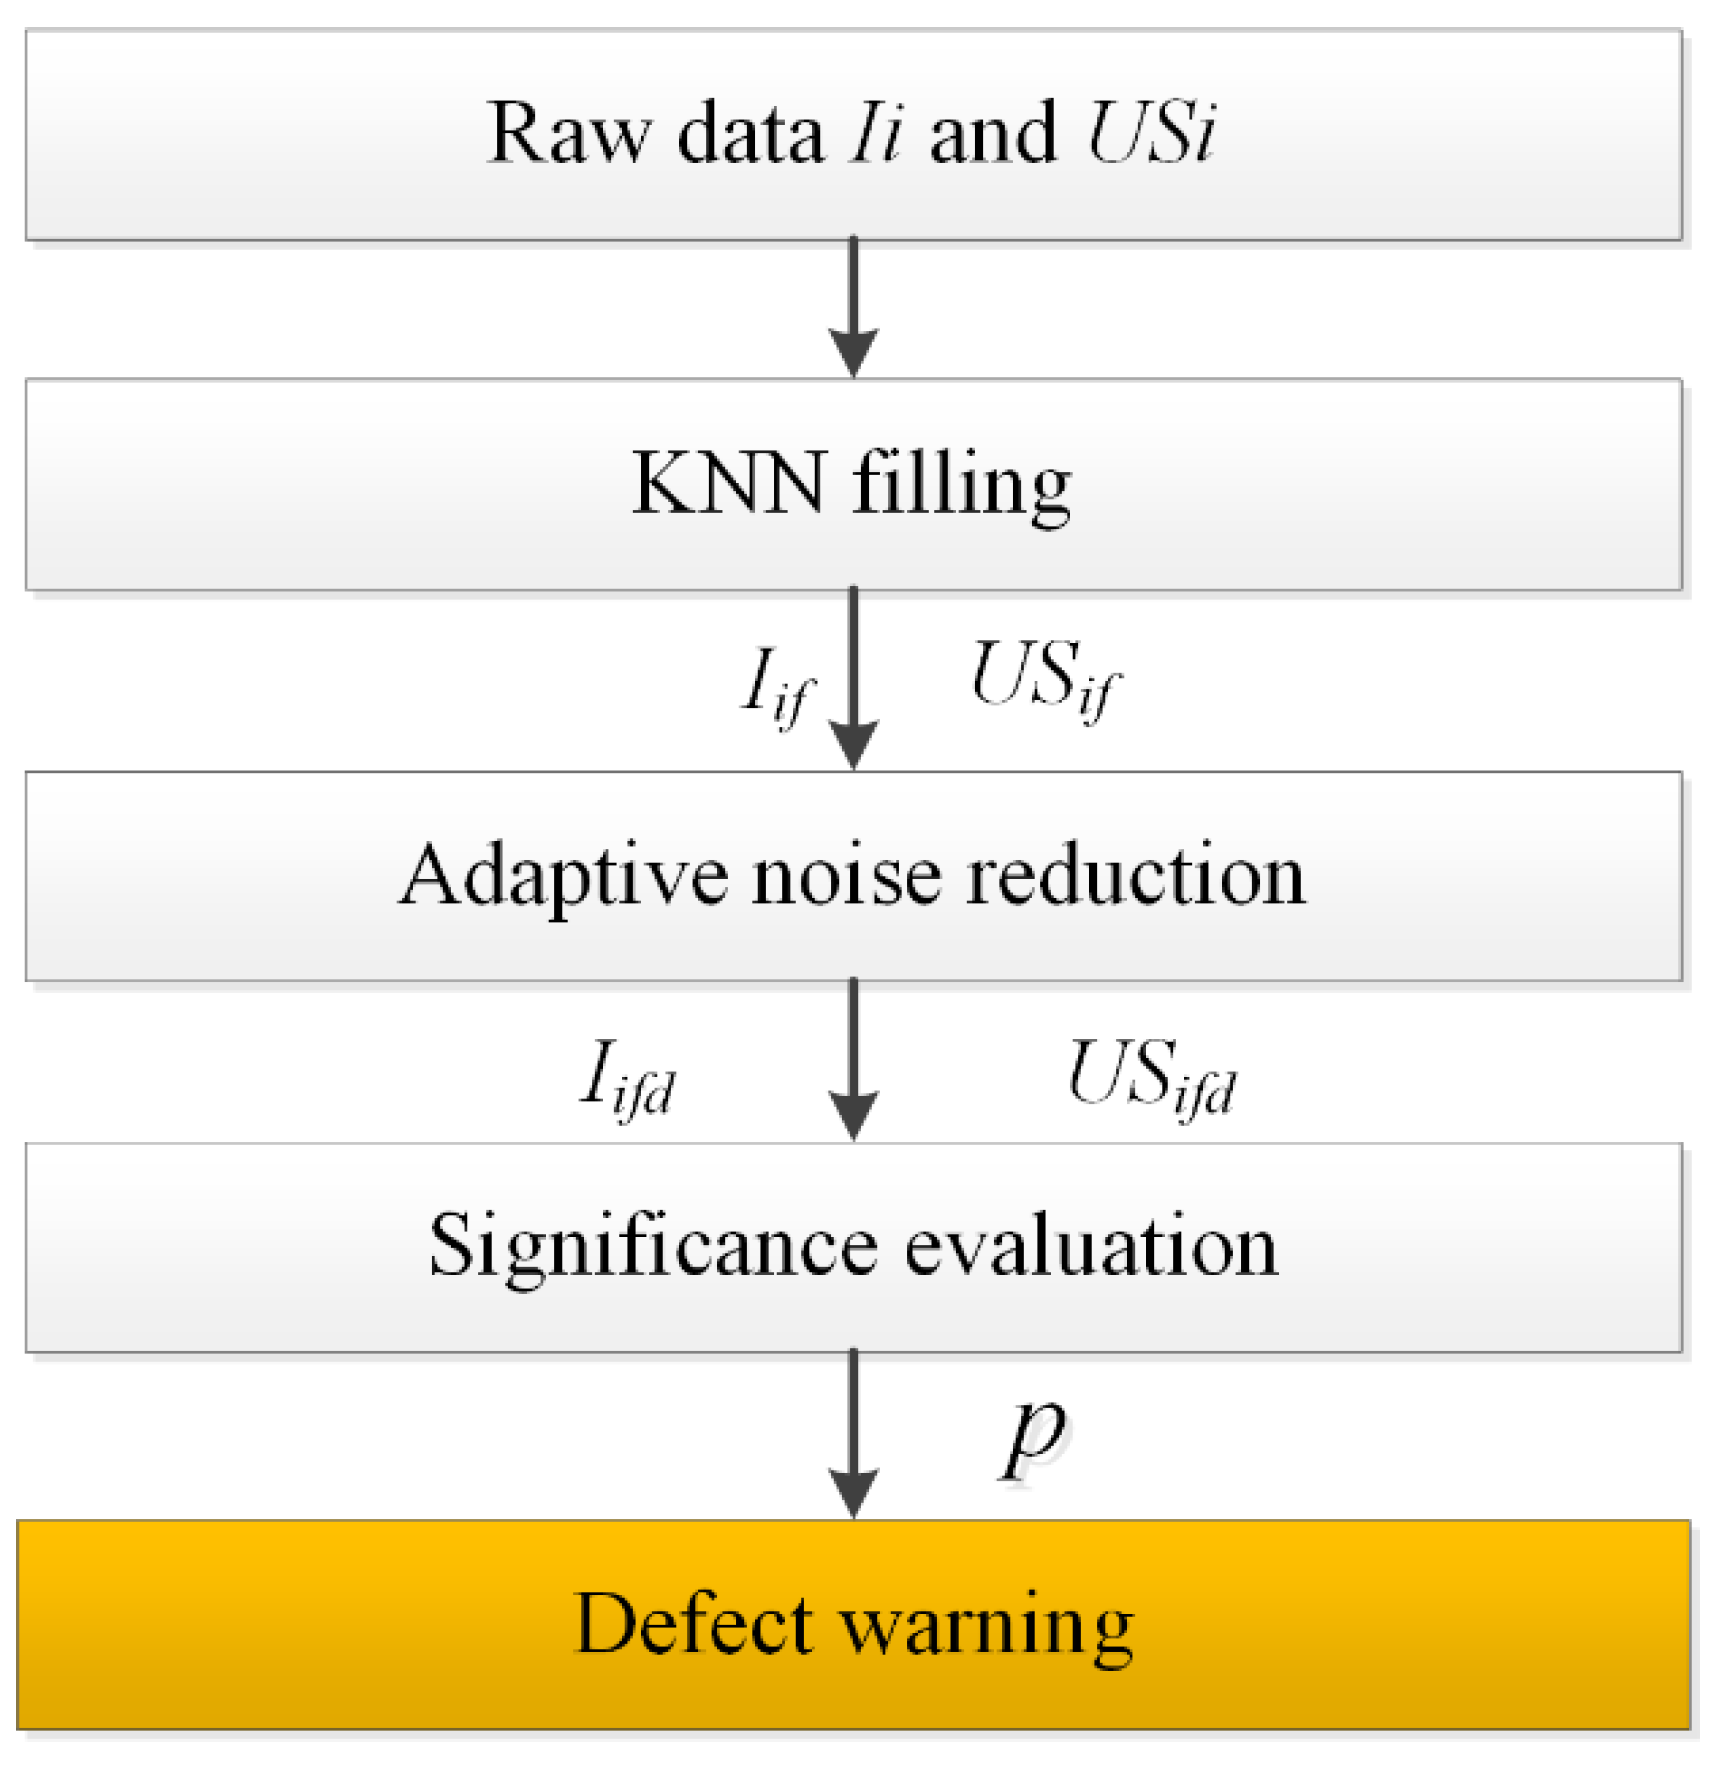
In order to solve the above problems, an acoustoelectric joint detection method is proposed in this study. The specific analysis process architecture is shown in
Figure 2. First, fill missing data based on the k-nearest neighbor (KNN) method; secondly, data reduce the impact of environmental noise through the adaptive noise reduction algorithm; thirdly, they find the PD signal, caused by real defects in the acoustoelectric data joint significance evaluation algorithm.
3. Acoustic–Electric Joint Detection Method
3.1. Missing Data Filling Algorithm
The common filling methods of missing data include 4 categories:
(1) Default value imputation, where a constant is used to substitute the missing values. Afifi and Elashoff [
27] provided a typical approach, which replaced all the missing values by zero or the median of the value range.
(2) Regression imputation, where the missing values of a given variable are replaced by predictions from a regression function of known variables [
28].
(3) Statistical imputation, where the missing values are replaced by a statistically inspired value that has a high likelihood of the true occurrence. Mean imputation is the simplest way of statistical imputation that fills the missing value with the average of non-missing data in the set. Multiple imputation is also a statistical method, which replaces each missing value with the one that achieves the best prediction results from several imputed datasets [
29].
(4) Hot deck imputation, where the missing values are filled by the values obtained from the present complete dataset following certain rules. KNN is a type of hot deck supervised learning method, where missing values are substituted with the values from k-compete data [
30].
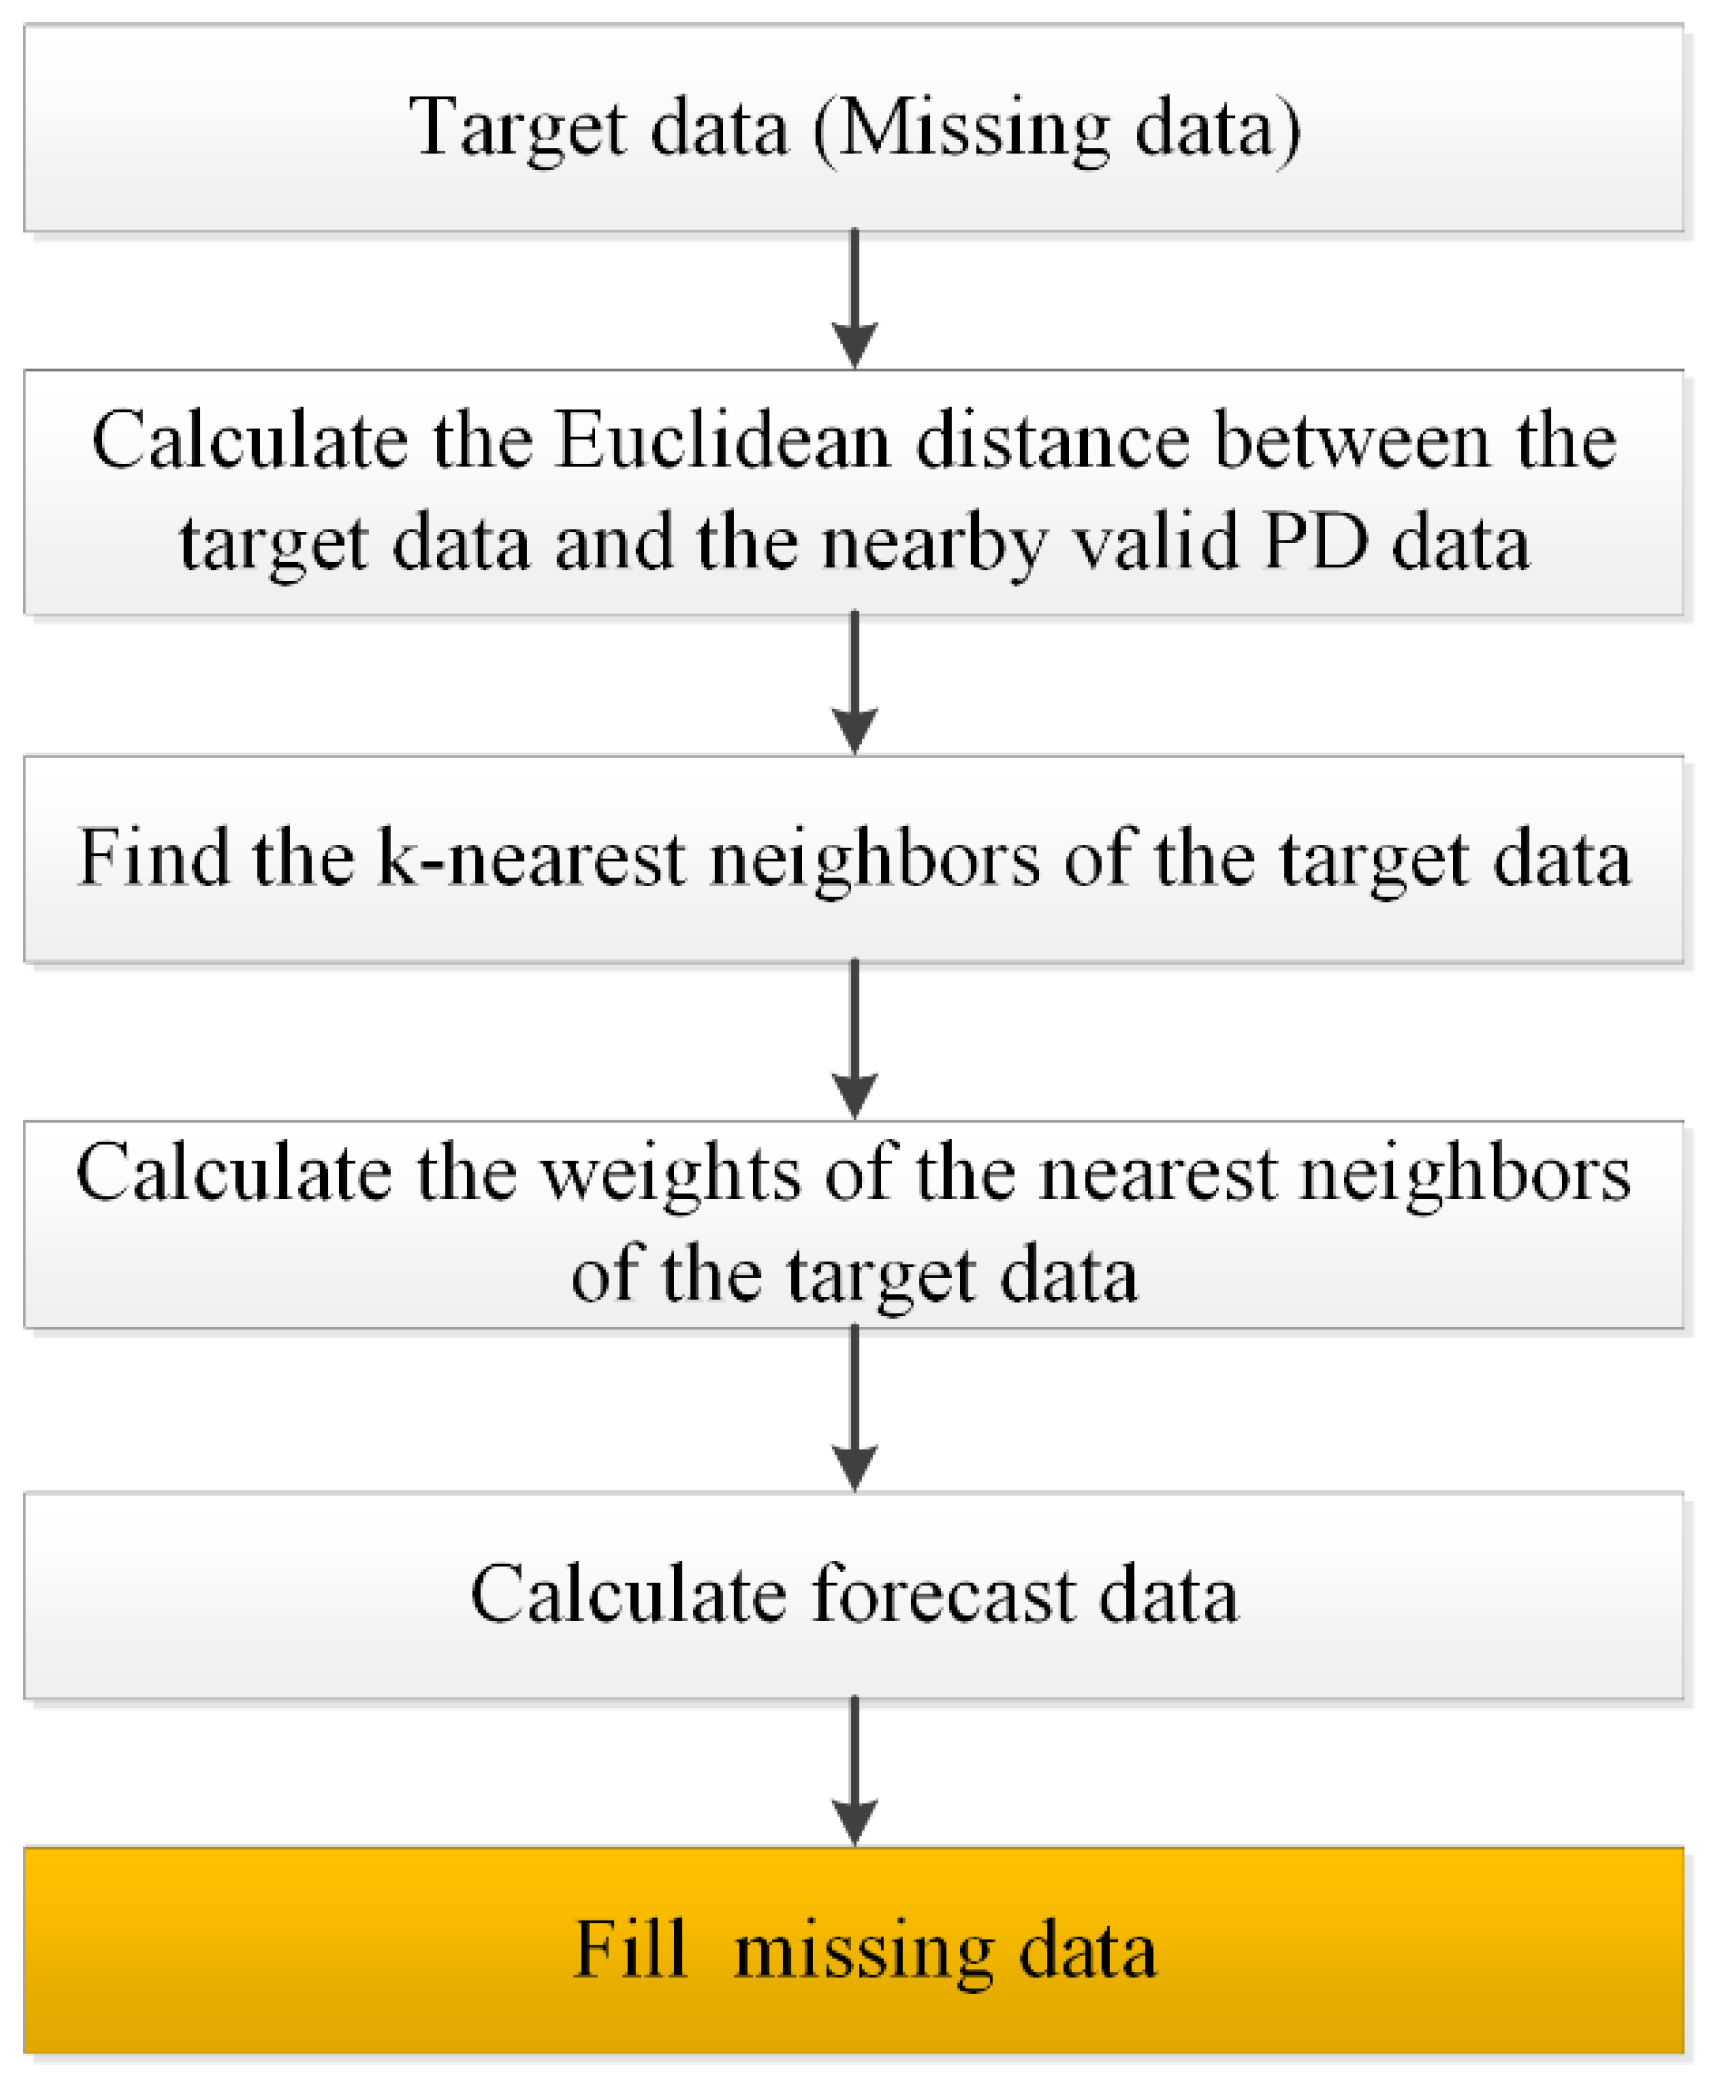
In this work, we use the KNN algorithm to interpolate the value of missing data. The basic principle of the algorithm is to calculate the PD value of the missing point based on
k-adjacent effective data
near the missing point. The basic flow of the algorithm is shown in
Figure 3.
In the algorithm, for the data missing point, the algorithm first calculates the Euclidean distance
between the data missing point and the nearby effective PD data. For one-dimensional PD data, the Euclidean distance
is equal to the time difference from the point missing date to the
k-nearest point. Secondly, the weight is assigned based on the reciprocal of Euclidean distance, and the weight
formula is as follows:
Then, based on the weight and the PD value, the PD value
(mV). of the missing point is calculated, i.e., pulse current amplitude or ultrasonic amplitude at a certain time. The specific formula is as follows:
According to the characteristics of data to be processed in this paper, the value of k in the algorithm is 9.
3.2. Adaptive Noise Reduction Algorithm
Due to the differences of the sensors and environmental noise, there is a background noise in the field operation of the sensors in the substation. Background noise is the sum of the noise of the whole system, which is affected by many factors. The noise of the acquisition equipment is mainly caused by the thermal noise from the irregular movement of electrons in the atom, which varies in different seasons. Substation corona and high-current magnetic field interference have a great impact on the sensing noise, which is affected by many factors such as the amplitude of transmission voltage and current, the distance between the sensors and the interference source. Although researchers have taken a variety of noise reduction measures, background noise is widespread and different sensors have different background noise.
In order to solve this problem, this algorithm proposes an adaptive noise reduction method, which proposes different thresholds for different sensors.
Firstly, the probability density function of the output signal
(mV) of the sensing system filled with missing data is as follows,
where
is the standard deviation of PD signal,
is the mean value of PD signal.
Secondly, the probability density of the PD amplitude within the signal mean ± 3.3 times standard deviation is calculated as following:
As can be seen from the above formula, without PD the probability density of noise within the signal mean ± 3.3 times standard deviation is 99.9%. Therefore,
(mV) is taken as the partial discharge threshold, and the adaptive noise reduction method adopted in this algorithm is:
where
(mV) is the amplitude of PD after adaptive noise reduction.
3.3. Algorithm for Significance Evaluation of Joint Acoustoelectric Data
Since several pulse current and ultrasonic sensors are arranged near the high voltage reactor, the acoustoelectric data can be used to determine whether the signal is a real partial discharge signal or occasional interference.
In this algorithm, the
p-value is used to evaluate whether the ultrasonic signal is synchronized with the pulse current signal. Firstly, the measurement results of different pulse current sensors and ultrasonic sensors are summed up respectively:
(mV) and (mV) are the pulse current and ultrasonic signal after data filling and adaptive noise reduction respectively, and n and m are the number of two kinds of sensors respectively.
Secondly, the pulse current summation result I (mV) and the ultrasonic summation result US (mV) are segmented, and the data length in each segment is N.
Thirdly, the correlation difference between section
j pulse current and ultrasonic signal is calculated:
where
is the standard deviation of the amplitude of the pulse current in section
j, and
is the standard deviation of the amplitude of ultrasound in section
j.
Then, the score
t of the segment
j pulse current and the ultrasonic signal is calculated:
where
(mV) is the mean value of pulse current amplitude in section
j, and
(mV) is the mean value of ultrasonic amplitude in section
j.
After that, the degrees of freedom of the sample
df are calculated:
Finally, according to the
t-score and table of degree of freedom in the statistics books, the
p-value corresponding to the
t-score is found in the row containing the sample degree of freedom,
df, as shown in
Table 1.
If p > 0.1, it is considered that there is no significant correlation between pulse current and ultrasonic local discharge data. If 0.05 < p ≤ 0.1, there may be a significant correlation between pulse current and ultrasonic local discharge. If 0.01 < p ≤ 0.05, it is considered that there is a significant correlation between pulse current and ultrasonic local discharge. In addition, if p ≤ 0.01, the pulse current is considered to be highly significantly correlated with ultrasonic partial discharge.
4. Application Case
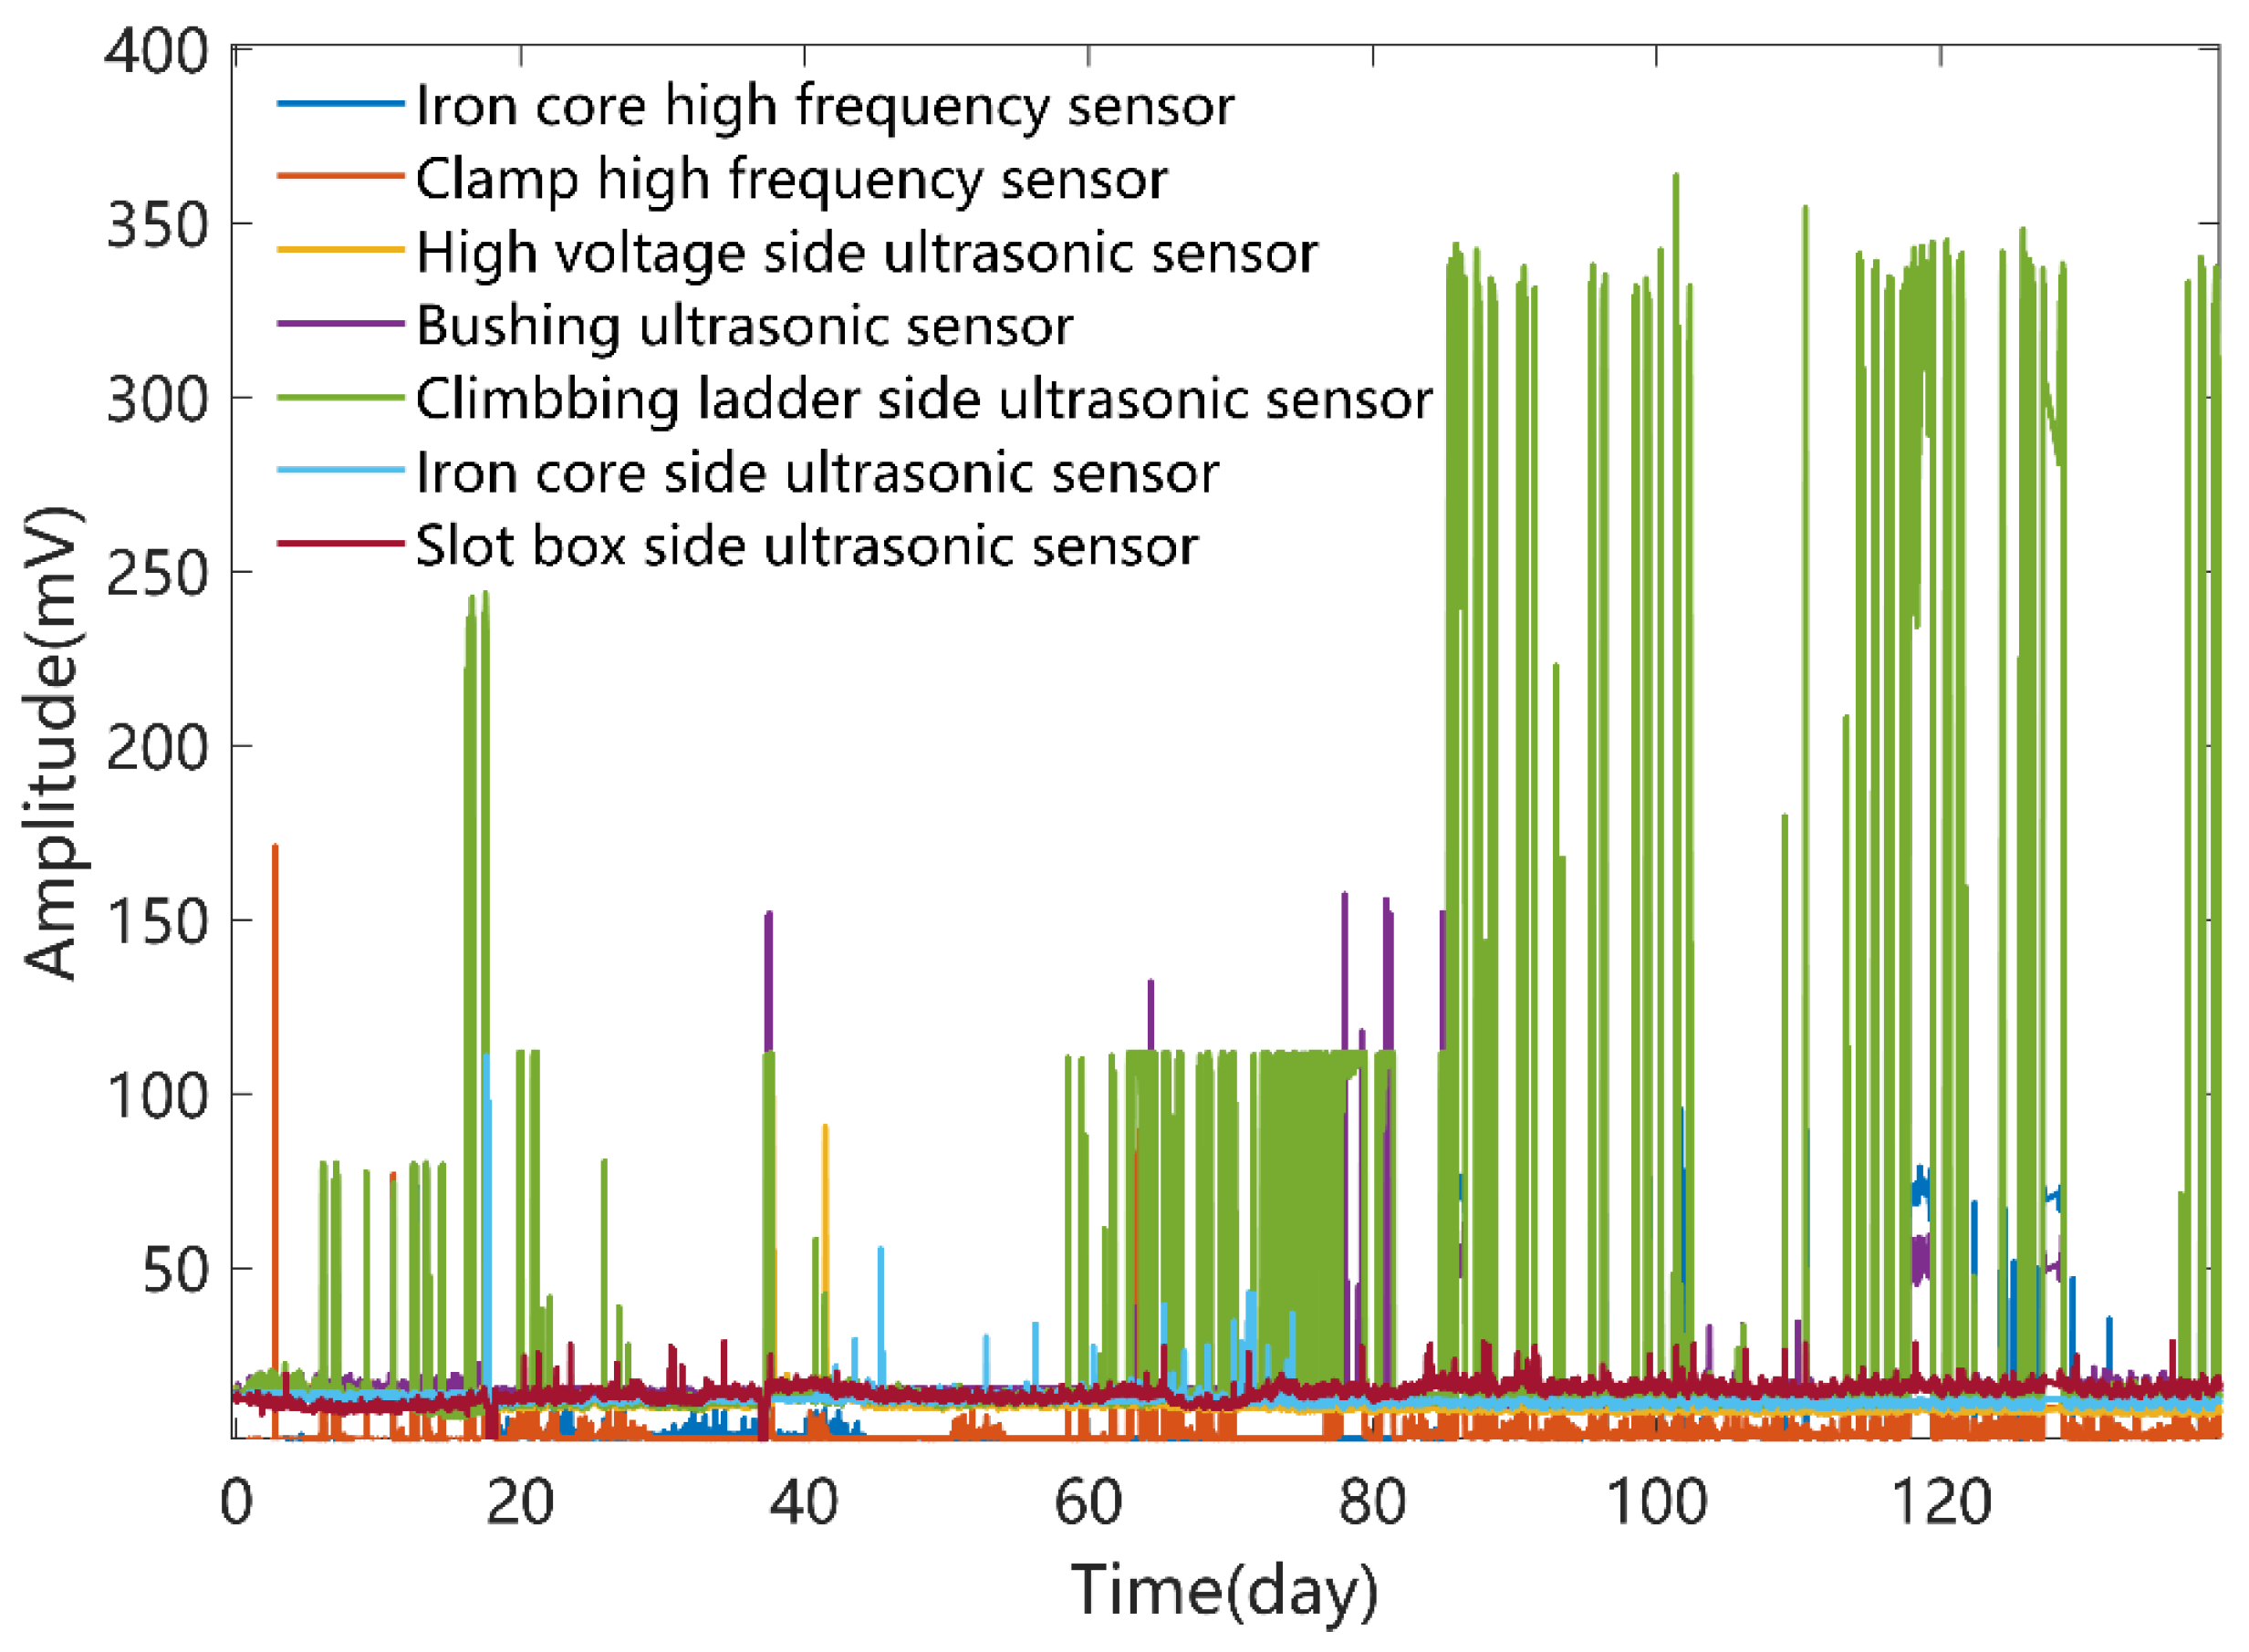
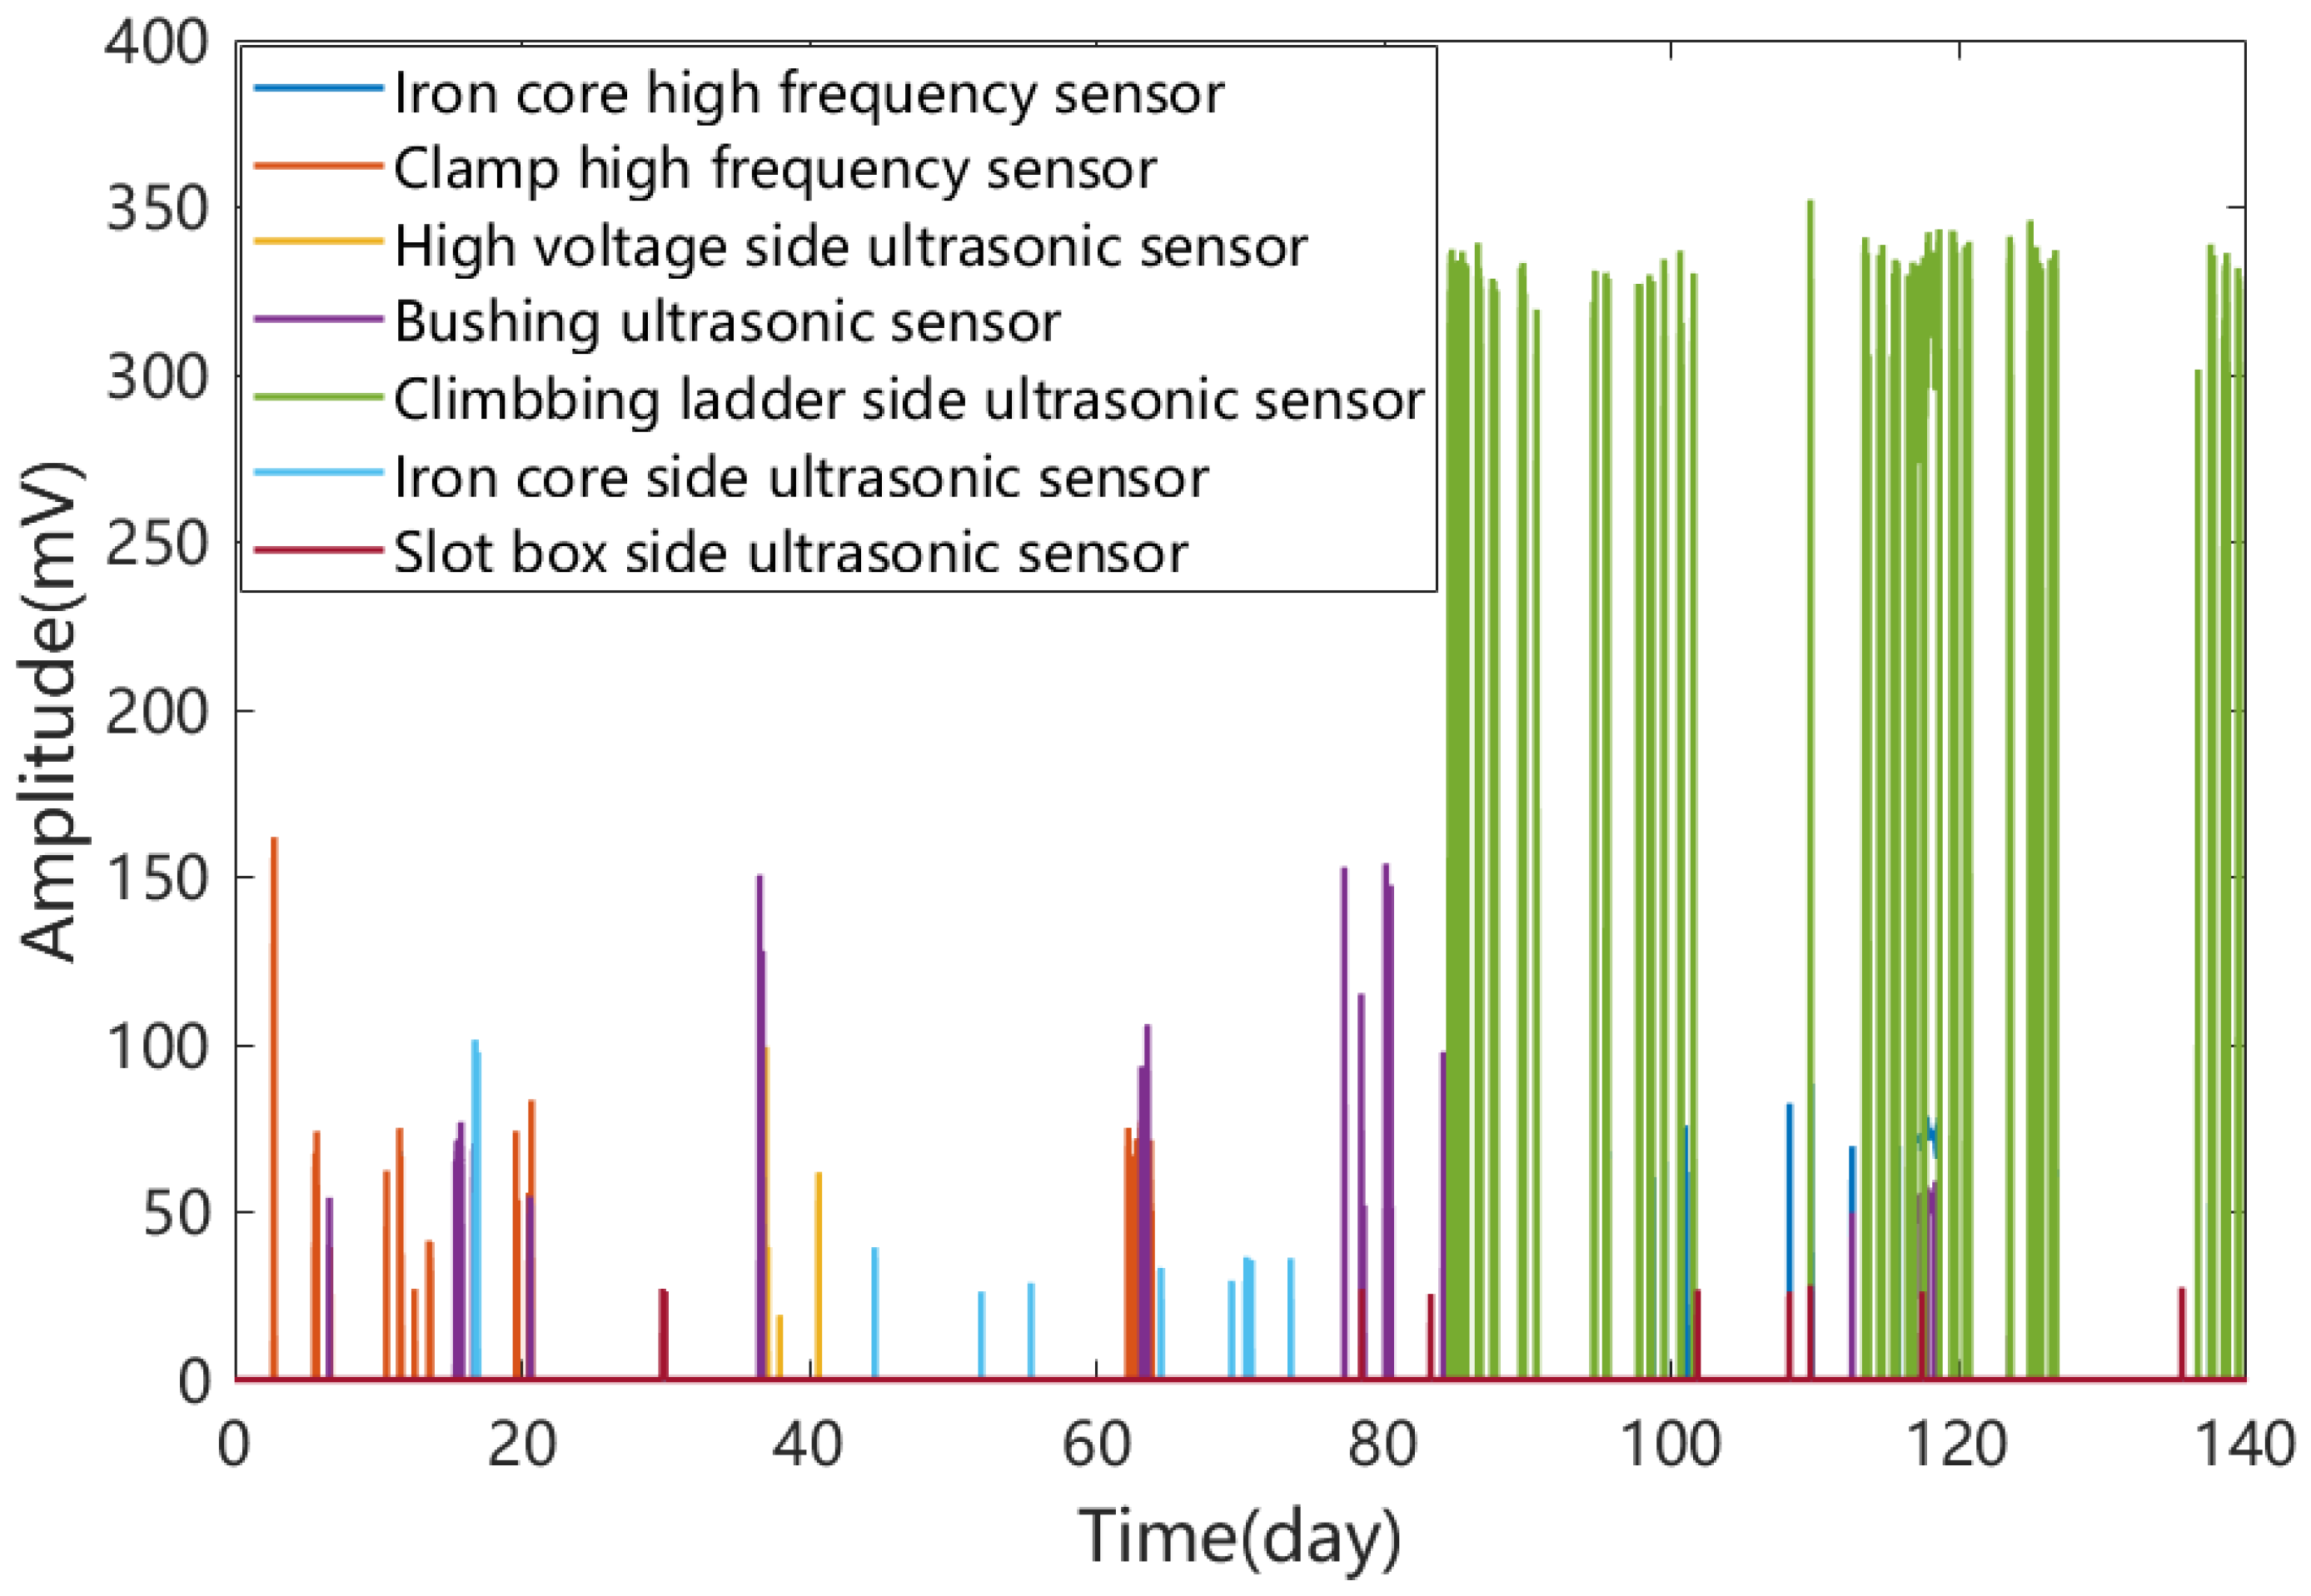
According to the method proposed in this paper, nearly half a year of data from a UHV reactor is obtained, as shown in
Figure 4. Based on the analysis of the above data, there are the following problems:
(1) There is a serious problem of data missing. Affected by the reliability of sensors, 7.97% of the real data is missing.
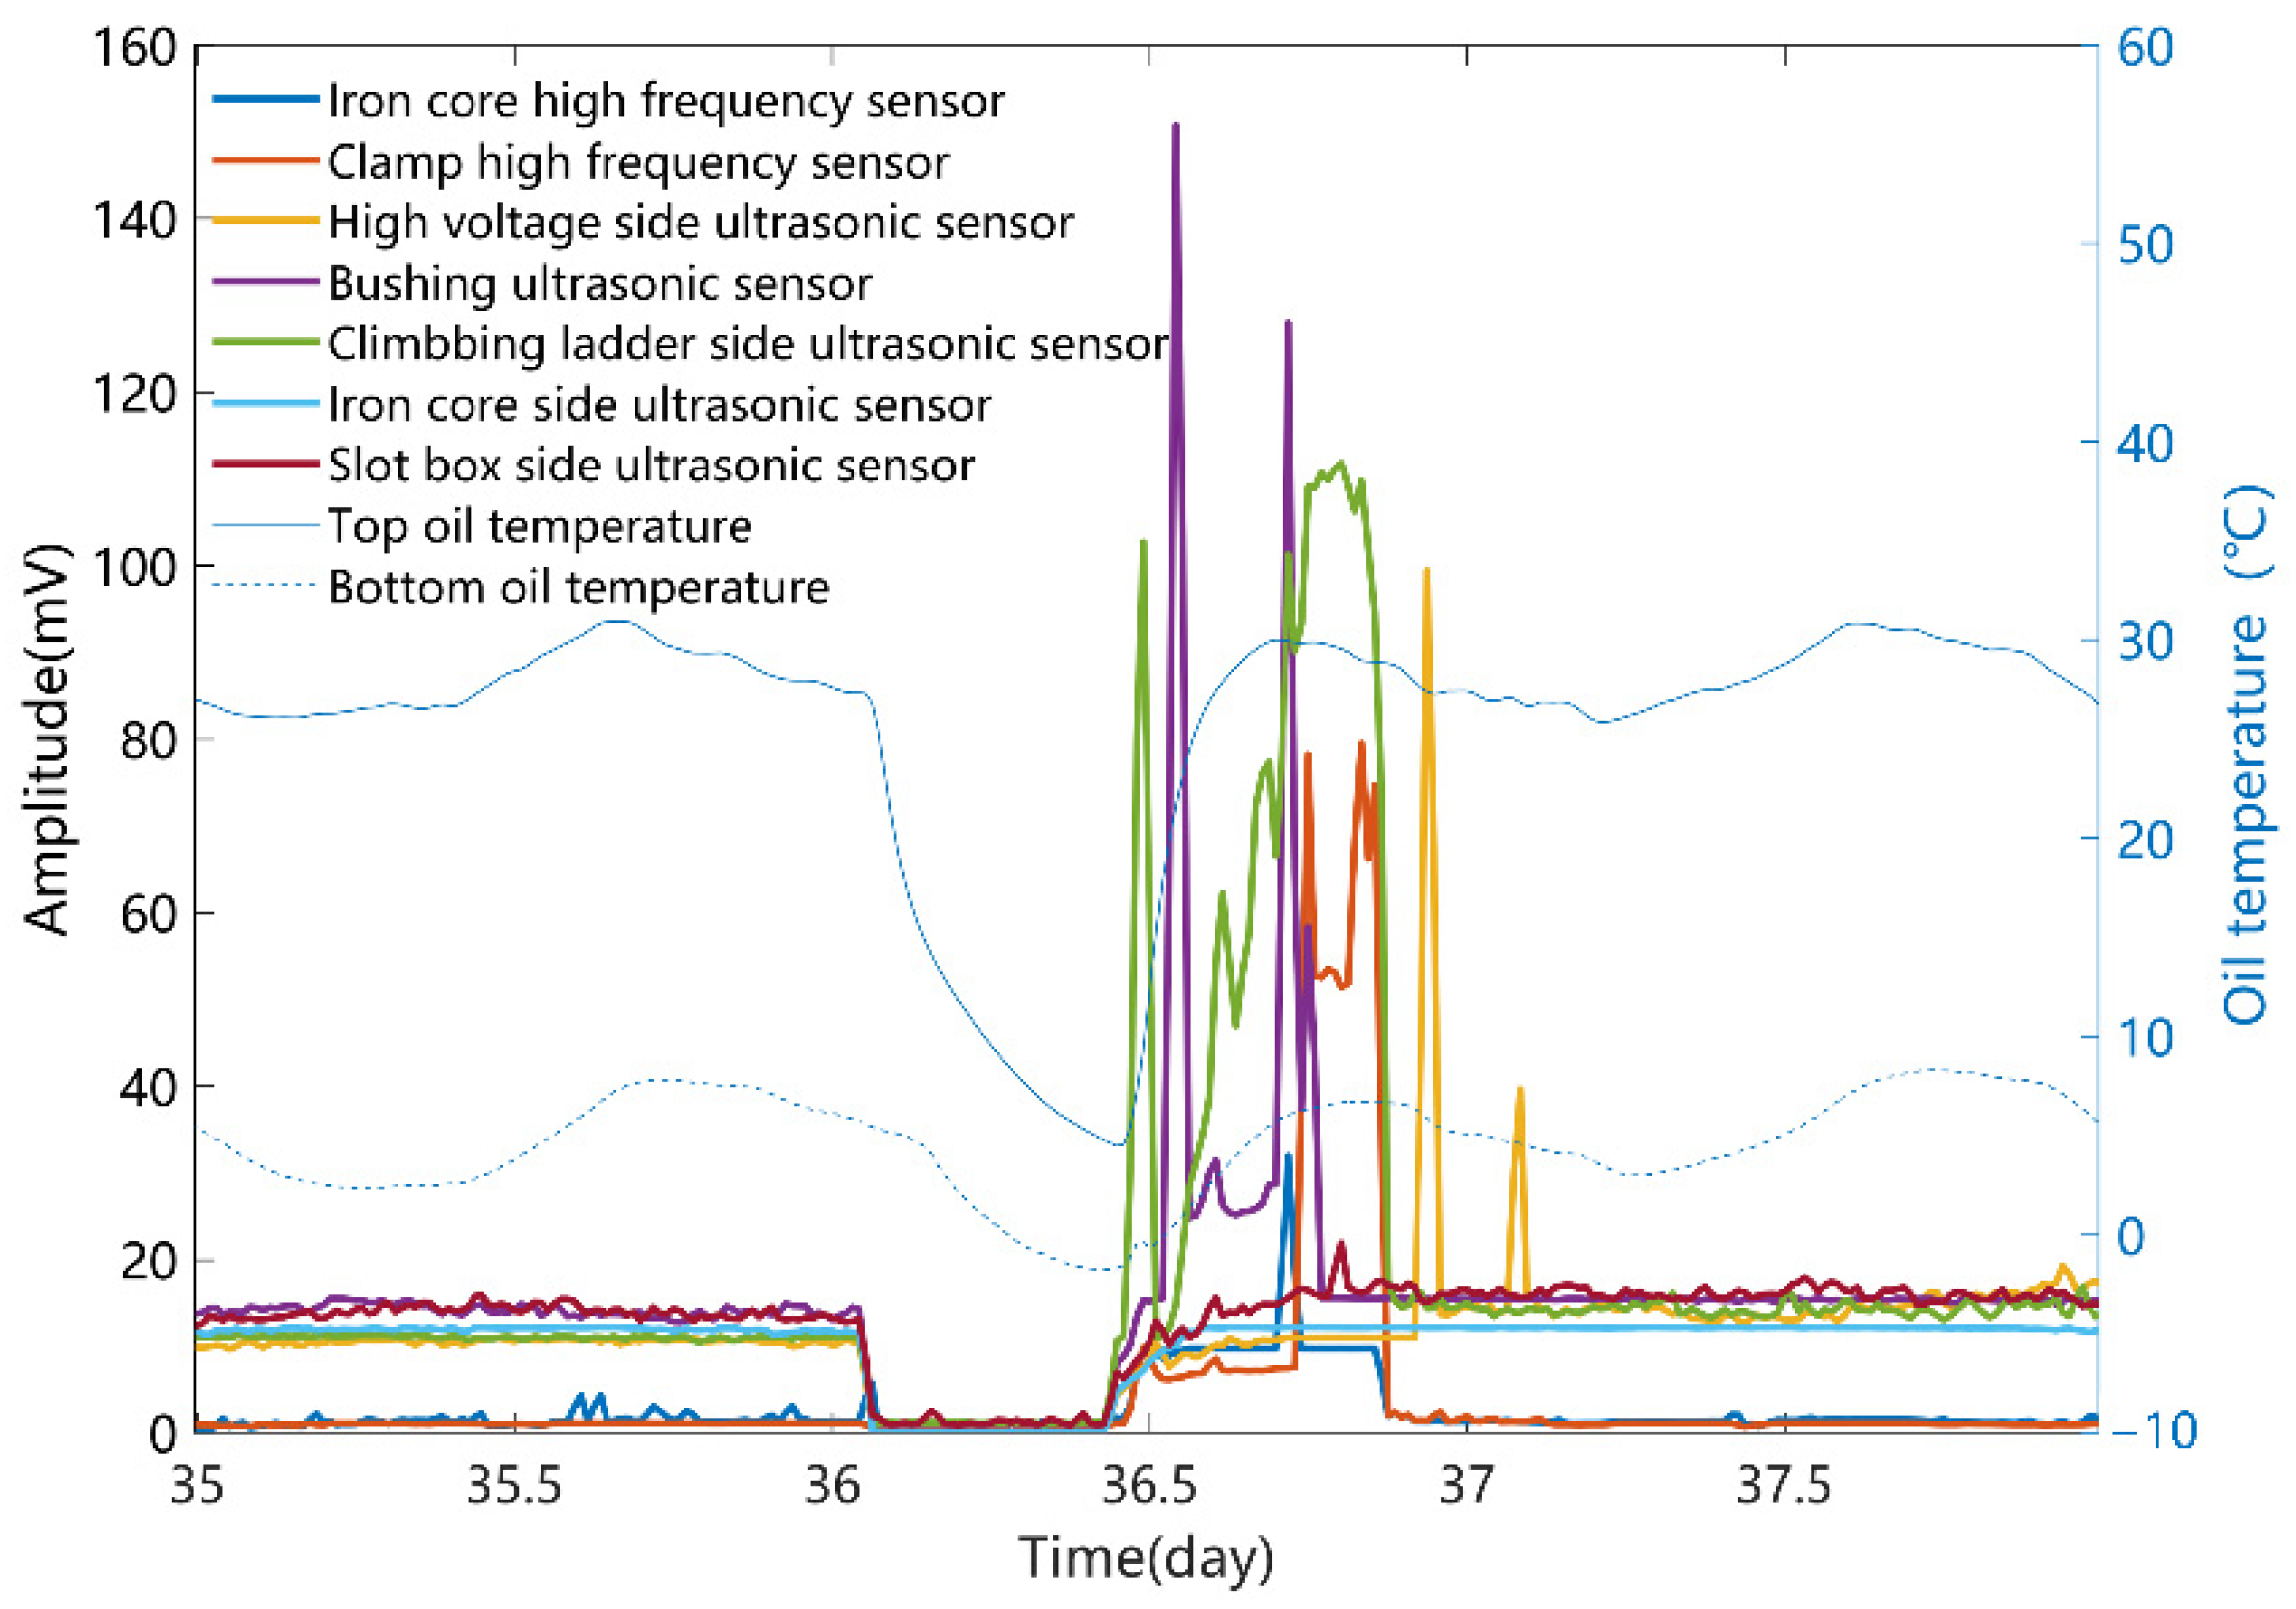
(2) The false alarm is serious. For example,
Figure 5 shows the original measurement data from days 35 to 38. From the oil temperature data, the reactor was out of operation on the 36th day and put into use again on the 36.5th day. In the second start-up stage, there are many kinds of noise, such as vibration, operating overvoltage, electromagnetic and so on. If the defect alarm analysis is carried out according to the original recorded data, the false alarm signal will last for 14 h.
(3) There are a lot of data and noise. The system simultaneously collected seven channels of pulse current and ultrasonic signals and two channels of oil temperature signals, and there is superposition of signal and noise. The analysis time will be very long if the manual processing is used, and there may be omissions and false positives.
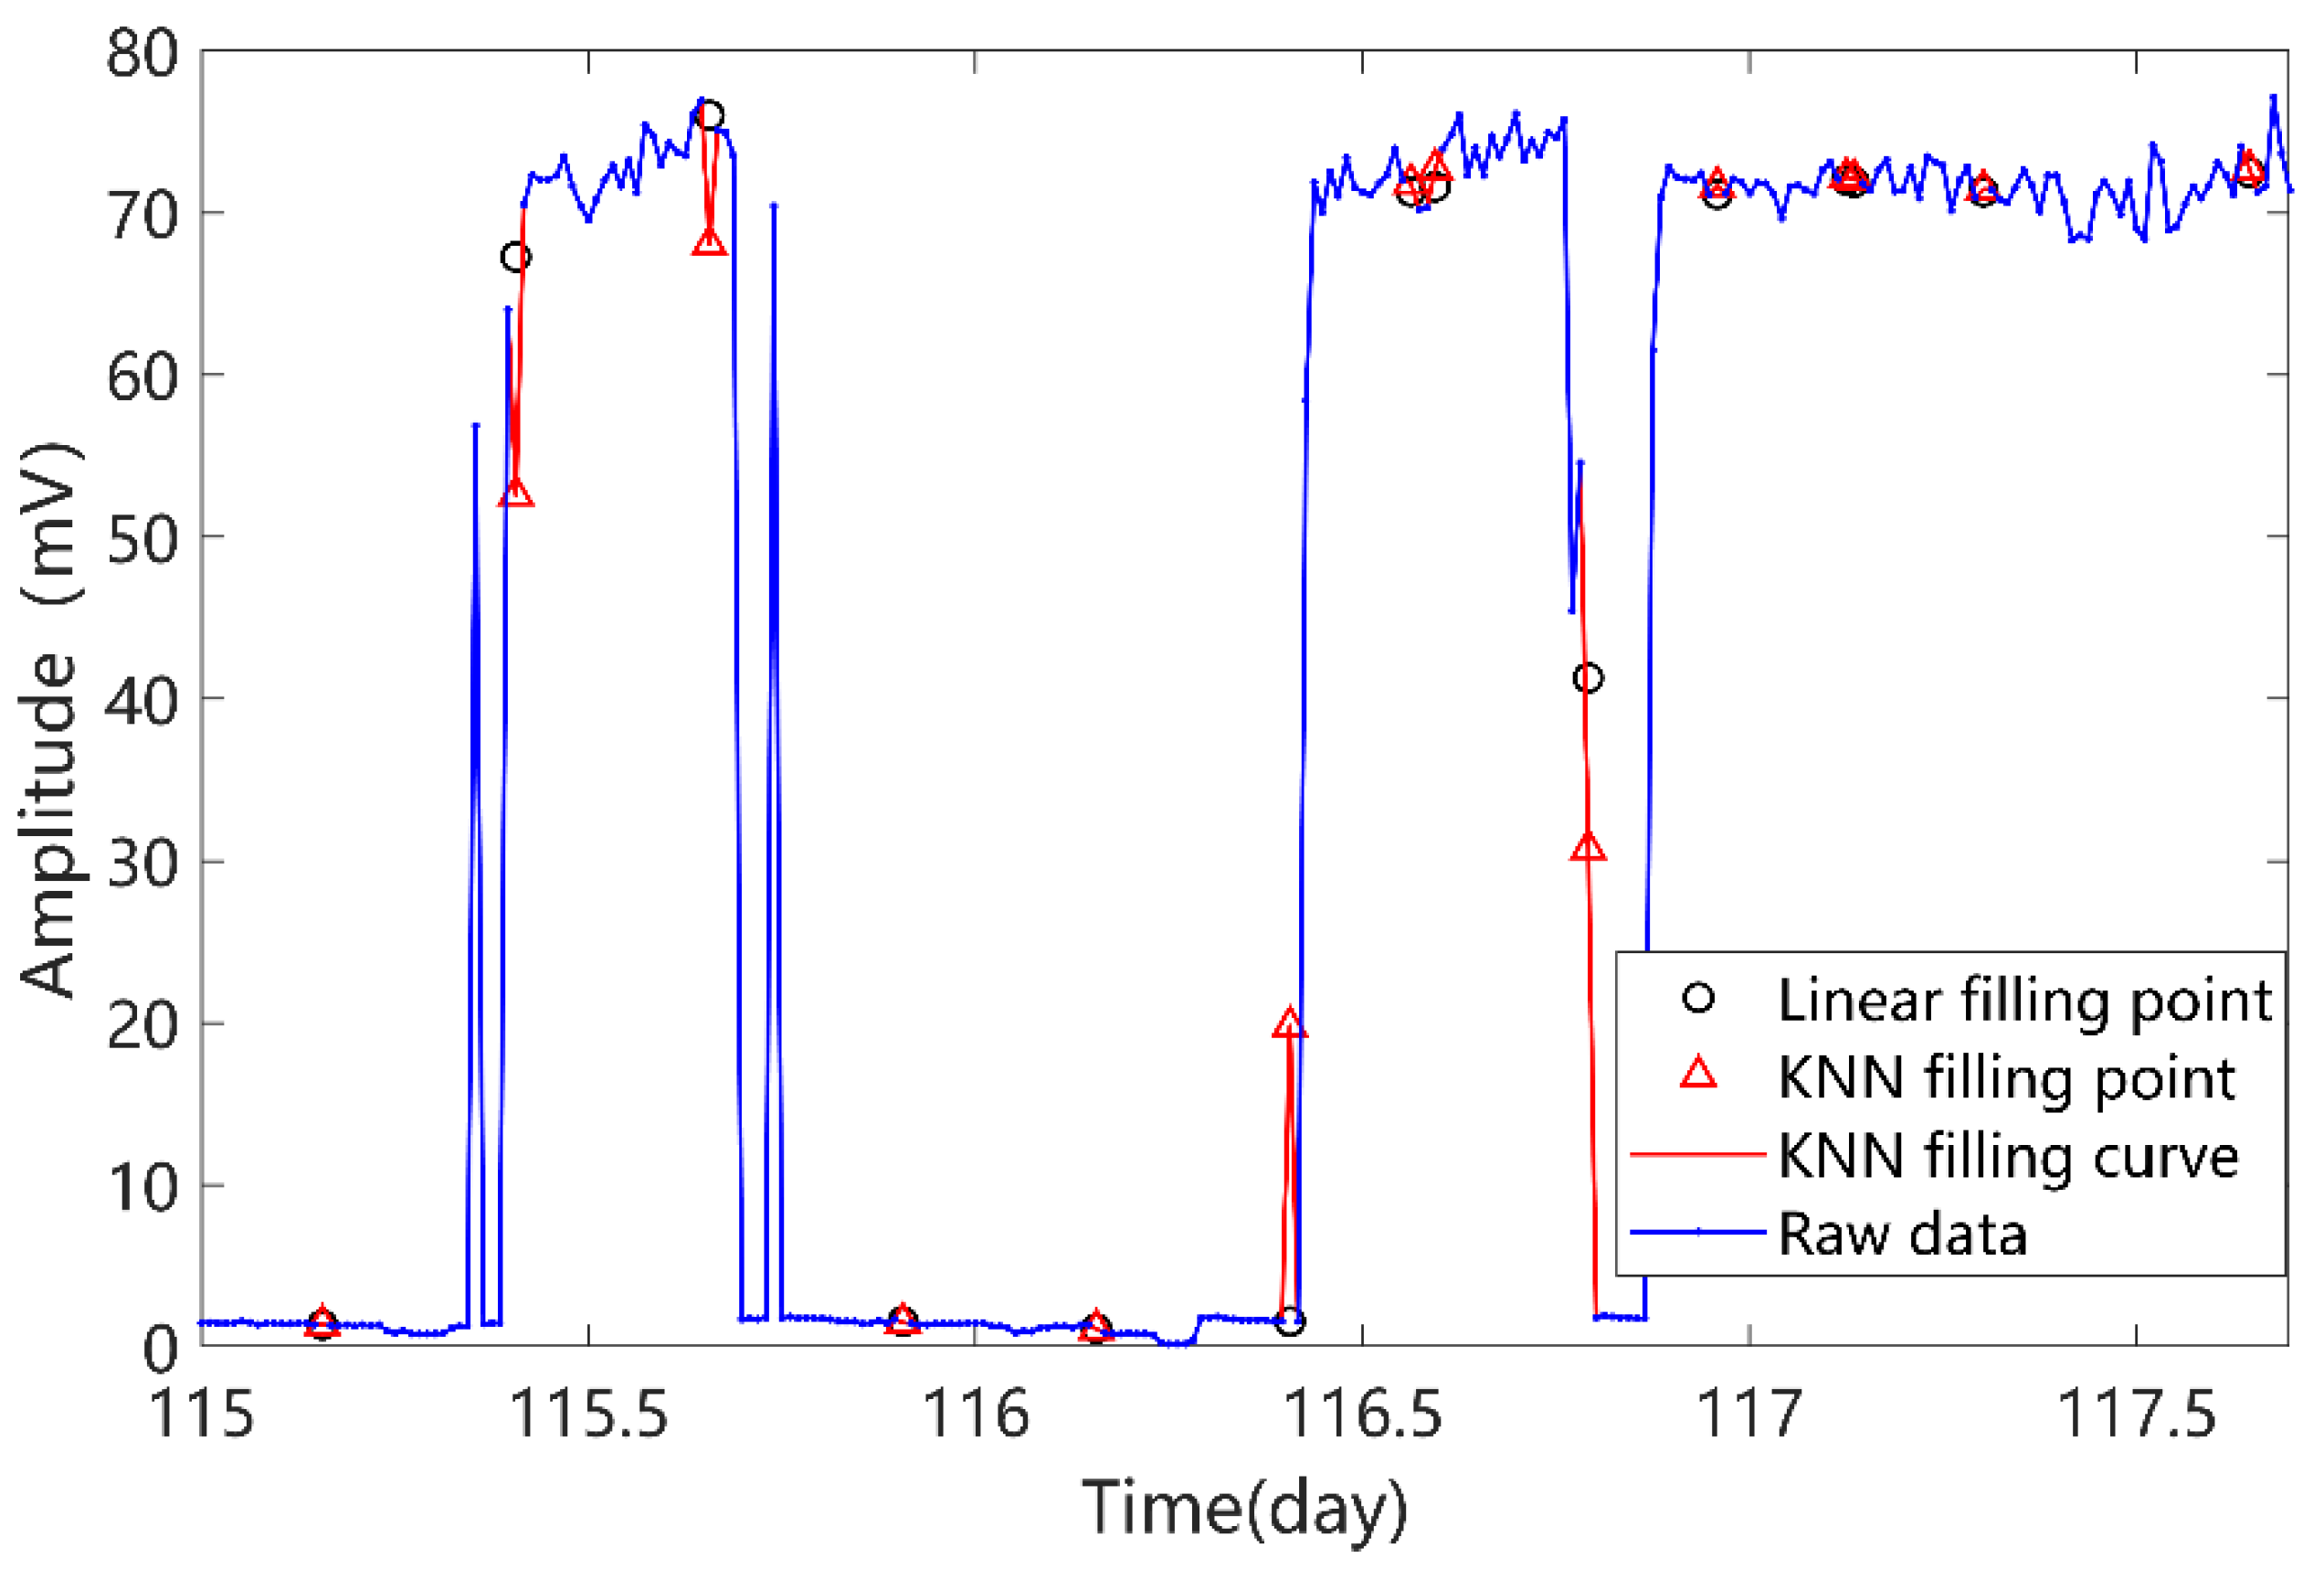
In order to fill the missing data and carry out the follow-up algorithm, firstly, the missing data of a pulse current sensors is filled based on the KNN algorithm. As can be seen from
Figure 6, KNN method considers the pre-and post-correlation of PD and can reflect the fluctuation of PD signal more accurately.
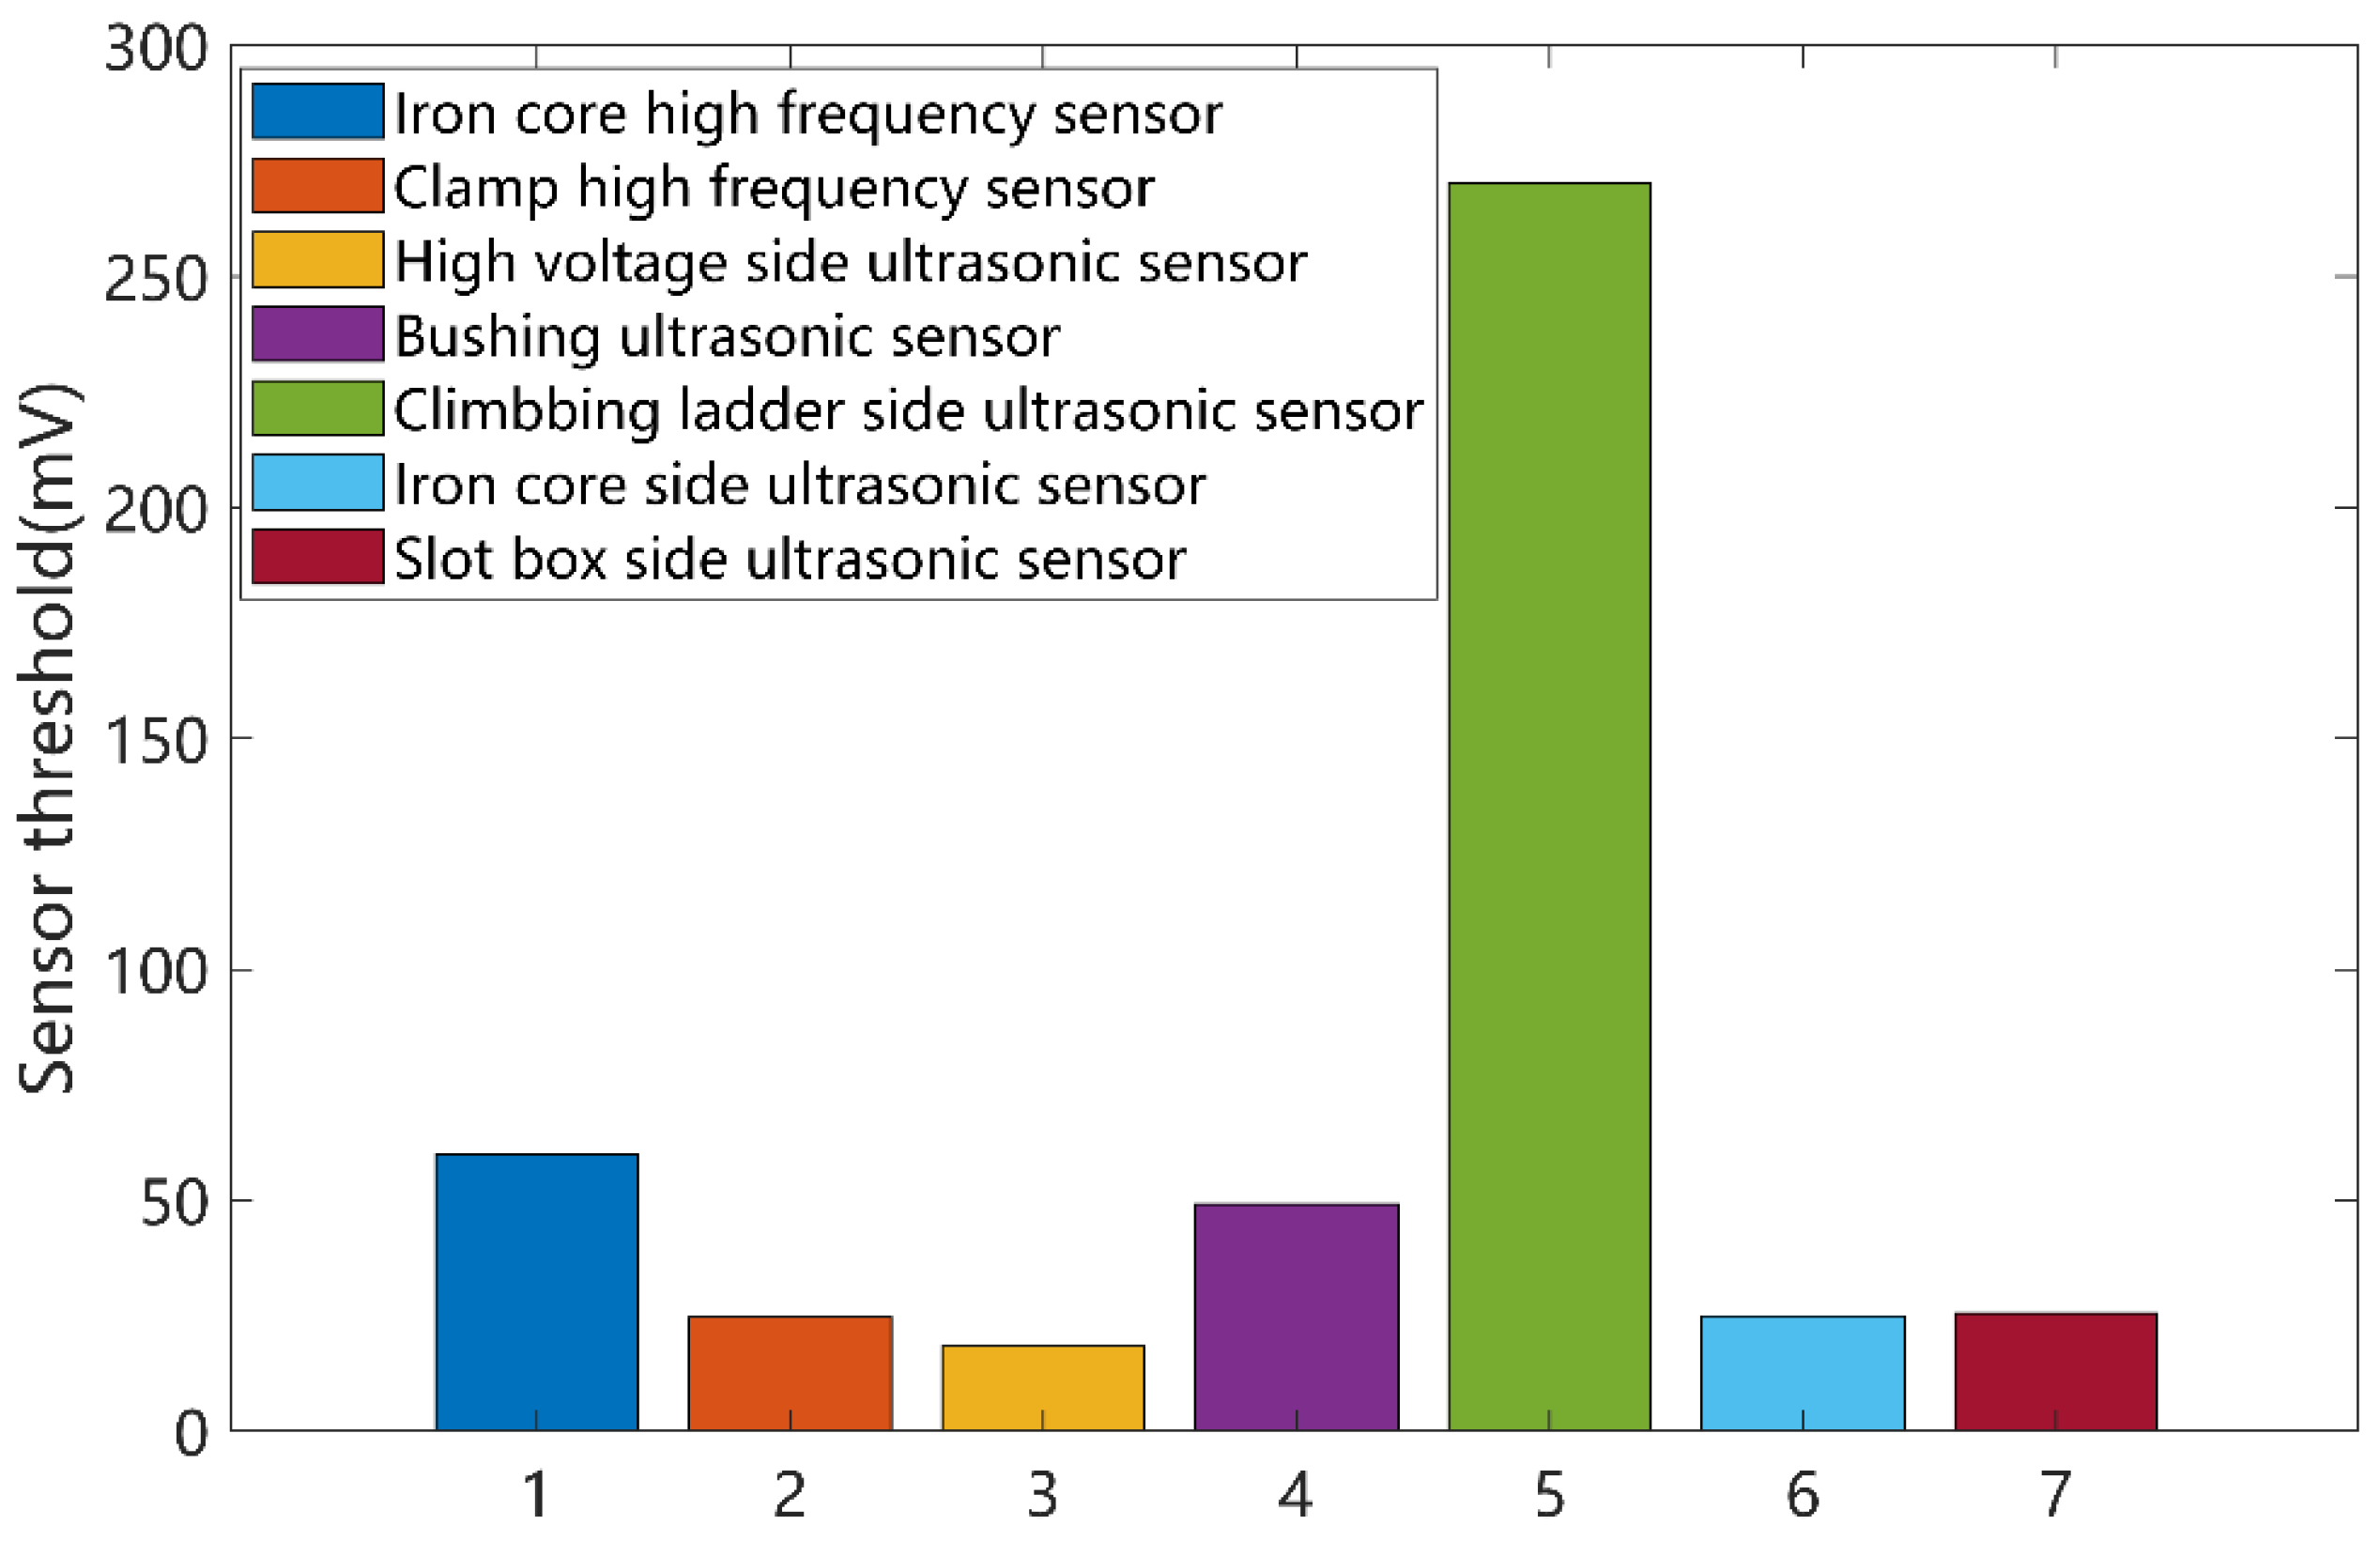
As shown in
Figure 7, real field data are analyzed based on the proposed adaptive noise reduction algorithm, and the PD thresholds of different sensors are determined. Theoretically, the measurement results of the sensors without PD signal should be taken for noise threshold analysis, but it is difficult to determine whether there is a small discharge defect inside under the real operation condition. According to the actual operation experience, there is still a long time from the occurrence of small defects to the serious fault that must carry out a power outage, and the PD signal is obviously improved before the serious fault. Therefore, the sensors threshold analysis for all data (including real small discharge data) has engineering accuracy.
It can be seen from
Figure 6 that the thresholds of different sensors are quite different. Different thresholds are closely related to the noise level of the sensors and the surrounding environment and prove the correctness of adaptive threshold processing.
The data of seven sensors are further processed based on the above adaptive filtering algorithm, as shown in
Figure 8.
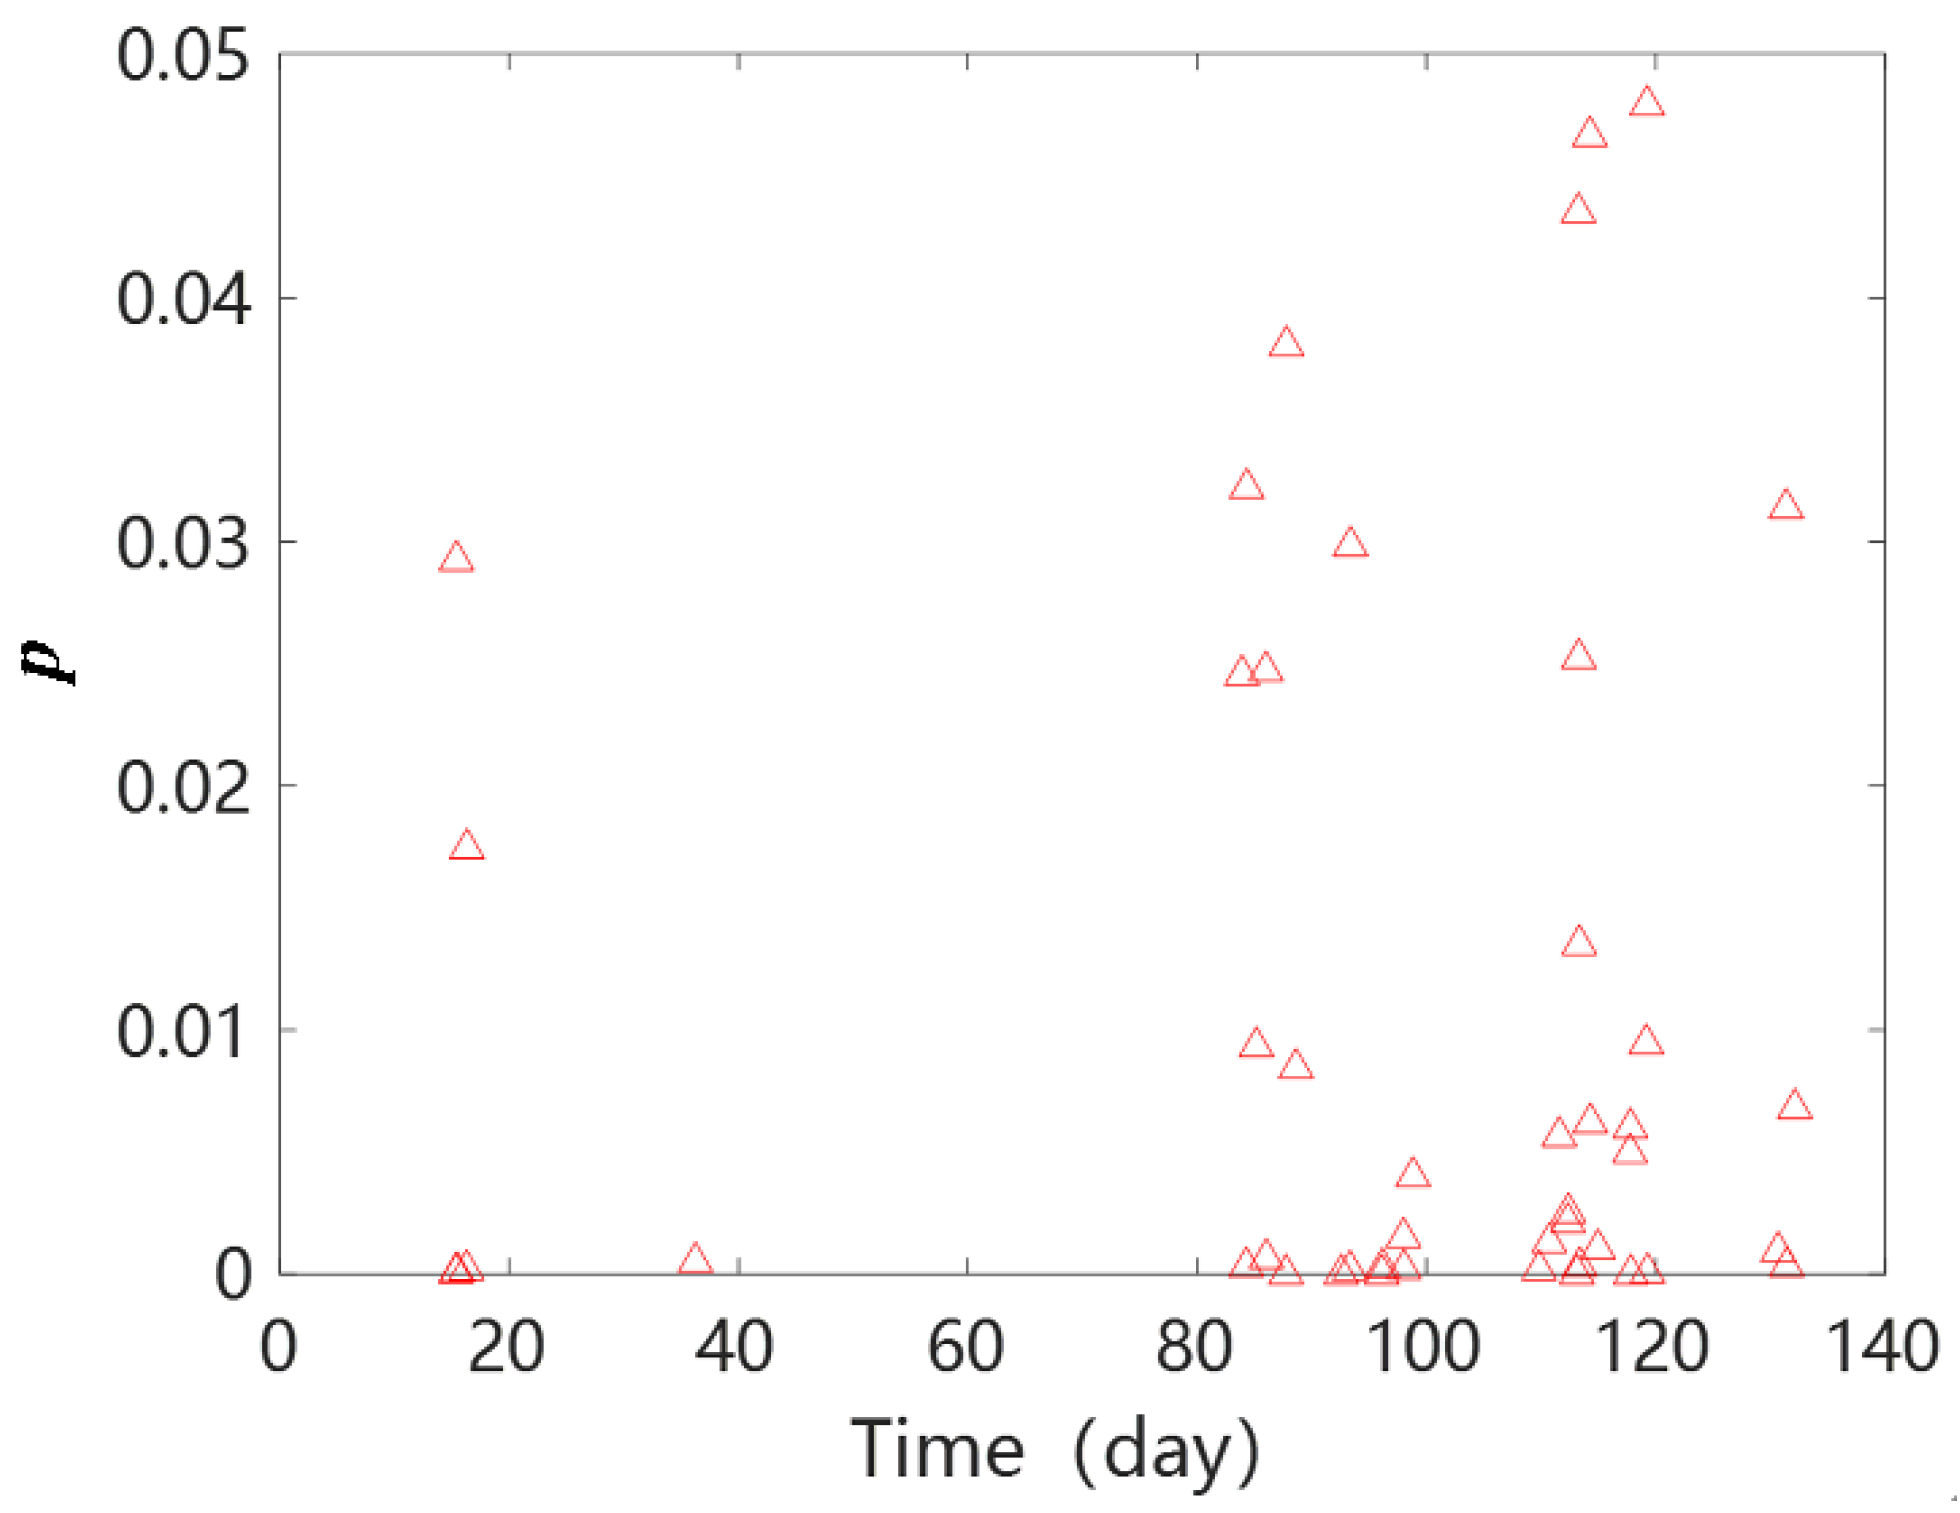
According to the acoustoelectric correlation significance evaluation method, the sensor data in the figure are calculated (
N = 4, reflecting the hourly results). The results are shown in the
Figure 9 (only
p ≤ 0.05 is shown).
As can be seen from
Figure 8, several events occurred that can be identified as internal discharge between the 15th and 17th days.
The original measurement data from days 35 to 38 in
Figure 3 are analyzed. As mentioned earlier, if the traditional threshold method is used for the alarm, the false alarm signal will last for 14 h. Using the algorithm proposed in this paper, there is only one alarm signal. The false alarm is significantly reduced by the joint detection of acoustoelectric significance. Compared with
Figure 7 and
Figure 8, the number of false alarms decreased by 89.3%.
Although in
Figure 3, multiple signals appear between days 40 and 80, defects are not considered to have a serious impact due to the lack of correlation between the pulse current and the ultrasonic signal.
After 80 days, significant events occurred again and tended to be dense. The reactor was determined to need to return to the factory for maintenance.
The reactor was disintegrated after returning to the factory, and near the magnetic shunt on the X column on the non-outlet side the grounding wire which should be connected with the clamp on the main core was not reliably connected. That was due to negligent installation and contact with the upper iron yoke pull screw gasket after long-term vibration. There were obvious discharge traces around the pull screw gasket, the corresponding clamp and insulation gasket, as shown in
Figure 10. The discharge traces verified the accuracy of the detection method in this paper, and proved that the method can effectively warn against the defects of the reactor.
5. Conclusions
The analysis and diagnosis for on-site UHV reactors were carried out in this paper. The main conclusions are as follows:
(1) A method of missing data filling of PD information based on KNN is proposed, which solves the problem of error reporting in subsequent algorithms. KNN method can reflect the fluctuation of PD signal more accurately. An adaptive noise reduction method is proposed, and a method for calculating the noise threshold of sensors is given, which effectively reduces the noise level of the acquisition results.
(2) A joint analysis method of acoustoelectric signals based on correlation significance is established. The discharge event is judged based on the correlation significance of pulse current and ultrasonic partial discharge data, which significantly reduces the problem of false positives that often occur in the on-site online monitoring system. A field application case shows that the number of false alarms has been reduced by 89.3%.
(3) The application case of the UHV reactor proves the effectiveness of the proposed method. Compared with previous studies, the object of this paper is real field data, and has better research value. The proposed acoustoelectric fusion high-voltage reactor acquisition and defect diagnosis system has many advantages, such as low cost, adaptive noise reduction, low false alarm rate.


 ,
, 


