
Effect of Multistage Circulation Control on Blade Aerodynamic Performance

1
School of Aeronautics and Astronautics, Xihua University, Chengdu 610039, China
2
National Key Laboratory of Science and Technology on Aerodynamic Design and Research, Northwest Polytechnical University, Xi’an 710072, China
3
Key Laboratory of Fluid and Power Machinery, Ministry of Education, Xihua University, Chengdu 610039, China
*
Author to whom correspondence should be addressed.
Energies 2022, 15(19), 7395; https://0-doi-org.brum.beds.ac.uk/10.3390/en15197395
Submission received: 15 September 2022
/
Revised: 28 September 2022
/
Accepted: 29 September 2022
/
Published: 9 October 2022
(This article belongs to the Topic Fluid Mechanics)
Abstract
:To improve the low aerodynamic efficiency and reduce the high energy consumption of a single-stage circulation control wing, a multistage circulation control wing was designed. By combining force measurement and particle image velocimetry (PIV), the aerodynamic and flow-field characteristics of an aerofoil were investigated with respect to the increase in the number of blowing slots, changes in the blowing coefficient, and different blowing ratios for three slots. The force measurement results revealed that the maximum lift-to-drag ratio resulting from simultaneous blowing into the three slots increased by 95.3% compared with that in the absence of circulation control. With an increase in the blowing coefficient, two stages were observed: separation control and supercirculation control. In the separation control stage, the lift and drag coefficients significantly increased and decreased, respectively. In the supercirculation control stage, the lift coefficient gradually increased with the blowing coefficient, whereas the drag coefficient remained unchanged. When the blowing ratio (blowing flow ratio of three slots) in the three slots was 3:1:2, the maximum lift-to-drag ratio of the wing could reach 143.48%. The effects of different slot positions on the aerodynamic control were found to vary. The effects of Slot.1 and Slot.3 in terms of the drag reduction and lift, respectively, were evident, and the influence of Slot.2 on blowing between these two slots played a role in jet relay. The PIV results revealed that multistage blowing circulation increased the curvature of the trailing-edge streamline, thus increasing the equivalent aerofoil camber and improving the wing lift. At a high angle of attack, this circulation demonstrated a flow separation control effect.
1. Introduction
Environmental pollution and other problems have become more severe owing to the global energy crisis. Consequently, environmental pollution, energy conservation, and emission reduction have gained more attention. Wind power, as one of the clean energy sources, has attracted considerable interest. Wind power generation is a type of power production method that converts the kinetic energy of wind into electrical energy through a wind turbine. Wind turbine blades, which are important in capturing wind energy, directly affect the utilisation rate of energy [1]. Study results indicate that the best approach to improve the utilisation rate of wind energy is to increase the aerodynamic efficiency of wind turbine blades.
With the development of flow control technology, an increasing number of flow control methods have been used to improve the aerodynamic efficiency of wind turbine blades [2]. Currently, the main flow control methods include blowing/suction, synthetic jets, vortex generators, slotted aerofoils, bionic nodes, grooves, and tip winglets [3,4].
Zhang et al. [5] adopted synthetic jet technology to replace the traditional blowing control mode to improve the aerodynamic performance of wind turbine blades; however, the lift increment obtained was evidently insufficient. Stalnov et al. [6] applied zero-mass jet technology to wind turbine blades to increase the lift. Experiments reveal that the zero-mass jet can double the maximum lift coefficient of the aerofoil; however, the lift force barely increases in the linear segment of the lift. Krentel et al. [7] constructed the trailing edge of an aerofoil into a stepped and zigzag shape and relieved the periodic vortex shedding of the trailing edge of the aerofoil using a passive flow control method to achieve drag reduction. Remarkably, this control method reduced the drag by 29%; however, it also lowered the lift. Kotsonis et al. [8] placed the plasma controller on the round trailing edge of the aerofoil. Through force measurement experiments, they found that the lift could be increased by a maximum of 20% only when the magnitude of the angle of attack approached the angle corresponding to the occurrence of stall.
Circulation control is currently the most widely used active flow control technology and has great potential for improving the aerodynamic performance of aerofoils. It is primarily implemented through the trailing-edge open-air blowing slot using tangential flow to produce the Coanda effect [9] (i.e., the delay in boundary layer separation [10] and the increase in circulation along an aerofoil [11]), consequently increasing the lift. The circulation control device is composed of Coanda trailing edge, air blowing slot and air compression chamber as the main control components [12]. Currently, the circulation control technology can be used not only to improve the aerodynamic performance of aerofoils but also to reduce noise [13,14].
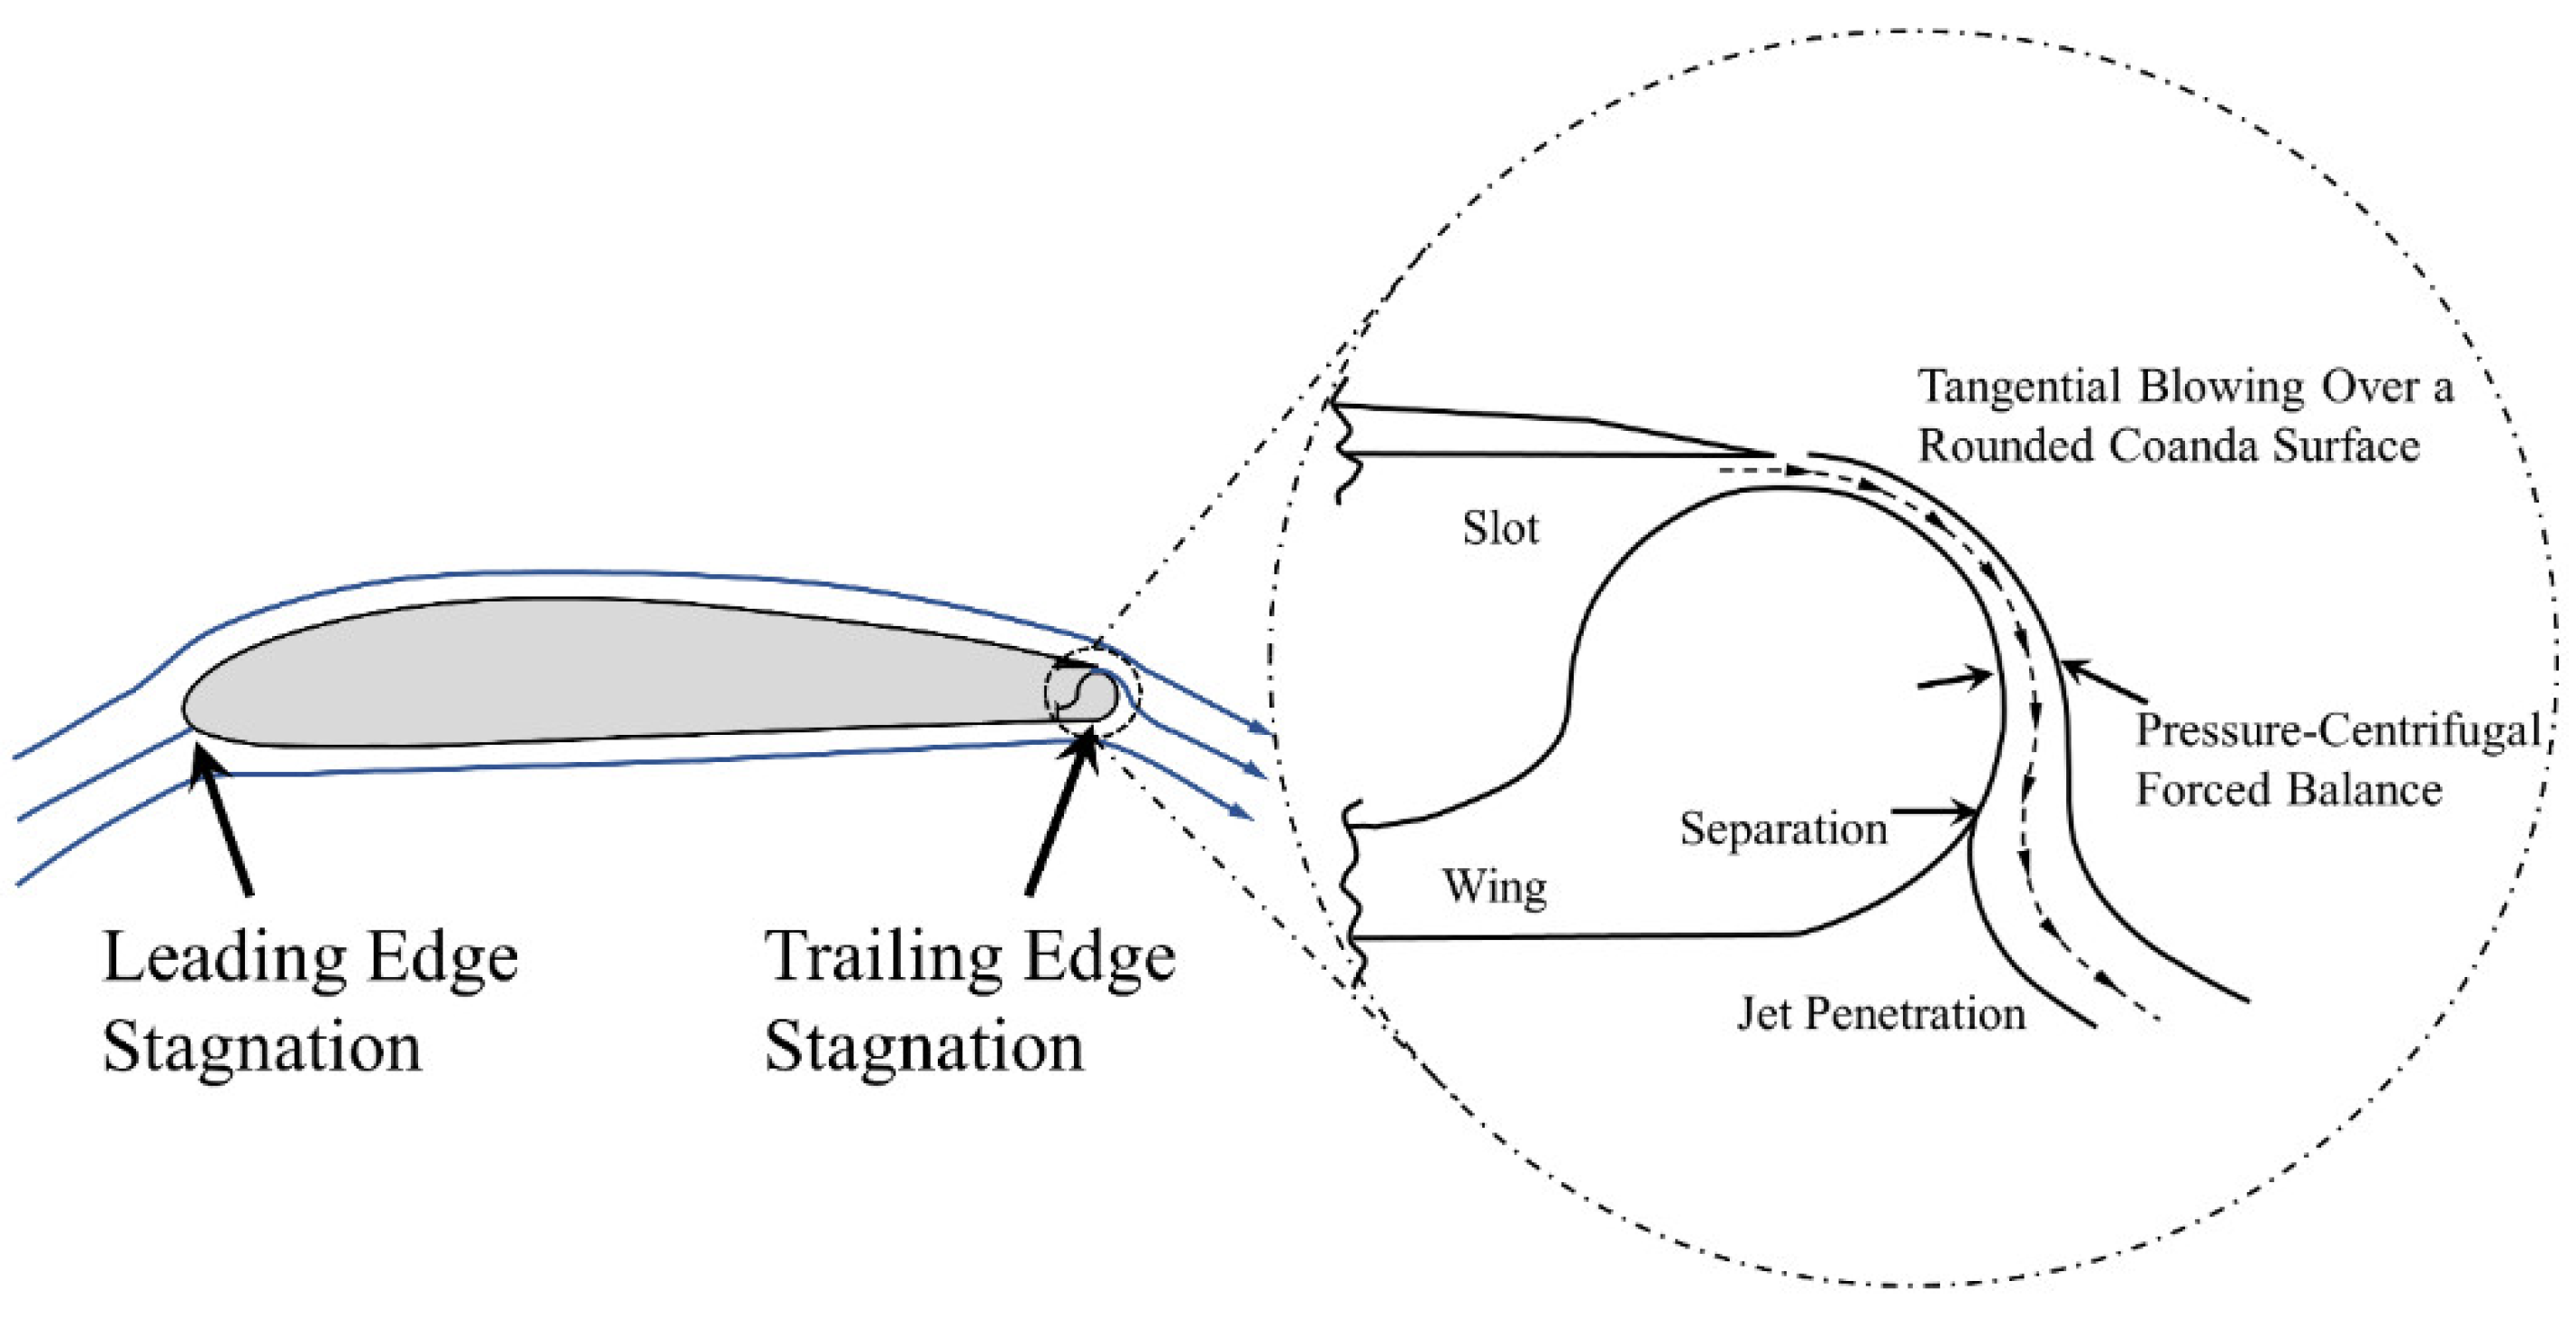
Compared with other flow control technologies, the boundary layer entrained by the Coanda face jet was found to prevent the separation of the tail airflow [15,16], significantly contributing to the control of boundary layer separation [17]. Moreover, the jet adheres to the circular surface without separation because of the equilibrium between the centrifugal force of jet gas molecules and the local pressure drop [18]. As the blowing speed increases, the two stagnation points continue to move, resulting in considerable circulation [19]. As the blowing air separates from the arc surface, it mixes with the mainstream, resulting in a downward deflection of the streamline; this is similar to the lift system of a conventional rudder surface [20] shown in Figure 1. At the same time, the parameters such as the blowing coefficient, the size of the blowing slot and the location of the blowing slot also affect the lifting efficiency of the circulation control.
The studies on the efficiency of circulation control technology show that circulation control aerofoils have a significant lifting effect compared with traditional aerofoils. Englar et al. [21,22,23,24] systematically studied the circulation control technology. The results show that under certain blowing conditions, the lift gain of the aerofoil using circulation control technology is two to three times higher than that of the traditional aerofoil. Xu et al. [25,26] studied the effects of a circulation control device on the aerofoil of a wind turbine. They found that the use of circulation control technology increased the lift and reduced the drag. Although increasing the blowing coefficient or decreasing the height of the blowing gap can further enhance the aerodynamic efficiency, more external energy is consumed.
Numerous studies have been conducted on circulation control technology in terms of theory and application. However, most of the current single-stage circulation control technologies must satisfy the conditions of high-speed jet flow at the blowing slot; this, in turn, requires significant energy consumption. To resolve this, a multistage circulation control aerofoil was developed in this study. Through pneumatic measurement and a particle image velocimetry (PIV) experiment, the advantages of the proposed multistage circulation control were compared. The aerofoil aerodynamic characteristics, which vary with the blowing coefficient and ratio of multistage circulation control, were obtained. Moreover, the effectiveness of the multistage cycle control and changing blowing conditions in improving the aerodynamic efficiency of the wind turbine aerofoil was verified.
The structure of this paper is as follows. The first part introduces the advantages and disadvantages of most flow control technologies used to improve the aerodynamic performance of wind turbine blades. The advantages of circulation control technology and the problems encountered in the application of single-stage circulation control technology are introduced. The second section introduces the experimental model and conditions. The analysis of force measurement results and their discussion in terms of three aspects (varying the number of blowing slots, blowing coefficient, and blowing proportion) are presented in the third section. The fourth part elaborates on the study of the flow control mechanism of the trailing edge when the number of blowing slots, blowing coefficient, and blowing ratio are modified. The fifth part summarises the study.
2. Experimental Equipment and Programme
2.1. Wind Tunnel Experimental System
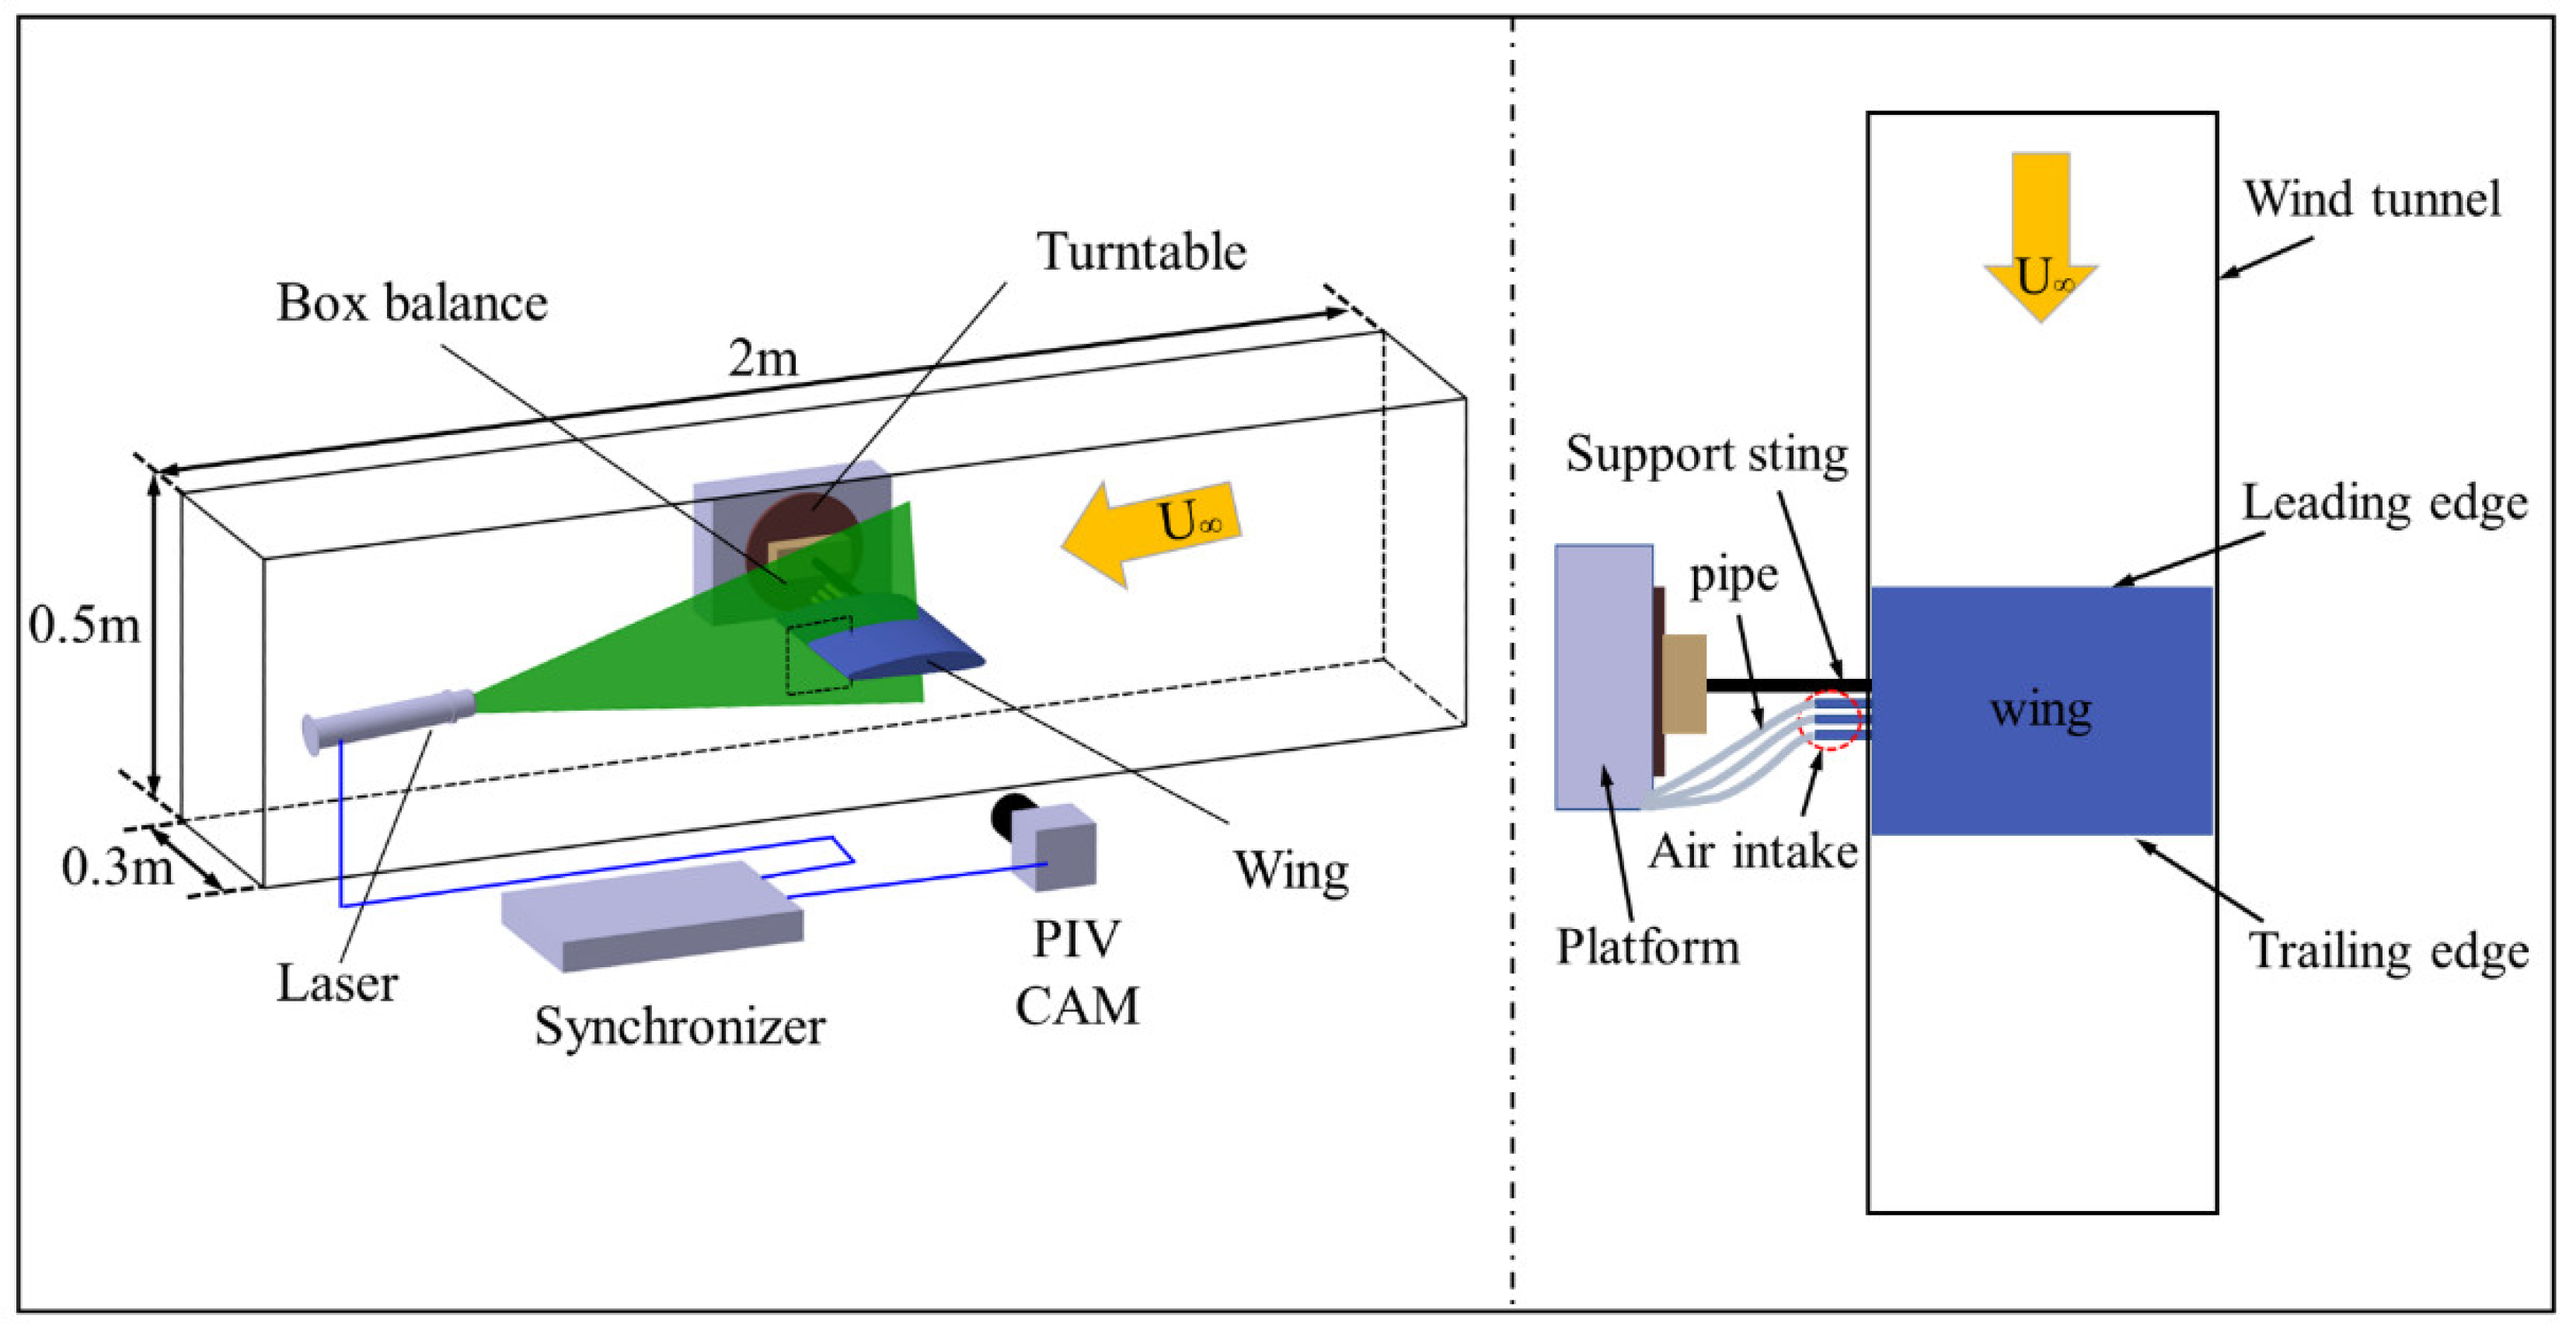
The experiment was conducted in the low-turbulence direct-flow wind tunnel of the Key Laboratory of Fluid and Power Machinery of the Ministry of Education, Xihua University. The dimensions of the experimental section were 2.0 m × 0.3 m × 0.5 m (length × width × height), the turbulence of the wind tunnel was less than 0.5%, the airflow deviation angle was less than 0.5°, and the adjustable steady wind speed was 5–35 m/s. The wind tunnel experimental system is shown in Figure 2.
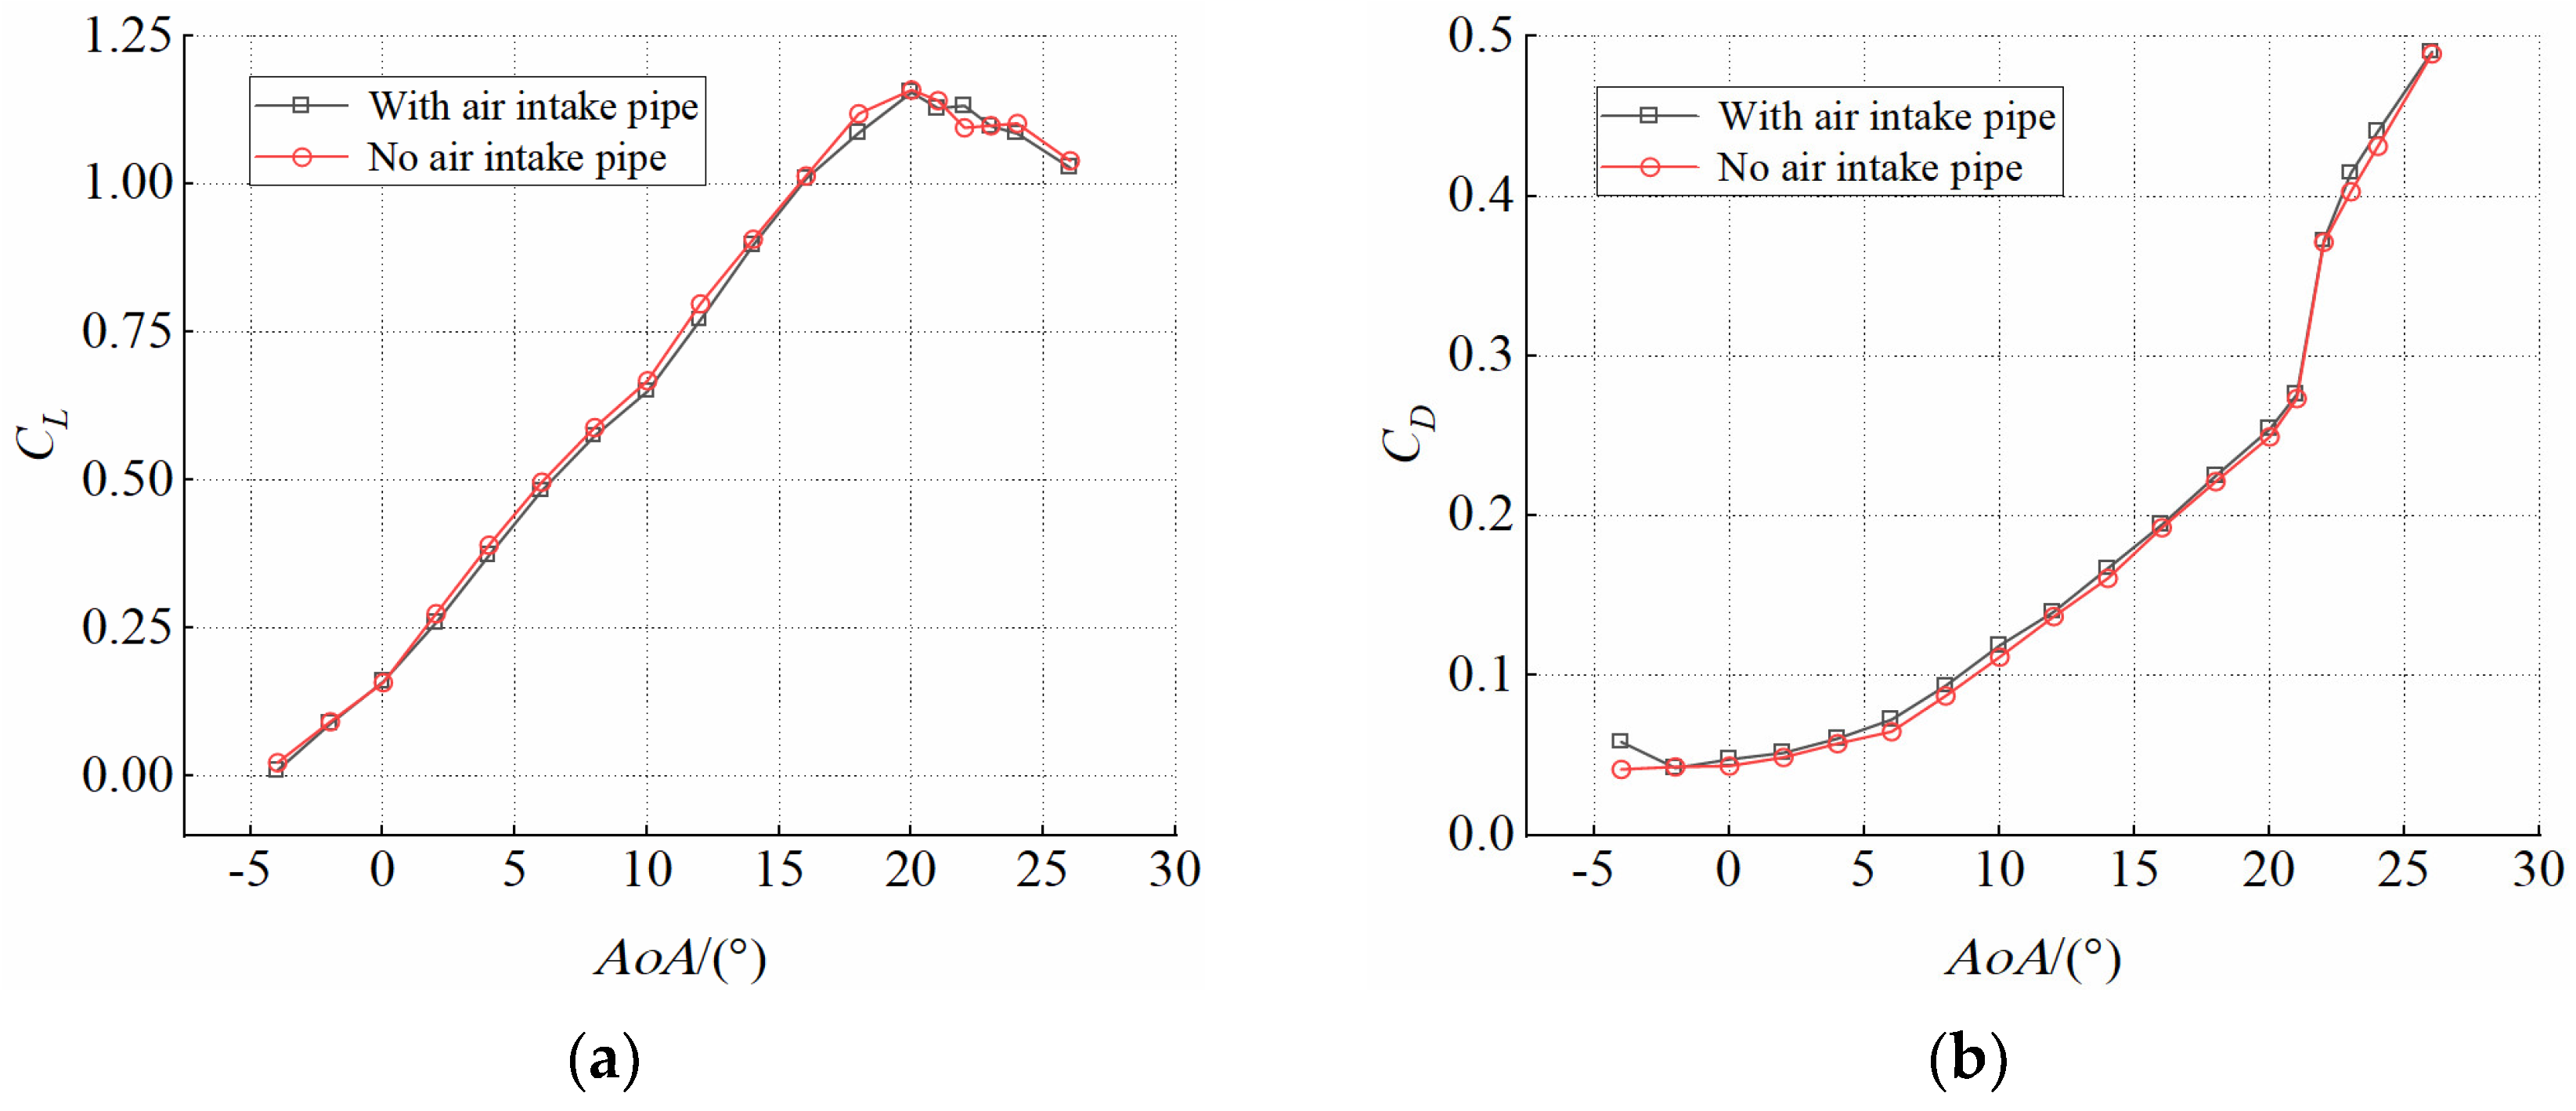
To avoid the influence of gravity and other impact forces on the force measurement data when the blowing pipe was connected with the air inlet, in the experiment, the blowing pipe was fixed to the mobile platform and then connected to the air source. The aerodynamic measurement results recorded when the pipe was connected and not connected to the wing are shown in Figure 3. In the two cases, the lift and drag coefficients of the wing were observed to be fundamentally the same, indicating that the installation of the blowing pipe has no influence on the aerodynamic measurement.
Similarly, to avoid the influence of air intake on the flow field, the wingspan was 296 mm, which also avoided collision between the wing and the wall of the wind tunnel and eliminated the influence on the force measurement results. Moreover, the air intake was extended outside the wind tunnel and then connected to the blowing pipe. Thus, the influence of air inlet on the flow field was effectively avoided.
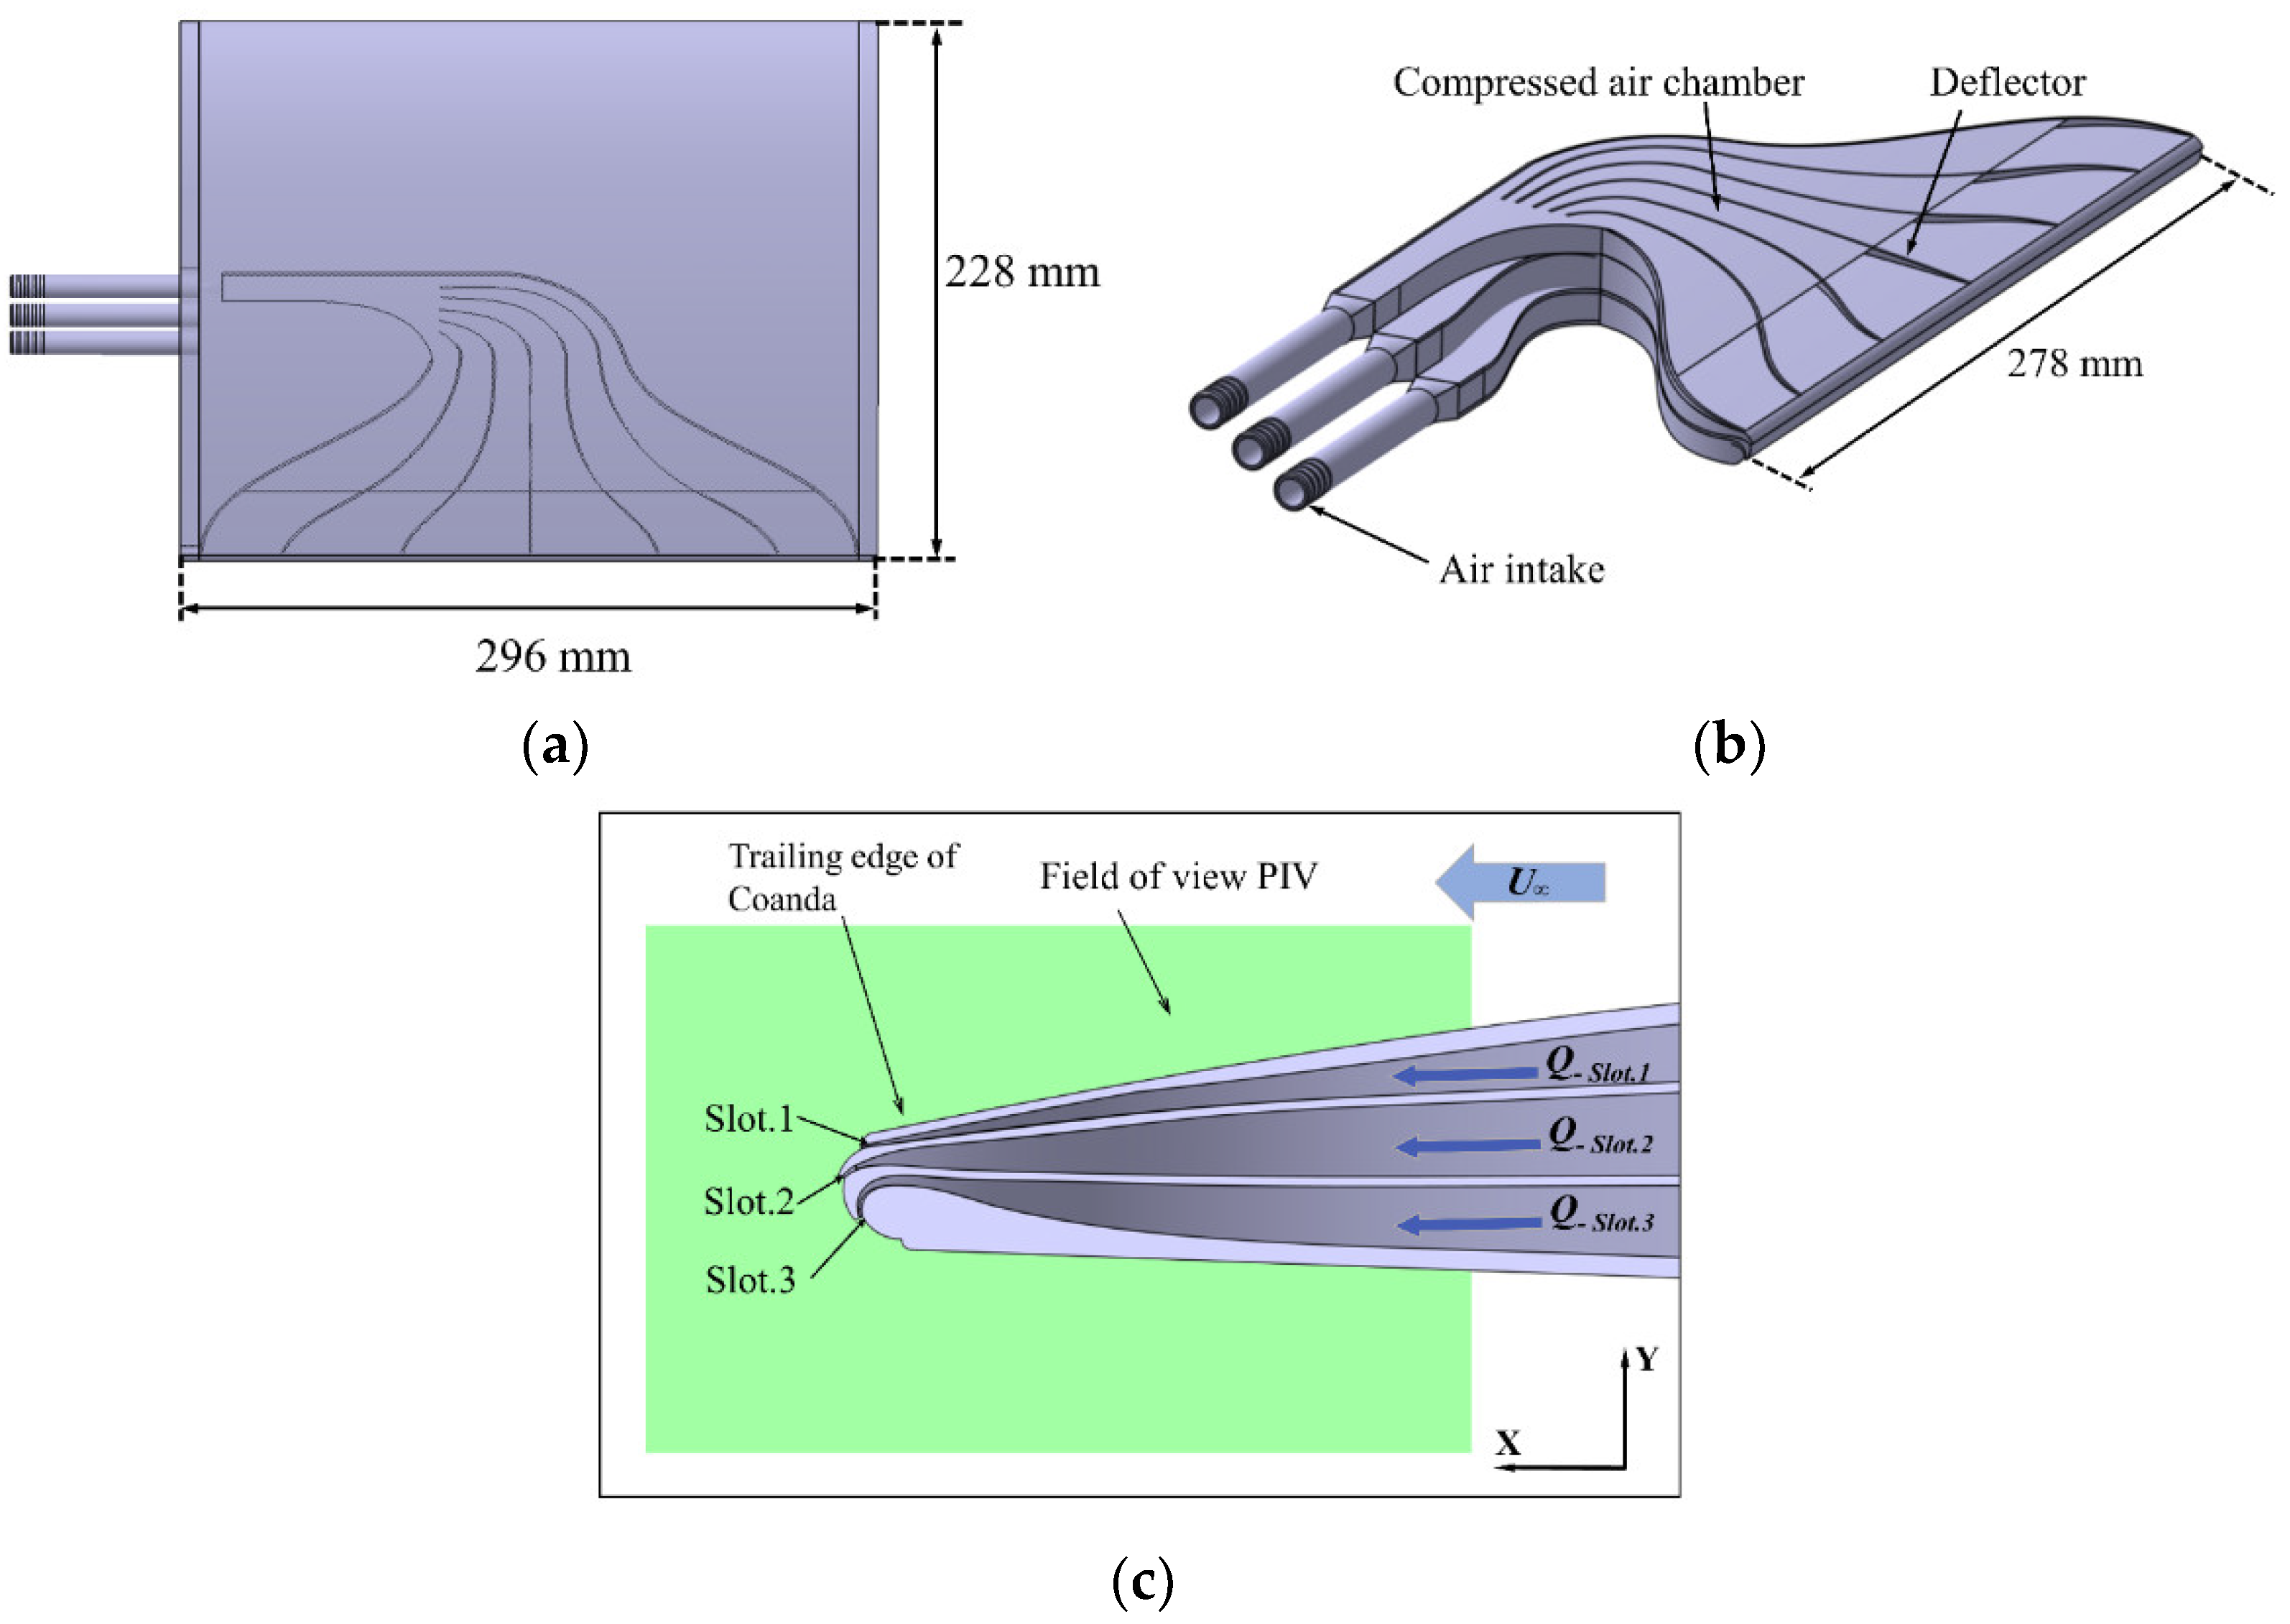
As shown in Figure 4a, the experiment was to modify the pointed trailing edge of the original Clark-Y airfoil into a circular trailing edge with a radius of 4.5 mm, and the modified airfoil chord length was 228 mm. The modified Clark-Y airfoil was used to design a two-dimensional equivalent wing with a length of 296 mm. The Clark-Y airfoil was selected in the experiment mainly because of its large lift-to-drag ratio and good stall performance. The multistage circulation control device is shown in Figure 4b. The design of the air inlet and the three layers of the compressed air chamber could realise the independent blowing control of the three slots. The trailing-edge shape, blow slot position, and PIV experimental shooting area are shown in Figure 4c. The trailing-edge radius was 4.5 mm, and three slots were open from top to bottom. The height (h) of the slots was 0.4 mm (h/c = 0.0018). Slot.1 was located at the beginning of the rear edge of the arc; Slot.2 was located 31.3% below the arc; and Slot.3 was located 69.9% below the position of the arc. In this experiment, single-slot blowing means that the trailing edge opens only one blowing slot (Slot.1). Double-slot blowing indicates that the trailing edge opens two blowing slots (Slot.1 and Slot.2). Three-slot blowing denotes that the trailing edge opens three blowing slots (Slot.1, Slot.2, and Slot.3). The wings and the multistage circulation control device are all 3D printed in one piece.
A high-pressure centrifugal fan was used to supply air to the blowing device. The maximum flow was 330 m3/h, and the dynamic pressure was 36 kPa. The fan outlet was divided into three outputs. The high precision flow meter was connected to the fan outlet and model inlet. The different flow sizes were controlled by adjusting the flow meter.
To describe the blowing volume and facilitate comparison, the blowing coefficient, Cμ, is calculated as follows:
where is the jet mass flow rate; is the jet velocity, which is calculated by flow meter reading and jet outlet area; is the free-stream density; is the free-stream velocity; and S is the reference area of the wing. The blowing coefficient, Cμ, is the ratio of the momentum flux of the jet to that of the free-stream.
2.2. Aerodynamic Force and Flow-Field Measurement System
The force measurement system mainly includes a DH8300N dynamic signal acquisition system, balance, connecting piece, and rotating mechanism. The measurement range, calibration accuracy and calibration accuracy of the six-component box strain balance used in this experiment are shown in Table 1.
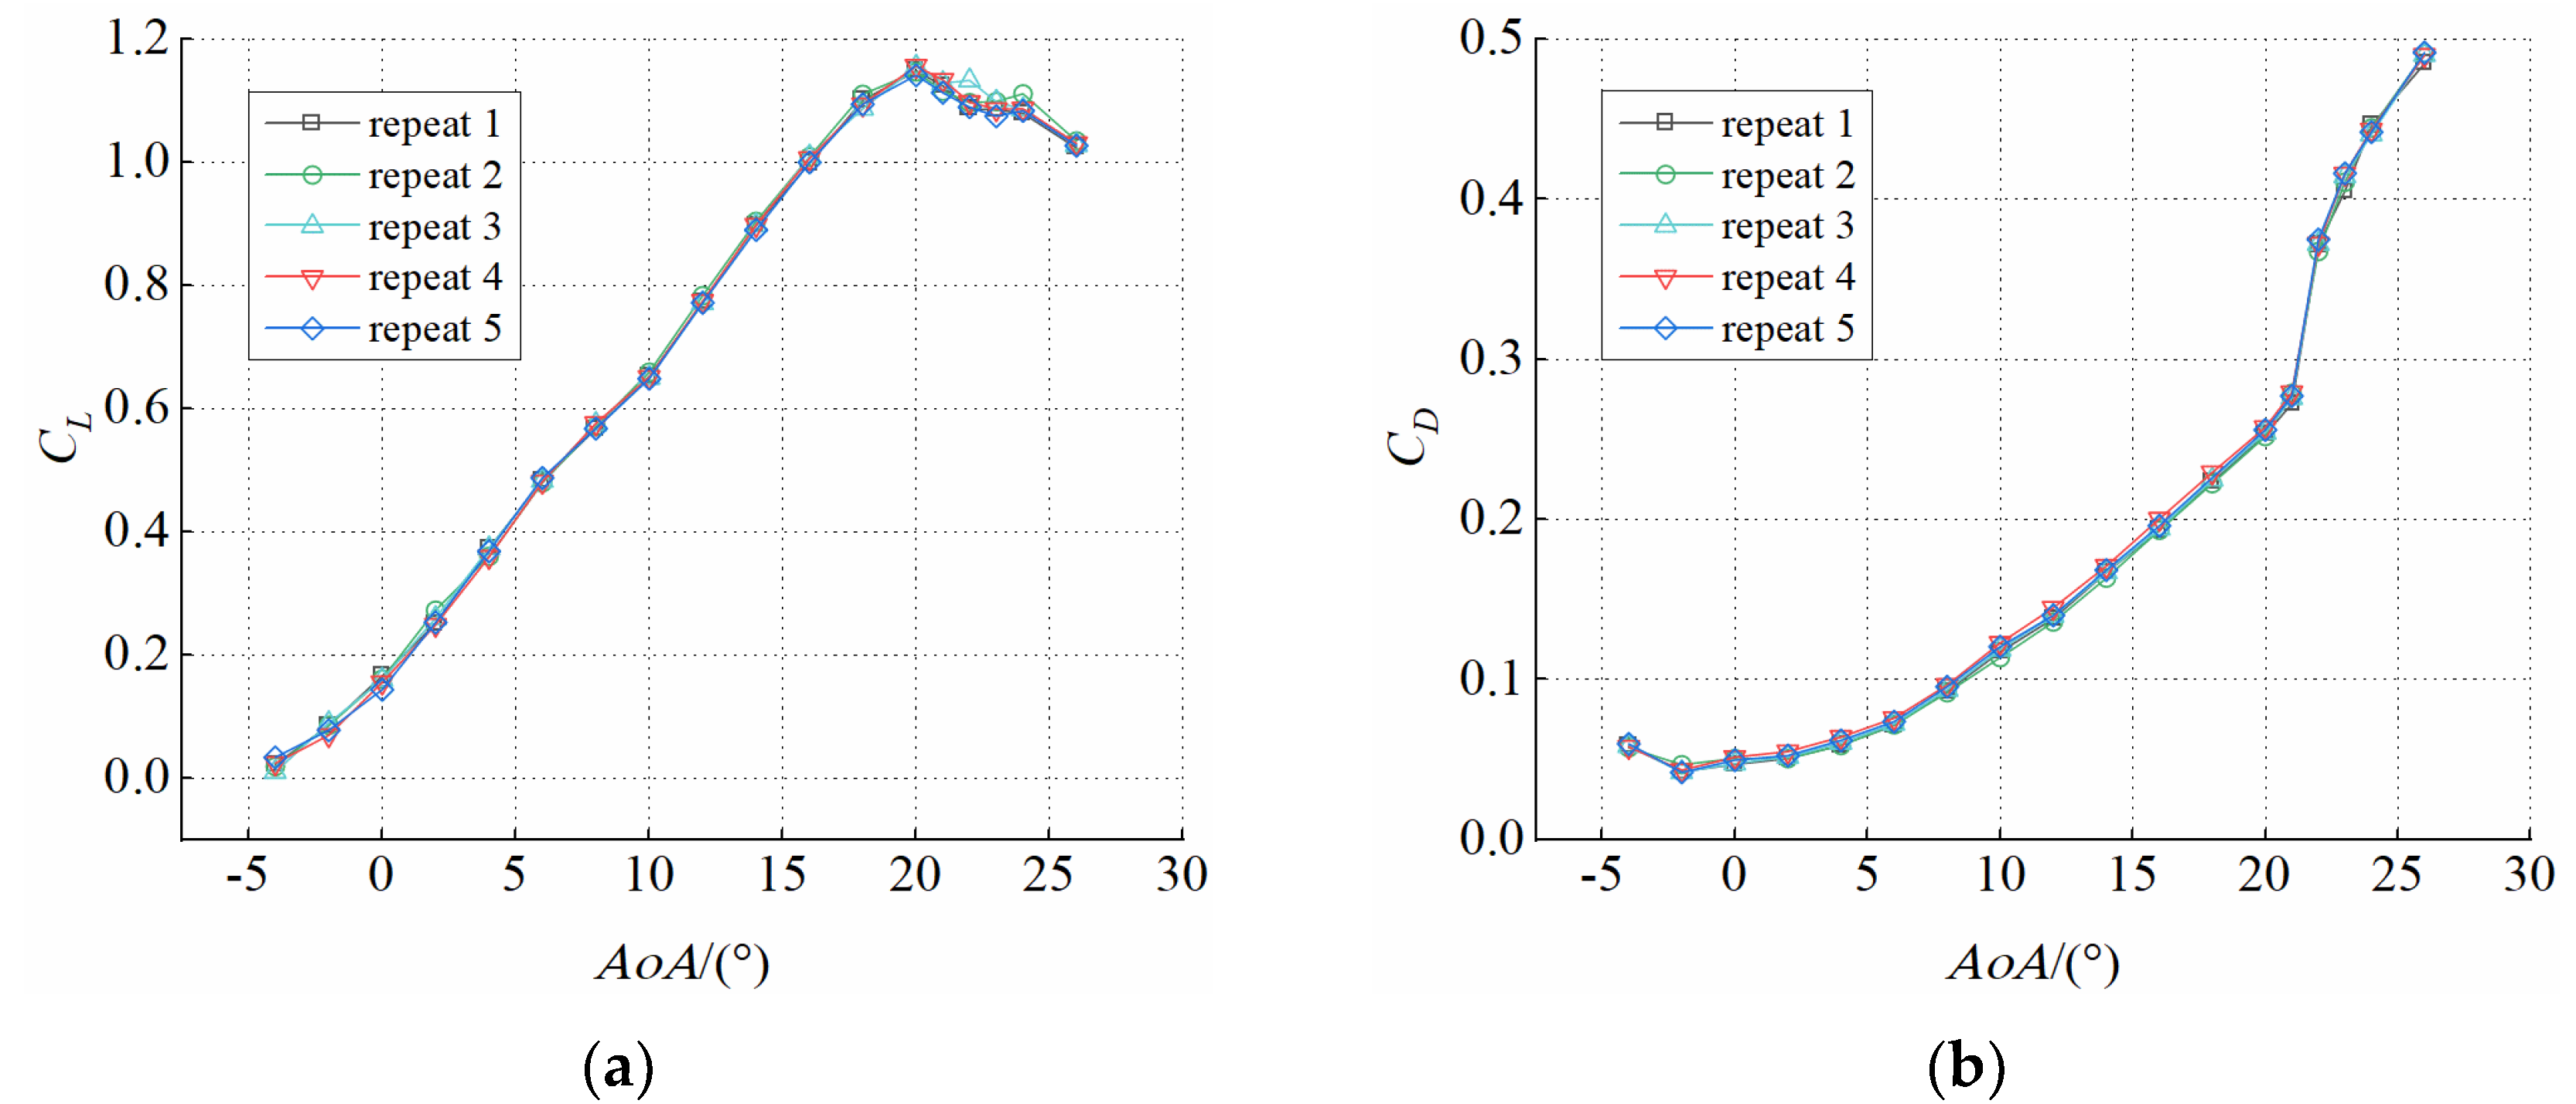
To verify the stability of the force measurement system, five experiments were repeatedly conducted when the experimental wind speed was 8 m/s, and the trailing edge was not blown. The experimental results are shown in Figure 5. The calculated repeatability errors of the lift and drag coefficients were 0.971% and 0.616%, respectively, indicating that the experimental system was stable and reliable.
When measuring the aerodynamic force under the circulation control, due to the proportion of the jet reverse thrust to the aerodynamic force of the model body under typical working conditions , this paper ignores the influence of the jet reverse thrust on the aerodynamic force in the analysis.
High-time resolution PIV measures the velocity distribution on the wing surface and wake. The speed measurement system includes a Fastcam AX-100 high-speed camera (1024 pixel × 1024 pixel (12 bits)) (Motion Engineering Company, Westfield, IN, USA), Nikon 85 mm lens, Vlite-Hi-527 double-pulse laser (energy: 20 mJ; output wavelength: 532 nm) (Beamtech Company, Beijing, China), tracer particle generator (Dongfang Fluid Measurement Technology Co., Ltd., Beijing, China), computer and an ILA synchroniser (pulse interval: 30 μs) (ILA 5150 Company, Rotter Bruch 26a 52068 Aachen, Germany).
The ILA synchroniser controls the digital synchronisation between the high-speed cameras and lasers. The smoke particle generator produces approximately 1 μm oil droplets in the flow field. The laser generates an approximately 1 mm thick slice of light. After calibration, the physical space size of the camera shooting area was 121 mm × 121 mm, so the pixel ratio was 0.118 mm/pixels. Due to the limitation of the laser range, it also captured the region where x/c = 1 as the reference at the trailing edge, and the flow direction was from x/c = 0.8 to x/c = 1.2, and the vertical direction was from y/c = −0.11 to y/c = 0.125 area (length 91.2 mm, width 53.8 mm). The camera shooting frequency was 2000 Hz, the recording time was 4 s, and 8000 consecutive images were recorded. The PIV-view software was used to process the original images, and a cross-correlation algorithm was adopted. The interrogation window was 64 × 64, and the overlap rate was 50%.
3. Analysis and Discussion of Experimental Results of Force
3.1. Influence of Number of Slots on Aerodynamic Characteristics
To study the influence of different numbers of slots on the wing aerodynamic force, a force measurement experiment with a variable number of slots was conducted. In the experiment, the single slot blowing generated a jet at Slot.1, and Slot.2 and Slot.3 were closed. Two slot blowing produced jets at Slot.1 and Slot.2, and closed Slot.3. Table 2 lists the experimental parameters for the variable number of slots. The total input flow was consistently maintained, and the input flow of each slot was evenly distributed. The experimental wind speed was 8 m/s, and the Reynolds number was 1.21 × 10⁵.
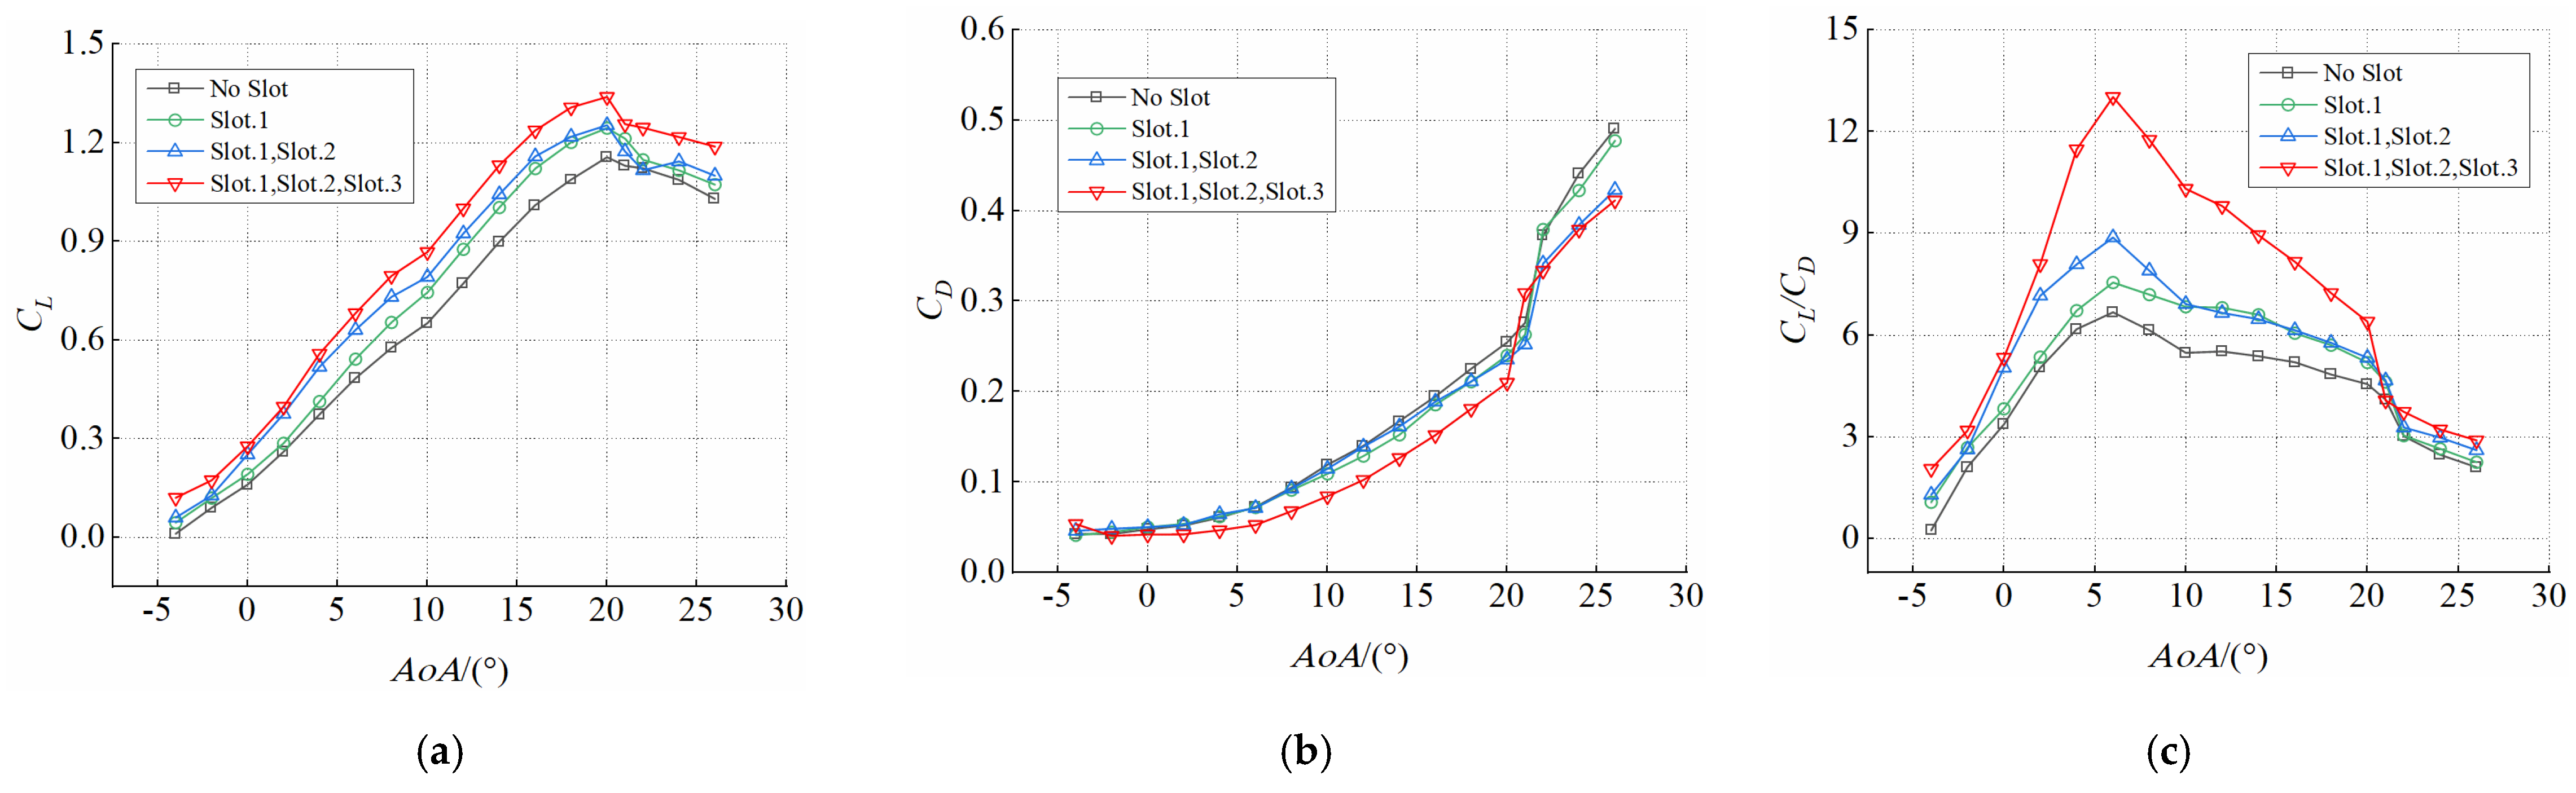
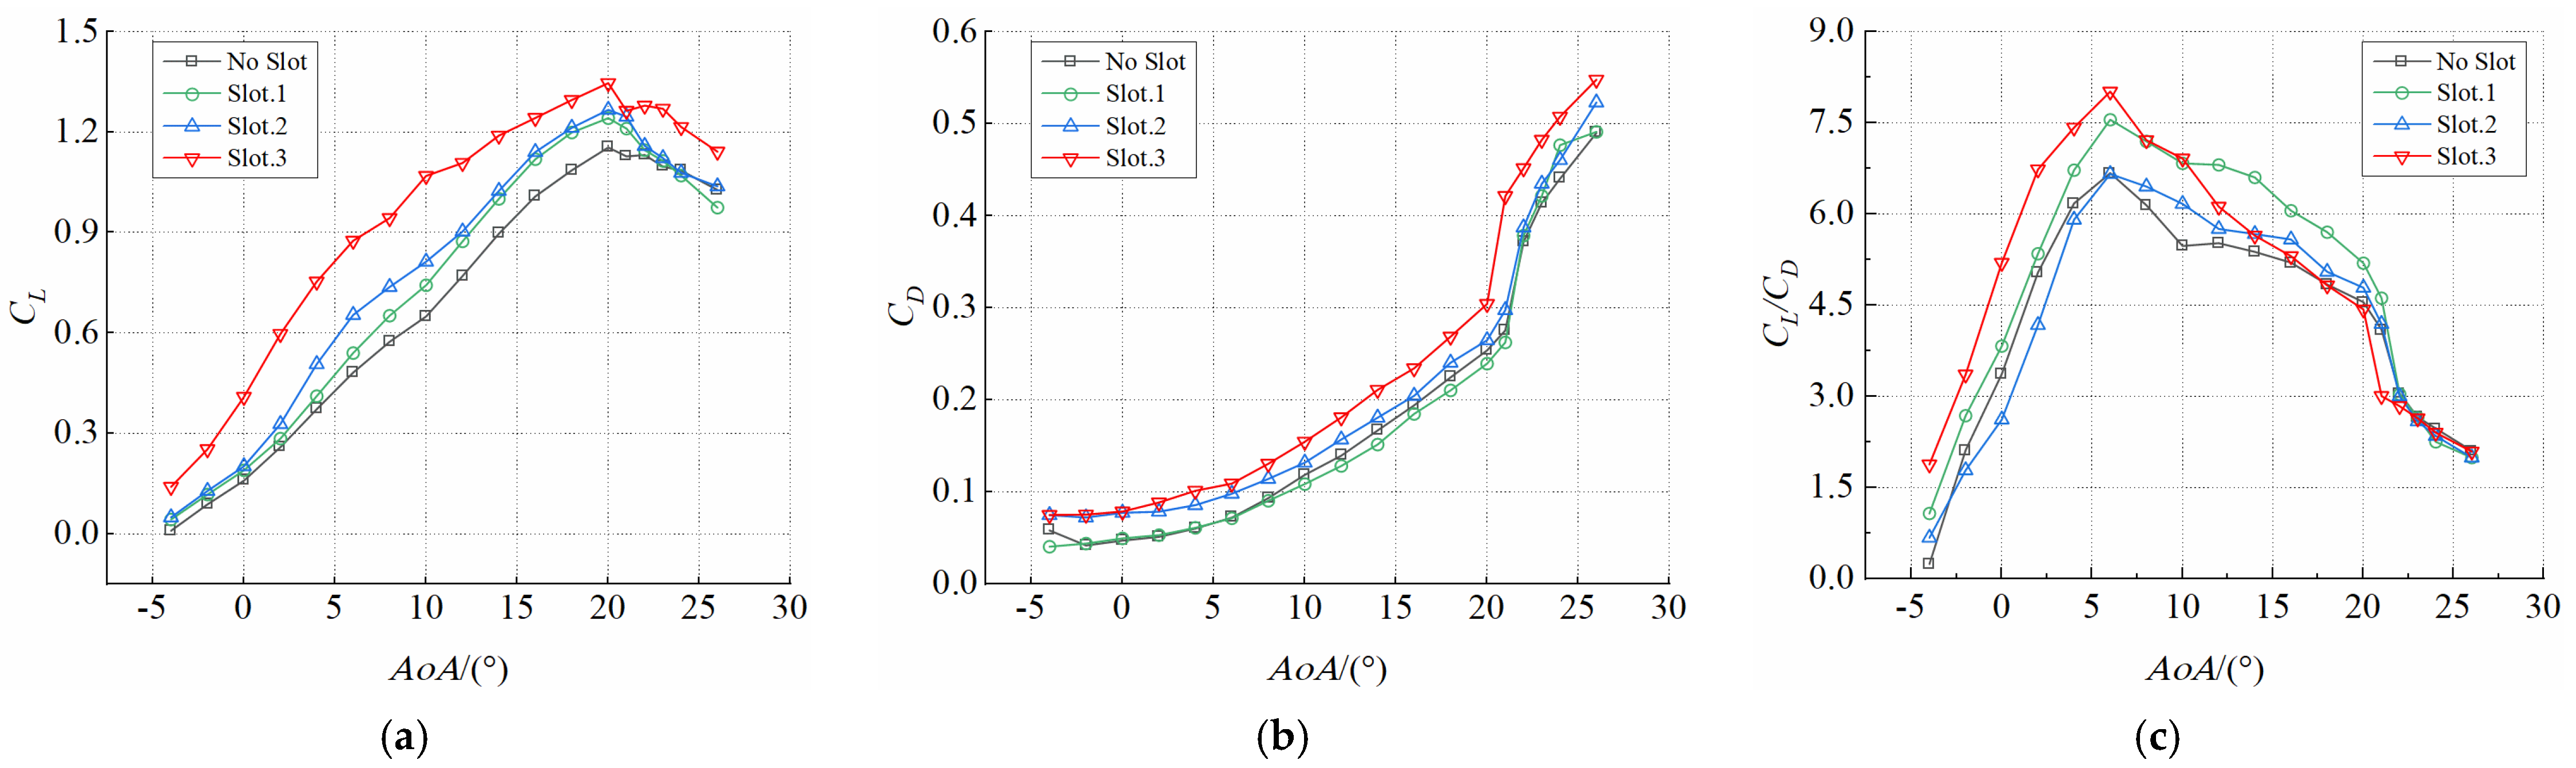
The aerodynamic results of the wing when the total input flow was Q = 41.91 m3/h and the number of blowing slots of the trailing edge changes are shown in Figure 6. The lift coefficient and lift-to-drag ratio increased with the number of slots, as shown in Figure 6a,c, respectively. The maximum lift-to-drag ratios corresponding to single-slot blowing, double-slot blowing, and three-slot blowing increased by 13.2, 21.5, and 95.3%, respectively, compared with those in the absence of blowing. The drag coefficient significantly decreased when three slots were simultaneously used, as shown in Figure 6b.
The multistage circulation control (double-slot and triple-slot blowing) can further enhance the aerodynamic force of the wing compared with the single-stage circulation control (single-slot blowing) under the premise that the amount of external energy consumed is the same.
3.2. Influence of Blowing Coefficient on Aerodynamics of Wing with Circulation Control
According to the force measurement experiment with a variable number of slots, under the same input flow rate, the best control effect is achieved when the three slots are simultaneously blown. Accordingly, the effect of varying the blowing coefficient on the aerodynamic performance of the wing was studied when the three slots were concurrently blown.
Air was independently supplied to the three slots during the experiment, and the same flow rate was applied. The experimental conditions are summarised in Table 3. The experimental wind speed was 8 m/s, and the Reynolds number was 1.21 × 10⁵.
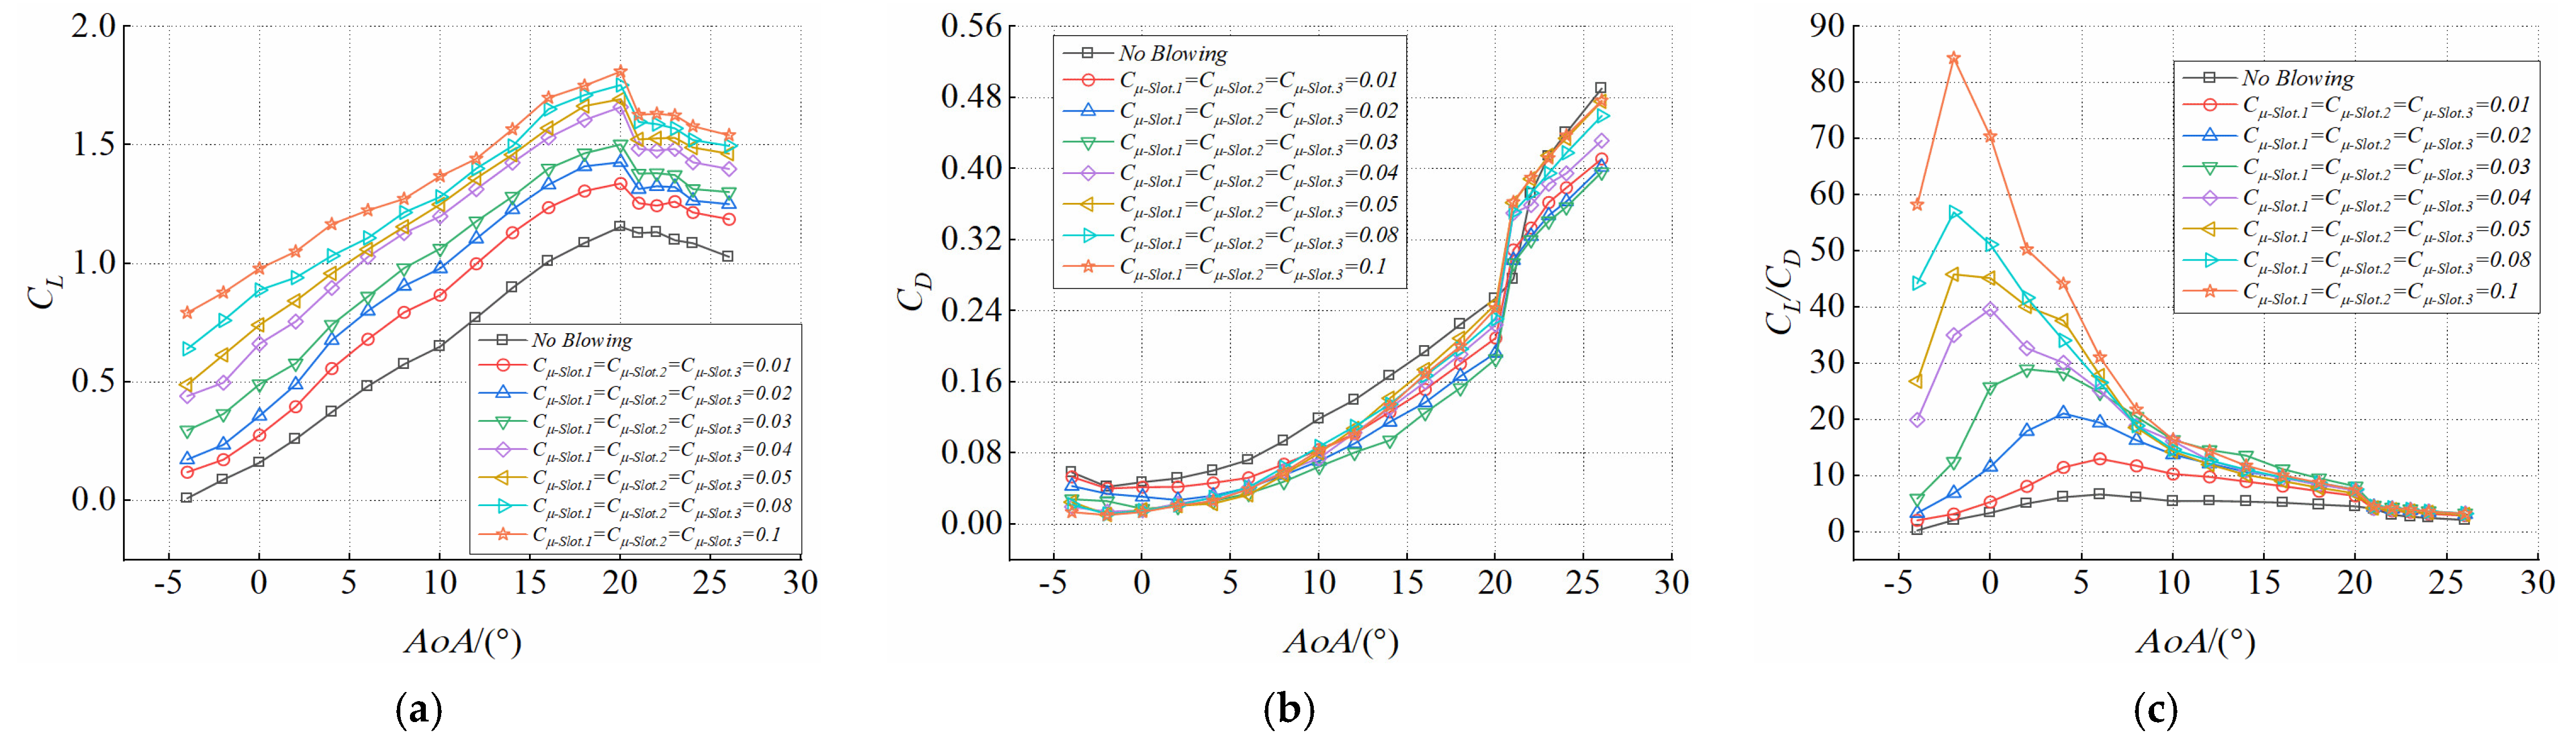
The aerodynamic characteristic curves of the wing with different blowing coefficients recorded, when the three slots were simultaneously blown into, are shown in Figure 7. The lift coefficient curve of the wing gradually shifted upward when the blowing coefficient increased, and the maximum lift coefficient increased from 1.15 (without blowing) to 1.81 (Cμ-Slot.1 = Cμ-Slot.2 = Cμ-Slot.3 = 0.1), as shown in Figure 7a. The drag coefficients in the presence of blowing were smaller than those in the absence of blowing, as shown in Figure 7b. As shown in Figure 7c, the lift-to-drag ratio also increased significantly with the increase in the blowing coefficient. The results show that an increase in the blowing coefficient had a significant effect on improving the wing aerodynamic performance under the action of simultaneous blowing of the three slots.
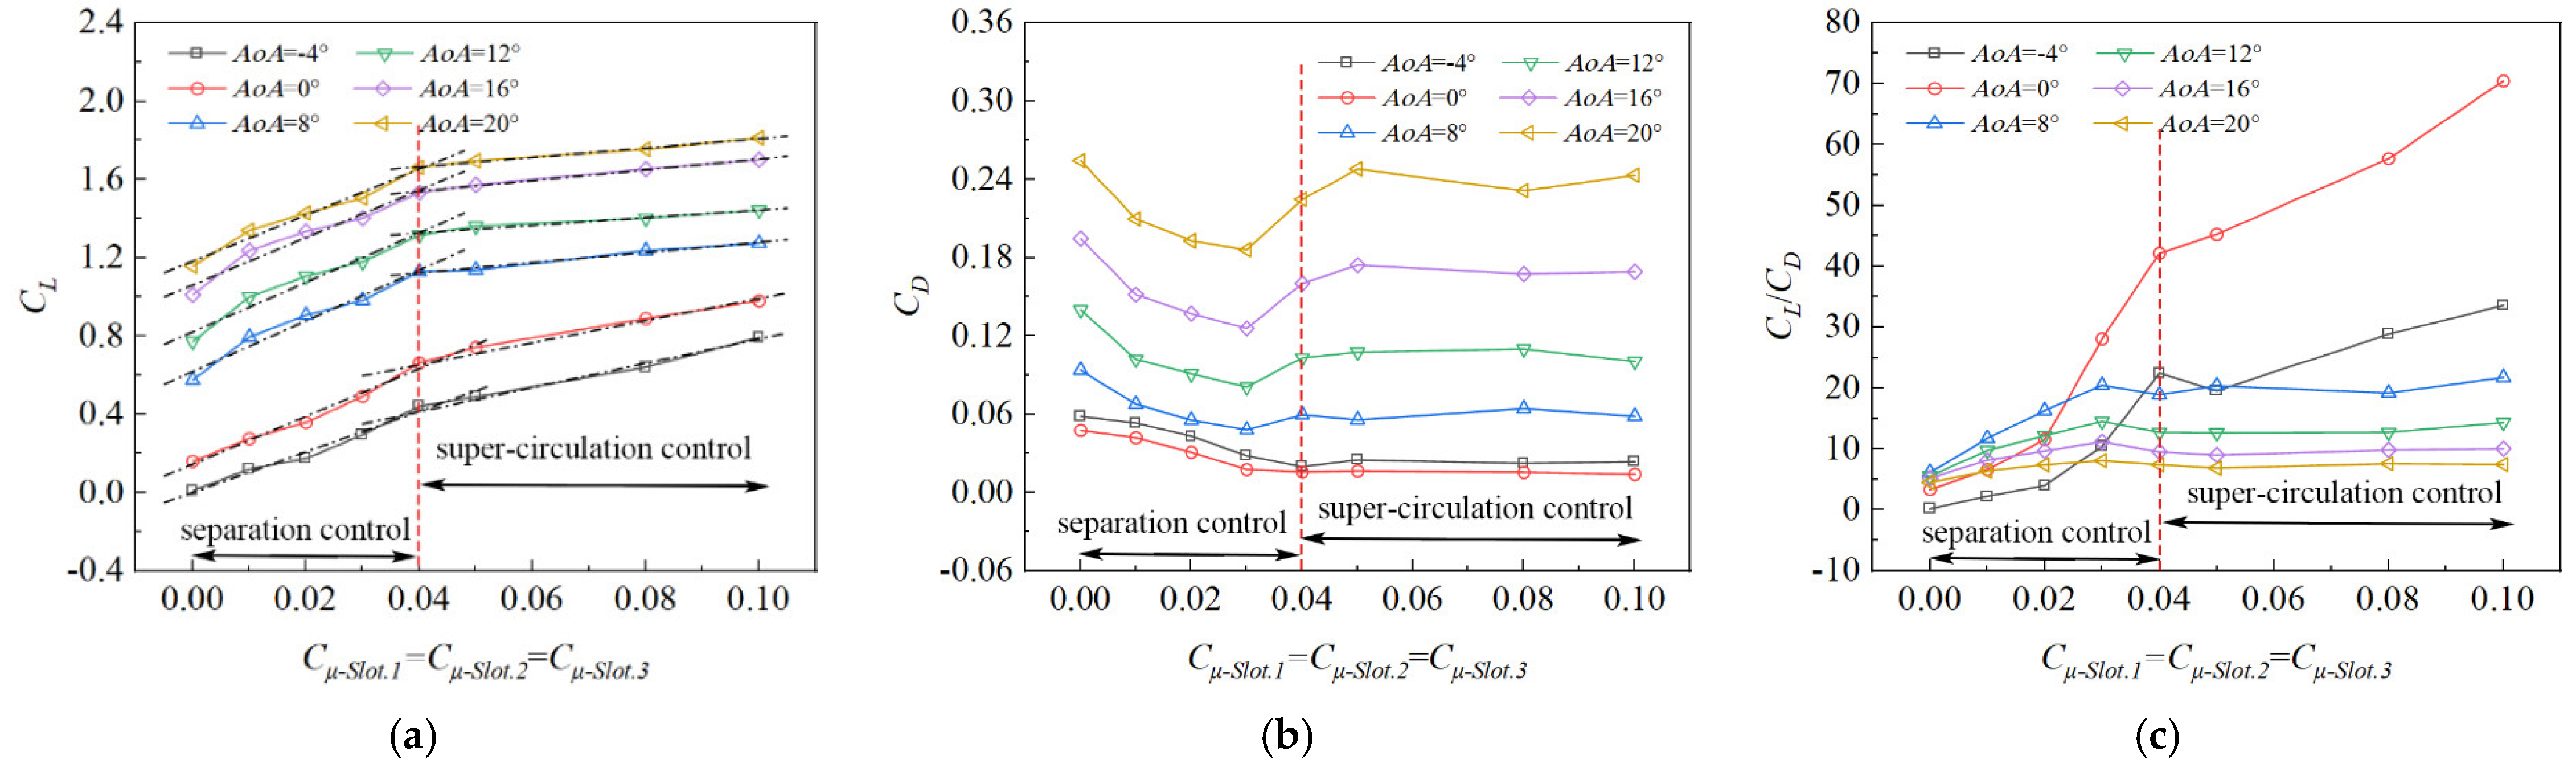
As shown by the CL–Cμ curve in Figure 8a, the wing lift coefficient gradually increased with the blowing coefficient; however, the slope of the lift coefficient curve decreased after Cμ-Slot.1 = Cμ-Slot.2 = Cμ-Slot.3 = 0.04. As shown by the CD–Cμ curve in Figure 8b, the drag coefficient did not monotonically decrease; instead, it increased after the blowing coefficient reached Cμ-Slot.1 = Cμ-Slot.2 = Cμ-Slot.3 = 0.03 and then finally flattened out. The CL/CD–Cμ curve in Figure 8c shows that the slope of the lift-to-drag ratio curve reached the maximum at a small angle of attack and tended to be gentle as the angle of attack gradually increased.
This is a typical phenomenon in which the lift and drag coefficients of a circulation control aerofoil appear to be critical points as the blowing coefficients increase [27]. At critical points, the blowing coefficients are also critical values. The critical point is preceded by the separation control stage; that is, when the blowing coefficient gradually increases, the jet separation position moves downward along the Coanda surface under the action of a high-speed jet and gradually moves away from the slot. After attaining the critical point, the supercirculation control stage follows (i.e., the separation position of the jet does not vary with the increase in the blowing coefficient). Compared with the supercirculation control stage, the effect of lift increase and drag reduction on the separation control stage was better.
3.3. Effect of Different Proportions of Air Blowing on Wing Aerodynamics
The experiment on the blowing coefficient showed that increasing this coefficient could improve the lift and reduce the drag. However, as the blowing coefficient increased, the external input flow gradually increased, also increasing the energy consumption and weakening the lifting effect in the supercirculation control. Therefore, increasing the blowing coefficient has a specific limit in improving the aerodynamic performance of the wing. Accordingly, the aerodynamic efficiency of the wing under multistage circulation control must be enhanced without increasing the energy consumption, and the efficiency of each slot must be maximised. To accomplish this, an experiment in which the flow distribution of the three slots was varied when the total input flow was constant was conducted.
To evaluate the contribution of the different slots to the aerodynamic force of the wing, three slots were independently blown into. Then, a combined blowing control experiment on the three slots was performed.
3.3.1. Individual Blowing Experiments for Each Slot
In the experiment, air was independently supplied to the three slots at the same flow rate. The experimental conditions are summarised in Table 4. The experimental wind speed was 8 m/s, and the Reynolds number was 1.21 × 10⁵.
The aerodynamic characteristic curves of the wing without blowing and with each slot blown separately are shown in Figure 9. The lift coefficient curves for each slot blown separately are shown in Figure 9a. The minimum and maximum lift coefficients were attained at Slot.1 and Slot.3, respectively. The increase in lift in Slot.1 was small because its position was close to the suction surface, the entrainment effect of the slot jet on the mainstream was weak, and the jet was prematurely separated from the Coanda surface. In contrast, the lift increased in Slot.3 because its position was close to the pressure surface, and the jet flow increased the circulation around the aerofoil.
The drag coefficients of the three independently blown slots are compared in Figure 9b. The drag coefficients were minimum and maximum when Slot.1 and Slot.3 were subjected to blowing. Because Slot.1 is close to the suction surface, more energy is added to the boundary layer during blowing. This delays flow separation and reduces the drag on the wing. In the independent blowing experiment on the three slots, the drag reduction effect was excellent when Slot.1 was blown, whereas the increase in lift was evident when Slot.3 was blown.
3.3.2. Results of Experiment on Different Blowing Ratios for Three Slots
In the experiment with different blowing ratios, air was independently supplied to the three slots. In other words, the total input flow was fixed, and the input flow of each slot was allocated according to different proportions. The experimental conditions are summarised in Table 5. The experimental wind speed was 8 m/s, and the Reynolds number was 1.21 × 10⁵.
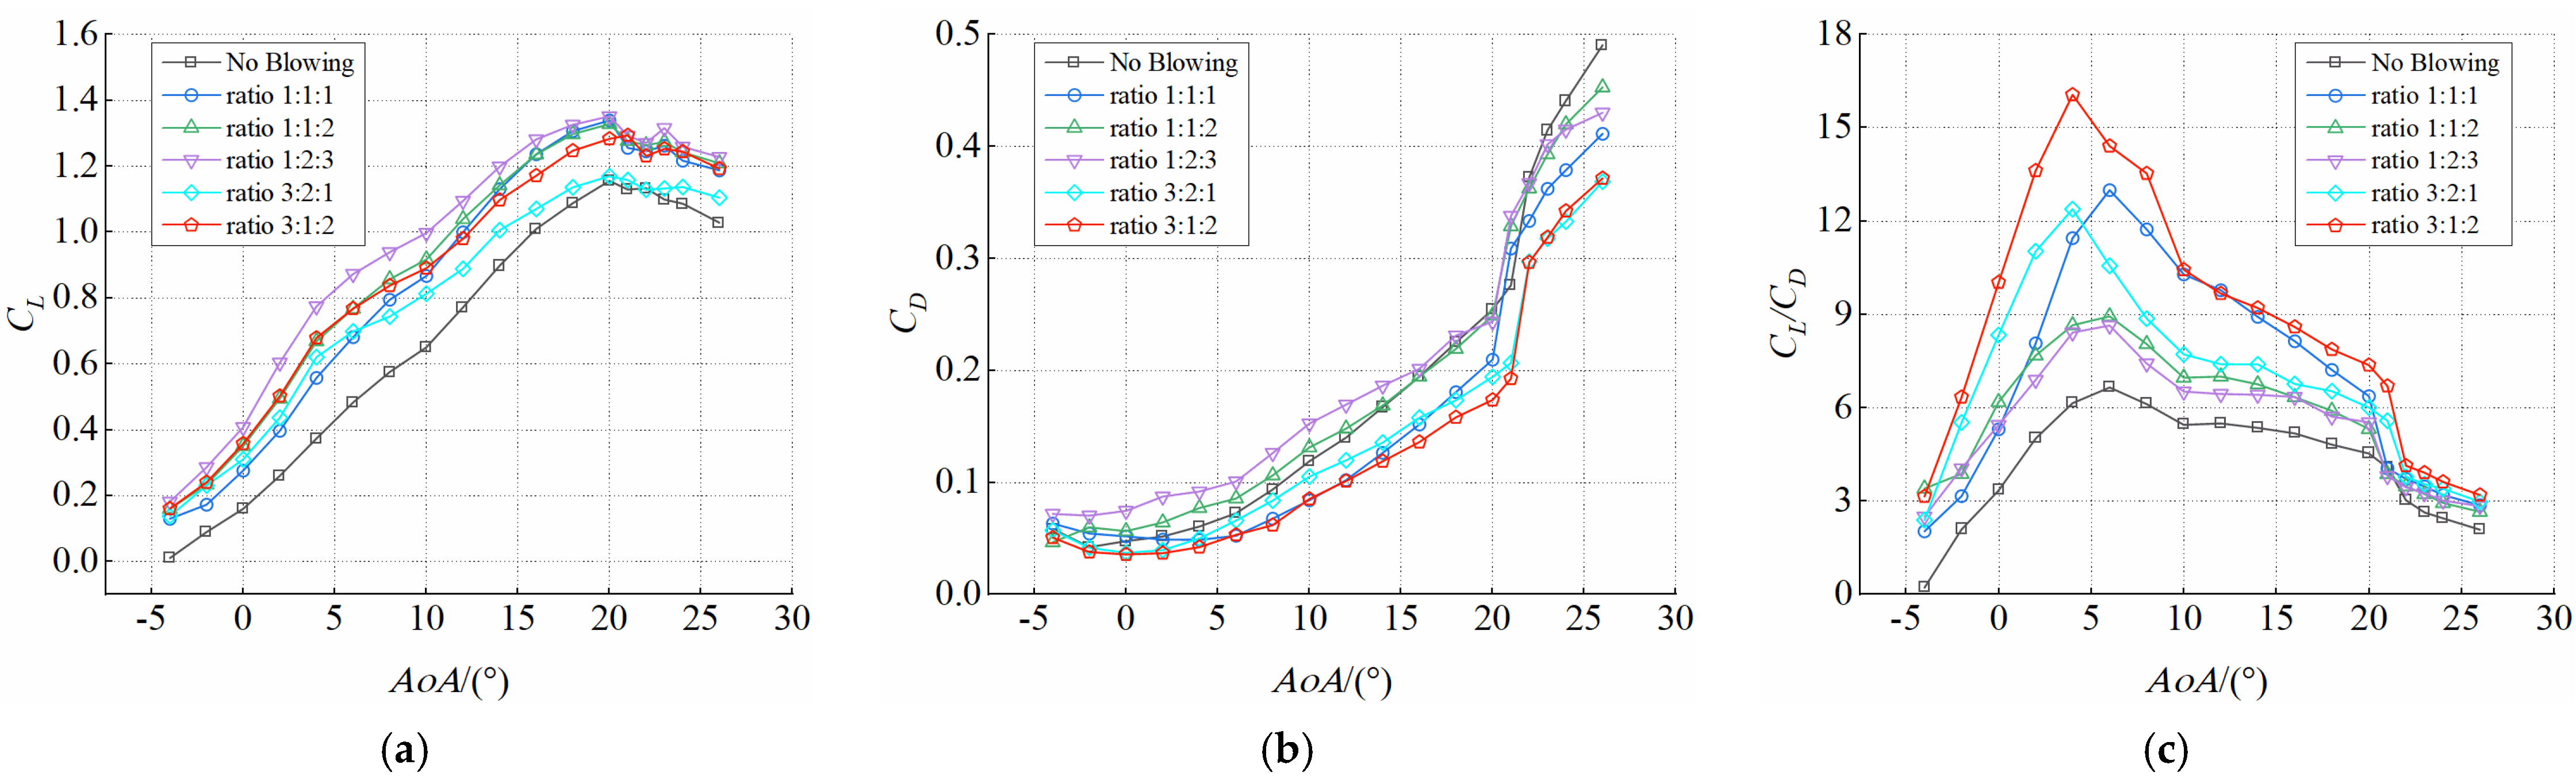
The characteristic aerodynamic curves of the wing when the three slots were blown at different proportions when the total input flow, Q = 41.91 m3/h, are shown in Figure 10. When the five blowing ratios shown in the figure were compared, the best control effect was observed when the 3:1:2 ratio was adopted. When the blowing ratios were 1:1:1 and 3:1:2, the maximum lift-to-drag ratios increased by 97.1 and 143.48%, respectively. The lift coefficient was highest when the blowing ratio was 1:2:3; however, the lift-to-drag ratio was low. This is because Slot.3 is close to the pressure surface, and the blowing flow distribution is considerable in this slot, thus increasing the lift. However, Slot.1 has a low flow distribution and no substantial drag-reduction effect; consequently, the lift–drag ratio does not significantly increase. These results are consistent with the conclusions of the slot-independent blowing experiment.
The slots have the following advantages. Slot.1 reduces the wing drag, Slot.2 has a transfer jet effect that inhibits the premature separation of the jet from the arc surface, and Slot.3 moves the stagnation point at the trailing edge further down, thus increasing the circulation and lift.
4. Mechanism of Multistage Circulation Control
This section mainly discusses the flow-field structure of the trailing edge when the experimental wind speed is 8 m/s and the Reynolds number is 1.21 × 10⁵. The flow mechanism was analysed under the conditions of increasing the number of slots, increasing blowing coefficient, and varying blowing ratio.
4.1. PIV Flow-Field Effect on Wing Aerodynamics at Different Number of Slots
In the flow experiment, the trailing edge was captured with no blowing and with single-slot blowing, double-slot blowing, and three-slot blowing under the condition that the total input flow was Q = 41.91 m3/h.
4.1.1. Control Mechanism of Variation in Number of Slots at a Low Angle of Attack
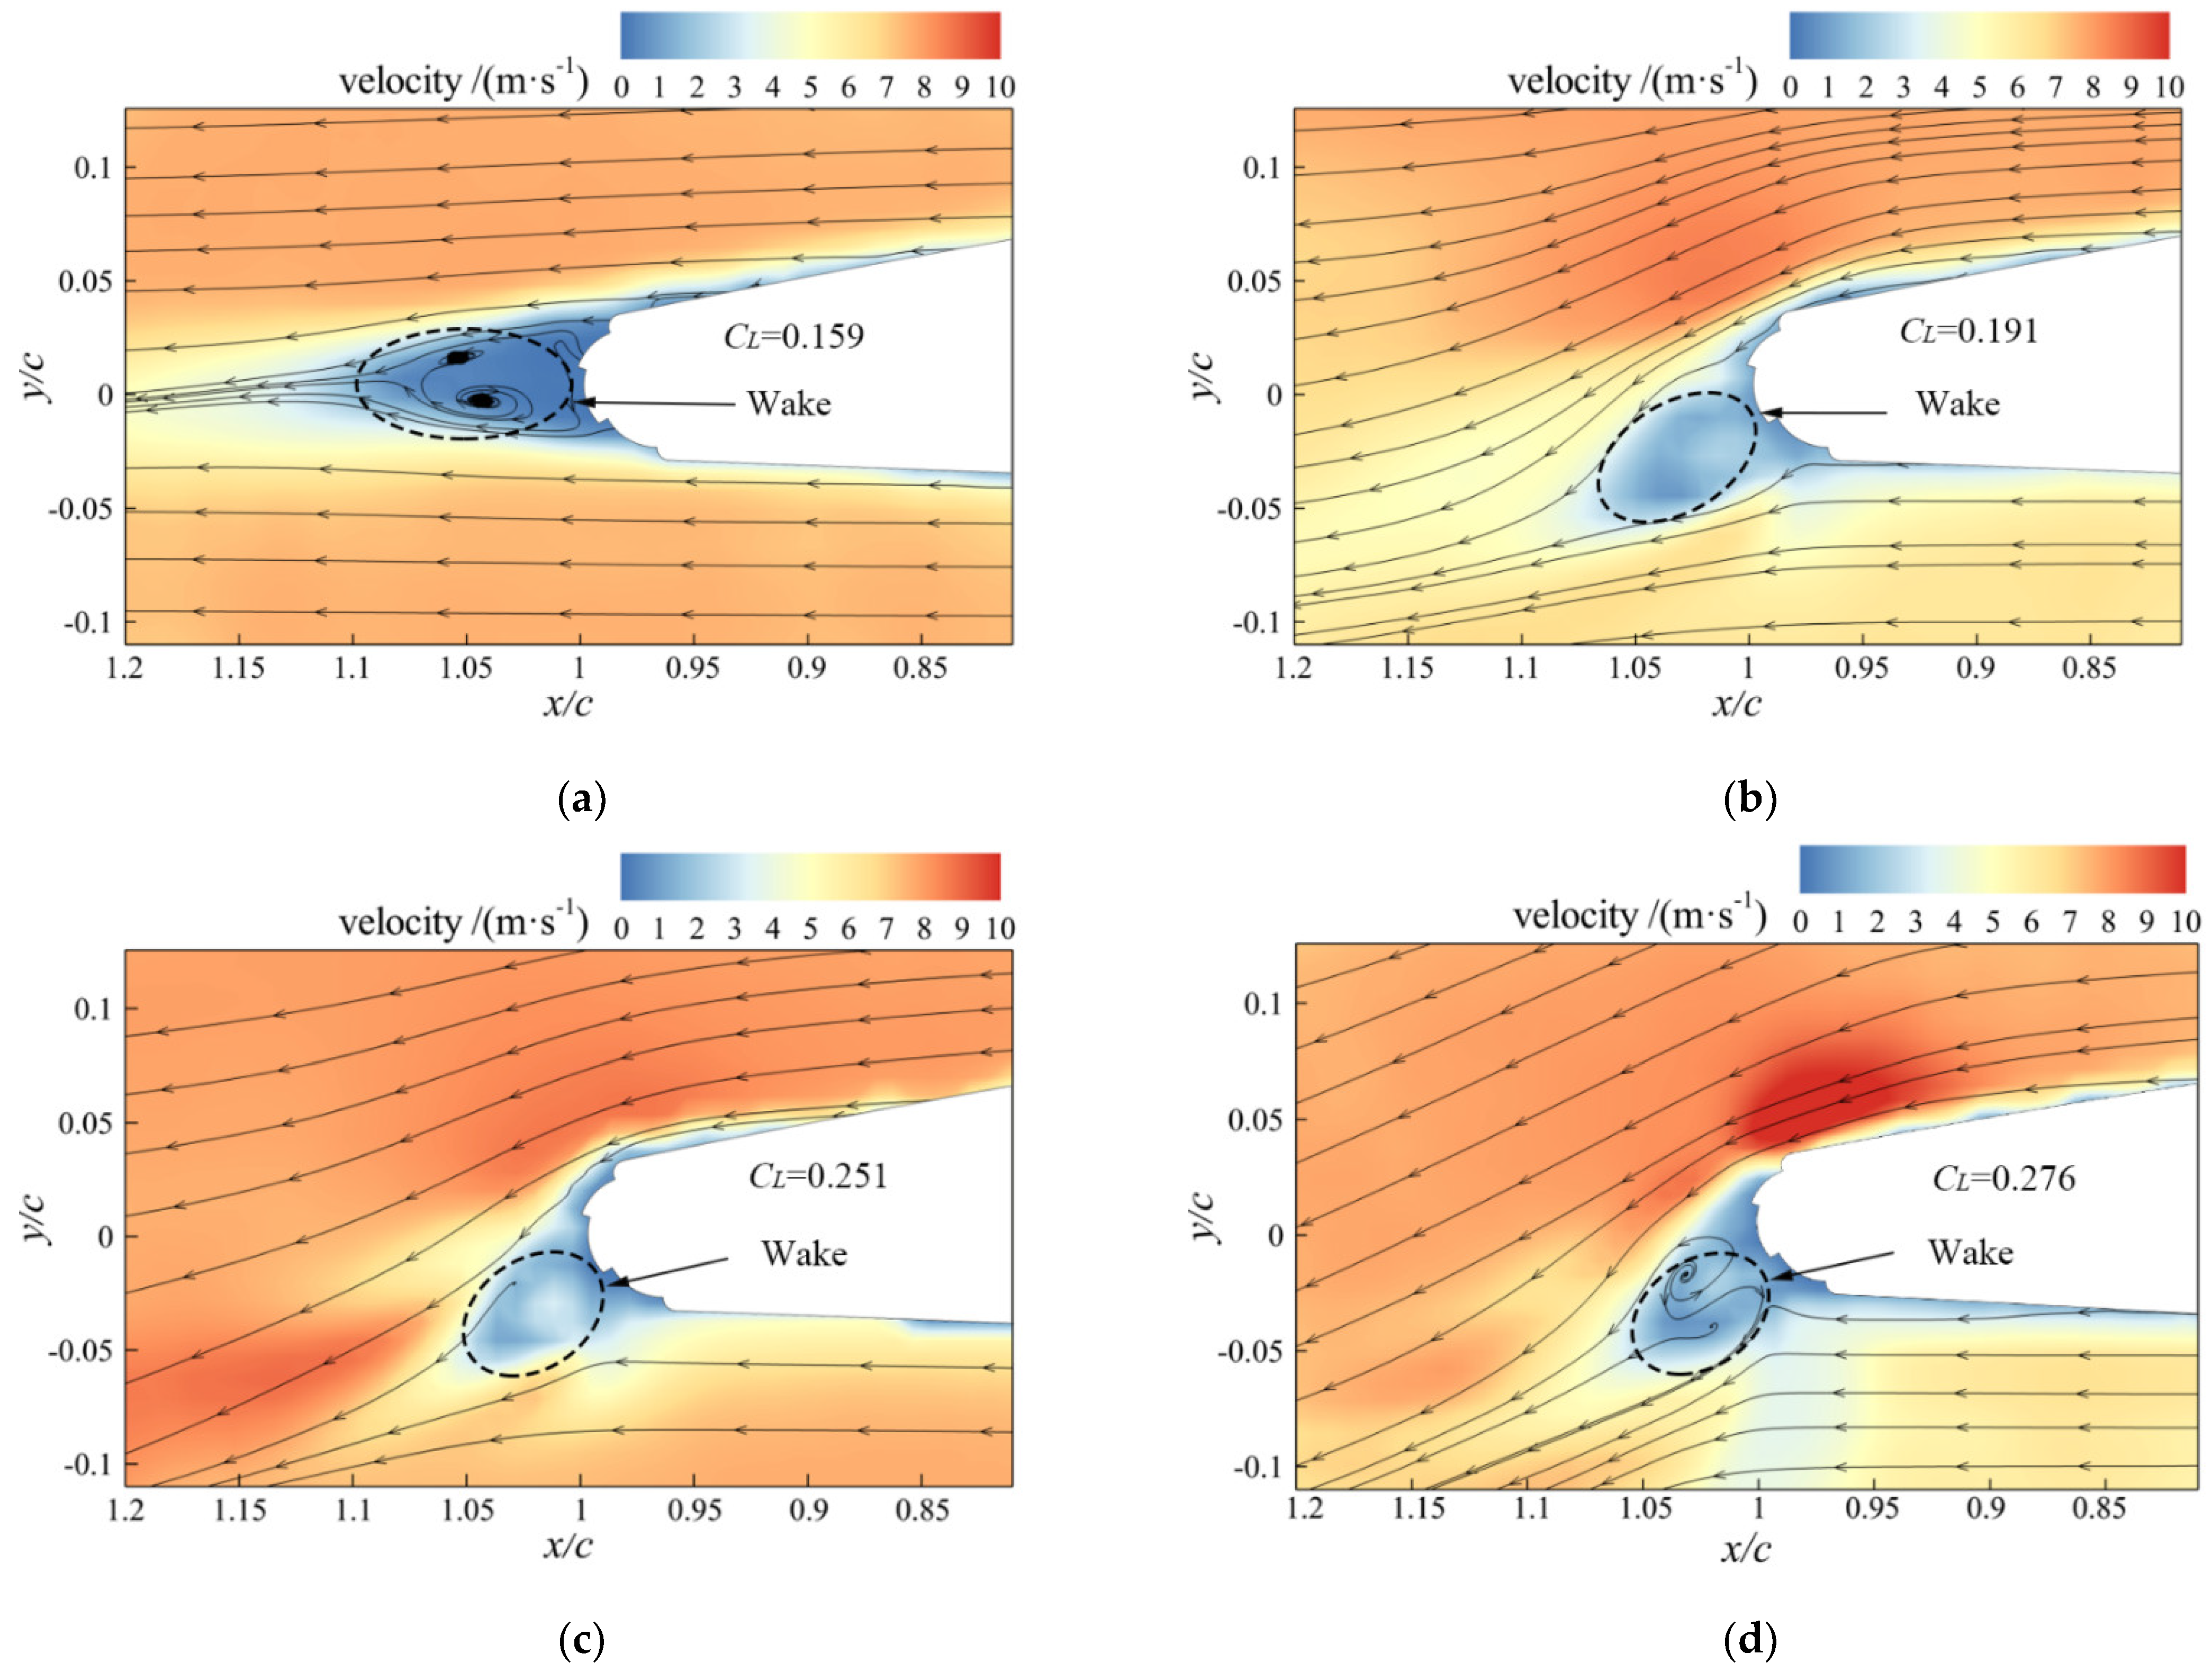
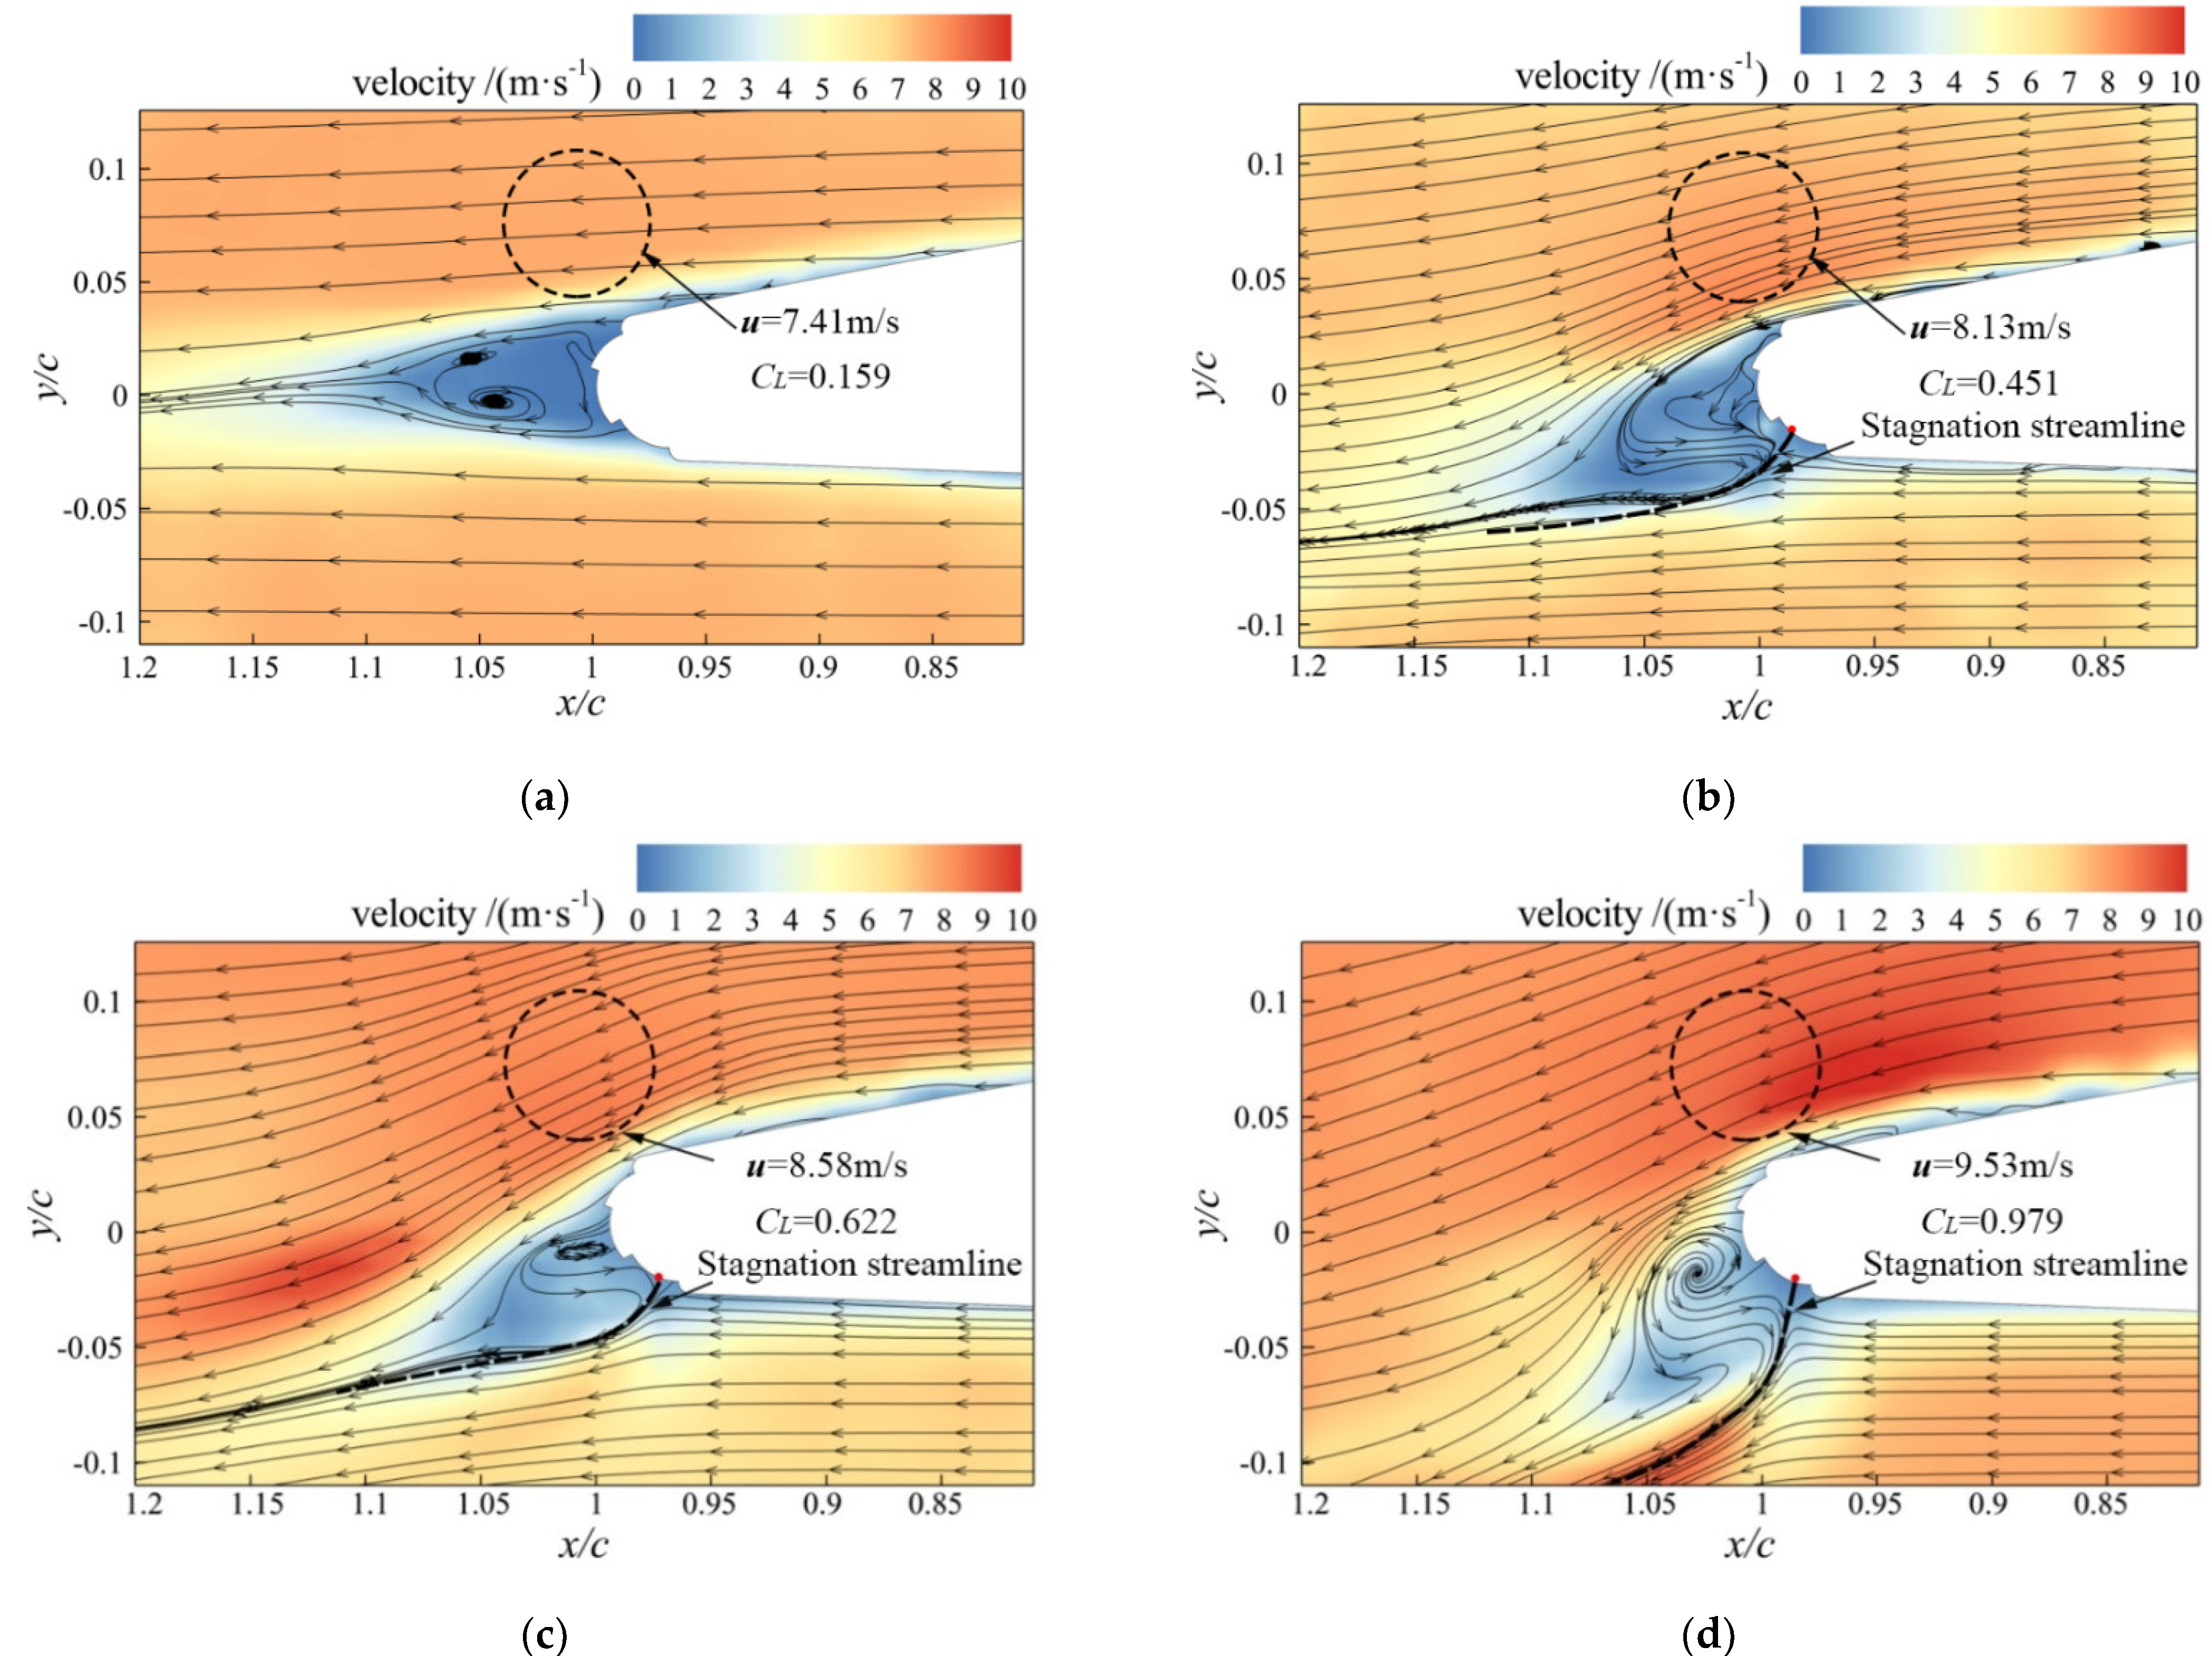
The time-averaged flow-field diagram of blowing air resulting from the increase in the number of trailing slots and when the angle of attack was 0° is shown in Figure 11. The flow-field diagram of blowing air with the angle of attack at 0° and increasing number of trailing slots is shown in Figure 11. According to the velocity cloud and streamline distribution, the trailing edge exhibited a distinct flow separation phenomenon without air blowing. This occurs because the trailing edge is modified compared with a normal aerofoil (blunt leading edge and pointed trailing edge). As the number of slots increased, the flow separation zone and range decreased. The deflection curvature of the trailing-edge streamlines was also found to increase with the number of slots.
The flow separation moved downward along the surface under the influence of the Coanda effect with the increasing number of blowing slots. First, multiple-slot blowing had a relay effect. This influence intensifies the shear action of blowing, accelerates the flow near the jet, and increases the downward bending of the streamlines near the trailing edge. Consequently, the equivalent aerofoil camber changes, increasing the circulation around the aerofoil, which in turn increases lift.
4.1.2. Control Mechanism of Variation in Number of Slots at High Angle of Attack
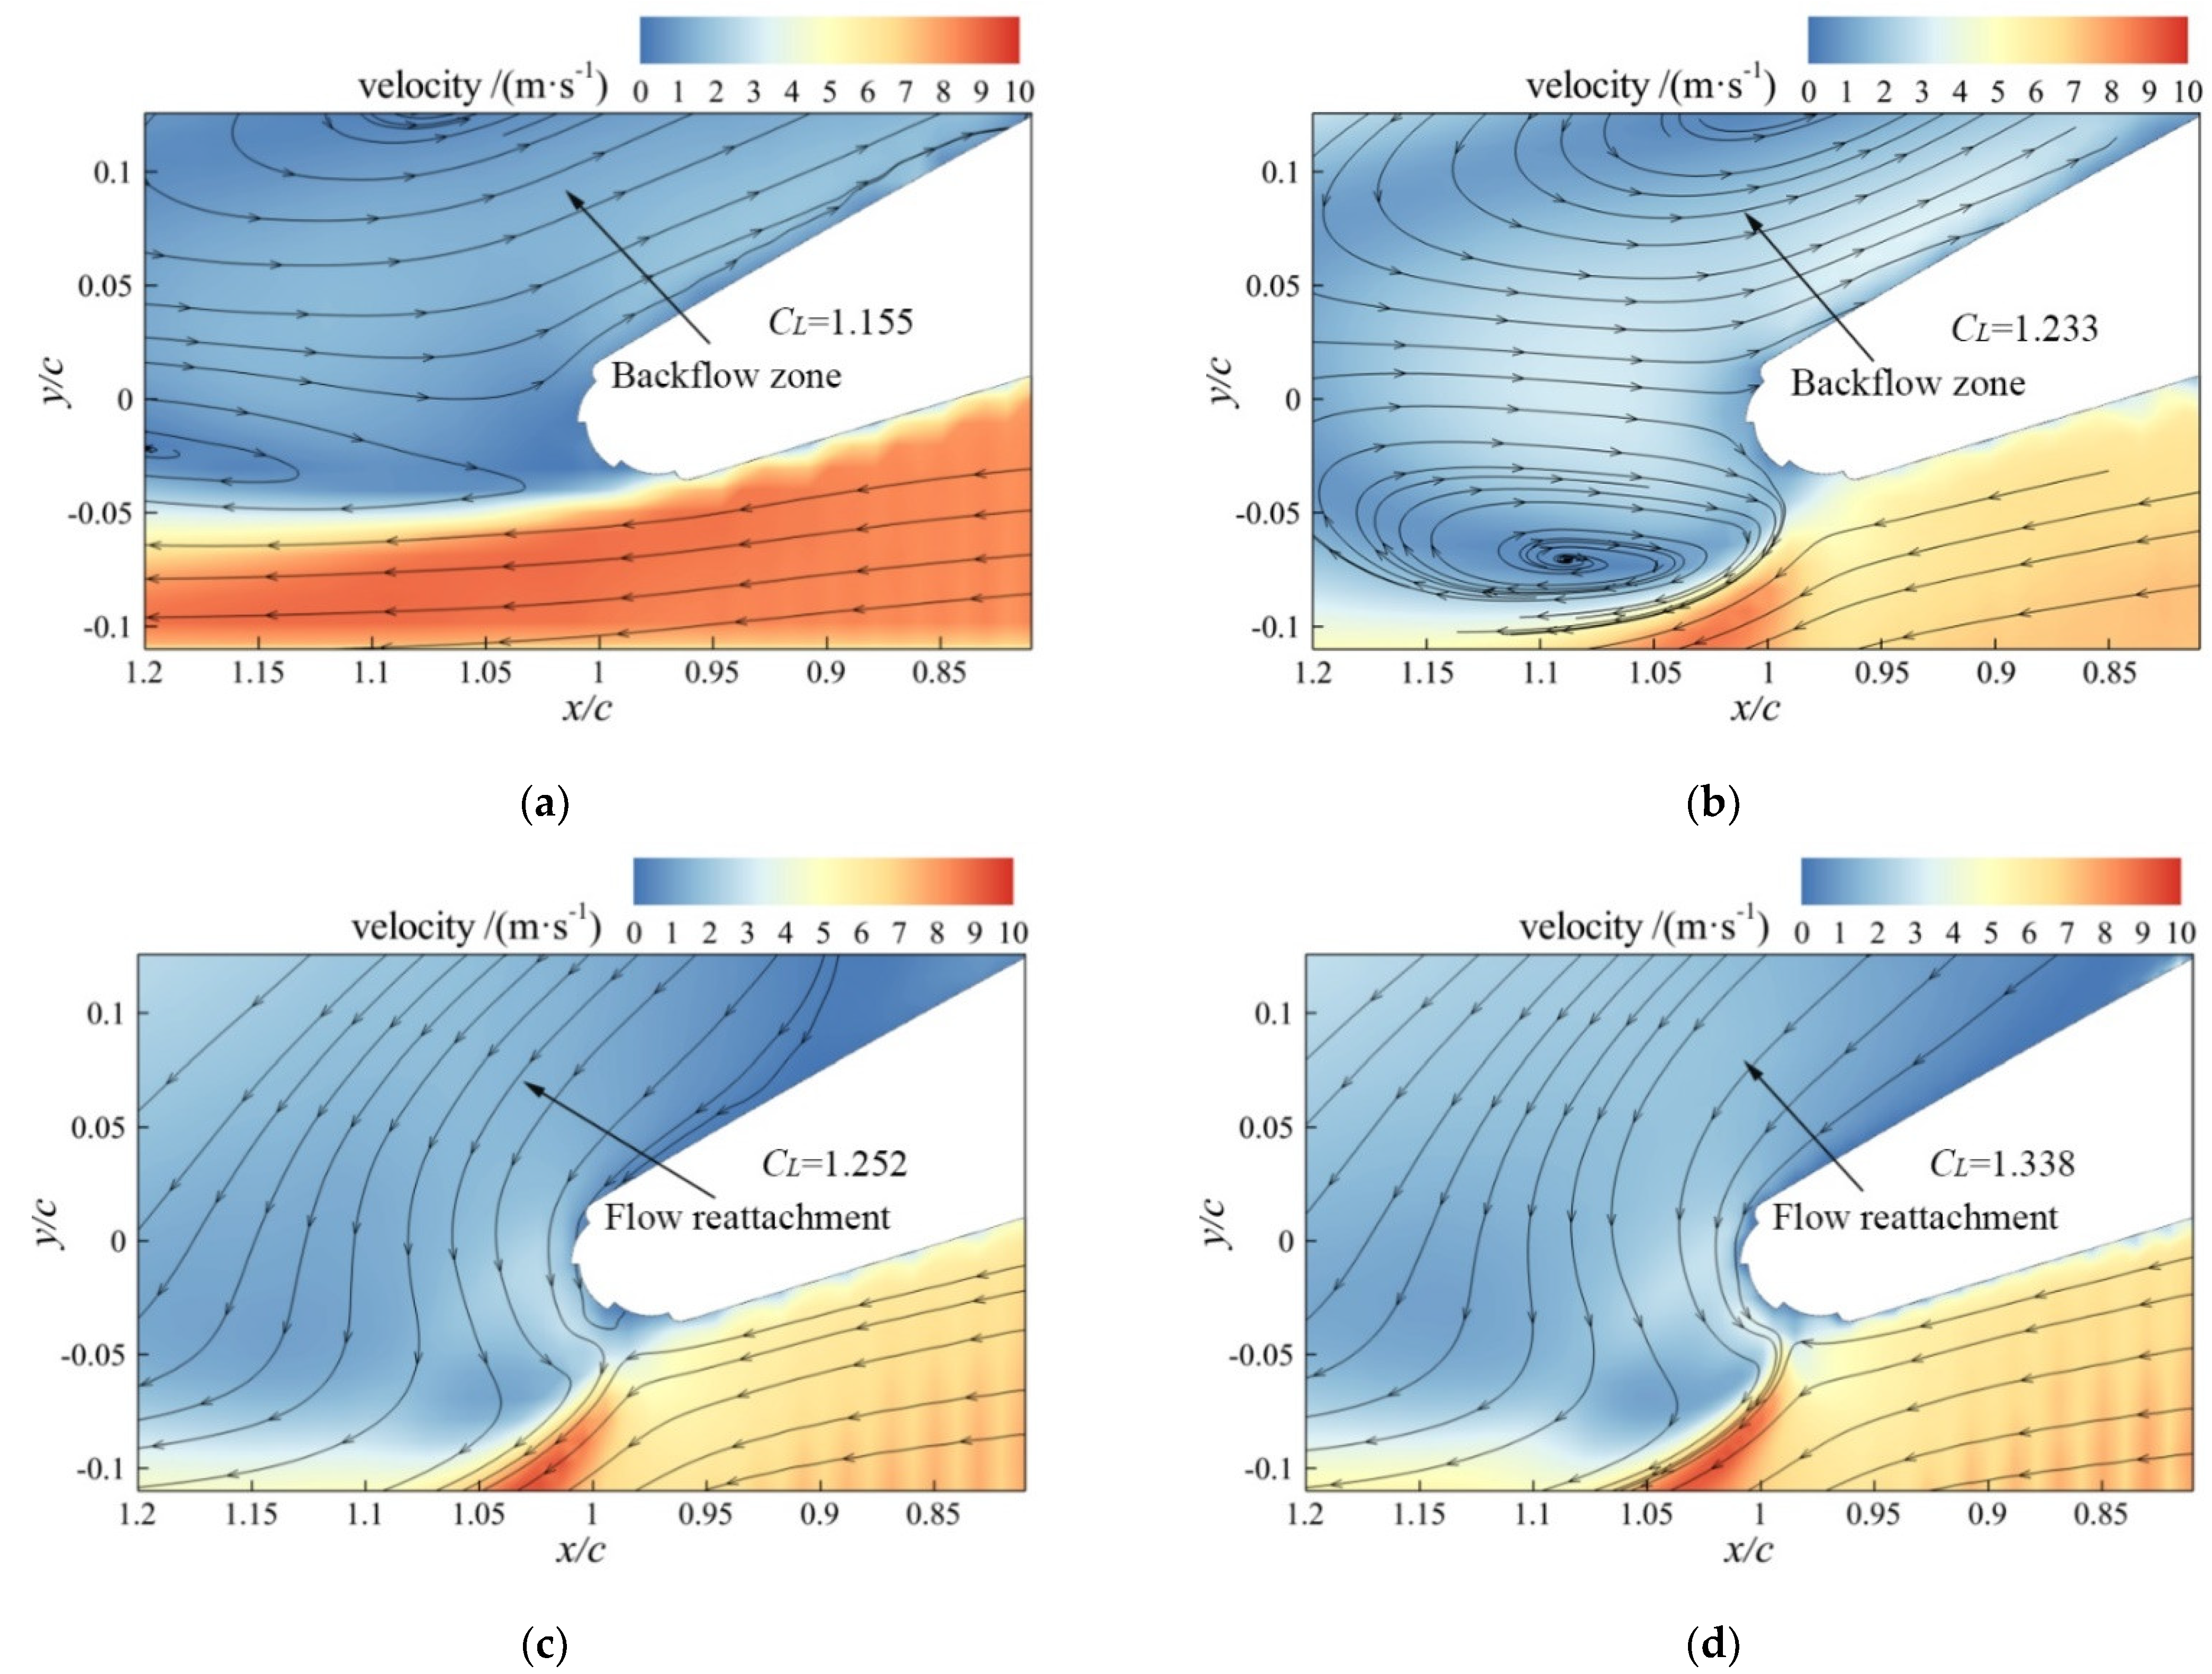
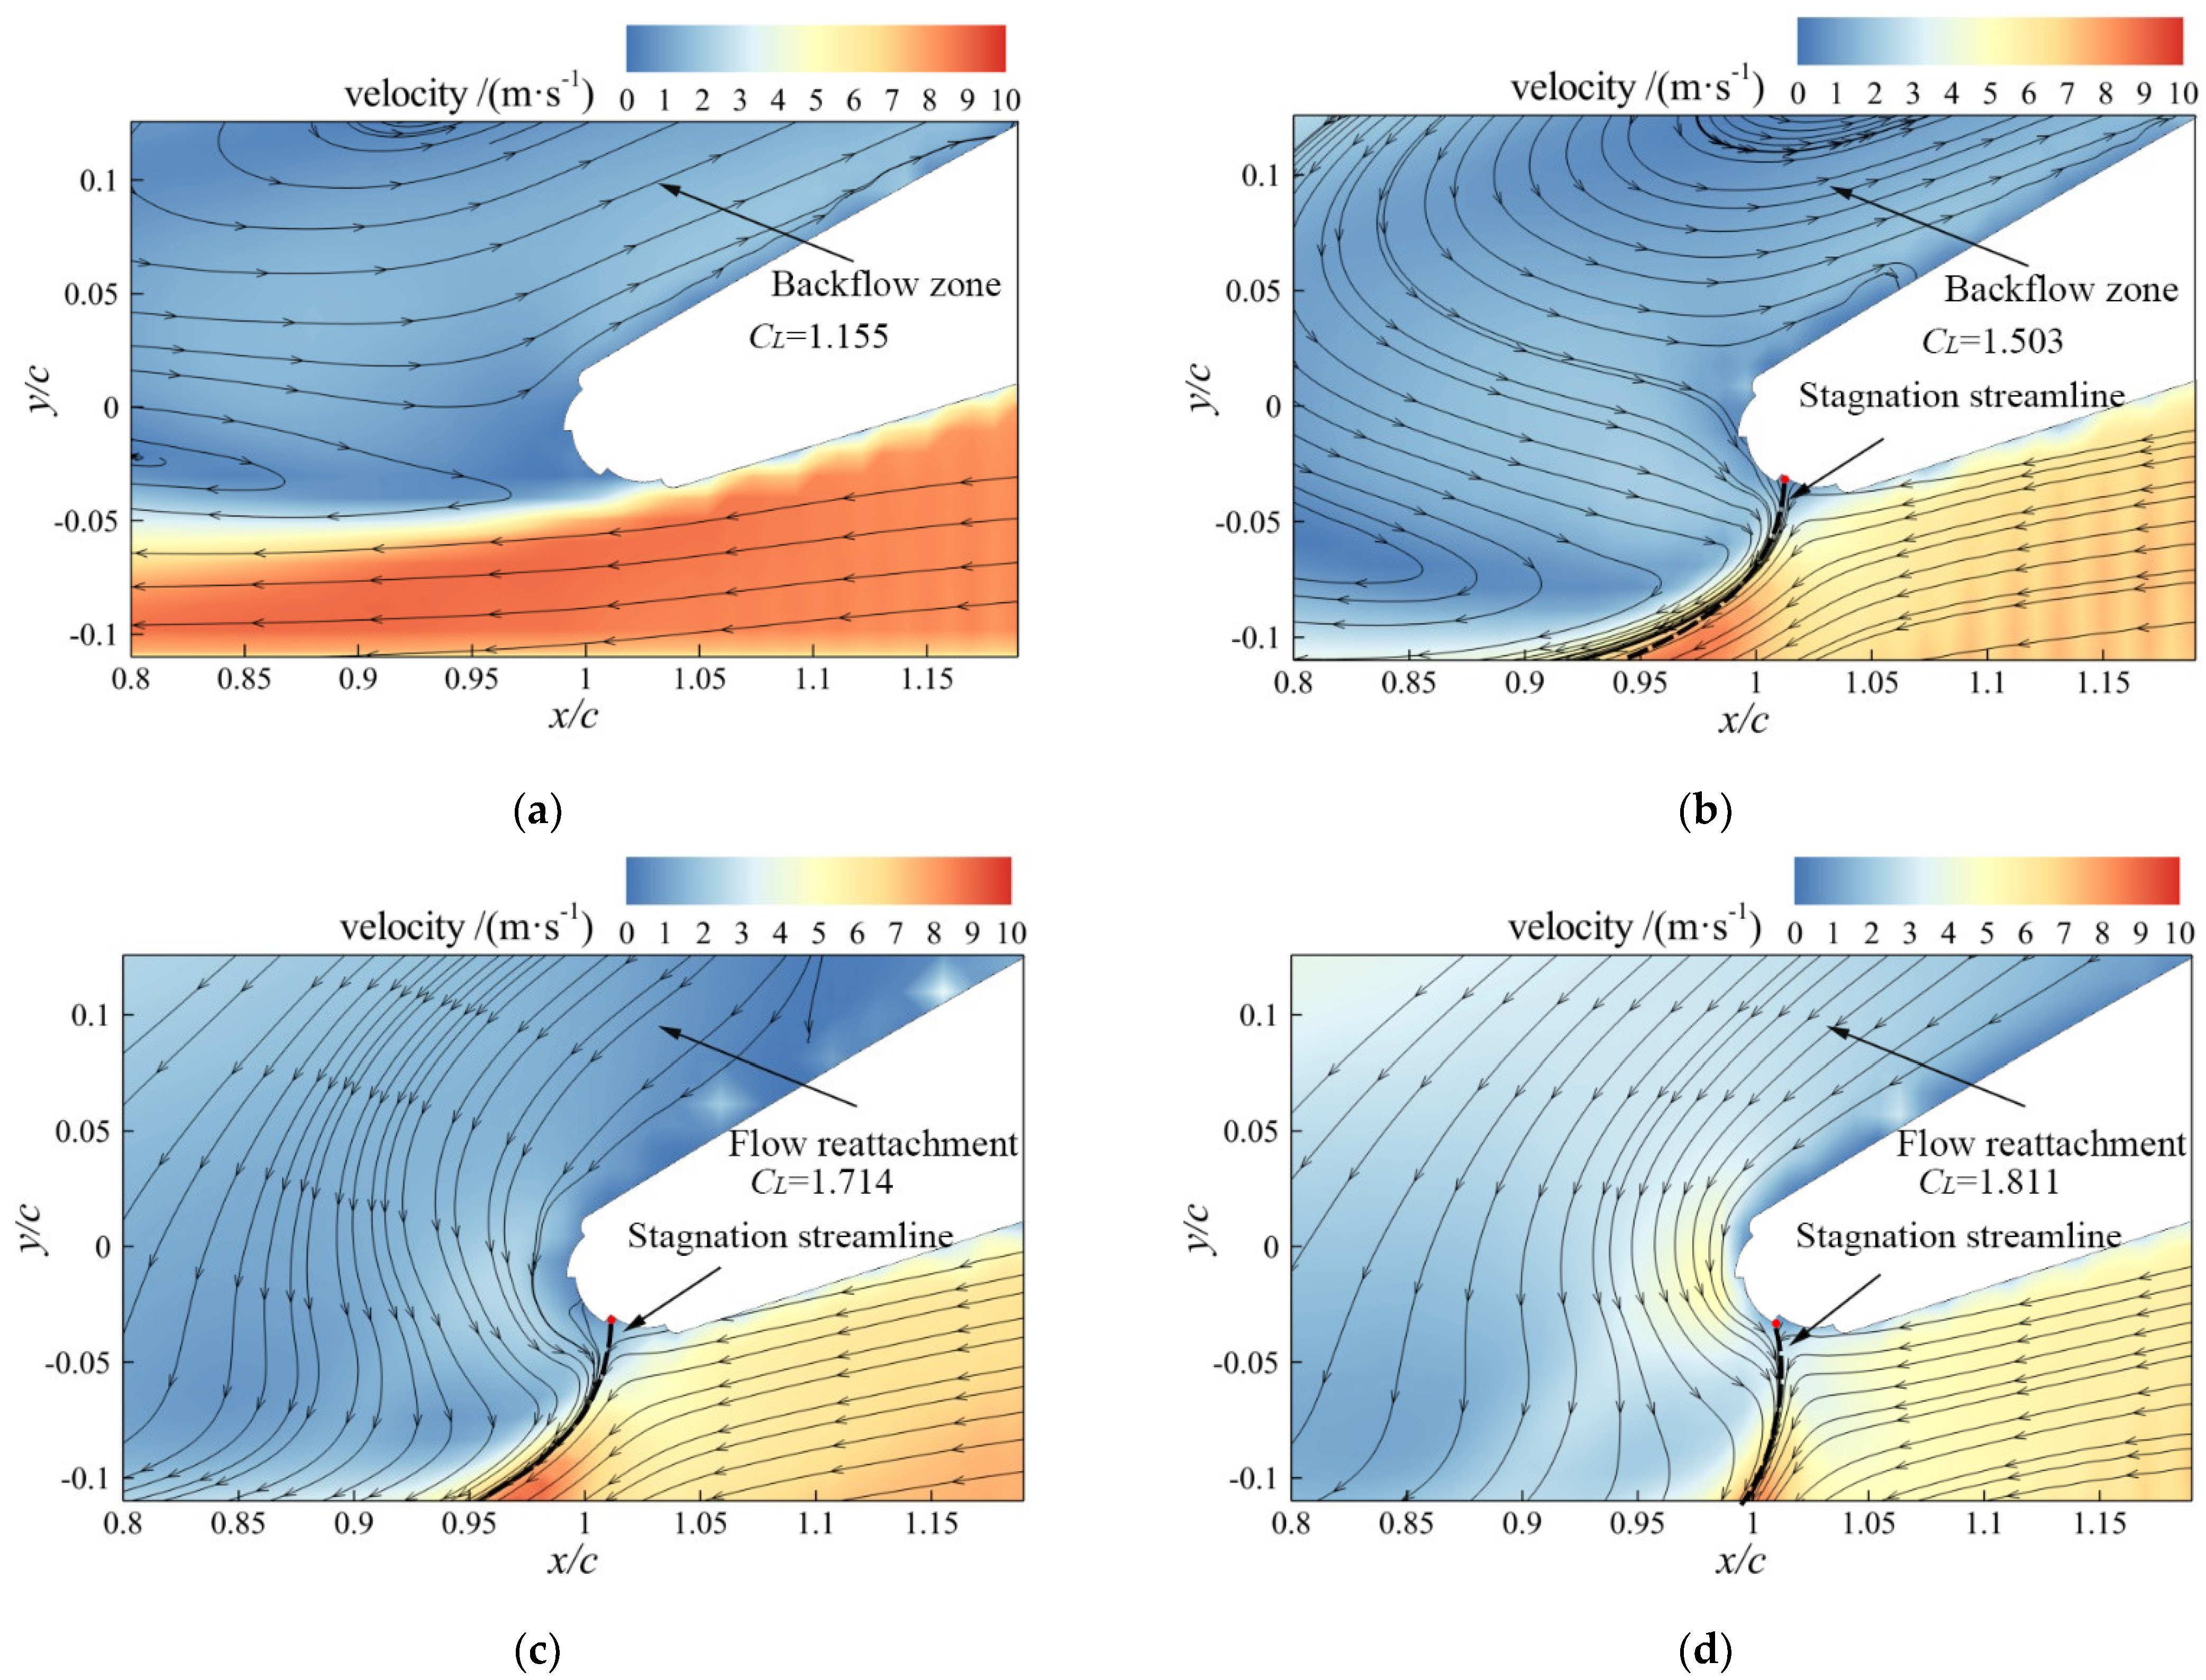
The time-averaged flow-field diagram of blowing air resulting from the increase in the number of trailing slots and when the angle of attack was 20° is shown in Figure 12. When blowing was not applied (Figure 12a), flow separation occurred on the suction surface, and a backflow zone appeared near the trailing edge. With one slot open (Figure 12b), the streamlines near the pressure surface exhibited a distinct deflection; however, a large reflux area remained on the suction surface. With two slots open (Figure 12c), flow separation was suppressed, and some areas attached to the suction surface until fluid started to flow. When all the three slots were open (Figure 12d), the flow separation was significantly inhibited, and the fluid attachment area further increased.
The foregoing results indicate that under a high angle of attack, the control effect of single-slot blowing on the separation zone of the suction surface was weak. However, with double-slot and triple-slot blowing, the separation zone gradually decreased. The phenomenon of flow reattachment on the suction surface also increasingly became evident, improving the wing lift and reducing the pressure differential drag.
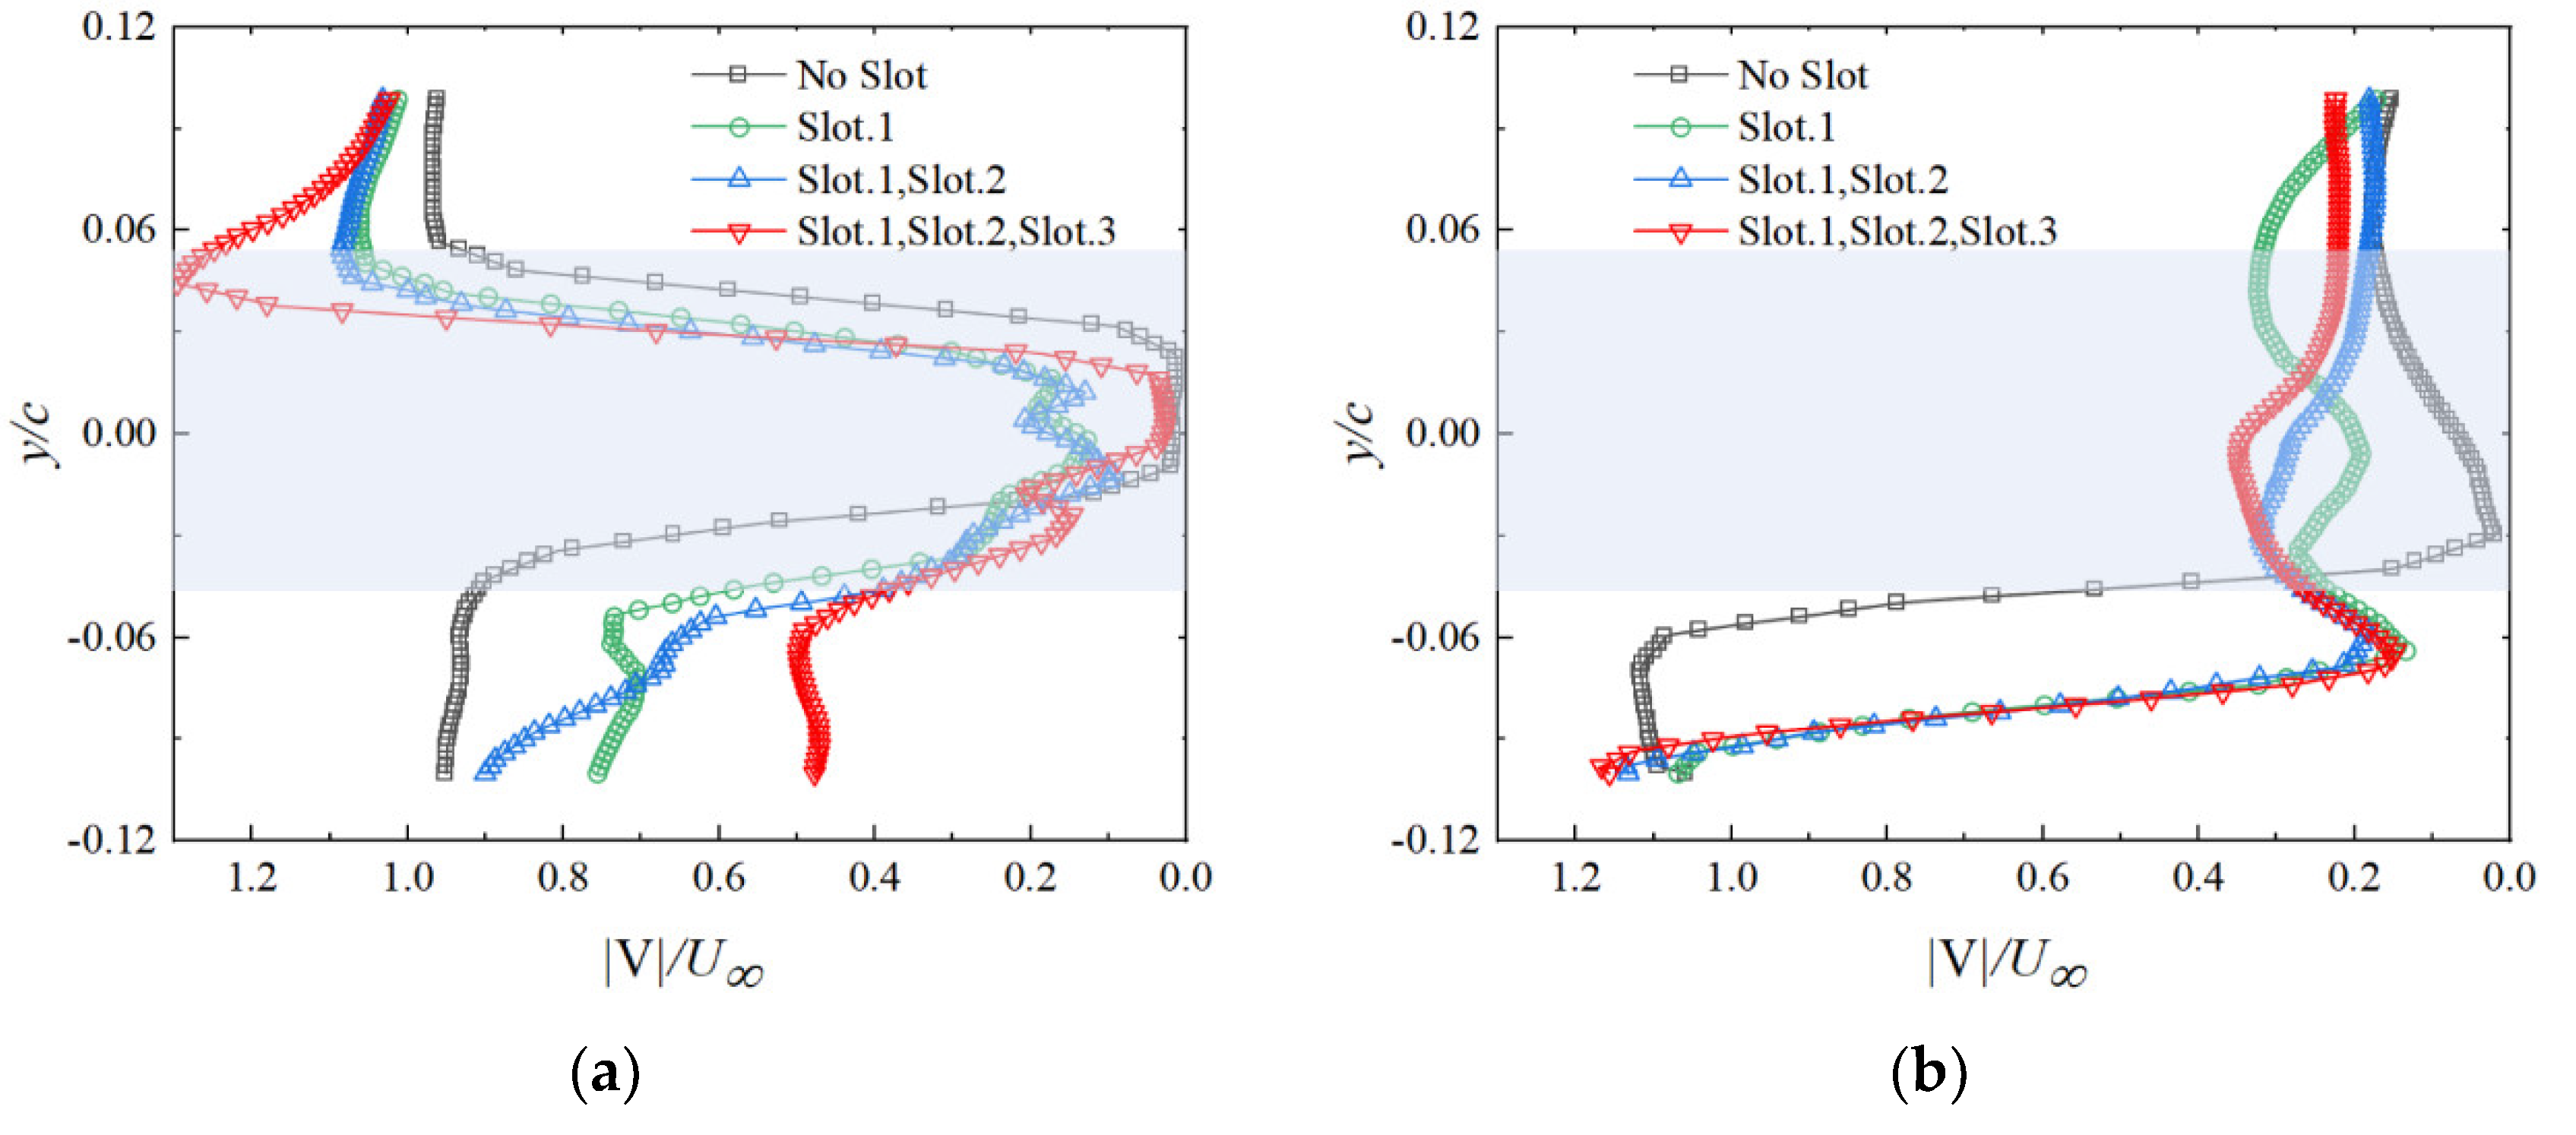
The extraction of the time-averaged composite velocity distribution curves at the trailing edge at x/c = 1 in Figure 11 and Figure 12 is shown in Figure 13. As shown in Figure 13a, when the trailing edge was not blown, the range of the wake area was −0.05 < y/c < 0.05 (shaded area in the figure), and the velocity on both suction and pressure surfaces was approximately 0.98 U∞. When the number of blowing slots was increased to three, the range of the wake area was decreased to −0.06 < y/c < 0.03. Moreover, the velocity in regions y/c > 0.05 (suction surface) and y/c < −0.05 (pressure surface) increased to 1.3 U∞ and decreased to 0.5 U∞, respectively. Therefore, multiple-slot blowing can cause the wake area to move down. This increases and decreases the velocities of the suction and pressure surfaces, respectively.
As shown in Figure 13b, when the trailing edge was not subjected to blowing, the lowest speed in the trailing-edge wake zone (shaded area in Figure 13b) was 0.02 U∞. This figure also shows that the speed in the y/c > 0.05 area was approximately 0.15 U∞. When the number of blowing slots was increased to three, the velocity in the y/c > 0.05 (suction surface) area also increased to 0.3 U∞. The wake area moved downward, and the velocity increased to 0.3 U∞. Therefore, with the increase in the number of slots at a high angle of attack, the velocity loss in the wake area decreased. Moreover, the velocity in the separation area significantly increased, reducing the drag on the wing. This observation is consistent with the experimental results of force measurement shown in Figure 6.
4.2. PIV Flow-Field Effect on Wing Aerodynamics Due to Blowing Coefficient
The force measurement experiment indicated the successive appearance of separate control stage and supercirculation control stages with an increase in the blowing coefficient. In the experiments, the flow field no blowing control and the flow fields with blowing coefficients of 0.03, 0.05 and 0.1 were captured.
4.2.1. Control Mechanism of Variation in Blowing Coefficient at Low Angle of Attack
The time-averaged flow-field diagrams at different blowing coefficients when the three slots were used for simultaneous blowing are shown in Figure 14. The velocity cloud and streamline distribution indicate that the trailing edge exhibits a distinct flow separation phenomenon when no air is blown. With an increase in the blowing coefficient, the velocity on the suction surface and the curvature of the downward deflection of the streamline increased. By comparing the velocities at the coordinate points (x/c = 1; y/c = 0.05) shown in Figure 14, the velocity was found to increase to 9.8, 15.2, and 23.1% when the blowing coefficients were 0.03, 0.05, and 0.1, respectively.
By comparing the positions of the stagnation points (red dot in Figure 14) of the trailing edge, the stagnation points of the trailing edge moved down significantly when the blowing coefficients were 0.03 and 0.05. However, when the blowing coefficient was 0.1, the position of the stagnation points of the trailing edge was virtually the same as that when the blowing coefficient was 0.05. This occurs because when the blowing coefficients are 0.05 and 0.1, the trailing edge is under supercirculation control. With an increase in the blowing coefficient, the stagnation point of the trailing edge ceases to move down; this is also consistent with the force measurement experiment result shown in Figure 8.
At a low angle of attack (AoA = 0°), the strong shear action of the jet has a significant acceleration effect on the suction surface with an increase in the blowing coefficient. Moreover, the curvature of the downward deflection of the streamline gradually increases. In the separation control stage, the trailing-edge stagnation point moves downward along the arc surface by increasing the blowing coefficient. In the supercirculation control stage, the trailing-edge stagnation point never varies.
4.2.2. Control Mechanism of Variation in Blowing Coefficient at High Angle of Attack
The time-averaged flow-field diagram, when the three slots were blown simultaneously at different blowing coefficients and the angle of attack was 20°, is shown in Figure 15. The velocity cloud and streamline distribution indicate that flow separation occurred on the suction surface without air blowing, and a backflow zone appeared. When the blowing coefficient was increased to 0.03, the backflow area near the slot on the suction surface tended to move downward because of the entrainment of jet flow. The streamlines began to deflect downward near the pressure surface on the back edge. When the blowing coefficient was increased to 0.05, the backflow area decreased, and air attached to most of the suction surface. When the blowing coefficient was increased to 0.1, the flow attachment area on the suction surface increased, and the deflection curvature of the trailing-edge streamline also significantly increased. At this time, the flow separation was significantly inhibited, and the backflow area disappeared. With an increase in the blowing coefficient, the variation laws of the stagnation streamline and stagnation point (red dot in Figure 15) of the trailing edge are consistent with the law when the angle of attack is 0°.
At a high angle of attack (AoA = 20°), when the blowing coefficient was small, the jet energy was weak. This could not overcome the large inverse pressure gradient on the suction surface, and the control effect on the backflow zone was weak. When the blowing coefficient gradually increased, the high-speed jet drove and accelerated the flow in the backflow zone on the suction surface. It had the effect of controlling flow separation.
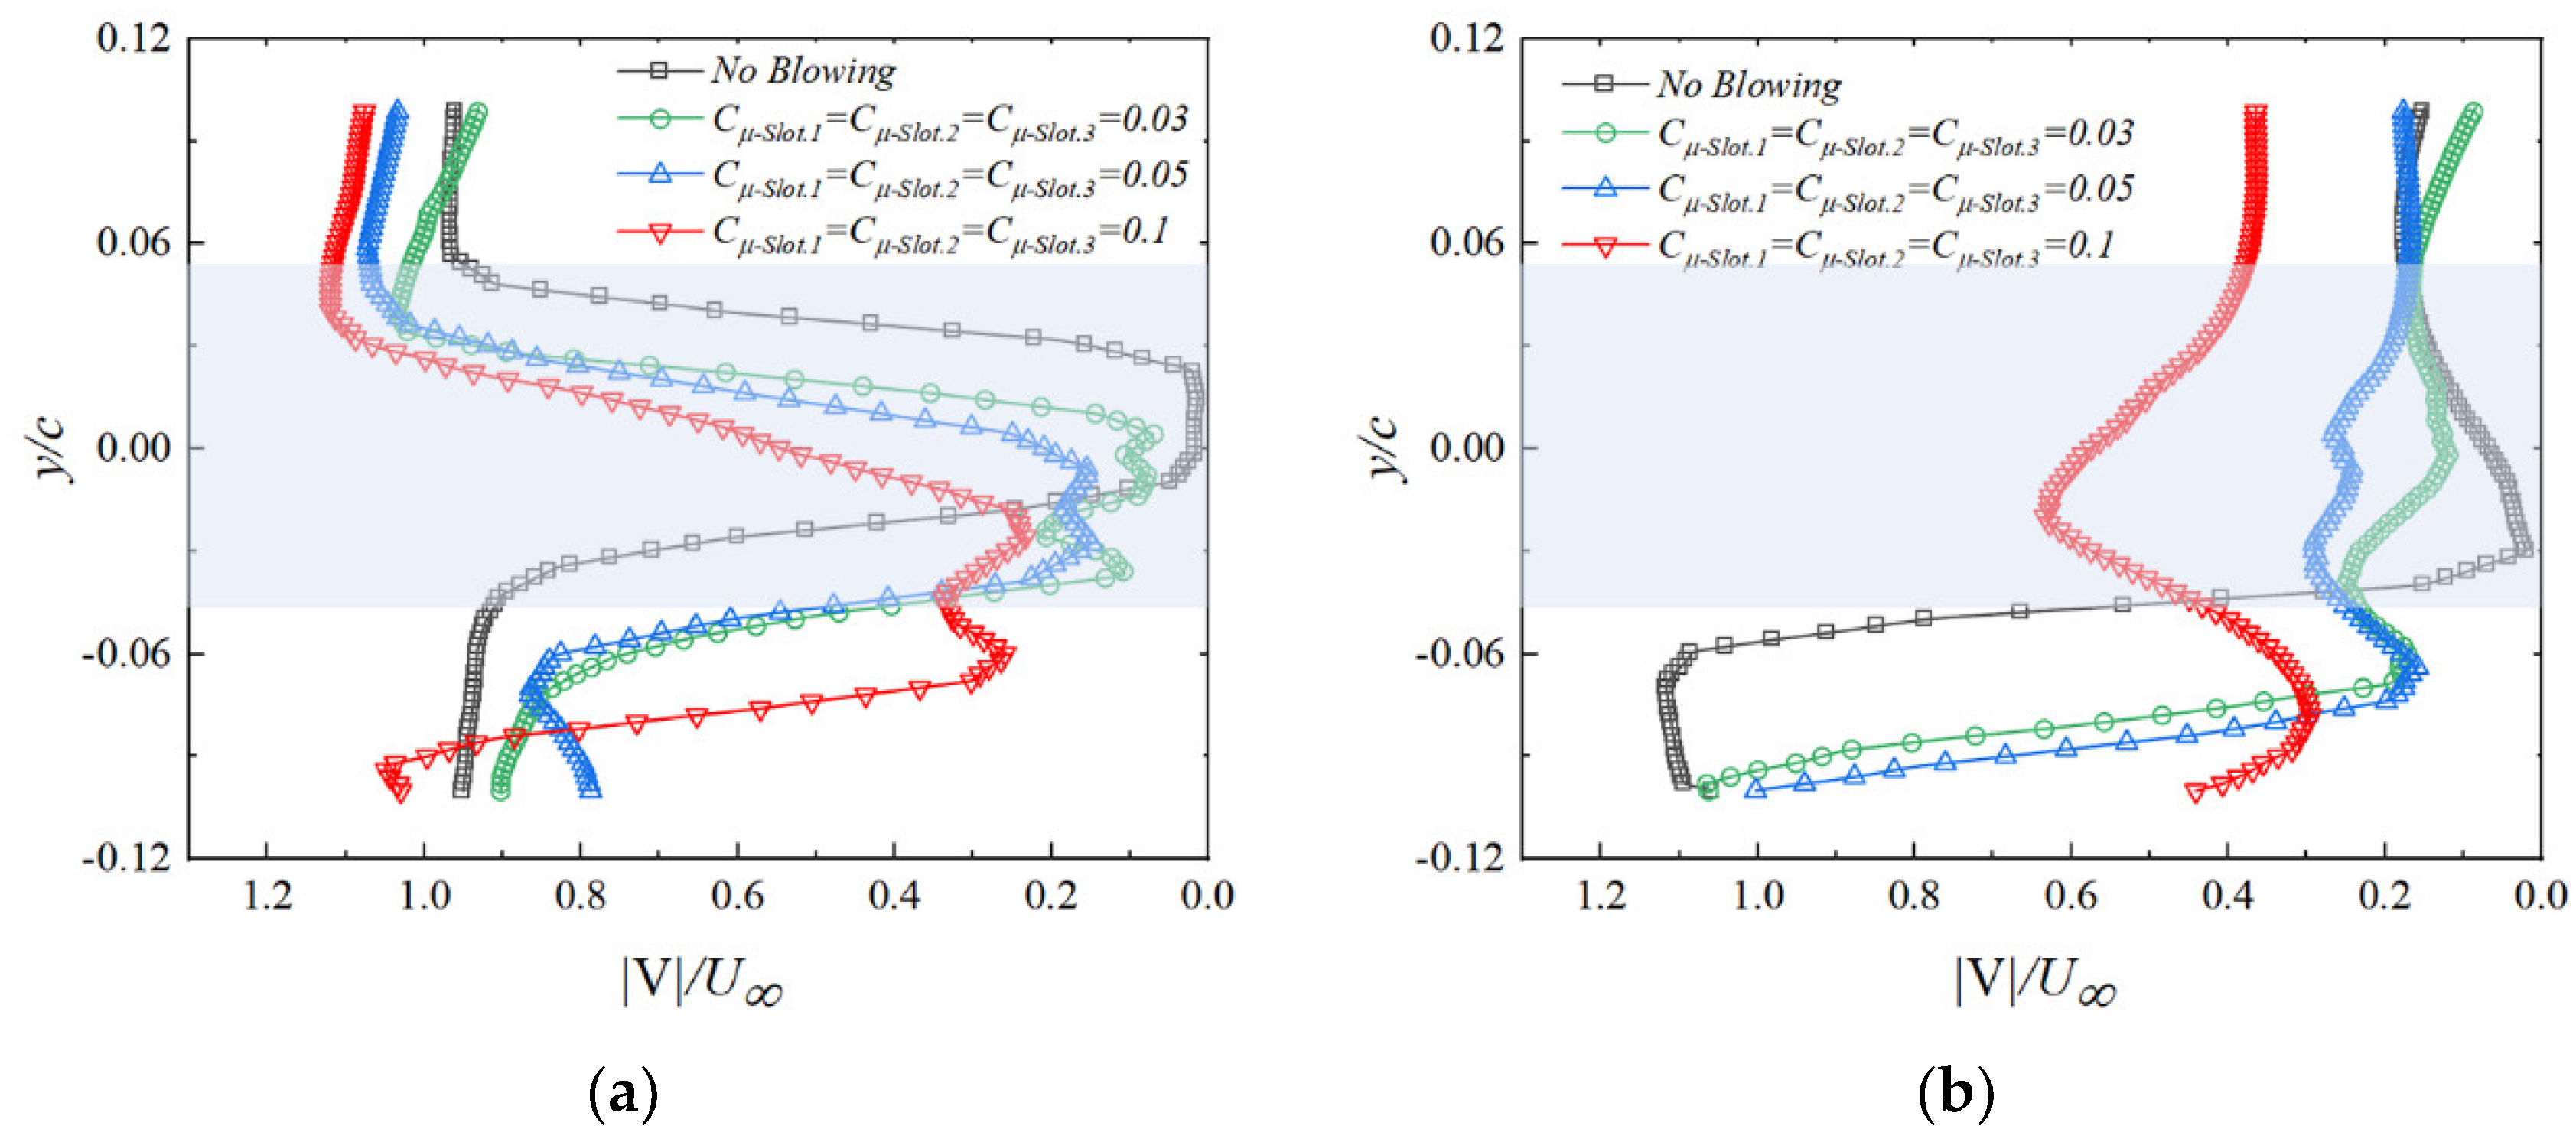
The time-averaged composite velocity distribution curve derived from the trailing edge at x/c = 1 (Figure 14 and Figure 15) is shown in Figure 16. As shown in Figure 16a, without blowing, the trailing-edge wake velocity decreased to 0.02 U∞. When the blowing coefficient increased to 0.1, the wake area speed increased to 0.3 U∞. Therefore, increasing the blowing coefficient can reduce the trailing-edge wake speed loss. Based on the distribution on the wake area in y/c, without blowing, the wake area was in the range −0.05 < y/c < 0.05. When the blowing coefficient was increased to 0.03, the wake area range was decreases to −0.06 < y/c < 0.03. At this time in the separation control phase, the wake area was reduced so that the drag was reduced. When the blowing coefficient was increased to 0.1, the wake area range was increased to −0.09 < y/c < 0.05. At this point, the wake area was in the supercirculation control stage, and the lift and resistance increased.
As shown in Figure 16b, the velocity was approximately 0.2 U∞ in the region y/c > 0.05 (suction surface) under the condition of no air blowing and a low air-blowing coefficient. When the blowing coefficient was increased to 0.1, the velocity increased to 0.4 U∞. Therefore, the acceleration effect of the small blowing coefficient on the suction surface separation zone was weak. However, as the blowing coefficient increased, the high-speed jet significantly enhanced the suction surface velocity through entrainment.
4.3. PIV Flow-Field Effect on Wing Aerodynamics at Different Air Blowing Proportions
Under the condition of the same external input flow, the control mode with a blowing ratio of 3:1:2 could further improve the wing lift and reduce the drag according to the force measurement experiment. The flow display experiment captured the flow field at the trailing edge when the blowing ratios of the three slots were 1:1:1 and 3:1:2 and the total input flow was Q = 93.72 m3/h.
4.3.1. Control Mechanism under Different Blowing Proportions at Low Angle of Attack
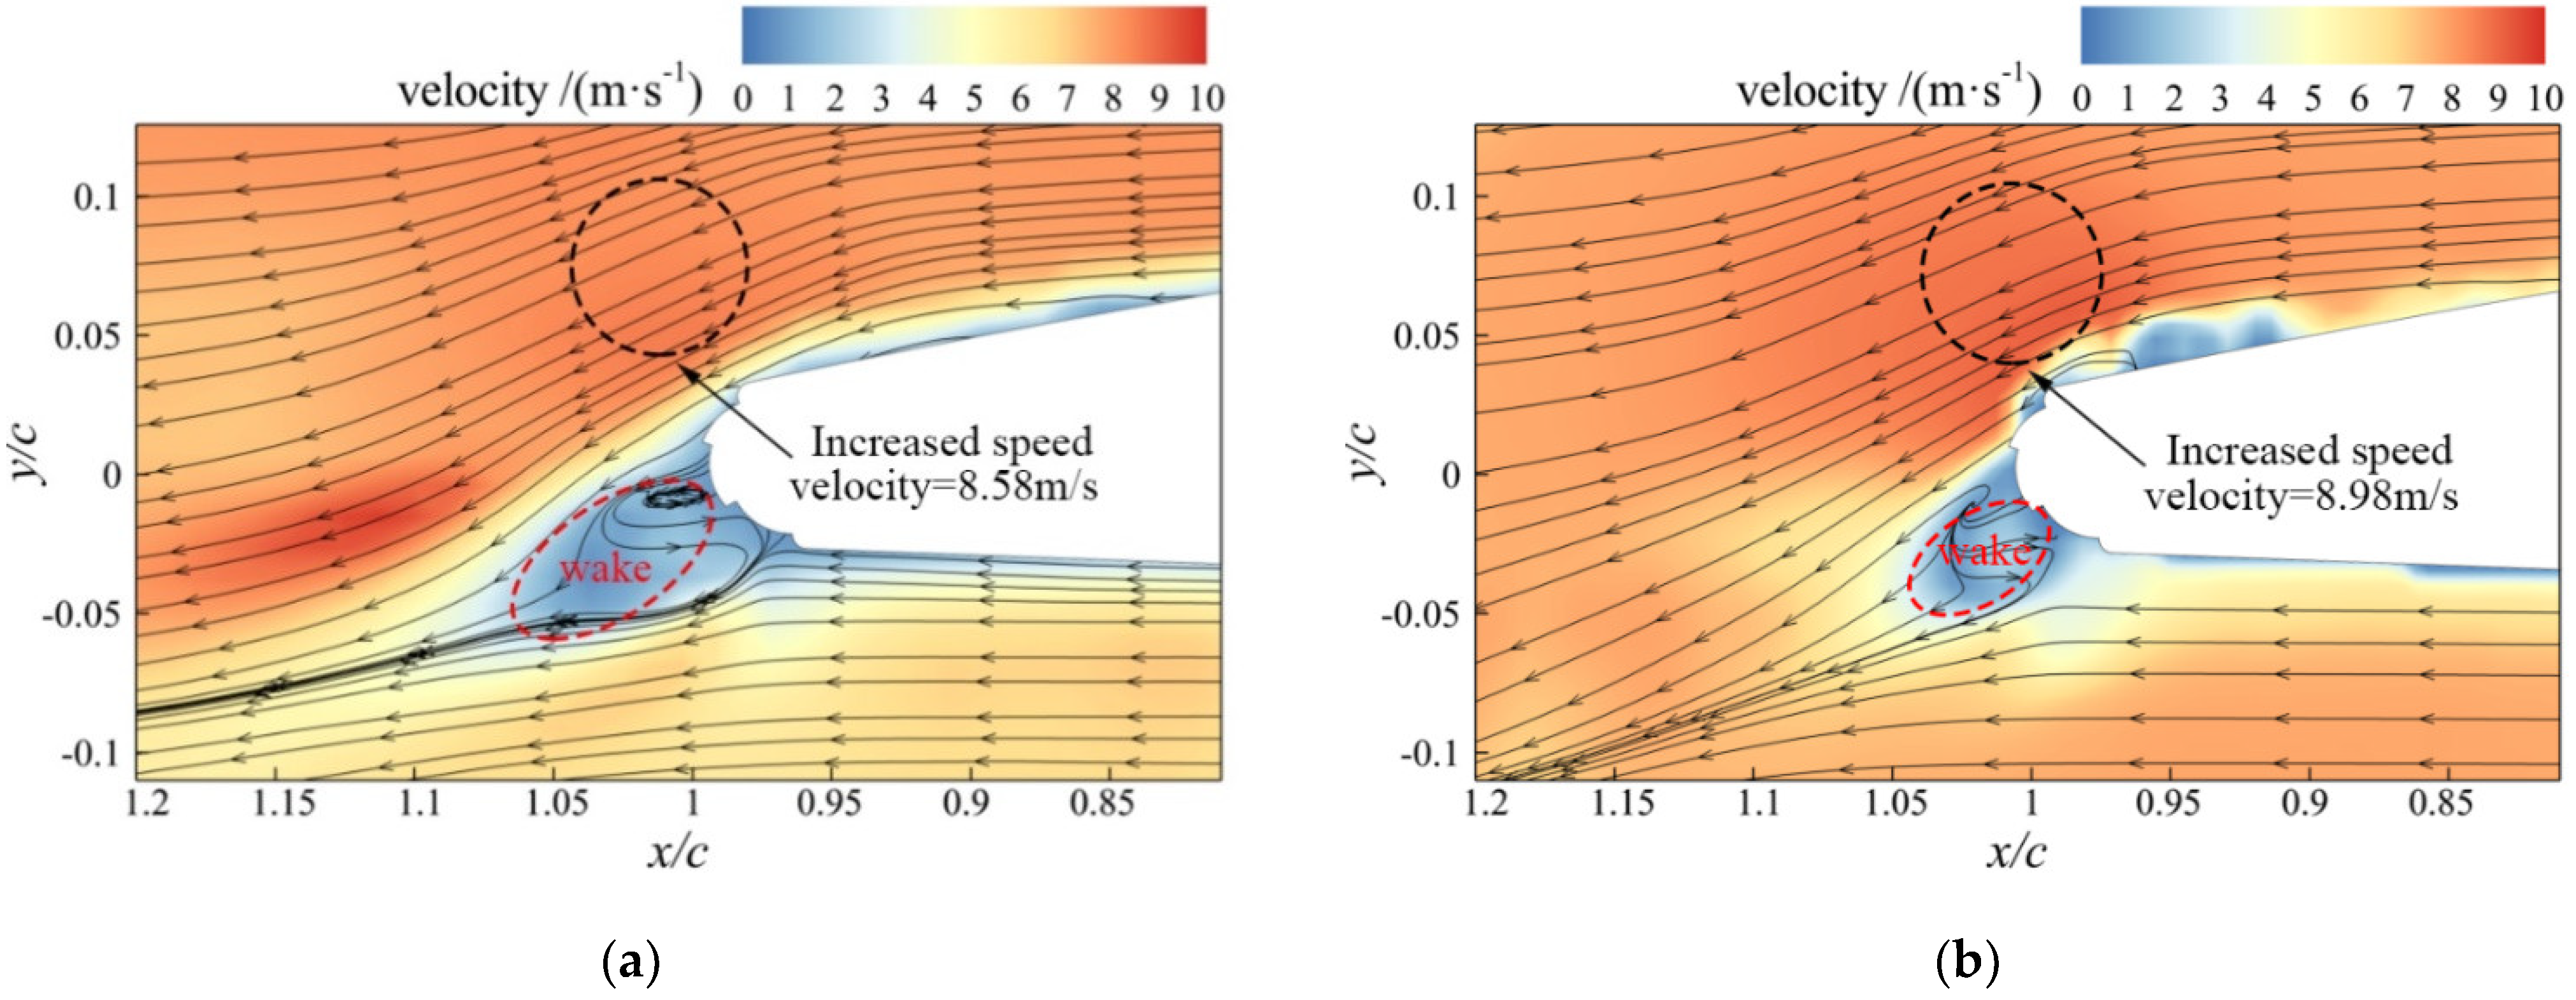
The time-averaged flow-field diagrams for different blowing ratios when the angle of attack was 0° are shown in Figure 17. The velocity cloud image indicates that when the blowing ratio was 3:1:2, the streamline curvature of the trailing edge was larger compared with that when the ratio was average. By comparing the speed at the coordinate points (x/c = 1; y/c = 0.05), the control result of the relative average blowing ratio could be determined. When the blowing ratio was 3:1:2, the speed at this position increased by 4.6%. Moreover, the low-speed area of the trailing edge (shown by the red dotted line) significantly decreased, and the velocity on the suction surface increased.
With the same energy consumption, a blowing ratio of 3:1:2 can further increase the flow rate on the suction surface and increase the curvature of the downward deflection of the trailing-edge streamline. Moreover, it promotes the stagnation point of the trailing edge to move downward, thus further improving the wing lift. In addition, the trailing-edge low-speed zone significantly decreases, thus reducing the wing drag.
4.3.2. Control Mechanism under Different Blowing Proportions at High Angle of Attack
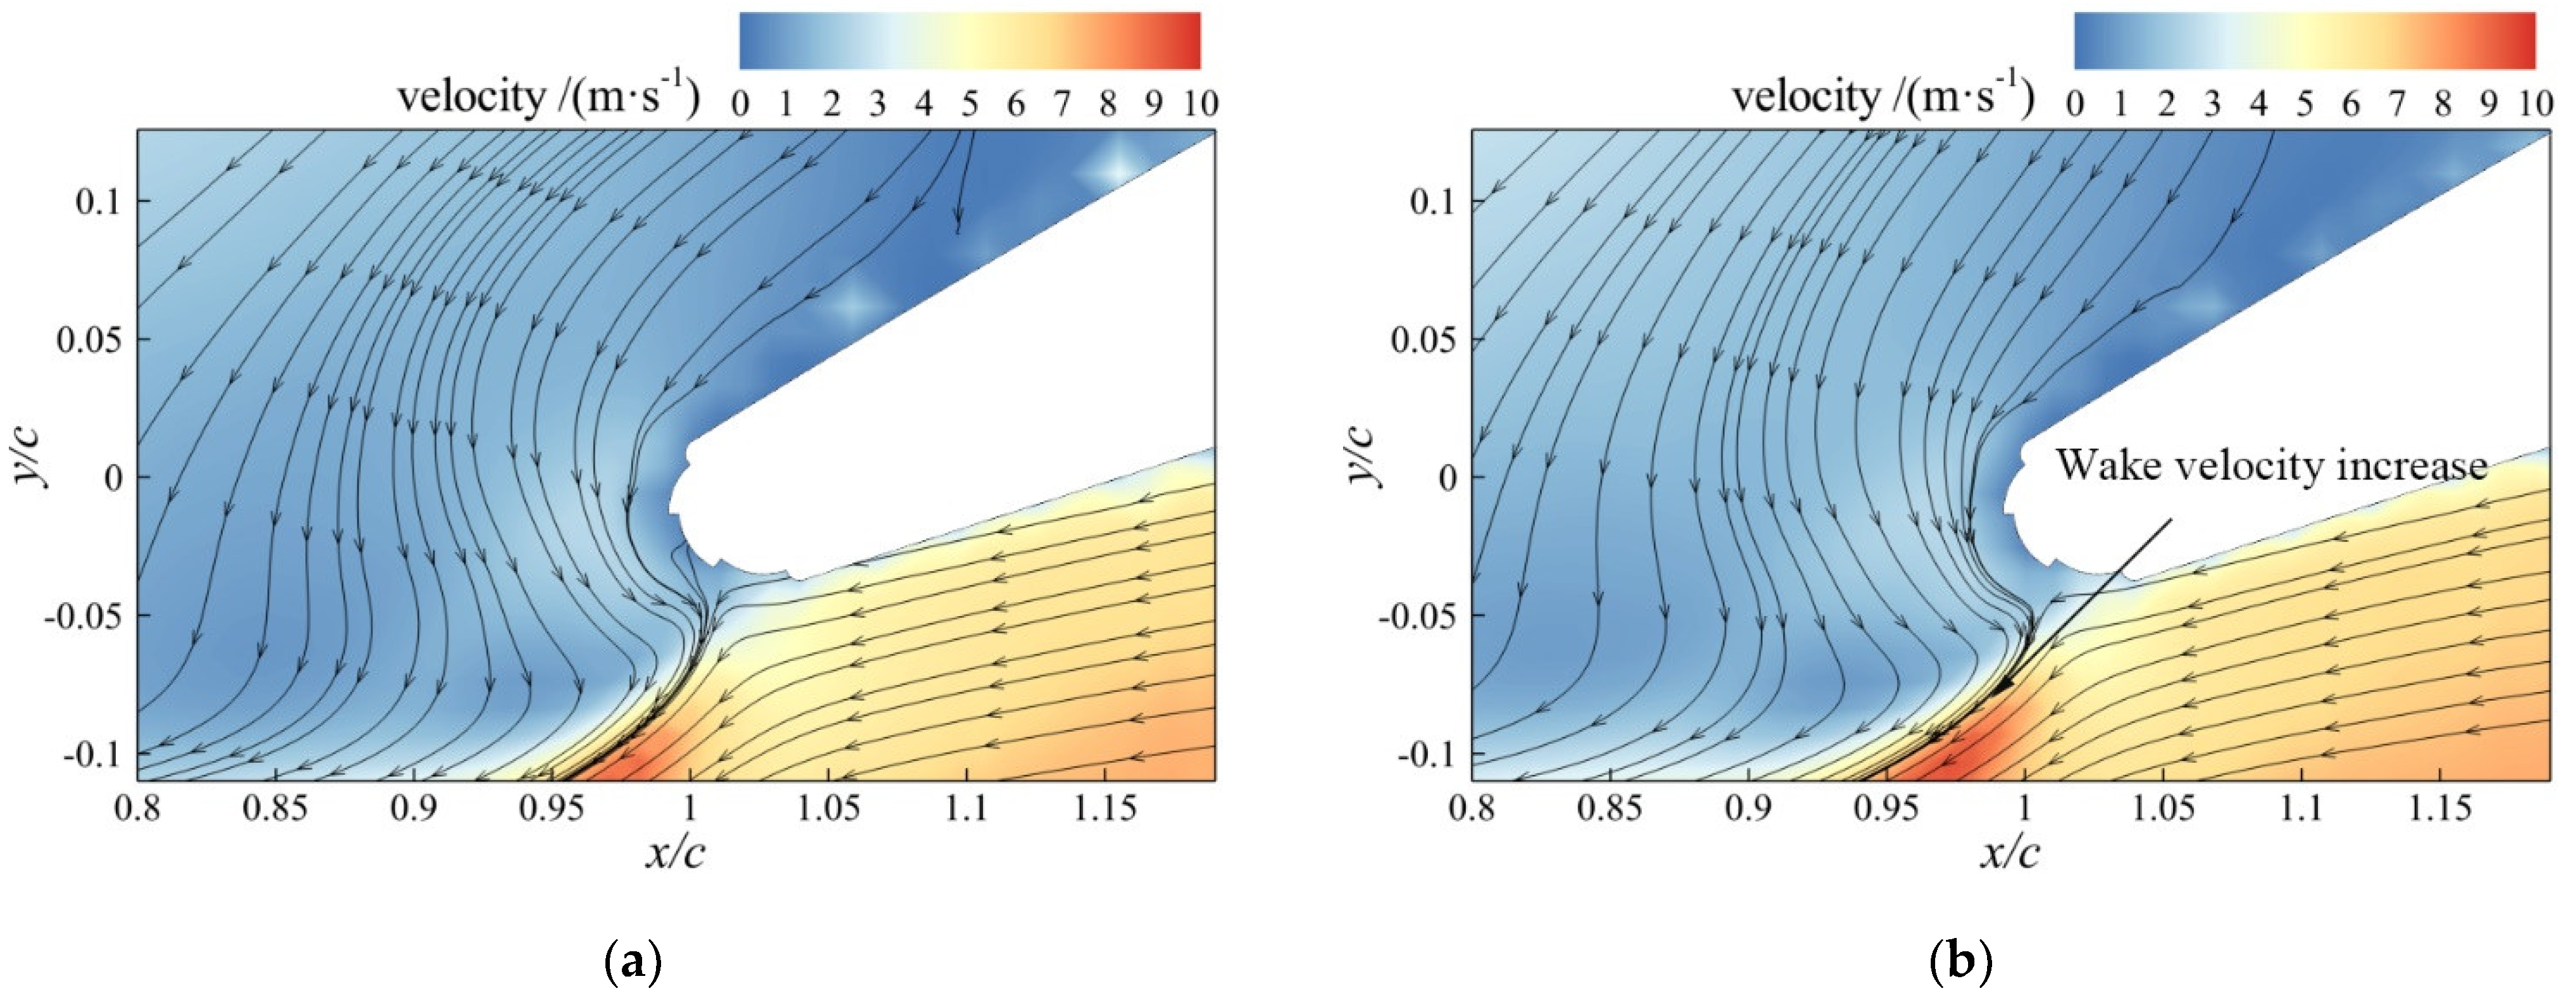
The time-averaged flow-field diagrams at different blowing ratios when the angle of attack was 20° are shown in Figure 18. According to the velocity cloud and streamline distribution, the wake velocity was higher at the slot position on the trailing edge of the wing when the blowing ratio was 3:1:2 than when it was 1:1:1.
The foregoing results show that the blowing ratio of 3:1:2 at a high angle of attack had a weak control effect on flow separation, but it could improve the wake velocity. This can greatly reduce the drag of the wing.
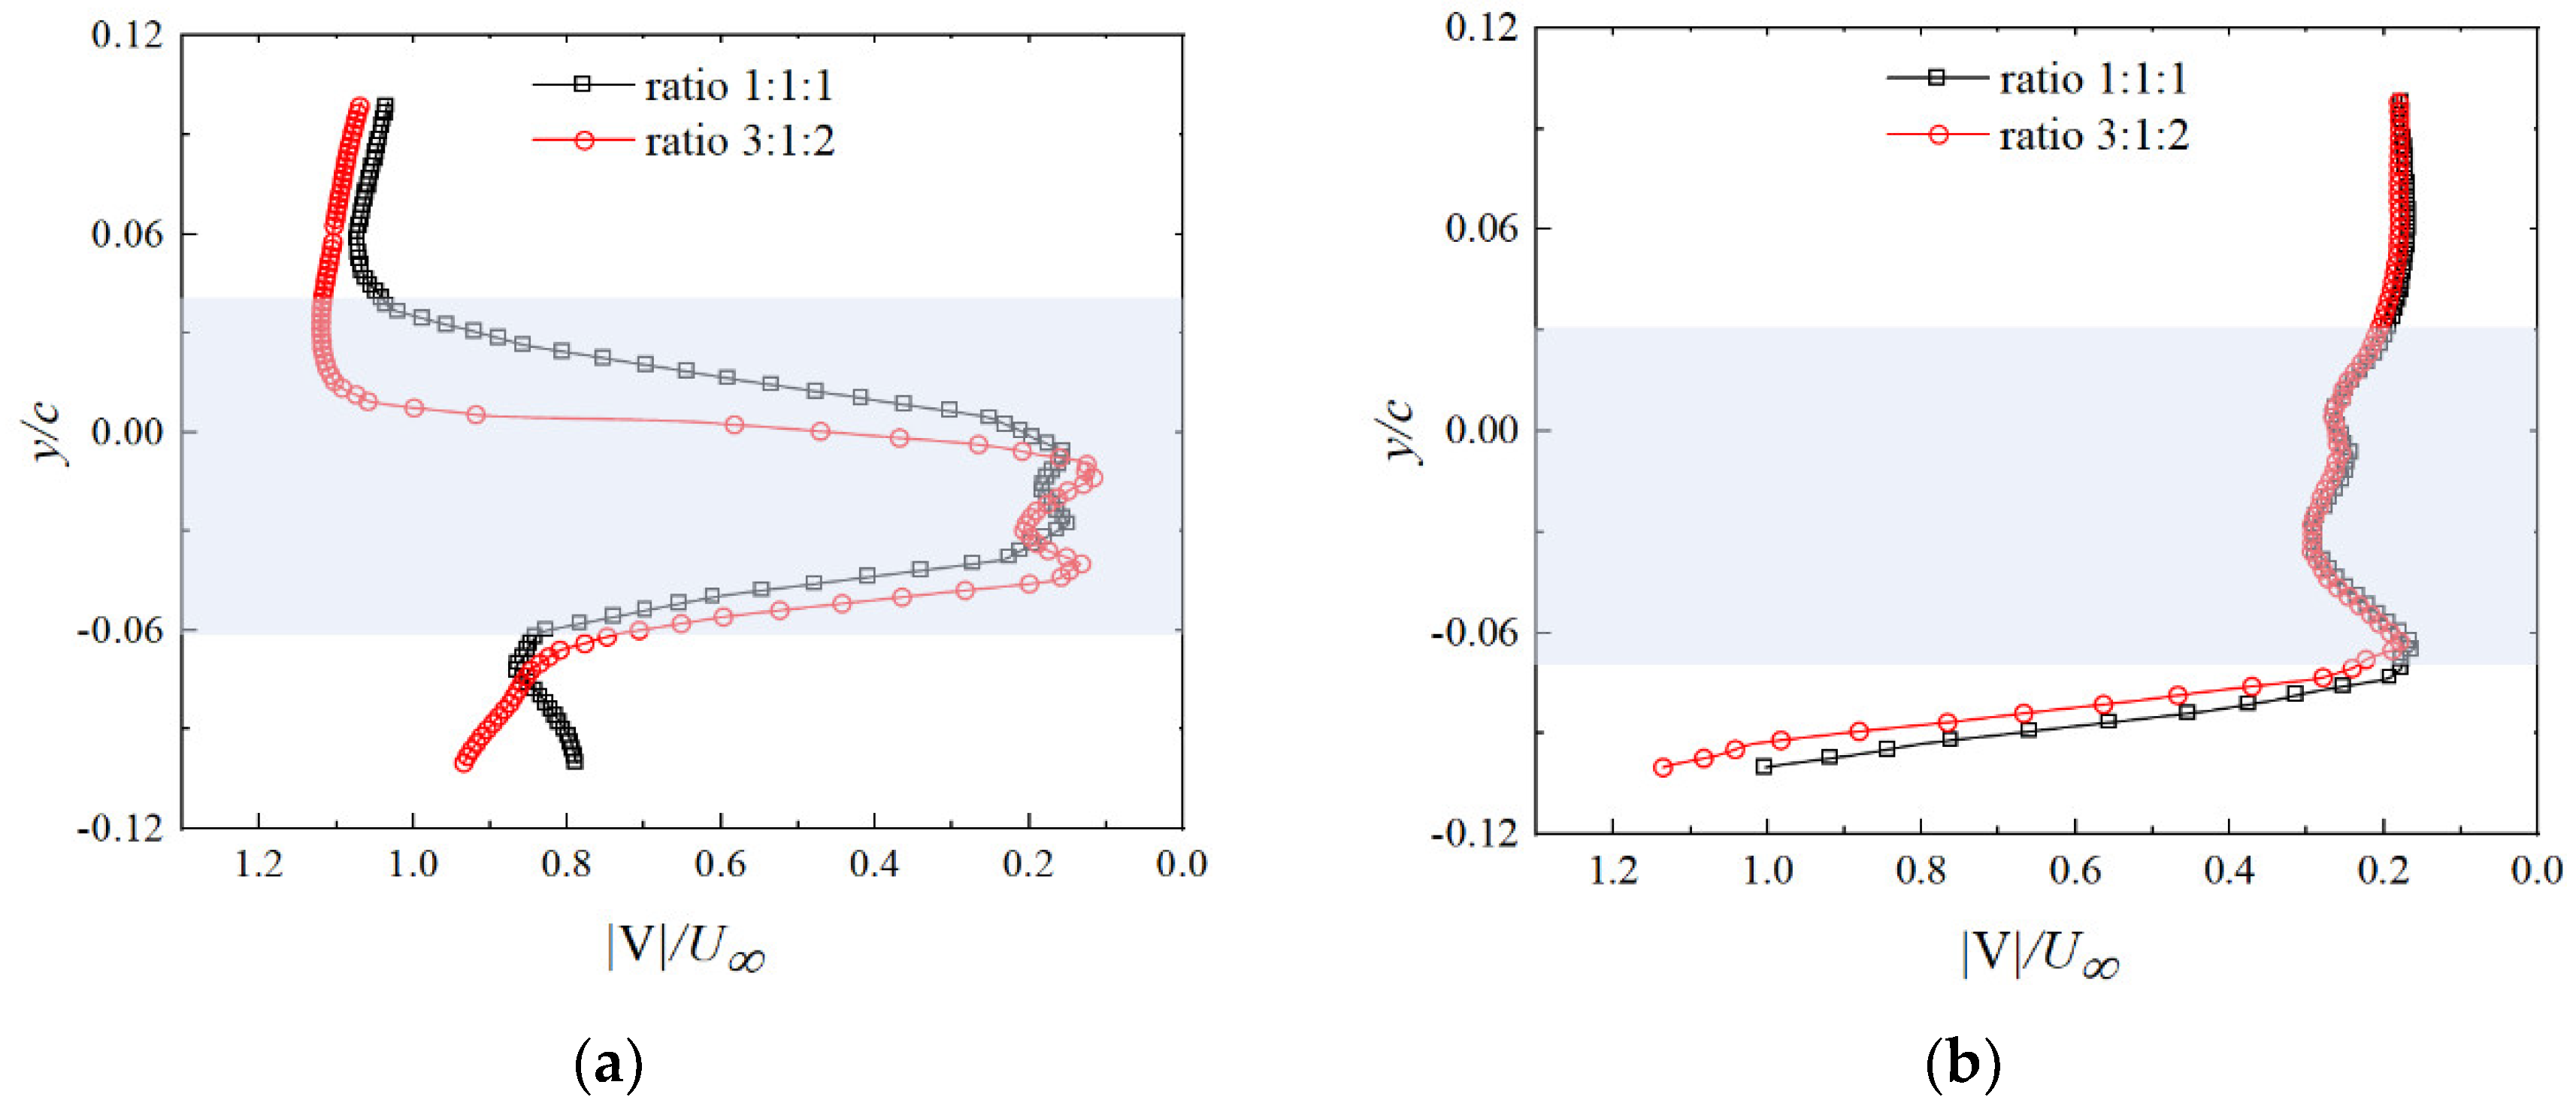
The time-averaged composite velocity distribution curve derived from the trailing edge of x/c = 1 (Figure 17 and Figure 18) is shown in Figure 19. At a low angle of attack, the minimum velocity in the wake area (shaded area in Figure 18a) was virtually the same as that when the average proportion blowing control was 3:1:2. However, the wake area evidently decreased from −0.05 < y/c < 0.03 to −0.06 < y/c < 0.01 when the blowing ratio was 3:1:2. Furthermore, the size range of the y/c distribution decreased. At a high angle of attack, the 3:1:2 blowing ratio of the control mode increased the velocity on the suction and pressure surfaces.
The above results indicate that the 3:1:2 ratio of blowing control increases the velocity on the suction surface and reduces the velocity deficit in the wake area regardless of the angle of attack. In addition, the wake area moves downward, and the distribution area of y/c significantly decreases (AoA = 0°), thus reducing the drag.
5. Conclusions
In this study, the aerodynamic control effect of a multistage circulation control wing was investigated through force measurements and PIV experiments. Then, based on a three-slot blowing experiment, the aerodynamic force and flow-field characteristics of the wing were studied when different blowing coefficients and blowing ratios were applied. The conclusions are as follows:
- (1)
- The lift and lift-to-drag ratio increased, and the drag decreased as the number of blowing slots in the trailing edge increased. When the experimental wind speed was 8 m/s, the maximum lift-to-drag ratios corresponding to single-slot blowing, double-slot blowing, and triple-slot blowing (compared with no blowing) increased by 13.2, 21.5, and 95.3%, respectively.
- (2)
- When the three slots were subjected to blowing simultaneously, the aerodynamic characteristics of the wing could be significantly improved by increasing the blowing coefficient. In the separation control stage, the lift coefficient significantly increased, and the drag coefficient gradually decreased with an increase in the blowing coefficient. In the supercirculation control, the lift coefficient gradually increased, and the drag coefficient first increased and then flattened. The lift increase and aerodynamic efficiency were better in the separation control than in the supercirculation control.
- (3)
- When different blowing ratios were adopted for the three slots, the wing control effect could be further improved with the same total flow. The maximum lift-to-drag ratios increased by 97.1 and 143.48% at 1:1:1 and 3:1:2, respectively (compared with those in the absence of blowing). Remarkably, blowing through Slot.1 reduced the wing drag, whereas blowing through Slot.3 increased the wing lift.
- (4)
- In terms of the flow mechanism, at a low angle of attack, increasing the number of slots, had a relay effect on the trailing edge. This effect increased the curvature of the streamline near the Coanda surface, thus increasing the equivalent aerofoil camber and enhancing the wing lift. When air was blown simultaneously through the three slots, the increase in the blowing coefficient had a distinct acceleration effect on the suction surface. Moreover, velocity circulation on the wing increased, and the lift significantly improved. Furthermore, in the separation control, the entrainment effect of the blowing jet of the trailing edge through the upper surface enhanced the wake velocity. This reduced speed loss and drag. The control mode with a blowing ratio of 3:1:2 further reduced the velocity loss in the wake area of the trailing edge.
At a high angle of attack, increasing the number of slots and blowing coefficient could inhibit the formation of a backflow zone and enable the reattachment of flow to the suction surface. The control method with a blowing ratio of 3:1:2 could cause flow reattachment in the separation area of the suction surface and reduce velocity loss at the trailing edge.
Author Contributions
H.D. wrote the paper. L.Y. participated in the wind tunnel experiment and analysed the calculated results. S.C. provided constructive guidance in the process of preparing this paper. S.H. and W.Z. participated in the analysis and collation of literature materials. All authors have read and agreed to the published version of the manuscript.
Funding
This work was supported by the National Natural Science Foundation of China (Grant No. 51806181) and Foundation of the National Key Laboratory of Science and Technology on Aero-dynamic Design and Research (No. 614220121030205).
Institutional Review Board Statement
Not applicable.
Informed Consent Statement
Not applicable.
Data Availability Statement
The data supporting the findings of this study are available from the corresponding author upon reasonable request.
Conflicts of Interest
The authors declare no conflict of interest.
References
- Hassanzadeh, A.; Hassanabad, A.H.; Dadvand, A. Aerodynamic shape optimization and analysis of small wind turbine blades employing the Viterna approach for post-stall region. Alex. Eng. J. 2016, 55, 2035–2043. [Google Scholar] [CrossRef] [Green Version]
- Mm, A.; Mjm, B. Improvement of wind turbine aerodynamic performance by vanquishing stall with active multi air jet blowing. Energy 2021, 224, 120–176. [Google Scholar]
- Gen, M.S.; Akel, H.H.; Koca, K. Effect of partial flexibility over both upper and lower surfaces to flow over wind turbine airfoil. Energy Convers. Manag. 2020, 219, 113042. [Google Scholar]
- Wang, H.; Jiang, X.; Chao, Y.; Li, Q.; Li, M.; Zheng, W.; Chen, T. Effects of leading edge slat on flow separation and aerodynamic performance of wind turbine. Energy 2019, 182, 988–998. [Google Scholar] [CrossRef]
- Zhang, P.; Yan, B.; Dai, C. Lift enhancement method by synthetic jet circulation control. Sci. China Technol. Sci. 2012, 55, 2585–2592. [Google Scholar] [CrossRef]
- Stalnov, O.; Kribus, A.; Seifert, A. Evaluation of active flow control applied to wind turbine blade section. J. Renew. Sustain. Energy 2010, 2, 12080. [Google Scholar] [CrossRef]
- Krentel, D.; Nitsche, W. Investigation of the near and far wake of a bluff airfoil model with trailing edge modifications using time-resolved particle image velocimetry. Exp. Fluids 2013, 54, 1551. [Google Scholar] [CrossRef]
- Kotsonis, M.; Pul, R.; Veldhuis, L. Influence of circulation on a rounded-trailing-edge airfoil using plasma actuators. Exp. Fluids 2014, 55, 1772. [Google Scholar] [CrossRef]
- Harris, M.J. Investigation of the Circulation Control Wing/Upper Surface Blowing High-Lift System on a Low Aspect Ratio Semispan Model. In Report DTNSRDC/ASED-81/10; David Taylor Naval Ship R&D Center, Aviation and Surface Effects Department: Bethesda, MD, USA, 19 May 1981. [Google Scholar]
- Kind, R.J.; Maull, D.J. An Experimental Investigation of a Low-Speed Circulation-Controlled Aerofoil. Aeronaut. Q. 2016, 19, 170–182. [Google Scholar] [CrossRef]
- Zhu, H.; Hao, W.; Li, C.; Ding, Q.; Wu, B. Application of flow control strategy of blowing, synthetic and plasma jet actuators in vertical axis wind turbines. Aerosp. Sci. Technol. 2019, 88, 468–480. [Google Scholar] [CrossRef]
- Xiao, T.; Zhu, Z.; Deng, S.; Gui, F.; Li, Z.; Zhou, Z. Effects of nozzle geometry and active blowing on lift enhancement for upper surface blowing configuration. Aerosp. Sci. Technol. 2021, 111, 106536. [Google Scholar] [CrossRef]
- Sommerwerk, K.; Krukow, I.; Haupt, M.C.; Dinkler, D. Investigation of Aeroelastic Effects of a Circulation Controlled Wing. J. Aircr. 2016, 53, 1746–1756. [Google Scholar] [CrossRef]
- Li, Y.; Wang, X.; Zhang, D. Control strategies for aircraft airframe noise reduction. Chin. J. Aeronaut. 2013, 26, 249–260. [Google Scholar] [CrossRef] [Green Version]
- Luo, Z.; Zhao, Z.; Liu, J.; Deng, X.; Zheng, M.; Yang, H.; Chen, Q.; Li, S. Novel roll effector based on zero-mass-flux dual synthetic jets and its flight test. Chin. J. Aeronaut. 2022, 35, 1–6. [Google Scholar] [CrossRef]
- Cao, S.; Li, Y.; Zhang, J.; Deguchi, Y. Lagrangian analysis of mass transport and its influence on the lift enhancement in a flow over the airfoil with a synthetic jet. Aerosp. Sci. Technol. 2019, 86, 11–20. [Google Scholar] [CrossRef]
- Miklosovic, D.; Imber, R.; Britt-Crane, M. Measurements of Midspan Flow Interactions of a Low-Aspect-Ratio Circulation Control Wing. J. Aircr. 2016, 53, 1969–1974. [Google Scholar] [CrossRef]
- Wetzel, D.A.; Griffin, J.; Cattafesta, L.N. Experiments on an elliptic circulation control aerofoil. J. Fluid Mech. 2013, 730, 99–144. [Google Scholar] [CrossRef]
- Jonathan, K.; Panthe, C.C.; Smit, J.E. Applications of Circulation Control, Yesterday and Today. Int. J. Eng. 2010, 4, 411. [Google Scholar]
- Jones, G.; Viken, S.; Washburn, A.; Jenkins, L.; Cagle, C. An Active Flow Circulation Controlled Flap Concept for General Aviation Aircraft Applications, AIAA-2002-3157. In Proceedings of the 1st Flow Control Conference, St. Louis, MO, USA, 24–26 June 2002. [Google Scholar]
- Englar, R.J.; Huson, G.G. Development of advanced circulation control wing high-lift airfoils. J. Aircr. 1984, 21, 476–483. [Google Scholar] [CrossRef]
- Englar, R.J.; Smith, M.J.; Kelley, S.M.; Rover, R.C., III. Application of Circulation Control to Advanced Subsonic Transport Aircraft, Part I—Airfoil Development. J. Aircr. 1994, 31, 1160–1168. [Google Scholar] [CrossRef]
- Englar, R. Circulation Control Pneumatic Aerodynamics: Blown Force and Moment Augmentation and Modification; Past, Present and Future. AIAA J. 2013, 12. [Google Scholar] [CrossRef]
- Englar, R.J. Circulation Control for High Lift and Drag Generation on STOL Aircraft. J. Aircr. 1975, 12, 457–463. [Google Scholar] [CrossRef]
- Xu, H.Y.; Qiao, C.L.; Yang, H.Q.; Ye, Z.Y. Active Circulation Control on the Blunt Trailing Edge Wind Turbine Airfoil. AIAA J. 2018, 56, 554–570. [Google Scholar] [CrossRef]
- Xu, H.Y.; Dong, Q.L.; Qiao, C.L.; Ye, Z.Y. Flow Control over the Blunt Trailing Edge of Wind Turbine Airfoils Using Circulation Control. Energies 2018, 11, 619. [Google Scholar] [CrossRef]
- Jones, G.S.; Lin, J.C.; Allan, B.G.; Milholen, W.E.; Rumsey, C.L.; Swanson, R.C. Overview of CFD Validation Experiments for Circulation Control Applications at NASA, AIAA Paper 2008-030041. In 2008 International Powered Lift Conference; NASA Langley Research Center: Hampton, VA, USA, 2008; p. 23681. [Google Scholar]
Figure 1.
The influence of Coanda effect on streamlines and the concept of circulation control.

Figure 2.
Wind tunnel experiment system and experiment arrangement.

Figure 3.
Influence of air pipe on aerodynamic force. (a) Lift coefficient. (b) Drag coefficient.

Figure 4.
Multistage circulation control model. (a) Drawing of experimental model. (b) Multistage circulation control device. (c) Internal section view of wing trailing-edge and PIV shooting area.
Figure 4.
Multistage circulation control model. (a) Drawing of experimental model. (b) Multistage circulation control device. (c) Internal section view of wing trailing-edge and PIV shooting area.

Figure 5.
Results of repeated experiments. (a) Lift coefficient. (b) Drag coefficient.

Figure 6.
Comparison of wing aerodynamic characteristics with different numbers of slots (U∞ = 8 m/s and Q = 41.91 m3/h). (a) Lift coefficient. (b) Drag coefficient. (c) Lift-to-drag ratio.
Figure 6.
Comparison of wing aerodynamic characteristics with different numbers of slots (U∞ = 8 m/s and Q = 41.91 m3/h). (a) Lift coefficient. (b) Drag coefficient. (c) Lift-to-drag ratio.

Figure 7.
Aerodynamic curves of wing characteristics with different blowing coefficients (U∞ = 8 m/s). (a) Lift coefficient. (b) Drag coefficient. (c) Lift-to-drag ratio.
Figure 7.
Aerodynamic curves of wing characteristics with different blowing coefficients (U∞ = 8 m/s). (a) Lift coefficient. (b) Drag coefficient. (c) Lift-to-drag ratio.

Figure 8.
Wing aerodynamic characteristic curve with increasing blowing coefficient (U∞ = 8 m/s). (a) Lift coefficient. (b) Drag coefficient. (c) Lift-to-drag ratio.
Figure 8.
Wing aerodynamic characteristic curve with increasing blowing coefficient (U∞ = 8 m/s). (a) Lift coefficient. (b) Drag coefficient. (c) Lift-to-drag ratio.

Figure 9.
Aerodynamic curve of wing with each slot independently blown (U∞ = 8 m/s, Q = 27.94 m3/h). (a) Lift coefficient. (b) Drag coefficient. (c) Lift-to-drag ratio.
Figure 9.
Aerodynamic curve of wing with each slot independently blown (U∞ = 8 m/s, Q = 27.94 m3/h). (a) Lift coefficient. (b) Drag coefficient. (c) Lift-to-drag ratio.

Figure 10.
Wing aerodynamic characteristic curves at different blowing ratios (U∞ = 8 m/s, Q = 41.91 m3/h). (a) Lift coefficient. (b) Drag coefficient. (c) Lift-to-drag ratio.
Figure 10.
Wing aerodynamic characteristic curves at different blowing ratios (U∞ = 8 m/s, Q = 41.91 m3/h). (a) Lift coefficient. (b) Drag coefficient. (c) Lift-to-drag ratio.

Figure 11.
Comparison of velocity cloud and streamline diagrams at different numbers of slots (U∞ = 8 m/s, AoA = 0°). (a) No slot. (b) Single slot. (c) Two slots. (d) Three slots.
Figure 11.
Comparison of velocity cloud and streamline diagrams at different numbers of slots (U∞ = 8 m/s, AoA = 0°). (a) No slot. (b) Single slot. (c) Two slots. (d) Three slots.

Figure 12.
Comparison of velocity cloud and streamline diagrams with different number of slots (U∞ = 8 m/s, AOA = 20°). (a) No slot. (b) Single slot. (c) Two slots. (d) Three slots.
Figure 12.
Comparison of velocity cloud and streamline diagrams with different number of slots (U∞ = 8 m/s, AOA = 20°). (a) No slot. (b) Single slot. (c) Two slots. (d) Three slots.

Figure 13.
Near-field wake profiles with different number of slots (U∞ = 8 m/s, x/c = 1). (a) AoA = 0°. (b) AoA = 20°.
Figure 13.
Near-field wake profiles with different number of slots (U∞ = 8 m/s, x/c = 1). (a) AoA = 0°. (b) AoA = 20°.

Figure 14.
Comparison of velocity cloud and streamline diagrams at different blowing coefficients (U∞ = 8 m/s, AOA = 0°). (a) No Blowing. (b) Cμ-Slot.1 = Cμ-Slot.2 = Cμ-Slot.3 = 0.03. (c) Cμ-Slot.1 = Cμ-Slot.2 = Cμ-Slot.3 = 0.05. (d) Cμ-Slot.1 = Cμ-Slot.2 = Cμ-Slot.3 = 0.1.
Figure 14.
Comparison of velocity cloud and streamline diagrams at different blowing coefficients (U∞ = 8 m/s, AOA = 0°). (a) No Blowing. (b) Cμ-Slot.1 = Cμ-Slot.2 = Cμ-Slot.3 = 0.03. (c) Cμ-Slot.1 = Cμ-Slot.2 = Cμ-Slot.3 = 0.05. (d) Cμ-Slot.1 = Cμ-Slot.2 = Cμ-Slot.3 = 0.1.

Figure 15.
Comparison of velocity cloud and streamline diagrams at different blowing coefficients (U∞ = 8 m/s, AoA = 20°). (a) No Blowing. (b) Cμ-Slot.1 = Cμ-Slot.2 = Cμ-Slot.3 = 0.03. (c) Cμ-Slot.1 = Cμ-Slot.2 = Cμ-Slot.3 = 0.05. (d) Cμ-Slot.1 = Cμ-Slot.2 = Cμ-Slot.3 = 0.1.
Figure 15.
Comparison of velocity cloud and streamline diagrams at different blowing coefficients (U∞ = 8 m/s, AoA = 20°). (a) No Blowing. (b) Cμ-Slot.1 = Cμ-Slot.2 = Cμ-Slot.3 = 0.03. (c) Cμ-Slot.1 = Cμ-Slot.2 = Cμ-Slot.3 = 0.05. (d) Cμ-Slot.1 = Cμ-Slot.2 = Cμ-Slot.3 = 0.1.

Figure 16.
Near-field wake profiles with different blowing coefficients (U∞ = 8 m/s, x/c = 1). (a) AoA = 0°. (b) AoA = 20°.
Figure 16.
Near-field wake profiles with different blowing coefficients (U∞ = 8 m/s, x/c = 1). (a) AoA = 0°. (b) AoA = 20°.

Figure 17.
Comparison of velocity cloud and streamline diagrams at different blowing ratios (U∞ = 8 m/s, AoA = 0°). (a) 1:1:1 Blowing ratio. (b) 3:1:2 Blowing ratio.
Figure 17.
Comparison of velocity cloud and streamline diagrams at different blowing ratios (U∞ = 8 m/s, AoA = 0°). (a) 1:1:1 Blowing ratio. (b) 3:1:2 Blowing ratio.

Figure 18.
Comparison of velocity cloud and streamline diagrams at different blowing ratios (U∞ = 8 m/s, AoA = 20°). (a) 1:1:1 Blowing ratio. (b) 3:1:2 Blowing ratio.
Figure 18.
Comparison of velocity cloud and streamline diagrams at different blowing ratios (U∞ = 8 m/s, AoA = 20°). (a) 1:1:1 Blowing ratio. (b) 3:1:2 Blowing ratio.

Figure 19.
Near-field wake profiles with different blowing ratios (U∞ = 8 m/s, x/c = 1). (a) AoA = 0°. (b) AoA = 20°.
Figure 19.
Near-field wake profiles with different blowing ratios (U∞ = 8 m/s, x/c = 1). (a) AoA = 0°. (b) AoA = 20°.


Table 1.
Measurement range, calibrated precision, and accuracy of the balance.
| X (kg) | Y (kg) | Z (kg) | Mx (kg·m) | My (kg·m) | Mz (kg·m) | |
|---|---|---|---|---|---|---|
| Force | 5 | 20 | 5 | 1 | 1 | 3 |
| Precision (%) | 0.48 | 0.31 | 0.5 | 0.27 | 0.3 | 0.42 |
| Accuracy (%) | 0.18 | 0.2 | 0.2 | 0.1 | 0.085 | 0.19 |
Table 2.
Experimental parameters of variable number of slots.
| Single-Slot Blowing Test | Double-Slot Blowing Test | Three-Slot Blowing Test | |||||||
|---|---|---|---|---|---|---|---|---|---|
| Slot | Slot.1 | Slot.2 | Slot.3 | Slot.1 | Slot.2 | Slot.3 | Slot.1 | Slot.2 | Slot.3 |
| Total flow, Q (m3/h) | 41.91 | 41.91 | 41.91 | ||||||
| Flow rate, Q, of each slot (m3/h) | 41.91 | / | / | 20.95 | 20.95 | / | 13.97 | 13.97 | 13.97 |
Table 3.
Experimental parameters of variable blowing coefficient.
| Total Flow Q (m3/h) | Q-Slot.1 | Cμ-Slot.1 | Q-Slot.2 | Cμ-slot.2 | Q-Slot.3 | Cμ-slot.3 |
|---|---|---|---|---|---|---|
| 0 | 0 | 0 | 0 | 0 | 0 | 0 |
| 41.91 | 13.97 | 0.01 | 13.97 | 0.01 | 13.97 | 0.01 |
| 59.28 | 19.76 | 0.02 | 19.76 | 0.02 | 19.76 | 0.02 |
| 72.57 | 24.19 | 0.03 | 24.19 | 0.03 | 24.19 | 0.03 |
| 83.82 | 27.94 | 0.04 | 27.94 | 0.04 | 27.94 | 0.04 |
| 93.72 | 31.24 | 0.05 | 31.24 | 0.05 | 31.24 | 0.05 |
| 118.53 | 39.51 | 0.08 | 39.51 | 0.08 | 39.51 | 0.08 |
| 132.54 | 44.18 | 0.1 | 44.18 | 0.1 | 44.18 | 0.1 |
Table 4.
Experimental parameters of independent blowing of three slots.
| Slot.1 Independently Blown | Slot.2 Independently Blown | Slot.3 Independently Blown | |||||||
|---|---|---|---|---|---|---|---|---|---|
| Slot | Slot.1 | Slot.2 | Slot.3 | Slot.1 | Slot.2 | Slot.3 | Slot.1 | Slot.2 | Slot.3 |
| Total flow, Q (m3/h) | 27.94 | / | / | / | 27.94 | / | / | / | 27.94 |
| Cμ | 0.04 | / | / | / | 0.04 | / | / | / | 0.04 |
Table 5.
Experimental parameters of different blowing proportions.
| Total Input Flow, Q (m3/h) | Flow Rate, Q, through Each Slot (m3/h) | Blowing Ratio | ||
|---|---|---|---|---|
| Slot.1 | Slot.2 | Slot.3 | ||
| 41.91 | 13.97 | 13.97 | 13.97 | 1:1:1 |
| 41.91 | 10.47 | 10.47 | 20.95 | 1:1:2 |
| 41.91 | 6.98 | 13.97 | 20.94 | 1:2:3 |
| 41.91 | 20.94 | 13.97 | 6.98 | 3:2:1 |
| 41.91 | 20.94 | 6.98 | 13.97 | 3:1:2 |
Publisher’s Note: MDPI stays neutral with regard to jurisdictional claims in published maps and institutional affiliations. |
© 2022 by the authors. Licensee MDPI, Basel, Switzerland. This article is an open access article distributed under the terms and conditions of the Creative Commons Attribution (CC BY) license (https://creativecommons.org/licenses/by/4.0/).
Share and Cite
MDPI and ACS Style
Du, H.; Yang, L.; Chen, S.; Zhang, W.; Han, S. Effect of Multistage Circulation Control on Blade Aerodynamic Performance. Energies 2022, 15, 7395. https://0-doi-org.brum.beds.ac.uk/10.3390/en15197395
AMA Style
Du H, Yang L, Chen S, Zhang W, Han S. Effect of Multistage Circulation Control on Blade Aerodynamic Performance. Energies. 2022; 15(19):7395. https://0-doi-org.brum.beds.ac.uk/10.3390/en15197395
Chicago/Turabian StyleDu, Hai, Lejie Yang, Shuo Chen, Wenxiao Zhang, and Shengchun Han. 2022. "Effect of Multistage Circulation Control on Blade Aerodynamic Performance" Energies 15, no. 19: 7395. https://0-doi-org.brum.beds.ac.uk/10.3390/en15197395
Note that from the first issue of 2016, this journal uses article numbers instead of page numbers. See further details here.