

Techno-Economic Model for Scaling Up of Hydrogen Refueling Stations


1
Department of Engineering Sciences, Università degli Studi Guglielmo Marconi, 00193 Rome, Italy
2
CREAT, Centro di Ricerca su Energia, Ambiente e Territorio, Università Telematica eCampus, 22060 Novedrate, Italy
*
Author to whom correspondence should be addressed.
Energies 2022, 15(20), 7518; https://0-doi-org.brum.beds.ac.uk/10.3390/en15207518
Submission received: 19 September 2022
/
Revised: 7 October 2022
/
Accepted: 10 October 2022
/
Published: 12 October 2022
(This article belongs to the Special Issue Advances in Hydrogen Energy Ⅱ)
Abstract
:In a recent publication, the Hydrogen Council states that scaling up to greater production volumes leads to significant cost savings as a consequence of the industrialization of equipment manufacturing, increased utilization, standardization, and improvements in system efficiency and flexibility. In this study, a component-oriented techno-economic model is applied to five different European hydrogen refueling stations within the 3Emotion project, which is planned to ensure capacities sufficient for increasing a fleet to 100 fuel cell buses. The investigation of the various cases shows that the levelized cost of hydrogen (LCOH) for large-scale applications will be in the range of about 4 €/kg to 7 €/kg within the boundaries analyzed. On-site production facilities were found to be the lower-cost design, benefiting from the high volumes at stake and the economy of scale with respect to decentralized production due to the significant costs associated with retail hydrogen and transport. This study also illustrates the effects on the LCOH of varying the hydrogen delivery and production prices using a sensitivity analysis. The results show that, by utilizing high-capacity trailers, the costs associated with delivery could be reduced by 30%. Furthermore, green hydrogen production could be a competitive solution if coupled with low electricity prices, resulting in an LCOH between 4.21 €/kg and 6.80 €/kg.
1. Introduction
Many published studies agree in identifying hydrogen (H2) as the critical factor for a sustainable future [1] and a competitive and feasible solution for tackling global warming [2]. Furthermore, H2 is likely to deeply impact the entire energy value chain as a consequence of the increasing role of renewables [3]. However, the presuppositions that a fully developed hydrogen economy would require broader infrastructure development, a solid and regulated market [4], and, finally, the supportive involvement and collaboration of industrial entities in the energy transition [5] are also widespread.
As the number of fuel cell vehicles is rapidly growing worldwide [6,7], the establishment of a hydrogen refueling station (HRS) network for alternative facilities [8] and the investigation of the most appropriate locations to achieve the maximum impact are needed to complement this development [9]. Hydrogen has been proven to be a safe and reliable technology [10]; for this reason, refueling stations can also be situated within urban areas [11] when precautionary prevention measures are applied. The sustainability of such systems can be achieved once the optimal configuration scheme, maximizing the operating efficiency and minimizing the total cost while reducing the carbon footprint, is defined [12,13]. Moreover, the environmental impact will be further reduced due to the expansion of renewables [14] and improvements in water electrolysis technologies, which will additionally abate the footprint related to electrical energy supply [15]. Hydrogen technologies could also be a viable solution for integrating energy production and demand thanks to the possibility of storing large amounts of energy for an extended period if smart bidding strategies are implemented [16,17].
The positive role of green energies in improving environmental quality has recently been highlighted by Liu et al. [18]. Furthermore, by applying econometric approaches, Azam et al. [19] and Zakari et al. [20] have demonstrated the capacity of renewable energies to mitigate CO2 emissions and facilitate sustainable consumption and production. Moreover, optimal natural resource usage would help boost resilient ecosystems and contribute to healthier and more respectful lifestyles [21]. However, economic growth, conscious use of energy resources, and reductions in CO2 emissions can only be achieved if an adequate level of education is ensured [22].
Low-cost green hydrogen is the target that many countries pursuing deep decarbonization would like to reach as soon as possible [23]. However, the studies by Yates et al. [24] and Tang et al. [25] have demonstrated that only regions with high solar resources or excess wind power availability have the potential to produce hydrogen via water electrolysis at a significantly lower cost. In general, it has been proven to be expensive and still needs policy support to be cost-competitive [26,27,28]. Several actions have been identified that would help attenuate the associated costs: stabilizing the electricity supply for hydrogen production, developing a station design with a connection to the electricity grid [25], and increasing the hydrogen production capacity to allow economies of scale [29,30].
Large-scale applications and worldwide studies have demonstrated the advantages of larger stations for H2 unit costs due to greater utilization of stations as a consequence of expanded demand and reduced refueling equipment costs, improved efficiency, better flexibility in operations, and standardization [23,31,32,33]. Other studies have suggested that technology synergy between natural gas and renewables can further decrease costs [34,35]. In addition, advances have also been made in overcoming institutional barriers to rapid station completion; for example, the time required to plan, site, and permit stations [7,36].
The path towards effective commercialization and deployment of fuel cell buses (FCBs), in addition to the attestation of HRSs as safe, reliable, and cost-efficient systems in Europe, has been long and challenging, passing through several projects. Among the first demo projects on hydrogen mobility, Clean Hydrogen in European Cities (CHIC) [37] operated 54 hydrogen fuel cells and 9 infrastructure sites. The subsequent projects, 3Emotion [38] and the Joint Initiative for Hydrogen Vehicles across Europe (JIVE) [39], demonstrated the feasibility of greater station capacity (up to 400 kg/day) and the serviceability of higher fleets (more than 10 FCBs per site).
However, there are no studies that apply and investigate a methodology able to assess the consequences of implementing large-scale systems for hydrogen costs. This work presents an approach to quantify the impact of each component on the overall costs for on-site and delivery HRSs and applies it to a case study.
In a previous work [30], the authors developed a component-oriented cost model intended for the investigation of capital expenditure (CAPEX), operational expenditure (OPEX), and the levelized cost of hydrogen (LCOH) for five small-scale European HRSs within the 3Emotion project. Currently, the 3Emotion HRSs have capacities ranging from slightly more than 100 kgH2/day for the sites with on-site production to 400 kgH2/day. The objective of the scaling-up activity is to be able to refuel 100 vehicles/day, the targeted maximum hydrogen fleet in Europe. This work provides an indication of the techno-economic parameters for such scaling up, offering the following contributions:
- A realistic dataset for HRSs dedicated to heavy-duty applications;
- Economic evaluation for large fleets;
- The economy of scale effect on major components (compressor, electrolyzer);
- A sensitivity analysis of the impact of hydrogen delivery and production costs on the LCOH.
This study could provide a reference for investors and public transport operators predicting the future industrial development of hydrogen demand. The article is structured as follows: Section 2 describes the different types of hydrogen refueling infrastructure commercially available, with a particular focus on the stations within 3Emotion. Section 3 depicts the techno-economic boundaries and the assumptions behind the study. Section 4 explains the basic equations for the calculation of the levelized cost of hydrogen. The results are presented and discussed in Section 5 and Section 6, including a sensitivity analysis of hydrogen delivery. Finally, in Section 7, the conclusions and recommendations are provided.
2. Description and Case Studies of Hydrogen Refueling Stations
2.1. On-Site Hydrogen Stations: The Pau and Aalborg HRSs
On-site stations, where H2 is obtained via electrolysis coupled with renewable energy technology, represent a low-carbon energy solution for hydrogen refueling. The input feeds for such facilities are electricity and water, thus requiring the relative availability of a grid connection. Since the outlet pressure of commercial electrolyzer systems is usually 30–40 bar, a compressor is integrated into these station to raise the pressure to the storage level; i.e., from 200 bar up. However, an alternative solution, involving a high-pressure water electrolyzer delivering at several hundred bars, thus making it possible to remove the mechanical compression, has been studied. However, this type of system is not yet widespread on the market [40].
The reliability of an HRS is extremely dependent on the electrolyzer operation, and it is common to include a backup hydrogen supply via a tube trailer. From an operational point of view, on-site HRSs are more versatile thanks to direct control of the flow rate depending on the demand. Nevertheless, the overall plant configuration is more complex, and a specific control system for the operating conditions must be implemented [23].
The city of Pau, a prefecture in the department of Pyrénées-Atlantiques in the south of France, opened its first HRS in 2019, serving eight Van Hool Exqui.City FC 18 m H2 buses [41]. The station is composed of a polymer electrolyte membrane (PEM) electrolyzer, two compressors, a series of low pressure (LP; 20 bar) and high pressure (HP; 600 bar) storage vessels, and a dispensing system at 350 bar. The station can provide H2 at a nominal capacity of 174 kg/day, increasing to a maximum of 268 kg/day. In addition, the HRS is equipped with a connection point to discharge the supplied H2 and insert it into the line.
The city of Aalborg, located in northwestern Denmark, inaugurated its HRS for public transport in 2020 [42]. The station provides fuel to three 12 m Van Hool buses through an on-site PEM electrolyzer, with an expected 100 kg/day capacity. The H2 is stored in a pressurized vessel at 35 bar and later compressed at 300 and 450 bar.
2.2. Delivery Hydrogen Stations: The London, Rotterdam, and Versailles HRSs
An alternative solution to on-site production is the delivery of H2 from a centralized production facility to the point of demand via road transport or through pipelines. The former is achieved by utilizing trucks (delivery of up to 300 kg) or tube trailers (maximum potential of 1000 kg), in which the gas is stored in a compressed form at pressures greater than 180 bar [43].
Alternatively, liquid hydrogen vessel trucks transporting the gas at a cryogenic temperature of −253 °C are employed [44]. The advantage of low-temperature liquid hydrogen is the much higher bulk density of the compressed gas, which increases the storage capacity per vehicle by about nine times [13]. However, the significant amount of energy required for the liquefaction process and the large investment due to the supplementary equipment (liquid storage tank, insulated process line, heaters, pumps, buffers) mean that the technology is only suitable for long transportation distances and large volumes [45].
Pipeline systems transporting hydrogen at 40–80 bar are a preferred option where lines are already available. However, in the future, when large-scale hydrogen consumption will require a well-developed infrastructure, such systems are expected to play an important role in delivering high volumes [46].
The London HRS has been operating as part of 3Emotion since 2015, refueling ten buses: eight Wrightbuses with the Ballard HD-6 fuel cell module and two new Van Hool buses with HD-7 fuel cell modules. The H2 is produced by a steam methane facility in Rotterdam and transported by liquid trailers to the site over 300 km. The trailers are successively used for integrated storage (up to 900 kg). In addition, the station also includes a permanent on-ground vessel (350 kg) at 500 bar.
The Rotterdam HRS is the only station within 3Emotion that is supplied by a pipeline. The H2 is provided continuously at the service point at 30 bar and then stored at 495 bar and 877 bar. The station serves two cities’ public transport operators, for a total of six FCBs, as well as private cars.
Lastly, an HRS was built in Versailles in 2017 by AirLiquide near its research center. Blue hydrogen is delivered to the site two or three times per week in compressed form through tube trailers transporting 350 kg of gas at 200 bar. The storage system is provided by the tube trailers, which remain on-site, with medium pressure (MP) storage at 495 bar and HP storage at 877 bar. As in the Rotterdam HRS, this location is open to two public transport operators, refueling a fleet of seven FCBs and light vehicles. A summary of the main characteristics of the five HRSs in the 3Emotion project is illustrated in Table 1.
3. System Boundary
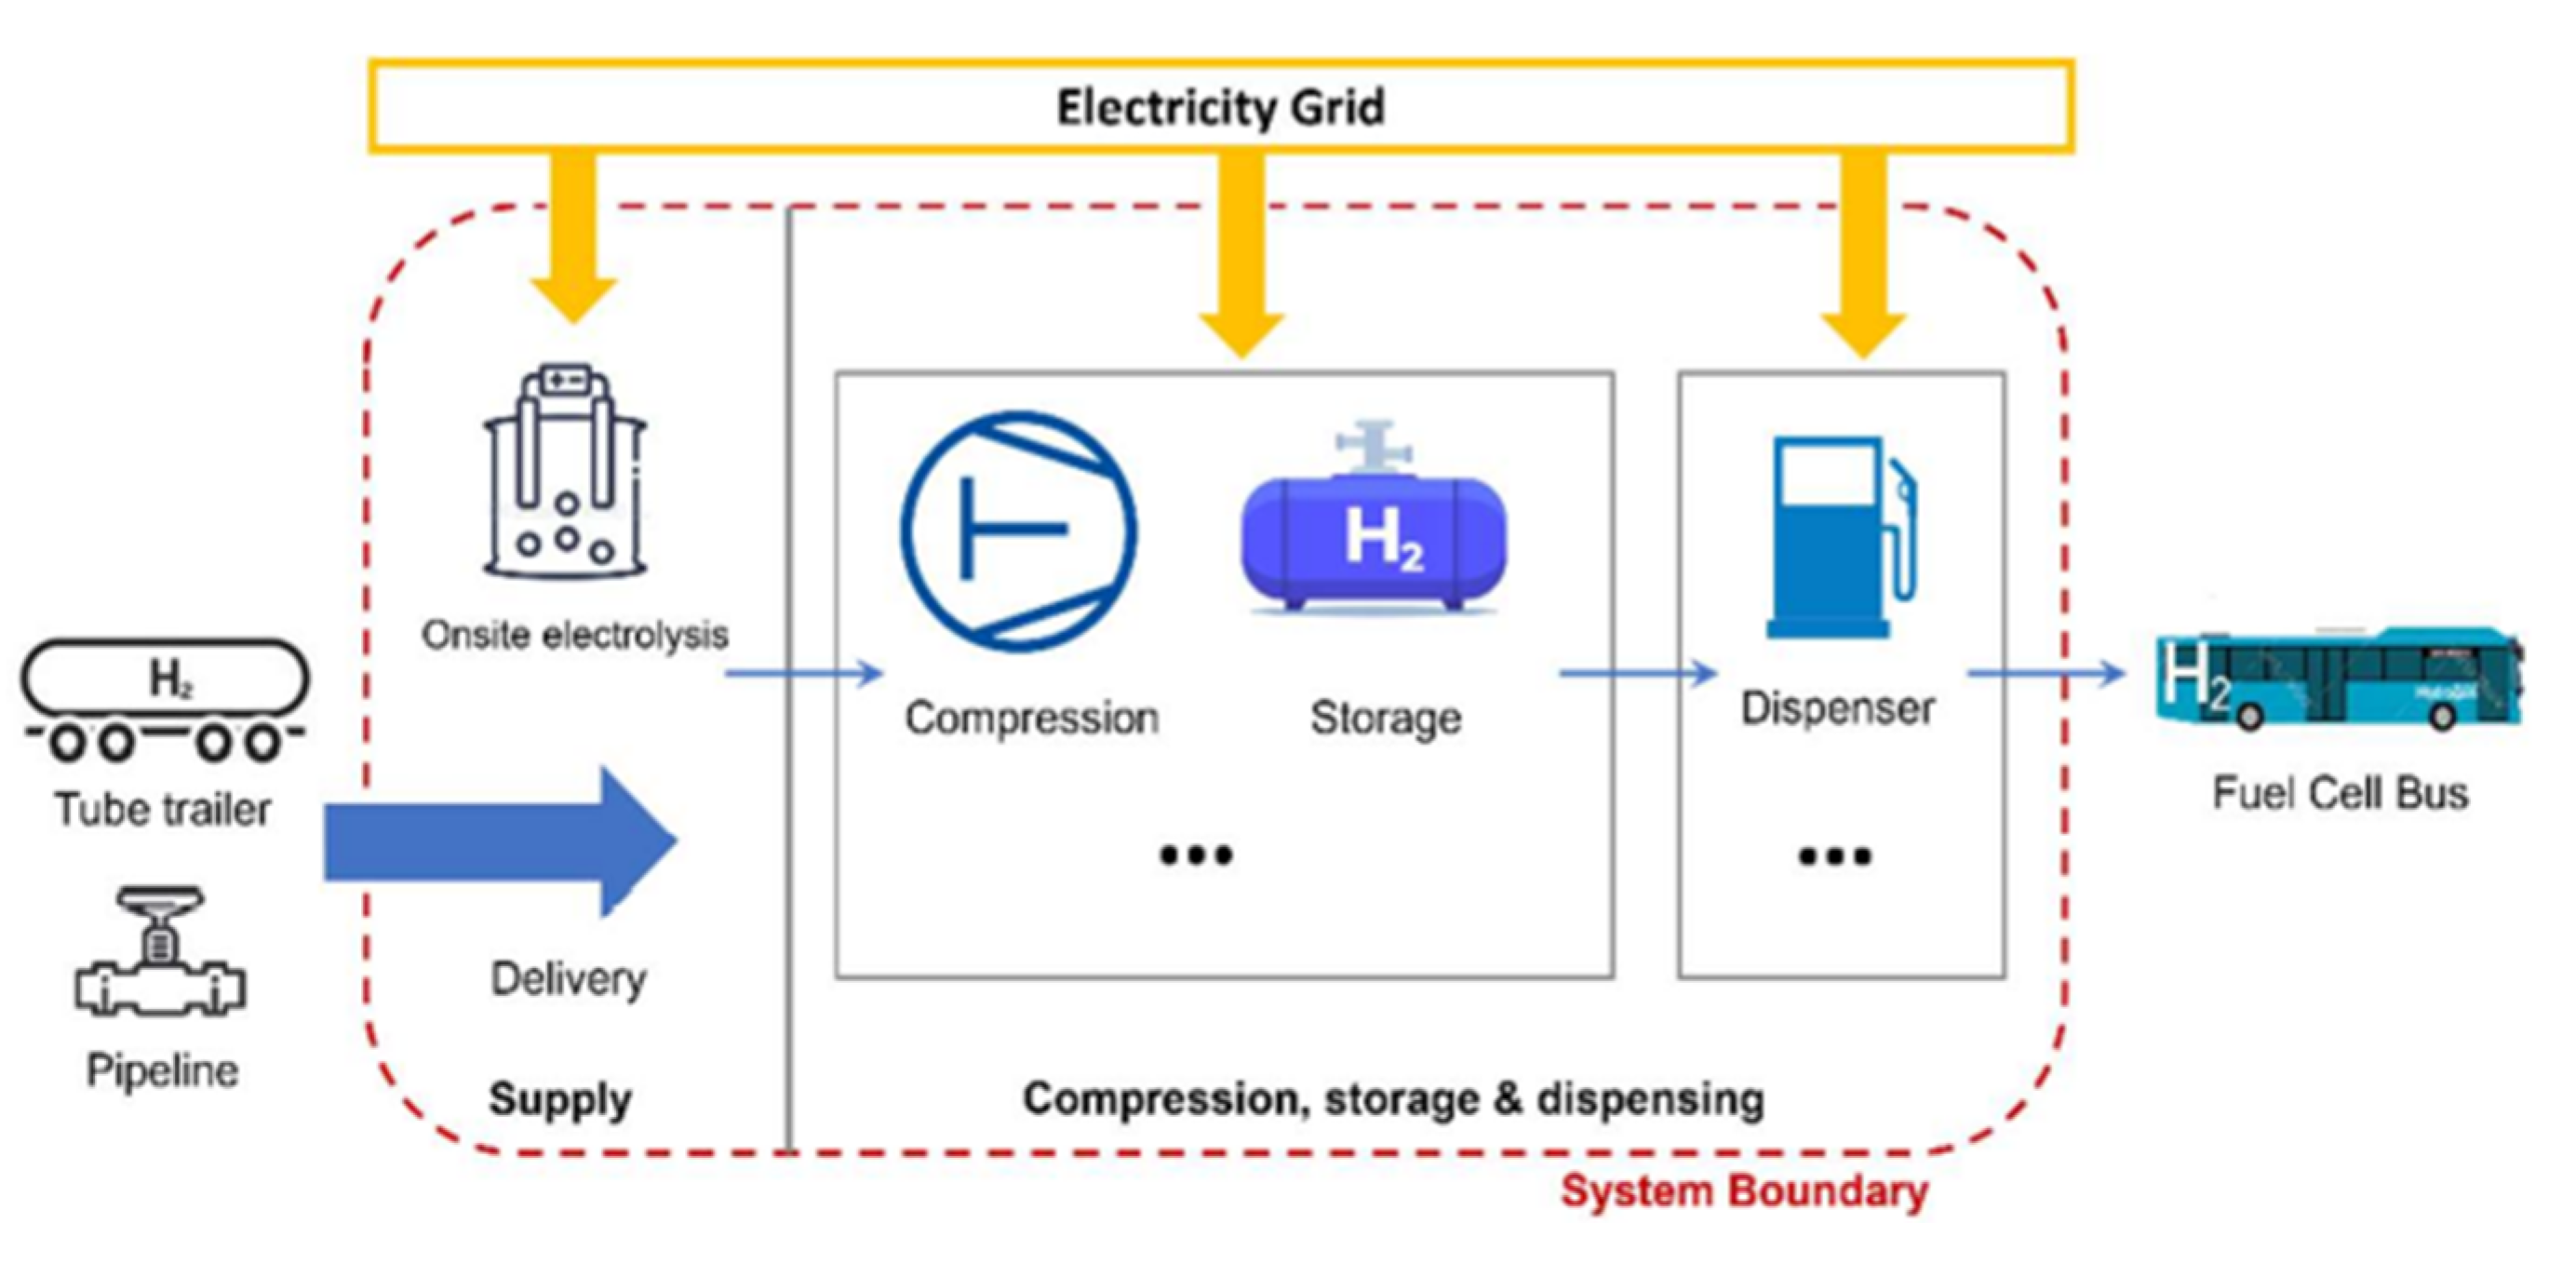
The authors of [30] presented an HRS techno-economic model to evaluate in detail the CAPEX, OPEX, and LCOH for the five HRSs in 3Emotion as designed. The results were obtained by applying a bottom-up approach starting from the specific characteristics of each component. The system was limited to the supply of H2 (either on-site or offsite) and the compression, storage, and dispensing systems, as represented in Figure 1. In accordance these assumptions, the cost of hydrogen produced in centralized facilities and the cost associated with hydrogen vaporization were not included in the model.
This work utilized the same conceptual scheme, but the aim was to evaluate the technical requirements and associated costs for the implemented HRSs that would ensure refueling capacities for a fleet of 100 FCBs per day for each sites.
The same infrastructure design was maintained for each site (Pau and Aalborg producing hydrogen on-site through PEM electrolysis, London receiving liquid hydrogen, Rotterdam connected to a pipeline, and Versailles supplied by compressed gas). At the same time, the daily demand was assessed based on the current performances of the FCBs in terms of H2 consumption, distance travelled, and HRS operation; i.e., the average quantity of hydrogen dispensed and the refueling time per bus. Table 2 summarizes the main hypotheses on which the scale-up model was set up.
3.1. Delivery Cost Assumptions
This section summarizes the principal assumptions used to calculate the delivered H2 costs. Except for the civil works adjustments that are required to accommodate the compressed gas trailers to the stations, which are seen as CAPEX by the HRS operator, the supply of hydrogen falls within the OPEX, including the transportation and distribution to the point of demand, the leasing of vehicles, and the retail hydrogen price. The fixed costs for the civil works at the stations and related connections are estimated to be EUR 110,000 [32].
As mentioned in Section 2, there are three delivery stations in 3Emotion, each with a different hydrogen supply. The London HRS is designed to receive 450 kg of usable hydrogen from liquid trailers, which travels 300 km before arriving at the site. Frequent delivery of hydrogen would be required to satisfy the demands of 100 FCBs, which would be about 95 kg/h. The station was assumed to be open 24/7; therefore, it was found that about 36 vehicles per week would be necessary to comply with the H2 request. In contrast, compressed gas tube trailers with a capacity of 350 kg and a nominal pressure of 200 bar are utilized at Versailles. The distance from the production point to the site is about 200 km. The station capacity was calculated to be 75 kg/h, depending on the buses’ specific requirements, which is equivalent to 37 trips/week. If a liquid trailer were employed, the frequency of the delivery for the same volumetric quantity of gas would be reduced by one-third due to the much higher mass density for liquid form (LH2 = 71 kg/Nm3 vs. CGH2 = 0.0898 kg/Nm3 at standard conditions) [47]. Since the cost associated with fuel supply represents a significant part of the operating costs [48], a sensitivity analysis of the LCOH when varying the quantity of H2 delivered—and, thus, the frequency of trips to the stations—was performed in this study.
Currently, hydrogen, whether in liquid or compressed form, is transported via diesel trailers. In this study, the reference tables published by the Italian Ministry of Infrastructure and Transport were utilized, from which the cost per kilometer of travel for vehicle weights above 26 tons was assumed to equal 0.423 €/km [49]. Vehicle leasing prices follow specific agreements between the supplier and the HRS operator. For the purpose of this work, 2150 €/month was utilized.
In contrast, when a pipeline secures the supply, the fuel is provided continuously, depending on the final user demand. According to the literature, the transportation cost is assumed to equal 0.2 €/kg (100 km) [50].
Finally, the last contribution to the delivery OPEX is given by the retail hydrogen price, which strictly depends on the H2 quality, origin of production, physical state, and distribution route. Studies indicate H2 delivery prices in the range from 2 to 11 €/kg [51,52]. Thus, to maintain consistency with a previous study, it was set at 4 €/kg for blue hydrogen [30]. A summary of the technical and economic parameters mentioned in this section is given in Table 3.
3.2. On-Site Production Cost Assumptions
The Pau and Aalborg HRSs are designed to produce hydrogen locally via electrolysis with energy supplied by the grid. Although the background assumption of our model is that the HRSs serve the same number of vehicles, the station capacities of the two sites differ (2180 kg/day for Pau and 1520 kg/day for Aalborg) because of the different operations of the buses (see Table 1). Taking 4.5 kWhe/Nm3 (or 50 kWhe/kg) specific energy consumption (SEC) at the system level [53] as a reference for large-scale hydrogen production, the corresponding electrolyzer sizes required to sustain the calculated flow rate would be 5 MW and 4 MW. The HHV-based electrical to hydrogen efficiency for the two systems is 78%, which is compatible with the 2025 alkaline technology target according to EU studies [54].
The water consumption, around 28 lH20/kg of hydrogen produced, was calculated as three times the stoichiometric value based on the reaction 2H2O→2H2 + O2, accounting for purification system losses and cooling water requirements [48]. In addition, the auxiliary consumption was assumed to be equal to 5% of the SEC.
The capital cost of the electrolyzers was obtained by applying a cost scaling function that allows the determination of the specific cost (€/kW) of any power class with respect to a base-case scenario in which the size is fixed at 100 kW. The CAPEX was found to be 2000 €/kW and scaled by a factor of 0.45 [27].
The operational cost includes the operating and maintenance (O&M) costs, the electricity cost for running the stack and the auxiliaries, and the water cost. Generally, O&M costs are calculated as a percentage of the CAPEX, since the manufacturers are not able to provide detailed indications about single component expenditure [55]. For the techno-economic analysis in this study, an O&M OPEX of 5% of the initial CAPEX was used. The electricity price was obtained from an evaluation of the average monthly electricity prices in France and Denmark for the year 2020 that did not take into account the soaring prices that followed COVID-19 and the supply shortage as a consequence of the Russia–Ukraine war [56,57]. Finally, the water cost was set at 2.6 €/m3 for Pau and 5.3 €/m3 for Aalborg, in accordance with the averages for the countries [58].
Table 4 summarizes all the techno-economic parameters used to evaluate the hydrogen production cost.
3.3. Compression, Storage, and Dispensing Assumptions
Regardless of how H2 is supplied to the point of demand, all stations are equipped with a compression unit to raise the gas pressure to that required for storage. Several types of compressors can be found on the market, but the most suitable for hydrogen-filling stations are reciprocating compressors, either diaphragm- or hydraulically piston-driven. In the former, only the diaphragm membrane and the compressor head make contact with the pumped gas, preventing any contamination of the process fluid. In the latter, hydraulic power is transferred to a piston that compresses gas [59]. Although this system can provide a large quantity of hydrogen, the main disadvantage is the vibration due to non-continuous gas delivery [60].
In this work, a three-stage piston compressor was modeled. The electrical power of the compressors required for the five HRSs was obtained by multiplying the corresponding mass flow rate (kg/h) by the specific work (kWh/kg) and dividing the result by the isentropic efficiency (), the mechanical efficiency (), and the electric efficiency ().
where is the ratio of the specific heats, (K) is the inlet temperature equal to the ambient temperature, is the inlet pressure (site-specific), and is the outlet pressure (500 bar). The total system compression power also includes 20% of the energy absorbed by the auxiliaries. The compressor power (kW) was used to estimate the relative CAPEX, obtained by applying the relation presented in [29]:
The compressor OPEX comprises the O&M cost, calculated as 8% of the CAPEX [29], and the electricity cost, already discussed in the previous paragraph.
The hydrogen is stored at the stations using multiple compressed gas cylinders at different pressure levels [61,62,63]. However, the design was simplified by modeling a single MP level at 500 bar. The sizing criterion was a 20% increase in the daily demand. The component CAPEX was determined assuming a specific cost of 900 €/kW [53,64]. The OPEX was calculated as 2% of the CAPEX [29].
The number of dispensers was settled upon using the most extreme demand in the daily requests at each station. The dispensers are designed to have one hose and a single pressure level at 350 bar. Multiple refueling processes with a lingering time—that is, the time between consecutive fills—of 10 min are possible. These assumptions allow the evaluation of the maximum number of FCBs that can be refueled simultaneously in one hour and the number of FCBs each dispenser can serve. The ratio of these values facilitates the design solution in this model. For all the HRSs, the parameters used to address the numbers of dispensers are presented in Table 4. The CAPEX cost for a single pressure level without a cooling dispenser was calculated according to the capacity for hydrogen refueling (kg/day) [30]. The OPEX was calculated as 2% of the CAPEX [29].
4. Levelized Cost of Hydrogen (LCOH) Calculation
The LCOH is defined as the ratio (€/kg) between the sum of net present costs of hydrogen generation during the technology life cycle and the annual hydrogen demand. It is widely used to compare the competitiveness and economic efficiency of different technologies for hydrogen production [65]. It is computed using the general equation:
The total cost is calculated as the sum of the annualized CAPEX ) and the yearly OPEX for each component i of the station (production, compression, storage, and dispensing):
The is estimated by considering a technology lifetime (n) of 15 years and an interest rate (i) of 6%, and the typical range for the technology is 3% to 6% [66]:
Due to the specific design of the production sites, which does not foresee an energy generation plant connected to the station and, for this reason, works upon the assumption of satisfying the demand with energy bought from the grid, no revenues from selling the energy were considered. In addition, no costs associated with the replacement of the components were included.
5. Results Analysis
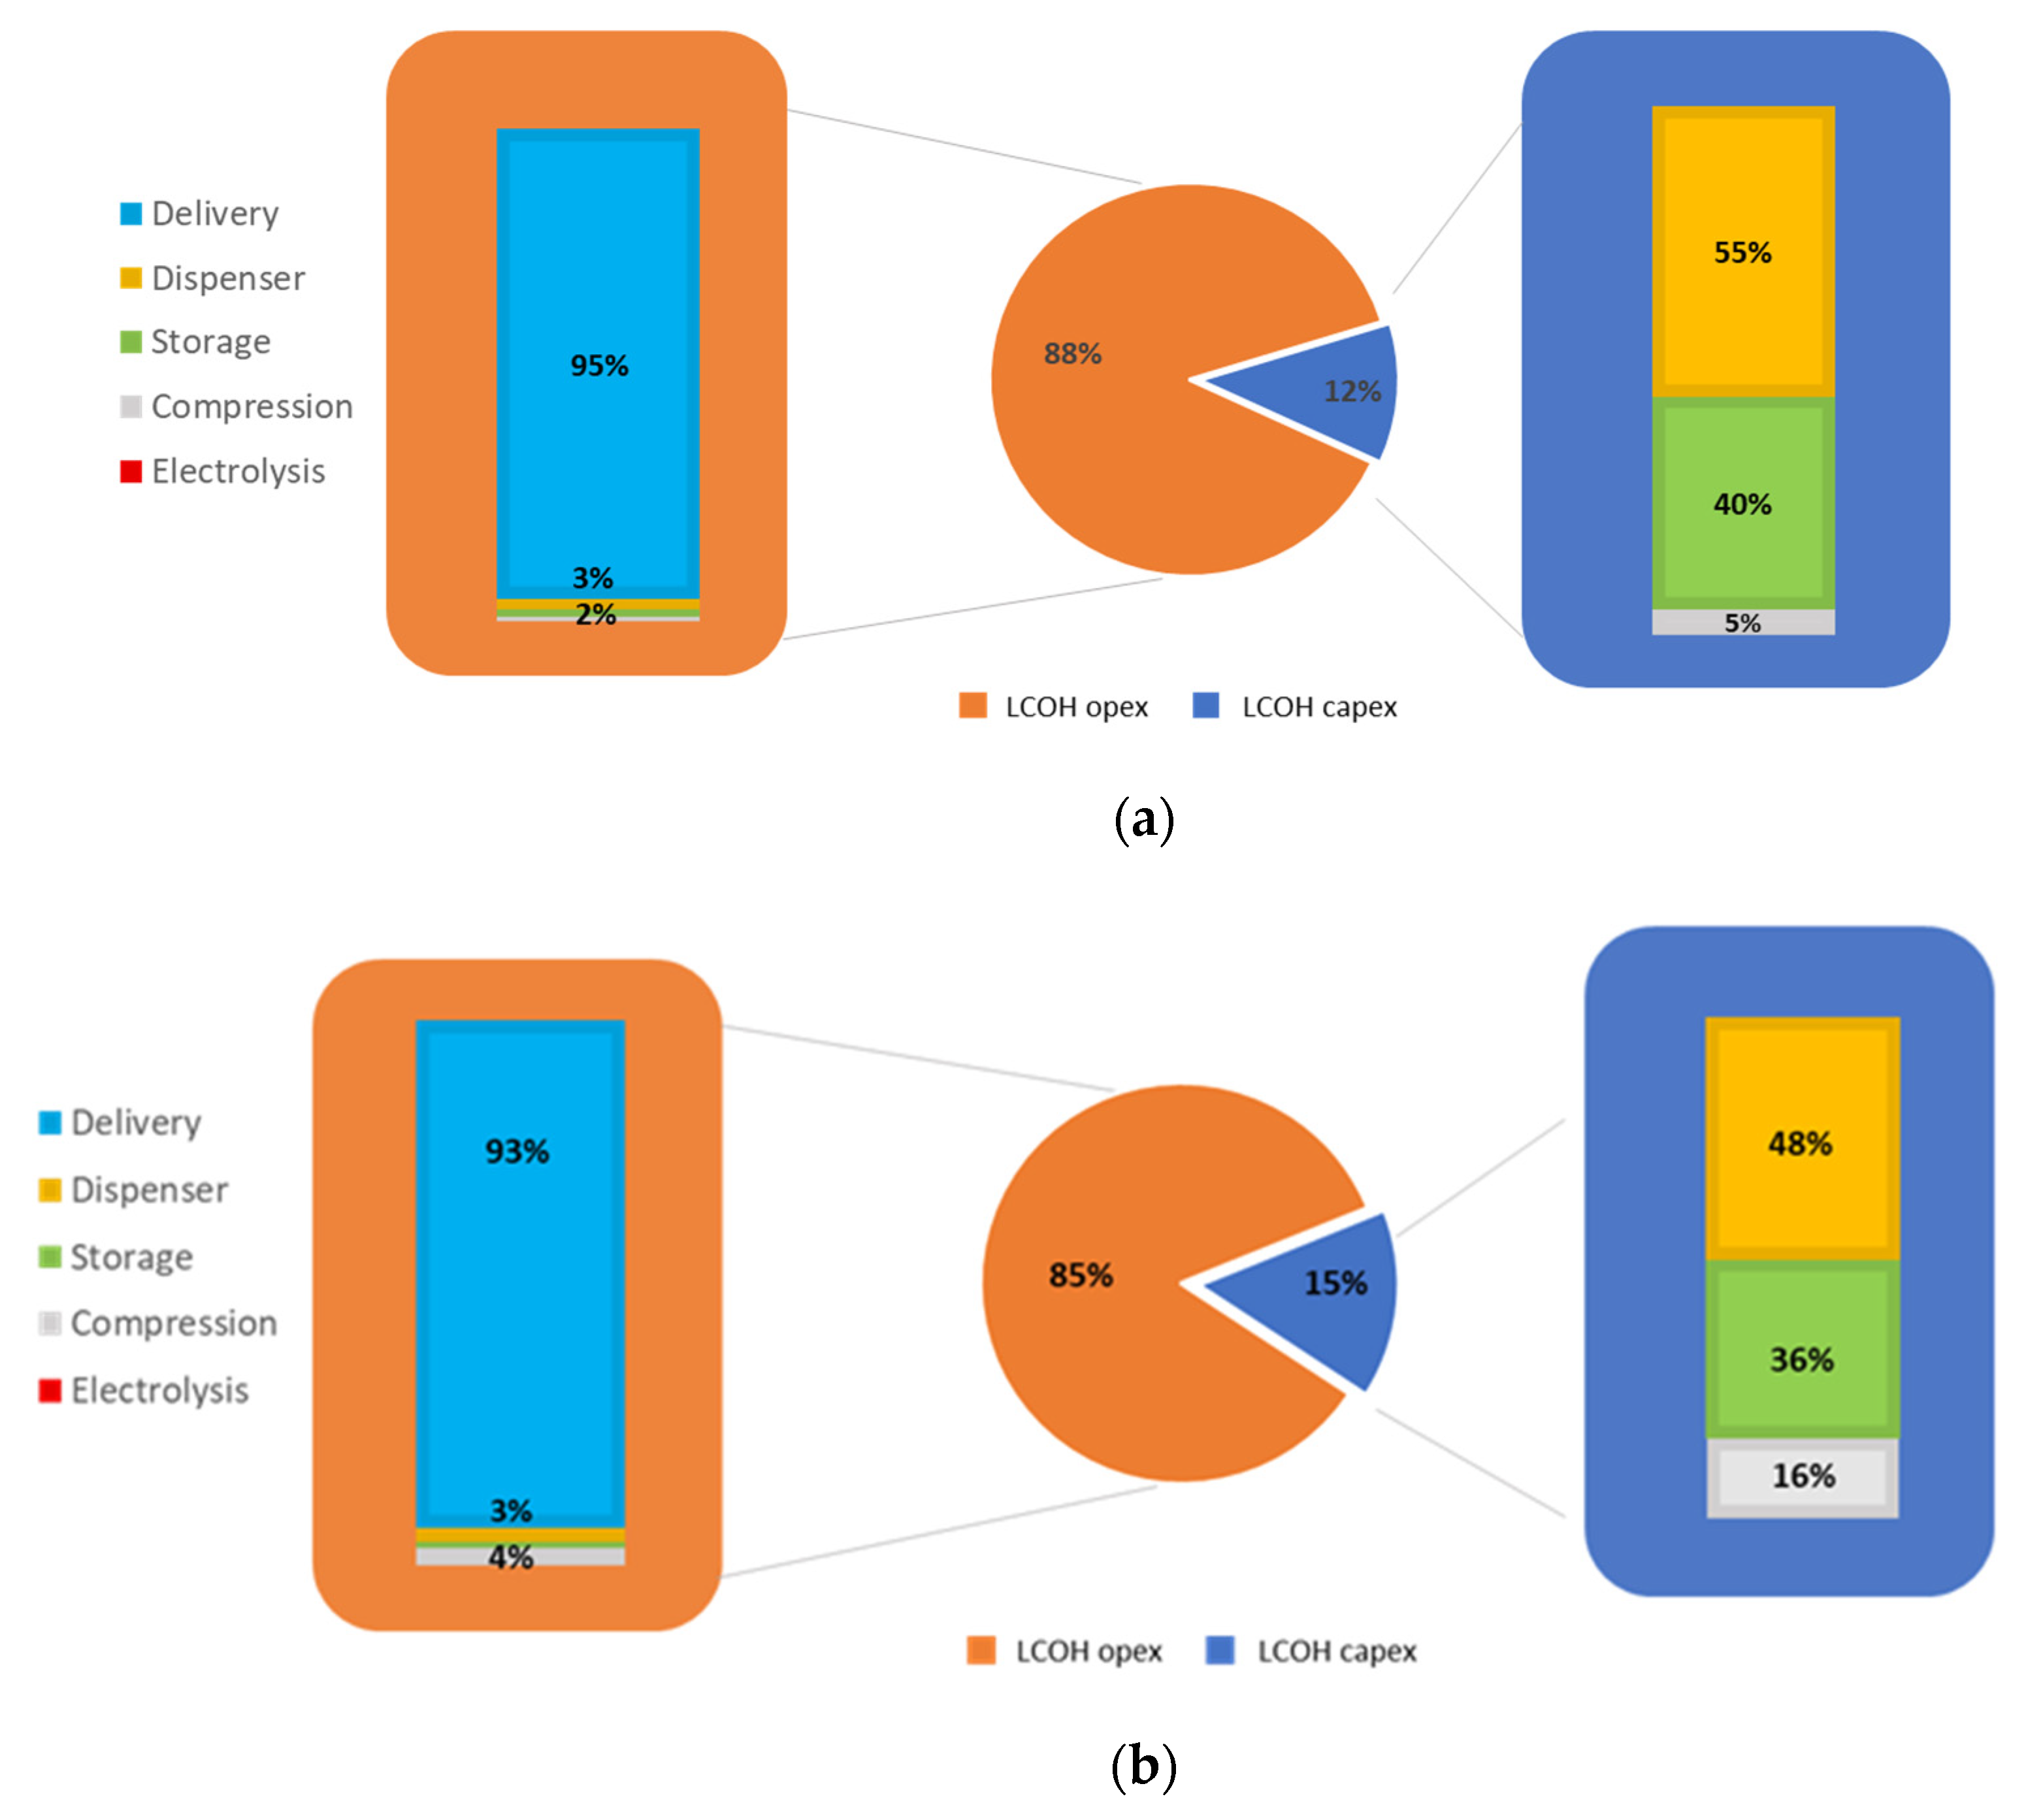
A breakdown of the costs for the five sites shows that, despite the differences in the supply extensively discussed in the previous sections, the OPEX accounts for more than 65% of the total (Figure 2). For the London (Figure 2a) and Versailles HRSs (Figure 2b), the share of operational expenditures reaches 88%, driven by the dominant costs associated with the procurement and transportation of hydrogen to the point of demand, either in liquid or compressed physical state (5.51 €/kg and 5.86 €/kg, respectively). Due to the high amount of hydrogen delivered (more than 1000 kg/day) and the relatively long distance of distribution (more than 200 km), the liquid hydrogen trailer cost is lower than that of the compressed hydrogen since such trailers are able to carry more than four times the payload compared to gaseous solutions [51].
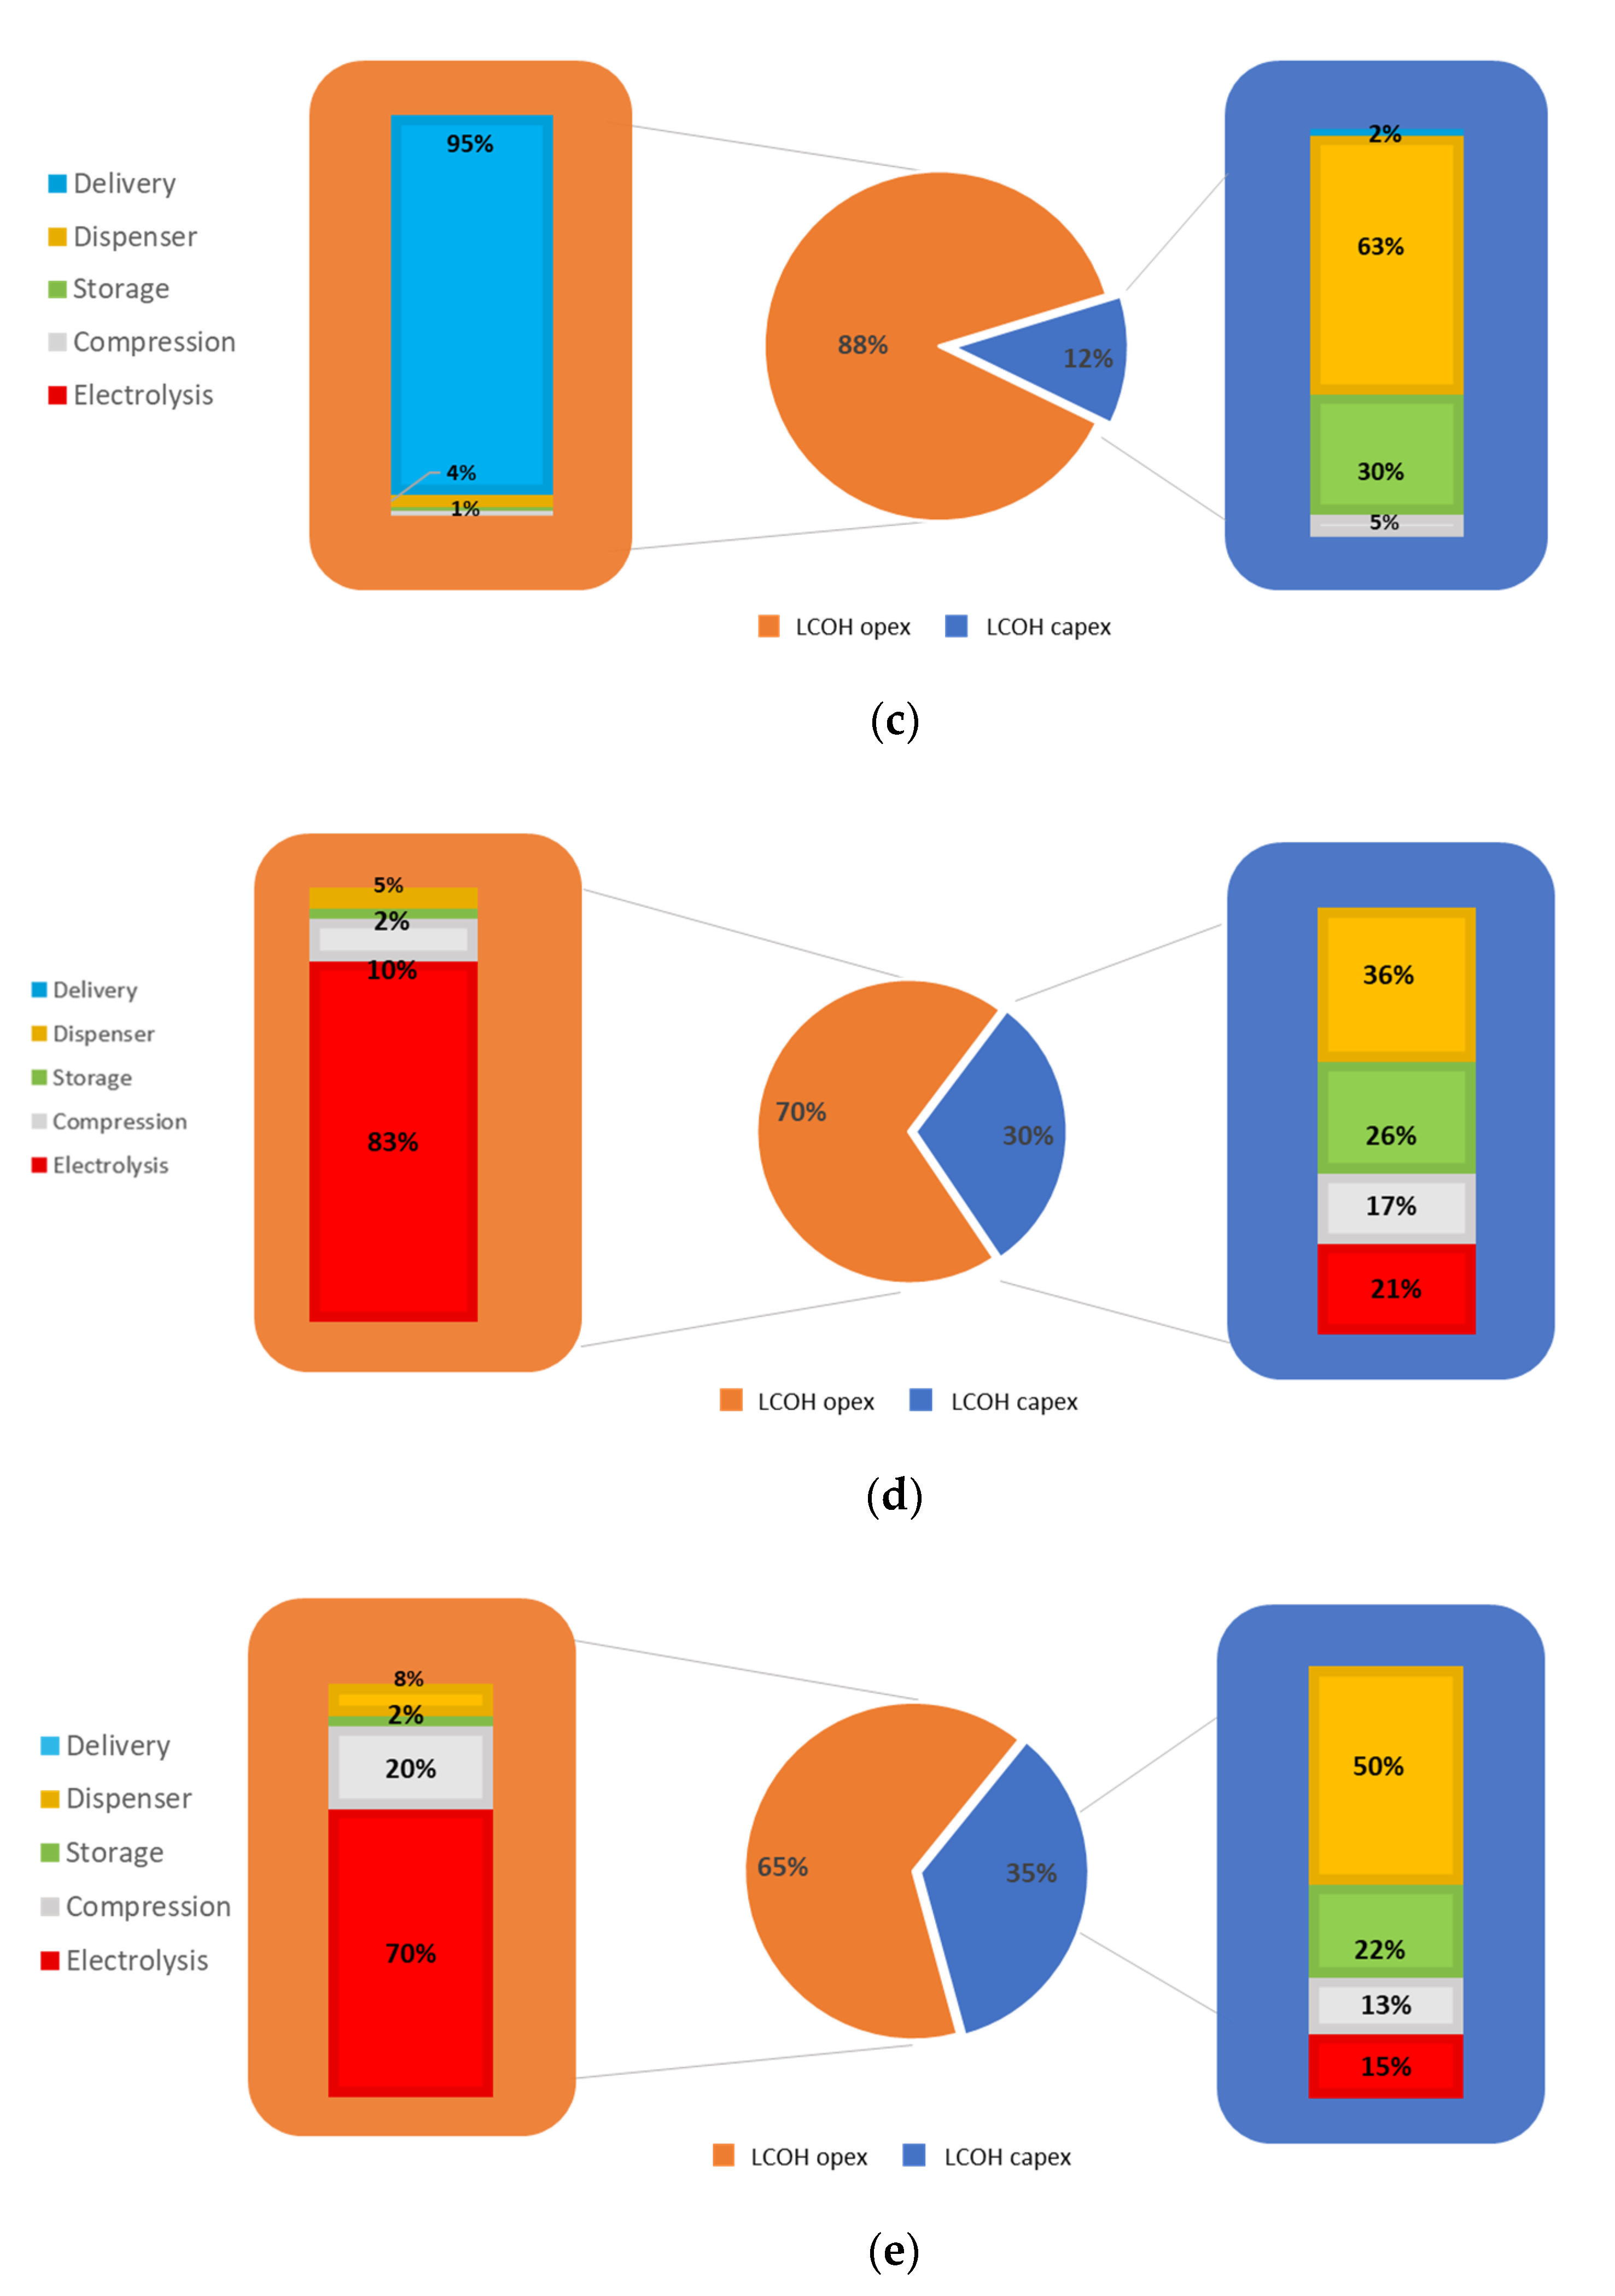
However, these results are sensitive to the high cost of liquefaction when evaluated [67]. For the on-site HRSs, Aalborg (Figure 2d) and Pau (Figure 2e), the considerable expenses associated with the electricity required to run the electrolysis and compression units is the major contributor to the LCOH OPEX, with almost the same impact as one would expect [30,48,65]. In contrast, the CAPEX results for these sites show how the economy of scale positively influences the costs of the most critical components, such as the compressor (about 3000 €/kW) and electrolyzer (about 400 €/kW), and the overall cost of hydrogen, leading to savings of up to 40–50% with respect to what was previously calculated [30]. The results align with the projected cost of hydrogen production via electrolysis published by the International Energy Agency (IEA) [68]. Finally, the storage LCOH represents a relevant but not predominant contribution to the CAPEX.
The breakdown of the CAPEX for the key components of delivery HRSs shows that, even in a large-scale scenario, the cost of storage based on composite pressure vessels offsets the cost savings obtained from the absence of a generation unit. As a result of the HRS design, the compressor in Rotterdam has to sustain a more significant load due to lower input pressure. The resulting greater size affects the capital cost, which accounts for twice the share compared to London and Versailles.
Overall, in the large-scale capacity scenario with increasing fleet size, the hydrogen cost is relatively independent of the type of supply. On-site production was found to be the design with a lower cost, benefiting from the high volumes at stake and the economy of scale with respect to decentralized production (Rotterdam LCOH = 6.51 €/kg, London LCOH = 5.81 €/kg, Aalborg LCOH = 3.83 €/kg, Pau LCOH = 4.47 €/kg). Nevertheless, the LCOH is still strongly influenced by the electricity and hydrogen prices, as demonstrated by the Versailles site results (LCOH = 7.21 €/kg). The cost model results concerning the CAPEX, OPEX, and LCOH breakdowns for all the HRSs are summarized in Table 5 and Table 6.
Sensitivity Analysis
The OPEX cost of hydrogen delivery in the scaling-up scenario was calculated assuming the same trailer capacity as in the already built HRSs; i.e., 350 kgH2 at 200 bar in Versailles and 450 kgH2 in London. However, as a consequence of the larger volumes, the number of trips the trailers have to undertake to fulfill the demand is not practical. Therefore, a sensitivity analysis of the LCOH, varying the quantity of hydrogen provided to the station and, thus, the required number of trailers per week, was performed.
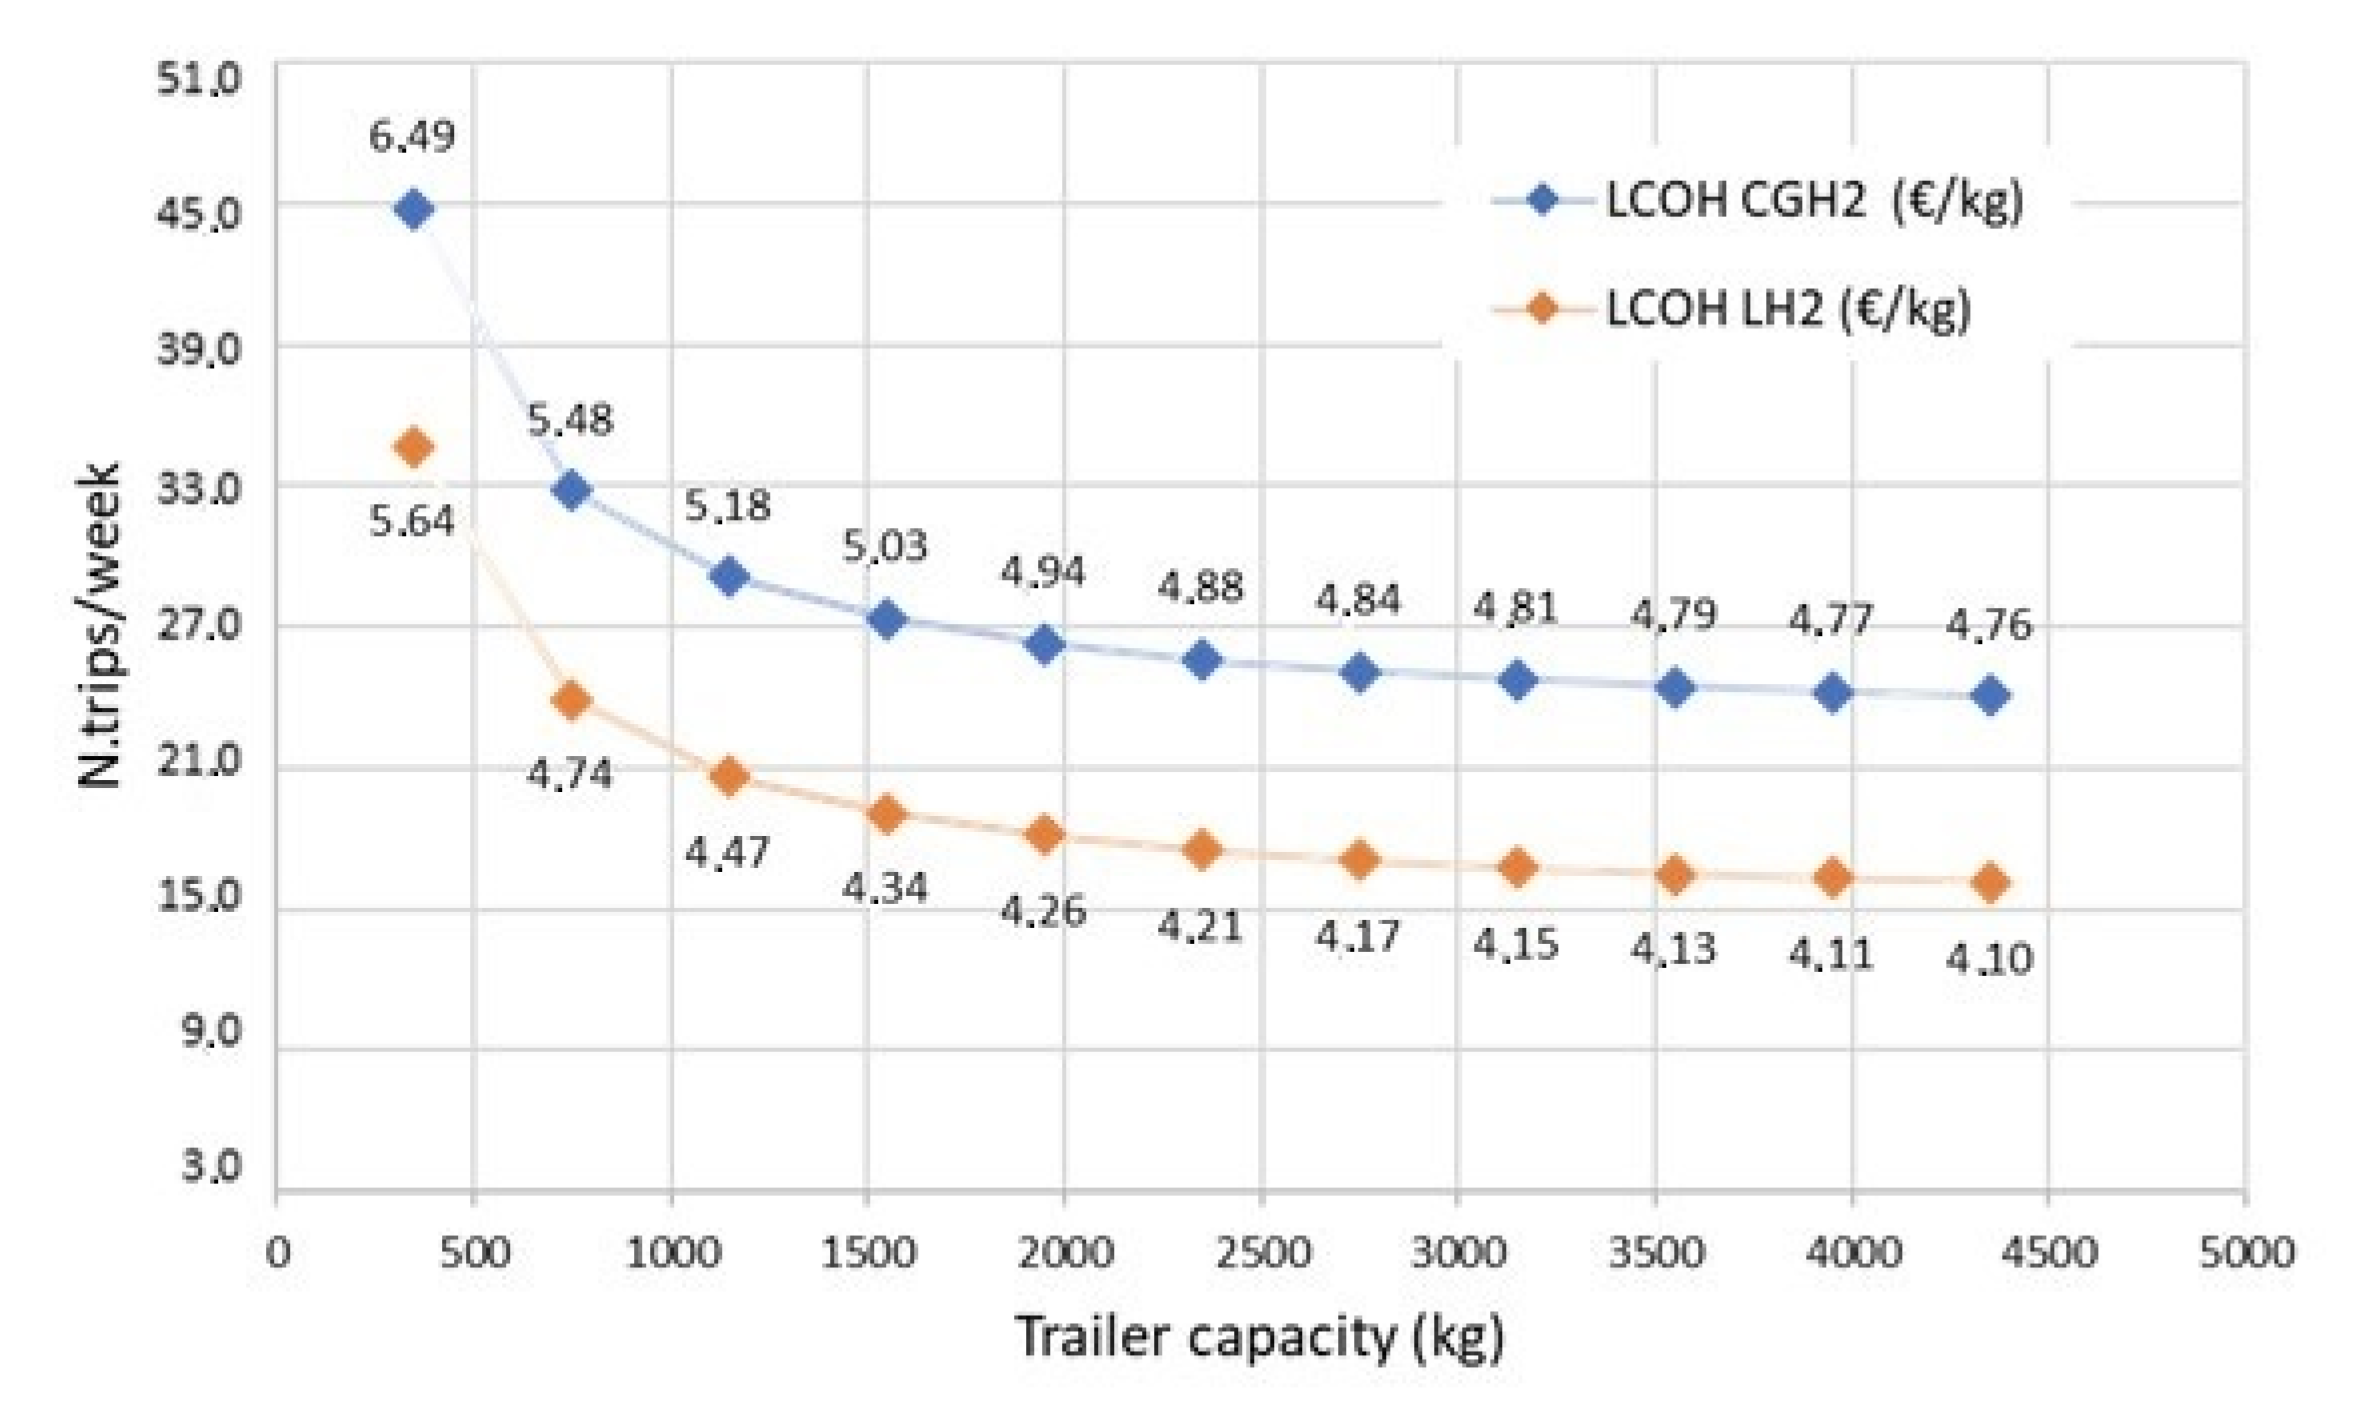
Figure 3 shows that, by utilizing high-capacity trailers, the number of weekly trips can be reduced from 36 to less than 5, entailing an approximately 30% decrease in the LCOH associated with the delivery. Furthermore, it can be seen that the cost reduction curve tends to flatten for greater capacities (less than 1% reduction every 700 kg transported for capacities greater than 2300 kgH2). As already mentioned, the liquid delivery case does not consider the costs associated with liquefaction, resulting in a lower LCOH than with compressed gas, in contrast to the general expectation. However, as already pointed out, liquid trailers can carry more hydrogen, thus reducing the number of trucks or trips required to supply the station.
Since the hydrogen delivery price represents the major contribution to the final LCOH, a further investigation of the impact of the delivery distance (km), varying between 180 and 500 km, and the retail hydrogen price (€/kg), ranging from 2.0 to 11.5 €/kg, on the compressed gas delivery was carried out (Table 7). The sensitivity analysis showed that shorter supply distances would be preferred to reduce the delivery price, affecting the LCOH with a maximum of 15%. However, the influence of the retail hydrogen price was found to be more significant, leading to an increase in the LCOH of up to 65% within the range analyzed.
To conclude, for an acceptable LCOH, the blue hydrogen retail price, which is the case under investigation, should be below 4 €/kg and the delivery distance should be less than 300 km. It must be noted that, for an H2 delivery price of 2 €/kg, as future forecasts suggest [69], greater transport distances could be implemented.
Finally, a sensitivity analysis for the on-site production, analyzing the effects of different HRS capacity sizes (kg/day) and electricity prices (€/MWh) on the LCOH, was performed (Table 8). The results show that the LCOH would be reduced by up to 35% when moving towards large-scale on-site systems that enable an economy of scale and take advantage of higher demand and improved technology. Therefore, green hydrogen production could be a competitive solution in these scenarios, especially if coupled with low electricity prices. Indeed, the electricity price is also a critical factor significantly influencing the final LCOH, causing an average 16% increase every 0.02 €/MWh.
6. Discussion
A comparison between the model results from the previous sections and those presented in a reference study that investigated the same HRS facilities but utilized smaller refuelling capacities makes it possible to clearly demonstrate the impact of dimension sizing on the overall costs.
Both CAPEX and OPEX specific costs (€/kg) show reductions, which are even more significant for on-site stations, mainly due to the limited tube-trailer payload assumed in the case scenario. The Rotterdam site, coupling the station infrastructure with the gas pipeline, presents a particularly cost-effective LCOH OPEX, intensified with greater fleet penetration. Both delivery-based HRSs and on-site HRSs are predominantly OPEX-driven, constituting more than 80% of the total costs and dominated by transport and electricity factors. In general, on-site production units in a large-scale scenario might be a better solution from the economic perspective, with a potential decrease in the LCOH to approximately 4 €/kg.
In order to reduce the influence of delivery on the overall costs, the frequency of supply should be reduced and, consequently, the utilization of higher-capacity trailers is suggested. Furthermore, travel distance plays an important role. The results demonstrate that road transport is no longer competitive for a distance of more than 300 km, and other solutions, such as pipeline transport, should be pursued. As repeatedly pointed out, the pathway towards low-cost green hydrogen requires improvements in technology efficiency, reliability, clear regulation, and low electricity price. Without strong and committed policy support, even in the presence of economies of scale and taking advantage of the already developed experience, the technology would not achieve cost parity with traditional technologies, and the EU 2 €/kg target for hydrogen refuelling [70] would likely not be reached.
7. Conclusions
The focus of this work was assessing the effects of large-scale systems and of increasing the fuel cell bus fleet to 100 vehicles on the levelized cost of hydrogen for both on-site and delivery hydrogen refueling stations. A previously developed component-oriented cost model applied to five European HRSs within the 3Emotion project was here updated and extended.
The results suggest that, due to the effects of greater utilization of the stations, as a consequence of higher demand and economies of scale, on the electrolyzer and the compressor capital expenditures, the LCOH would be reduced in the on-site facilities by almost 35%. In contrast, the LCOH in large and decentralized facilities is highly impacted by the retail hydrogen price and transport delivery distance. In particular, a sensitivity analysis of the LCOH, varying the number of trailers required to supply the demand, showed that, by utilizing high-capacity trailers transporting either liquid or compressed gas, the costs associated with delivery would be reduced by 30%. The advantages of liquid trailers, which can carry four times the payload compared to gaseous solutions, were also reaffirmed, thus decreasing the delivery price by one third due to the frequency of delivery. A further investigation of the impact of the delivery distance on compressed gas delivery demonstrates that shorter supply distances would be preferred to reduce the delivery price, but if a cap price of 2 €/kg is utilized, as future forecasts suggest, greater transport ranges can be covered with limited impact on the LCOH.
The electricity prices drive the operational costs associated with on-site production. Therefore, green hydrogen production could be a competitive solution for large-scale systems, especially if coupled with low electricity prices. Indeed, the electricity price is also a critical factor significantly influencing the final LCOH, causing an average 16% increase every 0.02 €/MWh. To conclude, this study shows that a large fleet with nearly 100% utilization would indeed lead to significant cost savings, with reductions being even more effective for on-site production plants coupled with renewable power generation that would make it possible to break away from dependency on electricity prices.
Author Contributions
Conceptualization, R.C.; methodology, R.C. and L.D.Z.; data curation, E.B.; writing—original draft preparation, R.C.; writing—review and editing, E.B. and L.D.Z.; supervision, L.D.Z. All authors have read and agreed to the published version of the manuscript.
Funding
This research received funding from the European FP7-JTI under grant agreement No 633174 3Emotion project.
Data Availability Statement
Not applicable.
Acknowledgments
The authors would like to thank all the partners of 3Emotion for suggestions and assistance.
Conflicts of Interest
The authors declare no conflict of interest.
References
- Göllei, A.; Görbe, P.; Magyar, A. Measurement Based Modeling and Simulation of Hydrogen Generation Cell in Complex Domestic Renewable Energy Systems. J. Clean. Prod. 2016, 111, 17–24. [Google Scholar] [CrossRef]
- González, E.L.; Llerena, F.I.; Pérez, M.S.; Iglesias, F.R.; Macho, J.G. Energy Evaluation of a Solar Hydrogen Storage Facility: Comparison with Other Electrical Energy Storage Technologies. Int. J. Hydrogen Energy 2015, 40, 5518–5525. [Google Scholar] [CrossRef]
- IRENA. Geopolitics of the Energy Transformation: The Hydrogen Factor; International Renewable Energy Agency: Abu Dhabi, United Arab Emirates, 2022. [Google Scholar]
- Acar, C.; Dincer, I. Review and Evaluation of Hydrogen Production Options for Better Environment. J. Clean. Prod. 2019, 218, 835–849. [Google Scholar] [CrossRef]
- Scott, M.; Powells, G. Towards a New Social Science Research Agenda for Hydrogen Transitions: Social Practices, Energy Justice, and Place Attachment. Energy Res. Soc. Sci. 2020, 61, 101346. [Google Scholar] [CrossRef]
- Sustainable Bus. Fuel Cell Bus Projects in the Spotlight: Fleets, Manufacturers, Trends. Available online: https://www.sustainable-bus.com/fuel-cell/fuel-cell-bus-hydrogen/ (accessed on 23 February 2021).
- Jean, B.; Chen, B. Joint Agency Staff Report on Assembly Bill 8: 2021 Assessment of Time and Cost Needed to Attain 100 Hydrogen Refueling Stations in California; California Energy Commission: Sacramento, CA, USA, 2021. [Google Scholar]
- Shukla, A.; Pekny, J.; Venkatasubramanian, V. An Optimization Framework for Cost Effective Design of Refueling Station Infrastructure for Alternative Fuel Vehicles. Comput Chem Eng. 2011, 35, 1431–1438. [Google Scholar] [CrossRef]
- Lin, R.H.; Ye, Z.Z.; Wu, B.D. A Review of Hydrogen Station Location Models. Int. J. Hydrogen Energy 2020, 45, 20176–20183. [Google Scholar] [CrossRef]
- Pagliaro, M.; Iulianelli, A.; Pagliaro, M.; Iulianelli, A. Hydrogen Refueling Stations: Safety and Sustainability. Gen. Chem. 2020, 6, 190029. [Google Scholar] [CrossRef]
- Vianello, C.; Carboni, M.; Mazzaro, M.; Mocellin, P.; Pilo, F.; Pio, G.; Russo, P.; Salzano, E. Hydrogen Refueling Stations: Prevention and Scenario Management. Large Scale Experimental Investigation of Hydrogen Jet-Fires. Chem. Eng. Trans. 2020, 82, 247–252. [Google Scholar] [CrossRef]
- Mayyas, A.; Mann, M. Manufacturing Competitiveness Analysis for Hydrogen Refueling Stations. Int. J. Hydrogen Energy 2019, 44, 9121–9142. [Google Scholar] [CrossRef]
- Tian, Z.; Lv, H.; Zhou, W.; Zhang, C.; He, P. Review on Equipment Configuration and Operation Process Optimization of Hydrogen Refueling Station. Int. J. Hydrogen Energy 2021, 47, 3033–3053. [Google Scholar] [CrossRef]
- Wulf, C.; Kaltschmitt, M. Life Cycle Assessment of Hydrogen Supply Chain with Special Attention on Hydrogen Refuelling Stations. Int. J. Hydrogen Energy 2012, 37, 16711–16721. [Google Scholar] [CrossRef]
- Tenhumberg, N.; Büker, K. Ecological and Economic Evaluation of Hydrogen Production by Different Water Electrolysis Technologies. Chem. Ing. Technol. 2020, 92, 1586–1595. [Google Scholar] [CrossRef]
- Nasir, M.; Jordehi, A.R.; Tostado-Véliz, M.; Tabar, V.S.; Amir Mansouri, S.; Jurado, F. Operation of Energy Hubs with Storage Systems, Solar, Wind and Biomass Units Connected to Demand Response Aggregators. Sustain. Cities Soc. 2022, 83, 103974. [Google Scholar] [CrossRef]
- Crespi, E.; Colbertaldo, P.; Guandalini, G.; Campanari, S. Energy Storage with Power-to-Power Systems Relying on Photovoltaic and Hydrogen: Modelling the Operation with Secondary Reserve Provision. J. Energy Storage 2022, 55, 105613. [Google Scholar] [CrossRef]
- Liu, H.; Alharthi, M.; Atil, A.; Zafar, M.W.; Khan, I. A Non-Linear Analysis of the Impacts of Natural Resources and Education on Environmental Quality: Green Energy and Its Role in the Future. Resour. Policy 2022, 79, 102940. [Google Scholar] [CrossRef]
- Azam, W.; Khan, I.; Ali, S.A. Alternative Energy and Natural Resources in Determining Environmental Sustainability: A Look at the Role of Government Final Consumption Expenditures in France. Environ. Sci. Pollut. Res. 2022, 4, 1–17. [Google Scholar] [CrossRef] [PubMed]
- Zakari, A.; Tawiah, V.; Khan, I.; Alvarado, R.; Li, G. Ensuring Sustainable Consumption and Production Pattern in Africa: Evidence from Green Energy Perspectives. Energy Policy 2022, 169, 113183. [Google Scholar] [CrossRef]
- Zahoor, Z.; Latif, M.I.; Khan, I.; Hou, F. Abundance of Natural Resources and Environmental Sustainability: The Roles of Manufacturing Value-Added, Urbanization, and Permanent Cropland. Environ. Sci. Pollut. Res. 2022, 1–14. [Google Scholar] [CrossRef]
- Zhang, Y.; Khan, I.; Zafar, M.W. Assessing Environmental Quality through Natural Resources, Energy Resources, and Tax Revenues. Environ. Sci. Pollut. Res. 2022, 1–16. [Google Scholar] [CrossRef]
- IRENA. Green Hydrogen Cost Reduction; Scaling up Electrolyzers to Meet the 1.5 C Climate Goal; International Renewable Energy Agency: Abu Dhabi, United Arab Emirates, 2020. [Google Scholar]
- Yates, J.; Daiyan, R.; Patterson, R.; Egan, R.; Amal, R.; Ho-Baille, A.; Chang, N.L. Techno-Economic Analysis of Hydrogen Electrolysis from Off-Grid Stand-Alone Photovoltaics Incorporating Uncertainty Analysis. Cell Rep. Phys. Sci. 2020, 1, 100209. [Google Scholar] [CrossRef]
- Tang, O.; Rehme, J.; Cerin, P. Levelized Cost of Hydrogen for Refueling Stations with Solar P.V. and Wind in Sweden: On-Grid or off-Grid? Energy 2022, 241, 122906. [Google Scholar] [CrossRef]
- Viktorsson, L.; Heinonen, J.T.; Skulason, J.B.; Unnthorsson, R. A Step towards the Hydrogen Economy—A Life Cycle Cost Analysis of a Hydrogen Refueling Station. Energies 2017, 10, 763. [Google Scholar] [CrossRef]
- Monforti Ferrario, A.; Rajabi Hamedani, S.; del Zotto, L.; Santori Simone, G.; Bocci, E. Techno-Economic Analysis of in-Situ Production by Electrolysis, Biomass Gasification and Delivery Systems for Hydrogen Refuelling Stations: Rome Case Study. In Energy Procedia; Elsevier: Amsterdam, The Netherlands, 2018; Volume 148, pp. 82–89. [Google Scholar] [CrossRef]
- ICCT. Cost of Renewable Hydrogen Produced Onsite at Hydrogen Refueling Stations in Europe; International Council on Clean Transportation: Washington, DC, USA, 2022. [Google Scholar]
- Minutillo, M.; Perna, A.; Forcina, A.; di Micco, S.; Jannelli, E. Analyzing the Levelized Cost of Hydrogen in Refueling Stations with On-Site Hydrogen Production via Water Electrolysis in the Italian Scenario. Int. J. Hydrogen Energy 2021, 46, 13667–13677. [Google Scholar] [CrossRef]
- Caponi, R.; Monforti Ferrario, A.; del Zotto, L.; Bocci, E. Hydrogen Refueling Station Cost Model Applied to Five Real Case Studies for Fuel Cell Buses. E3S Web Conf. 2021, 312, 07010. [Google Scholar] [CrossRef]
- Gim, B.; Yoon, W.L. Analysis of the Economy of Scale and Estimation of the Future Hydrogen Production Costs at On-Site Hydrogen Refueling Stations in Korea. Int. J. Hydrogen Energy 2012, 37, 19138–19145. [Google Scholar] [CrossRef]
- Reddi, K.; Elgowainy, A.; Rustagi, N.; Gupta, E. Impact of Hydrogen Refueling Configurations and Market Parameters on the Refueling Cost of Hydrogen. Int. J. Hydrogen Energy 2017, 42, 21855–21865. [Google Scholar] [CrossRef]
- Weidner, S.; Faltenbacher, M.; François, I.; Thomas, D.; Skùlason, J.B.; Maggi, C. Feasibility Study of Large Scale Hydrogen Power-to-Gas Applications and Cost of the Systems Evolving with Scaling up in Germany, Belgium and Iceland. Int. J. Hydrogen Energy 2018, 43, 15625–15638. [Google Scholar] [CrossRef]
- Liu, B.; Liu, S.; Guo, S.; Zhang, S. Economic Study of a Large-Scale Renewable Hydrogen Application Utilizing Surplus Renewable Energy and Natural Gas Pipeline Transportation in China. Int. J. Hydrogen Energy 2020, 45, 1385–1398. [Google Scholar] [CrossRef]
- Arora, A.; Zantye, M.S.; Hasan, M.M.F. Sustainable Hydrogen Manufacturing via Renewable-Integrated Intensified Process for Refueling Stations. App. Energy 2022, 311, 118667. [Google Scholar] [CrossRef]
- Greene, D.L.; Ogden, J.M.; Lin, Z. Challenges in the Designing, Planning and Deployment of Hydrogen Refueling Infrastructure for Fuel Cell Electric Vehicles. eTransportation 2020, 6, 100086. [Google Scholar] [CrossRef]
- CHIC. Clean Hydrogen in European Cities. Available online: https://chicproject.eu/it/progetto-chic/ (accessed on 5 October 2022).
- 3Emotion 3Emotion|Environmentally Friendly, Efficient, Electric Motion. Available online: https://3emotion.eu/ (accessed on 5 October 2022).
- JIVE. Joint Initiative for Hydrogen Vehicles across Europe. Available online: https://www.fuelcellbuses.eu/projects/jive (accessed on 4 July 2022).
- Hancke, R.; Holm, T.; Ulleberg, Ø. The Case for High-Pressure PEM Water Electrolysis. Energy Convers. Manag. 2022, 261, 115642. [Google Scholar] [CrossRef]
- Sustainable Bus. Pau (France) Welcomes the Launch of the World’s First Hydrogen BRT. Available online: https://www.sustainable-bus.com/news/pau-welcomes-the-launch-of-the-worlds-first-hydrogen-brt/ (accessed on 8 July 2022).
- Green Hydrogen Systems. GHS Helps Danish City Put Hydrogen Buses in Service. Available online: https://greenhydrogensystems.com/GHS/ghs-helps-danish-city-put-hydrogen-busses-in-service/ (accessed on 8 July 2022).
- Apostolou, D.; Xydis, G. A Literature Review on Hydrogen Refuelling Stations and Infrastructure. Current Status and Future Prospects. Renew. Sustain. Energy Rev. 2019, 113, 109292. [Google Scholar] [CrossRef]
- Qin, N.; Brooker, P.; Srinivasan, S.; Dunn, M.D. Hydrogen Fueling Stations Infrastructure; Florida Solar Energy Center: Cocoa, FL, USA, 2014. [Google Scholar]
- HyResponder. Lecture 12 Hydrogen Refuelling Stations & Infrastructure; HyResponder: Coleraine, UK, 2021. [Google Scholar]
- Wang, A.; van der Leun, K.; Peters, D.; Buseman, M. European Hydrogen Backbone: How a Dedicated Hydrogen Infrastructure Can Be Created. Pipeline & Gas Journal, 17 July 2020. [Google Scholar]
- Reuß, M.; Grube, T.; Robinius, M.; Preuster, P.; Wasserscheid, P.; Stolten, D. Seasonal Storage and Alternative Carriers: A Flexible Hydrogen Supply Chain Model. App. Energy 2017, 200, 290–302. [Google Scholar] [CrossRef]
- Hecht, E.S.; Pratt, J. Comparison of Conventional vs. Modular Hydrogen Refueling Stations, and On-Site Production vs. Delivery; Sandia National Laboratories: Albuquerque, NM, USA, 2017. [Google Scholar]
- Ministero dei Trasporti. Costo Chilometrico Medio Relativo al Consumo Di Gasolio Delle Imprese Di Autotrasporto per Conto Terzi. Available online: https://www.mit.gov.it/mit/mop_all.php.2009 (accessed on 8 July 2022).
- IEA-ETSAP. Hydrogen Production & Distribution; International Energy Agency: Paris, France, 2014. [Google Scholar]
- Koleva, M.; Rustagi, N. Hydrogen Delivery and Dispensing Cost; DOE Hydrogen and Fuel Cells Program Record; DOE: Washington, DC, USA, 2020.
- Perna, A.; Minutillo, M.; di Micco, S.; Jannelli, E. Design and Costs Analysis of Hydrogen Refuelling Stations Based on Different Hydrogen Sources and Plant Configurations. Energies 2022, 15, 541. [Google Scholar] [CrossRef]
- Gallardo, F.I.; Monforti Ferrario, A.; Lamagna, M.; Bocci, E.; Astiaso Garcia, D.; Baeza-Jeria, T.E. A Techno-Economic Analysis of Solar Hydrogen Production by Electrolysis in the North of Chile and the Case of Exportation from Atacama Desert to Japan. Int. J. Hydrogen Energy 2021, 46, 13709–13728. [Google Scholar] [CrossRef]
- Matute, G.; Yusta, J.M.; Correas, L.C. Techno-Economic Modelling of Water Electrolysers in the Range of Several M.W. to Provide Grid Services While Generating Hydrogen for Different Applications: A Case Study in Spain Applied to Mobility with FCEVs. Int. J. Hydrogen Energy 2019, 44, 17431–17442. [Google Scholar] [CrossRef]
- FCHJU. Development of Water Electrolysis in the European Union; FCHJU: Brussels, Belgium, 2014. [Google Scholar]
- Alves Bruna. Average Monthly Electricity Wholesale Price in Denmark from January 2019 to May 2022. Available online: https://0-www-statista-com.brum.beds.ac.uk/statistics/1271525/denmark-monthly-wholesale-electricity-price/ (accessed on 14 July 2022).
- Alves Bruna. Average Monthly Electricity Wholesale Price in France from January 2019 to May 2022. Available online: https://0-www-statista-com.brum.beds.ac.uk/statistics/1267546/france-monthly-wholesale-electricity-price/ (accessed on 14 July 2022).
- Tiseo Ian. Prices of Tap Water in Selected Cities in Europe in 2021. Available online: https://0-www-statista-com.brum.beds.ac.uk/statistics/1232847/tap-water-prices-in-selected-european-cities/ (accessed on 14 July 2022).
- NEA Group. Compression for Hydrogen Filling Stations. Available online: https://www.neuman-esser.de//en/company/media/blog/compression-for-hydrogen-filling-stations/ (accessed on 15 July 2022).
- Smith, R. Chemical Process. Design and Integration, 1st ed.; John Wiley & Sons: Hoboken, NJ, USA, 2005. [Google Scholar]
- Rothuizen, E.; Rokni, M. Optimization of the Overall Energy Consumption in Cascade Fueling Stations for Hydrogen Vehicles. Int. J. Hydrogen Energy 2014, 39, 582–592. [Google Scholar] [CrossRef]
- Farzaneh-Gord, M.; Deymi-Dashtebayaz, M.; Rahbari, H.R.; Niazmand, H. Effects of Storage Types and Conditions on Compressed Hydrogen Fuelling Stations Performance. Int. J. Hydrogen Energy 2012, 37, 3500–3509. [Google Scholar] [CrossRef]
- Caponi, R.; Ferrario, A.M.; Bocci, E.; Bødker, S.; del Zotto, L. Single-Tank Storage versus Multi-Tank Cascade System in Hydrogen Refueling Stations for Fuel Cell Buses. Int. J. Hydrogen Energy 2022, 47, 27633–27645. [Google Scholar] [CrossRef]
- Weinert, J.X.; Lipman, T.E. An Assessment of the Near-Term Costs of Hydrogen Refueling Stations and Station Components; UC Davis Institute of Transportation Studies: Davis, CA, USA, 2006. [Google Scholar]
- Fan, J.L.; Yu, P.; Li, K.; Xu, M.; Zhang, X. A Levelized Cost of Hydrogen (LCOH) Comparison of Coal-to-Hydrogen with CCS and Water Electrolysis Powered by Renewable Energy in China. Energy 2022, 242, 123003. [Google Scholar] [CrossRef]
- Correa, G.; Volpe, F.; Marocco, P.; Muñoz, P.; Falagüerra, T.; Santarelli, M. Evaluation of Levelized Cost of Hydrogen Produced by Wind Electrolysis: Argentine and Italian Production Scenarios. J. Energy Storage 2022, 52, 105014. [Google Scholar] [CrossRef]
- Yang, C.; Ogden, J. Determining the Lowest-Cost Hydrogen Delivery Mode. Int. J. Hydrogen Energy 2007, 32, 268–286. [Google Scholar] [CrossRef] [Green Version]
- IEA. Global Hydrogen Review 2021; International Energy Agency: Paris, France, 2021. [Google Scholar]
- Powell Drew. Focus on Blue Hydrogen; Gaffney Cline: Houston, TX, USA, 2020. [Google Scholar]
- European Commission. A Hydrogen Strategy for a Climate-Neutral Europe; European Commission: Brussels, Belgium, 2020. [Google Scholar]
Figure 1.
HRS cost model system boundaries Reprinted with permission from Ref. [30]. Caponi, E3S Web of Conferences, 2021.
Figure 1.
HRS cost model system boundaries Reprinted with permission from Ref. [30]. Caponi, E3S Web of Conferences, 2021.

Figure 2.
(a) London HRS cost breakdown; (b) Rotterdam HRS cost breakdown; (c) Versailles HRS cost breakdown; (d) Aalborg HRS cost breakdown; (e) Pau HRS cost breakdown.
Figure 2.
(a) London HRS cost breakdown; (b) Rotterdam HRS cost breakdown; (c) Versailles HRS cost breakdown; (d) Aalborg HRS cost breakdown; (e) Pau HRS cost breakdown.


Figure 3.
LCOH sensitivity analysis for the delivery of hydrogen, varying the trailer capacity (kg) and the number of trips required to supply the demand (trips/week).
Figure 3.
LCOH sensitivity analysis for the delivery of hydrogen, varying the trailer capacity (kg) and the number of trips required to supply the demand (trips/week).


Table 1.
Summary of the technical characteristics of the 3Emotion HRSs.
| Hydrogen Source | Nominal Capacity | Storage Specs | Dispenser Pressure | Fleet Size | |
|---|---|---|---|---|---|
| London | Delivery trailer 450 kg/trailer @350 bar | 400 kg/day ≈300 km | 900 kg @350 bar 350 kg @500 bar | 350 bar | 10 |
| Rhoon RET Rhoon PZH | Delivery pipeline @30 bar | 200 kg/day ≈100 km | 90 kg @495 bar 65 kg @877 bar 95 kg @495 bar | 350 bar | 2 4 |
| Versailles SAVAC Versailles BEGreen | Delivery trailer 350 kg/trailer @200 bar | 200 kg/day ≈200 km | 350 kg @200 bar 100 kg @495 bar 60 kg @877 bar | 350/700 bar | 2 5 |
| Pau SMTU | On-site PEM electrolysis | 174 kg/day | 230 kg @20 bar 630 kg @600 bar | 350 bar | 8 |
| Aalborg | On-site PEM electrolysis | 100 kg/day | 10 kg @35 bar 114 kg @300 bar 118 kg @450 bar | 350 bar | 3 |
Table 2.
Data used as the basis for the scale-up model.
| London | Rotterdam | Versailles | Pau | Aalborg | |
|---|---|---|---|---|---|
| Daily travelled distance per bus (km) | 180 | 250 | 200 | 240 | 180 |
| Average H2 consumption (kg/100 km) | 12 | 9.5 | 8.6 | 8.6 | 8 |
| Average mass dispensed (kg) | 16 | 27.78 | 24.55 | 27.21 | 23.75 |
| Average refueling time (min) | 9.4 | 23.1 | 24.1 | 27.2 | 20 |
Table 3.
Data used for the evaluation of the delivery costs.
| London | Versailles | Rotterdam | |
|---|---|---|---|
| Average mileage (km) | 300 | 200 | 100 |
| Delivered quantity (kg) | 450 | 350 | Upon request |
| Delivery pressure (bar) | 350 | 200 | 30 |
| Number of vehicles (trip/week) | 36 | 37 | - |
| Lease price (€/month) | 2150 | - | |
| Delivery price (€/km) | 0.423 | - | |
| H2 retail price (€/kg) | 4.00 | 5.50 | 4.00 |
| Civil works (€) | - | 110,000 | - |
Table 4.
Data used for the evaluation of the production costs.
| Pau | Aalborg | |
|---|---|---|
| HHV-based system efficiency (%) | 78.6 | |
| Specific energy consumption (kWh/Nm3) | 4.5 | |
| Output pressure (bar) | 20 | |
| Water consumption (l/kgH2 produced) | 28.4 | |
| Auxiliary consumption (kWh/Nm3) | 5% SEC | |
| Electricity price—average for year 2020 (€/kWh) | 0.036 | 0.035 |
| Water price (€/m3) | 2.6 | 5.3 |
| O&M OPEX (€) | 5% CAPEX | |
| CAPEX (€/kg) | C = Cbase(Sbase/S)0.45 | |
Table 5.
HRS parameters considered for dispenser numbers.
| London | Rotterdam | Versailles | Pau | Aalborg | |
|---|---|---|---|---|---|
| Max no. of FCBs refueling in 1 h | 6.67 | 5.67 | 9 | 11.17 | 5.17 |
| Lingering time | 10 | 10 | 10 | 10 | 10 |
| Total time of refill operation | 19.41 | 30.89 | 27.80 | 31.79 | 22.77 |
| Max no. of FCBs per dispenser | 3.09 | 1.94 | 2.16 | 1.89 | 2.63 |
| No. of dispensers | 3 | 3 | 5 | 6 | 2 |
Table 6.
Cost model results in terms of CAPEX, OPEX, and LCOH for all the HRSs.
| CAPEX (k€) | OPEX (k€/year) | LCOH, CAPEX (€/kg) | LCOH, OPEX (€/kg) | LCOH, Total (€/kg) | |
|---|---|---|---|---|---|
| London | 6112 | 4775 | 0.76 | 5.75 | 6.51 |
| Rotterdam | 7584 | 4303 | 0.86 | 4.72 | 5.57 |
| Versailles | 6645 | 4066 | 1.04 | 6.15 | 7.19 |
| Aalborg | 6232 | 1478 | 1.16 | 2.67 | 3.83 |
| Pau | 10,904 | 2418 | 1.42 | 3.05 | 4.47 |
Table 7.
LCOH sensitivity analysis for blue hydrogen delivery, varying the travel distance (km) and the H2 retail price (€/kg). In green the lowest cost solutions, in red the highest.
Table 7.
LCOH sensitivity analysis for blue hydrogen delivery, varying the travel distance (km) and the H2 retail price (€/kg). In green the lowest cost solutions, in red the highest.
| Delivery Distance (km) | ||||||||
|---|---|---|---|---|---|---|---|---|
| H2 retail price (€/kg) | 180 | 220 | 260 | 300 | 340 | 380 | 500 | |
| 2.0 | 5.19 € | 5.28 € | 5.38 € | 5.47 € | 5.56 € | 5.65 € | 5.93 € | |
| 3.5 | 6.68 € | 6.77 € | 6.86 € | 6.95 € | 7.05 € | 7.14 € | 7.42 € | |
| 4.0 | 6.76 € | 7.26 € | 7.36 € | 7.45 € | 7.54 € | 7.63 € | 7.91 € | |
| 5.5 | 8.66 € | 8.75 € | 8.84 € | 8.93 € | 9.03 € | 9.12 € | 9.40 € | |
| 7.5 | 10.64 € | 10.73 € | 10.82 € | 10.91 € | 11.01 € | 11.10 € | 11.38 € | |
| 9.5 | 12.62 € | 12.71 € | 12.80 € | 12.89 € | 12.99 € | 13.08 € | 13.36 € | |
| 11.5 | 14.60 € | 14.69 € | 14.78 € | 14.87 € | 14.97 € | 15.06 € | 15.34 € | |
Table 8.
LCOH sensitivity analysis for on-site production, varying the HRS capacity (kg/day) and the electricity price (€/MWh). In green the lowest cost solutions, in red the highest.
Table 8.
LCOH sensitivity analysis for on-site production, varying the HRS capacity (kg/day) and the electricity price (€/MWh). In green the lowest cost solutions, in red the highest.
| HRS Capacity (kg/Day) | ||||||||
|---|---|---|---|---|---|---|---|---|
| Electricity price (€/Mwh) | 100 | 300 | 500 | 900 | 1300 | 1700 | 2100 | |
| 30 | 6.30 € | 4.92 € | 4.63 € | 4.35 € | 4.21 € | 4.13 € | 4.07 € | |
| 50 | 7.22 € | 6.29 € | 5.99 € | 5.72 € | 5.58 € | 5.50 € | 5.43 € | |
| 70 | 8.58 € | 7.65 € | 7.36 € | 7.09 € | 6.95 € | 6.68 € | 6.80 € | |
| 90 | 9.95 € | 9.02 € | 8.73 € | 8.46 € | 8.32 € | 8.23 € | 8.17 € | |
| 110 | 11.32 € | 10.39 € | 10.10 € | 9.83 € | 9.69 € | 9.60 € | 9.54 € | |
| 130 | 12.69 € | 11.76 € | 11.47 € | 11.19 € | 11.05 € | 10.97 € | 10.91 € | |
Publisher’s Note: MDPI stays neutral with regard to jurisdictional claims in published maps and institutional affiliations. |
© 2022 by the authors. Licensee MDPI, Basel, Switzerland. This article is an open access article distributed under the terms and conditions of the Creative Commons Attribution (CC BY) license (https://creativecommons.org/licenses/by/4.0/).
Share and Cite
MDPI and ACS Style
Caponi, R.; Bocci, E.; Del Zotto, L. Techno-Economic Model for Scaling Up of Hydrogen Refueling Stations. Energies 2022, 15, 7518. https://0-doi-org.brum.beds.ac.uk/10.3390/en15207518
AMA Style
Caponi R, Bocci E, Del Zotto L. Techno-Economic Model for Scaling Up of Hydrogen Refueling Stations. Energies. 2022; 15(20):7518. https://0-doi-org.brum.beds.ac.uk/10.3390/en15207518
Chicago/Turabian StyleCaponi, Roberta, Enrico Bocci, and Luca Del Zotto. 2022. "Techno-Economic Model for Scaling Up of Hydrogen Refueling Stations" Energies 15, no. 20: 7518. https://0-doi-org.brum.beds.ac.uk/10.3390/en15207518
Note that from the first issue of 2016, this journal uses article numbers instead of page numbers. See further details here.