
Fundamental Directions of the Development of the Smart Cities Concept and Solutions in Poland

1
Faculty of Management and Logistics, Poznan School of Logistics, 60-755 Poznan, Poland
2
Faculty of Engineering Management, Poznan University of Technology, 60-965 Poznan, Poland
*
Authors to whom correspondence should be addressed.
Energies 2022, 15(21), 8213; https://0-doi-org.brum.beds.ac.uk/10.3390/en15218213
Submission received: 28 September 2022
/
Revised: 28 October 2022
/
Accepted: 1 November 2022
/
Published: 3 November 2022
(This article belongs to the Special Issue Transition to Sustainable and Integrated Energy Systems for Smart Cities and Industries)
Abstract
:As city areas have been experiencing dynamic growth, the efficient development of cities is becoming a priority for technologically advanced countries and for states further down on the list from the global leaders. Smart cities are friendly for both people and the environment, in which life is better, safer, and healthier, the results of a creative approach to developing and implementing various innovations. Boasting sustainable and modern infrastructure and management, ecological city centres are perceived as key foundations of the future. Still, developing cities towards being “smart” is a serious challenge, not just for self-government and government administrators, but also for entities offering technical and technological solutions used for the purpose of implementing the improvements. The research objective was an attempt to indicate the expected changes in the shaping of the idea of smart cities in Poland. The authors’ own research was conducted from 2 August to 31 August. The method of focus group interviews with experts, specialists in the field of smart city, was used. Twenty-three practitioners participated in the study. The geographic area of the analysis covered the territory of the Republic of Poland. The time perspective of the study concerned the end of the current decade. The research process consisted of three stages: (1) preparation, the analysis of the literature on the subject (in which the variables selected for the study were identified); (2) the implementation of focus interviews; and (3) the analysis of the research results. In the last stage of the study, the statistical analysis and qualitative approach to responses were also used (by creating clusters). A network of relations, spanning a total of 3034 connections, was developed from the responses of experts on the fundamental development directions, beneficial factors, and adverse factors. On the basis of the research results, a SWOT analysis was prepared, containing the key beneficial factors, adverse factors, benefits, and disadvantages of smart city development. It was shown, on the basis of the conducted research, that the key development directions for smart cities in Poland by 2030 are: smart and sustainable buildings and infrastructure, smart mobility, and smart energy. The developed results of the analyses constitute an added value and can be used particularly in planning investments in intelligent solutions (identification of barriers and key development factors).
1. Introduction
The modern world is seeing the dynamic rise in the importance of cities as the main centres of life, where increasingly larger portions of the society live. It is estimated that the global city-living population is 3.5 billion and keeps growing. According to the forecast by the United Nations, around 60% of the world’s population will be living in cities in 2030 [1].
Together with a significant rise in the number of people globally, technological advances have brought about highly dynamic changes as to how societies function. The main sites of interaction of these two, fundamental factors are the quickly changing cities and their characteristics [2,3,4].
It should be noted, however, that cities evolve and adapt to their inhabitants’ changing needs, which often turn them into centres of innovation that support the development of countries [4]. The demographic growth and dynamic urbanisation, reinforced with globalisation processes and the unprecedented movement of people, capital, and information, pit cities against completely new challenges and require them to use new concepts of functioning, technologies, technical solutions, and development strategies [5].
The studies on the changes in the spatial and economic structure of cities point more and more to new development factors comprising, among others, advanced technologies that save time and energy, along with human capital and social capita, all immeasurably important in the development of cities. A modern city is not just its physical structure anymore, but also a massive network of cyber-links striving to optimise the city’s resources and the processes of preventing negative external effects resulting from the city’s functioning, in accordance with the principle of sustainable development [6].
The strategic role of cities in social and economic development and environmental issues of modern economies implies the necessity to undertake discussions and research on the vision and directions of urban development, not only in relation to the implementation of a new generation of information and communication technologies (supporting service inhabitants), but also in the context of generating and implementing ecological innovations (leading to a reduction in carbon dioxide emissions or the efficient use of resources energy) and modern social solutions. A response to contemporary problems (related to the achievement of the sustainable development) and the postulated direction of the development of modern city goals that is more and more popular both in Polish [7] and in the foreign [8] literature, is the concept of smart cities. The article is part of the discussions and scientific research relating to the fundamental directions of smart city development in Poland as well as the most important factors that imply planning and implementing intelligent solutions. It should be noted that a wide range of factors of a social, economic, administrative, environmental, and technological nature will be considered.
Smart cities use information and communication technologies. It should be noted that currently, technological solutions are often related to the legal aspects of user safety, confidentiality, and personal data protection. Local legal requirements for operating in the new technology sector encourage investment. Predictability, the standardisation of regulations with EU directives and regulations will allow for the planning of long-term technological investments in Poland [9] to ensure long-term economic growth, the efficient management of resources, and improved quality of life for their inhabitants. A smart city can use its advanced infrastructure to support local businesses, the environment, transport and mobility, health care, lifestyle, and management. The adoption of smart city solutions is driven by the rise in urbanisation trends all over the world and the desire to achieve a better quality of life. The key assumption behind smart cities is the creation of economic growth and the improvement in the quality of life by supporting the development of local areas and using technologies that lead to smart outcomes [2,3,4,5,6,7].
- The research objective was an attempt to indicate the expected changes in the shaping of the idea of smart cities in Poland. It should be noted that the authors perceive the development of the concept as well as the solutions relating to smart city as a composition consisting of relationships between the fundamental development directions, beneficial factors, and adverse factors. Therefore, the questionnaire for the focus interview included these three categories of variables, the importance of which was assessed by experts.
The studies conducted as a part of the article (in particular based on an focus interview with experts and network analysis) allowed us to achieve the research objective. At the same time, the conducted studies served to show that the crucial development directions for smart cities in Poland, by 2030, are smart and sustainable buildings and infrastructure, smart mobility, and smart energy. The Pajek program was used to analyse the research material and visualise the results. Statistical analysis and a qualitative approach to responses were also used (by creating clusters). The article comprises six parts: the preface, the review of related literature (divided into subsections: scope of smart city, analysis of the market of smart city solutions and technologies, Polish smart cities against the background of global leaders, smart city technologies, and solution and development directions, beneficial factors, and adverse factors); materials and methods, (in which the objectives, problems, methods and research procedure are described); the analysis of results (contains test results and their interpretation); the discussion of the results (which includes comparisons and references to research by other authors); and the summary (a summary of the most important conclusions as well as the limitations and further research.
2. Literature Review
2.1. The Notion and Scope of Smart City
The contemporary, urbanised municipal areas never stop striving to ensure cohesion between social, economic, and environmental phenomena. The continuous improvement in processes and raising mobility via a sharing economy are priority issues in the age of universally growing urbanisation. The cities of the future must adapt to the changing environmental conditions to be able to rapidly react to climate changes, population sizes, the growing globalisation of economy and demographics, the development of technology, geopolitical dangers and changes, human mobility (including migration), the ageing of the population, conflicts, and social inequalities [10,11,12,13,14,15,16,17,18]. In their efforts to care for urbanised municipal areas and their users, municipal authorities are increasingly more often implementing the concept of a smart city. This concept is now becoming part of a strategic plan for numerous agglomeration in Poland, Europe, and worldwide [19].
The concept of a smart city is relatively new and arose as a result of an evolutionary process [20]. It should be noted that the concept of a smart city began to appear over time in various perspectives as a way to define urban technological changes. The first mention of this type appeared in 1997 as a virtual city and referred to the description of local ICT network initiatives that enabled the development of local cybernetic (virtual) communities [21]. Virtual cities relied on the World Wide Web (WWW) and acted as electronic counterparts of the real, material urban areas covered [20], which led to the digital city, that is, having an infrastructure for creating virtual communities [22].
In 2000, the smart city concept was defined as a city that monitors and integrates the conditions of its entire critical infrastructure including roads, bridges, tunnels, railway lines, subways, airports, seaports, communication, sanitary installations, energy, and even buildings for resource optimisation, preventive maintenance operation planning, and monitoring the safety aspect while maximising the quality of service for its citizens [23]. A decade later, it was pointed out that it was a city combining physical infrastructure, IT infrastructure, social infrastructure, and business infrastructure in order to use the city’s collective intelligence [24]. As much as understanding a smart city as an aggregate of initiatives aimed at improving the efficiency of the functioning of urban centres through the use of data, information and information technologies (IT) to provide citizens with more efficient services, monitoring and optimisation, thus increasing cooperation between various economic entities and encouraging the implementation of innovative business models in both the private and public sectors [25].
Thus, one can indicate the evolution from a virtual city (in which an ICT network was created), the concept of which was quoted in the literature after the end of the 1990s [26], through the implementation of ICT at the level of entire metrology [27], for intelligent energy consumption, transport, and building management [5]. Then, the concept of the city’s “smart footprint” was introduced, which is measured by means of indicators of the capacity (related to society, economy, mobility, governance) for large-scale testing of innovation—the city as a living laboratory [20]. In the latest approaches, the focus was on improving the quality of the everyday life of the inhabitants, sustainable development, the environment, mobility, and green zones [28]. Going with the definition by the Massachusetts Institute of Technology, a smart city is the new intelligence [that] resides in the increasingly effective combination of digital telecommunication networks (the nerves), ubiquitously embedded intelligence (the brains) sensors and tags (the sensory organs), and software (the knowledge and cognitive competence) [29].
The lack of a homogeneous or broadly accepted definition is obvious [30,31]. Publications addressing the topic of smart cities present a variety of terms related to this idea such as a digital city [32], a wired city [33], an information city [34,35,36], a ubiquitous city [37], and a sensing city [38]. When defining a smart city, most researchers have underscored the role of advanced technologies where the key elements of infrastructure and municipal services are becoming intelligent, better integrated and more effective [37,39,40].
According to A. Caragliu [12], a city becomes intelligent when it invests in human and social capital, and where traditional and modern information and communication technologies support lasting economic growth and a high quality of life. S. Mohanty, on the other hand, considers a smart city to be a place where traditional networks and services are made more flexible, efficient, and sustainable. They are based on the use of information and digital and telecommunication technologies to improve its operations for the benefit of its inhabitants. Consequently, they become greener, safer, faster, and friendlier [41].
N. Komninos [42] defined a smart city as an area (a commune, a district, a cluster, a city), consisting of four, main elements:
- A creative population engaged in intensive activities using their knowledge or a cluster of such activities;
- Effectively prospering institutions with their own procedures with regard to creating knowledge, facilitating its acquisition, adaptation, and continued development;
- A well-developed broadband infrastructure, digital spaces, e-services, and on-line tools for knowledge management;
- A documented ability to innovate, manage, and solve unprecedented problems because innovativeness and managing in uncertain conditions are crucial for evaluating intelligence.
One of the broader definitions of a smart city was proposed by the authors of a report titled Mapping Smart Cities in the EU [43]. Following this approach, a smart city is a city seeking to address public issues via ICT-based solutions on the basis of a multi-stakeholder, municipally based partnership. ICT serves to connect various municipal systems and stimulate innovations that facilitate the completion of municipal policy goals.
Using this class of solutions while securing social issues such as prosperity, cultural offerings, or life expectancy requires the adoption of a new, holistic city governance model where bottom–up governance works in accord with top–down governance, allowing the participation of multiple stakeholders (city users such as inhabitants, businesses, NGOs). The idea behind a smart city is to create and use relations and connections between human and social capital and ICT to generate the city’s sustainable growth and to improve the quality of life of its inhabitants [2,10,29,44,45,46,47,48,49,50,51,52,53,54,55,56,57].
- A competitive economy (smart economy), namely a highly efficient and technologically advanced economy due to the use of ICT; where new products and services are developed, along with new business models; one that fosters establishing local and global connections and the international exchange of goods, services and knowledge;
- Smart transport networks (smart mobility) (i.e., integrated transport and logistics systems that mostly consume clean energy);
- Sustainable use of resources (smart environment); a smart city manages its natural resources frugally; aims to increase the use of renewables; controls power and water networks, street lighting, and other public amenities in a manner allowing for the optimisation of environmental and financial costs of their operation; measures, controls, and monitors pollution on an ongoing basis; renovates buildings to reduce their power needs;
- A high quality social capital (smart people), whose creation is possible in a diverse, tolerant, creative, and engaged society;
- A high quality of life (smart living) translating into a safe and healthy life in a city with rich cultural and housing possibilities, with unobstructed access to ICT infrastructure that enables the creation of lifestyles, behaviours, and consumption;
- Intelligent public governance (smart governance), where social participation in making decisions, also of a strategic nature, plays an important role in the transparency of actions, quality, and availability of public services; intelligent public governance facilitates the organisation and integration of the remaining elements of a smart city.
A smart city is a creative, sustainable city where the quality of life improves and the perspectives of economic growth are stronger [14]. A smart city’s outstanding characteristics is its intelligence, understood as the sum of various improvements to the functioning of municipal infrastructure, the city’s resources, and social services [40,43,61,62,63,64,65,66,67,68,69,70,71,72,73,74,75,76,77,78].
According to the National Health Organisation, by 2050, the number of people in the world will double and 70% of the whole population will inhabit cities. These cities grow by 60 million people annually, and their share in global GDP is systematically growing, which is currently at around 80%. This is related to the increasing demand for utilities (power, water, gas), transport services, and housing, with serious limitations in public space [2].
Consequently, cities need highly effective solutions that generate sustainable economic growth and social prosperity, which are reflected in the inhabitants’ improved quality of life. Moreover, in the face of growing global warming and the instability of the global economy, cities have become the grounds of various social experiments, where the modern world’s problems are being solved [15,79,80], of which a smart city is a good example.
Therefore, it is evident that the aspect of modern technologies is not the only element or feature of the term “smart” in the context of the functioning of municipal centres. Other factors resulting from these constituents are difficult to grasp factors such as creativity, innovativeness, or democrativeness. The modernistic vision of an ideal city, predominantly based on the individualism of people, is currently in retreat, at an increasing intensity.
Additionally, a fundamental role in the context of the development of the cities of the future is played by business, namely companies introducing smart solutions in the public area, in people’s homes, and lives. These may be organisations that mainly use the technology, creativity, and access to open data, but also human needs, which create software that improves the quality of life, increases work efficiency, while at the same time filling the gap between a city and traditional business in creating social innovations. Another type of business is producers of hardware and software that increase energy efficiency, are based on smart algorithms (e.g., smart homes), and those that supplement smart grids (i.e., power solutions that aim to minimise power losses) [2].
It should be noted that using the market aspect, it is possible to estimate the value of investments that, in the coming years, will be made in the broadly understood smart city solutions and technologies. The analyses can be found in the next section.
2.2. Analysis of the Market of Smart City Solutions and Technologies—Global and European Dimension
The market of smart city solutions and technologies comprises the following components: appliances, software, services, and the functional area (smart infrastructure, governance, education, energy, mobility, health care, buildings). Based on the Allied Market Research data, this market’s value should increase from USD 648.36 B in 2020 to USD 6061.00 B in 2030 (Figure 1).
A report by Research and Markets presented similar values for 2020–2026. According to these data, by 2026, the value of the smart city solutions and technologies market will grow from USD 741.60 B to USD 2500.00 B. On the basis of the authors’ own forecast employing exponential smoothing (Section 3, Materials and Methods), the market’s value will increase to USD 4282.67 by 2030 (Figure 2).
Addressing the global revenues from smart city technologies, products and services, their value, following the data published by Statista, should increase from USD 116.35 B in 2020 to USD 241.02 B in 2025. Additionally, according to the authors’ own forecast (conducted using exponential smoothing—Section 3, Materials and Methods), it is estimated that their value will grow to USD 369.52 B in 2030 (Figure 3).
Addressing the European data, according to Research and Markets, the market’s value will grow, in 2020–2030, from USD 214.44 B to USD 1013.31 B (Figure 4).
It is worth noting that within a decade (in the period from 2020 to 2030), the value of the global market of smart city solutions and technologies will increase by 834.82% (based on data from Allied Market Research). On the other hand, based on the research of Research and Markets and the authors’ own forecast, this increase will amount to 477.49%. Therefore, it is possible to point to a significant dynamics in this sector.
It should be noted that the application of solutions and technologies related to smart city projects will grow in both the global and European setting. However, major differences in the level of advancement of the implemented smart city solutions exist. The following section presents the analysis of the level of Polish smart cities against the background of the world’s leading units of such type.
2.3. Polish Smart Cities on the Background of Global Leaders
The increasing popularity of the smart city concept is reflected in the actions of numerous municipal authorities worldwide. At the same time, the level of advancement and scope of implementation of smart solutions into municipal structures differs on international, domestic, and local levels alike.
The comparative analysis of Polish smart cities and the global leaders was conducted on the basis of a report by the IMD-SUTD Smart City Index (SCI), which comprises a multi-component and multi-criteria cumulative list of variables taken into account for evaluation and ranking purposes. It is also worth describing the methodological assumptions created by the authors of the report [85].
The evaluation covers the way the inhabitants perceive issues related to the structures and technologies they have access to in their respective cities. The most recent publication (2021) covered 118 cities worldwide and recorded the opinions of 120 inhabitants in each city. The final score for each city was calculated using the perception for the last three years, using the weight 3:2:1 for 2021:2020:2019. Smart city parameters were evaluated on the basis of two pillars [85]:
- Structure pertaining to the infrastructure existing in the cities;
- Technological, which describes the technological solutions and services available to the inhabitants.
Each pillar was evaluated within five key areas: health and safety, mobility, activities, possibilities, and governance. Cities were classified into four groups based on the United Nations Human Development Index (HDI) of the economy of which they were a part of. Scoring (AAA to D) was assigned to the cities in each HDI group, on the basis of the perception score of a given city in relation to the remaining cities in the same category [74]:
- For group 1 (the highest quartile in HDI), scale AAA–AA–A–BBB–BB;
- For group 2 (the second quartile in HDI), scale A–BBB–BB–B–CCC;
- For group 3 (the third quartile in HDI) scale BB–B–CCC–CC–C;
- For group 4 (the lowest quartile in HDI), scale CCC–CC–C–BB;
The ranking lists were then presented in two formats: a general ranking (from 1 to 118) and a score for each pillar and the entirety. The three top scoring cities were considered, along with two Polish cities from the ranking list (a total of five cities).
Singapore was ranked as the first city, followed by Zurich and Oslo. The Polish cities were ranked as: 75—Warsaw and 80—Krakow (Table 1).
Addressing the factors related to a city’s infrastructure, both Warsaw and Krakow had much lower values of components of factors. Still, some areas were identified to be at a similar level such as public transport, cultural activity, life-long education possibilities offered by administrative units, or the possibility to participate in the decision-making process of self-government projects (Table 2).
With regard to technology related factors, the ranked Polish cities achieved much higher scores, often approaching those of the world’s leaders. This can include a website or an app that allows the inhabitants to monitor air pollution, arranging medical services online, renting municipal bicycles, purchasing city transport tickets online, access to job offers, and information on how to commence business activity, online voting, using an online platform to communicate with the inhabitants, or the time needed to verify documents online (Table 3).
It is worth noting that inhabitants of Warsaw and Krakow used non-cash payment options more often than people who lived in Singapore or Zurich. However, their willingness to make available their personal data in order to reduce traffic congestion or improve the availability of information was lower, as was the trust they put in authorities (Table 4).
The last element subject to evaluation was the selection of priority areas by a city’s inhabitants (the sample was 120 individuals for each city). Those surveyed were asked to choose five factors, out of a list of fifteen factors, that they deemed the most urgent for their respective cities. It should be noted that the issue of affordable housing received high scores in practically all of the analysed cities. It should be noted that the indicated cities with the highest rating, compared to Polish smart cities, were characterised by a completely different situation. Among other things, Polish cities, in particular, have a problem with air pollution, urban traffic, and health services. In connection with the above, one can expect the development of intelligent solutions, precisely in the direction of solving these problems (Table 5).
The Polish smart cities were not among the world’s leading cities of that type, according to the conducted analyses. Still, the selected areas, comparable in their development to those in the top ranked cities, should be acknowledged. This state of affairs proves that there is a significant growth potential that can be utilised in the coming years. It is therefore justifiable to conduct analyses as identifying fundamental development directions is important. These considerations are discussed in the following section.
2.4. Smart City Technologies and Solution
The concept of a smart city allows for a multi-faceted approach to the development of urban centres. It assumes both an intelligent, sustainable way of managing them as well as the use of so-called smart technologies in urban space. These include [86]:
- Intelligent roads: Equipping roads with special sensors, robots, and other elements aimed at improving the comfort of driving a car; the use of heating elements can prevent freezing of roads, while the use of nanotechnology and self-healing materials keep roads in good condition; sensors will also be able to generate information to engineering services about problems with the surface and places requiring renovation;
- Waste management: The technology assumes the placement of sensors in waste containers that constantly monitor the level of filling the garbage cans; on the basis of information from sensors, the most optimal route of garbage trucks is created, which only considers full bins;
- Monitoring of green zones: Measuring the condition, temperature, and microclimate of the soil can optimise the irrigation and spraying of crops, which will contribute to maximising the quality and production of cereals, vegetables, and fruits; monitoring of exhaust gases and identifying exhaust conditions in forests will define fire zones and avoid the spread of fires; ongoing monitoring of tap water quality as well as the detection of chemical leaks in rivers,
- Intelligent parking lots: Sensors in parking lots in city centres allow drivers to plan parking before they set off;
- Intelligent lighting: Remote management of lighting in the city, where individual lamps can be turned on, turned off, or dimmed to a certain level at any time, depending on the time of day or season as well as during scheduled events taking place in the city;
- Internet of Things in buildings: Sensors located in buildings can monitor the technical condition of building elements as well as the condition of materials; thanks to the use of machine learning techniques and the use of predictive analysis, it is possible to estimate when the next failure will occur; real-time data delivery allows lifts to be repaired before a major failure occurs;
- Location and geolocation: Solutions of this type may, for example, apply to navigation systems inside buildings;
- Intelligent transport systems: A series of solutions that are designed to automatically adapt to the current traffic volume, season, day, and infrastructure. These are, for example, intelligent traffic light systems as well as road safety monitoring, road lighting regulation, or electronic payment management in urban transport.
L.G. Anthopoulos defines the following elements of the architecture of smart cities [20]:
- Soft infrastructure: People, knowledge, communities, business processes, etc;
- Hard infrastructure: Buildings, urban facilities (i.e., roads, bridges, telecommunications networks, etc.), and utilities (i.e., water, energy, waste, heat, etc.);
- ICT-based innovations: both hardware and software solutions that can be embedded in the above hard and soft infrastructure or provide relevant smart services;
- Non-ICT-based innovation: Innovation—beyond ICT—that addresses the dimensions of smart cities (i.e., creativity, open spaces, recycling, and waste management, smart materials, organisational innovation in administration, etc.);
- Physical environment: Relates to the natural landscape of the city (i.e., land, forests, rivers, mountains, etc.).
Thus, it can be concluded that the implementation of smart city technologies and solutions can take place at the following levels [20]:
- Layer 1—Environment: Respect for all features of the environment in which the city is located;
- Layer 2—Hard infrastructure (non-ICT based): Includes all urban facilities (i.e., buildings, roads, bridges, power, water, sewage, etc.);
- Layer 3—Hard Infrastructure (ICT based): This applies to all hardware with which intelligent services are created and delivered to end users (i.e., data centres, telecommunications networks, IoT, sensors, etc.);
- Layer 4—Smart Services: Smart services offered through hard and soft infrastructure (i.e., smart security, intelligent transport, smart management, smart water management, smart health, smart tourism, smart education, smart energy, smart buildings, etc.);
- Layer 5—Soft Infrastructure: People and groups of people living in the city, business processes, applications, and data by means of which intelligent services are implemented.
With regard to intelligent technologies and solutions used in Polish cities, it is worth mentioning Warsaw and Krakow. Warsaw is one of the most developed smart cities in Poland. Among the already available solutions, it is worth mentioning the Veturilo bicycle rental network, Targowa Creativity Centre, the launch of the Warsaw Air Index, and the creation of the Intelligent Heating Network. The solutions are also intended for tourists, elements of electromobility are being implemented, and there is a platform with open access to data. In the case of Krakow, the Intelligent Transport System is used. Within its framework, the following are used: Tram Traffic Supervision System, which enables the management of tram routes in the event of, for example, possible breakdowns; boards with current information. An Area Traffic Control System was also used. Pedestrian and car traffic has been optimised. An Intelligent Lighting Control System was also implemented. The Municipal Spatial Information System is used, which provides the most important information about Krakow, and residents can submit their comments about greenery through it [87].
2.5. Fundamental Development Directions, Beneficial Factors and Adverse Factors of Smart Cities in Poland
Globalisation allows one to observe processes of knowledge diffusion, permeation of models of functioning of city spaces, hybridisation of applied solutions, and the rise in importance of bottom–up (community) initiatives in the co-creation of city spaces [88]. Polish cities are now facing numerous changes that are stimulated by external and internal mechanisms. Consequently, the simultaneous presence of various fundamental directions that can shape smart cities can be brought to attention.
C. Crowe lists the following directions and phenomena that will soon shape the undertakings and projects related to smart cities [89]:
- Technology and innovative data analysis solutions will help fill the digital gap;
- Cities will implement technologies and policies to mitigate issues related to congestion and pollution caused by the increased activity of utility vehicles;
- City centres will be leaders in activities aiming to mitigate climate changes;
- The closed-loop economy concept will be widely used in transport;
- Cyber-security and anti-ransom system will be extended;
- Technological advances will stimulate the building of civic participation;
- Cities will modernise their infrastructure to become more resilient to unpredictable events that may have major, destabilising effects on their functioning;
- Shared mobility using low-emission technologies will grow;
- The creation and extension of the infrastructure for e-car chargers;
- Wireless power supply of infrastructure and buildings will reduce the cable system and maintenance costs, but will also allow consumers to power smart homes and personal gadgets;
- Public libraries should become centres for rebuilding communities (and even perhaps for the return of civic discourse), the development of workforce and entrepreneurship, and for positive changes and social advancement.
Deloitte identifies 12 key tendencies pertaining to the development of smart cities in the nearest future. Table 6 presents the said tendencies.
F. Salva lists five fundamental directions that will have key importance in the context of the development of a smart city [96]:
- Smart health: Technologies will reduce the burden on healthcare eco-systems by supporting not only diagnostics and treatment, but also preventative self-care. This will shift the centre of gravity from health care that focuses on an individual, to a community model. Driven by data analysis, health care will be adapted to the needs of individuals and their families;
- Smart security: Biometrics, facial recognition, smart cameras, and video supervision are growing in popularity as their use by various services and state administration is intensifying. These technologies will assist cities in identifying patterns in data on crime, shorten reaction times, and analyse crime forecasts;
- Smart energy: Apart from investing in clean energy, a city will use technology to monitor energy consumption in real-time and to optimise it;
- Smart infrastructure: Innovative technologies will improve the existing interfaces in several ways from green buildings, through waste management systems, to traffic control;
- Smart citizens: New technologies reinforce a city’s communication with its inhabitants, allowing them to promptly report local problems, while social platforms facilitate establishing connections and sharing resources. Thanks to this, cities will focus on humans and their needs.
Ten key directions related to smart cities can be designated when citing another cumulative list compiled by StartUS (Table 7).
Moreover, M. Pavlica identified seven key directions related to the development of the smart city concept [98]:
- 5G ubiquity—Very soon, 5G networks will become common in cities and will greatly boost the speed of digital transformation. New generation cellular networks will boost the evolution of technologies such as IoT, deep learning in network edge, or detailed data analysis. Support for significantly more 5G devices will allow cities to collect more information and analyse them in real-time, leading to improved efficiency (e.g., in the area of public security or municipal mobility);
- The need for data protection—As technology is gaining popularity, the amount of data is growing. Consequently, cities that implement smart technologies will have to satisfy growing expectations with regard to providing better protection to the information on their inhabitants;
- Combating cyber-crime—The growing problem of cyber-crime forces cities to look more closely into ways of protecting municipal systems. Many places still lack action plans that would describe how to react to cyber-attacks on municipal services and infrastructure;
- Nearing the edge—The ongoing digitisation of cities reinforces the need to store and analyse data collected from network edges, which is where sensors, cameras, and other smart appliances are located. Municipal authorities have already noticed the many benefits originating from deep edge analyses and are eagerly introducing modern solutions in road traffic management, light control, flood protection, etc.
- Municipal mobility—As the number of inhabitants grows, so does the number of vehicles on the streets. This necessitates the introduction of smart and sustainable solutions that reduce city traffic and are, at the same time, environmentally friendly;
- Reaction to climate changes—Climate changes belong to the most serious challenges that today’s cities face. Extreme weather conditions, rapidly ebbing rivers, and dwindling water resources have had an unprecedented impact on urbanised areas. Aiming to limit their impact on the environment, smart cities have been setting increasingly eco-friendly goals and introducing technologies for monitoring threats and the impact of extreme weather. Solutions such as air quality analysis, energy consumption optimisation, water level monitoring, and waste management are being introduced.
- Smart, post-COVID cities—The COVID-19 pandemic has altered the priorities of city planners because the coronavirus managed to reorganise numerous aspects of daily life. In reality, we now have access to and can use smart solutions that prevent the virus from spreading. In the future, city authorities will have to implement smart systems that allow them to get ready to the next, potential pandemic, or maybe even prevent it altogether.
Apart from the fundamental directions present in the surroundings (both far and near) of city centres, there are specific factors that, on one hand, may stimulate and, on the other one, hinder the growth of smart cities. Referring to the studies by L. Lsa and S. De Azambuja [99], a wide range of factors can be distinguished that should support the implementation of intelligent solutions and technologies in cities (see Table 8).
Some of the most important drivers are innovative health care and sanitation facilities, community collectivism, volunteering networks [100,101,102,103,104,105,106,107,108,109], social capital management, ensuring skilled workforce, orientation at renewable energy sources [110], closed-loop economy, transparency of governance and actions of public and governmental administration [111,112], and the use of modern technologies related to the functioning of municipal infrastructure [113,114].
There are also numerous adverse factors that include, among others, the citizens’ distrust in administrative and government authorities [115,116], the costs of functioning and modernisation of infrastructure, climate changes, ineffective transport system, centralised decision-making process, and the use of obsolete technologies [117]. The cumulative list of adverse factors for the development of smart city concepts and projects is shown in Table 9.
Citing the results of other analyses, M. Czupich, A. Ignasiak-Szulc, and M. Kola-Bezka point to the following drivers of the development of smart cities [10]:
- The rise in the number of inhabitants of cities, which forces specific actions aiming to organise spaces in a way that allows for their optimal utilisation; new needs emerge with regard, among others, to equip public spaces with web infrastructure, creating transfer nodes, rebuilding the communication framework, and introducing smart street traffic management;
- Increased interest in sustainable development; self-governments face a new challenge of limiting energy use and CO2 emissions;
- Ongoing computerisation of the life of communities; more and more people from various age groups have been using new IT technologies that facilitate communication, but also allow making online payments or searching for information; therefore, public services must be computerised even more; the traditional model of administration based on providing services to stakeholders via personal contact should be gradually replaced with ICT tools.
At the same time, the cited authors formulated the following list of adverse factors for the use of the smart city concept among Polish cities [10]:
- A difficult financial situation mainly caused by investment activities in the recent years; consequently, new projects in areas where the most capital is needed, namely in transport, power engineering, and waste management, may be limited or postponed;
- The tenure nature of governance, which may negatively affect the strategy selected by predecessors; the political risk constitutes a barrier that is difficult to overcome as it makes it necessary to build alliances with disregard to the differences, political party affiliation, and personal antagonisms; it is important that the city and its inhabitants remain the ultimate goal; the proper satisfaction of public needs with the use of new tendencies and proven solutions should remain the foundation of city governance;
- Lack of awareness of recipients with regard to the rational use of utilities; the task of the local authorities would have to be the creation of a conscious consumer approach, an individual who uses power, gas, and water during periods that guarantee lower bills, and eliminate the risk of grid overload;
- Resistance towards changes; it is a society’s natural reaction; therefore, the introduction of new, municipal solutions should be preceded by widely reaching information campaigns and consultations, so that arguments for the viability of the made decisions can be presented; it is important that all improvement actions are taken regularly; the nature of innovations is the continuity; the regularity of introduced changes may alleviate social resistance and motivate inhabitants to accept new solutions.
It should be noted that the conducted analyses point to a wide range of factors and variables that may prove to be beneficial to the development of smart city projects, but may also limit them. Additionally, given the specific nature of domestic and local conditions, it is reasonable to conduct inquiries that aim to determine the key tendencies and factors that may shape smart cities. The next section describes the methodological assumptions behind the authors’ own studies.
3. Materials and Methods
3.1. Conceptual Assumptions
The research objective was an attempt to indicate the expected changes in the shaping of the idea of smart cities in Poland.
In the context of creating smart city concepts and solutions, fundamental development directions will be analysed, which are related to two categories of factors: beneficial and adverse. The study used a variety of methods depending on the phase (analysis of the literature on the subject, the implementation of the study, and the elaboration of the results). Below is a description along with an indication of their use in individual stages of the study.
As part of the study, a number of methods were used depending on the stage of the study (preparation, implementation, and results processing).
Research preparation phase
The authors formulated the following research problems:
- Q1: What directions will be crucial for the development of smart cities in Poland by 2030 (in the opinion of experts)?
- Q2: What beneficial factors will be crucial for the development of smart cities in Poland by 2030 (in the opinion of experts)?
- Q3: What adverse factors will be most important for the development of smart cities in Poland by 2030 (in the opinion of experts)?
Desk research is a research method consisting of the analysis of available sources of data and, in particular, their compilation, mutual verification, and processing. This analysis serves as a basis to draw conclusions on the researched problem [119,120]. The method was used in the analysis of the literature on the subject and the selection of variables (fundamental development directions, beneficial factors, and adverse factors) to develop a form for focus expert research.
Exponential smoothing method consists in the processing of a time series and reduces its variance thanks to a weighted moving average from previous values, where weights diminish exponentially along with the distance in time [121]. It should be noted that exponential smoothing and its modification allows for the extrapolation of trends (the smoothing removes noise and other effects, leaving only the signal), making it possible to predict the series behaviour in the near future [122]. Depending on the conclusions drawn from the decomposition of the series, a relevant method of exponential smoothing is subject to adaptation [123]. The analysis uses exponential triple smoothing, ETS, with three additive model components such as error, seasonality, and trend (AAA algorithm). Excel was used for the calculations. The examined variables were the time and values pertaining to smart city solutions and technologies. To show the trends in the implementation of smart city solutions and technologies, the market data (global and European) relating to this sector was presented (Section 2.2 Analysis of the market of smart city solutions and technologies—global and European dimension). For two reports from the following sources Research and Markets [82] and Statista [83], the authors prepared a forecast up to 2030 in terms of market value. The forecasting function in Excel (FORECAST.ETS) was used for the calculations.
Research implementation phase
Expert focus group interview (expert questionnaire) is based on collecting research material using a developed questionnaire form, obtaining answers by the researcher from research participants selected on the basis of specific criteria.
It should be noted that an expert interview is a special type of method as it draws from the knowledge and ingenuity of individuals who are experts in a given field [124]. The questions given to the respondents in focus interview not only pertain to facts or attitudes to them, but also to attempts at explaining and predicting them. Additionally, it is assumed that professionally accomplished respondents who have expert knowledge on a topic can offer interesting analytical proposals. Thanks to their professional knowledge and “reality-based imagination”, they can also create valuable (realistic) forecasts as to the development of a situation within a specific part of economic and social reality [125,126]. The authors’ own research was conducted from 2 August to 31 August 2022. The criteria for selecting experts for the study are described in the next section.
Results analysis phase
The analysis of the test results is based on two parallel analytical paths. The first was based on the statistical method. The second, on the other hand, was carried out on the basis of the network analysis method.
On the one hand, the statistical analysis included descriptive measures such as arithmetic average, dominant, minimum value, maximum value, and range [127]:
- Arithmetic average: is the sum of the value of variable () of all units of the studied population divided by the number of units of the population (): ;
- The dominant () is the value of the variable that is the most frequent (dominant, typical) in the studied community. The dominant is called a modal value or mode. In a simple series, the values of the variable should be ordered from the lowest to the highest value (i.e., from to ) and then the values that repeat themselves are counted;
- The minimum value of recorded responses in accordance with the adopted scale ;
- The maximum value of the recorded responses in accordance with the adopted scale ;
- The range is the difference between the maximum and minimum value ;
- The intraclass correlation coefficient (ICC) is a descriptive statistic that is used in quantifying individuals that are organised into groups. It is used when the test variable is measured by several experts. It measures the strength of expert reliability (i.e., the degree to which their assessments agree). Analysis was conducted in statistical software R, ver. 4.2.1, with α = 0.05. The ICC estimates with 95% confidence intervals were based on an absolute-agreement, 2-way random-effects model. The single measure option was chosen for the fundamental development directions (as no general indicator was built for those items) and average measure option for beneficial and adverse factors (as they were later on averaged for other computations).
Based on the value of the dominant estimated for individual factors, the responses were grouped (clustered), taking into account the inclination of the experts’ assessments.
Correlation coefficients used in the analysis were Pearson’s r and Spearman’s rho.
Pearson’s linear correlation coefficient ( is a descriptive measure that determines both the strength and direction of the correlation relationship between two quantitative features X and Y when the relationship between them is linear. Pearson’s correlation coefficient is based on the so-called feature covariance-. The Pearson’s correlation coefficient is calculated as: ; where is the X feature value, is the Y feature value; is the arithmetic average of the X feature; is the arithmetic average of the Y feature; is the standard deviation of the X feature; is the standard deviation of the Y feature [127].
Spearman’s rank correlation coefficient ( is used to describe the strength of correlation of both the quantitative and qualitative features in a situation where it is possible to order their variants. The formula for calculating the Spearman rank factor can be written as ; where is the difference between the ranks of the feature X and Y; is the number of pairs of X and Y features. Ranking consists of arranging the values of X and Y features in ascending or descending order, then, they are given the so-called ranks: 1, 2, 3, …, n [127].
Network analysis is based on the identification and description of relations (relationships) between groups, both organisations (or their components) and people [128]. It can be said that this is an interdisciplinary approach using, inter alia, statistics, matrix algebra, graph theory, informatics, and the assumptions of sociology, anthropology, and social psychology, focusing mainly on the structure of relationships between social entities (factors, components of organisations, organisations, and even regions and others). Network analysis is practically used (mainly in analytical processes) in management and quality sciences, on a pan-organisational level including interregional areas [129,130].
The following network analysis indicators will be used in the article’s research part:
- Betweenness centrality, a relation of the number of the shortest paths between any two nodes, which pass through a given node, to the total number of all shortest paths; betweenness is sometimes normalised so that the maximal betweenness in the network is 1; it shows which nodes are the most important ones, in other words, it determines the probability of a given factor (element) being key for the entirety of flows within a network;
- Cumulative value of a vector, the summed values of all connections from a given network node, it parametrises the scope of impact of a given factor on flows in the network.
Network analysis makes it possible to assess the structure of the network by analysing other levels of connections, identifying gaps in the structure, emerging subgroups linked by specific recurrences, and also identifying the importance of individual factors in the studied socio-economic processes [128]. Thus, such a research approach includes both quantitative and qualitative appetites—the collected data are subject to qualitative interpretation [131]. In this study, the analyses and visualisations were based on the Pajek program, which was developed by V. Batagejl and A. Mrvar [132], thanks to which, the relations and interactions between the assessments made by individual experts participating in the study were reflected.
The article serves as a continuation of the cycle of experimental examinations on the use of Pajek as an auxiliary tool for the creation of a concept of solving specific problems of businesses and sectors on the basis of relation systems within the environment’s phenomena [133,134].
SWOT analysis is one of the strategic methods and is a heuristic method. Its name is an acronym for strengths, weaknesses, opportunities, and threats. The method has many applications; in this study, it was used to aggregate the results into the following (modified) categories: key beneficial factors of development, key adverse factors of development, benefits of smart city development, and the disadvantages of smart city development.
3.2. Selection of Experts for the Research
The technique of purposeful selection of the research sample was used. The selection criteria for the study were extensive practical experience in the field of smart city solutions and concepts, manifested by participation in the development of strategic assumptions for smart cities, international projects related to the implementation of smart city technology, and the development of policies for the development of the smart city concept at the European Union level. Twenty-three experts participated in the study. Due to the focus of the study, the number of participants was not selected to be representative, which is a limitation. However, due to the importance of expert opinion(s), a significant added value of the research results can be indicated.
3.3. Tool Description
The tool used in the study was an expert focus interview form (in electronic form-Computer Assisted Web Interviewing, CAWI), where the following issues were discussed:
- The role of fundamental directions in the development of smart cities in Poland by 2030; 21 trends were selected by the authors for analysis on the basis of desk research analysis; moreover, the respondents could identify additional directions; the following scoring was used:
- ○
- 0: Neutral, the direction will not have any impact on the development of smart city concepts and solutions in Poland by 2030;
- ○
- 1: Mild, the direction will have little impact on the development of smart city concepts and solutions in Poland by 2030;
- ○
- 2: Average, the direction will have a significant, but not crucial impact on the development of smart city concepts and solutions in Poland by 2030;
- ○
- 3: Strong, the direction will have a strong, crucial impact on the development of smart city concepts and solutions in Poland by 2020.
- The role of beneficial factors of the development of smart city concepts and solutions in Poland by 2030; a total of 49 factors in the following areas was selected for analysis: social, economic, environmental, administrative, infrastructural, and technological; moreover, the experts could identify additional factors; the following scoring was used:
- ○
- 0: Neutral, the beneficial factor will not have any impact on the development of smart city concepts and solutions in Poland by 2030;
- ○
- 1: Mild, the beneficial factor will have little impact on the development of smart city concepts and solutions in Poland by 2030;
- ○
- 2: Average, the beneficial factor will have a significant, but not crucial impact on the development of smart city concepts and solutions in Poland by 2030;
- ○
- 3: Strong, the beneficial factors will have a strong, crucial impact on the development of smart city concepts and solutions in Poland by 2020.
- The role of adverse factors on the development of smart city concepts and solutions in Poland by 2030; a total of 49 factors in the following areas was selected for analysis: social, economic, environmental, administrative, infrastructural, and technological; moreover, the experts could identify additional factors; the following scoring was used:
- ○
- 0: Neutral, the factor will not have any impact on the development of smart city concepts and solutions in Poland by 2030;
- ○
- −1: Mild, the factor will have little impact on the development of smart city concepts and solutions in Poland by 2030;
- ○
- −2: Average, the factor will have a significant, but not crucial impact on the development of smart city concepts and solutions in Poland by 2030;
- ○
- −3: Strong, the factor will have a strong, crucial impact on the development of smart city concepts and solutions in Poland by 2020.
3.4. Analysis Scheme
The study consisted of three phases: preparation, implementation. and results analysis. The results of the analyses were developed in parallel based on two approaches: the statistical method and the network analysis (Figure 5).
The network in the Pajek program was created in two main stages (after collecting the research material). First, all of the analysed elements (variables) were entered. In this case, the element was divided into the following categories: symbols of experts, trends, factors, and barriers to development (divided into social, economic, environmental, governmental, and infrastructural subgroups). In the second stage, the relationships between the components of the network were defined. Therefore, on the basis of each of the 23 questionnaires, relations between the expert and the answers indicated by them were introduced. The direction of the relationship was from the expert to the element (trend, factor or barrier of development) with the strength of this relationship (according to the adopted scale).
On this basis, it was possible to select the most important elements of the network using the two factors described above: the cumulative value of the vector and the intermediation. The first indicator shows the total value of relations entering a given network element where the higher the value, the more often it was indicated by the experts or obtained higher values on the rating scale. On the other hand, the second indicator determines the key level of network elements where the higher its value, the more important a specific network element is in it. Therefore, on the basis of these two indicators, it is possible to identify the main reasons for the studied phenomena.
The analysis of the results of the authors’ own research is presented in the following section.
4. Results
The focus interview was conducted from 2 to 31 August 2022. The research material was collected using an expert survey form consisting of parts on the evaluation of the fundamental development directions, beneficial factors, and adverse factors.
The research sample consisted of 23 experts. Regarding the function, the biggest share included specialists (34.78%), followed by managers (21.74%), and department heads (17.39%) (Figure 6).
It should be noted that the participating experts had ample experience in their respective functions, with most of them indicating over 5 years of experience (52.17%), from 3 to 5 years (34.78%), and from 1 to 3 years (the remaining 13.04%) (Figure 7).
The experts also indicated high levels of their respective knowledge on the issues related to smart city concepts, solutions, and technologies. The assumed scoring scale was from 1 to 5 (where 1 means a low level of knowledge and experience and 5 indicates a high level of knowledge and experience). A total of 78.26% of all answers had the highest values of 4 and 5 (Figure 8).
Calculations were made of the average, dominant, minimum, maximum, and range values for each analysed variable. Details of the calculations are included in Appendix A, Appendix B and Appendix C.
On the basis of the average answer, the following fundamental directions of activities were distinguished: smart and sustainable buildings and infrastructure, smart energy, and smart mobility.
With regard to the beneficial factors, they were grouped into the following categories: social, economic, environmental, governance, and urban infrastructure. The most important social factors were: education directed towards citizen development, social responsibility, informed citizens, and innovative health care and sanitation facilities. In the case of economic factors: innovation, urban lab, Research and Development (R&D), sustainable management of resources, circular economy and partnership formation, and multisector synergies. In the case of environmental issues, these were energy related (renewable resources, saving initiatives, smart systems) and water related (monitoring quality, efficiency of water usage and pollution prevention, and reduction). Governance factors included citizen empowerment, interactive and participatory services, co-production, co-creation, bottom–up approaches, definition of Key Performance Indicators (KPIs); monitoring/assessment and stakeholders’ engagement, internal (cross-sector) and external. In the case of the last category—infrastructural factors—these were: affordable housing facilities such as water and energy supply, the adoption of innovative construction techniques, and Internet of Things (IoT).
With regard to adverse factors in the social category, the highest values were obtained by the lack of citizen participation, lack of trust. and lack of social awareness. In the economic group, it was the high cost of urban infrastructure, imbalance of investments, lack of funding and investors; short time horizon of investments and weak public–private partnership. For environmental factors, climate change, increasing resource consumption and growing population, and imbalance between liveability and environment. In the governance category, it was a lack of planning, lack of vision and strategy, lack of capacity (HR), and lack of IT knowledge among city planners. In the last group, infrastructural, it was technological obsolescence, system failures, infrastructure fragility, lack of infrastructure integration, complexity of networks, and deficit of technological infrastructure.
Referring to the interclass correlation coefficient (CCI), item scores for individual beneficial and adverse factors were averaged—generic indicators for each beneficial and adverse factors were created (scale for adverse factors was reversed, so higher number indicated a higher significance in inhibiting the development of smart city concepts and solutions in Poland by 2020). Agreement between experts was the highest for the environmental adverse factor (ICC 95% CI = 0.71 [0.41; 0.91]) and the lowest for the governance beneficial factor (ICC 95% CI = 0.05 [−0.26; 0.50]). ICC values lower than 0.50 indicated low agreement between experts, 0.50 and above showed mediocre agreement, and 0.75 and above showed good agreement (Table 10).
A qualitative analysis was also carried out, which was related to the search for inclination in the experts’ responses. Therefore, on the basis of the estimated absolute value of the dominant, individual variables were grouped into clusters corresponding to the value of the dominant. A total of four such clusters (Appendix D) were created. The list of cluster 1 with the highest value of the dominant is presented in Table 11.
Almost all variables were correlated to each other. The P value was larger than 0.050 only for the analyses between urban infrastructure (adverse factor) and social factors (beneficial), urban infrastructure (adverse factor) and economic factors (beneficial), and environmental factors (adverse) and economic factors (beneficial). In the case of other variables, as the level of one variable increased, an increase in the level of the other variables could be observed (all correlations were positive ones). For example, the higher the assessment of the social factors’ influence, the higher the assessment of the influence of economic factors (r = 0.76; p < 0.001). R values lower than 0.40 indicated a weak relationship, 0.40–0.59 was moderate relationship, 0.60–0.79 was a strong relationship, 0.80 and above was a very strong relationship (Appendix E).
Correlations with the Spearman’s coefficient were also significant in most cases (except for the relationships between urban infrastructure (adverse factor) and the social, economic and environmental beneficial factors). The interpretation of the strength of dependencies was the same as for the Pearson’s coefficient (Appendix F).
Network analysis tools such as visualisations, betweenness indicators, and vector values were used for the analysis and interpretation. In the case of network visualisations in Pajek software, the thickness of lines between the individual network elements designates the strength of relation, with thicker lines meaning stronger impact (both positive as in the case of beneficial factors, and negative in the case of adverse factors).
The authors selected two parameters to select fundamental directions, beneficial factors, and adverse factors with a significant impact on the development of smart cities: the value of betweenness and the value vector, whose value could be determined in Pajek software.
The value of betweenness shows the probability with which a given factor is crucial for shaping, in this particular case, the beneficial and adverse factors. This is calculated on the basis of all connections within the network, with values added to a unit, where the higher the betweenness value, the higher the importance of the factor’s variable that can be shown. On the other hand, the vector’s value determines the strength of impact of the factor on the indicator. In this study, it was in accordance with the assumed scale (see Section 3). The higher the vector’s value, the bigger its impact on the indicator. The experts’ individual opinions were assigned to individual fundamental directions, beneficial factors, and adverse factors, considering the strength of impact of the individual variables. This allowed us to determine the nature of the relation network:
- 149 network elements including:
- ○
- 23 experts;
- ○
- 21 fundamental development directions;
- ○
- 98 factors including:
- ▪
- 49 beneficial factors;
- ▪
- 49 adverse.
- ○
- 3034 connections within the network.
A detailed summary of the test results is included in Appendix A, Appendix B and Appendix C at the end of the article. All values were estimated on the basis of appropriate functions in the Pajek program concerning the indicators selected for the analysis.
The following, most important, key development directions are listed here on the basis of the scoring of all factors: smart and sustainable buildings and infrastructure, smart mobility, and smart energy. An additional trend, identified by the participants, was presented in the cumulative list: construction/energy passive districts, zero-emission construction.
However, there are other directions that were also highly rated. These include planning green public spaces, 15-min cities, solutions for intelligent mobility, cybersecurity, or advanced waste management methods (Appendix G).
Therefore, according to the research results, Polish smart cities will be driven by solutions related to smart building by 2030 (e.g., the optimisation of energy consumption, waste management, low and zero emission solutions, decarbonisation of buildings, digital twins, smart sensors, and cloud computing enable monitoring real-time forecasting of energy consumption, detection of security threats, and the optimisation of expenses). Emission-free transport, intelligent traffic management, and the use of artificial intelligence in public transport will also play a significant role.
Analogous calculations were conducted for the beneficial factors in individual categories, considering the experts’ additional indications.
In the social sphere, the key beneficial factors included innovative health care and sanitation facilities, education directed to citizen development and social responsibility, and informed citizens. Additionally, factors such as public provision of urban services, community development, collectivism, and volunteering networks. The most important factors with regard to economy are innovation, urban lab, Research and Development (R&D), sustainable management of resources, circular economy and partnership formation, and multisector synergies. In this group, also important were the promotion of social and human capital, attracting and retaining workforce, and flexibility of the labour market. Environmental factors made up yet another group. The following were deemed crucial by the respondents: energy related (renewable resources, saving initiatives, smart systems, smart building, Responsive Building Envelope (RBE)) and water related (monitoring quality, efficiency of water usage). In addition, significant factors were smart waste management, recycling and mobility related (efficient transport systems, cycle paths). Among the administrative factors, the highest scoring ones were urban planning (strategy and vision definition, capacity planning, i.e., infrastructure, cost, and human resources), the definition of Key Performance Indicators (KPIs); monitoring/assessment and stakeholders’ engagement (internal (cross-sector) and external). Additionally significant in this category were supportive government policies, political will and synergy, alignment and management of conflicts of interests, data governance (data quality, data sharing, and data privacy policies). The last category included infrastructural determinants, notably, affordable housing facilities, water and energy supply, adoption of innovative construction techniques, and Internet of Things (IoT). In addition, important factors in this group include connectivity, broadband, access to Internet facilities, advanced ICT, intelligent technologies in urban services, and the use of geographical information systems (GIS) (Appendix H).
Referring to adverse factors, the most important social factors were listed as a lack of citizen participation, lack of trust, and lack of social awareness. Of less importance were: resistance to change, social exclusion and gentrification, availability of services for different communities, and fact that Polish society is not very active and not very pro-social. In the case of economic adverse factors, the list of key ones included the high cost of urban infrastructure, imbalance of investments, lack of funding and investors, the short time horizon of investments, and unemployment. The factors with lower ratings included competitiveness (local against regional and international markets), imbalance between competitiveness and quality of life, and unemployment and the lack of equity access to the labour market. For the environmental aspects, the respondents gave the highest scores to the following ones: resource scarcity, loss of biodiversity, climate change, and increasing resource consumption. Other environmental factors such as the lack of resource sharing, lack of holistic approach for environmental sustainability, and the lack of knowledge on how ICT can decrease energy consumption. For another category—administrative factors—the key aspects were a lack of planning, a lack of vision and strategy, a lack of capacity (HR), and the inability of policies. It is also worth pointing out the lack of project management, structure issues (complexity of organisational structures, political instability), and complexity. In the last group, containing infrastructural factors, the most important ones were technological obsolescence, systems failures, infrastructure fragility, lack of infrastructure integration, complexity of networks, and deficit of the technological infrastructure. Moreover, the following deserve attention: a lack of systems interoperability, a lack of integration standards, and lack of systems security and privacy violation (Appendix I).
Based on the network analysis, a SWOT analysis was prepared containing the key beneficial factors of development, the key adverse factors of development, benefits, and disadvantages of smart city development (Table 12).
Key development directions, beneficial factors, and adverse factors of smart cities in Poland by 2030 were selected on the basis of the completed analyses (based on the opinions of experts). Still, it must be pointed out that in numerous cases, the remaining variables had similar scores and values of the estimated factors. This points to a significant complexity of creative processes and conditions for the implementation of projects, solutions, and technologies of smart cities.
5. Discussion
By 2026, smart cities may potentially generate USD 20 T of economic benefits. Organisations of various types are encouraged to finance smart city projects through green stimulation packets and strategies that help reduce their financial risk and ensure a potential for additional revenue. On the basis of Barclays’ analyses, it was shown that the fundamental trend driving the changes of city centres towards “smart cities” will be technological innovations within municipal infrastructure, which, in turn, play a key role for development, by ensuring that foundations are already in place before additional solutions and services appear [135].
C. Ratti and A. Townsend identified the basic tendency to be the development of high technologies that allow for fast, unlimited transfer of data, the availability of databases, the emergence of effective, easily programmable infrastructure, and the continuously extended network of sensors and drivers, as the implicators of changes towards smart cities. The main benefit comes from the improved quality of services provided to a city’s users and the savings of financial expenditure, time, and energy from the perspective of the functioning of a city [136].
It is worth noting that the main directions of changes and the development of smart cities also depend on the city’s size and location. Such areas are described, among others, in the Domestic Municipal Policy 2030 and include security, good access to high quality public services including health care, a job market, housing offerings, leisure options, cultural offerings, natural environment, public transport, and attractive public spaces. The document also shows that a city can be an attractive location in three aspects. Apart from the attractive nature of the work and living place, the accessibility and quality of the so-called third place—a place of leisure—is just as important. Equally important are broadly reaching activities improving the quality of public health care [137,138].
In the local documents, however, the implicators are described in a definitive way, according to the diagnosed specifics of a city. The key directions for Warsaw are, foremost, the smart management of environmental resources and smart city management [139]. In Kielce, the tendencies include electronic administration, open access to data, and power engineering [140]. In the strategy for Nowa Ruda, despite the small number of entries in documents relating to smart cities, the quality of educational services was indicated as the key to further development of the city under the smart city concept [141]. Most of the development areas regarding Krakow’s 2030 strategy for smart city solutions and technologies were identified as any and all activities fostering sustainable development, with a particular focus on pro-ecology, transport system, and open data activities [142].
In the literature on the subject, there have been many analyses relating to directions in smart city development. V. Albino, U. Beradi, and R.M. Dangelico emphasise the importance of intelligent mobility aimed at improving the city’s transport by using advanced technologies in the transport process [44]. In addition, intelligent mobility or transport is one of the most important applications of a smart city, thanks to which cities can opt for road traffic [143]. Other authors have emphasised the role of intelligent building in terms of heating, air conditioning, optimisation of the use of lighting, window shading, and energy management systems [144]. Some of the analyses are directly related to the energy issue of smart cities, the main element of which is the use of diversified sources of renewable energy, and the reduction in greenhouse gas emissions [145]. The security technology issues were also highlighted as a key smart component in tracking inappropriate human behaviour, monitoring community activities, and detecting specific individuals in the event of disasters and criminals [146]. In addition, we can talk about factors such as intelligent water solutions [147], computing innovations to improve education [148], smart streets [149], intelligent water supply network [150], and intelligent parking [151].
Based on the quoted research from the literature on the subject, it can be indicated that the development directions of a smart city include areas related to innovations in the field of intelligent life, intelligent economy, intelligent environment, intelligent education, intelligent management, intelligent energy, intelligent security, intelligent mobility, intelligent hospitals, intelligent buildings, and construction, which is consistent with the analyses carried out. The differences, however, consist in the indications of the significance of individual factors, which are related to the specificity of the level of socio-economic development in Poland.
Based on a multi-criteria analysis using the TOPSIS technique, S. Hajduk has developed a ranking of smart cities based on urban intelligence. Kraków received the highest rating. The most important development directions of this urban center were solutions in the field of environmental protection and building social capital [152]. G. Mąsik, I. Sagan, and J.W. Scott conducted research on the Polish cities of Warsaw, Krakow, Łodz, Wroclaw, Poznan and Gdansk. They showed that the most important development directions of Polish smart cities are participatory management, digitisation of service provision, meeting social needs, and combining smart programs with wider goals of urban development [74]. P. Maleszyk conducted research on the basis of an intelligent neighbour satisfaction recognition tool implemented in Lublin (Poland). It should be noted that such solutions may contribute to giving development directions and implementing intelligent solutions based on participatory management and the level of the residents’ satisfaction [153].
The key fundamental directions listed in EU-level documents, within European innovations partnership for smart cities and communities, are predominantly related to power engineering (smart grids, smart measuring, smart distribution, smart energy management) and transport. It can therefore be concluded that the results from the analysis of the authors’ own studies converge with the presented development directions for smart cities in Poland by 2030, both on a domestic level and on a local level, in relation to particular cities.
6. Conclusions
The quality of life and civilisation standards are determined by the development of science and technological advancements. Currently, cities need highly effective solutions that generate sustainable economic growth and social prosperity, which are reflected in the inhabitants’ improved quality of life. This is the basic assumption behind the creation of new, organisational units—smart cities. The characteristic feature of these solutions and concepts is “intelligence”, which can be understood as the sum of various improvements to the functioning of municipal infrastructure, city resources, and public services. Given the current complexity of human functioning in a city, it is necessary to develop and implement innovative solutions of a social, environmental, economic, infrastructural, and administrative nature. Depending on the domestic or local conditions, other phenomena may be present, which may accelerate or hinder the use of smart city solutions and technologies.
The research objective was an attempt to indicate the expected changes in the shaping of the idea of smart cities in Poland. The authors’ own study was conducted from 2 to 31 August 2022, based on a focus interview with 23 experts that were professionally connected to smart city issues.
Based on the intraclass correlation coefficient (ICC), it was shown that the compliance of experts in the field of beneficial factors from the social, environmental, and urban infrastructure category was average. Similarly, in the case of the adverse factors in the categories oof social, economic, and environmental.
It should be noted that almost all the variables were correlated with each other. No correlation was found between urban infrastructure (adverse factor) and social factors (beneficial), urban infrastructure (adverse factor) and economic factors (beneficial), and environmental factors (adverse) and economic factors (beneficial). However, in the case of the remaining variables, with an increase in the level of one, there was an increase in the level of the other variables (all correlations were positive).
In the research process, the method of network analysis was used, and the Pajek program was used for analysis and visualisation. A network of relations, spanning a total of 3034 connections (98 variables were examined, made up of 49 beneficial factors and 49 adverse factors), was developed from the responses of the experts.
With regard to trends that will be of crucial importance for the development of smart city projects in Poland by 2030, the directions are smart and sustainable buildings and infrastructure, smart mobility, and smart energy. Both beneficial and adverse factors were divided into categories of social, economic, environmental, administrative, and infrastructure. The following were highlighted among the most critical beneficial factors: innovative health care and sanitation facilities, innovation, urban lab, Research and Development (R&D), renewable resources, urban planning: strategy and vision definition, capacity planning (i.e., infrastructure, cost, and human resources), and affordable housing facilities. The major adverse factors for such projects included a lack of citizen participation, high cost of urban infrastructure, resource scarcity, lack of planning, a lack of vision and strategy, and technological obsolescence. It should be noted that results similar to those in the network analysis were obtained after estimating the descriptive statistics.
It should be added that the results of the study led to a conclusion that highly complex, creative processes and circumstances exist that are related to the implementation of the vision of smart cities.
The limitations of this research are related to the scope of the focus interview, of which 23 experts is not representative. At the same time, selected research parameters such as development directions, beneficial factors, and adverse factors were selected on the basis of an analysis of the literature on the subject. Therefore, future research should include the possibly broadest sample of engaged experts, not only related to the real economy, but also from the scientific community. They will also include other research methods such as Delphi or the analysis of strategic documents at the national and EU level, considering the research and development programs. At the same time, the research will also relate to individual regions of Poland and selected cities that implement these powerful solutions, considering the statistical analysis of the selected factors.
Author Contributions
Conceptualisation, Ł.B. and M.K.W.; Methodology, Ł.B. and M.K.W.; Software, Ł.B.; Validation, Ł.B.; Formal analysis, Ł.B.; Investigation, Ł.B.; Data curation, Ł.B.; Writing—original draft preparation, Ł.B. and M.K.W.; Writing—review and editing, Ł.B. and M.K.W.; Visualisation, Ł.B. All authors have read and agreed to the published version of the manuscript.
Funding
The research received no external funding.
Data Availability Statement
Not applicable.
Conflicts of Interest
The authors declare no conflict of interest.
Appendix A

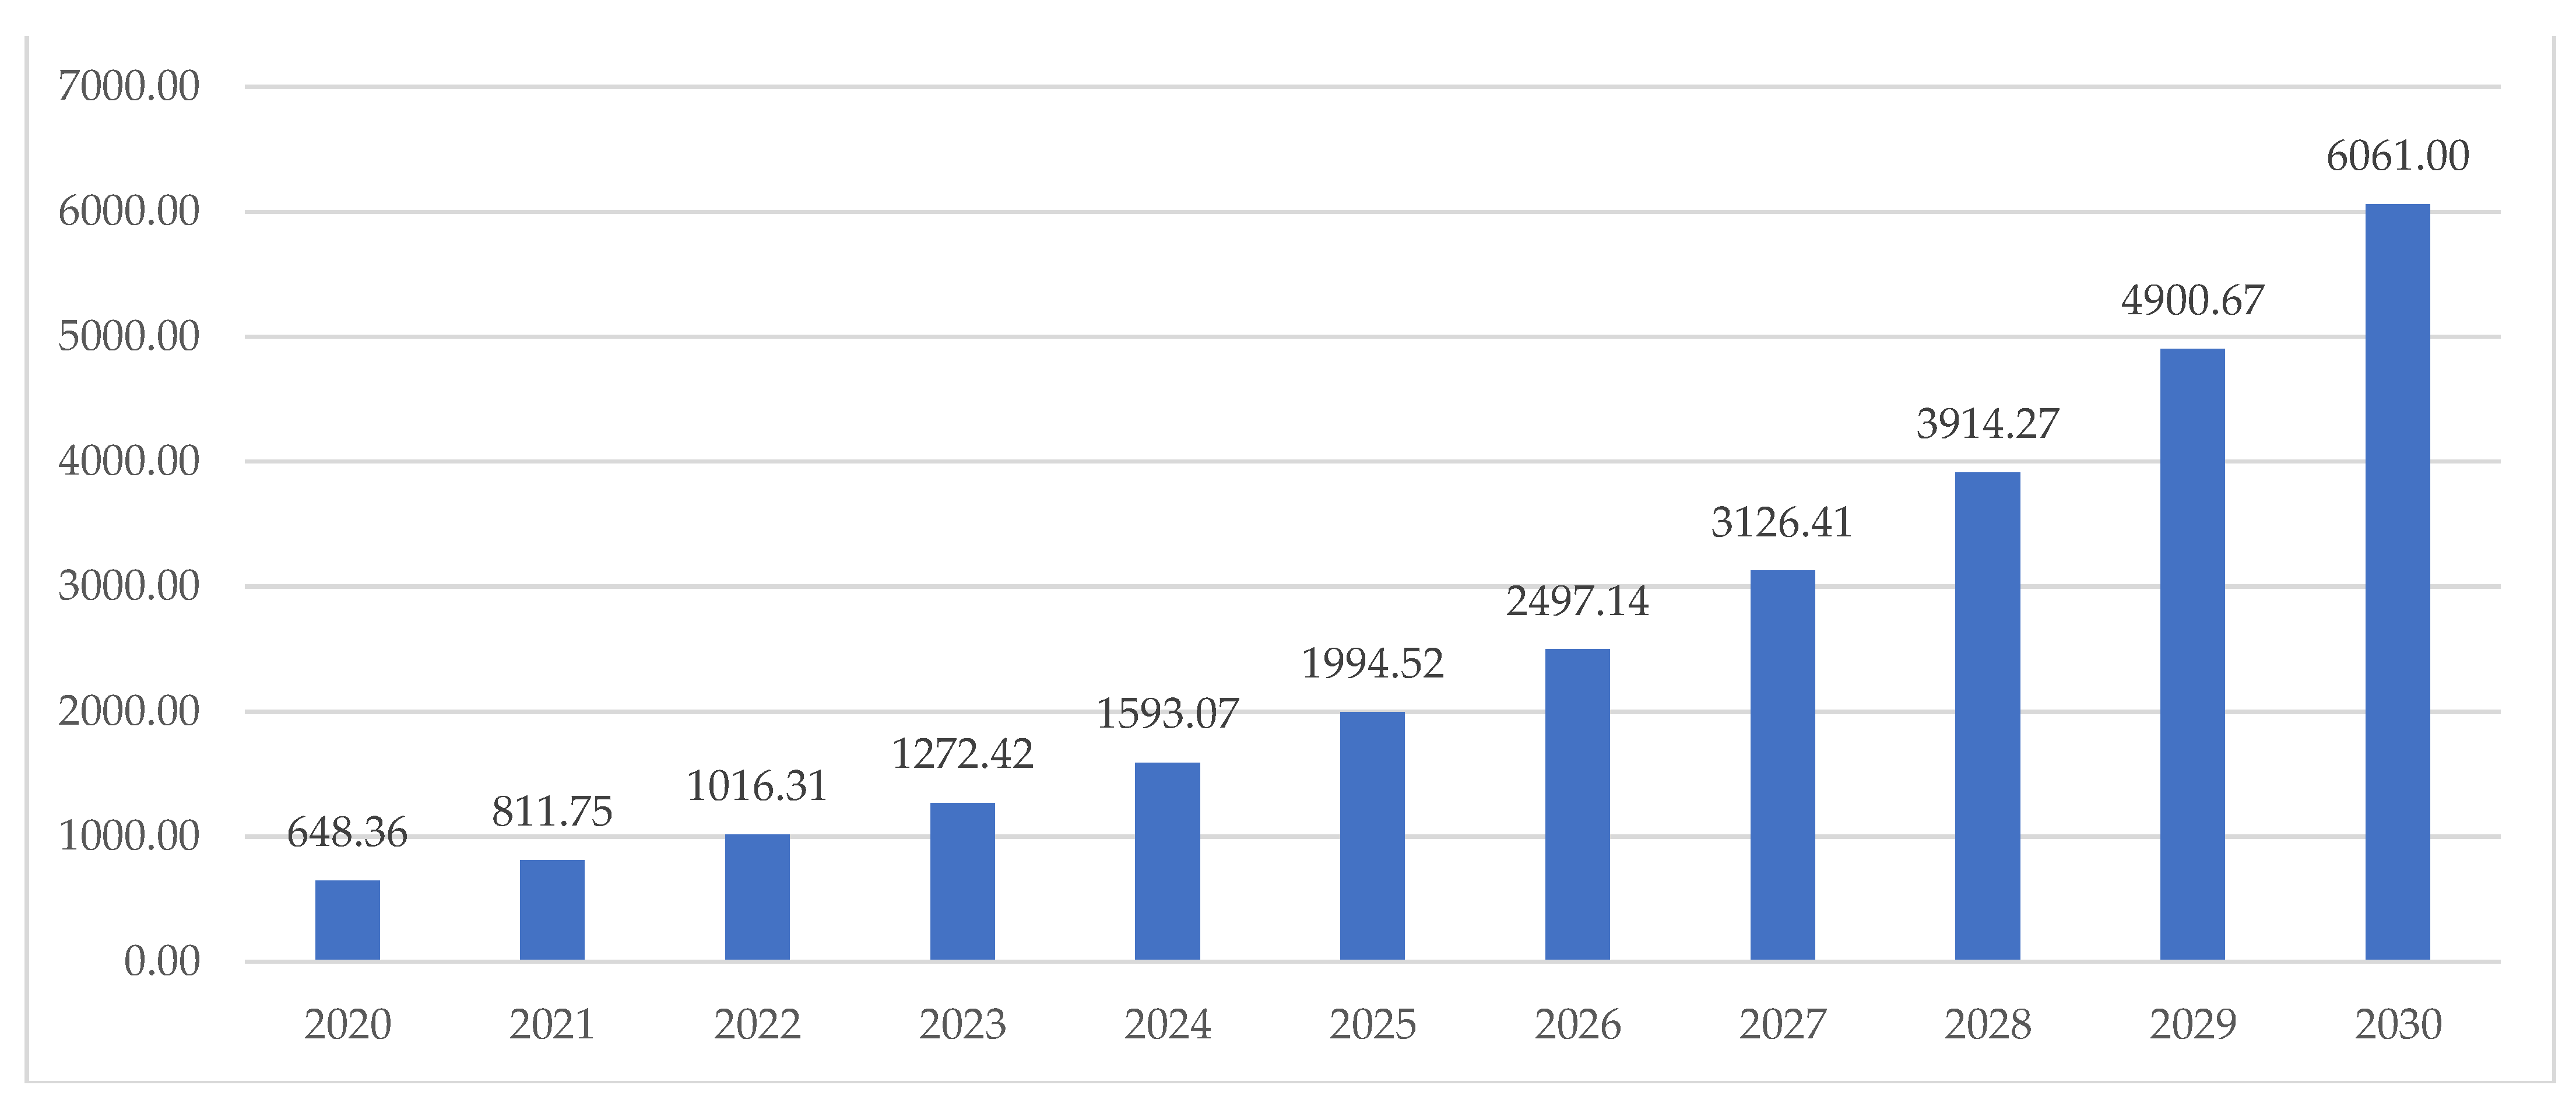
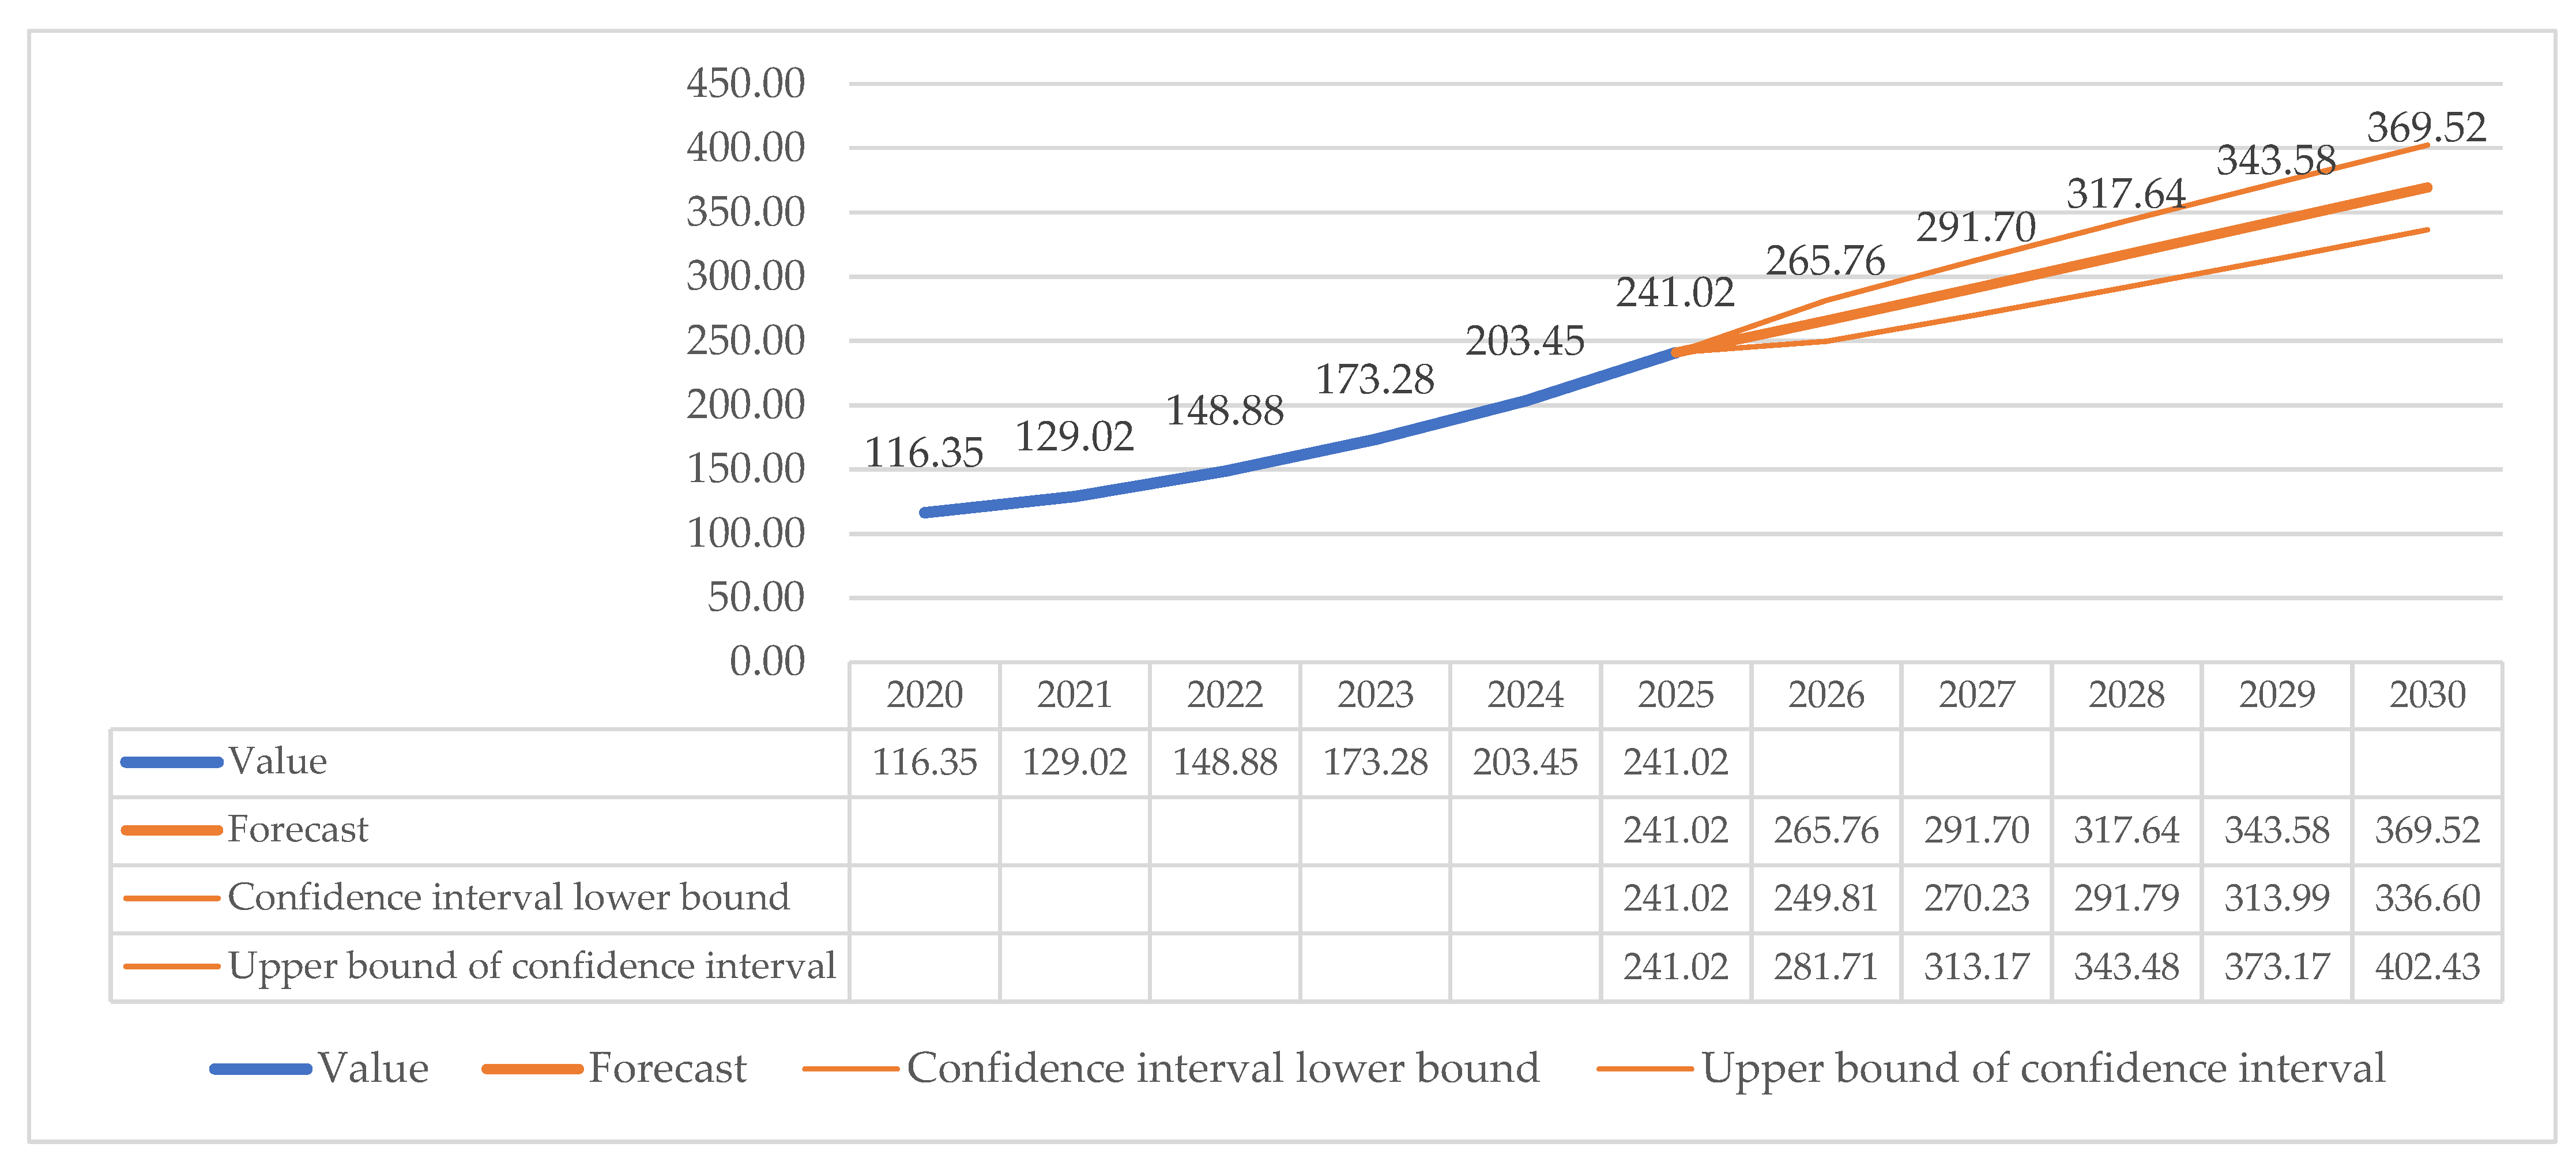
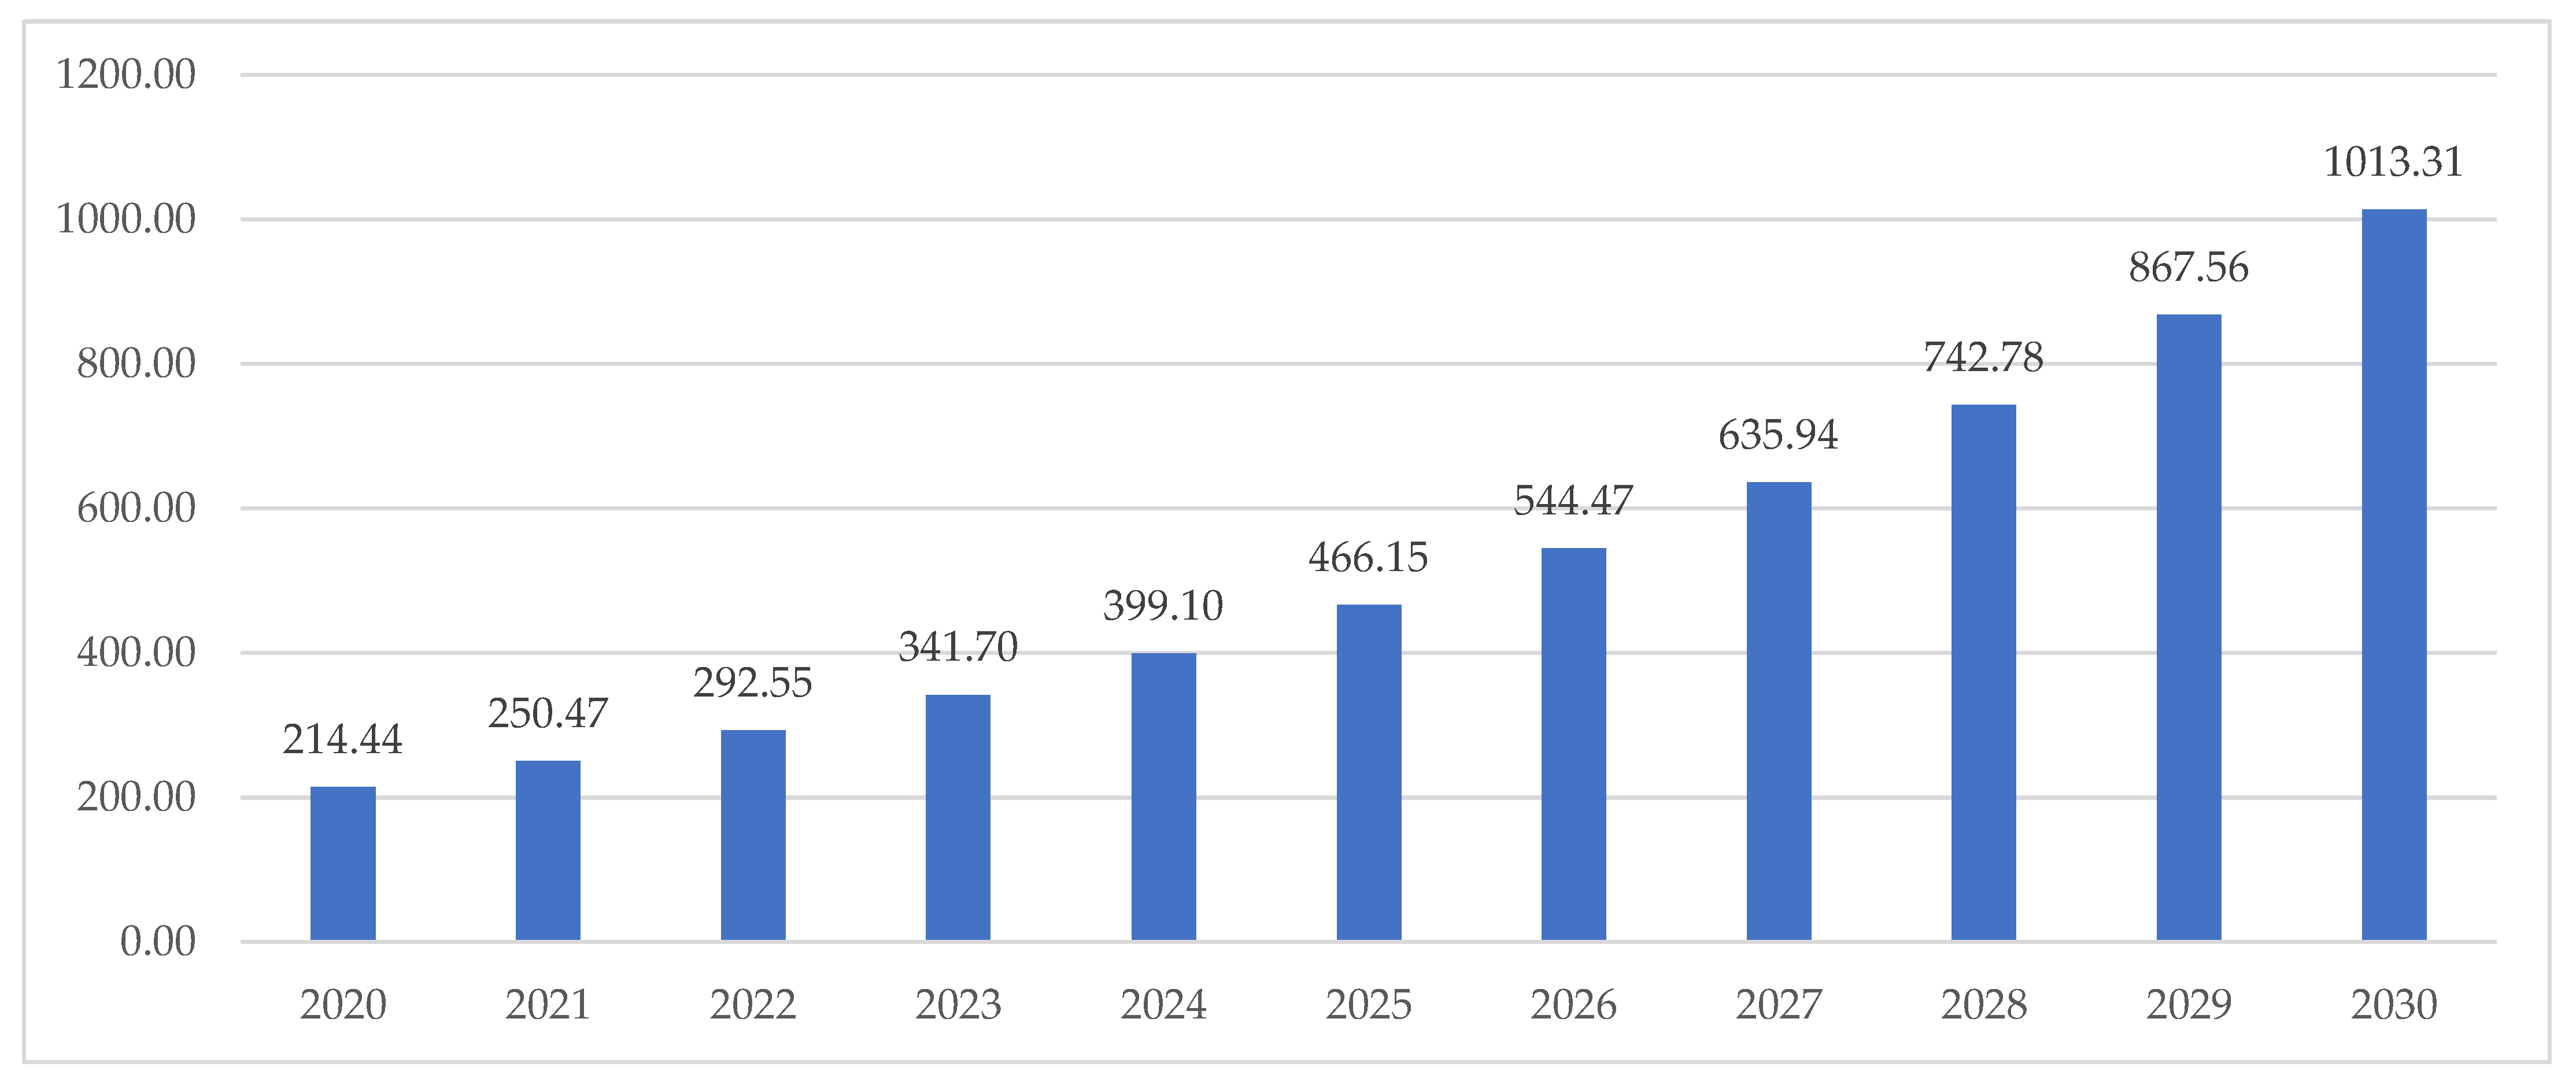
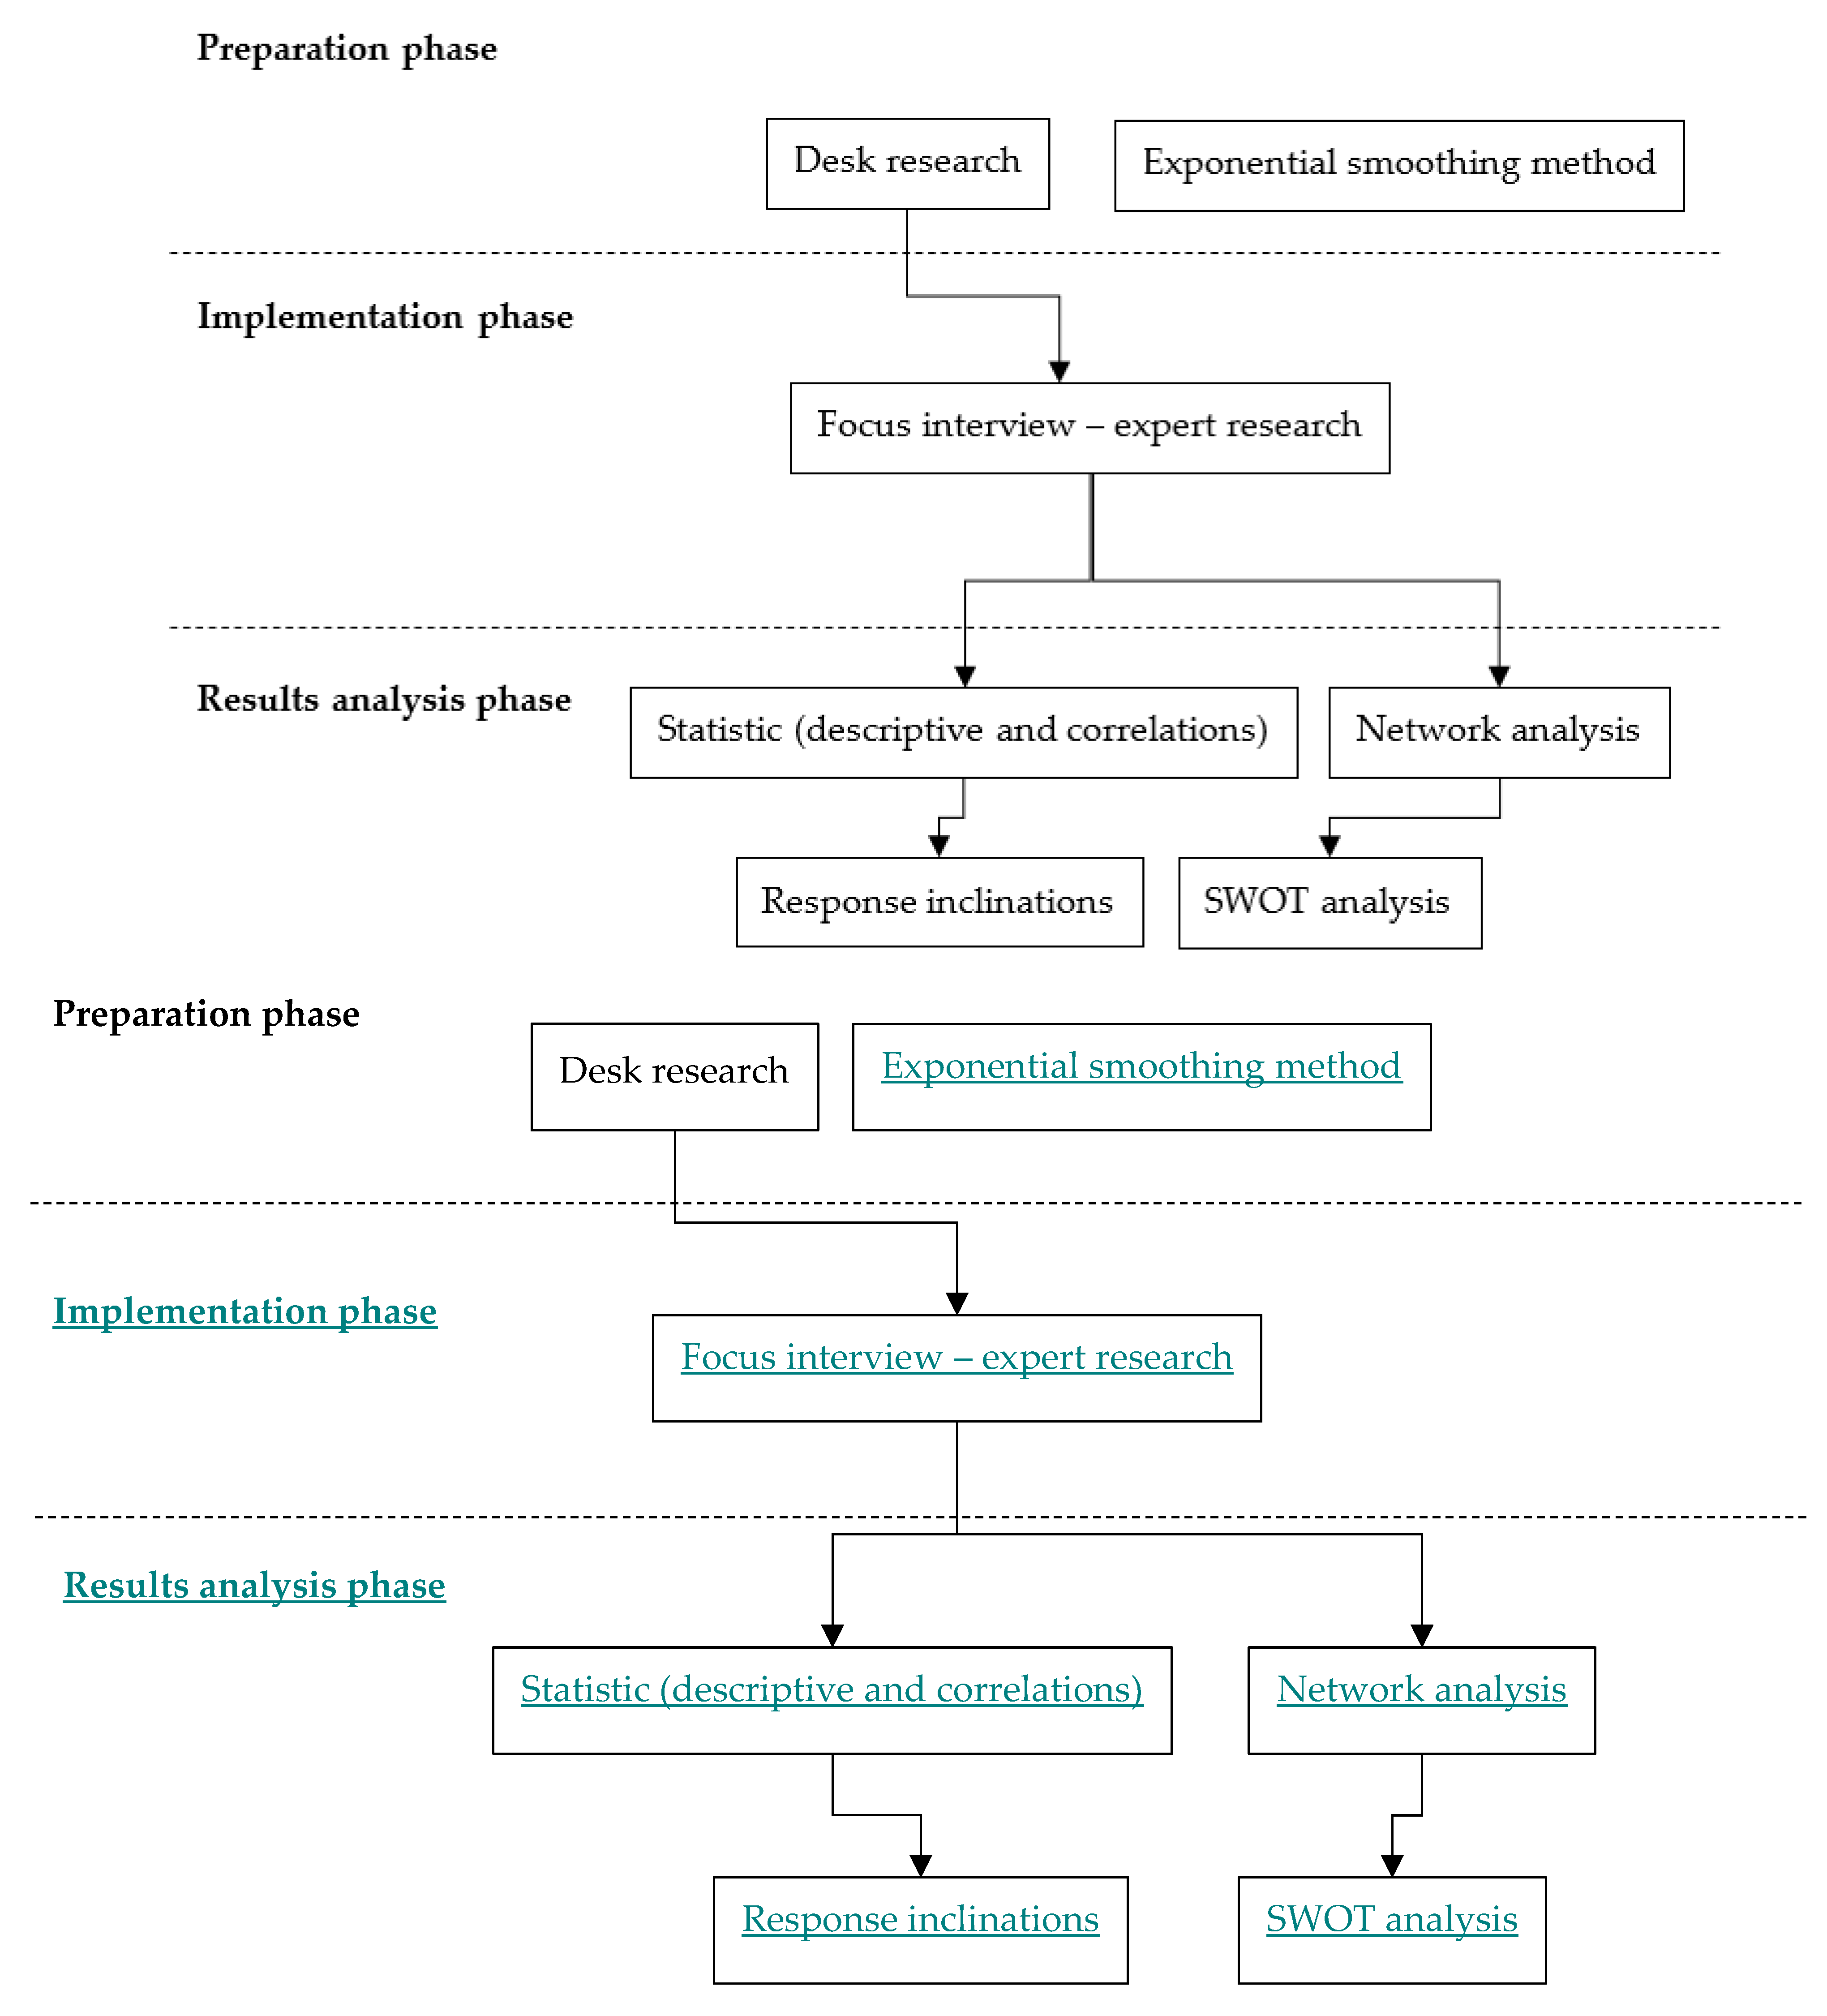
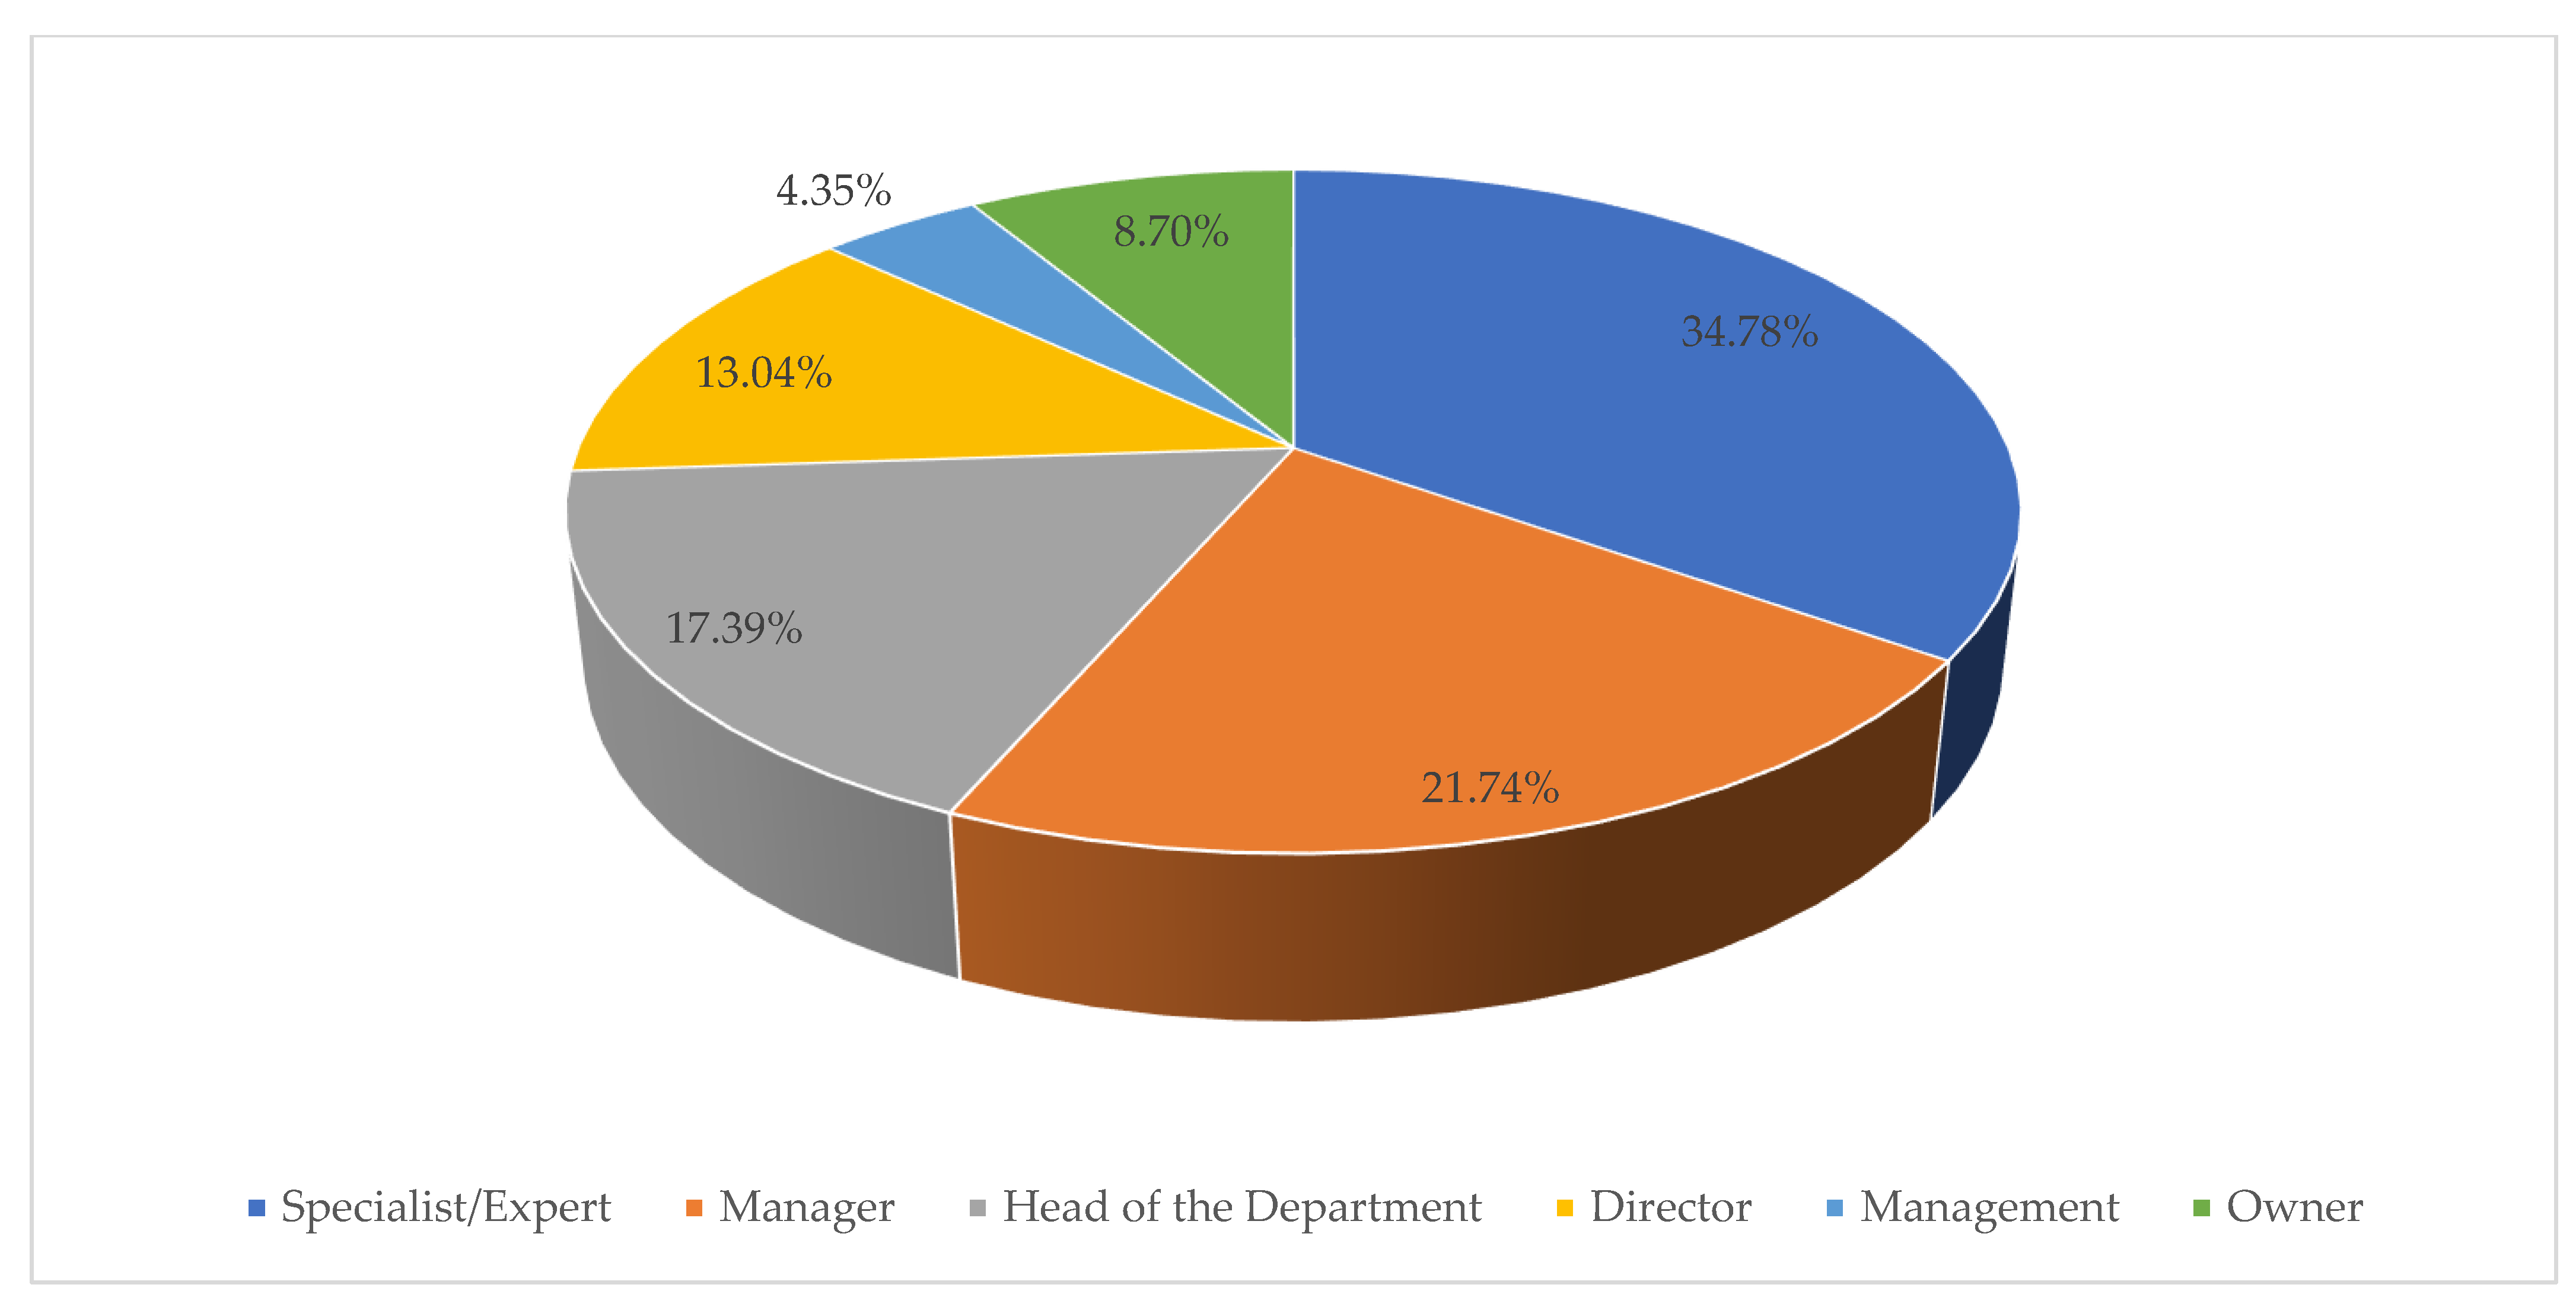
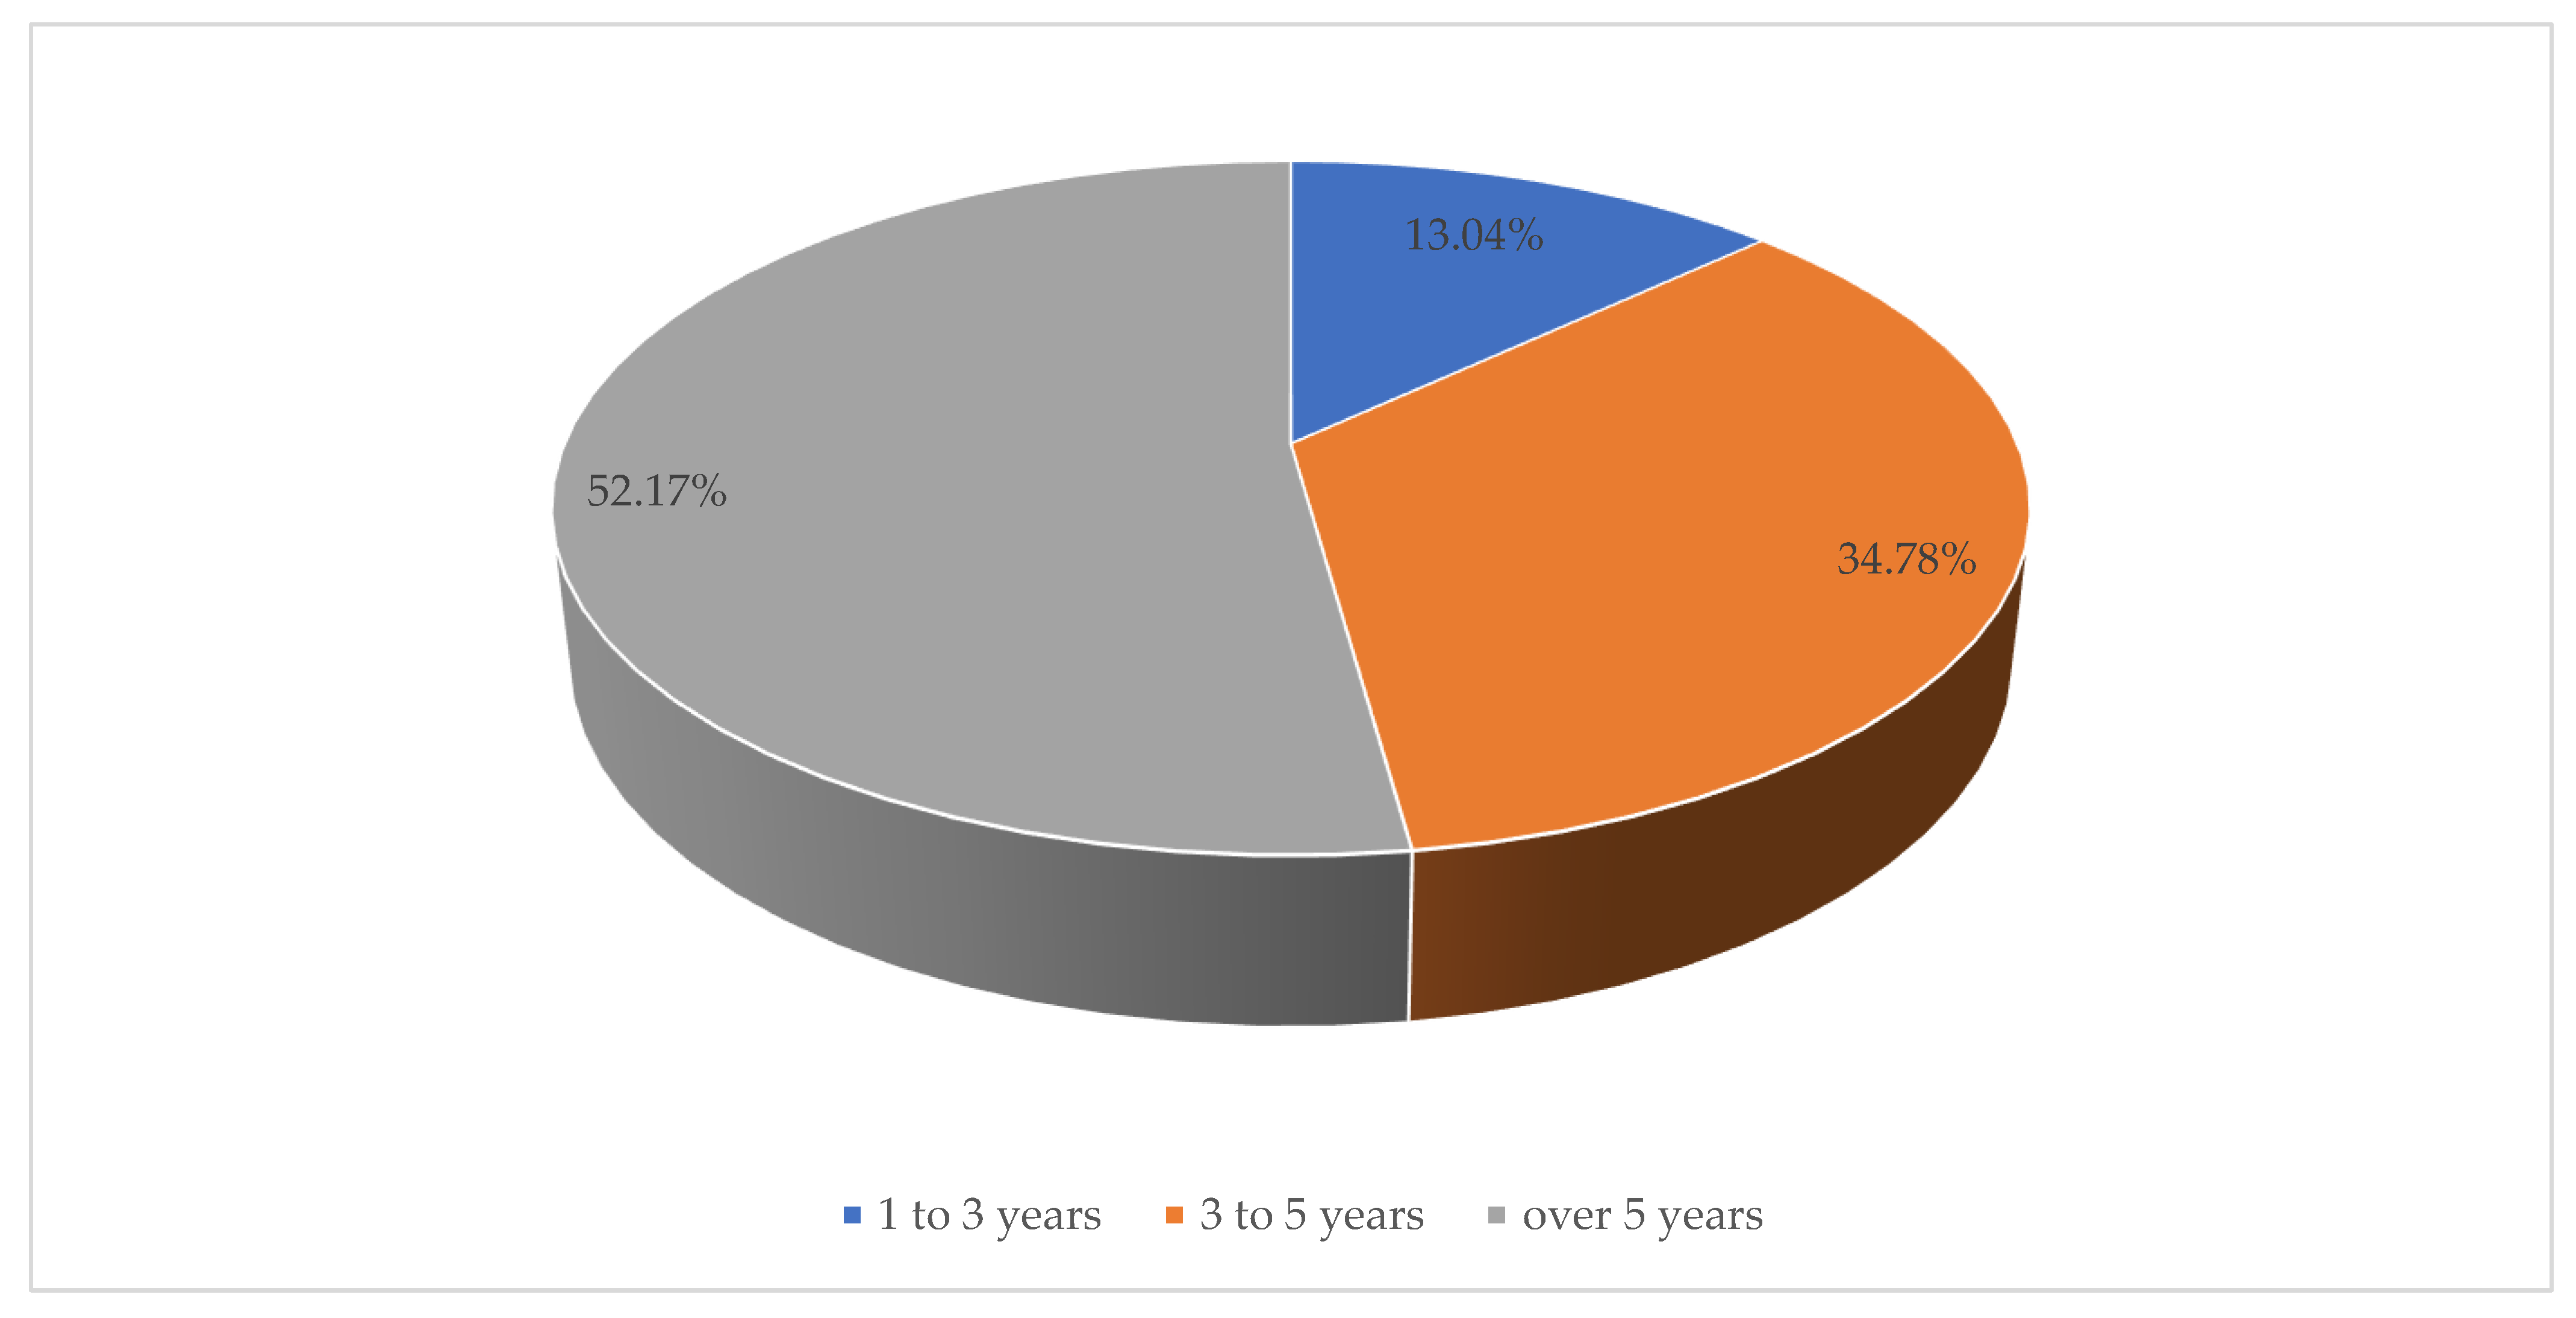
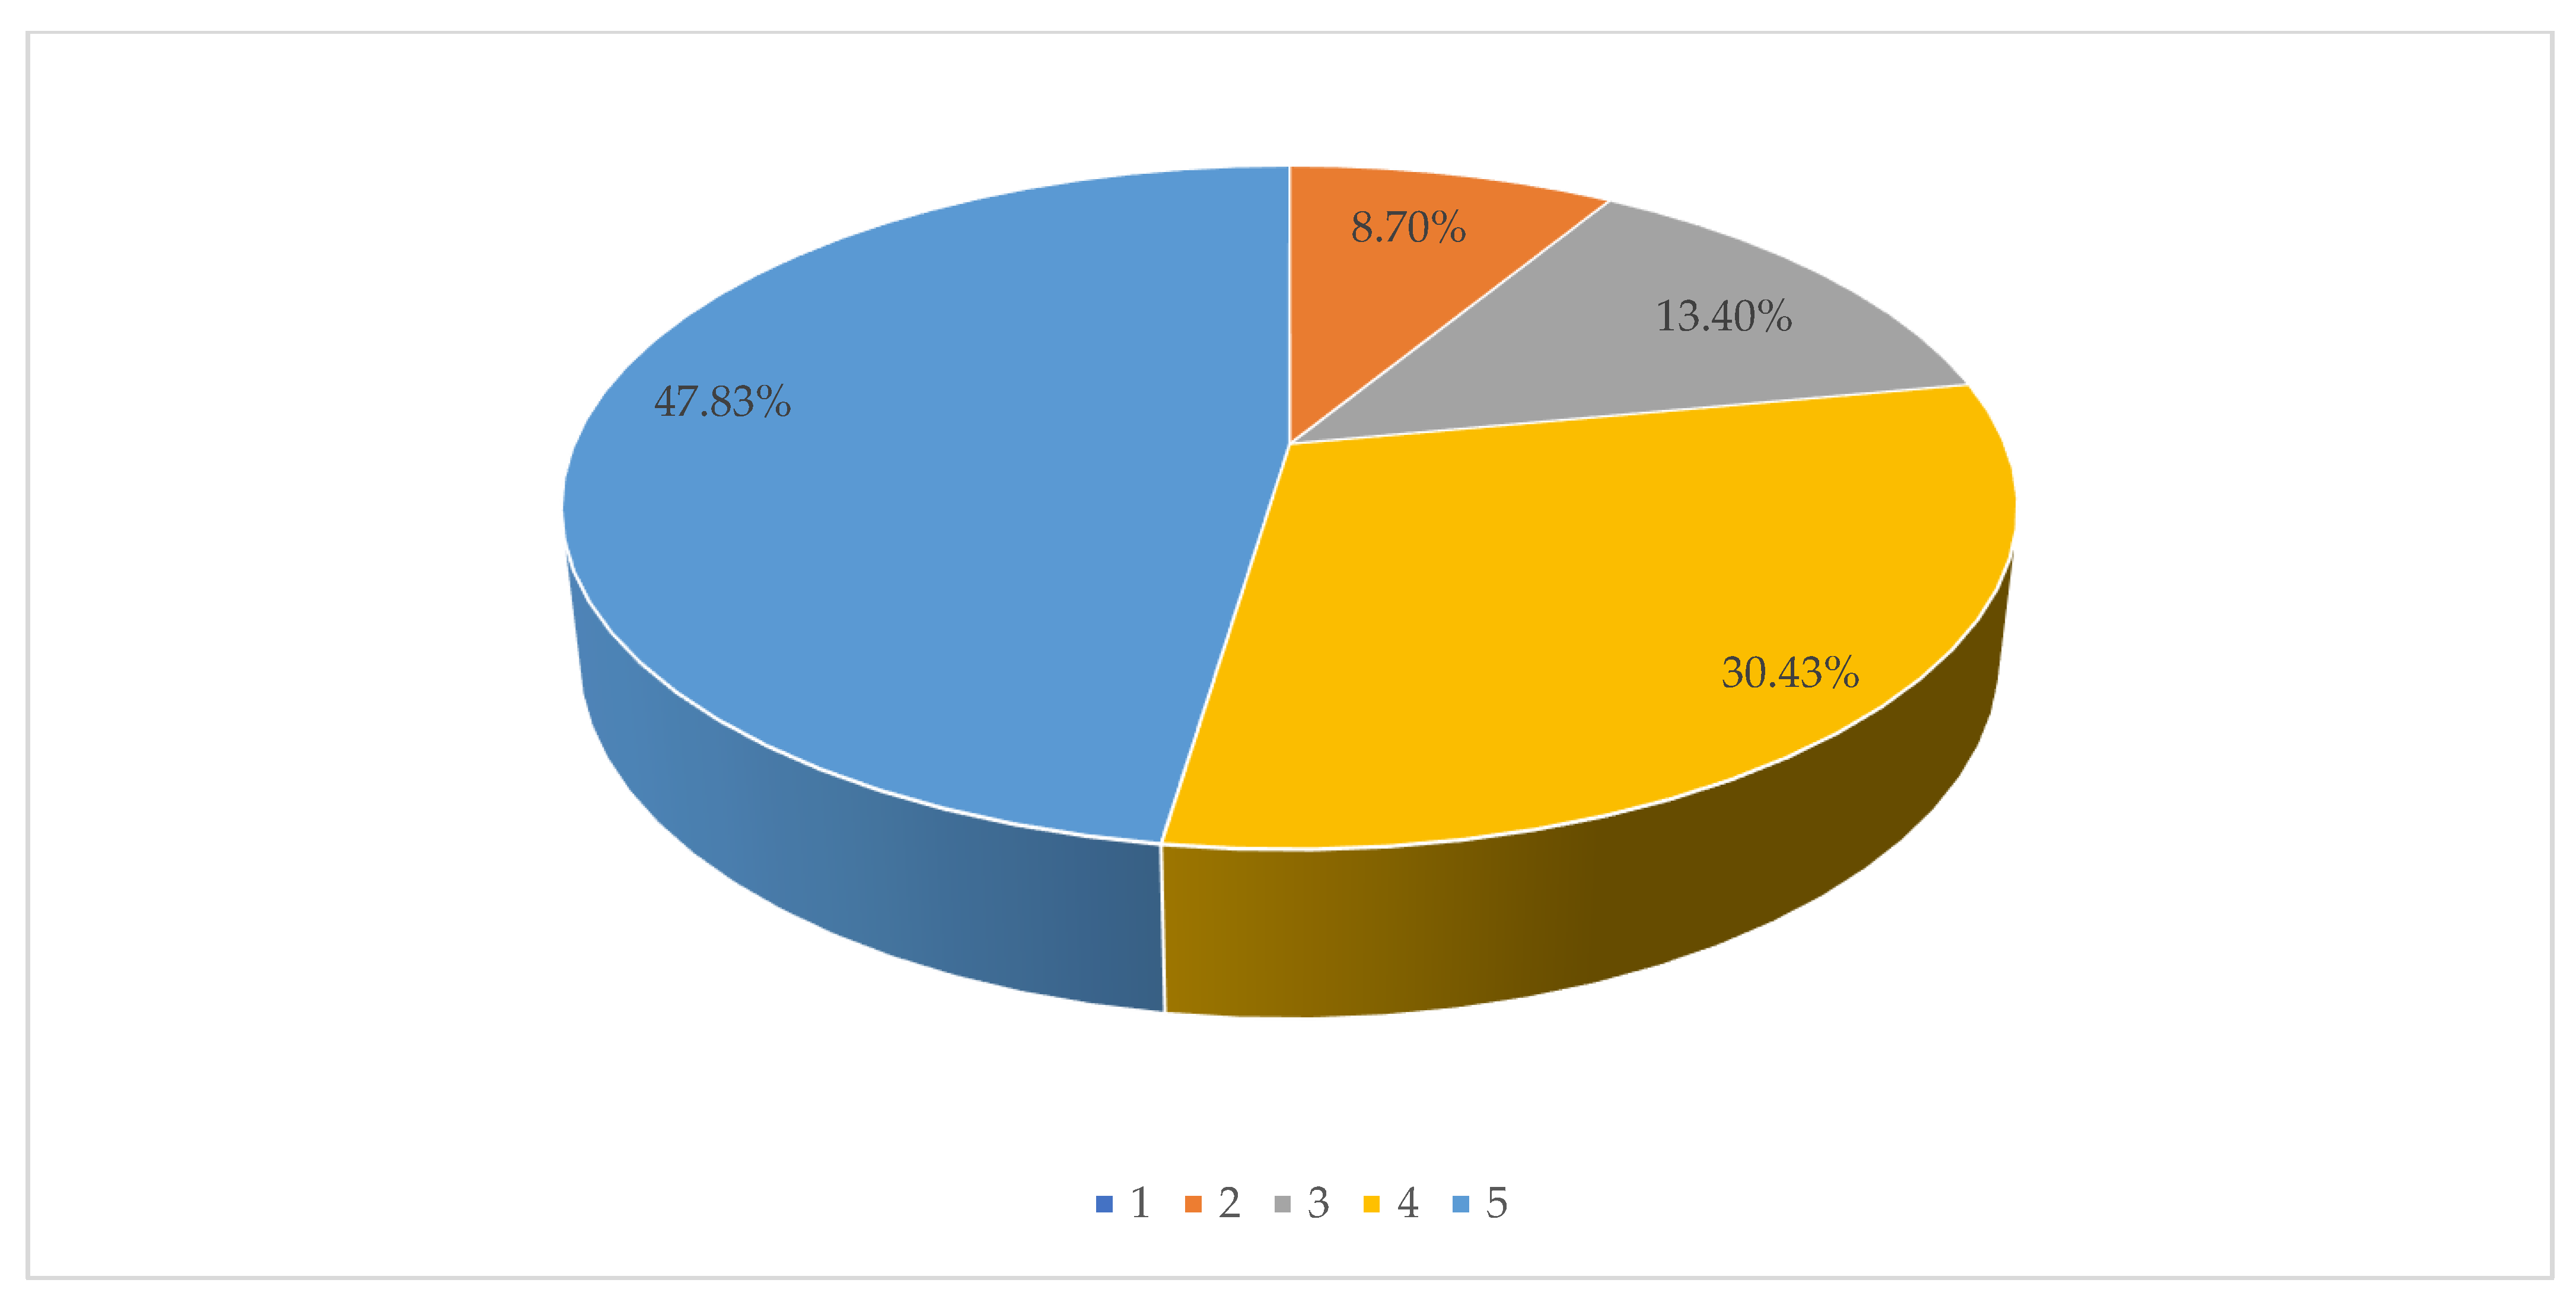
Table A1.
Calculations of the descriptive statistics of the fundamental development directions of a smart city in Poland based on expert opinion. Source: Own study.
Table A1.
Calculations of the descriptive statistics of the fundamental development directions of a smart city in Poland based on expert opinion. Source: Own study.
| Fundamental Development Directions | Average | Dominant | |||
|---|---|---|---|---|---|
| Green planning of public spaces | 1.83 | 2 | 3 | 0 | 3 |
| Smart health communities in cities | 2.00 | 2 | 3 | 0 | 3 |
| 15-min city | 1.87 | 2 | 3 | 0 | 3 |
| Mobility-smart and sustainable services | 1.83 | 1 | 3 | 0 | 3 |
| Inclusive and planned services | 1.43 | 1 | 3 | 0 | 3 |
| The city as an ecosystem of digital innovations | 2.00 | 2 | 3 | 0 | 3 |
| Circular economy and local production | 1.96 | 3 | 3 | 0 | 3 |
| Smart and sustainable buildings and infrastructure | 2.26 | 3 | 3 | 0 | 3 |
| Mass participation in the construction of the city development | 1.35 | 1 | 3 | 0 | 3 |
| AI-powered city operations | 2.09 | 2 | 3 | 1 | 2 |
| Cybersecurity and privacy awareness in the city | 1.87 | 1 | 3 | 0 | 3 |
| Supervision and policy predicated with the use of AI | 1.48 | 1 | 3 | 0 | 3 |
| Smart security | 1.57 | 1 | 3 | 0 | 3 |
| Smart energy | 2.17 | 3 | 3 | 1 | 2 |
| Smart mobility | 2.17 | 3 | 3 | 1 | 2 |
| Digital citizen | 1.43 | 2 | 3 | 0 | 3 |
| E-management | 1.35 | 0 | 3 | 0 | 3 |
| Advanced waste management | 1.74 | 1 | 3 | 0 | 3 |
| Advanced water management | 1.96 | 2 | 3 | 1 | 2 |
| Smart farming | 1.48 | 1 | 3 | 0 | 3 |
| Smart post-COVID city | 1.09 | 0 | 3 | 0 | 3 |
| Construction/energy passive districts, zero-emission construction | 1.00 | 1 | 1 | 1 | 0 |
Appendix B
Table A2.
Calculations of the descriptive statistics of the beneficial factors of a smart city in Poland based on expert opinion. Source: Own study.
Table A2.
Calculations of the descriptive statistics of the beneficial factors of a smart city in Poland based on expert opinion. Source: Own study.
| Beneficial Factors | Average | Dominant | |||
|---|---|---|---|---|---|
| Social | |||||
| Public provision of urban services | 1.74 | 1 | 3 | 0 | 3 |
| Innovative healthcare and sanitation facilities | 1.91 | 2 | 3 | 1 | 2 |
| Education directed to citizens development | 2.04 | 3 | 3 | 0 | 3 |
| Social responsibility, informed citizens | 2.00 | 2 | 3 | 0 | 3 |
| Community development, collectivism, volunteering networks | 1.70 | 2 | 3 | 0 | 3 |
| Participate and engaged citizens | 1.39 | 1 | 3 | 0 | 3 |
| Integration of migrants | 1.00 | 1 | 1 | 1 | 0 |
| Economic | |||||
| Innovation, urban lab, Research and Development (R&D) | 2.13 | 3 | 3 | 0 | 3 |
| Crowdsourcing | 1.35 | 1 | 3 | 0 | 3 |
| Knowledge and shared-based economy, portfolio-thinking | 1.96 | 2 | 3 | 0 | 3 |
| Sustainable management of resources, circular economy | 2.00 | 3 | 3 | 0 | 3 |
| Partnership formation, multisector synergies | 2.00 | 2 | 3 | 0 | 3 |
| Promotion of social and human capital | 1.74 | 1 | 3 | 0 | 3 |
| Workforce availability (skilled and non-skilled) | 1.91 | 2 | 3 | 0 | 3 |
| Attract and retain workforce, flexibility of the labour market | 1.87 | 1 | 3 | 0 | 3 |
| Environmental | |||||
| Energy related: renewable resources, saving initiatives, smart systems | 2.39 | 3 | 3 | 1 | 2 |
| Water related: monitoring quality, efficiency of water usage | 2.26 | 3 | 3 | 1 | 2 |
| Pollution prevention and reduction | 2.17 | 3 | 3 | 1 | 2 |
| Air pollution monitoring, emission control systems | 2.13 | 3 | 3 | 1 | 2 |
| Smart waste management | 1.78 | 1 | 3 | 0 | 3 |
| Recycling | 1.74 | 1 | 3 | 0 | 3 |
| Environmental projects and green initiatives | 2.00 | 3 | 3 | 1 | 2 |
| Quality of urban space, land use planning | 1.83 | 1 | 3 | 1 | 2 |
| Mobility related: efficient transport systems, cycle paths | 1.87 | 2 | 3 | 0 | 3 |
| Smart building, Responsive Building Envelope (RBE) | 2.39 | 3 | 3 | 1 | 2 |
| Construction resistant to climatic factors (droughts, floods, heat waves, etc.) | 1.00 | 1 | 1 | 1 | 0 |
| Governance | |||||
| Citizen empowerment, interactive and participatory services, co-production, co-creation, bottom–up approaches | 1.96 | 2 | 3 | 0 | 3 |
| Supportive government policies, political will and synergy | 1.74 | 2 | 3 | 0 | 3 |
| Urban planning: strategy and vision definition | 1.78 | 1 | 3 | 1 | 2 |
| Context adaptation, analysis of current situation, flexibility | 1.65 | 1 | 3 | 0 | 3 |
| Capacity planning (i.e., infrastructure, cost, and human resources) | 1.78 | 1 | 3 | 1 | 2 |
| Key Performance Indicators (KPIs) definition; monitoring/assessment | 1.91 | 2 | 3 | 1 | 2 |
| Collaborative decision-making; participatory governance models | 1.87 | 1 | 3 | 0 | 3 |
| Stakeholders’ engagement: internal (cross-sector), and external | 1.91 | 2 | 3 | 1 | 2 |
| Align and manage conflicts of interest | 1.70 | 2 | 3 | 0 | 3 |
| Data-driven decision-making and availability of real-time data | 1.61 | 1 | 3 | 0 | 3 |
| Urban proactiveness for service provision | 1.78 | 1 | 3 | 0 | 3 |
| Data governance: data quality, data sharing and data privacy policies | 1.52 | 1 | 3 | 0 | 3 |
| Strengthening the staffing of public administration | 1.00 | 1 | 1 | 1 | 0 |
| Urban Infrastructure | |||||
| Physical infrastructure integration | 1.52 | 2 | 3 | 0 | 3 |
| Affordable housing facilities such as water and energy supply | 2.35 | 3 | 3 | 1 | 2 |
| Adoption of innovative construction techniques | 2.00 | 3 | 3 | 1 | 2 |
| Connectivity, broadband, access to Internet facilities | 1.87 | 1 | 3 | 0 | 3 |
| Interoperability and integrated ICT | 1.74 | 2 | 3 | 0 | 3 |
| Security verification tools/systems | 1.65 | 2 | 3 | 0 | 3 |
| Advance ICT, intelligent technologies in urban services | 1.78 | 1 | 3 | 0 | 3 |
| Smart grid; intelligent energy management systems | 1.87 | 1 | 3 | 0 | 3 |
| Use of geographical information systems (GIS) | 1.57 | 1 | 3 | 0 | 3 |
| Data processing: modelling imperfect data; data exchange | 1.61 | 1 | 3 | 0 | 3 |
| Data analytic capacity; Business Intelligence (BI) | 1.48 | 1 | 3 | 0 | 3 |
| Internet of Things (IoT) | 1.91 | 2 | 3 | 1 | 2 |
| Big Data | 1.65 | 1 | 3 | 0 | 3 |
Appendix C
Table A3.
Calculations of the descriptive statistics of the adverse factors of a smart city in Poland based on expert opinion. Source: Own study.
Table A3.
Calculations of the descriptive statistics of the adverse factors of a smart city in Poland based on expert opinion. Source: Own study.
| Adverse Factors | Average | Dominant | |||
|---|---|---|---|---|---|
| Social | |||||
| Lack of citizen participation | −2.04 | −3 | 0 | −3 | 3 |
| Lack of trust | −2.04 | −3 | 0 | −3 | 3 |
| Lack of social awareness | −1.74 | −1 | 0 | −3 | 3 |
| Resistance to change | −1.74 | −1 | 0 | −3 | 3 |
| Social exclusion and gentrification | −1.57 | −1 | 0 | −3 | 3 |
| Unavailability of services for different communities | −1.43 | −2 | 0 | −3 | 3 |
| Lack of connection between technological and social infrastructure | −1.57 | −1 | 0 | −3 | 3 |
| Polish society is not very active and not very pro-social | −1.00 | −1 | −1 | −1 | 0 |
| Economic | |||||
| High cost of urban infrastructure, imbalance of investments | −2.39 | −3 | −1 | −3 | 2 |
| Lack of funding and investors; short time horizon of investments | −2.26 | −3 | −1 | −3 | 2 |
| Volatility of global economy | −1.87 | −2 | 0 | −3 | 3 |
| Mono-sectoral economy | −1.48 | −2 | 0 | −3 | 3 |
| Competitiveness (local against regional and international markets) | −1.61 | −2 | 0 | −3 | 3 |
| Unbalance between competitiveness and quality of life | −1.70 | −2 | 0 | −3 | 3 |
| Unemployment, lack of equity access to labour market | −1.70 | −2 | 0 | −3 | 3 |
| Lack of qualified human capital | −1.91 | −3 | 0 | −3 | 3 |
| Weak public–private partnership | −1.96 | −3 | 0 | −3 | 3 |
| Inefficiency of resource management | −1.74 | −1 | 0 | −3 | 3 |
| Environmental | |||||
| Climate change | −2.52 | −3 | 0 | −3 | 3 |
| Growing population, unbalance between liveability and environment | −2.26 | −2 | 0 | −3 | 3 |
| Increasing resource consumption | −2.30 | −3 | −1 | −3 | 2 |
| Resource scarcity, loss of biodiversity | −2.17 | −3 | −1 | −3 | 2 |
| Lack of resource sharing | −1.70 | −2 | 0 | −3 | 3 |
| Lack of holistic approach for environmental sustainability | −1.70 | −1 | 0 | −3 | 3 |
| Lack of knowledge on how ICT can decrease energy consumption | −1.48 | −1 | 0 | −3 | 3 |
| High level of air pollution | −1.91 | −2 | 0 | −3 | 3 |
| Inefficient waste management | −1.91 | −2 | −1 | −3 | 2 |
| Traffic density and inefficient public transport system | −1.96 | −2 | −1 | −3 | 2 |
| Governance | |||||
| Lack of planning; lack of vision and strategy | −2.17 | −2 | −1 | −3 | 2 |
| Lack of project management | −1.83 | −2 | −1 | −3 | 2 |
| Lack of capacity (HR) | −2.17 | −3 | −1 | −3 | 2 |
| Lack of IT knowledge among city planners | −1.91 | −2 | 0 | −3 | 3 |
| Lack of operational capability | −1.74 | −1 | −1 | −3 | 2 |
| Structure issues: complexity of organissational structures | −1.87 | −2 | 0 | −3 | 3 |
| Lack of alignment, conflicts of interest | −1.61 | −2 | 0 | −3 | 3 |
| Poor public–private partnership | −1.61 | −2 | 0 | −3 | 3 |
| Centralised decision-making process, top-down approach | −1.74 | −1 | 0 | −3 | 3 |
| Political instability and complexity | −1.83 | −1 | 0 | −3 | 3 |
| Lack of political will and support | −1.87 | −2 | 0 | −3 | 3 |
| Lack of transparency and trust | −1.61 | −2 | 0 | −3 | 3 |
| Lack of regulation and legislation | −1.57 | −1 | −1 | −3 | 2 |
| Inability of policies | −1.87 | −1 | −1 | −3 | 2 |
| Multiplicity of policies and programs | −1.48 | −1 | 0 | −3 | 3 |
| Staff shortages | −2.00 | −2 | −2 | −2 | 0 |
| Urban Infrastructure | |||||
| Urban infrastructure deterioration | −1.83 | −2 | −1 | −3 | 2 |
| Deficit of technological infrastructure | −1.96 | −2 | −1 | −3 | 2 |
| Lack of infrastructure integration, complexity of networks | −2.13 | −2 | −1 | −3 | 2 |
| Technological obsolescence, systems failures, infrastructure fragility | −2.17 | −3 | −1 | −3 | 2 |
| Lack of systems interoperability and lack of integration standards | −1.78 | −1 | 0 | −3 | 3 |
| Lack of systems security, privacy violation | −1.70 | −1 | 0 | −3 | 3 |
| Poor quality of ICT-based services | −1.61 | −1 | 0 | −3 | 3 |
Appendix D
Table A4.
Summary of responses to clusters based on the estimated dominant based on the opinion of the experts. Source: Own study.
Table A4.
Summary of responses to clusters based on the estimated dominant based on the opinion of the experts. Source: Own study.
| Cluster | Category | Factor | Dominant | |
|---|---|---|---|---|
| 1 | Fundamental development directions | Circular economy and local production | 3 | |
| 1 | Fundamental development directions | Smart and sustainable buildings and infrastructure | 3 | |
| 1 | Fundamental development directions | Smart energy | 3 | |
| 1 | Fundamental development directions | Smart mobility | 3 | |
| 1 | Beneficial | Social | Education directed to citizen development | 3 |
| 1 | Beneficial | Economic | Innovation, urban lab, Research and Development (R&D) | 3 |
| 1 | Beneficial | Economic | Sustainable management of resources, circular economy | 3 |
| 1 | Beneficial | Environmental | Energy related: renewable resources, saving initiatives, smart systems | 3 |
| 1 | Beneficial | Environmental | Water related: monitoring quality, efficiency of water usage | 3 |
| 1 | Beneficial | Environmental | Pollution prevention and reduction | 3 |
| 1 | Beneficial | Environmental | Air pollution monitoring, emission control systems | 3 |
| 1 | Beneficial | Environmental | Environmental projects and green initiatives | 3 |
| 1 | Beneficial | Environmental | Smart building, Responsive Building Envelope (RBE) | 3 |
| 1 | Beneficial | Urban Infrastructure | Affordable housing facilities such as water and energy supply | 3 |
| 1 | Beneficial | Urban Infrastructure | Adoption of innovative construction techniques | 3 |
| 1 | Adverse | Social | Lack of citizen participation | 3 |
| 1 | Adverse | Social | Lack of trust | 3 |
| 1 | Adverse | Economic | High cost of urban infrastructure, imbalance of investments | 3 |
| 1 | Adverse | Economic | Lack of funding and investors; short-time horizon of investments | 3 |
| 1 | Adverse | Economic | Lack of qualified human capital | 3 |
| 1 | Adverse | Economic | Weak public–private partnership | 3 |
| 1 | Adverse | Environmental | Climate change | 3 |
| 1 | Adverse | Environmental | Increasing resource consumption | 3 |
| 1 | Adverse | Environmental | Resource scarcity, loss of biodiversity | 3 |
| 1 | Adverse | Governance | Lack of capacity (HR) | 3 |
| 1 | Adverse | Urban Infrastructure | Technological obsolescence, systems failures, infrastructure fragility | 3 |
| 2 | Fundamental development directions | Green planning of public spaces | 2 | |
| 2 | Fundamental development directions | Smart health communities in cities | 2 | |
| 2 | Fundamental development directions | 15-min city | 2 | |
| 2 | Fundamental development directions | The city as an ecosystem of digital innovations | 2 | |
| 2 | Fundamental development directions | AI-powered city operations | 2 | |
| 2 | Fundamental development directions | Digital citizen | 2 | |
| 2 | Fundamental development directions | Advanced water management | 2 | |
| 2 | Beneficial | Social | Innovative health care and sanitation facilities | 2 |
| 2 | Beneficial | Social | Social responsibility, informed citizens | 2 |
| 2 | Beneficial | Social | Community development, collectivism, volunteering networks | 2 |
| 2 | Beneficial | Economic | Knowledge and shared-based economy, portfolio-thinking | 2 |
| 2 | Beneficial | Economic | Partnership formation, multisector synergies | 2 |
| 2 | Beneficial | Economic | Workforce availability (skilled and non-skilled) | 2 |
| 2 | Beneficial | Environmental | Mobility related: efficient transport systems, cycle paths | 2 |
| 2 | Beneficial | Governance | Citizen empowerment, interactive, and participatory services, co-production, co-creation, bottom-up approaches | 2 |
| 2 | Beneficial | Governance | Supportive government policies, political will, and synergy | 2 |
| 2 | Beneficial | Governance | Key Performance Indicators (KPIs) definition; monitoring/assessment | 2 |
| 2 | Beneficial | Governance | Stakeholders’ engagement: internal (cross-sector), and external | 2 |
| 2 | Beneficial | Governance | Align and manage conflicts of interests | 2 |
| 2 | Beneficial | Urban Infrastructure | Physical infrastructure integration | 2 |
| 2 | Beneficial | Urban Infrastructure | Interoperability and integrated ICT | 2 |
| 2 | Beneficial | Urban Infrastructure | Security verification tools/systems | 2 |
| 2 | Beneficial | Urban Infrastructure | Internet of Things (IoT) | 2 |
| 2 | Adverse | Social | Unavailability of services for different communities | 2 |
| 2 | Adverse | Economic | Volatility of global economy | 2 |
| 2 | Adverse | Economic | Mono-sectoral economy | 2 |
| 2 | Adverse | Economic | Competitiveness (local against regional and international markets) | 2 |
| 2 | Adverse | Economic | Imbalance between competitiveness and quality of life | 2 |
| 2 | Adverse | Economic | Unemployment, lack of equity access to labour market | 2 |
| 2 | Adverse | Environmental | Growing population, unbalance between liveability and environment | 2 |
| 2 | Adverse | Environmental | Lack of resource sharing | 2 |
| 2 | Adverse | Environmental | High level of air pollution | 2 |
| 2 | Adverse | Environmental | Inefficient waste management | 2 |
| 2 | Adverse | Environmental | Traffic density and inefficient public transport system | 2 |
| 2 | Adverse | Governance | Lack of planning; lack of vision and strategy | 2 |
| 2 | Adverse | Governance | Lack of project management | 2 |
| 2 | Adverse | Governance | Lack of IT knowledge among city planners | 2 |
| 2 | Adverse | Governance | Structure issues: complexity of organisational structures | 2 |
| 2 | Adverse | Governance | Lack of alignment, conflicts of interest | 2 |
| 2 | Adverse | Governance | Poor public–private partnership | 2 |
| 2 | Adverse | Governance | Lack of political will and support | 2 |
| 2 | Adverse | Governance | Lack of transparency and trust | 2 |
| 2 | Adverse | Urban Infrastructure | Urban infrastructure deterioration | 2 |
| 2 | Adverse | Urban Infrastructure | Deficit of technological infrastructure | 2 |
| 2 | Adverse | Urban Infrastructure | Lack of infrastructure integration, complexity of networks | 2 |
| 3 | Fundamental development directions | Mobility-smart and sustainable services | 1 | |
| 3 | Fundamental development directions | Inclusive and planned services | 1 | |
| 3 | Fundamental development directions | Mass participation in the construction of the city development | 1 | |
| 3 | Fundamental development directions | Cybersecurity and privacy awareness in the city | 1 | |
| 3 | Fundamental development directions | Supervision and policy predicated with the use of AI | 1 | |
| 3 | Fundamental development directions | Smart security | 1 | |
| 3 | Fundamental development directions | Advanced waste management | 1 | |
| 3 | Fundamental development directions | Smart farming | 1 | |
| 3 | Beneficial | Social | Public provision of urban services | 1 |
| 3 | Beneficial | Social | Participate and engaged citizens | 1 |
| 3 | Beneficial | Economic | Crowdsourcing | 1 |
| 3 | Beneficial | Economic | Promotion of social and human capital | 1 |
| 3 | Beneficial | Economic | Attract and retain workforce, flexibility of the labour market | 1 |
| 3 | Beneficial | Environmental | Smart waste management | 1 |
| 3 | Beneficial | Environmental | Recycling | 1 |
| 3 | Beneficial | Environmental | Quality of urban space, land use planning | 1 |
| 3 | Beneficial | Governance | Urban planning: strategy and vision definition | 1 |
| 3 | Beneficial | Governance | Context adaptation, analysis of current situation, flexibility | 1 |
| 3 | Beneficial | Governance | Capacity planning (i.e., infrastructure, cost, and human resources) | 1 |
| 3 | Beneficial | Governance | Collaborative decision-making; participatory governance models | 1 |
| 3 | Beneficial | Governance | Data-driven decision-making and availability of real-time data | 1 |
| 3 | Beneficial | Governance | Urban proactiveness for service provision | 1 |
| 3 | Beneficial | Governance | Data governance: data quality, data sharing, and data privacy policies | 1 |
| 3 | Beneficial | Urban Infrastructure | Connectivity, broadband, access to Internet facilities | 1 |
| 3 | Beneficial | Urban Infrastructure | Advance ICT, intelligent technologies in urban services | 1 |
| 3 | Beneficial | Urban Infrastructure | Smart grid; intelligent energy management systems | 1 |
| 3 | Beneficial | Urban Infrastructure | Use of geographical information systems (GIS) | 1 |
| 3 | Beneficial | Urban Infrastructure | Data processing: modelling imperfect data; data exchange | 1 |
| 3 | Beneficial | Urban Infrastructure | Data analytic capacity; Business Intelligence (BI) | 1 |
| 3 | Beneficial | Urban Infrastructure | Big Data | 1 |
| 3 | Adverse | Social | Lack of social awarenessBariery społeczne [Brak świadomości społecznej] | 1 |
| 3 | Adverse | Social | Resistance to change | 1 |
| 3 | Adverse | Social | Social exclusion and gentrification | 1 |
| 3 | Adverse | Social | Lack of connection between technological and social infrastructure | 1 |
| 3 | Adverse | Economic | Inefficiency of resource management | 1 |
| 3 | Adverse | Environmental | Lack of holistic approach for environmental sustainability | 1 |
| 3 | Adverse | Environmental | Lack of knowledge on how ICT can decrease energy consumption | 1 |
| 3 | Adverse | Governance | Lack of operational capability | 1 |
| 3 | Adverse | Governance | Centralised decision-making process, top–down approach | 1 |
| 3 | Adverse | Governance | Political instability and complexity | 1 |
| 3 | Adverse | Governance | Lack of regulation and legislation | 1 |
| 3 | Adverse | Governance | Inability of policies | 1 |
| 3 | Adverse | Governance | Multiplicity of policies and programs | 1 |
| 3 | Adverse | Urban Infrastructure | Lack of systems interoperability and lack of integration standards | 1 |
| 3 | Adverse | Urban Infrastructure | Lack of systems security, privacy violation | 1 |
| 3 | Adverse | Urban Infrastructure | Poor quality of ICT-based services | 1 |
| 4 | Fundamental development directions | E-management | 0 | |
| 4 | Fundamental development directions | Smart post-COVID city | 0 | |
Appendix E
Table A5.
Correlation analysis with Pearson’s r coefficient. Source: Own study.
| 1 | 2 | 3 | 4 | 5 | 6 | 7 | 8 | 9 | ||||||||||
|---|---|---|---|---|---|---|---|---|---|---|---|---|---|---|---|---|---|---|
| r | p | r | p | r | p | r | p | r | p | r | p | r | p | r | p | r | p | |
| Beneficial factors | ||||||||||||||||||
| 1. Social | ||||||||||||||||||
| 2. Economic | 0.76 | <0.001 | ||||||||||||||||
| 3. Environmental | 0.71 | <0.001 | 0.65 | 0.001 | ||||||||||||||
| 4. Governance | 0.76 | <0.001 | 0.74 | <0.001 | 0.61 | 0.002 | ||||||||||||
| 5. Urban infrastructure | 0.74 | <0.001 | 0.65 | 0.001 | 0.58 | 0.004 | 0.83 | <0.001 | ||||||||||
| Adverse factors | ||||||||||||||||||
| 6. Social | 0.73 | <0.001 | 0.62 | 0.002 | 0.74 | <0.001 | 0.63 | 0.001 | 0.77 | <0.001 | ||||||||
| 7. Economic | 0.70 | <0.001 | 0.72 | <0.001 | 0.74 | <0.001 | 0.75 | <0.001 | 0.71 | <0.001 | 0.79 | <0.001 | ||||||
| 8. Environmental | 0.57 | 0.005 | 0.39 | 0.067 | 0.51 | 0.012 | 0.56 | 0.005 | 0.61 | 0.002 | 0.78 | <0.001 | 0.69 | <0.001 | ||||
| 9. Governance | 0.73 | <0.001 | 0.67 | <0.001 | 0.66 | 0.001 | 0.81 | <0.001 | 0.78 | <0.001 | 0.70 | <0.001 | 0.84 | <0.001 | 0.78 | <0.001 | ||
| 10. Urban infrastructure | 0.40 | 0.060 | 0.39 | 0.065 | 0.44 | 0.035 | 0.57 | 0.004 | 0.62 | 0.002 | 0.62 | 0.001 | 0.59 | 0.003 | 0.77 | <0.001 | 0.61 | 0.002 |
r—Pearson’s correlation coefficient; p—p value for correlation analyses. Variables that were included in the correlation analysis were general indicators of the beneficial and adverse factors (they were constructed by averaging items for each category).
Appendix F
Table A6.
Correlation analysis with Spearman’s rho coefficient. Source: Own study.
| 1 | 2 | 3 | 4 | 5 | 6 | 7 | 8 | 9 | ||||||||||
|---|---|---|---|---|---|---|---|---|---|---|---|---|---|---|---|---|---|---|
| rho | p | rho | p | rho | p | rho | p | rho | p | rho | p | rho | p | rho | p | rho | p | |
| Beneficial factors | ||||||||||||||||||
| 1. Social | ||||||||||||||||||
| 2. Economic | 0.69 | <0.001 | ||||||||||||||||
| 3. Environmental | 0.68 | <0.001 | 0.64 | 0.001 | ||||||||||||||
| 4. Governance | 0.68 | <0.001 | 0.73 | <0.001 | 0.54 | 0.008 | ||||||||||||
| 5. Urban infrastructure | 0.66 | 0.001 | 0.58 | 0.003 | 0.49 | 0.018 | 0.78 | <0.001 | ||||||||||
| Adverse factors | ||||||||||||||||||
| 6. Social | 0.71 | <0.001 | 0.57 | 0.004 | 0.68 | <0.001 | 0.65 | 0.001 | 0.80 | <0.001 | ||||||||
| 7. Economic | 0.59 | 0.003 | 0.65 | 0.001 | 0.67 | <0.001 | 0.69 | <0.001 | 0.60 | 0.002 | 0.70 | <0.001 | ||||||
| 8. Environmental | 0.50 | 0.016 | 0.36 | 0.091 | 0.45 | 0.030 | 0.52 | 0.010 | 0.57 | 0.005 | 0.73 | <0.001 | 0.62 | 0.002 | ||||
| 9. Governance | 0.68 | <0.001 | 0.66 | 0.001 | 0.57 | 0.004 | 0.69 | <0.001 | 0.68 | <0.001 | 0.65 | 0.001 | 0.81 | <0.001 | 0.67 | <0.001 | ||
| 10. Urban infrastructure | 0.26 | 0.229 | 0.31 | 0.153 | 0.34 | 0.110 | 0.47 | 0.025 | 0.58 | 0.004 | 0.52 | 0.010 | 0.53 | 0.010 | 0.73 | <0.001 | 0.47 | 0.025 |
rho—Spearman’s correlation coefficient; p—p value for correlation analyses. Variables that were included in the correlation analysis were general indicators of the beneficial and adverse factors (they were constructed by averaging items for each category).
Appendix G
Table A7.
List of scoring of smart city fundamental development directions in Poland based on expert opinion. Source: Own study.
Table A7.
List of scoring of smart city fundamental development directions in Poland based on expert opinion. Source: Own study.
| Fundamental Development Directions | Betweenness Indicator | Accumulated Vector Value |
|---|---|---|
| Green planning of public spaces | 0.000133 | 43.000000 |
| Smart health communities in cities | 0.000116 | 47.000000 |
| 15-min city | 0.000136 | 44.000000 |
| Mobility-smart and sustainable services | 0.000133 | 43.000000 |
| Inclusive and planned services | 0.000107 | 34.000000 |
| The city as an ecosystem of digital innovations | 0.000137 | 47.000000 |
| Circular economy and local production | 0.000133 | 46.000000 |
| Smart and sustainable buildings and infrastructure | 0.000133 | 53.000000 |
| Mass participation in the construction of the city development | 0.000081 | 32.000000 |
| AI-powered city operations | 0.000141 | 49.000000 |
| Cybersecurity and privacy awareness in the city | 0.000130 | 44.000000 |
| Supervision and policy predicated with the use of AI | 0.000103 | 35.000000 |
| Smart security | 0.000115 | 37.000000 |
| Smart energy | 0.000141 | 51.000000 |
| Smart mobility | 0.000141 | 51.000000 |
| Digital citizen | 0.000095 | 34.000000 |
| E-management | 0.000076 | 32.000000 |
| Advanced waste management | 0.000127 | 41.000000 |
| Advanced water management | 0.000141 | 46.000000 |
| Smart farming | 0.000109 | 35.000000 |
| Smart post-COVID city | 0.000052 | 26.000000 |
| Construction/energy passive districts, zero-emission construction | 0.000000 | 2.000000 |
Appendix H
Table A8.
Cumulative list of scoring for the beneficial factors of the development of smart cities in Poland based on expert opinion. Source: Own study.
Table A8.
Cumulative list of scoring for the beneficial factors of the development of smart cities in Poland based on expert opinion. Source: Own study.
| Beneficial Factors | Betweenness Indicator | Accumulated Vector Value |
|---|---|---|
| Social | ||
| Public provision of urban services | 0.000135 | 41.000000 |
| Innovative health care and sanitation facilities | 0.000141 | 45.000000 |
| Education directed to citizen development | 0.000135 | 48.000000 |
| Social responsibility, informed citizens | 0.000127 | 47.000000 |
| Community development, collectivism, volunteering networks | 0.000121 | 40.000000 |
| Participate and engaged citizens | 0.000115 | 33.000000 |
| Integration of migrants | 0.0000000 | 1.0000000 |
| Economic | ||
| Innovation, urban lab, Research and Development (R&D) | 0.000126 | 50.000000 |
| Crowdsourcing | 0.000093 | 32.000000 |
| Knowledge and shared-based economy, portfolio-thinking | 0.000130 | 46.000000 |
| Sustainable management of resources, circular economy | 0.000127 | 47.000000 |
| Partnership formation, multisector synergies | 0.000130 | 47.000000 |
| Promotion of social and human capital | 0.000112 | 41.000000 |
| Workforce availability (skilled and non-skilled) | 0.000135 | 45.000000 |
| Attract and retain workforce, flexibility of the labour market | 0.000130 | 44.000000 |
| Environmental | ||
| Energy related: renewable resources, saving initiatives, smart systems | 0.000141 | 56.000000 |
| Water related: monitoring quality, efficiency of water usage | 0.000141 | 53.000000 |
| Pollution prevention and reduction | 0.000141 | 51.000000 |
| Air pollution monitoring, emission control systems | 0.000141 | 50.000000 |
| Smart waste management | 0.000134 | 42.000000 |
| Recycling | 0.000134 | 41.000000 |
| Environmental projects and green initiatives | 0.000141 | 47.000000 |
| Quality of urban space, land use planning | 0.000141 | 43.000000 |
| Mobility related: efficient transport systems, cycle paths | 0.000130 | 44.000000 |
| Smart building, Responsive Building Envelope (RBE) | 0.000141 | 56.000000 |
| Construction resistant to climatic factors (droughts, floods, heat waves, etc.) | 0.0000000 | 1.0000000 |
| Governance | ||
| Citizen empowerment, interactive and participatory services, co-production, co-creation, bottom–up approaches | 0.000130 | 46.000000 |
| Supportive government policies, political will and synergy | 0.000136 | 41.000000 |
| Urban planning: strategy and vision definition | 0.000141 | 42.000000 |
| Context adaptation, analysis of current situation, flexibility | 0.000116 | 39.000000 |
| Capacity planning (i.e., infrastructure, cost, and human resources) | 0.000141 | 42.000000 |
| Key Performance Indicators (KPIs) definition; monitoring/assessment | 0.000141 | 45.000000 |
| Collaborative decision-making; participatory governance models | 0.000137 | 44.000000 |
| Stakeholders’ engagement: internal (cross-sector), and external | 0.000141 | 45.000000 |
| Align and manage conflicts of interest | 0.000095 | 40.000000 |
| Data-driven decision-making and availability of real-time data | 0.000109 | 38.000000 |
| Urban proactiveness for service provision | 0.000131 | 42.000000 |
| Data governance: data quality, data sharing, and data privacy policies | 0.000103 | 36.000000 |
| Strengthening the staffing of public administration | 0.0000000 | 1.0000000 |
| Urban Infrastructure | ||
| Physical infrastructure integration | 0.000115 | 36.000000 |
| Affordable housing facilities such as water and energy supply | 0.000141 | 55.000000 |
| Adoption of innovative construction techniques | 0.000141 | 47.000000 |
| Connectivity, broadband, access to Internet facilities | 0.000127 | 44.000000 |
| Interoperability and integrated ICT | 0.000127 | 41.000000 |
| Security verification tools/systems | 0.000103 | 39.000000 |
| Advance ICT, intelligent technologies in urban services | 0.000129 | 42.000000 |
| Smart grid; intelligent energy management systems | 0.000129 | 44.000000 |
| Use of geographical information systems (GIS) | 0.000118 | 37.000000 |
| Data processing: modelling imperfect data; data exchange | 0.000118 | 38.000000 |
| Data analytic capacity; Business Intelligence (BI) | 0.000112 | 35.000000 |
| Internet of Things (IoT) | 0.000141 | 45.000000 |
| Big Data | 0.000129 | 39.000000 |
Appendix I
Table A9.
Cumulative list of scoring for the adverse factors of the development of smart cities in Poland based on expert opinion. Source: Own study.
Table A9.
Cumulative list of scoring for the adverse factors of the development of smart cities in Poland based on expert opinion. Source: Own study.
| Adverse Factors | Betweenness Indicator | Accumulated Vector Value |
|---|---|---|
| Social | ||
| Lack of citizen participation | 0.000130 | −46.000000 |
| Lack of trust | 0.000130 | −46.000000 |
| Lack of social awareness | 0.000130 | −39.000000 |
| Resistance to change | 0.000120 | −39.000000 |
| Social exclusion and gentrification | 0.000122 | −35.000000 |
| Unavailability of services for different communities | 0.000119 | −35.000000 |
| Lack of connection between technological and social infrastructure | 0.000119 | −35.000000 |
| Polish society is not very active and not very pro-social | 0.000000 | −1.0000000 |
| Economic | ||
| High cost of urban infrastructure, imbalance of investments | 0.000141 | −54.000000 |
| Lack of funding and investors; short-time horizon of investments | 0.000141 | −51.000000 |
| Volatility of global economy | 0.000122 | −42.000000 |
| Mono-sectoral economy | 0.000104 | −33.000000 |
| Competitiveness (local against regional and international markets) | 0.000127 | −36.000000 |
| Imbalance between competitiveness and quality of life | 0.000130 | −38.000000 |
| Unemployment, lack of equity access to labour market | 0.000136 | −38.000000 |
| Lack of qualified human capital | 0.000130 | −43.000000 |
| Weak public–private partnership | 0.000130 | −44.000000 |
| Inefficiency of resource management | 0.000109 | −39.000000 |
| Environmental | ||
| Climate change | 0.000136 | −57.000000 |
| Growing population, imbalance between liveability and environment | 0.000136 | −51.000000 |
| Increasing resource consumption | 0.000141 | −52.000000 |
| Resource scarcity, loss of biodiversity | 0.000141 | −49.000000 |
| Lack of resource sharing | 0.000107 | −38.000000 |
| Lack of holistic approach for environmental sustainability | 0.000121 | −38.000000 |
| Lack of knowledge on how ICT can decrease energy consumption | 0.000106 | −33.000000 |
| High level of air pollution | 0.000134 | −43.000000 |
| Inefficient waste management | 0.000141 | −43.000000 |
| Traffic density and inefficient public transport system | 0.000141 | −44.000000 |
| Governance | ||
| Lack of planning; lack of vision and strategy | 0.000141 | −49.000000 |
| Lack of project management | 0.000141 | −41.000000 |
| Lack of capacity (HR) | 0.000141 | −49.000000 |
| Lack of IT knowledge among city planners | 0.000127 | −43.000000 |
| Lack of operational capability | 0.000127 | −39.000000 |
| Structure issues: complexity of organisational structures | 0.000127 | −42.000000 |
| Lack of alignment, conflicts of interest | 0.000121 | −36.000000 |
| Poor public–private partnership | 0.000115 | −36.000000 |
| Centralised decision-making process, top–down approach | 0.000129 | −39.000000 |
| Political instability and complexity | 0.000129 | −41.000000 |
| Lack of political will and support | 0.000123 | −42.000000 |
| Lack of transparency and trust | 0.000105 | −36.000000 |
| Lack of regulation and legislation | 0.000141 | −35.000000 |
| Inability of policies | 0.000141 | −42.000000 |
| Multiplicity of policies and programs | 0.000101 | −33.000000 |
| Staff shortages | 0.000000 | −2.0000000 |
| Urban Infrastructure | ||
| Urban infrastructure deterioration | 0.000141 | −41.000000 |
| Deficit of technological infrastructure | 0.000141 | −44.000000 |
| Lack of infrastructure integration, complexity of networks | 0.000141 | −48.000000 |
| Technological obsolescence, systems failures, infrastructure fragility | 0.000141 | −49.000000 |
| Lack of systems interoperability and lack of integration standards | 0.000127 | −40.000000 |
| Lack of systems security, privacy violation | 0.000127 | −38.000000 |
| Poor quality of ICT-based services | 0.000118 | −36.000000 |
References
- Megamiasta na Świecie. Zobacz, Gdzie Będzie żyło Najwięcej Ludzi. Available online: https://businessinsider.com.pl/wiadomosci/miasta-na-swiecie-gdzie-mieszka-najwiecej-ludzi/y3ww8n6 (accessed on 23 August 2022).
- Ryba, M. What is A ‘Smart City’ Concept and How We Should Call It In Polish. Res. Pap. Wrocław Univ. Econ. 2017, 467, 82–89. [Google Scholar]
- Gądecki, J. Historia wielkiego wynalazku. Niezbędnik Intel. Miasta Ludzie Polityka 2014, 10, 8–11. [Google Scholar]
- Florida, R. The Historic Link between Cities and Innovation. Available online: http://www.citylab.com/design/2015/12/the-historic-link-between-cities-and-innovation/422226 (accessed on 23 August 2022).
- Neirotti, P.; De Marco, A.; Cagliano, A.C.; Mangano, G.; Scorrano, F. Current Trends in Smart City Initiatives: Some Stylised Facts. Cities 2014, 38, 25–36. [Google Scholar] [CrossRef] [Green Version]
- Stawasz, D.; Sikora-Fernandez, D.; Turała, M. Koncepcja smart city jako wyznacznik podejmowania decyzji związanych z funkcjonowaniem i rozwojem miasta. Zesz. Nauk. Uniw. Szczecińskiego Stud. Inform. 2012, 29, 729. [Google Scholar]
- Pichlak, M. Inteligentne miasta w Polsce—Rzeczywistość czy utopia? Zesz. Nauk. Politech. Śląskiej 2018, 127, 191–206. [Google Scholar]
- Letaifa, S.B. How to Strategize Smart Cities: Revealing the SMART Model. J. Bus. Res. 2015, 68, 1414–1419. [Google Scholar] [CrossRef]
- Piechocki, A.; Siciński, D. Prawno Nowych Technologii i Internetu. Available online: https://www.paih.gov.pl/prawo/prawo_nowych_technologii_i_Internetu (accessed on 19 October 2022).
- Czupich, M.; Ignasiak-Szulc, A.; Kola-Bezka, M. Czynniki i bariery wdrażania koncepcji smart city w Polsce. Stud. Ekon. Zesz. Nauk. Uniw. Ekon. W Katowicach 2016, 276, 223–233. [Google Scholar]
- Makieła, Z.J.; Stuss, M.M.; Mucha-Kuś, K.; Kinelski, G.; Budziński, M.; Michałek, J. Smart City 4.0: Sustainable Urban Development in the Metropolis GZM. Sustainability 2022, 14, 3516. [Google Scholar] [CrossRef]
- Caragliu, A. Smart Cities: Past achievements and future challenges. Sci. Reg. Ital. J. Reg. Sci. 2016, 1, 7–14. [Google Scholar]
- Caragliu, A.; Del Bo, C.; Nijkamp, A. Smart Cities in Europe; University Amsterdam, Faculty of Economics, Business Administration and Econometrics: Amsterdam, The Netherlands, 2006. [Google Scholar]
- Caragliu, A.; Del Bo, C.; Nijkamp, P. Smart Cities in Europe. J. Urban Technol. 2011, 18, 2. [Google Scholar] [CrossRef]
- Katz, B.; Bradley, J. The Metropolitan Revolution: How Cities and Metros Are Fixing Our Broken Politics and Fragile Economy; Brooking Institution Press: Washington, DC, USA, 2013. [Google Scholar]
- Toppeta, D. The Smart City Vision: How Innovation and ICT Can Build Smart, “Liveable”, Sustainable Cities; THINK! The Innovation Knowledge Foundation: Milano, Italy, 2010. [Google Scholar]
- Lee, J.H.; Hancock, M.G.; Hu, M.-C. Towards an Effective Framework for Building Smart Cities: Lessons from Seoul and San Francisco. Technol. Forecast. Soc. Chang. 2014, 89, 80–99. [Google Scholar] [CrossRef]
- Popescu, A.I. Long-Term City Innovation Trajectories and Quality of Urban Life. Sustainability 2020, 12, 10587. [Google Scholar] [CrossRef]
- Bachanek, K.H. Gospodarka współdzielenia w koncepcji smar city. Probl. Transp. Logistyki 2019, 3, 7–13. [Google Scholar] [CrossRef]
- Anthopoulos, L.G. The Rise of the Smart City. In Understanding Smart Cities: A Tool for Smart Government or an Industrial Trick? Anthopoulos, L.G., Ed.; Public Administration and Information Technology; Springer: Cham, Switzerland, 2017; Volume 22. [Google Scholar] [CrossRef]
- Graham, S.; Aurigi, A. Urbanising cyberspace? City 1997, 2, 18–39. [Google Scholar] [CrossRef]
- van Bastelaer, B. Digital cities and transferability of results. In Proceedings of the 4th EDC Conference on Digital Cities, Salzburg, Austria, 29–30 October 1998. [Google Scholar]
- Hall, R.E.; Bowerman, B.; Braverman, J.; Taylor, J.; Todosow, H.; Von Wimmersperg, U. The Vision of a Smart City; Brookhaven National Laboratory: Upton, MA, USA, 2010. [Google Scholar]
- Harrison, C.; Eckman, B.; Hamilton, R.; Hartswick, P.; Kalagnanam, J.; Paraszczak, J.; Williams, P. Foundations for smarter cities. IBM J. Res. Dev. 2010, 54, 1–16. [Google Scholar] [CrossRef]
- Marsal-Llacuna, M.L.; Colomer-Llinàs, J.; Meléndez-Frigola, J. Lessons in urban monitoring taken from sustainable and livable cities to better address the smart cities initiative. Technol. Forecast. Soc. Chang. 2015, 90, 611–622. [Google Scholar] [CrossRef]
- Anthopoulos, L.; Fitsilis, P. Smart Cities and their Roles in City Competition: A Classification. Int. J. Electron. Gov. Res. 2014, 10, 67–81. [Google Scholar] [CrossRef] [Green Version]
- Chourabi, H.; Nam, T.; Walker, S.; Gil-Garcia, J.R.; Mellouli, S.; Nahon, K.; Pardo, T.A.; Scholl, H.J. Understanding Smart Cities: An Integrative Framework. In Proceedings of the 45th Hawaii International Conference on System Sciences, Maui, HI, USA, 4–7 January 2011. [Google Scholar]
- Anthopoulos, L. Understanding the smart city Domain: A Literature Review. In Transforming City Governments for Successful Smart Cities; Public Administration and Information Technology Series; Bolivar, M.P., Ed.; Springer Science Business Media: New York, NY, USA, 2015; Volume 3. [Google Scholar]
- Mitchell, W. Intelligent cities. E-J. Knowl. Soc. 2007, 5, 3–8. [Google Scholar]
- Schaffers, H.; Komninos, N.; Pallot, M.; Trousse, B.; Nilsson, M.; Oliveira, A. Smart Cities and the Future Internet: Towards CooperationFrameworks for Open Innovation. In The Future Internet; Schaffers, H., Komninos, N., Pallot, M., Trousse, B., Nilsson, M., Oliveira, A., Eds.; Lecture Notes in Computer Science; Springer: Berlin/Heidelberg, Germany, 2011; Volume 6656. [Google Scholar]
- Chong, M.; Habib, A.; Evangelopoulos, N.; Park, H. Dynamic capabilities of a smart city: An innovative approach to discovering urban problems and solutions. Gov. Inf. Q. 2018, 35, 6872. [Google Scholar] [CrossRef]
- Tan, M. Creating the digital economy: Strategies and perspectives from Singapore. Int. J. Electron. Commer. 1999, 3, 111. [Google Scholar] [CrossRef]
- Targowski, A.S. Strategies and architecture of the electronic global village. Inf. Soc. 1990, 7, 196. [Google Scholar] [CrossRef]
- Sproull, L.; Patterson, J.F. Making information cities livable. Commun. ACM 2004, 47, 35. [Google Scholar] [CrossRef]
- Fietkiewicz, K.J.; Mainka, A.; Stock, W.G. eGovernment in cities of the knowledge society. An empirical investigation of smart cities’ governmental websites. Gov. Inf. Q. 2017, 34, 79. [Google Scholar] [CrossRef]
- Stolfi, F.; Sussman, G. Telecommunications and transnationalism: The polarization of social space. Inf. Soc. 2001, 17, 56. [Google Scholar]
- Shin, D.H. Ubiquitous city: Urban technologies, urban infrastructure and urban informatics. J. Inf. Sci. 2009, 35, 520. [Google Scholar] [CrossRef]
- Mone, G. The new smart cities. Commun. ACM 2015, 58, 20. [Google Scholar] [CrossRef]
- Schaffers, H.; Ratti, C.; Komninos, N. Special issue on smart applications for smart cities—new approaches to innovation: Guest editors’ introduction. J. Theor. Appl. Electron. Commer. Res. 2012, 7, 3. [Google Scholar] [CrossRef]
- Stolfi, F.; Peng, G.C.A.; Nunes, M.B.; Zheng, L. Impacts of low citizen awareness and usage in smart city services: The case of London’s smart parking system. Inf. Syst. e-Bus. Manag. 2017, 15, 862. [Google Scholar]
- Mohanty, S.P.; Choppali, U.; Kougianos, E. Everything you wanted to know about smart cities: The internet of things is the backbone. IEEE Consum. Electron. Mag. 2016, 5, 60–70. [Google Scholar] [CrossRef]
- Komninos, N. The Age of Intelligent Cities. Smart Environments and Innovation-for-All Strategies; Routledge Taylor & Francis Group: New York, NY, USA, 2015. [Google Scholar]
- Manville, C.; Cochrane, G.; Cave, J.; Millard, J.; Pederson, J.K.; Thaarup, R.K.; Liebe, A.; Wissner, M.; Massink, R.; Kotterink, B. Maping Smart Cities in the EU, Study; Directorate General for Internal Policies, Policy Department A: Economic and Scientific Policy, European Parliament: Belgium, Brussels, 2014. [Google Scholar]
- Albino, V.; Berardi, U.; Dangelico, R.M. Smart cities: Definitions, dimensions, performance, and initiatives. J. Urban Technol. 2015, 22, 3–21. [Google Scholar] [CrossRef]
- Kumar, H.; Singh, M.K.; Gupta, M.P.; Madaan, J. Moving towards smart cities: Solutions that lead to the smart city transformation framework. Technol. Forecast. Soc. Chang. 2020, 153, 1–16. [Google Scholar] [CrossRef]
- Leźnicki, M.; Lewandowska, A. Contemporary concepts of a city in the context of sustainable development: Perspective of humanities and natural sciences. Probl. Ekorozw. 2016, 11, 45–54. [Google Scholar]
- Kumar, T.V.; Dahiya, B. Smart economy in smart cities. In Smart Economy in Smart Cities; Vinod Kumar, T.M., Ed.; Springer: Berlin/Heidelberg, Germany, 2017. [Google Scholar]
- Visvizi, A.; Lytras, M.D. Rescaling and refocusing smart cities research: From mega cities to smart villages. J. Sci. Technol. Policy Manag. 2018, 9, 134–145. [Google Scholar] [CrossRef]
- Janik, A.; Ryszko, A.; Szafraniec, M. Scientific landscape of smart and sustainable cities literature: A bibliometric analysis. Sustainability 2020, 12, 779. [Google Scholar] [CrossRef] [Green Version]
- Lee, J.H.; Phaal, R.; Lee, S.H. An integrated service-device-technology roadmap for smart city development. Technol. Forecast. Soc. Chang. 2013, 80, 286–306. [Google Scholar] [CrossRef]
- Akaraci, S.; Usman, M.A.; Usman, M.R.; Ahn, D.J. From smart to smarter cities: Bridging the dimensions of technology and urban planning. In Proceedings of the 2016 International Conference on Smart Green Technology in Electrical and Information Systems (ICSGTEIS), Bali, Indonesia, 6–8 October 2016; pp. 74–78. [Google Scholar]
- Sepasgozar, S.M.; Hawken, S.; Sargolzaei, S.; Foroozanfa, M. Implementing citizen centric technology in developing smart cities: A model for predicting the acceptance of urban technologies. Technol. Forecast. Soc. Change 2019, 142, 105–116. [Google Scholar] [CrossRef]
- Lewandowska, A.; Chodkowska-Miszczuk, J.; Rogatka, K. Development of renewable energy sources in big cities in Poland in the context of urban policy. In Renewable Energy Sources Engineering Technology Innovation; Springer: Cham, Switzerland, 2019; pp. 842–852. [Google Scholar] [CrossRef]
- Yigitcanlar, T.; Kamruzzaman, M.; Foth, M.; Sabatini-Marques, J.; da Costa, E.; Ioppolo, G. Can cities become smart without being sustainable? A systematic review of the literature. Sustain. Cities Soc. 2019, 45, 348–365. [Google Scholar] [CrossRef]
- Yeh, H. The effects of successful ICT-based smart city services: From citizens’ perspectives. Gov. Inf. Q. 2017, 34, 556–565. [Google Scholar] [CrossRef]
- Bibri, S.E.; Krogstie, J. Smart Sustainable Cities of the Future: An Extensive Interdisciplinary Literature Review. Sustain. Cities Soc. 2017, 31, 183–212. [Google Scholar] [CrossRef]
- Gołuchowski, J.; Korzeb, M.; Weichbroth, P. The participation of economic entities as a determinant of the transformation of a modern city towards an intelligent city. Economic Studies. J. Econ. Manag. 2015, 243, 119–150. [Google Scholar]
- Giffinger, R.; Fertner, C.; Kramar, H.; Kalasek, R.; Pichler-Milanovic, N.; Meijers, E. Smart Cities—Ranking of European Medium-Sized Cities (Report), European Parliament; Directorate General for Internal Policies, Policy Department Economic and Scientific Policy A: Brussels, Belgium, 2007. [Google Scholar]
- Cohen, B. The Top 10 Smartest European Cities. Available online: https://www.fastcompany.com/3024721/the-10-smartest-cities-in-europe (accessed on 23 August 2022).
- Smart Cities. Available online: https://ec.europa.eu/info/es-regionu-ir-miestu-pletra/temos/miestai-ir-miestu-pletra/miestu-iniciatyvos/smart-cities_en (accessed on 28 August 2022).
- Allwinkle, S.; Cruickshank, P. Creating Smarter Cities: An Overview. J. Urban Technol. 2011, 18, 1–16. [Google Scholar] [CrossRef]
- Boulton, A.; Brunn, S.D.; Devriendt, L. Cyberinfrastructures and ‘Smart’ World Cities: Physical, Human and Soft Infrastructures. In International Handbook of Globalization and World Cities; Derudder, B., Hoyler, M., Taylor, P.J., Witlox, F., Eds.; Edward Elgar: Cheltenhamm, UK, 2011. [Google Scholar]
- Hollands, R. Will the Real Smart City Please Stand up? City 2008, 12, 3. [Google Scholar] [CrossRef]
- Nam, T.; Pardo, T.A. Smart City as Urban Innovation: Focusing on Management, Policy, and Context. In Proceedings of the 5th International Conference on Theory and Practice of Electronic Governance, Tallin, Estonia, 26–28 September 2011. [Google Scholar]
- Yigitcanlar, T. Smart cities: An effective urban developmentwsazuje and management model? Aust. Plan. 2015, 52, 27–34. [Google Scholar] [CrossRef]
- Angelidou, M. Smart city policies: A spatial approach. Cities 2014, 41, 3–11. [Google Scholar] [CrossRef]
- Trinidade, E.P.; Hinning, M.P.F.; Da Costa, E.M.; Marques, J.S.; Bastos, R.C.; Yigitcanlar, T. Sustainable development of smart cities: A systematic review of the literature. J. Open Innov. Technol. Mark. Complecity 2017, 3, 11. [Google Scholar] [CrossRef] [Green Version]
- Jong, M.; Joss, S.; Schraven, D.; Zhan, C.; Weijnen, M. Sustainable–smart–resilient–low carbon–eco–knowledge cities; making sense of a multitude of concepts promoting sustainable urbanization. J. Clean. Prod. 2015, 109, 25–38. [Google Scholar] [CrossRef] [Green Version]
- Gontar, Z.; Gintar, Z.; Pamuła, B. Deployment of Smart City Concepts in Poland. Selected Aspects. Organ. Vadyb. Sist. Tyrim. 2013, 67, 39–51. [Google Scholar] [CrossRef] [Green Version]
- Komninos, N. Intelligent Cities: Innovation, Knowledge Systems and Digital Spaces; Spon Presss: London, UK; New York, NY, USA, 2013. [Google Scholar]
- Gotlibowska, K. Propozycja modelu miasta inteligentnego (Smart city) opartego na zastosowaniu technologii informacyjno-komunikacyjnych w jego rozwoju. Rozw. Reg. Polityka Reg. 2018, 42, 67–80. [Google Scholar]
- Hajduk, S. Bibliometric Analysis of the Concept of the Smart City in International Scientific Literature; Internal Trade No. 3(368); Instytut Badań Rynku, Konsumocji i Koniunktury: Warszawa, Polska, 2017; pp. 301–312. [Google Scholar]
- Larsen, E.M.; Pinson, P.; Leimgruber, F.; Judex, F. Demand response evaluation and forecasting—Methods and results from the EcoGridEU experiment. Sustain. Energy Grids Netw. 2017, 10, 75–83. [Google Scholar] [CrossRef]
- Masik, G.; Sagan, I.; Scott, J.W. Smart City strategies and new urban development policies in the Polish context. Cities 2021, 108, 102970. [Google Scholar] [CrossRef]
- Germaine, H.R. Smart Cities; The MIT Press: Cambridge, UK, 2020. [Google Scholar]
- Glasmeier, A.; Christopherson, S. Thinking about smart cities. Camb. J. Reg. Econ. Soc. 2015, 8, 3–12. [Google Scholar] [CrossRef]
- Zygiaris, S. Smart City Reference Model: Assisting Planners to Conceptualize the Building of Smart City Innovation Ecosystems. J. Knowl. Econ. 2013, 4, 220–221. [Google Scholar] [CrossRef]
- Barrionuevo, J.M.; Berrone, P.; Ricart, J.E. Smart Cities, Sustainable Progress. IESE Insight 2011, 14, 50–57. [Google Scholar]
- Lehrer, J. A Physicists Solves the City. The New York Times, 17 December 2021. [Google Scholar]
- Glaeser, E.L. Triumph of the City: How Our Greatest Invention Makes Us Richer, Smarter, Greener, Healthier, and Happier; Penguin Press: New York, NY, USA, 2011. [Google Scholar]
- Smart Cities Market: Global Opportunity Analysis and Industry Forecast, 2021–2030; Allied Market Research: Portland, OR, USA, 2021.
- Smart Cities—Global Market Trajectory & Analytics, Reseach and Markets. Available online: https://www.researchandmarkets.com/reports/3633914/smart-cities-global-market-trajectory-and?gclid=Cj0KCQjwgO2XBhCaARIsANrW2X23DA9jOsH_aDc_8T4Q7zvQCMcueMWOtlrArftbQYNP9AIEOBuXQpcaAvLtEALw_wcB (accessed on 23 August 2022).
- Projected Revenue Generated by Companies in the Global Smart City from 2020 to 2025, Statista. Available online: https://0-www-statista-com.brum.beds.ac.uk/statistics/1111626/worldwide-smart-city-market-revenue/ (accessed on 23 August 2022).
- Europe Smart Cities Market 2020–2030 by Component (Hardware, Software, Services), Application (Citizen Service, Transportation, Utilities, Home & Building), Business Model (BOM, BOO, BOT, OBM), and Country: Trend Forecast and Growth Opportunity, Research and Markets. Available online: https://www.researchandmarkets.com/reports/5182615/europe-smart-cities-market-2020-2030-by-component (accessed on 23 August 2022).
- 2021 Global Smart City Index. Available online: https://www.quantumesco.it/en/2021-global-smart-city-index/ (accessed on 24 August 2022).
- 10 Najciekawszych Technologii Smart City. Available online: https://apollogic.com/pl/2016/02/10-najciekawszych-technologii-smart-city/ (accessed on 19 October 2022).
- Przykłady Smart Cities. Jakie są Inteligentne Miasta w Polsce. Available online: https://almine.pl/smart_city_przyklady_polska/ (accessed on 19 October 2022).
- Chrisidu-Budnik, A. Współczesne Kierunki Rozwoju Inteligentnych miast w Kontekście Potencjału Relacyjnego; E-Wydawnictwo, Prawnicza i Ekonomiczna Biblioteka Cyfrowa Uniwersytetu Wrocławskiego: Wrocław, Polska, 2021. [Google Scholar] [CrossRef]
- Crowe, C. 12 Predictions about the Trends That Will Shape Smart Cities in 2022, Smart Cities Dive. Available online: https://www.smartcitiesdive.com/news/12-predictions-about-the-trends-that-will-shape-smart-cities-in-2022/616439/ (accessed on 26 August 2022).
- Antunes, M.E.; Barroca, J.; Guerreiro Oliveira, D. Urban Future with a Purpose, Deloitte. Available online: https://www2.deloitte.com/us/en/insights/industry/public-sector/future-of-cities.html (accessed on 24 August 2022).
- Locke, T. These Are the World’s Most Liveable Cities in 2019. Available online: https://www.cnbc.com/2019/09/04/global-liveability-index-2019-most-liveable-cities-in-the-world.html (accessed on 24 August 2022).
- 2020 Global Health Care Outlook, Deloitte Insights. Available online: https://www2.deloitte.com/content/dam/Deloitte/za/Documents/life-sciences-health-care/za-2020-global-health-care-outlook.pdf (accessed on 25 August 2022).
- Climate Emergency, Urban Opportunity, Coalition for Urban Transitions. Available online: https://urbantransitions.global/wp-content/uploads/2019/09/Climate-Emergency-Urban-Opportunity-report.pdf (accessed on 25 August 2022).
- Building a Hyperconnected City, ESI Consulting Solutions INC. Available online: https://econsultsolutions.com/hyperconnected-city/ (accessed on 25 August 2022).
- Smart City Solutions for a Riskier World. Available online: https://econsultsolutions.com/smart-city-solutions-for-a-riskier-world-2/ (accessed on 25 August 2022).
- Salva, F. Top 5 Smart City Trends in 2022. Available online: https://identityreview.com/top-5-smart-city-trends-in-2022/ (accessed on 24 August 2022).
- Top 10 Smart City Trends & Innovations in 2022, StartUS Insights. Available online: https://www.startus-insights.com/innovators-guide/smart-city-trends/ (accessed on 25 August 2022).
- Pavlica, M. Smart City 2021—7 Trendów w Rozwoju Inteligentnych Miast. Available online: https://www.axis.com/pl-pl/newsroom/article/smart-city-2021-7-trendow-w-rozwoju-inteligentnych-miast (accessed on 26 August 2022).
- Lsa, L.; Azambuja, S.D. Drivers and Barriers for the development of Smart Sustainabl Cities: A Systematic Literature Review. In Proceedings of the 14th International Conference on Theory and Practice of Electronic Governance (ICEGOV 2021), Athens, Greece, 6–8 October 2021. [Google Scholar] [CrossRef]
- Macke, J.; Casagrande, R.M.; Sarate, J.A.R.; Silva, K.A. Smart city and quality of life: Citizens’ perception in a Brazilian case study. J. Clean. Prod. 2018, 182, 717–726. [Google Scholar] [CrossRef]
- Aina, Y.A. Achieving smart sustainable cities with GeoICT support: The Saudi evolving smart cities. Cities 2017, 71, 49–58. [Google Scholar] [CrossRef]
- Glasmeier, A.K.; Nebiolo, M. Thinking about smart cities: The travels of a policy idea that promises a great deal, but so far has delivered modest results. Sustainability 2016, 8, 1122. [Google Scholar] [CrossRef] [Green Version]
- Barns, S. Smart cities and urban data platforms: Designing interfaces for smart governance. City Cult. Soc. 2018, 12, 5–12. [Google Scholar] [CrossRef]
- Fernandez-Anez, V.; Fernández-Güell, J.M.; Giffinger, R. Smart City implementation and discourses: An integrated conceptual model. The case of Vienna. Cities 2018, 78, 4–16. [Google Scholar] [CrossRef]
- Grossi, G.; Pianezzi, D. Smart cities: Utopia or neoliberal ideology? Cities 2017, 69, 79–85. [Google Scholar] [CrossRef]
- Kummitha, R.K.R.; Crutzen, N. How do we understand smart cities? An evolutionary perspective. Cities 2017, 67, 43–52. [Google Scholar] [CrossRef]
- Lopes, I.M.; Oliveira, P. Can a small city be considered a smart city? Procedia Comput. Sci. 2017, 121, 617–624. [Google Scholar] [CrossRef]
- Praharaj, S.; Han, J.H.; Hawken, S. Urban innovation through policy integration: Critical perspectives from 100 smart cities mission in India. City Cult. Soc. 2018, 12, 35–43. [Google Scholar] [CrossRef]
- Vakali, A.; Dematis, I.; Tolikas, A. Vol4All: A Volunteering Platform to Drive Innovation and Citizens Empowerment. In Proceedings of the 26th International Conference on World Wide Web Companion, Geneva, Switzerland, 3–7 April 2017. [Google Scholar]
- Lazaroiu, G.C.; Roscia, M. Definition methodology for the smart cities model. Energy 2012, 47, 326–332. [Google Scholar] [CrossRef]
- Meijer, A.; Rodríguez Bolívar, M.P. Governing the Smart City: Scaling-Up the Search for Socio-Techno Synergy. In Proceedings of the 2013 Annual Conference, Edinburg, Scotland, 11–13 September 2013. [Google Scholar]
- Khan, Z.; Pervez, Z.; Abbasi, A.G. Towards a secure service provisioning framework in a Smart city environment. Future Gener. Comput. Syst. 2017, 77, 112–135. [Google Scholar] [CrossRef] [Green Version]
- Costin, A.; Eastman, C. Need for Interoperability to Enable Seamless Information Exchanges in Smart and Sustainable Urban Systems. J. Comput. Civ. Eng. 2019, 33, 3. [Google Scholar] [CrossRef]
- Allam, Z.; Dhunny, Z.A. On big data, artificial intelligence and smart cities. Cities 2019, 89, 80–91. [Google Scholar] [CrossRef]
- Balta-Ozkan, N.; Davidson, R.; Bicket, M.; Whitmarsh, L. Social barriers to the adoption of smart homes. Energy Policy 2013, 63, 363–374. [Google Scholar] [CrossRef]
- Monzon, A. Smart Cities Concept and Challenges. In Proceedings of the 2015 International Conference on Smart Cities and Green ICT Systems (SMARTGREENS), Lisbon, Portugal, 22–25 May 2015. [Google Scholar] [CrossRef] [Green Version]
- Corbett, J.; Mellouli, S. Winning the SDG battle in cities: How an integrated information ecosystem can contribute to the achievement of the 2030 sustainable development goals. Inf. Syst. J. 2017, 27, 427–461. [Google Scholar] [CrossRef]
- Adapa, S. Indian smart cities and cleaner production initiatives—Integrated framework and recommendations. J. Clean. Prod. 2018, 172, 3351–3366. [Google Scholar] [CrossRef]
- Makowska, M. Analiza Danych Zastanych. Przewodnik dla Studentów; Wydawnictwo Naukowe Scholar: Warszawa, Polska, 2013. [Google Scholar]
- Bednarowska, Z. Desk research—Wykorzystanie potencjału danych zastanych w prowadzeniu badań marketingowych i społecznych. Mark. Rynek 2015, 7, 18–26. [Google Scholar]
- Dąbrowska, D.; Sołtysiak, M.; Waligóra, J. Modele wygładzania wykładniczego w ocenie jakości wód podziemnych na przykładzie uzdrowiska Ustroń. Acta Geogr. 2016, 22, 11–16. [Google Scholar]
- Balaguer, E.; Palomares, A.; Sorie, R.; Martin-Guerrero, J.D. Predicting service in support centers based on nonlinear dynamics, ARMA modeling and neural network. Expert Syst. Appl. 2018, 34, 665–672. [Google Scholar] [CrossRef]
- Hyndman, R.; Anthanasopoulos, G. Forecasting: Principles and Practice; University of Western Australia: Perth, Australia, 2014. [Google Scholar]
- Magruk, A. Foresight—Nowa metoda prognozowania heurystycznego. In Technologie i Prognozowanie w Zarządzaniu. Wybrane Zagadnienia; Kiełtyka, L., Nazarko, J., Eds.; Wydawnictwo Politechniki Białostockiej: Białystok, Polska, 2005. [Google Scholar]
- Babbie, E. Badania Społeczne w Praktyce; Wydawnictwo Naukowe PWN: Warszawa, Polska, 2004. [Google Scholar]
- Churchill, G.A. Badania Marketingowe. Podstawy Metodologiczne; Wydawnictwo Naukowe PWN: Waszawa, Polska, 2002. [Google Scholar]
- Ręklewski, M. Statystyka Opisowa; Państwowa Uczelnia Zawodowa we Włocławku: Włocławek, Poland, 2020. [Google Scholar]
- Wasserman, S.; Faust, K. Social Network Analysis: Methods and Applications; Structural Analysis in the Social Sciences; Cambridge University Press: Cambridge, UK, 1994. [Google Scholar]
- Reid, N.; Smith, B.W.; Carroll, M.C. Cluster Regions: A Social Network Perspective. Econ. Dev. Q. 2008, 22, 4. [Google Scholar] [CrossRef]
- Kijkuit, B.; van den Ende, J. With a Little Help from Our Colleagues: A Longitudinal Study of Social Networks for Innovation. Organ. Stud. 2010, 31, 4. [Google Scholar] [CrossRef]
- Scott, J. Social Network Analysis: A Handbook; Sage Publications: London, UK, 2000. [Google Scholar]
- Pajek. Available online: http://mrvar.fdv.uni-lj.si/pajek/ (accessed on 26 August 2022).
- Brzeziński, Ł.; Kliber, M.C.; Wyrwicka, M.K. The Support of Analysis of Level for Customer Service by Network Visualization. Res. Logist. Prod. 2016, 6, 25–38. [Google Scholar] [CrossRef]
- Brzeziński, Ł.; Wyrwicka, M.K. Wykorzystanie wizualizacji sieciowej do stymulacji wzrostu przedsiębiorstwa. In Wybrane Zastosowania Technologii Informacyjnych Wspomagających Zarządzanie w Organizacjach; Kiełtyka, L., Niedbał, R., Eds.; Wydawnictwo Politechniki Częstochowskiej: Częstochowa, Polska, 2015. [Google Scholar]
- The Future of Smart Cities, Barclays. Available online: https://www.cib.barclays/our-insights/Rethinking-smart-cities-prioritising-infrastructure.html?cid=paidsearch-textads_google_google_themes_smart_cities_we_research_general_phrase_300433502566&gclid=Cj0KCQjwlMaGBhD3ARIsAPvWd6j4y3NEcfF0lP615n2dc9u39GbGdpTfj-lp2dfJfoiOXwwUswiS5mIaAsKrEALw_wcB&gclsrc=aw.ds (accessed on 26 August 2022).
- Ratti, C.; Townsend, A. Splot społeczny. Świat Nauki 2011, 10, 242. [Google Scholar]
- Ewaluacja Realizacji Koncepcji Smart City w Krajach Grupy Wyszehradzkiej. Available online: https://www.ewaluacja.gov.pl/media/102581/Smart_City_zal2_Przeglad_zagadnien.pdf (accessed on 28 August 2022).
- Krajowa Polityka Miejska 2030; Ministerstwo Funduszy i Polityki Regionalnej: Warszawa, Polska, 2022.
- Strategia Warszawa 2030. Available online: https://um.warszawa.pl/waw/strategia/strategia-rozwoju-miasta (accessed on 28 August 2022).
- Strategia Rozwoju Miasta Kielce do 2030 roku. Available online: http://www.um.kielce.pl/strategia-rozwoju-kielc-2030/ (accessed on 28 August 2022).
- Strategia Rozwoju Miasta Ruda Śląska. Available online: https://www.rudaslaska.pl/strategia (accessed on 28 August 2022).
- Strategia Rozwoju Krakowa 2030. Available online: https://strategia.krakow.pl/252788,artykul,strategia_rozwoju_krakowa.html (accessed on 28 August 2022).
- Joshi, M.; Vaidya, A.; Deshmukh, M. Sustainable transport solutions for the concept of smart city. In Sustainable Energy and Transportation; Gupta, J.G., De, S., Gautam, A., Dhar, A., Pandey, A., Eds.; Springer: Singapore, 2018. [Google Scholar] [CrossRef]
- Jayashree, M.; Sunny, A.; John, A.; Sunny, A.; Sam, S. Smart hospital technology. Health Inform.—Int. J. 2014, 3, 9–16. [Google Scholar] [CrossRef]
- Stoltz, D.; Arrias, J.L.; Lundqvist, P. Categorization Framework for Systems Innovation in Eco Cities. Energy Procedia 2015, 75, 2466–2471. [Google Scholar] [CrossRef] [Green Version]
- Pan, G.; Qi, G.; Zhang, W.; Li, S.; Wu, Z.; Yang, L.T. Trace analysis and mining for smart cities: Issues, methods, and applications. IEEE Commun. Mag. 2013, 51, 120–126. [Google Scholar] [CrossRef]
- Dickey, T. Smart water solutions for smart cities. In Smart Cities; McClellan, S., Jimenez, J., Koutitas, G., Eds.; Springer: Cham, Switzerland, 2018. [Google Scholar] [CrossRef]
- Gomede, E.; Gaffo, F.; Briganó, G.; de Barros, R.L.; Mendes, L. Application of Computational Intelligence to Improve Education in Smart Cities. Sensors 2018, 18, 267. [Google Scholar] [CrossRef] [Green Version]
- Ahmed, S.H.; Rani, S. A hybrid approach, Smart Street use case and future aspects for Internet of Things in smart cities. Future Gener. Comput. Syst. 2018, 79, 941–951. [Google Scholar] [CrossRef]
- Kim, K.G. Development of an integrated smart water grid model as a portfolio of climate smart cities. J. Smart Cities 2019, 3, 23–34. [Google Scholar]
- Tomar, P.; Kaur, G.; Singh, P. A prototype of IoT-based real time smart street parking system for smart cities. In Internet of Things and Big Data Analytics Toward Next-Generation Intelligence; Elhayatmy, G., Dey, N., Ashour, A.S., Eds.; Springer: Cham, Switzerland, 2018. [Google Scholar] [CrossRef]
- Hajduk, S. Multi-Criteria Analysis of Smart Cities on the Example of the Polish Cities. Resources 2021, 10, 44. [Google Scholar] [CrossRef]
- Maleszyk, P. Recognizing intra-city differences in smart cities: An example from Poland. In Smart Cities and the United Nations Sustainable Development Goals; Visvizi, A., Pérez del Hoyo, R., Eds.; Elsevier: Amsterdam, The Netherlands, 2021; pp. 163–180. [Google Scholar]
Figure 1.
The value of the global market of smart city solutions and technologies in 2020–2030 on the basis of Allied Market Research data. Source: [81].
Figure 1.
The value of the global market of smart city solutions and technologies in 2020–2030 on the basis of Allied Market Research data. Source: [81].

Figure 2.
The value of the global market of smart city solutions and technologies in 2020–2030 on the basis of Research and Markets data, along with the authors’ own forecast. Source: ([82], own elaboration).
Figure 2.
The value of the global market of smart city solutions and technologies in 2020–2030 on the basis of Research and Markets data, along with the authors’ own forecast. Source: ([82], own elaboration).

Figure 3.
The value of global revenues from smart city technologies, products, and services in 2020-2030, on the basis of Statista data, along with the authors’ own forecast. Source: ([83], own elaboration).
Figure 3.
The value of global revenues from smart city technologies, products, and services in 2020-2030, on the basis of Statista data, along with the authors’ own forecast. Source: ([83], own elaboration).

Figure 4.
The value of the European market of smart city solutions and technologies in 2020-2030 on the basis of Allied Market Research data, along with the authors’ own forecast. Source: ([84], own elaboration).
Figure 4.
The value of the European market of smart city solutions and technologies in 2020-2030 on the basis of Allied Market Research data, along with the authors’ own forecast. Source: ([84], own elaboration).

Figure 5.
The scheme of the author’s research. Source: Own study.

Figure 6.
Functions of experts participating in the study. Source: Own study.

Figure 7.
Experience of the participating experts, in years, on their last respective function. Source: Own study.
Figure 7.
Experience of the participating experts, in years, on their last respective function. Source: Own study.

Figure 8.
Experts’ own evaluation of knowledge on smart city issues. Source: Own study.

Table 1.
A cumulative list of smart city scoring on the basis of the IMD-SUTD Smart City Index (SCI)—an overview [85].
Table 1.
A cumulative list of smart city scoring on the basis of the IMD-SUTD Smart City Index (SCI)—an overview [85].
| Specification | Singapore | Zurich | Oslo | Warsaw | Krakow |
|---|---|---|---|---|---|
| Smart city ranking | 1 | 2 | 3 | 75 | 80 |
| Smart city rating | AAA | AA | AA | CCC | CCC |
| Factor ratings—structures | AAA | AAA | AAA | CCC | CCC |
| Factor ratings—technologies | AAA | A | A | CCC | CCC |
| Group | 1 | 1 | 1 | 3 | 3 |
Table 2.
A cumulative list of smart city scoring on the basis of the IMD-SUTD Smart City Index (SCI)—structural factors [85].
Table 2.
A cumulative list of smart city scoring on the basis of the IMD-SUTD Smart City Index (SCI)—structural factors [85].
| Specification | Singapore | Zurich | Oslo | Warsaw | Krakow |
|---|---|---|---|---|---|
| Health and Safety | |||||
| Basic sanitation meets the needs of the poorest areas | 83.9 | 83.7 | 78.0 | 62.6 | 61.6 |
| Recycling services are satisfactory | 66.4 | 86.7 | 79.8 | 55.6 | 58.6 |
| Public safety is not a problem | 74.9 | 77.1 | 73.5 | 61.4 | 58.5 |
| Air pollution is not a problem; CCTV cameras has made residents feel safer | 60.7 | 59.5 | 62.9 | 27.9 | 20.0 |
| Medical services provision is satisfactory | 84.9 | 87.3 | 78.8 | 45.0 | 47.4 |
| 48.7 | 30.4 | 33.7 | 27.1 | 26.1 | |
| Mobility | |||||
| Traffic congestion is not a problem | 47.9 | 40.7 | 53.3 | 29.4 | 28.5 |
| Public transport is satisfactory | 77.6 | 79.5 | 69.9 | 65.0 | 56.6 |
| Activities | |||||
| Green spaces are satisfactory | 78.3 | 73.9 | 80.6 | 67.2 | 59.4 |
| Cultural activities (shows, bars, and museums) are satisfactory | 76.0 | 82.6 | 79.4 | 76.5 | 77.5 |
| Opportunities (Work and School) | |||||
| Employment finding services are readily available | 74.1 | 74.1 | 73.4 | 66.8 | 61.4 |
| Most children have access to a good school | 82.0 | 85.9 | 82.1 | 65.6 | 67.8 |
| Lifelong learning opportunities are provided by local institutions | 81.7 | 74.5 | 72.6 | 70.8 | 67.4 |
| Businesses are creating new jobs | 67.6 | 70.2 | 69.6 | 67.9 | 63.4 |
| Minorities feel welcome | 69.1 | 67.4 | 64.3 | 52.8 | 58.1 |
| Governance | |||||
| Information on local government decisions is easily accessible | 77.1 | 70.9 | 66.2 | 62.6 | 60.5 |
| Corruption of city officials is not an issue of concern | 68.8 | 68.1 | 59.9 | 37.2 | 38.8 |
| Residents contribute to decision making of local government | 59.9 | 73.0 | 61.4 | 50.6 | 51.4 |
| Residents provide feedback on local government projects | 68.5 | 73.6 | 66.6 | 61.6 | 58.1 |
Table 3.
A cumulative list of smart city scoring on the basis of the IMD-SUTD Smart City Index (SCI)—technological factors [85].
Table 3.
A cumulative list of smart city scoring on the basis of the IMD-SUTD Smart City Index (SCI)—technological factors [85].
| Specification | Singapore | Zurich | Oslo | Warsaw | Krakow |
|---|---|---|---|---|---|
| Health and Safety | |||||
| Online reporting of city maintenance problems provides a speedy solution | 70.5 | 59.5 | 51.4 | 50.3 | 49.4 |
| A website or app allows residents to easily give away unwanted items | 65.3 | 55.9 | 69.5 | 61.5 | 55.7 |
| Free public Wi-Fi has improved access to city services | 76.4 | 52.9 | 49.4 | 61.0 | 58.3 |
| CCTV cameras has made residents feel safer | 80.2 | 49.7 | 49.6 | 58.1 | 56.3 |
| A website or app allows residents to effectively monitor air pollution | 63.6 | 42.6 | 41.7 | 64.5 | 73.0 |
| Arranging medical appointments online has improved access | 81.9 | 56.0 | 66.9 | 64.4 | 60.1 |
| Mobility | |||||
| Car-sharing apps have reduced congestion | 59.9 | 42.4 | 43.6 | 47.6 | 39.3 |
| Apps that direct you to an available parking space have reduced journey time | 57.9 | 44.2 | 44.8 | 49.9 | 45.9 |
| Bicycle hiring has reduced congestion | 51.9 | 51.4 | 61.9 | 59.4 | 50.2 |
| Online scheduling and ticket sales has made public transport easier to use | 62.9 | 79.6 | 76.2 | 72.6 | 69.4 |
| The city provides information on traffic congestion through mobile phones | 75.2 | 57.9 | 52.6 | 48.2 | 40.4 |
| Activities | |||||
| Online purchasing of tickets to shows and museums has made it easier to attend | 83.5 | 78.5 | 76.3 | 80.2 | 76.9 |
| Opportunities (Work and School) | |||||
| Online access to job listings has made it easier to find work | 80.3 | 75.4 | 68.9 | 76.6 | 73.1 |
| IT skills are taught well in schools | 72.3 | 58.5 | 59.6 | 55.2 | 50.0 |
| Online services provided by the city has made it easier to start a new business | 70.5 | 55.9 | 52.2 | 61.2 | 54.7 |
| The current internet speed and reliability meet connectivity needs | 82.6 | 77.3 | 70.3 | 68.6 | 64.1 |
| Governance | |||||
| Online public access to city finances has reduced corruption | 58.1 | 46.6 | 47.2 | 43.7 | 38.2 |
| Online voting has increased participation | 49.3 | 50.4 | 49.3 | 50.1 | 47.9 |
| An online platform where residents can propose ideas has improved city life | 60.9 | 49.3 | 47.2 | 61.1 | 56.8 |
| Processing identification documents online has reduced waiting times | 78.1 | 56.8 | 52.3 | 68.0 | 64.7 |
Table 4.
A cumulative list of smart city scoring on the basis of the IMD-SUTD Smart City Index (SCI)—inhabitants’ attitudes [%] [85].
Table 4.
A cumulative list of smart city scoring on the basis of the IMD-SUTD Smart City Index (SCI)—inhabitants’ attitudes [%] [85].
| Specification | Singapore | Zurich | Oslo | Warsaw | Krakow |
|---|---|---|---|---|---|
| You are willing to concede personal data in order to improve traffic congestion | 67.3 | 69.4 | 62.1 | 46.6 | 50.4 |
| You are comfortable with face recognition technologies to lower crime | 73.0 | 59.9 | 65.3 | 60.0 | 55.6 |
| You feel the availability of online information has increased your trust in authorities | 75.3 | 68.1 | 69.8 | 52.6 | 53.2 |
| The proportion of your day-to-day payment transactions that are non-cash | 67.9 | 73.4 | 84.2 | 80.5 | 79.6 |
Table 5.
A cumulative list of smart city scoring on the basis of the IMD-SUTD Smart City Index (SCI)—priority areas according to inhabitants [%] [85].
Table 5.
A cumulative list of smart city scoring on the basis of the IMD-SUTD Smart City Index (SCI)—priority areas according to inhabitants [%] [85].
| Specification | Singapore | Zurich | Oslo | Warsaw | Krakow |
|---|---|---|---|---|---|
| Affordable housing | 67.5 | 74.0 | 69.6 | 61.2 | 56.7 |
| Security | 23.6 | 28.4 | 36.4 | 37.3 | 38.7 |
| Unemployment | 51.1 | 32.7 | 35.1 | 18.5 | 14.9 |
| Public transport | 28.7 | 22.0 | 34.7 | 26.6 | 30.8 |
| Health services | 36.2 | 11.3 | 33.4 | 49.9 | 35.8 |
| Social mobility | 26.1 | 16.9 | 30.9 | 12.4 | 12.1 |
| Road congestion | 25.3 | 64.0 | 30.5 | 40.7 | 52.7 |
| Air pollution | 18.8 | 37.1 | 27.4 | 47.6 | 68.6 |
| School education | 17.6 | 10.2 | 25.0 | 18.0 | 10.5 |
| Fulfilling employment | 51.4 | 26.2 | 21.0 | 44.3 | 34.3 |
| Basic amenities | 21.2 | 14.8 | 19.9 | 33.5 | 27.2 |
| Corruption | 17.3 | 12.8 | 19.2 | 22.6 | 16.0 |
| Citizen engagement | 32.9 | 12.5 | 18.5 | 11.4 | 7.6 |
| Green spaces | 17.4 | 28.0 | 17.6 | 30.9 | 39.9 |
| Recycling | 33.1 | 26.2 | 16.9 | 25.3 | 28.7 |
Table 6.
A cumulative list of smart city development directions—Deloitte’s view [90,91,92,93,94,95].
| Development Direction | Description |
|---|---|
| Green planning of public spaces | Cities will be planned and designed focusing on humans, with “green” streets, new corridors, and public spaces serving as social life centres. Among others, the aim is to increase the number of trees in cities and more facilities for pedestrians and cyclists, solutions fostering closer contact with nature |
| Smart health communities in cities | Cities will be developing health care eco-systems that not only focus on diagnosing and treating diseases, but also on supporting human well-being through early intervention and prevention, with the use of digital technologies. The health crisis during the pandemic has made it all clear: communities play a role in creating better health environments and cities must pay more attention to their inhabitants’ well-being (up to a half of deaths globally is estimated to be connected with unhealthy lifestyles). |
| 15-min city | Cities will be designed so that amenities and most services are located within a 15-min walk or bike ride, thus creating a new approach to neighbourhoods. |
| Mobility: smart and sustainable services | Cities will offer digital, pure, smart, autonomous. and intermodal mobility, with more space allocated for pedestrians and cyclists, with transport commonly offered as a service. It is worth noting that transport will be accelerated thanks to electrification, autonomous driving, smart and connected infrastructure, modal and mobile diversity, which is also resilient, shared, and sustainable. |
| Inclusive and planned services | Cities will evolve to offer integrating services and approaches, combating inequalities by offering access to housing and infrastructure, equal rights and participation, along with jobs and possibilities. |
| A city as an eco-system of digital innovations | Cities will attempt to draw talent, foster creativity, and destructive thinking; they will be growing thanks to an innovative model approach and by combining physical and digital elements. The approach to innovation will become multi-dimensional and will combine social, scientific, environmental, administrative, and industrial potential. |
| Closed-loop economy and local production | Cities will assume a closed-loop model; principles of making things available, re-using, and restoring them; and a focus on limiting municipal waste and on local production (e.g., city farming). |
| Smart and sustainable buildings and infrastructure | Cities will seek to regenerate buildings and to use data to optimise energy consumption, use, and manage resources in buildings and utilities: waste, water, and energy. |
| Mass participation in the construction and development of a city | Cities will be oriented towards their inhabitants (the human) and designed by and for its citizens by promoting widespread participation in the process of cooperation and observing the policy of open governance. |
| AI-supported municipal operations | Cities will adopt automated processes and operations (organised by a city platform) and will follow data-based planning approaches. |
| Cyber-security and privacy awareness in a city | Cities will promote the awareness of the importance of data privacy and prepare for cyber-attack effects because data will be an important, municipal commodity. |
| AI-predicted supervision and policy | Cities will use AI to ensure security for its citizens, at the same time protecting privacy and basic human rights. |
Table 7.
A cumulative list of smart city fundamental development directions—StartUS Insights’ view [97].
Table 7.
A cumulative list of smart city fundamental development directions—StartUS Insights’ view [97].
| Development Direction | Description |
|---|---|
| Smart mobility | Municipal mobility developments are connected with improved infrastructure, mobility as a service, micro-mobility, logistics solutions, and zero-emission transport. Smart traffic management, advanced commuting, and autonomous vehicles will make municipal mobility environmentally friendly. Innovative transport options such as hyperloop, robotaxis, and water taxis will be also a part of smart, municipal mobility. |
| Digital citizen | The digital citizen focuses on increasing the involvement of citizens, a community based on cooperation and access to health care and education. Integration services ensure equal rights for civic participation and career opportunities. In the education sphere, remote and personalised learning will foster wider access to education all over the world. AI-based health care eco-systems will also offer early prediction and preventative measures based on data-driven findings, with particular focus on supporting the elderly. |
| Public safety and security | Digitisation will improve public safety by assisting citizens in combating crime and coping with crisis situations faster and more effectively. Big data and artificial intelligence will facilitate the implementation of critical, municipal solutions such as supervision systems, smart street-lights, real-time crime mapping, and predictive police policy. |
| Smart energy | Reliable, efficient, and environmentally friendly energy supplies are one of the main goals of smart cities. Connected IoT solutions will improve energy management by making it possible to take data-based decisions for improved energy storage and distribution. |
| E-governance | Public services and decision-making will become an open, transparent, and sustainable process based on collaboration. Blockchain and IoT based solutions will be used so that all stakeholders can take part in the decision-making process. Digital services such as online voting, digital passports, and robust data security tools will encourage citizens to participate and will boost e-democracy. |
| Green urban planning | Given the changing climate, urban planning is facing a serious challenge of making cities smart, sustainable, and resilient. Following decarbonisation goals, green urban design incorporates aa sustainable neighbourhood approach and 15-min city models, where most daily needs can be reached by walking or cycling. |
| Advanced waste management | Advanced waste management systems will use IoT sensors for accurate monitoring of waste removal, informing inhabitants about their waste generation, and encouraging them with a system of benefits. AI recycling robots will precisely identify the type of material when segregating waste, leading to improved efficiency thanks to avoiding human work. |
| Smart buildings | Technologies such digital twins, smart sensors, and cloud computing allow for real-time monitoring, energy consumption forecasts, identify security threats, and optimise expenses and will be incorporated in modern construction. |
| Advanced water management | The growing demand for improved water supply systems is driven by global warming and the resulting droughts. This leads to the development of smart tools and appliances for wireless measurements, providing inhabitants with hourly water consumption data, leading to increased awareness and reduced costs. Additionally, structural flow technology will dynamically react to changes in water levels, consequently leading to a higher variety of aquatic life on riverbanks. |
| Smart farming | The latest technological innovations in IoT, robotics, and data analysis will support managing farms, crops, and work optimisation. |
Table 8.
A cumulative list of the beneficial factors of a smart city [99].
Table 8.
A cumulative list of the beneficial factors of a smart city [99].
| Categories | Beneficial Factors |
|---|---|
| Social | Public provision of urban services Innovative health care and sanitation facilities Education directed to citizen development Social responsibility, informed citizens Community development, collectivism, volunteering networks Participate and engaged citizens |
| Economic | Innovation, urban lab, Research and Development (R&D) Crowdsourcing Knowledge and shared-based economy, portfolio-thinking Sustainable management of resources, circular economy Partnership formation, multisector synergies Promotion of social and human capital Workforce availability (skilled and non-skilled) Attract and retain workforce, flexibility of the labour market |
| Environmental | Energy related: renewable resources, saving initiatives, smart systems Water related: monitoring quality, efficiency of water usage Pollution prevention and reduction Air pollution monitoring, emission control systems Smart waste management Recycling Environmental projects and green initiatives Quality of urban space, land use planning Mobility related: efficient transport systems, cycle paths Smart building, Responsive Building Envelope (RBE) |
| Governance | Transparency and openness Citizen empowerment, interactive and participatory services, co-production, co-creation, bottom–up approaches Supportive government policies, political will, and synergy Urban planning: strategy and vision definition Context adaptation, analysis of current situation, flexibility Capacity planning (i.e., infrastructure, cost, and human resources) Key Performance Indicators (KPIs) definition; monitoring/assessment Collaborative decision-making; participatory governance models Stakeholders’ engagement: internal (cross-sector), and external Align and manage conflicts of interests Data-driven decision-making and availability of real-time data Urban proactiveness for service provision Data governance: data quality, data sharing and data privacy policies |
| Urban Infrastructure | Physical infrastructure integration Affordable housing facilities such as water and energy supply Adoption of innovative construction techniques Connectivity, broadband, access to Internet facilities Interoperability and integrated ICT Security verification tools/systems Advance ICT, intelligent technologies in urban services Smart grid; intelligent energy management systems Use of geographical information systems (GIS) Data processing: modelling imperfect data; data exchange Data analytic capacity; Business Intelligence (BI) Internet of Things (IoT) Big Data |
| Categories | Adverse Factors |
|---|---|
| Social | Lack of citizen participation Lack of trust Lack of social awareness Cultural diversification Resistance to change Social exclusion and gentrification Unavailability of services for different communities Lack of connection between technological and social infrastructure |
| Economic | High cost of urban infrastructure, imbalance of investments Lack of funding and investors; short time horizon of investments Volatility of global economy Mono-sectoral economy Competitiveness (local against regional and international markets) Unbalance between competitiveness and quality of life Unemployment, lack of equity access to labour market Lack of qualified human capital Weak public–private partnership Inefficiency of resource management |
| Environmental | Climate change Growing population, unbalance between liveability and environment Increasing resource consumption Lack of resource sharing Lack of holistic approach for environmental sustainability Lack of knowledge on how ICT can decrease energy consumption High level of air pollution Inefficient waste management Traffic density and inefficient public transport system |
| Governance | Lack of planning; lack of vision and strategy Lack of project management Lack of capacity (HR) Lack of IT knowledge among city planners Lack of operational capability Structure issues: complexity of organisational structures Lack of alignment, conflicts of interests Poor public–private partnership Centralised decision-making process, top–down approach Political instability and complexity Lack of political will and support Lack of transparency and trust Lack of regulation and legislation Inability of policies Multiplicity of policies and programs |
| Urban infrastructure | Urban infrastructure deterioration Deficit of technological infrastructure Lack of infrastructure integration, complexity of networks Technological obsolescence, systems failures, infrastructure fragility Lack of systems interoperability and lack of integration standards Lack of systems security, privacy violation Poor quality of ICT-based services |
Table 10.
Characteristics of beneficial and adverse factors (general indicators) and ICC analysis for all factors studied (own elaboration).
Table 10.
Characteristics of beneficial and adverse factors (general indicators) and ICC analysis for all factors studied (own elaboration).
| Factor | M ± SD | Me (min-max) | ICC (95% CI) |
|---|---|---|---|
| Fundamental development directions | - | - | 0.09 (0.04; 0.19) |
| Beneficial factors | |||
| Social | 1.80 ± 0.69 | 1.67 (0.67; 3.00) | 0.56 (0.12; 0.91) |
| Economic | 1.87 ± 0.64 | 1.88 (0.62; 3.00) | 0.44 (−0.05; 0.84) |
| Environmental | 2.06 ± 0.48 | 2.10 (1.20; 3.00) | 0.55 (0.12; 0.86) |
| Governance | 1.77 ± 0.71 | 1.50 (0.58; 3.00) | 0.05 (−0.26; 0.50) |
| Urban infrastructure | 1.77 ± 0.66 | 1.62 (0.69; 3.00) | 0.53 (0.22; 0.81) |
| Adverse factors | |||
| Social | 1.73 ± 0.72 | 1.57 (0.43; 3.00) | 0.56 (0.19; 0.89) |
| Economic | 1.86 ± 0.60 | 1.80 (0.60; 3.00) | 0.64 (0.31; 0.88) |
| Environmental | 1.99 ± 0.52 | 2.00 (1.10; 3.00) | 0.71 (0.41; 0.91) |
| Governance | 1.79 ± 0.58 | 1.60 (0.93; 3.00) | 0.43 (0.07; 0.74) |
| Urban infrastructure | 1.88 ± 0.52 | 1.71 (1.00; 3.00) | 0.47 (−0.08; 0.88) |
M ± SD—mean with standard deviation, Me (min-max)—median with a range of observed scores. ICC estimates and their 95% confident intervals were based on a single measure for fundamental development directions (as no general indicator was built for those items) and on an average measure for beneficial and adverse factors (as they were later on averaged for other analyses). All ICC values were based on absolute-agreement, 2-way random-effects model.
Table 11.
Fundamental development directions, beneficial factors, and adverse factors of smart city in the opinion of experts until 2030 in Poland—the highest-dominant response cluster (own elaboration).
Table 11.
Fundamental development directions, beneficial factors, and adverse factors of smart city in the opinion of experts until 2030 in Poland—the highest-dominant response cluster (own elaboration).
| Cluster | Category | Factor | Dominant | |
|---|---|---|---|---|
| 1 | Fundamental development directions | Circular economy and local production | 3 | |
| 1 | Fundamental development directions | Smart and sustainable buildings and infrastructure | 3 | |
| 1 | Fundamental development directions | Smart energy | 3 | |
| 1 | Fundamental development directions | Smart mobility | 3 | |
| 1 | Beneficial | Social | Education directed to citizens development | 3 |
| 1 | Beneficial | Economic | Innovation, urban lab, Research and Development (R&D) | 3 |
| 1 | Beneficial | Economic | Sustainable management of resources, circular economy | 3 |
| 1 | Beneficial | Environmental | Energy related: renewable resources, saving initiatives, smart systems | 3 |
| 1 | Beneficial | Environmental | Water related: monitoring quality, efficiency of water usage | 3 |
| 1 | Beneficial | Environmental | Pollution prevention and reduction | 3 |
| 1 | Beneficial | Environmental | Air pollution monitoring, emission control systems | 3 |
| 1 | Beneficial | Environmental | Environmental projects and green initiatives | 3 |
| 1 | Beneficial | Environmental | Smart building, Responsive Building Envelope (RBE) | 3 |
| 1 | Beneficial | Urban Infrastructure | Affordable housing facilities, such as water and energy supply | 3 |
| 1 | Beneficial | Urban Infrastructure | Adoption of innovative construction techniques | 3 |
| 1 | Adverse | Social | Lack of citizen participation | 3 |
| 1 | Adverse | Social | Lack of trust | 3 |
| 1 | Adverse | Economic | High cost of urban infrastructure, imbalance of investments | 3 |
| 1 | Adverse | Economic | Lack of funding and investors; short time horizon of investments | 3 |
| 1 | Adverse | Economic | Lack of qualified human capital | 3 |
| 1 | Adverse | Economic | Weak public–private partnership | 3 |
| 1 | Adverse | Environmental | Climate change | 3 |
| 1 | Adverse | Environmental | Increasing resource consumption | 3 |
| 1 | Adverse | Environmental | Resource scarcity, loss of biodiversity | 3 |
| 1 | Adverse | Governance | Lack of capacity (HR) | 3 |
| 1 | Adverse | Urban Infrastructure | Technological obsolescence, systems failures, infrastructure fragility | 3 |
Table 12.
Trends, factors, and barriers to the development of a smart city in the opinion of experts until 2030 in Poland.
Table 12.
Trends, factors, and barriers to the development of a smart city in the opinion of experts until 2030 in Poland.
| Key Beneficial Factors of Development | Key Adverse Factors of Development |
Social:
| Social:
|
| Benefits of smart city development | Disadvantages of smart city development |
|
|
Publisher’s Note: MDPI stays neutral with regard to jurisdictional claims in published maps and institutional affiliations. |
© 2022 by the authors. Licensee MDPI, Basel, Switzerland. This article is an open access article distributed under the terms and conditions of the Creative Commons Attribution (CC BY) license (https://creativecommons.org/licenses/by/4.0/).
Share and Cite
MDPI and ACS Style
Brzeziński, Ł.; Wyrwicka, M.K. Fundamental Directions of the Development of the Smart Cities Concept and Solutions in Poland. Energies 2022, 15, 8213. https://0-doi-org.brum.beds.ac.uk/10.3390/en15218213
AMA Style
Brzeziński Ł, Wyrwicka MK. Fundamental Directions of the Development of the Smart Cities Concept and Solutions in Poland. Energies. 2022; 15(21):8213. https://0-doi-org.brum.beds.ac.uk/10.3390/en15218213
Chicago/Turabian StyleBrzeziński, Łukasz, and Magdalena Krystyna Wyrwicka. 2022. "Fundamental Directions of the Development of the Smart Cities Concept and Solutions in Poland" Energies 15, no. 21: 8213. https://0-doi-org.brum.beds.ac.uk/10.3390/en15218213
Note that from the first issue of 2016, this journal uses article numbers instead of page numbers. See further details here.