
A Prefeasibility Solar Photovoltaic Tool for Tropical Small Island Developing States †

Environmental Physics Laboratory, Department of Physics, Faculty of Science and Technology, The University of the West Indies, St. Augustine 685509, Trinidad and Tobago
*
Authors to whom correspondence should be addressed.
†
This paper is an extended version of Dookie, N.; Chadee, X.T.; Clarke, R.M. Assessing Solar Electricity Potential and Prospective Present Day Costs For A Low Latitude Caribbean Island: Trinidad. In Proceedings of the 12th Edition of the International Conference on Solar Energy for Buildings and Industry (EuroSun 2018), Freiburg, Germany, 10–13 September 2018.
Energies 2022, 15(22), 8337; https://0-doi-org.brum.beds.ac.uk/10.3390/en15228337
Submission received: 29 September 2022
/
Revised: 1 November 2022
/
Accepted: 4 November 2022
/
Published: 8 November 2022
(This article belongs to the Special Issue Solar Energy: Resources, Technologies and Challenges)
Abstract
:Small island developing states (SIDS) are the lowest emitters of greenhouse gases yet are the most vulnerable to the impacts of global climate warming. Many islands, such as the Caribbean islands, identified solar photovoltaics as a technology for reducing greenhouse gas emissions from their electricity sector. However, prefeasibility economic studies for photovoltaics are challenging as operational photovoltaic system data are nonexistent, and the measured solar radiation datasets are limited. Thus, a prefeasibility PV tool that uses ground-measured global horizontal irradiation and a supplementary photovoltaic derating factor model is proposed for use in tropical SIDS. In addition, the bias of a modelled irradiation dataset was quantified with limited solar radiation data for a tropical Caribbean SIDS, Trinidad and Tobago. For this SIDS, the tool estimates the annual energy output of a 50 MW photovoltaic system to be 57,890 MWh and the levelized cost of electricity to be USD 0.12/kWh. The performance of the proposed tool was comparable with two existing prefeasibility models, RETScreen and SAM, which use past ground measurements and modelled data, respectively. The biases in the annual irradiation data for RETScreen and SAM were determined to be 6% and 25%, respectively, against the solar irradiance dataset used. The proposed tool may be useful for first approximation prefeasibility photovoltaic studies in similar regions with limited climatic data.
1. Introduction
Small island developing states (SIDs) have embraced the need for ambitious efforts to reduce greenhouse gas (GHG) emissions for survival reasons. Their small landmasses, small economies, dependence on a narrow range of exports, high dependence on food and fuel imports and thus low economic resilience make these islands vulnerable to the potential impacts of climate change [1]. SIDS have set targets to reduce their GHG emissions, although the anthropogenic GHG emissions from SIDS are considered negligible in relation to global emissions [1]. In their intended nationally determined contributions to the United Nations Framework Convention on Climate Change (UNFCCC), Caribbean small islands have included transitioning to energy production from renewable energy sources as a mitigation strategy. Most islands intend to use solar photovoltaics (PVs) in the electricity generation sector [2,3,4,5,6,7]. The thrust for PVs is greater as the technology is now cost-competitive with carbon-intensive fuels [8].
To determine whether PVs may be cost-competitive regionally or locally, a prefeasibility assessment to estimate the quantity of electricity generated from a plant is typically performed using available historical ground measurements of solar radiation. These assessments also advise on the potential operational performance of PVs, which can vary significantly depending on location and climatic conditions [9,10,11]. Performance ratios (PRs) can range from as low as 60% to as high as 90% [10], with typical values of 90% for Germany [12], 84–86% for India and South Africa and approximately 71–76% in Malaysia [13,14,15].
In areas where PV performance data are lacking, models can be used to predict operational performance at specific locations [13,16,17,18]. SAM and RETScreen are commonly used prefeasibility PV models or tools [19,20,21,22,23,24,25,26]. Prefeasibility models take solar radiation datasets as input. Caribbean islands, and other SIDS, often have limited publicly available climatic datasets for assessing solar resources. The Caribbean Institute for Meteorology and Hydrology (CIMH) maintains an archive of regional hourly, daily, and monthly meteorological datasets [27]. In 2019, no solar radiation data were housed for Grenada, St Vincent and the Grenadines, St Lucia or Dominica, with a limited amount of daily solar radiation data for Trinidad and Tobago. Existing solar radiation data in the Caribbean islands are limited to those collected at airport sites. Some sites collect daily or monthly totals of solar irradiance on a horizontal surface or sunshine hours.
Alternatively, existing prefeasibility models can use modelled solar irradiance datasets. All model-derived estimates should be validated and qualified as much as possible using local ground measurements [28]. The bias for SAM’s PSM V3 modelled solar irradiance dataset for North America is a maximum of 5% [29,30]. The bias for modelled datasets is typically assumed to apply to other areas with limited data. However, unvalidated modelled irradiance datasets can introduce significant risks in a PV project and compromise investments. An overestimation of the solar resource will result in an overestimation of the estimated energy yield. If the actual energy yield does not meet the initial estimates, lower revenue from energy sales will impact the servicing of debt or investment returns [31].
In addition, PV models often assume values for the derate factors that advise on the various components that lead to losses in PV output. Environmentally dependent derate factors, such as losses due to air mass [32,33] and soiling [34,35], are site-specific. Some models assume default derate factors. Most SIDS do not collect data that could advise on site-specific effects on the energy outputs of PV systems. One previous study examined derate factors for the island of Trinidad and Tobago [36]. In this present manuscript, we have significantly extended that study by reviewing and justifying the selection of derate factors that are applicable to tropical small island developing states located within 30° latitude of the equator. We have compared the results of the proposed PV tool with three existing industry tools that use modelled solar irradiance time series (PVWatts, NREL’s SAM detailed PV model and RETScreen) and quantified the biases of these PV tools with ground measured solar irradiance data. Furthermore, we have quantified the effects of the site-specific (environmental) derate factors on the performance ratios and capacities of a PV system as well as the levelized costs of electricity generation. A review of environmental derate factors is necessary for advising on the range of values for use in prefeasibility PV assessments.
In this study, existing publicly available prefeasibility solar PV models and environmentally dependent derate factors are reviewed in Section 2 and Section 3, respectively. Additionally, a prefeasibility PV tool that takes limited climatic solar measurements as input and considers derate factors relevant to low latitudes is proposed in Section 4. The proposed tool is suited to prefeasibility assessments in tropical SIDS as most small island states are located within 30° latitude of the equator [37,38]. Finally, the proposed PV prefeasibility tool was used to estimate the feasibility of PVs in one of the Caribbean islands (Trinidad and Tobago), and the results of the proposed tool were compared with the performance of two existing prefeasibility tools (Section 5).
2. Prefeasibility PV Models
Prefeasibility PV tools model the conditions of a PV system and determine its potential performance characteristics and economic viability. In this section, the main components of a PV system are presented, the derating effects experienced by such systems are characterized, the performance metrics used to evaluate systems are outlined and two publicly available prefeasibility models are described.
2.1. Brief Overview of Modelling PV Systems
Typical photovoltaic utility systems are made up of photovoltaic modules that produce direct current (DC) electricity, inverters that convert DC to alternating current (AC), electrical wiring and mounting systems, transformers that step up the voltage of the AC for transmission on the electrical grid and a grid connection [39,40]. The electrical output of such a system depends on two categories of losses: (i) site-specific losses and (ii) technical system losses.
2.2. Derate (Loss) Factors
Site-specific factors that influence the effective global horizontal and direct normal irradiance on a PV module’s surface include climatic, environmental and location factors such as sun path geometry, the slope and nature of the site terrain, the tilt of the PV system, shading, angular reflectivity, soiling and the air temperature [41].
System-related derate factors are associated with performance losses due to inefficiencies in the following: the type of modules used, the mounting system, DC losses, internal network resistances, the inverter, the transformer and losses incurred due to technical availability [40].
PV models consist of two main stages: (1) estimating the quantity of solar irradiance reaching the PV panel and (2) estimating the electricity generated from this irradiance [42]. PV models vary in complexity in how they model each component of the PV system and the effects of the losses on the overall system’s energy output (Figure 1).
2.3. Performance Metrics of PV Systems
Regardless of the complexity of the PV model, PV models estimate three main performance metrics for a PV system: the energy output EPV, the performance ratio (PR) and the annual capacity factor (CF) [18,43,44,45]. The PR and CF metrics are given by [44,45,46]:
where Pr is the peak power of the installed system under standard test conditions (STC) of 1000 W/m2 solar irradiance and 25 °C cell temperature, YR is the reference yield, YF is the final yield, HT is the total solar irradiation on a horizontal plane, and ER is the array reference irradiance.
PR = YF/YR,
YR = HT/ER,
YF = EPV/Pr,
CF = Energy produced EPV/Maximum energy the PV system is capable of producing
= EPV/(Pr × No. of hours per year),
= EPV/(Pr × No. of hours per year),
The PR is the ratio of the final yield to the reference yield. The PR of the system is the proportion of the energy available for export to the grid after considering the energy losses [47]. The YR is the ratio of the total in-plane irradiance to the PV’s reference irradiance. YF is the ratio of the PV system’s annual, monthly or daily net AC output to the installed peak power at STC [45].
The PR can also be calculated via the derate factors as the product of the efficiency of each factor would affect the system from operating at its rated capacity [18,45]:
where losses due to air mass (ηM), tilt (ηtilt), shading (ηshad), angular reflectivity (ηAR), soiling (ηsoil), temperature (ηtemp), inverter (ηinv), internal network (DC wiring and interconnection losses) (ηnet), transformer (ηtrans) and availability and grid connection (ηppc) [18] are considered. Note that η is the efficiency related to each factor, and 1 − η is the loss due to each factor.
PR = ηM ηtilt ηshad ηAR ηsoil ηtemp ηinv ηnet ηtrans ηppc,
Once PR is estimated using Equation (5), the electrical energy output is estimated via Equations (1)–(3):
EPV = (PR × Pr × HT)/ER,
The factor Pr/ER is related to the efficiency of the modules under STC ηmod and the total surface array area of the modules Aa [48]:
Aa = PR/(ER × ηmod),
Thus, the net AC energy output of the system, EPV, is [49]:
EPV = PR × HT × Aa × ηmod,
2.4. Existing Prefeasibility Tools for Areas with Limited Datasets—SAM and RETScreen
Existing modelling tools that can be used for prefeasibility assessments for utility-scale PV systems include the System Advisor Model (SAM) [50], RETScreen [51], PVSyst [52], HOMER Energy [53,54,55,56], PVSOL [57], PVGIS [58], TRNSYS [59] and Polysun [60]. They are differentiated by their complexity, minimum data requirements and cost. The more complex models have greater input data requirements that are not typically available in regions with limited datasets. This study focused on two popular software tools, SAM and RETScreen, as they consist of models that allow for limited input data. These tools have been used in evaluating energy production [20,22,24,61,62,63,64,65,66] and financial feasibility [19,20,22,24,61,63,64].
SAM was developed by the United States Department of Energy’s National Renewable Energy Laboratory to calculate the performance of renewable energy projects [50]. It has two different PV models available: the detailed photovoltaic model and PVWatts [67]. PVWatts has two versions, a desktop version and an online calculator. PVWatts and SAM’s detailed photovoltaic model differ based on their applicable developmental phases and input data requirement characteristics and the complexity of the modelling processes. PVWatts is recommended for preliminary project analysis as it requires a smaller number of user inputs and consists of less-complex energy model processing with sub-models and derate factors [68]. The PVWatts desktop version includes options for modelling shading that are not available with the online calculator version [67]. SAM’s detailed photovoltaic model is a more complex model that uses separate component-based models for the module and inverter and is recommended for use when information about the equipment used in the system is available [67].
RETScreen is a photovoltaic modelling software developed by the Government of Canada and other partners [51]. The model helps the user calculate the annual energy production for a photovoltaic project based on user-defined inputs for local site conditions, system characteristics and system modelling [69]. It is recommended for preliminary project analysis and feasibility studies [69].
Both SAM and RETScreen provide default input data. It is the user’s responsibility to modify the input data as required.
2.4.1. Input Data Requirements
PVWatts and SAM require one year of hourly data for at least two components of solar irradiance (i.e., diffuse horizontal radiation, direct normal radiation and global horizontal radiation), ambient dry bulb temperature and wind speed [70]. However, in SAM’s detailed photovoltaic model, two of the three solar irradiance measurements can be used to calculate the plane of array (POA) irradiance, or the user can input a single POA irradiance time series from a reference cell or a pyranometer. SAM’s detailed PV model uses a decomposition model to separate the POA irradiance data into direct normal and diffuse horizontal irradiance [70,71]. PVWatts’s web application does not allow users to specify their data but allows access to three online solar resource databases. Data used in PVWatts’s desktop version and SAM’s detailed photovoltaic model can be the user’s data, downloaded from the internet or automatically downloaded from the NREL National Solar Radiation Database for solar resource data and ambient weather conditions [50].
RETScreen requires the site’s monthly average daily radiation on the horizontal surface and average monthly temperatures [69]. In contrast, SAM requires one year of hourly data. RETScreen has a climate database that provides meteorological data necessary for the model to run, such as solar radiation and temperature. It allows the user to overwrite the data with their site-measured data [72]. RETScreen has two levels of feasibility analysis for photovoltaic projects that differ in complexity. Level 1 is typically used when details of the PV equipment data are unavailable and is thus a simplified version of Level 2.
2.4.2. Energy Losses and Derate Factors
PVWatts, SAM detailed photovoltaic model and RETScreen estimate losses either by modelling the losses or using derate factors. Derate factors are provided as percentage losses, which are scaling factors that account for reduced power output due to actual conditions compared with standard test conditions [42].
PVWatts provides default derate factors for losses due to the factors such as soiling, shading, snow cover, mismatch, wiring, connections, light-induced degradation, nameplate rating, system age and operational availability (Table 1). The user can change these derate factors to that representative of the system.
Explicitly modelled losses are those due to cell temperature and angular reflectivity. For example, PVWatts calculates the operating cell temperature using an energy balance model [73], which uses parameters such as the total incident POA irradiance, wind speed and dry bulb temperature. The desktop version of PVWatts includes options to specify the shading losses via a derate factor or to import shading data and model the shading effect [70].
SAM’s detailed photovoltaic model has multiple temperature models, module models, external shading losses, self-shading models and various inverter models. However, it uses derate factors to account for DC and AC losses (Table 1), and default values are provided.
In RETScreen’s photovoltaic level 1 model, the user must enter the CF of the photovoltaic system. RETScreen provides a database of typical CFs (5 to 20%) to assist the user. In the level 2 model, user inputs include the nominal efficiency of the PV module, inverter efficiency and several types of photovoltaic and inverter losses. The online RETScreen manual [69] also recommends particular values (Table 1). The temperature coefficient of the module is also modelled.
SIDS, which are now considering as incorporating solar energy in their energy mix and have limited ground measured climatic, may not meet the necessary data requirements of SAM and RETScreen. Such countries may find a prefeasibility tool that requires fewer climatic datasets or data of a lower temporal resolution useful.
3. Materials and Methods: Proposed Prefeasibility PV Model for Low-Latitude Areas with Limited Datasets
This work presents a site-representative prefeasibility assessment tool for utility-scale photovoltaic systems for Caribbean SIDS with limited datasets. The islands may not have all required climate input data for using existing prefeasibility PV tools, which also do not recommend derate factors appropriate to low-latitude small islands. In this study, we consider when only a single (annual, seasonal or monthly) global horizontal irradiance data value is available and propose an adapted prefeasibility PV assessment tool with appropriate derate factors. The PR is derived by estimating the impact of the associated derate factors reflective of tropical conditions and is used in place of system performance data as such data are unavailable for Caribbean SIDS. The proposed prefeasibility tool is designed to accommodate the use of lower temporal resolution site-measured irradiation. It also does not require any other meteorological time-series data such as temperature or wind speed; however, the accuracy will be lower. Due to using low temporal resolution solar radiation data, the resource’s temporal variability will not be reflected. The primary purpose of the proposed prefeasibility tool is to estimate the annual energy output of a PV system due to real-world operating conditions compared with the PV system’s rated conditions and the associated levelized cost of electricity (LCOE) for the lifetime of such a system.
3.1. Proposed Derating Factor PV Model
The energy output of the PV system (Equation (8)) is estimated via an estimate of the PR (Equation (5)). Several derate factors affect the PR. Section 3.2.2 reviews the literature for appropriate values of the derate factors influenced by environmental factors to comprise the proposed prefeasibility tool for low-latitude islands. System derate factors are listed in Section 3.2.3. This proposed tool considers maximum, baseline and minimum losses. In the proposed tool, several loss factors are represented by a range of values rather than a single value as the performance of grid-connected PV systems at a particular location will vary on clear and cloudy days [74]. The baseline model will comprise the average expected losses.
3.2. Derate Factors
3.2.1. Efficiency of the PV Module
3.2.2. Site-Related (Environmental) Derate Factors
Several environmental derate factors affect the efficiency of the PV modules.
Air Mass
In general, efficiency is a function of global irradiation, cell temperature and air mass [80]:
where η is the cell efficiency, G is the global irradiation, Tcell is the cell temperature, and AM is the relative air mass. Under standard testing conditions (STC), G = 1000 W/m2, Tcell = 25 °C and AM = 1.5 [32].
η = f (G, Tcell, AM),
As air mass prevents a PV system from operating at its rated capacity, an effective operating efficiency of the cell ηeff is defined as the product of the efficiency due to the difference in air mass compared with STC and the efficiency under standard test conditions:
ηeff = ηSTC(1.5AM) ηAM,
In Equation (10), ηSTC(1.5AM) is the rated efficiency of the module, STC(1.5AM) is used to denote that the rated capacity occurs under STC, ηAM is the efficiency related to the difference in air mass compared with STC and 1 − ηAM is the loss due to the difference in air mass compared with STC.
Cheegar and Mialhe [32] found that efficiencies of both monocrystalline and multicrystalline cells increase when the AM increases from 1 to 2.77 where AM1 presented a loss factor of 1% compared with AM1.5 and AM2.77 which presented a 1% gain in efficiency.
Durisch et al. [80] showed the efficiencies of a monocrystalline module with STC efficiency of 15.4% and a multicrystalline module with STC efficiency of 12.7% varied between 15 to 16% and 11% and 13%, respectively, when AM was varied between 1 and 8.
As calculated according to [33,81,82,83], the air mass at the lower latitudes of the Caribbean region (0°N) have AM hourly averages between 1.24 and 5.06 from 6 am and 6 pm. At the higher latitudes (30°N), the hourly AM averages vary between 0.00 and 12.31, with the high hourly air mass of 12.31 occurring only at 6 am. Between 7 am and 6 pm, the daily average of air mass varies between 0.00 and 6.07. Thus, with reference to [32] and [80], the inefficiency of a photovoltaic system due to the difference in air mass at the site relative to that of STC conditions is estimated to be 0% to 1%. The baseline model considers an inefficiency of 1.0% due to the effect of AM.
Tilt
The direct insolation received by a PV module can be maximized by choosing an optimal tilt angle. The angle is usually the site’s latitude, with the modules oriented toward the Equator [84]. Hence, for low-latitude SIDS located within 30° of the Equator, the optimal tilt angle would be between 0° and 30°. The total radiation received on a surface with a defined tilt and azimuth is referred to as the global tilted irradiation (GTI) and is the sum of the scattered, direct and reflected radiation [85].
If GTI at the optimal tilt angle is available for a site, it should be used as input into this proposed model.
If GTI data are unavailable, decomposition and transposition models can be used to predict GTI [86]. Global horizontal irradiance (GHI) and diffuse horizontal irradiance (DHI) are used in transposition models to predict GTI [86]. If only GHI is available, decomposition models are used to estimate direct normal irradiance (DNI) and DHI [86]. However, the prediction error increased when decomposition and transposition models were combined and evaluated for tropical regions. Furthermore, the magnitude of the prediction error increases as the tilt angle increases [86]. Other studies have shown that the decomposition models result in different biases based on location [87,88], resulting in possible over- and underestimations of the solar resource. Biases in transposition models depend on the model and the locations. In locations where no available ground measurements and modelled GHI are used, bias and random errors in the modelled GHI will contribute to errors in the final plane of array (POA) irradiance estimate [88]. In order to reduce bias and random errors that may occur due to the use of a transposition model to calculate the POA of a tilted module, a horizontal module whose POA will be equivalent to the GHI in the measured dataset is considered.
Shading
Shading PV modules reduces PV output with losses as low as 1% with good system designs and a reasonable ground cover ratio [12]. Shading losses were estimated at 2% for residential systems in France and Belgium [89,90] and 5.99% for polycrystalline modules partially shaded by an electrical cable [91]. In this study, it was assumed that PV systems would be set up in flat terrain, that they would be isolated from the shading of vegetation and buildings and that systems would be optimized to reduce the impact of shading. A baseline loss of 2% was adopted for the Caribbean SIDS to account for shading caused by the weather [92]. An overall minimum loss rate of 1.0% and a maximum loss rate of 6.0% were adopted for sensitivity analyses.
Angular Reflectivity
Angular reflection losses in PV modules were estimated for Bangkok (latitude of 13.4˚N) [93] and Singapore (latitude of 1.35˚N) [94]. Losses ranged from 3% to 4% at 0˚ tilt in Bangkok [93] and between 3.3% and 3.8% at 10˚ tilt in Singapore [94]. Thus, an inefficiency of 3.5% is assumed for angular reflectivity losses for the baseline model of the proposed prefeasibility tool.
Soiling
The power loss of PV modules due to soiling depends on the dust type, the length of time since the last rainfall and the cleaning maintenance schedule [18,95]. Shading effects on PV modules due to soiling by bird dropping, dirt, leaves and pollution can be removed by regular cleaning [92]. Airborne dust is a significant contributor to soiling [95,96,97,98]. While the Caribbean islands are exposed to Sahara dust annually and mainly during the summer [99], rainfall during the summer will reduce the degree of soiling. In Barbados, [34] found that the highest Sahara dust concentrations occurred from April to July, with an average of 12 days of rain per month [34].
Soiling can cause more than 1% loss per day [95,96,100,101]. In temperate climates, radiation can be reduced by 1%, while in dry and dusty climates, absorbed radiation can be reduced by 2% [33]. A 2% to 2.5% loss was found for modules that were washed each week in Libya from February to May [35]. The study area was a desert environment with rare rainfall and had a local western wind that usually carried dust [35]. One study in California and the Southwest region of the United States found an annual performance losses of 1.5% to 6.2% [102]. For a 171.36 kWp solar park in Germany, soiling loss was 6–7% during the summer, 4–5% during the winter, and 5.86% annually [18]. For the Caribbean SIDS, where rainfall is typical for half the year, a 1.5% loss was used in the baseline model, which is midway between the 1% and 2% loss defined by [33] for temperate climates, and a range of 1% to 7% may be considered in a sensitivity analysis.
Temperature
The performance of a PV module decreases with an increase in its temperature, which is affected by ambient temperature, light intensity and local wind speed [103,104,105]. This study assumes that measured global horizontal irradiance is available but not a complementary dataset of temperature or wind speeds. In reviewing the literature on the effect of ambient temperature on PV module performance, the monthly temperatures in the Caribbean islands were considered. These range, on average, from the low 20s °C to the upper 20s °C [106].
For a reasonable estimate of the effect of ambient temperature on the performance of PV systems, a study in Colombia [107] was reviewed as its geography includes coastal lowlands and a 1000-mile Caribbean coast. This study considered the module temperature to be a function of the irradiance and the ambient temperature and estimated a 10% loss in the component efficiency due to temperature and other losses generated on a photovoltaic panel [107]. In Colombia, the mean annual temperatures can range from 11 °C to 29 °C depending on location, and maximum temperatures and minimum temperatures are 17.2 °C–33.8 °C and 5.8 °C–25.9 °C, respectively [108]. Colombia has an annual average daily solar radiation of 5.35 kWh/m2-day [107], which is comparable with the 4–7 kWh/m2-day experienced in the Caribbean [109]. The warmer temperatures in Colombia are similar to the temperature of the islands of the Caribbean during the warmer months of August to December [106], when PV modules are more likely to experience a change in performance.
Studies for other regions, such as those by [105], found that temperature can influence PV output over a wide range. In Europe, Africa and Asia, the effects of temperature and irradiance on the PR of crystalline silicon varied from −15% to +5% depending on the location [105]. In Italy (41° N latitude), a 7% loss is expected due to temperature [110].
Since Colombia’s warm temperatures are similar to those of the Caribbean, the baseline temperature loss is taken as 10.0% and the maximum loss as 15%. The minimum loss is 8.5%, the mid-point between 7% for Italy, where climatic temperatures are lower than those in the Caribbean (monthly mean maximum and minimum temperatures are 25.2 °C and −9.1 °C) [111], and 10% for Columbia.
The environmental derate factors and values for the Caribbean SIDS and this prefeasibility assessment tool are summarized in Table 2.
3.2.3. System-Related Derate Factors
The proposed model accounts for four main system-related derate factors (Table 3). The assumed minimum, maximum and baseline losses are based on the derate factors found in the literature.
3.3. LCOE Model
The LCOE is a standard metric used in energy generation projections and technology assessments [115] and is used when comparing electricity generation technologies or considering grid parities for emerging technologies [78,116,117,118]. The LCOE is the net present total life cycle cost of the project per quantity of energy produced [119].
A constant-dollar, no-tax, LCOE [120] was assumed in this study. The no-tax assumption is often applied to nonprofit and government ventures [120]. The following equations define the LCOE:
where
LCOE = TLCC/ΣNn=1 (EPV n/(1 + d)n),
TLCC = I + PVOM,
PVOM = ΣNn=1 (O&Mn/(1 + d)n),
TLCC = Total life cycle cost
EPV n = Energy output or energy saved in year n
d = Discount rate
N = Analysis period
I = Initial investment
PVOM = Present value operating, maintenance and fuel expenses
O&M = Annual operating, maintenance and fuel expenses
Table 4 shows the cost data [121,122] used to model the total life cycle cost of PV systems. Good-quality photovoltaic modules have an expected lifetime of 25–30 years [39,117,121] and a degradation rate of 0.70% per year [121].
The proposed tool may be applied to any capacity system. For this study, the case of a 50 MW system is considered. Trinidad and Tobago has no existing utility-scale systems, and as such, the minimum size, 50 MW, of the utility-scale system was chosen. Even though this size system has a higher investment cost per W than a 100 MW system (USD 1.13 USD/W compared with USD 1.06 USD/W [121,122]), it has a lower overall cost (56,500 USD compared with 106,000 USD [121,122]). The lower overall cost may also be more favorable to an investor. Since no other large-sized utility system currently exists, the installation and monitoring of the minimum-sized utility-scale systems will provide operational performance data that can be used to improve feasibility analyses of other systems. Such monitoring would reduce investment risk and assist in determining whether investments in larger systems would be feasible.
The discount rate reflects the opportunity cost of an investment, which depends on the investment’s risk profile [123]. A 10% discount rate is used according to the recommendations of IRENA [124] for non-OECD countries. This discount rate is recommended for investments with considerably more significant financial, technological and price risks [125], as may be the case for countries with no PV farms.
4. Performance of the Proposed Prefeasibility PV Model with Existing Models for a Caribbean SIDS: Trinidad and Tobago
4.1. Energy and Economic Situation and Past Solar Resource Assessments
The case study island, the Republic of Trinidad and Tobago, is the southernmost island state in the Caribbean region (Figure 2). Trinidad and Tobago is one of the few SIDS with local natural gas and oil resources. As such, electricity tariffs, USD 0.04–USD 0.06 per kWh, are low compared with most of the Caribbean region [126]. The island state is one of the highest emitters of GHGs per capita among the SIDS [127]. Thus, integrating renewable energy for power generation is an objective in the country’s commitment to the Paris Accord Agreement [128], aiming to generate 10% of power from renewable energy by 2021 [129]. Due to a low electricity tariff, the grid parity of utility-scale PV systems will play a key role in integrating solar PVs into Trinidad and Tobago’s energy matrix.
Currently, a complete solar resource assessment is unavailable for Trinidad and Tobago. Solar resource assessments have been limited mainly to the climatological assessment of solar radiation data and the development of models for predicting monthly solar radiation [132,133,134]. Existing literature on prefeasibility assessments of the solar potential for Trinidad and Tobago consists of policy development roadmaps in which modelled datasets, such as those from the World Bank SolarGIS [135] and PVWatts [136], were used. In addition, one of these studies assumed a PR for PV systems (81.5%) [137]. As noted in Section 1, modelled data may have inherent uncertainties if not validated with high-quality ground-measured in situ solar datasets. As such, the prefeasibility model proposed in this study was used with limited available solar radiation data for the island state to determine the feasibility of utility-scale grid-integrated PV systems.
4.2. Solar Radiation Datasets, Quality Control and Climate
Daily and hourly global insolation on a horizontal plane for the respective periods of 2001 to 2010 and 2002 to 2015 were obtained from the Trinidad and Tobago Meteorological Service for the Piarco International Airport (Figure 2). The dataset was subjected to quality control procedures outlined by the World Meteorological Organization (WMO), including checks for missing days, negative values and zero values. Additionally, the daily data were checked to determine if they exceeded the upper limit of each month and if they fell below the lower limit [138]. Months with missing daily totals were not used for calculating monthly solar radiation totals [138]. Annual totals were not calculated if any month in a year was labelled invalid [138]. Overall, there were 300 instances of missing days, 2 instances of negative values, and 3 instances of zero values in the daily dataset. The hourly dataset consisted of two periods in the 2002–2015 time frame: January 2002 to January 2006 and January 2010 to March 2016. From 2002 to January 2006, the hourly dataset had 1146 invalid values, for example, either consistent zeros for an extended period, a duplicate of another section of the time series or negative. In addition, between 2010 to 2015, 23.4% of the data were invalid. After subjecting the data to all the quality control steps outlined by WMO, one valid year of data (2003) was deemed acceptable for use.
The variation in the daily total insolation on a horizontal plane over 2003 ranged from 0.85 to 6.15 kWh/m2 with a daily average of 4.41 kWh/m2 (Figure 3).
As the proposed prefeasibility tool used the annual total insolation on a horizontal plane as its only climatic data input, annual total insolation on a horizontal plane was found by summing the daily insolation on a horizontal plane for each day of the year. The annual total insolation on a horizontal plane for 2003 was found to be 1610 kWh/m2.
Since Trinidad and Tobago has two seasons, a dry season that spans the months of January to May and a wet season that extends from June to December, the energy output per season was also investigated. The seasonal insolation on a horizontal surface was found by summing the daily insolation on a horizontal plane for each day of the season and input to the proposed model. The total insolation on a horizontal plane for 2003 for the dry and wet seasons was 729.7 and 880.6 kWh/m2, respectively.
5. Results and Discussion
5.1. Performance of the Proposed Prefeasibility Tool for the Case Study
5.1.1. Performance Ratio (PR)
The PR represents the losses’ overall effect on the photovoltaic system’s rated output [12]. Using the proposed tool, the site-representative PR for utility-scale systems in Trinidad and Tobago is 72% with the baseline derate factors. When maximum and minimum derate factors were considered for maximum and minimum losses, the estimated PR ranges between 57 and 82%.
A previous study [137] used the upper end of this range (PR of 81.5%) for a PV system in Trinidad and Tobago. A lower PR, such as the 72% found in this study, would indicate lower energy output and higher associated costs. At the prefeasibility stage, in designing a PV system for regions with limited climatic measurements and nonexistent large-scale PV systems, a PR that is reflective of the site’s conditions would be best for use, regardless of the magnitude. For example, using a higher PR that is not specific to the local climate will lead to an overestimation of energy output and associated revenue projections. Alternatively, using a lower PR, which is not specific to the local climate, will lead to an underestimation and potential project rejection. Considering the already limited data, a PR estimation representative of the local climate is needed. In [137], the PR of 81.5% was used based on the assumption that typical systems have performance ratios between 80 and 90% and because the software tool PV Sol® Software Expert 5.5 (R4 version) recommends 81.5% as a good value. In this study, also considering the lack of system performance data in the region, the PR of 72% is derived from estimations of the impact of the associated derate factors reflective of tropical conditions.
One of the points of interest is how the proposed tool compares with existing prefeasibility PV tools. The results from PVWatts, SAM’s detailed PV model from SAM Version 2018.11.11 and RETScreen Version 7 were compared. It was found that the PR of the proposed PV tool (72%) is slightly less than that determined by RETScreen (74%) and SAM’s prefeasibility model, PVWatts (76%) and even lower than SAM’s detailed PV model (80%). It appears that tools using limited ground measurements (the proposed tool and RETScreen) tend to produce estimates of PV performance that are more cautious than models using modelled input solar radiation data (SAM’s PVWatts and SAM’s detailed PV models).
5.1.2. Estimates of Energy Produced from a 50 MW PV Farm and Corresponding Capacity Factors
Annual Estimations
Associated with the representative PR of 72% is the estimated annual energy output of a 50 MW PV plant of approximately 57,890 MWh. In contrast, maximum losses lead to an energy output of 45,510 MWh, and minimum losses lead to 64,600 MWh. The corresponding CF for the baseline derate factor was 13.2%, with a minimum CF of 10.4% corresponding to maximum losses and a maximum CF of 15.0% corresponding to minimum losses.
Annually, the industry models, PVWatts, SAM’s detailed photovoltaic model and RETScreen, projected greater energy output for a 50 MW system than this study’s proposed model. RETScreen’s estimate is 8.7% more than the energy output of the proposed model, while PVWatts and SAM’s detailed photovoltaic models were 31.2% and 38.2% greater.
Seasonal Estimations
Associated with the representative PR of 72%, the energy output per month and the CF during the dry season exceeded that of the wet season. During the dry season, the energy output per month was estimated to range between 4130 MWh and 5940 MWh, while the CF ranged between 11.4% and 16.4%, depending on the loss model used (Figure 4). During the wet season, the energy output per month was estimated to range between 3560 MWh and 5120 MWh, while the CF ranged between 9.7% and 14.0%, depending on the loss model used (Figure 4). PVWatts, SAM’s detailed photovoltaic model and RETScreen do not permit seasonal analysis.
Monthly Estimations
The monthly energy output and the CF associated with the representative PR of 72% range between 3100 MWh and 6460 MWh and 8.6% and 17.7%, depending on the loss model used (Figure 5). The highest energy output per day and CF were observed in April, while the lowest values were observed in November and December.
The industry models, PVWatts, SAM’s detailed photovoltaic model and RETScreen, projected greater monthly energy output for a 50 MW system than this study’s proposed model (Figure 6). RETScreen’s estimate is 4.1% to 15.9% more than the energy output of the proposed model, while PVWatts and SAM’s detailed photovoltaic models were 25.3% to 37.6% and 30.2% to 44.8% greater, respectively.
5.1.3. Comparison of Input Solar Radiation Datasets Used in Existing Prefeasibility Tools with Ground-Measured Datasets
This section compares the solar radiation dataset used as input into the proposed prefeasibility model with those for SAM and RETScreen. For the PV model proposed in this work, measured daily solar irradiance was used to compute an annual total for Piarco, Trinidad and Tobago. SAM uses the National Solar Radiation Database (NSBRN) Physical Solar Model Version 3 (PSM) dataset for Mexico and Central America [139]. The PSM V3 model considers the physics of clouds, aerosols, water vapour and the primary atmospheric constituents impacting solar radiation [140]. In contrast, RETScreen provides ground-measured data for Trinidad and Tobago at Piarco [72]. However, RETScreen does not specify the time frame for its dataset.
The annual solar radiation total from the ground measurements taken by the Trinidad and Tobago Meteorological Service was 1610 kWh/m2. The totals used by RETScreen (1707 kWh/m2) and PSMV3 (2013 kWh/m2) were 6% and 25% greater than the annual solar radiation total from the ground measurements. Thus, it was expected that the prefeasibility tool SAM, which uses PSMV3 as its input, would produce estimates of PV output significantly greater than that produced by RETScreen and the prefeasibility tool proposed in this study.
Although the annual solar radiation total was used as input in the prefeasibility model, the differences in monthly averages of the solar radiation among the datasets were compared. It should be noted that the monthly averages for the measured data at Piarco were computed from daily totals, RETScreen has monthly averages of past measurements and PSMV3 computes the monthly averages from model-derived hourly solar radiation values.
It was found that the PSM V3 2003 dataset overestimated the ground-measured data (Figure 7) [29,30]. Thus, prefeasibility assessments may benefit from using limited ground measurements of solar radiation over modelled irradiance datasets.
In contrast, the ground-measured solar radiation data from RETScreen’s input database showed a smaller bias than the PSM V3 2003 modelled data. RETScreen’s monthly bias range between 1.8 and 11.9% (Figure 8), resulting in an annual overestimate of 6.0%. The differences between the monthly ground-measured data and RETScreen’s input data may be due to inter-annual variations in the solar resource since RETScreen did not allow the selection of solar radiation data for specific periods. These differences are smaller than the overestimate of 25.0% from the PSM V3 2003 dataset and support the use of limited ground-measured datasets for prefeasibility PV assessments.
5.2. Levelized Costs of Electricity (LCOE) Generation
Since Trinidad and Tobago has no existing utility-scale systems, the minimum size, 50 MW, of the large utility-scale system was chosen to determine LCOE generation. This size system has a higher investment cost per W than a 100 MW system (USD 1.13 USD/W compared with USD 1.06 USD/W [122]) but has a lower overall cost (USD 56,500 compared with USD 106,000 [122]), which could be more favorable to an investor.
The baseline LCOE was USD 0.12/kWh for 50 MW systems. According to Lazard [141], the global LCOE for utility crystalline systems ranges between USD 0.036/kWh and USD 0.044/kWh. The LCOE was significantly larger than the global value. However, it is comparable with the 2018 LCOE of USD 0.11/kWh found for Latin America and the Caribbean [142] and twice that of the 2020 global weighted average LCOE for utility-scale PV systems [143].
The calculated LCOEs are also larger than the residential electricity tariffs (USD 0.04–USD 0.06/kWh) in Trinidad and Tobago. This first approximation suggests that Trinidad and Tobago may need to consider subsidizing photovoltaic systems to ensure economic feasibility. The current electricity tariff is a subsidized cost that does not consider the cost of natural gas, a local resource that is used in power generation. Solar PV may be attractive for utility-scale electricity generation if these subsidies are removed.
The baseline LCOE found here is less than that estimated by [137], where LCOE estimates were USD 0.14-USD 0.288 per kWh at 2012 prices despite using a higher PR than that estimated in this study. Differences in LCOE may be attributed to different assumptions for the LCOE model. However, details were not provided in [137].
5.3. Sensitivity of the Prefeasibility Model’s Results to Derate Factors
One proposed prefeasibility PV tool’s attributes represent several loss factors as a range of values rather than a single value. The tool considers maximum, baseline and minimum losses.
5.3.1. Sensitivity of PR, CF and LCOE to Climatic, Site-Related Derate Factors
The baseline model consisted of the cumulative baseline losses due to climatic and systematic derate factors and module efficiency. Of the five site-related derate factors considered (air mass, shading, angular reflectivity, soiling and temperature), the maximum losses due to soiling and temperature showed the greatest impact on the PR, with maximum losses contributing to a 4% reduction in the PR relative to the baseline; the resulting reduction in the CF was 0.7% (Table 5). Cooling and regular washing systems and schedules should be included in future feasibility system designs to both reduce these losses and improve the PR and CF of such systems.
The baseline LCOE of USD 0.12/kWh was unaffected by the range of the derate considered for air mass and angular reflectivity (Table 5). When considering the maximum derate for shading, temperature and soiling, the LCOE increased to USD 0.13/kWh. Although this increase of USD 0.01 does not appear significantly to affect the baseline LCOE, this difference is equivalent to 25% of Trinidad and Tobago’s present residential electricity tariff for 1 to 400 kWh of electricity consumption and represents a high cost to consumers.
The cumulative maximum and minimum losses due to all five site-related derate factors were compared with the baseline model. Cumulative maximum losses result in a decrease in the PR by 10.7%, while the CF decreased by 2.0% (Table 6), implying that cumulative maximum losses significantly affect the PR and CF of the system.
When the cumulative effect of the five site-related derate factors was considered, the LCOE was found to vary between USD 0.12/kWh and USD 0.15/kWh for cumulative maximum and minimum losses, respectively.
5.3.2. Sensitivity of PR, CF and LCOE to System-Related Derate Factors
The cumulative maximum and minimum losses due to all four system-related derate factors (losses due to the effect of internal network resistances, the inefficiency of the inverter and transformer, and losses incurred due to technical availability) were compared with the baseline model’s results.
When considering the maximum losses, the PR decreased by 5.5% while the CF decreased by 1.0%. Thus, maximum system-related losses are smaller than the decreases observed due to the cumulative effect of the site-related derate factors. When considering the minimum losses due to the cumulative effect of the system-related derate factors, a 5.8% increase in the PR was observed. Minimum system-related losses were greater than the 3.5% increase observed due to the cumulative effect of the site-related derate factors. With maximum system losses, the LCOE was USD 0.14/kWh, while with minimum losses, LCOE was estimated at USD 0.12/kWh.
5.3.3. Sensitivity of PR, CF and LCOE to Site-Related and System-Related Derate Factors
The cumulative maximum and minimum losses due to all site-related and system-related derate factors were compared with the baseline model. The PR varied from 56.6% to 81.5%, with a baseline of 71.9%. The CF varied from 10.4% and 15.0%, with a baseline of 13.2%. Table 7 shows the differences between the PR and the CF of the cumulative minimum derate factor model, the cumulative maximum derate factor model and the baseline derate factor model.
When the cumulative effects of site-related and system-related derate factors, as well as module efficiency were considered, the LCOE was found to vary between USD 0.11/kWh and USD 0.16/kWh with differences between USD 0.01/kWh and USD 0.03/kWh (Table 7) in comparison to the baseline model.
This first approximation shows that improving the system to reduce losses due to the climatic factors of temperature, soiling, and system-related derate factors can significantly improve the system’s performance. While the first approximation variation in losses does not significantly affect the LCOE in US dollars (USD 0.01/kWh and USD 0.03/kWh), it may translate to a change in electricity tariffs of 25–75% in Trinidad and Tobago. Thus, power purchase agreements and subsidies should be considered for solar-generated electricity.
In addition, the LCOE for the baseline energy model (USD 0.12/kWh) was compared with that found using the default input datasets and PV energy models for PVWatts, SAM and RETScreen. Considering that the derating factor model used is a simple model intended to perform preliminary estimates of energy outputs with rough financial metrics, it performs comparably with the results obtained from PVWatts (USD 0.10/kWh), SAM (USD 0.09/kWh) and RETScreen (USD 0.11/kWh). The range of LCOEs when considering maximum and minimum losses of the proposed model, USD 0.11/kWh–USD 0.16/kWh, is still greater than the estimates from PVWatts, SAM and RETScreen. As such, this possible range should be considered for appropriate fiscal policy measures to integrate utility-scale PV into the Caribbean island state of Trinidad and Tobago.
6. Conclusions
This study proposed a prefeasibility PV model that could take as input limited climatic solar measurements available in tropical SIDS. Using an annual irradiation measurement as input, the annual energy output of photovoltaic systems can be estimated and fed into a levelized cost of electricity model. The model considers derate factor values relevant to low-latitude tropical small islands. In addition, the model was used with limited solar radiation dataset for the Caribbean island state of Trinidad and Tobago to estimate the energy output and LCOE for a 50 MW utility-scale PV plant. The results were compared with two existing prefeasibility tools, RETScreen and SAM. The proposed model performed comparably with RETScreen and provided more cautious estimates of PV performance than SAM. This may be due to using ground-based data in the proposed model and RETScreen while SAM used modelled solar radiation data. SAM’s modelled dataset, PSM V3, overestimates the annual solar irradiance by 25% for Trinidad and Tobago, which is a significant bias. As such, limited ground measurements are preferred to modelled data for prefeasibility PV assessments. The proposed tool offers a significant benefit, in that, a single measured irradiation input value can lead to comparable results as with existing industry tools. In addition, the proposed model estimates the performance ratio of PVs using relevant environmental and system derate factors rather than taking a performance ratio value from the user as input. This approach may be preferred as there is a lack of operational PV performance ratio data in small island states.
Furthermore, considering the range of environmental derate factors, the LCOE for the case study island state of Trinidad and Tobago was between USD 0.12/kWh and USD 0.15/kWh for cumulative maximum and minimum losses, respectively. When both environmental and system derate factors were considered, this range extended to USD 0.11/kWh and USD 0.16/kWh. The LCOEs found were comparable with IRENA’s 2018 estimate of USD 0.11/kWh for Latin America and the Caribbean [142]. Additionally, by using the proposed prefeasibility model and relevant derate factors, the suggested range of LCOE estimates indicate that fiscal policy measures are required to successfully integrate utility-scale PV in the Caribbean island state of Trinidad and Tobago as current electricity tariffs (USD 0.04/kWh–USD 0.06/kWh) are approximately half the estimated LCOEs.
Once PV systems are established in small island states, attention should be paid to monitoring the systems and collecting data to determine and validate technical performance parameters such as the performance ratio and capacity factor. In addition, the derate factors should be validated and made publicly available. Values for these parameters could be used as defaults in prefeasibility assessment tools for small island case studies.
Author Contributions
Conceptualization, N.D., X.T.C. and R.M.C.; Data curation, N.D.; Formal analysis, N.D., X.T.C. and R.M.C.; Investigation, N.D.; Methodology, N.D.; Project administration, N.D.; Resources, R.M.C.; Software, N.D.; Supervision, X.T.C. and R.M.C.; Validation, N.D.; Visualization, N.D.; Writing—original draft, N.D.; Writing—review & editing, N.D., X.T.C. and R.M.C. All authors have read and agreed to the published version of the manuscript.
Funding
Nalini Dookie was partially supported by a scholarship from the National Gas Company, Trinidad and Tobago.
Data Availability Statement
Solar irradiation data were obtained from the Trinidad and Tobago Meteorological Service and are available directly from the Service by request to [email protected].
Acknowledgments
Sincere thanks to the Trinidad and Tobago Meteorological Office for providing data for this project.
Conflicts of Interest
The authors declare no conflict of interest .
References
- Nurse, L.A.; McLean, R.F.; Agard, J.; Briguglio, L.P.; Duvat-Magnan, V.; Pelesikoti, N.; Tompkins, E.; Webb, A. Part B: Regional Aspects. Contribution of Working Group II to the Fifth Assessment Report of the Intergovernmental Panel on Climate Change. In Climate Change 2014: Impacts, Adaptation, and Vulnerability; Barros, V.R., Field, C.B., Dokken, D.J., Mastrandrea, M.D., Mach, K.J., Bilir, T.E., Chatterjee, M., Ebi, K.L., Estrada, Y.O., Genova, R.C., et al., Eds.; Cambridge University Press: Cambridge, UK, 2014; pp. 1613–1654. [Google Scholar]
- The Government of Barbados. Barbados Intended Nationally Determined Contribution 2015. Available online: https://www4.unfccc.int/sites/submissions/INDC/Published%20Documents/Barbados/1/Barbados%20INDC%20FINAL%20September%20%2028,%202015.pdf (accessed on 24 June 2020).
- The Government of Cuba. República de Cuba Contribución Nacionalmente Determinada Convención Marco de las Naciones Unidas Sobre El Cambio Climático 2015. Available online: https://www4.unfccc.int/sites/submissions/INDC/PublishedDocuments/Cuba/1/RepublicofCuba-INDCs-Nov2015.pdf (accessed on 24 June 2020).
- The Government of Dominica. Intended Nationally Determined Contribution (INDC) of The Commonwealth of Dominica 2015. Available online: https://www4.unfccc.int/sites/submissions/INDC/Published%20Documents/Dominica/1/Commonwealth%20of%20Dominica-%20Intended%20Nationally%20Determined%20Contributions%20(INDC).pdf (accessed on 24 June 2020).
- The Government of Grenada. Grenada iNDC 2015. Available online: https://www4.unfccc.int/sites/submissions/INDC/PublishedDocuments/Grenada/1/GrenadaINDC.pdf (accessed on 24 June 2020).
- Republique D’Haïti Ministere de L’Environnement. Contribution Prévue Déterminée au niveau National 2015. Available online: https://www4.unfccc.int/sites/submissions/INDC/PublishedDocuments/Haiti/1/CPDN_Republiqued’Haiti.pdf (accessed on 24 June 2020).
- The Government of St Lucia. Saint Lucia Intended Nationally Determined Contribution Under the United Nations Framework Convention on Climate Change (UNFCCC) 2015. Available online: https://www4.unfccc.int/sites/submissions/INDC/Published%20Documents/Saint%20Lucia/1/Saint%20Lucia's%20INDC%2018th%20November%202015.pdf (accessed on 24 June 2020).
- IRENA. Renewable Power Generation Costs in 2019. 2020. Available online: https://www.irena.org/-/media/Files/IRENA/Agency/Publication/2020/Jun/IRENA_Power_Generation_Costs_2019.pdf (accessed on 25 June 2020).
- Makrides, G.; Zinsser, B.; Norton, M.; Georghiou, G.E.; Schubert, M.; Werner, J.H. Potential of photovoltaic systems in countries with high solar irradiation. Renew. Sustain. Energy Rev. 2010, 14, 754–762. [Google Scholar] [CrossRef]
- Dierauf, T.; Growitz, A.; Kurtz, S.; Cruz, J.L.B.; Riley, E.; Hansen, C. Weather-Corrected Performance Ratio 2013. Available online: http://www.nrel.gov/docs/fy13osti/57991.pdf (accessed on 3 February 2021).
- Ma, D.; Pan, G.; Xu, F.; Sun, H. Quantitative Analysis of the Impact of Meteorological Environment on Photovoltaic System Feasibility. Energies 2021, 14, 2893. [Google Scholar] [CrossRef]
- Reich, N.H.; Mueller, B.; Armbruster, A.; van Sark, W.G.J.H.M.; Kiefer, K.; Reise, C. Performance ratio revisited: Is PR > 90% realistic? Prog. Photovolt. Res. Appl. 2012, 20, 717–726. [Google Scholar] [CrossRef]
- Humada, A.M.; Aaref, A.M.; Hamada, H.M.; Sulaiman, M.H.; Amin, N.; Mekhilef, S. Modeling and characterization of a grid-connected photovoltaic system under tropical climate conditions. Renew. Sustain. Energy Rev. 2018, 82, 2094–2105. [Google Scholar] [CrossRef]
- Farhoodnea, M.; Mohamed, A.; Khatib, T.; Elmenreich, W. Performance evaluation and characterization of a 3-kWp grid-connected photovoltaic system based on tropical field experimental results: New results and comparative study. Renew. Sustain. Energy Rev. 2015, 42, 1047–1054. [Google Scholar] [CrossRef]
- Anang, N.; Syd Nur Azman, S.N.A.; Muda, W.M.W.; Dagang, A.N.; Daud, M.Z. Performance Analysis of a Grid-Connected Rooftop Solar Pv System in Kuala Terengganu, Malaysia. Energy Build. 2021, 248, 111182. [Google Scholar] [CrossRef]
- Khatib, T.; Sopian, K.; Kazem, H.A. Actual performance and characteristic of a grid connected photovoltaic power system in the tropics: A short term evaluation. Energy Convers. Manag. 2013, 71, 115–119. [Google Scholar] [CrossRef]
- Amaro e Silva, R.; Monteiro Baptista, J.; Brito, M.C. Data-driven estimation of expected photovoltaic generation. Sol. Energy 2018, 166, 116–122. [Google Scholar] [CrossRef]
- Kymakis, E.; Kalykakis, S.; Papazoglou, T.M. Performance analysis of a grid connected photovoltaic park on the island of Crete. Energy Convers. Manag. 2009, 50, 433–438. [Google Scholar] [CrossRef]
- Shamsullaqa; Shatrughn; Pandey, A.; Iqbal, A.; Mishra, A.K.; Aslam Husain, M. Economic Feasibility Analysis of Solar PV Generation at REC Ambedkar Nagar. In Proceedings of the 2019 IEEE International Conference on Electrical, Computer and Communication Technologies (ICECCT). Coimbatore, India, 20–22 February 2019; pp. 1–6. [Google Scholar] [CrossRef]
- Aristizábal Cardona, A.J.; Páez Chica, C.A.; Ospina Barragán, D.H. Integrated Photovoltaic System Sizing and Economic Evaluation Using RETScreenTM for a Building of 40 Apartments. In Building-Integrated Photovoltaic Systems (BIPVS); Aristizábal Cardona, A.J., Páez Chica, C.A., Ospina Barragán, D.H., Eds.; Springer International Publishing: Cham, Switzerland, 2018; pp. 35–46. [Google Scholar] [CrossRef]
- Yadav, N.K.; Singh, D.K. Design and Graphical Analysis of 8-kW Off-Grid Solar Photovoltaic Power System. In Advances in Smart Grid and Renewable Energy; Sengupta, S., Zobaa, A.F., Sherpa, K.S., Bhoi, A.K., Eds.; Springer: Singapore, 2018; pp. 389–399. [Google Scholar] [CrossRef]
- Mukherjee, S.; Razzak, M.A. Analysis of 100 kW grid-connected solar photovoltaic system developed on the river deltas of eight divisions of Bangladesh using RETScreen. In Proceedings of the 2017 International Conference on Electrical, Computer and Communication Engineering (ECCE), Cox’s Bazar, Bangladesh, 16–18 February 2017; pp. 350–355. [Google Scholar] [CrossRef]
- Anwarzai, M.A.; Nagasaka, K. Utility-scale implementable potential of wind and solar energies for Afghanistan using GIS multi-criteria decision analysis. Renew. Sustain. Energy Rev. 2017, 71, 150–160. [Google Scholar] [CrossRef]
- Bustos, F.; Toledo, A.; Contreras, J.; Fuentes, A. Sensitivity analysis of a photovoltaic solar plant in Chile. Renew. Energy 2016, 87, 145–153. [Google Scholar] [CrossRef]
- González-Peña, D.; García-Ruiz, I.; Díez-Mediavilla, M.; Dieste-Velasco, M.I.; Alonso-Tristán, C. Photovoltaic Prediction Software: Evaluation with Real Data from Northern Spain. Appl. Sci. 2021, 11, 5025. [Google Scholar] [CrossRef]
- Kassem, Y.; Çamur, H.; Aateg, R.A. Exploring Solar and Wind Energy as a Power Generation Source for Solving the Electricity Crisis in Libya. Energies 2020, 13, 3708. [Google Scholar] [CrossRef]
- CIMH. Data Archieve 2021. Available online: http://www.cimh.edu.bb/?p=archive (accessed on 2 March 2021).
- Polo, J.; Wilbert, S.; Ruiz-Arias, J.A.; Meyer, R.; Gueymard, C.; Súri, M.; Martin, L.; Mieslinger, T.; Blanc, P.; Grant, I.; et al. Preliminary survey on site-adaptation techniques for satellite-derived and reanalysis solar radiation datasets. Sol. Energy 2016, 132, 25–37. [Google Scholar] [CrossRef]
- Sengupta, M.; Xie, Y.; Lopez, A.; Habte, A.; Maclaurin, G.; Shelby, J. The National Solar Radiation Data Base (NSRDB). Renew. Sustain. Energy Rev. 2018, 89, 51–60. [Google Scholar] [CrossRef]
- Yang, D. A correct validation of the National Solar Radiation Data Base (NSRDB). Renew. Sustain. Energy Rev. 2018, 97, 152–155. [Google Scholar] [CrossRef]
- Tjengdrawira, C.; Richter, M. Review and Gap Analyses of Technical Assumptions in PV Electricity Cost: Report on Current Practices in How Technical Assumptions are Accounted in PV Investment Cost Calculation. 27 July 2016, Version 1.0. 2016. Available online: http://www.solarbankability.org/fileadmin/sites/www/files/documents/649997_SolarBankability_D3.1_v1.0p_20160727.pdf (accessed on 3 February 2021).
- Chegaar, M.; Mialhe, P. Effect of atmospheric parameters on the silicon solar cells performance. J. Electron Devices 2008, 6, 173–176. [Google Scholar]
- Duffie, J.A.; Beckman, W.A. Solar Engineering of Thermal Processes; John Wiley & Sons: Hoboken, NJ, USA, 2006. [Google Scholar]
- Field, D.; Rogers, T.; Sealy, A. The effect of saharan dust on PV system yields in the tropical environment of Barbados. In Proceedings of the 2015 IEEE 42nd Photovoltaic Specialist Conference (PVSC), New Orleans, LA, USA, 14–19 June 2015; pp. 1–4. [Google Scholar] [CrossRef]
- Mohamed, A.O.; Hasan, A. Effect of Dust Accumulation on Performance of Photovoltaic Solar Modules in Sahara Environment. J. Basic Appl. Sci. Res. 2012, 2, 11030–11036. [Google Scholar]
- Dookie, N.; Chadee, X.T.; Clarke, R.M. Assessing Solar Electricity Potential and Prospective Present Day Costs For A Low Latitude Caribbean Island: Trinidad. In Processings EuroSun 2018; International Solar Energy Society: Freiburg, Germany, 2018; pp. 1–11. [Google Scholar] [CrossRef]
- Méheux, K.; Dominey-Howes, D.; Lloyd, K. Natural hazard impacts in small island developing states: A review of current knowledge and future research needs. Nat. Hazards 2007, 40, 429–446. [Google Scholar] [CrossRef]
- Chadee, X.T.; Clarke, R.M. Large-scale wind energy potential of the Caribbean region using near-surface reanalysis data. Renew. Sustain. Energy Rev. 2014, 30, 45–58. [Google Scholar] [CrossRef]
- International Finance Corporation World Bank Group. Utility Scale Solar Power Plants: A Guide for Developers and Investors 2012. Available online: https://www.ifc.org/wps/wcm/connect/fe79dd27-5c9d-4cb0-8dc0-00e54073aa87/SOLAR%2BGUIDE%2BBOOK.pdf?MOD=AJPERES&CVID=jrR7UB7 (accessed on 31 January 2020).
- SolarGIS. Solargis Solar Resource Database: Description and Accuracy 2016. Available online: https://solargis2-web-assets.s3.eu-west-1.amazonaws.com/public/doc/8e24dda319/Solargis-database-description-and-accuracy.pdf (accessed on 16 January 2020).
- Firouzjah, K.G. Assessment of small-scale solar PV systems in Iran: Regions priority, potentials and financial feasibility. Renew. Sustain. Energy Rev. 2018, 94, 267–274. [Google Scholar] [CrossRef]
- Roberts, J.J.; Mendiburu Zevallos, A.A.; Cassula, A.M. Assessment of photovoltaic performance models for system simulation. Renew. Sustain. Energy Rev. 2017, 72, 1104–1123. [Google Scholar] [CrossRef]
- Akhter, M.N.; Mekhilef, S.; Mokhlis, H.; Olatomiwa, L.; Muhammad, M.A. Performance assessment of three grid-connected photovoltaic systems with combined capacity of 6.575 kWp in Malaysia. J. Clean Prod. 2020, 277, 123242. [Google Scholar] [CrossRef]
- Okello, D.; van Dyk, E.E.; Vorster, F.J. Analysis of measured and simulated performance data of a 3.2kWp grid-connected PV system in Port Elizabeth, South Africa. Energy Convers. Manag. 2015, 100, 10–15. [Google Scholar] [CrossRef]
- Ayompe, L.M.; Duffy, A.; McCormack, S.J.; Conlon, M. Measured performance of a 1.72kW rooftop grid connected photovoltaic system in Ireland. Energy Convers. Manag. 2011, 52, 816–825. [Google Scholar] [CrossRef] [Green Version]
- Goel, S.; Sharma, R. Analysis of measured and simulated performance of a grid-connected PV system in eastern India. Environ. Dev. Sustain. 2021, 23, 451–476. [Google Scholar] [CrossRef]
- Khalid, A.M.; Mitra, I.; Warmuth, W.; Schacht, V. Performance ratio—Crucial parameter for grid connected PV plants. Renew. Sustain. Energy Rev. 2016, 65, 1139–1158. [Google Scholar] [CrossRef]
- Idoko, L.; Anaya-Lara, O.; McDonald, A. Enhancing PV modules efficiency and power output using multi-concept cooling technique. Energy Rep. 2018, 4, 357–369. [Google Scholar] [CrossRef]
- EL-Shimy, M. Chapter 3: Operational Characteristics of Renewable Sources, Challenges, and Future Prospective. In Economics of Variable Renewable Sources for Electric Power Production; Lambert Academic Publishing: Saarbrücken, Germany, 2017. [Google Scholar]
- Blair, N.; DiOrio, N.; Freeman, J.; Gilman, P.; Janzou, S.; Neises, T.; Wagner, M. System Advisor Model (SAM) General Description (Version 2017.9.5); National Renewable Energy Lab. (NREL): Golden, CO, USA, 2018. Available online: https://www.nrel.gov/docs/fy18osti/70414.pdf (accessed on 28 September 2022).
- Natural Resources Canada. RETScreen 2019. Available online: https://www.nrcan.gc.ca/energy/RETScreen/7465 (accessed on 23 September 2019).
- PVSyst. Shop 2020. Available online: https://www.pvsyst.com/shop-prices/ (accessed on 18 February 2020).
- HOMER Energy. The Power of HOMER: Diversified Products to Meet Your Planning Needs 2018. Available online: https://www.homerenergy.com/products/index.html (accessed on 18 February 2020).
- HOMER Energy. HOMER QuickStart The Fast Path to Microgrid Optimization 2018. Available online: https://www.homerenergy.com/products/quickstart/index.html (accessed on 18 February 2020).
- HOMER Energy. HOMER QuickGrid Estimate Demand Charge Reduction Savings 2018. Available online: https://www.homerenergy.com/products/quickgrid/index.html (accessed on 18 February 2020).
- HOMER Energy. HOMER ® Pro Choose the Right Plan for Your Projects 2018. Available online: https://www.homerenergy.com/products/pro/pricing/index.html (accessed on 18 February 2020).
- Valentin Software. PVSol—Online Tool 2020. Available online: http://pvsol-online.valentin-software.com/#/ (accessed on 25 September 2020).
- PVGIS. PVGIS Photovoltaic Geographical Information System. Available online: https://joint-research-centre.ec.europa.eu/pvgis-photovoltaic-geographical-information-system_en (accessed on 7 November 2022).
- TRNSYS. TRNSYS Transient System Simulation Tool 2019. Available online: http://www.trnsys.com/ (accessed on 8 February 2021).
- Vela Solaris AG. Polysun 2020. Available online: https://www.velasolaris.com/?lang=en (accessed on 8 February 2021).
- Said, M.; EL-Shimy, M.; Abdelraheem, M.A. Photovoltaics energy: Improved modeling and analysis of the levelized cost of energy (LCOE) and grid parity—Egypt case study. Sustain. Energy Technol. Assess. 2015, 9, 37–48. [Google Scholar] [CrossRef]
- Navabi, R.; Abedi, S.; Hosseinian, S.H.; Pal, R. On the fast convergence modeling and accurate calculation of PV output energy for operation and planning studies. Energy Convers. Manag. 2015, 89, 497–506. [Google Scholar] [CrossRef]
- Li, C. Economic and performance evaluation of grid-connected residential solar photovoltaic systems in Northwest China. Energy Sources Part A Recover Util. Environ. Eff. 2022, 44, 5473–5489. [Google Scholar] [CrossRef]
- Fathi Nassar, Y.; Yassin Alsadi, S. Assessment of solar energy potential in Gaza Strip-Palestine. Sustain. Energy Technol. Assess. 2019, 31, 318–328. [Google Scholar] [CrossRef]
- Alshare, A.; Tashtoush, B.; Altarazi, S.; El-Khalil, H. Energy and economic analysis of a 5 MW photovoltaic system in northern Jordan. Case Stud. Therm. Eng. 2020, 21, 100722. [Google Scholar] [CrossRef]
- Chang, B.; Starcher, K. Evaluation of wind and solar energy investments in Texas. Renew. Energy 2019, 132, 1348–1359. [Google Scholar] [CrossRef]
- NREL. SAM Help Version 2016.3.14. 2016. Available online: https://sam.nrel.gov/sites/default/files/content/help/sam-help-2016-3-14.pdf (accessed on 3 March 2019).
- Dobos, A.P. PVWatts Version 5 Manual 2014. Available online: https://www.nrel.gov/docs/fy14osti/62641.pdf (accessed on 6 February 2021).
- Natural Resources Canada. RETScreen® Software Online User Manual 2005. Available online: http://publications.gc.ca/collections/collection_2008/nrcan/M39-115-2005E.pdf (accessed on 23 September 2019).
- NREL. SAM Help Version 2018.11.11. 2018. Available online: https://sam.nrel.gov/sites/default/files/content/help/sam-help-2018-11-11.pdf (accessed on 4 April 2019).
- Gilman, P.; Dobos, A.; DiOrio, N.; Freeman, J.; Janzou, S.; Ryberg, D. SAM Photovoltaic Model Technical Reference Update 2018; National Renewable Energy Laboratory (NREL): Golden, CO, USA, 2018; NREL/TP-6A20-67399. [Google Scholar]
- Natural Resources Canada. RETScreen Expert Help (Version Viewer). Computer Software. 2019. Available online: https://www.nrcan.gc.ca/energy/RETScreen/7465 (accessed on 20 July 2019).
- Fuentes, M.K. A Simplified Thermal Model for Flat-Plate Photovoltaic Arrays 1987. Available online: http://prod.sandia.gov/techlib/access-control.cgi/1985/850330.pdf (accessed on 10 July 2020).
- Dabou, R.; Bouchafaa, F.; Arab, A.H.; Bouraiou, A.; Draou, M.D.; Neçaibia, A.; Draou, M.D.; Neçaibia, A.; Mostefaoui, M. Monitoring and performance analysis of grid connected photovoltaic under different climatic conditions in south Algeria. Energy Convers. Manag. 2016, 130, 200–206. [Google Scholar] [CrossRef]
- Buchla, D.; Kissell, T.; Floyd, T. Renewable Energy Systems, 1st ed.; Pearson: Boston, MA, USA, 2015. [Google Scholar]
- Manoj Kumar, N.; Sudhakar, K.; Samykano, M. Techno-economic analysis of 1 MWp grid connected solar PV plant in Malaysia. Int. J. Ambient Energy 2019, 40, 434–443. [Google Scholar] [CrossRef]
- Skoplaki, E.; Palyvos, J.A. On the temperature dependence of photovoltaic module electrical performance: A review of efficiency/power correlations. Sol. Energy 2009, 83, 614–624. [Google Scholar] [CrossRef]
- IRENA. Renewable Energy Technologies: Cost Series Analysis 2012. Available online: https://www.irena.org/DocumentDownloads/Publications/RE_Technologies_Cost_Analysis-SOLAR_PV.pdf (accessed on 10 October 2016).
- Smets, A.; Jäger, K.; Isabella, O.; Swaaij, R.V.; Zeman, M. Solar Energy: The Physics and Engineering of Photovoltaic Conversion, Technologies and Systems; UTI Cambridge: Cambridge, UK, 2016. [Google Scholar]
- Durisch, W.; Bitnar, B.; Mayor, J.-C.; Kiess, H.; Lam, K.; Close, J. Efficiency model for photovoltaic modules and demonstration of its application to energy yield estimation. Sol. Energy Mater. Sol. Cells 2007, 91, 79–84. [Google Scholar] [CrossRef]
- Spencer, J.W. Fourier Series Representation of the Position of the Sun. Search 1971, 2, 162–172. [Google Scholar]
- Kennedy, R.E. Average Air Mass. Mon Weather Rev 1941. Available online: https://journals.ametsoc.org/downloadpdf/journals/mwre/68/11/1520-0493_1940_068_0301_adam_2_0_co_2.xml (accessed on 26 January 2022).
- Smithsonian Institution. Smithsonian Meteorological Tables; Smithsonian Institution: Washington, DC, USA, 1931. [Google Scholar]
- Yu, C.; Khoo, Y.; Chai, J.; Han, S.; Yao, J. Optimal Orientation and Tilt Angle for Maximizing in-Plane Solar Irradiation for PV Applications in Japan. Sustainability 2019, 11, 2016. [Google Scholar] [CrossRef] [Green Version]
- SolarGIS. Documentation 2021. Available online: https://solargis.com/docs/methodology/solar-radiation-modeling#:~:text=GHI (accessed on 22 January 2021).
- Yang, D.; Dong, Z.; Nobre, A.; Khoo, Y.S.; Jirutitijaroen, P.; Walsh, W.M. Evaluation of transposition and decomposition models for converting global solar irradiance from tilted surface to horizontal in tropical regions. Sol. Energy 2013, 97, 369–387. [Google Scholar] [CrossRef]
- Ineichen, P. Comparison and validation of three global-to-beam irradiance models against ground measurements. Sol. Energy 2008, 82, 501–512. [Google Scholar] [CrossRef] [Green Version]
- Lave, M.; Hayes, W.; Pohl, A.; Hansen, C.W. Evaluation of Global Horizontal Irradiance to Plane-of-Array Irradiance Models at Locations Across the United States. IEEE J. Photovolt. 2015, 5, 597–606. [Google Scholar] [CrossRef]
- Leloux, J.; Narvarte, L.; Trebosc, D. Review of the performance of residential PV systems in France. Renew. Sustain. Energy Rev. 2012, 16, 1369–1376. [Google Scholar] [CrossRef] [Green Version]
- Leloux, J.; Narvarte, L.; Trebosc, D. Review of the performance of residential PV systems in Belgium. Renew. Sustain. Energy Rev. 2012, 16, 178–184. [Google Scholar] [CrossRef] [Green Version]
- Sathyanarayana, P.; Ballal, R.; Lakshmi Sagar, P.S.; Kumar, G. Effect of Shading on the Performance of Solar PV Panel. Energy Power 2015, 5, 1–4. [Google Scholar] [CrossRef]
- Singh, N.; Chauhan, Y.K.; Singh, S.P.; Srivastava, A.K. Shading Issues in Photo-voltaic Modules and its Performance Assessment. In Proceedings of the 2018 International Conference on Power Energy, Environment and Intelligent Control (PEEIC), Greater Noida, India, 13–14 April 2018; pp. 280–287. [Google Scholar] [CrossRef]
- Martín, N.; Ruiz, J.M. Annual angular reflection losses in PV modules. Prog. Photovoltaics Res. Appl. 2005, 13, 75–84. [Google Scholar] [CrossRef]
- Khoo, Y.S.; Singh, J.P.; Walsh, T.M.; Aberle, A.G. Comparison of Angular Reflectance Losses Between PV Modules With Planar and Textured Glass Under Singapore Outdoor Conditions. IEEE J. Photovolt. 2014, 4, 362–367. [Google Scholar] [CrossRef]
- Ilse, K.; Micheli, L.; Figgis, B.W.; Lange, K.; Daßler, D.; Hanifi, H.; Wolfertstetter, F.; Naumann, V.; Hagendorf, C.; Gottschalg, R.; et al. Techno-Economic Assessment of Soiling Losses and Mitigation Strategies for Solar Power Generation. Joule 2019, 3, 2303–2321. [Google Scholar] [CrossRef] [Green Version]
- Ilse, K.; Figgis, B.W.; Naumann, V.; Hagendorf, C.; Bagdahn, J. Fundamentals of soiling processes on photovoltaic modules. Renew. Sustain. Energy Rev. 2018, 98, 239–254. [Google Scholar] [CrossRef]
- Micheli, L.; Muller, M. An investigation of the key parameters for predicting PV soiling losses. Prog. Photovolt. Res. Appl. 2017, 25, 291–307. [Google Scholar] [CrossRef]
- Micheli, L.; Deceglie, M.G.; Muller, M. Mapping Photovoltaic Soiling Using Spatial Interpolation Techniques. IEEE J. Photovolt. 2019, 9, 272–277. [Google Scholar] [CrossRef]
- Doherty, O.M.; Riemer, N.; Hameed, S. Saharan mineral dust transport into the Caribbean: Observed atmospheric controls and trends. J. Geophys. Res. 2008, 113, D07211. [Google Scholar] [CrossRef]
- Sarver, T.; Al-Qaraghuli, A.; Kazmerski, L.L. A comprehensive review of the impact of dust on the use of solar energy: History, investigations, results, literature, and mitigation approaches. Renew. Sustain. Energy Rev. 2013, 22, 698–733. [Google Scholar] [CrossRef]
- Costa, S.C.S.; Diniz, A.S.A.C.; Kazmerski, L.L. Solar energy dust and soiling R&D progress: Literature review update for 2016. Renew. Sustain. Energy Rev. 2018, 82, 2504–2536. [Google Scholar] [CrossRef]
- Kimber, A.; Mitchell, L.; Nogradi, S.; Wenger, H. The Effect of Soiling on Large Grid-Connected Photovoltaic Systems in California and the Southwest Region of the United States. In Proceedings of the 2006 IEEE 4th World Conference on Photovoltaic Energy Conference, Waikoloa, HI, USA, 7–12 May 2006; pp. 2391–2395. [Google Scholar] [CrossRef]
- Faiman, D. Assessing the outdoor operating temperature of photovoltaic modules. Prog. Photovolt. Res. Appl. 2008, 16, 307–315. [Google Scholar] [CrossRef]
- Koehl, M.; Heck, M.; Wiesmeier, S.; Wirth, J. Modeling of the nominal operating cell temperature based on outdoor weathering. Sol. Energy Mater. Sol. Cells 2011, 95, 1638–1646. [Google Scholar] [CrossRef]
- Huld, T.; Amillo, A. Estimating PV Module Performance over Large Geographical Regions: The Role of Irradiance, Air Temperature, Wind Speed and Solar Spectrum. Energies 2015, 8, 5159–5181. [Google Scholar] [CrossRef] [Green Version]
- Taylor, M.A.; Alfaro, E.J. Central America and the Caribbean, Climate of. In Encyclopedia of World Climatology; Springer: Dordrecht, The Netherlands, 2005; pp. 183–189. [Google Scholar] [CrossRef]
- Ariza Taba, M.F.; Mwanza, M.; Çetin, N.S.; Ülgen, K. Assessment of the energy generation potential of photovoltaic systems in Caribbean region of Colombia. Period Eng. Nat. Sci. 2017, 5, 55–60. [Google Scholar] [CrossRef] [Green Version]
- Climatological Atlas of Colombia. Annual Average Annual Temperature 2015. Available online: http://atlas.ideam.gov.co/basefiles/temperaturamedia_tabla.pdf (accessed on 3 January 2019).
- Headley, O. Renewable energy technologies in the Caribbean. Sol. Energy 1997, 59, 1–9. [Google Scholar] [CrossRef]
- Parretta, A.; Sarno, A.; Vicari, L.R.M. Effects of solar irradiation conditions on the outdoor performance of photovoltaic modules. Opt. Commun. 1998, 153, 153–163. [Google Scholar] [CrossRef]
- Liuzzo, L.; Viola, F.; Noto, L.V. Wind speed and temperature trends impacts on reference evapotranspiration in Southern Italy. Theor. Appl. Climatol. 2016, 123, 43–62. [Google Scholar] [CrossRef]
- Shiva Kumar, B.; Sudhakar, K. Performance evaluation of 10 MW grid connected solar photovoltaic power plant in India. Energy Rep. 2015, 1, 184–192. [Google Scholar] [CrossRef] [Green Version]
- Rehman, S.; Bader, M.A.; Al-Moallem, S.A. Cost of solar energy generated using PV panels. Renew. Sustain. Energy Rev. 2007, 11, 1843–1857. [Google Scholar] [CrossRef]
- Shukla, A.K.; Sudhakar, K.; Baredar, P. Design, simulation and economic analysis of standalone roof top solar PV system in India. Sol. Energy 2016, 136, 437–449. [Google Scholar] [CrossRef]
- Foster, J.; Wanger, L.; Bratanova, A. LCOE Models: A Comparision of the Theoretical Frameworks and Key Assumptions 2014. Available online: http://eemg.uq.edu.au/filething/get/137/2014-4.pdf (accessed on 10 July 2020).
- Hernández-Moro, J.; Martínez-Duart, J.M. Analytical model for solar PV and CSP electricity costs: Present LCOE values and their future evolution. Renew. Sustain. Energy Rev. 2013, 20, 119–132. [Google Scholar] [CrossRef]
- Branker, K.; Pathak, M.J.M.; Pearce, J.M. A review of solar photovoltaic levelized cost of electricity. Renew. Sustain. Energy Rev. 2011, 15, 4470–4482. [Google Scholar] [CrossRef] [Green Version]
- IRENA. Renewable Power Generation Costs in 2017. 2017. Available online: https://www.irena.org/-/media/Files/IRENA/Agency/Publication/2018/Jan/IRENA_2017_Power_Costs_2018.pdf (accessed on 8 August 2018).
- Cambell, M. The Drivers of the Levelized Cost of Electricity for Utility-Scale Photovoltaics. SunPower 2008. Available online: https://us.sunpower.com/sites/sunpower/files/media-library/white-papers/wp-levelized-cost-drivers-electricity-utility-scale-photovoltaics.pdf (accessed on 20 September 2019).
- Short, W.; Packey, D.; Holt, T. A Manual for the Economic Evaluation of Energy Efficiency and Renewable Energy Technologies 1995. Available online: http://www.nrel.gov/docs/legosti/old/5173.pdf (accessed on 24 April 2017).
- Fu, R.; Feldman, D.; Margolis, R. U.S. Solar Photovoltaic System Cost Benchmark: Q1 2018; National Renewable Energy Lab. (NREL): Golden, CO, USA, 2018; Technical report number: NREL/TP-6A20-72399. [Google Scholar]
- Fu, R.; Feldman, D.; Margolis, R. U.S. Solar Photovoltaic System Cost Benchmark Q1 2018 (Data Resource); National Renewable Energy Lab. (NREL): Golden, CO, USA, 2019. [Google Scholar] [CrossRef]
- Tao, J.Y.; Finenko, A. Moving beyond LCOE: Impact of various financing methods on PV profitability for SIDS. Energy Policy 2016, 98, 749–758. [Google Scholar] [CrossRef]
- IRENA. Renewable Power Generation Costs in 2014. 2015. Available online: https://www.irena.org/documentdownloads/publications/irena_re_power_costs_2014_report.pdf (accessed on 24 April 2017).
- Wittenstein, M.; Rothwell, G. Projected Costs of Generating Electricity 2015. Available online: https://www.oecd-nea.org/ndd/pubs/2015/7057-proj-costs-electricity-2015.pdf (accessed on 20 August 2017).
- Ochs, A.; Konold, M.; Auth, K.; Musolino, E.; Philip, K. Caribbean Sustainable Energy Roadmap and Strategy (C-SERMS): Baseline Report and Assessment 2015. Available online: http://www.worldwatch.org/cserms/baseline-report (accessed on 5 August 2019).
- The World Bank Group. CO2 Emissions (Metric Tons Per Capita) 2016. Available online: http://data.worldbank.org/indicator/EN.ATM.CO2E.PC?end=2011&start=2011&view=bar&year_high_desc=true. (accessed on 14 September 2016).
- The Government of Trinidad and Tobago. Intended Nationally Determined Contribution (iNDC) Under the United Nations Framework Convention on Climate Change 2015. Available online: http://www4.unfccc.int/Submissions/INDC/Published Documents/Trinidad and Tobago/1/Trinidad and Tobago Final INDC.pdf (accessed on 31 January 2018).
- Regulated Industries Commission. T&TEC Granted Annual Tariff Adjustment after Meeting Specific RIC Directives 2009. Available online: https://www.ric.org.tt/wp-content/uploads/2015/10/Annual%20Tariff%20Adjustment-%20TTEC%20-%202009.pdf (accessed on 25 August 2019).
- Patterson, T.; Kelso, N.V. “Natural Earth” 2018. Available online: https://www.naturalearthdata.com/downloads/ (accessed on 7 November 2022).
- QGIS Geographic Information System Version 3.16. Computer Software. Available online: https://www.qgis.org/en/site/ (accessed on 20 January 2021).
- Smith, G.W. Solar radiation and the duration of sunshine in Trinidad, West Indies. Q. J. R. Meteorol. Soc. 1960, 86, 415. [Google Scholar] [CrossRef]
- Stone, R.J. A New Sunshine-based Global Solar Radiation Estimation Model for Trinidad. West Indian J. Eng. 1999, 22, 42–48. [Google Scholar]
- De Souza, K.; Andrews, R. Models for daily global solar radiation for the Caribbean island of Trinidad. J. Renew. Sustain. Energy 2015. [Google Scholar] [CrossRef]
- Stefanou, I. Sustainable Energy Roadmap 2021/2030 for Trinidad and Tobago. EU Technical Assistance Facility for the Sustainable Energy for All Initiative (SE4ALL). 2017. Available online: https://eeas.europa.eu/sites/eeas/files/tt_sustainable_energy_roadmap_1.pdf (accessed on 20 August 2019).
- Barrett, S. Trinidad and Tobago Feasibility Study on the Use of Solar Energy at Piarco International Project: ICAO-European Union Assistance Project: Capacity Building for CO2 Mitigation from International Aviation 2018. Available online: https://www.icao.int/environmental-protection/Documents/SolarFeasabilityStudies_PiarcoTrinidadTobago_Report-July9-web.pdf (accessed on 14 January 2020).
- Marzolf, N.C.; Cañeque, F.C.; Klein, J.; Loy, D. A Unique Approach for Sustainable Energy in Trinidad and Tobago 2015. Available online: https://www.energy.gov.tt/wp-content/uploads/2016/08/A-Unique-Approach-for-Sustainable-Energy-in-Trinidad-and-Tobago.pdf (accessed on 23 August 2016).
- The World Meteorological Organization. Guidelines on the Quality Control of Data from the World Radiometric Network 1987. Available online: https://library.wmo.int/doc_num.php?explnum_id=9497 (accessed on 6 July 2016).
- Sengupta, M.; Lopez, A.; Habte, A.; Xie, Y. Improving the Accuracy of the National Solar Radiation Database (1998–2016): Preprint 2018. Available online: https://www.nrel.gov/docs/fy18osti/72410.pdf (accessed on 2 February 2020).
- U.S. Department of Energy. U.S. Data 2022. Available online: https://nsrdb.nrel.gov/about/u-s-data.html (accessed on 23 January 2022).
- Lazard. Lazard’s Levelized Cost of Energy Analysis Version 13.0. 2019. Available online: https://www.lazard.com/media/451086/lazards-levelized-cost-of-energy-version-130-vf.pdf (accessed on 25 November 2021).
- International Renewable Energy Agency. Global Renewables Outlook: Energy Transformation 2050; International Renewable Energy Agency: Abu Dhabi, United Arab Emirates, 2020. [Google Scholar]
- International Renewable Energy Agency. Renewable Power Generation Costs in 2020; International Renewable Energy Agency: Abu Dhabi, United Arab Emirates, 2021. [Google Scholar]
Figure 1.
Process map showing a typical PV model with the input, processes and output.


Figure 3.
Daily total insolation on a horizontal plane for 2003, Piarco Trinidad and Tobago.

Figure 4.
Energy output per month and CF estimates for each season using maximum, baseline and minimum loss models of the proposed prefeasibility tool.
Figure 4.
Energy output per month and CF estimates for each season using maximum, baseline and minimum loss models of the proposed prefeasibility tool.

Figure 5.
Energy output per month and CF estimations for each season using maximum, baseline and minimum loss models of the proposed prefeasibility tool.
Figure 5.
Energy output per month and CF estimations for each season using maximum, baseline and minimum loss models of the proposed prefeasibility tool.

Figure 6.
Monthly energy output estimations using the baseline loss model of the proposed prefeasibility tool, PVWatts, SAM’s detailed photovoltaic model and RETScreen.
Figure 6.
Monthly energy output estimations using the baseline loss model of the proposed prefeasibility tool, PVWatts, SAM’s detailed photovoltaic model and RETScreen.

Figure 7.
Data comparison between NSRBN’s PSM V3 2003 and the ground-measured data obtained from the Trinidad and Tobago Meteorological Service in 2003.
Figure 7.
Data comparison between NSRBN’s PSM V3 2003 and the ground-measured data obtained from the Trinidad and Tobago Meteorological Service in 2003.

Figure 8.
Data comparison between RETScreen’s ground-measured data and ground-measured data at Piarco obtained from the Trinidad and Tobago Meteorological Service in 2003.
Figure 8.
Data comparison between RETScreen’s ground-measured data and ground-measured data at Piarco obtained from the Trinidad and Tobago Meteorological Service in 2003.


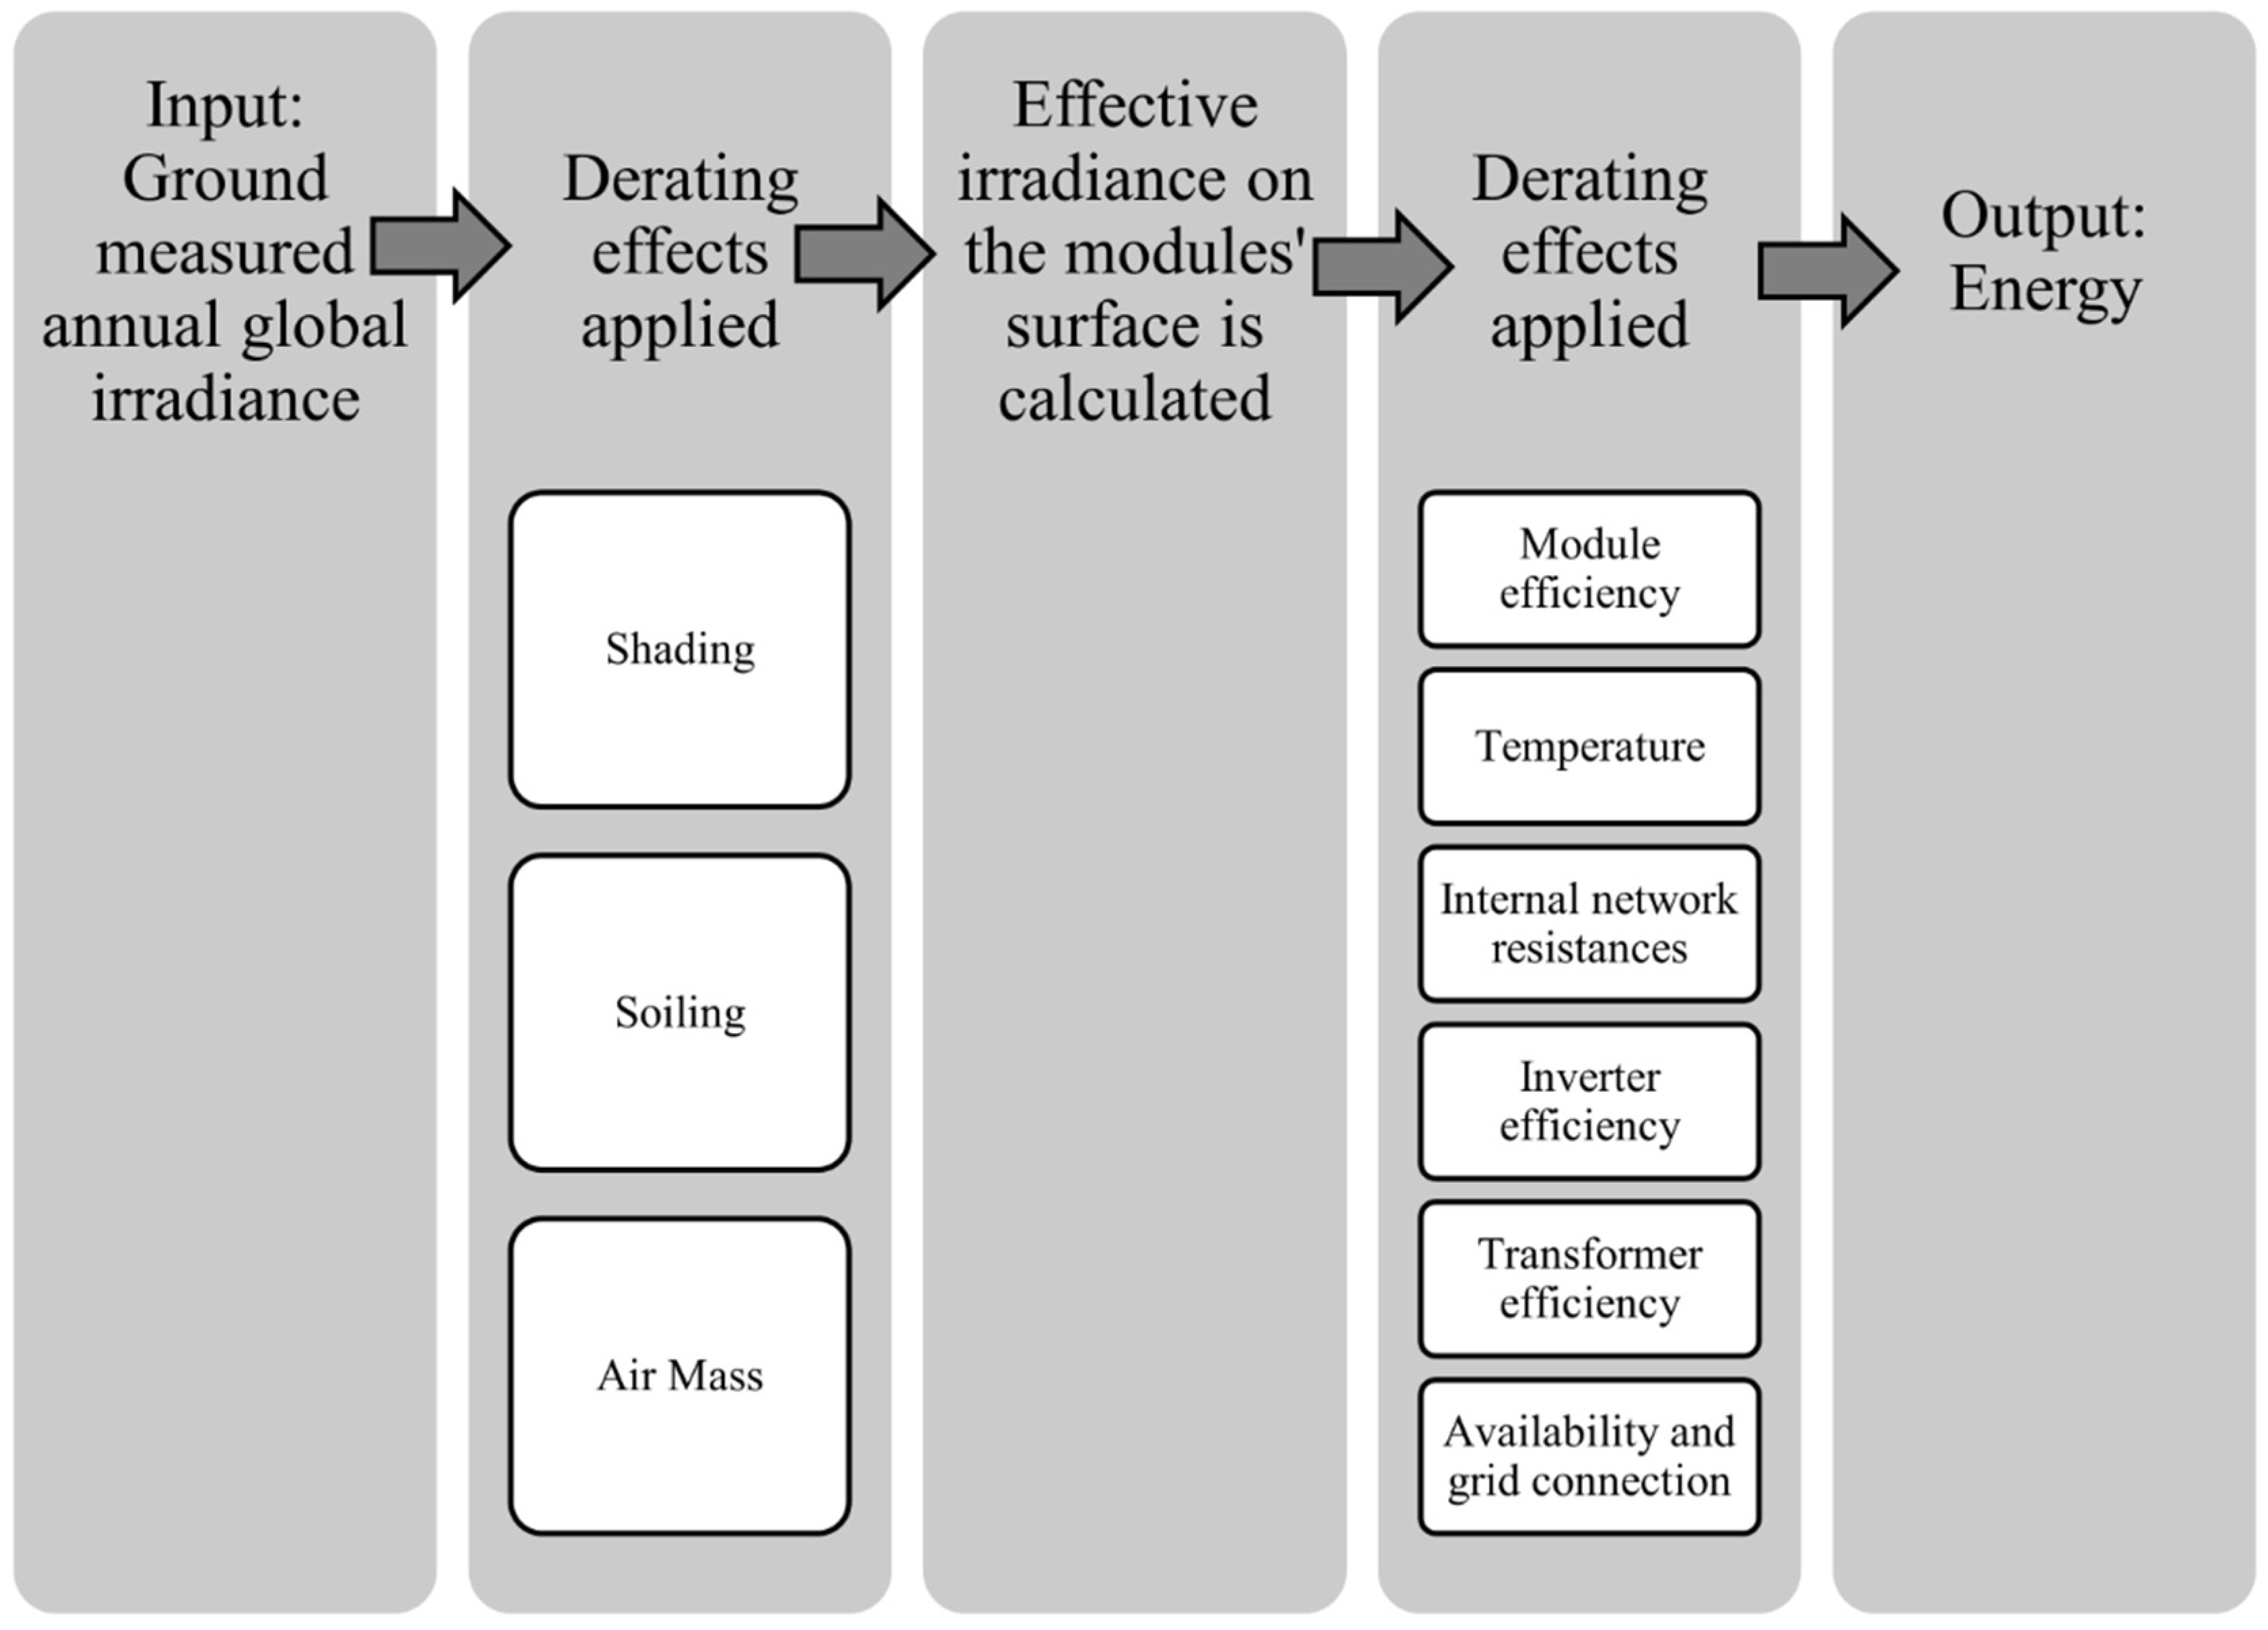
Table 1.
Summary of default derate factors and modelled losses for PVWatts, SAM and RETScreen [50,69,70,71,72].
| Loss Factor | Default Values (%) | Recommended for Central Grid-Connected Systems (%) | |||
|---|---|---|---|---|---|
| PVWatts Web | PVWatts Desktop | SAM | RETScreen | ||
| Nameplate rating | 1.0 | 1.0 | 0 | ||
| Miscellaneous PV array losses | 0.0–20.0 | ||||
| Air mass effect | Modelled | ||||
| Angular reflectivity effect | Modelled | Modelled | Modelled | ||
| Light-induced degradation | 1.5 | 1.5 | |||
| Shading effect | 3.0 | 3.0 or Modelled | Modelled | ||
| Soiling effect | 2.0 | 2.0 | 5.0 | ||
| Temperature effect | Modelled | Modelled | Modelled | Modelled | |
| Snow | 0.0 | 0.0 | 0.0 | ||
| Miscellaneous power conditioning losses | 0.0 | ||||
| Internal network effect | Mismatch | 2.0 | 2.0 | 0.0–2.0 | |
| DC Wiring | 2.0 1 | 2.0 1 | 2.0 | ||
| AC Wiring | 1.0 | ||||
| Connections | 0.5 | 0.5 | 0.5 | ||
| Tracking error | 0.0 | ||||
| DC power optimizer loss | 0.0–1.0 | ||||
| Inverter effect | 4.0 | 4.0 | 0.1 | ||
| Transformer effect | No load loss | 0.0 | |||
| Load loss | 0.0 | ||||
| PV energy absorption rate | 0.0 | ||||
| Availability and grid connection effect | Transmission loss | 3.0 | 0.0 | ||
| DC curtailment and availability | 3.0 2 | 0.0 2 | 0.0 | ||
| AC curtailment and availability | 0.0 | ||||
| Age | 0.0 | 0.0 | |||
1 This derate factor accounts for DC and AC wiring cumulatively. 2 This derate factor accounts for DC and AC curtailment and availability cumulatively.
Table 2.
Summary of the environmental derate factors and values considered in this prefeasibility assessment tool for the Caribbean SIDS.
Table 2.
Summary of the environmental derate factors and values considered in this prefeasibility assessment tool for the Caribbean SIDS.
| Factors | Partial Losses Due to Individual Factors (%) | ||
|---|---|---|---|
| Minimum | Maximum | Baseline–Default Value | |
| Efficiency of PV module | 80.00 | 88.00 | 84.00 |
| Effect of air mass | 0.00 | 1.00 | 1.00 |
| Effect of tilt angle of module | 0.00 | 0.00 | 0.00 |
| Effect of shading | 1.00 | 6.00 | 2.00 |
| Effect of angular reflectivity | 3.00 | 4.00 | 3.50 |
| Effect of Soiling | 1.00 | 7.00 | 1.50 |
| Effect of temperature | 8.50 | 15.00 | 10.00 |
Table 3.
Range of system derate factors assumed for the proposed prefeasibility PV model.
| Factors | Partial Losses Due to Individual Factors (%) Assumed for the Model | Percent Losses from the Literature | ||
|---|---|---|---|---|
| Minimum | Maximum | Baseline | ||
| Effect of internal network losses | 3.00 | 6.00 | 5.00 | 6% [18] 3.2% [112] |
| Effect of inverter losses | 2.00 | 8.00 | 5.00 | 3% [113] 1.9–2.0% [112] 7.84% [18] |
| Effect of transformer losses | 1.00 | 2.50 | 2.00 | 1.5–2.5% [114] 1.1–1.2% [112] 2% [18] |
| Effect of availability and grid connection losses | 0.50 | 5.00 | 2.00 | 0.5–2% [114] 2% [112] 4.54% [18] |
| Capacity (MW) | Installed Cost (USD/kW) | Total Installed Cost (USD Rounded to the Nearest Thousand) | Operations and Maintenance Cost per Annum (USD/kW Annum) |
|---|---|---|---|
| 5 | 1356.24 | 6781 | 13.00 |
| 10 | 1252.86 | 12,529 | 13.00 |
| 50 | 1129.18 | 56,459 | 13.00 |
Table 5.
Differences in performance ratio, differences in capacity factor and the LCOE of the isolated effects of the maximum and minimum losses compared with baseline values for air mass, shading, angular reflectivity, soiling and temperature for a 50 MW system.
Table 5.
Differences in performance ratio, differences in capacity factor and the LCOE of the isolated effects of the maximum and minimum losses compared with baseline values for air mass, shading, angular reflectivity, soiling and temperature for a 50 MW system.
| Description of Loss | Loss Considered in Baseline Model (%) | PR–PR Baseline (%) | CF–CF Baseline (%) | LCOE (USD/kWh) | |
|---|---|---|---|---|---|
| Overall Model | Minimum | 9.5 | 1.8 | 0.11 | |
| Baseline | 0.0 | 0.0 | 0.12 | ||
| Maximum | −15.4 | −2.8 | 0.16 | ||
| Air Mass | Minimum | 0.00 | 0.7 | 0.1 | 0.12 |
| Maximum | 1.00 | 0.0 | 0.0 | 0.12 | |
| Shading | Minimum | 1.00 | 0.7 | 0.1 | 0.12 |
| Maximum | 6.00 | −2.9 | −0.5 | 0.13 | |
| Angular Reflectivity | Minimum | 3.00 | 0.4 | 0.1 | 0.12 |
| Maximum | 4.00 | −0.4 | −0.1 | 0.12 | |
| Soiling | Minimum | 1.00 | 0.4 | 0.1 | 0.12 |
| Maximum | 7.00 | −0.4 | −0.7 | 0.13 | |
| Temperature | Minimum | 8.50 | 1.2 | 0.2 | 0.12 |
| Maximum | 15.00 | −4.0 | −0.7 | 0.13 | |
Table 6.
Differences in performance ratio and capacity factor of the maximum and minimum cumulative effect of the site-related derate factors compared with the baseline for a 50 MW system.
Table 6.
Differences in performance ratio and capacity factor of the maximum and minimum cumulative effect of the site-related derate factors compared with the baseline for a 50 MW system.
| Description of Loss | PR–PR Baseline (%) | CF–CF Baseline (%) |
|---|---|---|
| Minimum | 3.5 | 0.6 |
| Maximum | −10.7 | −2.0 |
Table 7.
Differences in performance ratio, capacity factor and LCOE of the maximum and minimum cumulative effect of system-related, system-related derate factors and module efficiency compared with the baseline for a 50 MW.
Table 7.
Differences in performance ratio, capacity factor and LCOE of the maximum and minimum cumulative effect of system-related, system-related derate factors and module efficiency compared with the baseline for a 50 MW.
| Description of Loss | PR–PR Baseline (%) | CF–CF Baseline (%) | LCOE–LCOE Baseline (USD/kWh) |
|---|---|---|---|
| Minimum | 9.5 | 1.8 | 0.01 |
| Maximum | −15.4 | −2.8 | 0.03 |
Publisher’s Note: MDPI stays neutral with regard to jurisdictional claims in published maps and institutional affiliations. |
© 2022 by the authors. Licensee MDPI, Basel, Switzerland. This article is an open access article distributed under the terms and conditions of the Creative Commons Attribution (CC BY) license (https://creativecommons.org/licenses/by/4.0/).
Share and Cite
MDPI and ACS Style
Dookie, N.; Chadee, X.T.; Clarke, R.M. A Prefeasibility Solar Photovoltaic Tool for Tropical Small Island Developing States. Energies 2022, 15, 8337. https://0-doi-org.brum.beds.ac.uk/10.3390/en15228337
AMA Style
Dookie N, Chadee XT, Clarke RM. A Prefeasibility Solar Photovoltaic Tool for Tropical Small Island Developing States. Energies. 2022; 15(22):8337. https://0-doi-org.brum.beds.ac.uk/10.3390/en15228337
Chicago/Turabian StyleDookie, Nalini, Xsitaaz T. Chadee, and Ricardo M. Clarke. 2022. "A Prefeasibility Solar Photovoltaic Tool for Tropical Small Island Developing States" Energies 15, no. 22: 8337. https://0-doi-org.brum.beds.ac.uk/10.3390/en15228337
Note that from the first issue of 2016, this journal uses article numbers instead of page numbers. See further details here.