Article

Application of Artificial Intelligence to Improve the Thermal Energy and Exergy of Nanofluid-Based PV Thermal/Nano-Enhanced Phase Change Material

by
Enas Taha Sayed
1,2,*,
Hegazy Rezk
3,*,
Abdul Ghani Olabi
1,4,5,*,
Mohamed R. Gomaa
6,
Yahia B. Hassan
7,
Shek Mohammad Atiqure Rahman
4,
Sheikh Khaleduzzaman Shah
8,* and
Mohammad Ali Abdelkareem
1,2,4,*
1
Center for Advanced Materials Research, University of Sharjah, Sharjah P.O. Box 27272, United Arab Emirates
2
Chemical Engineering Department, Faculty of Engineering, Minia University, Minya 61519, Egypt
3
Department of Electrical Engineering, College of Engineering in Wadi Alddawasir, Prince Sattam Bin Abdulaziz University, Al-Kharj 11942, Saudi Arabia
4
Sustainable Energy & Power Systems Research Centre, RISE, University of Sharjah, Sharjah P.O. Box 27272, United Arab Emirates
5
Mechanical Engineering and Design, School of Engineering and Applied Science, Aston University, Aston Triangle, Birmingham B4 7ET, UK
6
Mechanical Engineering Department, Faculty of Engineering, Al-Hussein Bin Talal University, Ma’an 71111, Jordan
7
Electrical Engineering Department, Higher Institute of Engineering, Minia 61519, Egypt
8
Renewable Energy and Energy Efficiency Group, Department of Infrastructure Engineering, Faculty of Engineering and Information Technology, The University of Melbourne, Parkville, VIC 3010, Australia
*
Authors to whom correspondence should be addressed.
Submission received: 21 October 2022 / Revised: 11 November 2022 / Accepted: 11 November 2022 / Published: 14 November 2022
(This article belongs to the Special Issue Advances in Solar Thermal Energy Storage Technologies)

Abstract

:
Photovoltaic-thermal (PVT) technologies have demonstrated several attractive features, such as higher power and comparative efficiencies. Improving the thermal recovery from the PVT system would further improve the power output and the efficiency of the PVT system. This paper identifies the best operating factors of nanofluid-based PV thermal/nano-enhanced phase change material using artificial intelligence. The target is the maximization of thermal energy and exergy outputs. The suggested approach combines ANFIS modelling and particle swarm optimization (PSO). Four operating factors are taken into consideration: PCM (phase change material) layer thickness, HTF (heat transfer fluid) mass flow rate, MFNPCM (“mass fraction of nanoparticles in PCM”) and MFNfluid (“mass fraction of nanoparticles in nanofluid”). Using a dataset, an “adaptive neuro-fuzzy inference system” (ANFIS) model has been established for simulating the thermal energy and exergy outputs in terms of the mentioned operating factors. Then, using PSO, the best values of PCM thickness, mass flow rate, MFNPCM and MFNfluid are estimated. The proposed model’s accuracy was examined by comparing the results with those obtained by response surface methodology and the experimental dataset.

1. Introduction

To address the issue of rising energy consumption and associated environmental impacts, the development of numerous RES, “renewable energy sources”, has become an unavoidable choice [1,2,3]. Meanwhile, various energy conversion processes are accompanied by the generation of a significant quantity of waste heat that negatively affects their overall efficiency [4,5,6]. The effective use of such waste heat using proper thermal energy conversion methods and technologies would improve the overall efficiency of the various energy conversion processes [7,8]. As a source of renewable energy, solar photovoltaics (PVs) now hold first place as to all newly installed electricity capacity that has reached mega-scale, and wind comes in second place. In light of this viewpoint, the efficiency of photovoltaic technologies has been improved thanks to the efforts of industrial developers and researchers. Several studies have shown that high operating temperatures on solar cells reduce efficiency over time [9]. In the solar photovoltaics (PVs) panels, a major part of the solar radiation is lost in the form of waste heat that results in increasing the working temperature of the solar PV panels; therefore, the electrical efficiency and the long-term performance decrease [10,11]. To enhance the power output of the solar PV panels, a proper cooling system is usually applied [12]. Management techniques for thermal energy are classified into four categories according to Jia et al. [13]: alleviation, squandering, thermal energy recovery and storage.
A PCM “Phase Change Material” is a material that can absorb (charge) or release (discharge) thermal energy, during the physical transition between the vapour, liquid, and solid phases, keeping the temperature fluctuation in the system process to a minimum [14,15]. PCMs have been the subject of a lot of attention in solar energy research because of their great energy storage capacity [16]. Moreover, this energy can also be used for other purposes, i.e., domestic application [17], refrigeration, heat pumps and water purgation [18,19]. A PVT (“Photovoltaic-thermal”) integrated with PCM (“phase change material”) system can be effectively used to provide electrical and thermal energies [20].
In terms of PVT-PCM hybrid systems, organic paraffinic chemicals are the most often employed PCM, because of their advantages [21]. To improve the thermal performance of the PVT system, raise the amount of heat that can be absorbed from the PV module, and boost the amount of hybrid energy that can be recovered, a number of studies have advocated the use of composite PCM, nano-PCM, and nanofluid.
Das et al. [22] studied a PVT collector with organic PCM and biochar. The melting temperature of the PCM-biochar ranged from 35 to 39 °C. The experimental results of the PVT collector surface temperature was decreased by 29%, whereas the electricity production was enhanced by 18.4% in comparison to the conventional PV module, and the biochar improved the thermal efficiency from 60.3 to 71.2%. Huo et al. [23] demonstrated that a PVT system with inorganic PCM module has a 3.5 to 6.5 °C lower surface temperature and 19.8% higher electrical efficiency than does a conventional PVT collector. Similar improvement has been reported by Karthikeyan et al. [24]. Qiu et al. [25] studied a PVT collector operating with MPCM (micro-encapsulated PCM); the hybrid system efficiency ranged from 80.8% to 83.9%. Jamil et al. [26] studied an experimental PV module with PCM (PT-58) mixed with three different Nano under two concentrations (0.25 wt% and 0.5 wt%): MWCNTs NPs (“multiwall carbon nanotubes nanoparticles”), GNPs (“graphene nanoplatelets”) and MgO NPs (“magnesium oxide nanoparticles”). The results showed that the highest reduction in PV module temperature was 9.94 °C and 6.53 °C for GNPs/PT-58 at 0.5 wt% and 0.25 wt%, respectively, in comparison to 5.01 °C for PV module with pure PCM. While the electrical efficiency increased to 12.10% and 11.97% at 0.5 wt% and 0.25 wt%, respectively, compared to 11.74% for traditional PV modules with pure PCM.
Deciding the optimum operating conditions of any process experimentally is time-, effort-, and money-consuming. Moreover, performing experimental measurements is limited to a definite number of datasets, as it is impossible to investigate all the available points. Therefore, modelling (mathematical and physical) is considered the best solution for such conditions [27,28,29,30]. However, major physical and mathematical models require several electrochemical, chemical, and/or physical parameters; additionally, some of them are assumed and thus negatively affect the accuracy of such models [31]. Lately, AI “artificial intelligence” and ML “machine learning” have been involved in this direction and demonstrated their superior efficacy relative to conventional techniques. AI and ML tools have been tackling several engineering applications [32,33,34,35].
The ANFIS model merges the merits of the fuzzy and neural, therefore, in the current research, it has been applied to build the model of a nanofluid-based PVT system incorporated with nano-enhanced phase change material (PCM). The constructed ANFIS model simulates the thermal energy and exergy outputs in terms of four operating parameters: the thickness of the PCM; the mass flow rate of the HTF “heat transfer fluid”; the MFNPCM, “mass fraction of nanoparticles in PCM”; and MFNfluid, the “mass fraction of nanoparticles in nanofluid”. PSO, “particle swarm optimizer”, is then used to determine the best operating conditions to boost the thermal energy and exergy outputs.
The main contributions in this research are outlined as follows:
  • A consistent ANFIS model is constructed for simulating a nanofluid-based PV/ thermal system.
  • A new application of PSO is proposed to determine the best-operating conditions of nanofluid-based PV/thermal systems.
  • The accuracy of the suggested strategy is demonstrated.
  • The thermal energy and exergy outputs are simultaneously maximized.

2. Measured Data

The dataset is obtained using the PVT/PCM system shown schematically in Figure 1. The system consists of the PV cells sandwiched between two layers of ethylene vinyl acetate (EVA) layers. The bottom EVA layer is covered by TPT (Tedlar Polyester Tedlar, Du Pont, Wilmington, DE, USA) [36], absorber, collector tubes, and, finally, PCM. In the shown PVT/NPCM module, water is used as the cooling HTF, and RT “Rubitherm” (Rubitherm, Berlin, Germany) series of organic phase change materials is used (https://www.rubitherm.eu/en/productcategory/organische-pcm-rt) (accessed on 1 November 2022). The performance of the PV system was boosted by optimizing the operating conditions, i.e., the flow rate of the HTF, the PCM thickness, and the mass fraction of the nanomaterials (Al2O3) in both the HTF and the PCM. The performance was discussed according to the thermal energy and exergy variation. Table 1 shows the dataset used in this study.

3. Methodology

Two stages, ANFIS modelling and parameter identification, are taken into consideration.

3.1. ANFIS-Modelling

Figure 2 exemplifies the construction of ANFIS model. It contains some main phases such as fuzzification and defuzzification [38]. There are several possible membership function forms and defuzzification methods, but the Gaussian shape and weight average were adopted in this work. For obtaining a smoother prediction curve, the Gaussian-shape is very suitable MF as it gives a fine transition from one predicted point to the next, as opposed to the others’ triangular or trapezoidal shapes, which produce jumps in the predictions. An example of the ANFIS rules is as follows:
IF x is A1 and y is B1 then f1 = g1(x, y)
IF x is A2 and y is B2 then f2 = g2(x, y)
where, the A1, A2 and B1, B2 are the membership functions of the two inputs x and y, respectively. However, the final output f is calculated based on the two rules’ outputs, f1 and f2, as follows:
f = ω ˜ 1 f 1 + ω ˜ 2 f 2   ( Output   Layer )
Evaluating   ω ˜ 1 g 1 x , y   and   ω ˜ 2 g 2 x , y   ( Defuzzification   Layer )
ω ˜ 1 = ω 1 ω 1 + ω 2 and   ω ˜ 2 = ω 2 ω 1 + ω 2   ( N   Layer )
ω 1 = μ A 1 μ B 1   and   ω 2 = μ A 2 μ B 2   ( π   Layer )
μ A 1 ,   μ A 2 , μ B 1   and   μ B 2   are   the   MF   values   of   the   two   inputs   ( Fuzzification   Layer )

3.2. Particle Swarm Optimization

PSO simulates the movements of birds to attain a specific objective (optimum solution). The location of every particle is updated based on data from other particles. The new velocity and location can be determined as follows [36,37]:
v t + 1 = v t + C 1 R 1 X p X t + C 2 R 2 X g X t
p t + 1 = p t + v t + 1
where, v and p are the velocity and location of the particle. R1 and R2 are randoms. Four controlling parameters that affect the thermal energy and exergy outputs are examined in the current work. Such parameters include the PCM’s thickness, the HTF’s mass flow rate, MFNPCM, and MFNfluid. Therefore, throughout the optimization procedure, these parameters are assigned to be the decision variables for the PSO to simultaneously boost the thermal energy and exergy outputs, which are used as the system’s cost function.

4. Results and Discussion

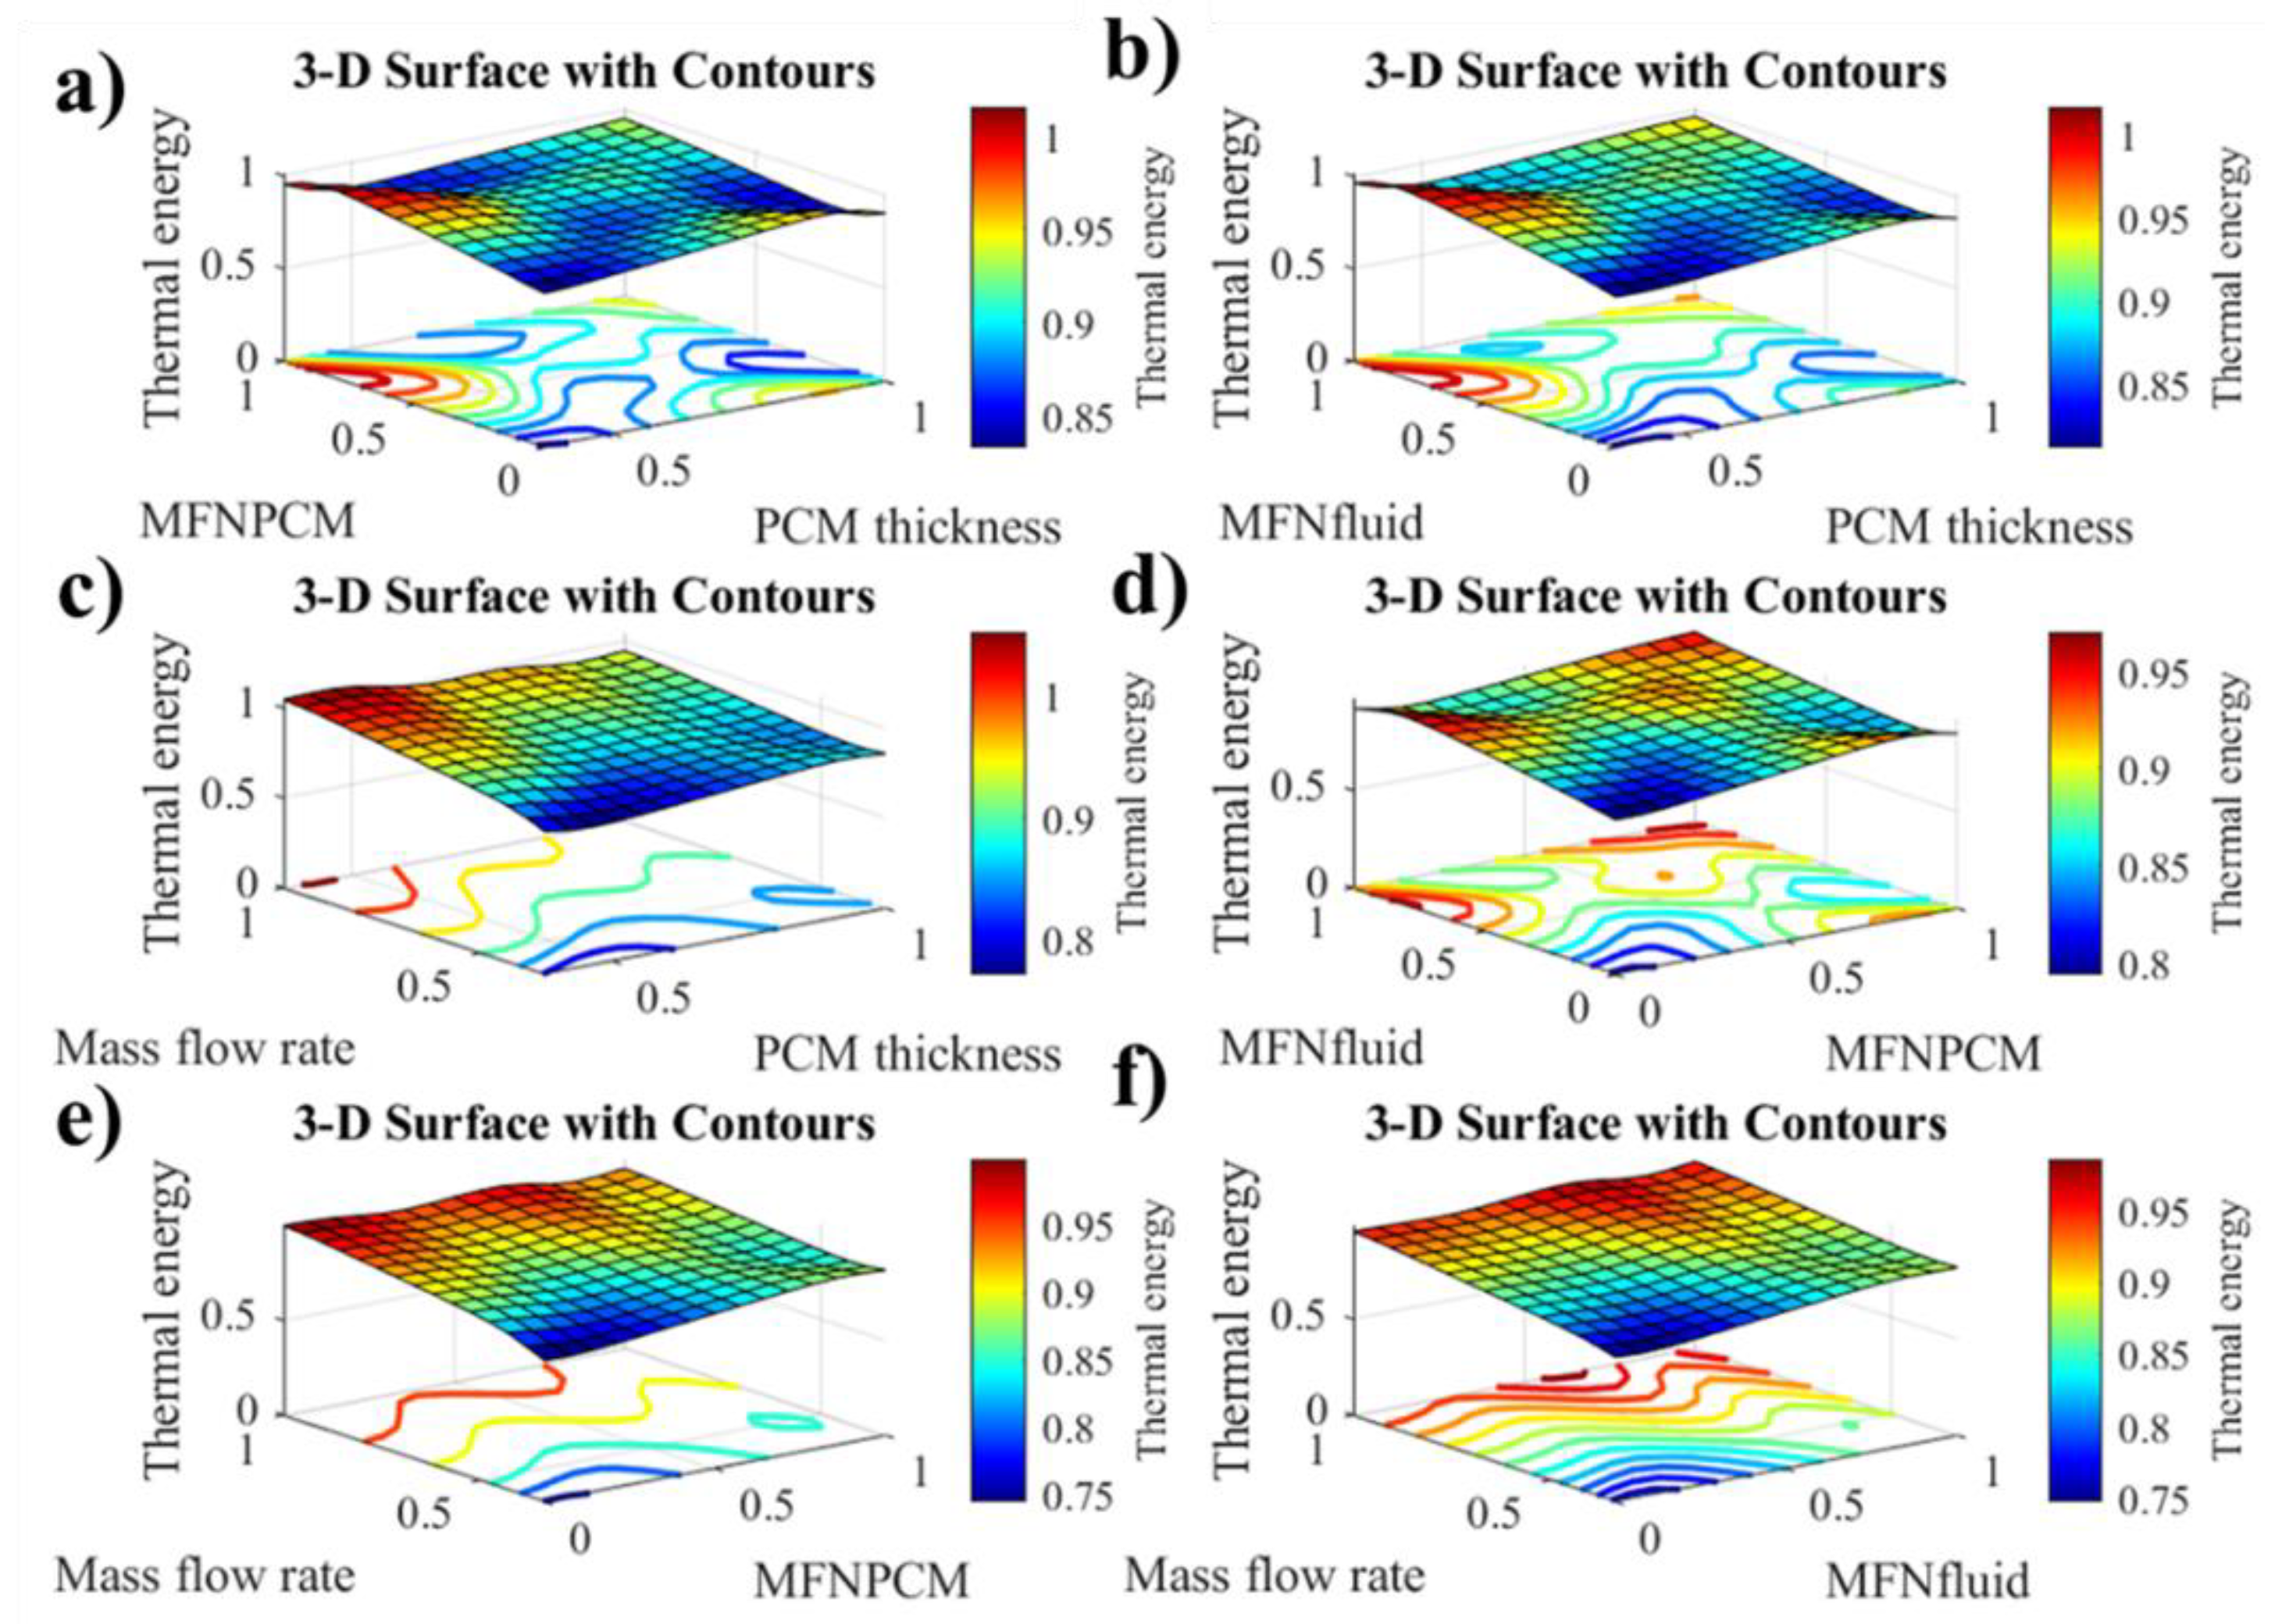
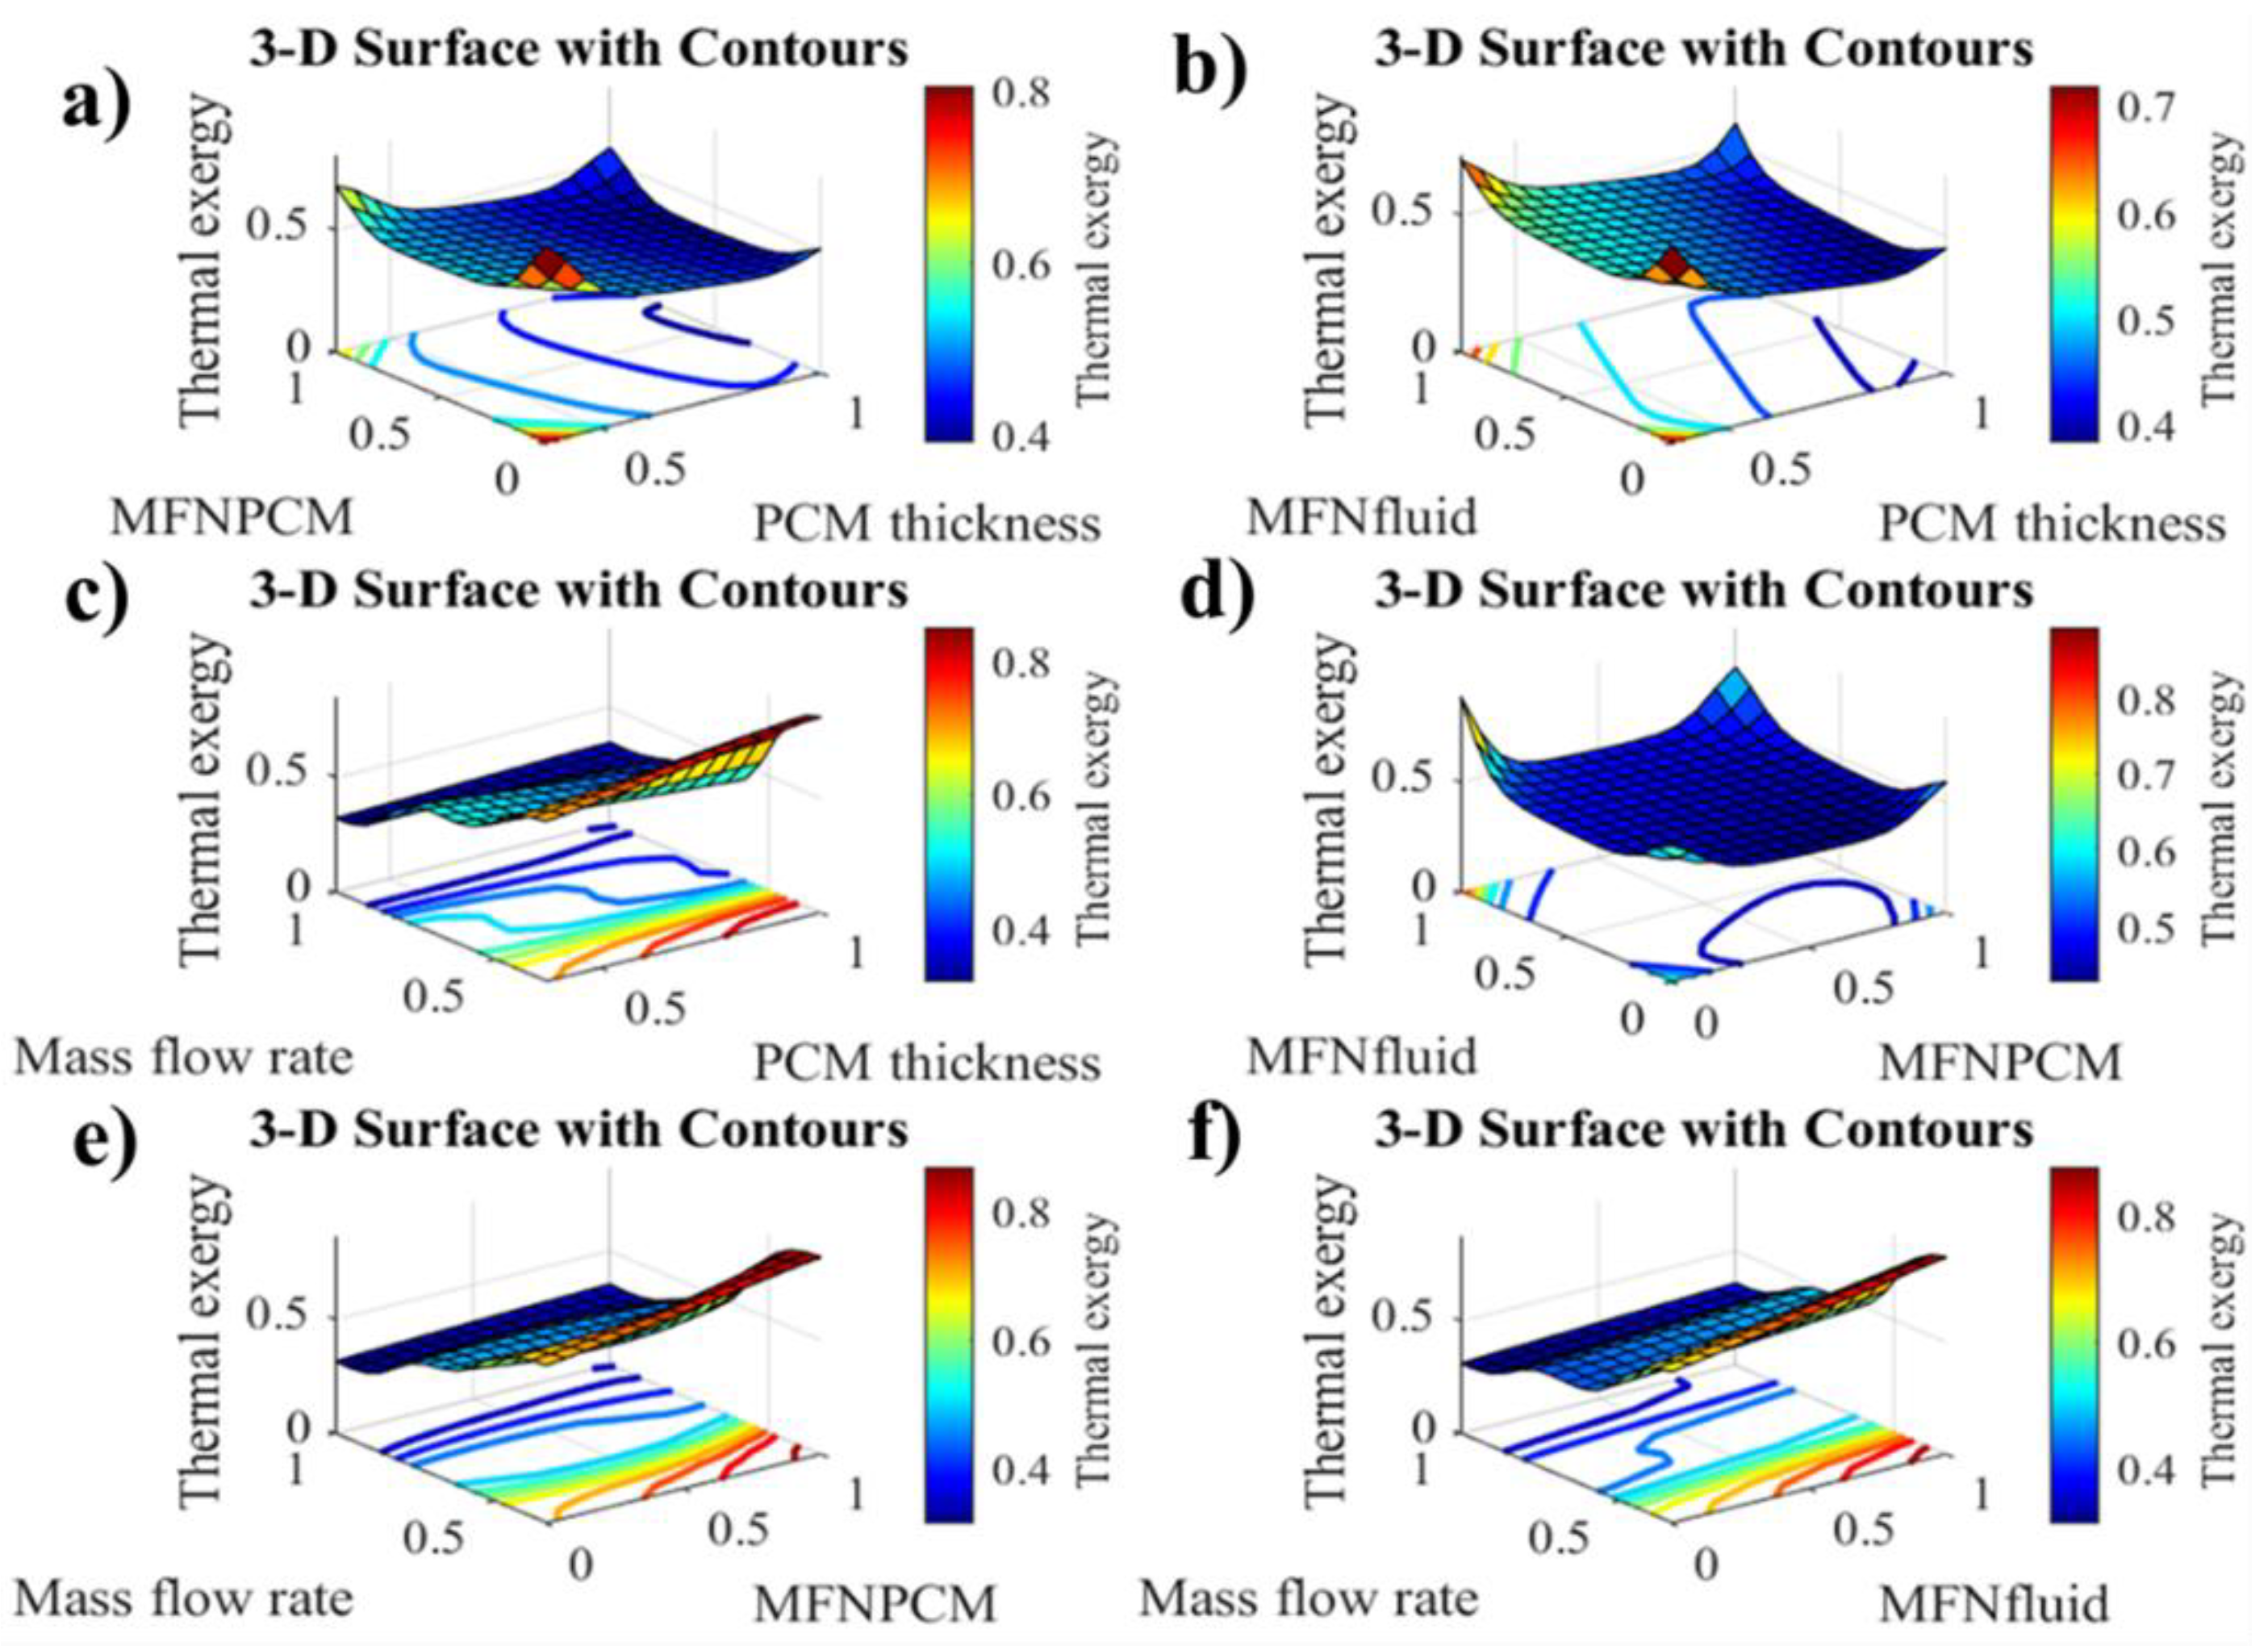
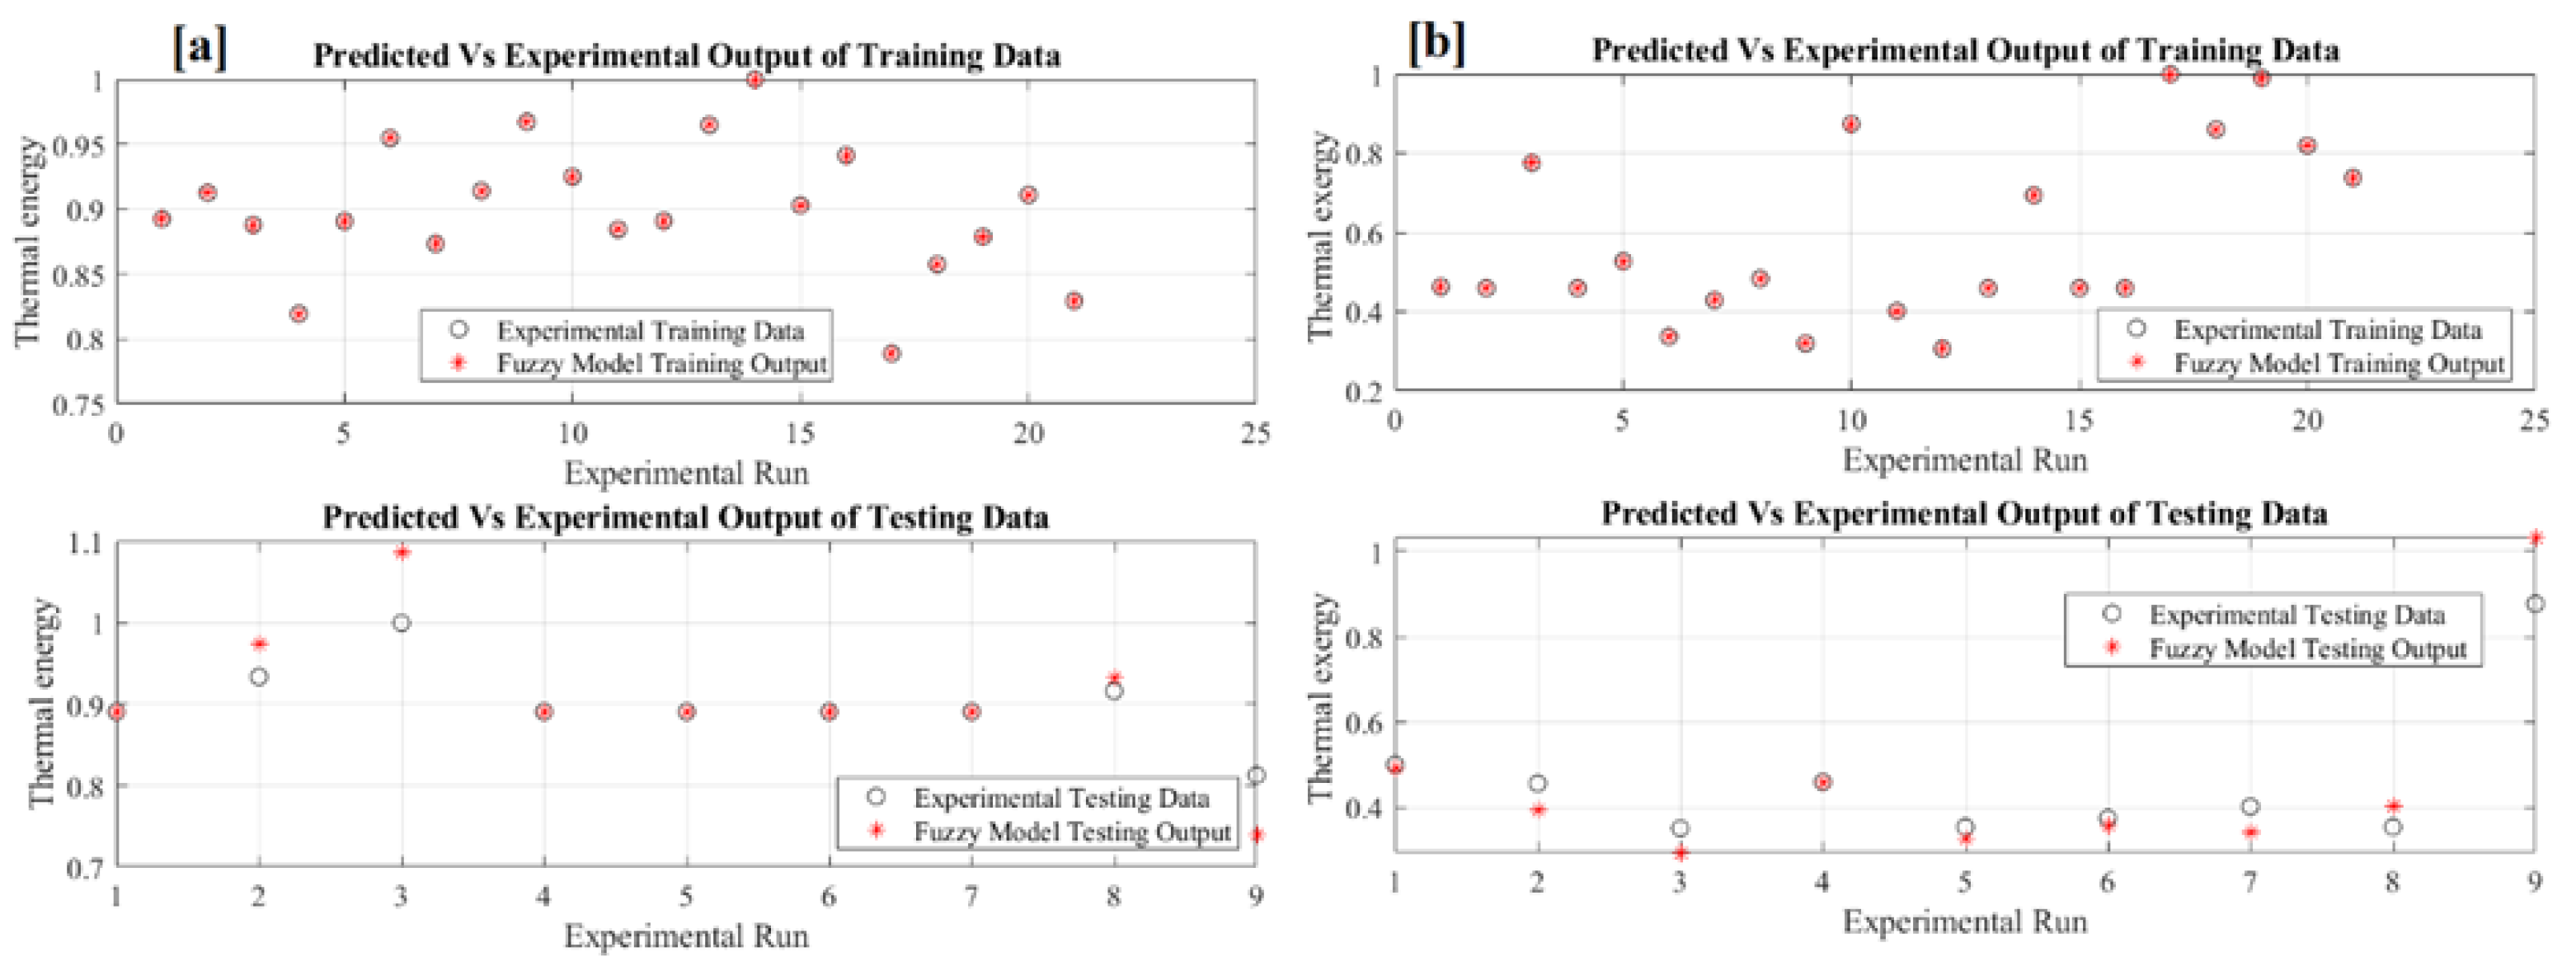
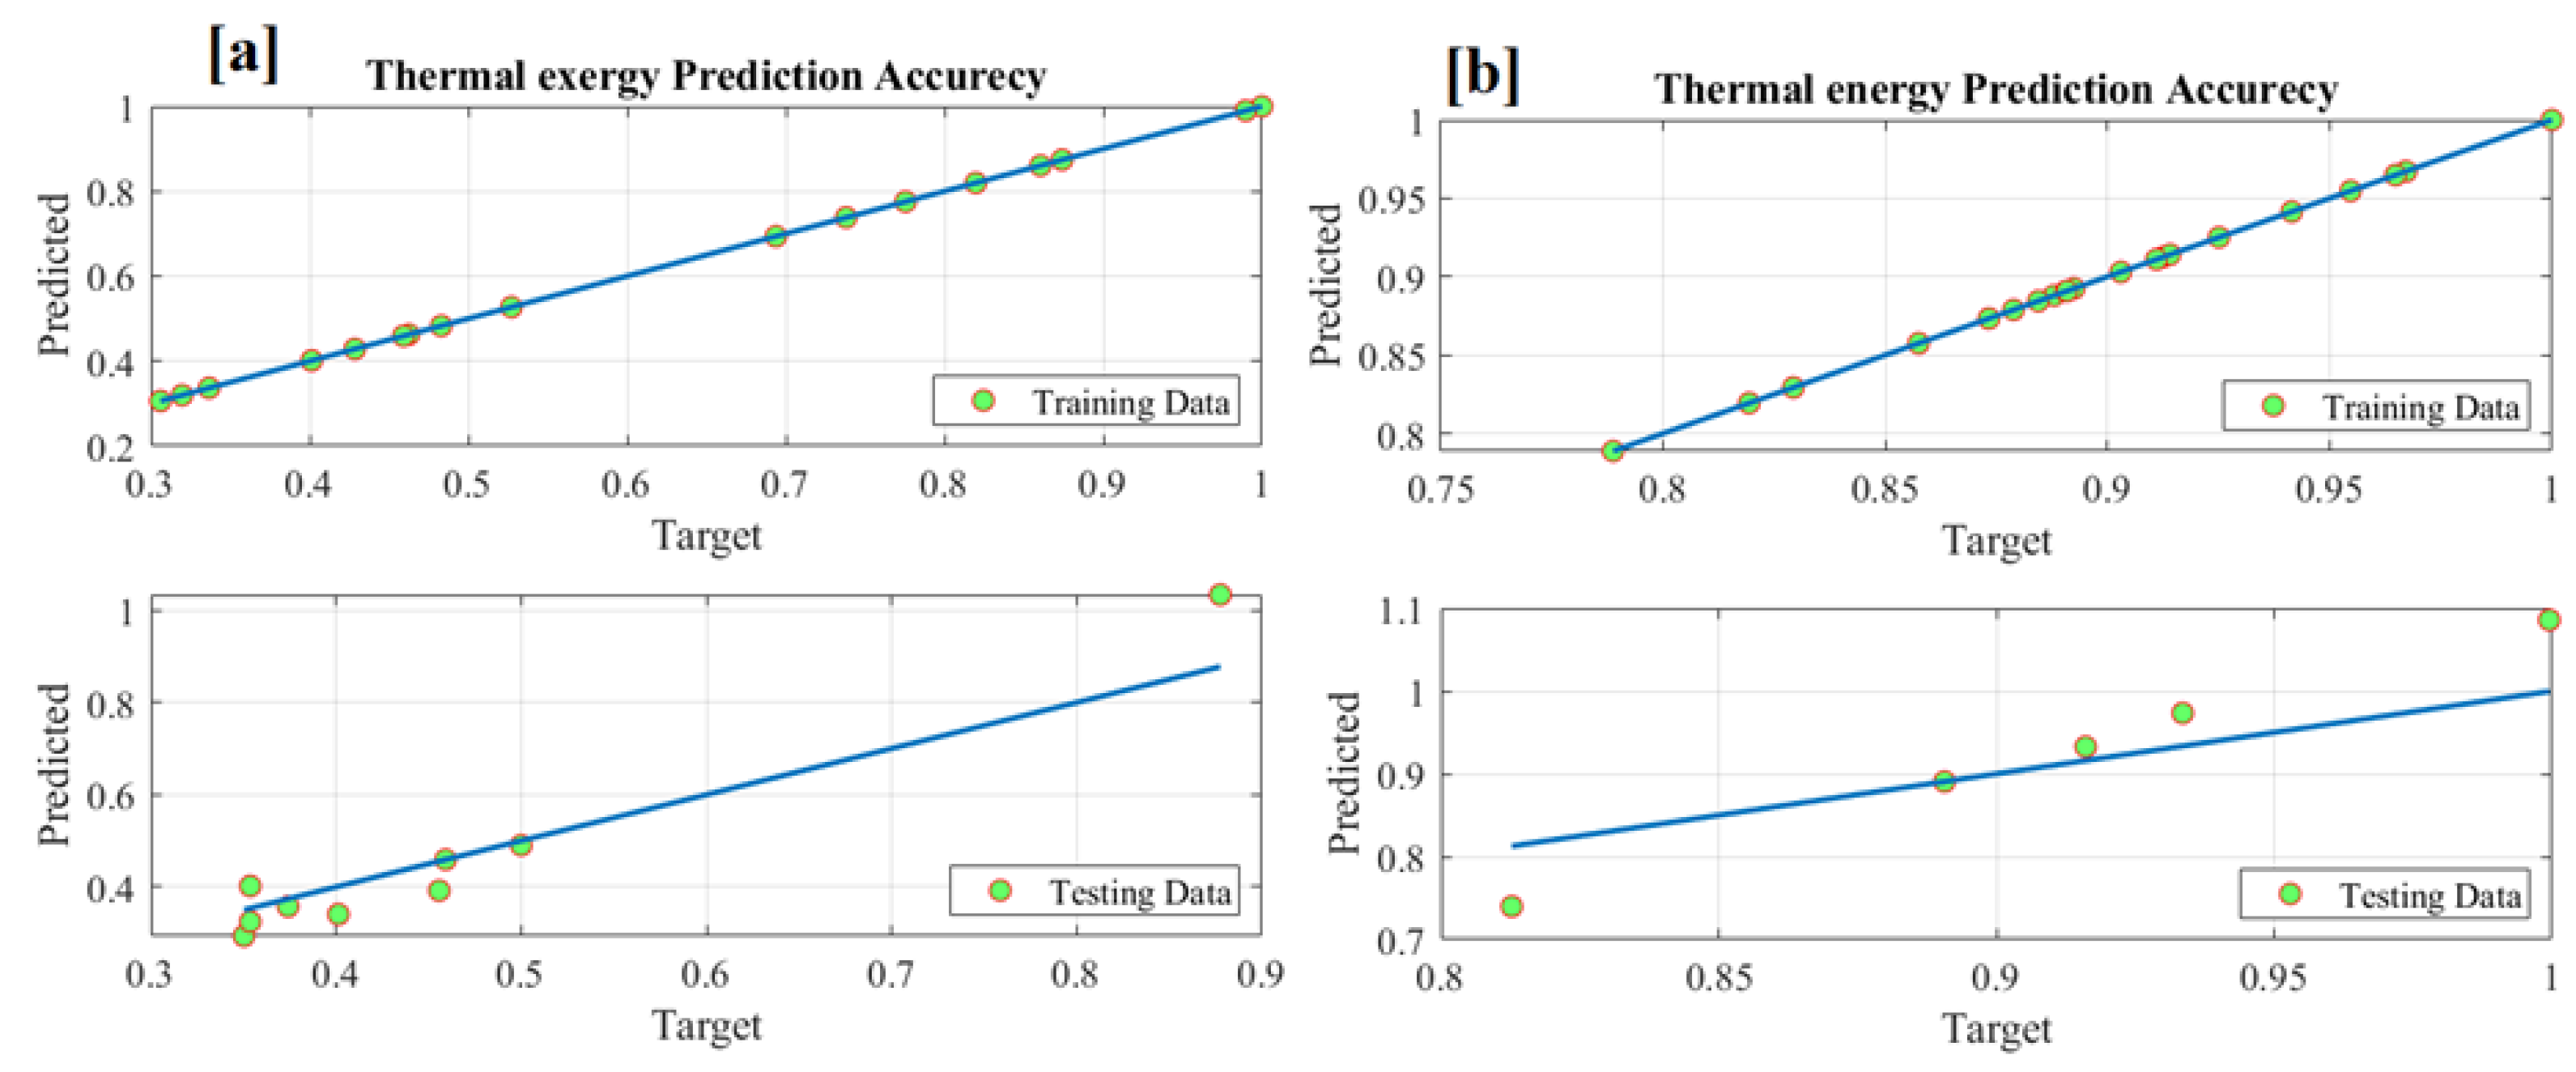
4.1. ANFIS Based Results

The number of the experimental data points used to build the ANFIS model is 30 points for both training and testing phases. The model is trained with a hybrid approach applying LSE in the forward path and Backpropagation in the backward path. The SC is used to create the system’s rules, which were in this work 13 and 21 rules, respectively, for energy and exergy models. Then, these models were trained up to a smaller MSE. The resulting statistical metrics of both energy and exergy models are presented in Table 2.
In respect to Table 2, for the thermal exergy ANFIS- based model, the RMSE values are 2.262 × 10⁻⁶ and 0.0657 for training and testing data. The R2 values “coefficient-of-determination” are 1.00 and 0.966 for training and testing data. On the other hand, for the thermal energy ANFIS-based model, the RMSE values are 3.61 × 10⁻⁷ and 0.0403 for training and testing data, while R2 values are 1.00 and 0.9985 for training and testing data. The low RMSE and the high R2 values of both ANIFS-based models reveal a successful modelling phase. Figure 3 displays the four-input single-output construction of both ANFIS-based models; the outlines of the Gaussian shape MFs are expressed in Figure 4.
Figure 5 indicates the 3D description for the input and output (dark red is the highest, while dark blue is the lowest). As depicted in Figure 5a, a higher mass fraction of the nanoparticles in the PCM has a positive effect at a low thickness of the PCM where the nanoparticles will improve the thermal conductivity (K) of the PCM, thereby, improving the efficiency of the PCM in recovering the heat from the PV panels that can be rejected out again easily at a small thickness of the PCM. However, at a high thickness of the PCM, the increase in the K at higher fractions of the nanoparticles would result in a higher storage capacity of the PCM of the thermal energy; therefore, the net output thermal energy will decrease. From Figure 5b, it is clear that the increase in the mass fraction of the nanofluid in the HTF resulted in increasing the heat recovery and thus the thermal energy output. This would be related to the improved K of the base fluid with the nanoparticles’ dispersion, and thus to the heat recovery from the PV panels. Therefore, the output thermal energy is increased by increasing the nanoparticle fraction in the base fluid. This effect is very clear at the low thickness of the PCM; however, again, at the high thickness of the PCM, a considerable portion of the energy is stored in the PCM, so the effect is not clear. The effect of the mass flow rate of the HTF on the thermal energy is clear in Figure 5c,e,f. It is clear that the thermal energy is increased with the increase in the mass flow rate of the HTF, and this effect is clear at a low thickness of the PCM (Figure 5c), the low fraction of nanoparticles in the PCM (Figure 5e) and a high fraction of the nanoparticles in the HTF (Figure 5f). The negative effect of the high thickness of the PCM (Figure 5c), and the high fraction of nanoparticles in the PCM (Figure 5e) would be related to the increased capacity of the PCM to store the thermal energy. And the low fraction of the nanoparticles in the HTF (Figure 5f) would be related to the low K of the HTF and thus suggest a lower capacity to remove heat from the PV panels. Figure 5d demonstrated the significant effect of the nanoparticles in the base HTF on the thermal energy compared to the effect of the nanoparticles in the PCM. In sum, the significant effect of the mass flow rate of the HTF and the fraction of the nanoparticles in the base HTF was clear compared to the other factors. Figure 6 shows the effect of the interaction of every two binary variables on the exergy. It was clear from the figure that the exergy has the highest values at conditions where the lowest thermal energy recovery occurs, i.e., the highest expected panel temperature. For instance, at the high mass flow rate depicted in Figure 6c,e,f, the lowest exergy was recorded, and the highest exergy was recorded at the lowest mass flow rate of the HTF. Also, high exergy values can be seen in the conditions of using the lowest thickness of the PCM and lowest nanoparticle concentrations in both the PCM and the base fluid (Figure 6a,b,d).
Capturing the correct relation between the inputs and outputs of nanofluid-based PV/thermal system helps the ANFIS models to predict the output performance correctly. Figure 7 shows the predicted outputs against the experimental datasets. Considering Figure 7, it is clear that there is matching between dataset and predictions. As well, the predictions’ plots across the 100% precision line (Figure 8) are shown for both training and testing stages.

4.2. Optimization Results

The purpose of this part is to determine the best values of thickness of the PCM layer, the flow rate of the HTF MFNPCM, and MFNfluid for simultaneous maximization of both the thermal energy and exergy. Accordingly, after constructing reliable ANFIS models of thermal energy and exergy, PSO is used for estimating the optimal operating parameters. SO (“single-objective”) and MO (“multi-objective”) optimization processes are considered. The problem argument of SO and MO optimization procedures can be stated as:
for   SO ,   energy :   x = arg x R   max y 1
for   SO ,   exergy :   x = arg x R   max y 2
for   MO :   x = arg x R   max y 1 + y 2
x is the set of normalized input variables and y1 and y2 are normalized values of the energy and exergy.
Table 3 presents the optimal parameters and corresponding energy and exergy values using the measured, RSM method and the suggested methodology for both single- and multi-objective optimization. For single-objective optimization of energy, the proposed methodology increased the thermal energy by 16.91% compared with measured data, however, the exergy value decreased by 7.97%; hence in general, the overall performance increased by 8.94%. For single-objective optimization of exergy, the proposed methodology improved the exergy by 5.78% than those of measured data, but the energy value decreased by 0.6%, so the overall performance increased by 5.18%. Finally, for multi-objective optimization, the proposed methodology increased the energy and exergy, respectively, by 7.94% and 1.36%, compared with measured data. These results show the effectiveness of integrating PSO and ANFIS modelling. The particle convergence curves during multi-objective optimization are presented in Figure 9. It is evident that all particles will eventually arrive at the best possible answer. Figure 10 shows the objective function variation for single-objective optimization of energy, single-objective optimization of exergy, and multi-objective optimization.

5. Conclusions

The optimal controlling input parameters of the nanofluid-based photovoltaic/thermal system were determined using the interaction between ANFIS modeling and PSO. Firstly, ANFIS has been established for simulating the output thermal energy and exergy in terms of different operating conditions. For the thermal exergy ANFIS- based model, the values of the RMSE are 2.262 × 10⁻⁶ and 0.0657 for training and testing data. The values of the R2 “coefficient-of-determination” are 1.00 and 0.966, for training and testing data. In the other hand, for the thermal energy ANFIS- based model, the RMSE values are 3.61 × 10⁻⁷ and 0.0403 for training and testing data. The values of the R2 are 1.00 and 0.9985 for training and testing data. The low RMSE and the high R2 of both ANIFS-based models reveal a successful modelling phase Then, PSO was used to estimate the best-controlling parameters to increase the thermal energy and exergy. For single-objective optimization of energy, the proposed ANFIS & PSO increased the thermal energy by 16.91% over measured data, however, the exergy value is decreased by 7.97%. For single-objective optimization of exergy, the proposed ANFIS & PSO improved the thermal exergy by 5.78% above measured data; however, the energy decreased by 0.6%. Finally, for multi-objective optimization, the proposed methodology increased the energy and exergy respectively by 7.94% and 1.36%, compared with measured data. This proves the superiority of the incorporation of PSO and ANFIS modelling. The obtained results are helpful for other PVT systems, taking into consideration the effect of the site, capacity of the PVT systems, the type of the nanofluid, etc.

Author Contributions

Conceptualization, E.T.S., A.G.O., M.A.A. and H.R.; methodology, E.T.S., S.K.S., M.R.G., S.M.A.R., Y.B.H. and S.K.S.; formal analysis, A.G.O., M.A.A. and H.R.; investigation, E.T.S. and H.R.; resources, A.G.O. and M.A.A.; data curation, E.T.S. and H.R.; writing—original draft preparation, A.G.O., M.A.A., E.T.S., H.R., M.R.G., Y.B.H., S.M.A.R. and S.K.S.; writing—review and editing, A.G.O., M.A.A., E.T.S., H.R., M.R.G., S.M.A.R. and S.K.S.; supervision, A.G.O., M.A.A. and S.K.S.; project administration, A.G.O. All authors have read and agreed to the published version of the manuscript.

Funding

The authors would thank the University of Sharjah for supporting the current work through project number CoV19–0202.

Data Availability Statement

Not applicable.

Conflicts of Interest

The authors declare no conflict of interest.

References

  1. Olabi, A.G.; Abdelkareem, M.A. Renewable energy and climate change. Renew. Sustain. Energy Rev. 2022, 158, 112111. [Google Scholar] [CrossRef]
  2. Olabi, A.G. State of the art on renewable and sustainable energy. Energy 2013, 61, 2–5. [Google Scholar] [CrossRef]
  3. Olabi, A.G. Developments in sustainable energy and environmental protection. Energy 2012, 39, 2–5. [Google Scholar] [CrossRef]
  4. Gomaa, M.R.; Mustafa, R.J.; Al-Dhaifallah, M.; Rezk, H. A low-grade heat Organic Rankine Cycle driven by hybrid solar collectors and a waste heat recovery system. Energy Rep. 2020, 6, 3425–3445. [Google Scholar] [CrossRef]
  5. Abdelkareem, M.A.; Maghrabie, H.M.; Sayed, E.T.; Kais, E.-C.A.; Abo-Khalil, A.G.; Radi, M.A.; Baroutaji, A.; Olabi, A.G. Heat pipe-based waste heat recovery systems: Background and applications. Therm. Sci. Eng. Prog. 2022, 29, 101221. [Google Scholar] [CrossRef]
  6. Olabi, A.G.; Elsaid, K.; Sayed, E.T.; Mahmoud, M.S.; Wilberforce, T.; Hassiba, R.J.; Abdelkareem, M.A. Application of nanofluids for enhanced waste heat recovery: A review. Nano Energy 2021, 84, 105871. [Google Scholar] [CrossRef]
  7. Zhang, R.; Yang, B.; Chen, N. Arithmetic optimization algorithm based MPPT technique for centralized TEG systems under different temperature gradients. Energy Rep. 2022, 8, 2424–2433. [Google Scholar] [CrossRef]
  8. Abdelkareem, M.A.; Mahmoud, M.S.; Elsaid, K.; Sayed, E.T.; Wilberforce, T.; Al-Murisi, M.; Maghrabie, H.M.; Olabi, A.G. Prospects of Thermoelectric Generators with Nanofluid. Therm. Sci. Eng. Prog. 2022, 29, 101207. [Google Scholar] [CrossRef]
  9. Maghrabie, H.M.; Elsaid, K.; Sayed, E.T.; Abdelkareem, M.A.; Wilberforce, T.; Olabi, A.G. Building-integrated photovoltaic/thermal (BIPVT) systems: Applications and challenges. Sustain. Energy Technol. Assess. 2021, 45, 101151. [Google Scholar] [CrossRef]
  10. Gomaa, M.R.; Ahmed, M.; Rezk, H. Temperature distribution modeling of PV and cooling water PV/T collectors through thin and thick cooling cross-fined channel box. Energy Rep. 2022, 8, 1144–1153. [Google Scholar] [CrossRef]
  11. Alami, A.H.; Rabaia, M.K.H.; Sayed, E.T.; Ramadan, M.; Abdelkareem, M.A.; Alasad, S.; Olabi, A.-G. Management of potential challenges of PV technology proliferation. Sustain. Energy Technol. Assess. 2022, 51, 101942. [Google Scholar] [CrossRef]
  12. Guedri, K.; Salem, M.; Assad, M.E.H.; Rungamornrat, J.; Malek Mohsen, F.; Buswig, Y.M. PV/Thermal as Promising Technologies in Buildings: A Comprehensive Review on Exergy Analysis. Sustainability 2022, 14, 12298. [Google Scholar] [CrossRef]
  13. Jia, Y.; Alva, G.; Fang, G. Development and applications of photovoltaic–thermal systems: A review. Renew. Sustain. Energy Rev. 2019, 102, 249–265. [Google Scholar] [CrossRef]
  14. Olabi, A.G.; Wilberforce, T.; Elsaid, K.; Sayed, E.T.; Ramadan, M.; Atiqure Rahman, S.M.; Abdelkareem, M.A. Recent progress on Carbon-based nanomaterial for phase change materials: Prospects and challenges. Therm. Sci. Eng. Prog. 2021, 23, 100920. [Google Scholar] [CrossRef]
  15. Hameed, G.; Ghafoor, M.A.; Yousaf, M.; Imran, M.; Zaman, M.; Elkamel, A.; Haq, A.; Rizwan, M.; Wilberforce, T.; Abdelkareem, M.A.; et al. Low temperature phase change materials for thermal energy storage: Current status and computational perspectives. Sustain. Energy Technol. Assess. 2022, 50, 101808. [Google Scholar] [CrossRef]
  16. Pandey, A.K.; Hossain, M.S.; Tyagi, V.V.; Abd Rahim, N.; Selvaraj, J.A.L.; Sari, A. Novel approaches and recent developments on potential applications of phase change materials in solar energy. Renew. Sustain. Energy Rev. 2018, 82, 281–323. [Google Scholar] [CrossRef]
  17. Palacio, M.; Rincón, A.; Carmona, M. Experimental comparative analysis of a flat plate solar collector with and without PCM. Sol. Energy 2020, 206, 708–721. [Google Scholar] [CrossRef]
  18. Obalanlege, M.A.; Mahmoudi, Y.; Douglas, R.; Ebrahimnia-Bajestan, E.; Davidson, J.; Bailie, D. Performance assessment of a hybrid photovoltaic-thermal and heat pump system for solar heating and electricity. Renew. Energy 2020, 148, 558–572. [Google Scholar] [CrossRef]
  19. Daghigh, R.; Khaledian, Y. A novel photovoltaic/thermoelectric collector combined with a dual—Evaporator vapor compression system. Energy Convers. Manag. 2018, 158, 156–167. [Google Scholar] [CrossRef]
  20. Maghrabie, H.M.; Elsaid, K.; Sayed, E.T.; Radwan, A.; Abo-Khalil, A.G.; Rezk, H.; Abdelkareem, M.A.; Olabi, A.G. Phase change materials based on nanoparticles for enhancing the performance of solar photovoltaic panels: A review. J. Energy Storage 2022, 48, 103937. [Google Scholar] [CrossRef]
  21. Kalidasan, B.; Pandey, A.K.; Shahabuddin, S.; Samykano, M.; Thirugnanasambandam, M.; Saidur, R. Phase change materials integrated solar thermal energy systems: Global trends and current practices in experimental approaches. J. Energy Storage 2020, 27, 101118. [Google Scholar]
  22. Das, D.; Bordoloi, U.; Kamble, A.D.; Muigai, H.H.; Pai, R.K.; Kalita, P. Performance investigation of a rectangular spiral flow PV/T collector with a novel form-stable composite material. Appl. Therm. Eng. 2021, 182, 116035. [Google Scholar] [CrossRef]
  23. Huo, Y.; Lv, J.; Li, X.; Fang, L.; Ma, X.; Shi, Q. Experimental study on the tube plate PV/T system with iron filings filled. Sol. Energy 2019, 185, 189–198. [Google Scholar] [CrossRef]
  24. Karthikeyan, V.; Sirisamphanwong, C.; Sukchai, S.; Sahoo, S.K.; Wongwuttanasatian, T. Reducing PV module temperature with radiation based PV module incorporating composite phase change material. J. Energy Storage 2020, 29, 101346. [Google Scholar] [CrossRef]
  25. Qiu, Z.; Ma, X.; Zhao, X.; Li, P.; Ali, S. Experimental investigation of the energy performance of a novel Micro-encapsulated Phase Change Material (MPCM) slurry based PV/T system. Appl. Energy 2016, 165, 260–271. [Google Scholar] [CrossRef]
  26. Jamil, F.; Ali, H.M.; Nasir, M.A.; Karahan, M.; Janjua, M.M.; Naseer, A.; Ejaz, A.; Pasha, R.A. Evaluation of photovoltaic panels using different nano phase change material and a concise comparison: An experimental study. Renew. Energy 2021, 169, 1265–1279. [Google Scholar] [CrossRef]
  27. Ilegbusi, O.J.; Iguchi, M.; Wahnsiedler, W.E. Mathematical and Physical Modeling of Materials Processing Operations; CRC Press: Boca Raton, FL, USA, 1999; Volume 12. [Google Scholar]
  28. Sun, H.; Chang, A.; Zhang, Y.; Chen, W. A review on variable-order fractional differential equations: Mathematical foundations, physical models, numerical methods and applications. Fract. Calc. Appl. Anal. 2019, 22, 27–59. [Google Scholar] [CrossRef] [Green Version]
  29. Banks, H.T.; Tran, H.T. Mathematical and Experimental Modeling of Physical and Biological Processes; CRC Press: Boca Raton, FL, USA, 2009. [Google Scholar]
  30. Popov, S.; Vaniushkin, V.; Valineeva, A. Mathematical and Physical Modeling Cooling Process for Solid Waste Tire Pyrolysis Products. In Proceedings of the 2020 V International Conference on Information Technologies in Engineering Education (Inforino), Moscow, Russia, 14–17 April 2020; IEEE: Piscataway, NJ, USA, 2020; pp. 1–4. [Google Scholar]
  31. Nassef, A.M.; Fathy, A.; Sayed, E.T.; Abdelkareem, M.A.; Rezk, H.; Tanveer, W.H.; Olabi, A.G. Maximizing SOFC performance through optimal parameters identification by modern optimization algorithms. Renew. Energy 2019, 138, 458–464. [Google Scholar] [CrossRef]
  32. Rezk, H.; Nassef, A.M.; Inayat, A.; Sayed, E.T.; Shahbaz, M.; Olabi, A.G. Improving the environmental impact of palm kernel shell through maximizing its production of hydrogen and syngas using advanced artificial intelligence. Sci. Total Environ. 2019, 658, 1150–1160. [Google Scholar] [CrossRef]
  33. Nassef, A.M.; Sayed, E.T.; Rezk, H.; Abdelkareem, M.A.; Rodriguez, C.; Olabi, A.G. Fuzzy-modeling with Particle Swarm Optimization for enhancing the production of biodiesel from Microalga. Energy Sources Part A Recovery Util. Environ. Eff. 2019, 41, 2094–2103. [Google Scholar] [CrossRef]
  34. Salameh, T.; Kumar, P.P.; Sayed, E.T.; Abdelkareem, M.A.; Rezk, H.; Olabi, A.G. Fuzzy modeling and particle swarm optimization of Al2O3/SiO2 nanofluid. Int. J. Thermofluids 2021, 10, 100084. [Google Scholar] [CrossRef]
  35. Nassef, A.M.; Sayed, E.T.; Rezk, H.; Inayat, A.; Yousef, B.A.A.; Abdelkareem, M.A.; Olabi, A.G. Developing a fuzzy-model with particle swarm optimization-based for improving the conversion and gasification rate of palm kernel shell. Renew. Energy 2020, 166, 125–135. [Google Scholar] [CrossRef]
  36. Ahmed, M.; Radwan, A. Performance evaluation of new modified low-concentrator polycrystalline silicon photovoltaic/thermal systems. Energy Convers. Manag. 2017, 149, 593–607. [Google Scholar] [CrossRef]
  37. Kazemian, A.; Khatibi, M.; Reza Maadi, S.; Ma, T. Performance optimization of a nanofluid-based photovoltaic thermal system integrated with nano-enhanced phase change material. Appl. Energy 2021, 295, 116859. [Google Scholar] [CrossRef]
  38. Mas’ud, A.A.; Ardila-Rey, J.A.; Albarracín, R.; Muhammad-Sukki, F.; Bani, N.A. Comparison of the performance of artificial neural networks and fuzzy logic for recognizing different partial discharge sources. Energies 2017, 10, 1060. [Google Scholar] [CrossRef]
Figure 1. Schematic diagram of the PVT/PCM setup used to get the dataset used in this study.
Energies 15 08494 g001
Figure 2. Arrangement of ANFIS model.
Energies 15 08494 g002
Figure 3. Configuration of ANFIS-based model (a) Energy and (b) exergy.
Energies 15 08494 g003
Figure 4. Inputs’ MFs of ANFIS-based model: (a) energy and (b) exergy.
Energies 15 08494 g004
Figure 5. 3-D surfaces of ANFIS-based model showing the interactions of two different variables, i.e., (a) MFNPCM and PCM’s thickness, (b) MFNfluid and PCM’s thickness, (c) HTF’s mass flow rate and PCM’s thickness, (d) MFNfluid and MFNPCM, (e) HTF’s mass flow rate and MFNPCM, and (f) HTF’s mass flow rate and MFNfluid, all relative to the thermal energy.
Energies 15 08494 g005
Figure 6. 3-D surfaces of ANFIS-based model showing the interactions of two different variables, i.e., (a) MFNPCM and PCM’s thickness, (b) MFNfluid and PCM’s thickness, (c) HTF’s mass flow rate and PCM’s thickness, (d) MFNfluid and MFNPCM, (e) HTF’s mass flow rate and MFNPCM, and (f) HTF’s mass flow rate and MFNfluid, all relative to the exergy.
Energies 15 08494 g006
Figure 7. Predicted against measured datasets: (a) energy and (b) exergy.
Energies 15 08494 g007
Figure 8. Prediction accuracy: (a) energy and (b) exergy.
Energies 15 08494 g008
Figure 9. Particles convergence curves during multi-objective optimization: (a) normalized Mass flow rate, (b) normalized MFNPCM, (c) normalized PCM thickness, and (d) normalized MFNfluid.
Energies 15 08494 g009
Figure 10. Objective function variation: (a) single-objective (normalized energy), (b) single-objective (normalized exergy), and (c) multi-objective optimization.
Energies 15 08494 g010
Table 1. The input and output data matrix, reproduced from [37], with permission No. 5401450569962.
Input ParametersOutput Parameters
m
(kg/h)
MFNfluid
(%)
H (cm)MFNPCM
(%)
E˝el
(W/m2)
E˝th
(W/m2)
Ex˝el
(W/m2)
Ex˝th
(W/m2)
S˝gen
(W/K m2)
12081.516135.09345.65135.092.942.6710
22082.750135.62323.55135.622.582.6704
32001.50134.60331.60134.602.532.6739
42081.50135.12343.74135.122.912.6710
5208416135.91312.91135.912.412.6700
620040135.26306.67135.262.172.6729
7200416135.54297.61135.542.042.6725
82001.516134.56333.71134.562.572.6740
92042.758135.65309.16135.652.282.6713
104042.7516136.37336.74136.371.362.6720
114082.758136.50344.32136.501.472.6712
124042.758136.34336.06136.341.352.6721
1340448136.40335.03136.401.342.6719
144042.758136.34336.06136.341.352.6721
154041.58135.80360.23135.801.552.6732
164002.758136.14329.51136.141.262.6730
174042.750136.16344.90136.161.422.6724
184042.758136.34336.06136.341.352.6721
196042.758136.67352.24136.670.992.6722
206001.50135.98364.94135.981.032.6743
2160040136.36349.05136.360.942.6734
226001.516135.97366.15135.971.042.6743
2360840136.70364.04136.701.102.6718
246081.50136.39377.32136.391.182.6725
25600416136.57340.71136.570.902.6728
266081.516136.40377.14136.401.182.6725
27608416136.90355.23136.901.042.6712
E˝el is the electrical power of the PVT system, E˝th is the thermal power of the PVT, Ex˝el is the electrical exergy of the PVT, Ex˝th is the thermal exergy of the PVT, S˝gen is the rate of entropy generation of the PVT. All are per unit area.
Table 2. Statistical metrics of both energy and exergy models.
MSERMSECoefficient of Determination (R2)
TrainTestAllTrainTestAllTrainTestAll
Thermal exergy model
5.12 × 10−120.00430.00132.262 × 10−60.06570.03601.000.9660.9773
Thermal energy model
1.3 × 10−130.00160.00053.61 × 10−70.04030.02211.00.99850.9106
Table 3. Optimal parameters using different strategies (SO: single-objective, and MO: multi-objective).
MethodObjectivePCM Thick
cm.
HTF
Kg/h
MFNPCM
%
MFNfluid
%
Energy
W/m2
Exergy
W/m2
% Change
Energy Exergy
Exp. [37]SO: energy1.50860377.321.18NANA
Exp. [37]SO: exergy1.516820345.652.94NANA
Exp. [37]MO1.516820345.652.94NANA
RSM [37]SO: energy1.50.0277.9259.127377.876NA0.15NA
RSM [37]SO: exergy1.50820NA2.916NA−0.82
RSM [37]MO2.71616834.043338.5451.773−2.06−39.69
ProposedSO: energy1.513.296.7260441.121.08616.91−7.97
ProposedSO: exergy2.210839.168343.583.11−0.65.78
ProposedMO1.515.94834.332373.092.987.941.36
Publisher’s Note: MDPI stays neutral with regard to jurisdictional claims in published maps and institutional affiliations.

