Article

Contrast Estimation in Vibroacoustic Signals for Diagnosing Early Faults of Short-Circuited Turns in Transformers under Different Load Conditions

by
Jose R. Huerta-Rosales
1,
David Granados-Lieberman
2,
Juan P. Amezquita-Sanchez
1,
Arturo Garcia-Perez
3,
Maximiliano Bueno-Lopez
4 and
Martin Valtierra-Rodriguez
1,*
1
ENAP-Research Group, CA-Sistemas Dinámicos y Control, Laboratorio de Sistemas y Equipos Eléctricos (LaSEE), Facultad de Ingeniería, Universidad Autónoma de Querétaro (UAQ), Campus San Juan del Río, Río Moctezuma 249, Col. San Cayetano, San Juan del Río 76807, Querétaro, Mexico
2
ENAP-Research Group, CA-Fuentes Alternas y Calidad de la Energía Eléctrica, Departamento de Ingeniería Electromecánica, Tecnológico Nacional de México, Instituto Tecnológico Superior de Irapuato (ITESI), Carretera Irapuato-Silao km 12.5, Colonia El Copal, Irapuato 36821, Guanajuato, Mexico
3
ENAP-Research Group, División de Ingenierías, Universidad de Guanajuato, Campus Irapuato-Salamanca, Carretera Salamanca-Valle de Santiago km 3.5 + 1.8 km, Comunidad de Palo Blanco, Salamanca 36885, Guanajuato, Mexico
4
Department of Electronics, Instrumentation, and Control, Universidad del Cauca, Popayán 190002, Cauca, Colombia
*
Author to whom correspondence should be addressed.
Submission received: 7 October 2022 / Revised: 10 November 2022 / Accepted: 11 November 2022 / Published: 14 November 2022
(This article belongs to the Special Issue Condition Monitoring and Failure Prevention of Electric Machines)

Abstract

:
The transformer is one of the most important electrical machines in electrical systems. Its proper operation is fundamental for the distribution and transmission of electrical energy. During its service life, it is under continuous electrical and mechanical stresses that can produce diverse types of damage. Among them, short-circuited turns (SCTs) in the windings are one of the main causes of the transformer fault; therefore, their detection in an early stage can help to increase the transformer life and reduce the maintenance costs. In this regard, this paper proposes a signal processing-based methodology to detect early SCTs (i.e., damage of low severity) through the analysis of vibroacoustic signals in steady state under different load conditions, i.e., no load, linear load, nonlinear load, and both linear and nonlinear loads, where the transformer is adapted to emulate different conditions, i.e., healthy (0 SCTs) and with damage of low severity (1 and 2 SCTs). In the signal processing stage, the contrast index is analyzed as a fault indicator, where the Unser and Tamura definitions are tested. For the automatic classification of the obtained indices, an artificial neural network is used. It showed better results than the ones provided by a support vector machine. Results demonstrate that the contrast estimation is suitable as a fault indicator for all the load conditions since 89.78% of accuracy is obtained if the Unser definition is used.

Graphical Abstract

1. Introduction

The condition monitoring and fault diagnosis of electrical machines have become essential tools for industrial processes since their reliability and safety can be improved [1]. Among the electric machines, the transformer can suffer various internal faults such as winding and core deformations, broken clamping structures, short-circuit turns (SCT), bending, and others [2]. For this machine, the winding is an essential operating component and, at the same time, it is one of the most vulnerable components; in fact, the associated faults to windings are nearly 40% [3], whereas in the most cases the initial damage can lead to the complete fault of the transformer, increasing repairment costs and people risks. In this regard, the development and application of early fault detection methods are of paramount importance [4,5].
In literature, different techniques to carry out the monitoring and diagnosis of transformer windings by analyzing different types of signals have been proposed [6,7,8,9]. However, the vibration signal analysis has proven to be an effective tool for monitoring and diagnosing internal faults in transformers [6], since the vibrational response changes if the winding mechanical properties are modified [7], e.g., when a fault condition appears. Some studies measure acoustic signals instead of vibration signals [8,9]. It is observed that acoustic signals are produced by the vibration of a source, thus, they contain the same information about the source behavior. In this way, the vibration and acoustic signals are interrelated and homologous [8,9].
The machinery diagnosis that employs vibroacoustic (VA) signals typically consists of three essential steps: acquisition and preprocessing of data, feature extraction from the data, and classification based on the extracted features. Successful methods have shown that feature extraction is the most crucial step in machinery monitoring and diagnosis [7,10]. In literature, several techniques extract features from VA signals in distinct domains (e.g., time, frequency, or time-frequency) for assessing the transformer condition [11,12,13,14,15,16,17,18,19,20,21,22]. A widely employed tool to change from time-domain to frequency-domain is the Fourier Transform (FT). The FT allows extracting frequential information related to the system condition. In [11], they employ the FT in VA signals and estimate the total harmonic distortion (THD) to assess the transformer healthy condition. Meanwhile, in [9], the THD, dominant frequencies, and the ratio of frequencies from the spectrum of acoustic signals are estimated. They establish a warning threshold that allows identifying a direct current bias state. Although the FT presents promising results, it has some limitations. These limitations compromise the detection of changes in frequency over time, mainly due to the nonstationary nature of the signal and its high-level noise, among others [12]. To overcome these limitations, the short-time Fourier Transform (STFT) is introduced. This technique provides a two-dimensional representation of the analyzed signal in time, i.e., a time-frequency representation (TFR) in the time-frequency domain. In [13], the STFT is used to analyze a VA signal, where the changes in frequency are associated to the anomalous behavior in the transformer. Nevertheless, the STFT has the resolution trade-off issue, i.e., it can gain frequency resolution but, at the same time, loss resolution in time, and vice versa, which can compromise the accuracy of the results; in addition, if the signal presents a severe level of noise, the performance decreases due to the spectral leakage problem, compromising the diagnosis as well [14]. Another effective way to construct a TFR is using the Wavelet transform (WT) and its variations. The WT has better time and frequency localization, making it more effective than STFT for some applications [15]. The work presented in [16] uses the WT to analyze the transient state of the transformer from its vibration signals. Also, a WT-based work called Empirical WT is used in [17], in which it is employed to build a TFR and estimate the multiscale entropy as a fault feature. On the other hand, in [18], the Wavelet packet is applied to detect DC bias in transformers, obtaining very effective results. Yet, the success of a WT-based approach depends on the proper selection of both the mother wavelet and the decomposition level [19], which is different in each application.
As mentioned above, the changing of domain (i.e., time or frequency) always requires the application of a transformation technique, implying a computational cost. In this regard, feature extraction in the time domain has been explored. The work presented in [20] diagnoses a transformer under a SCT fault by employing different fractal algorithms. They extract information from the vibration signals to detect diverse SCT fault severities. In [21], several statistical features are extracted from the vibration signals, then, the most representative ones are selected to diagnose the transformer under different SCT fault severities. Also, a mathematical statistics-based method for the analysis of vibration signals is presented in [22], where the probability distribution is used to identify the SCT fault. Although promising results have been obtained, there are still some issues that have not been completely addressed, e.g., damage detection of low severity (i.e., 1 or 2 SCTs) under different load conditions, which is of paramount importance since online condition monitoring systems for predictive maintenance can be developed. It is worth noting that the detection of early faults is a challenging task since the behavior of the transformer slightly changes. The challenge increases if both the high-level noise in the VA signals and the electrical stresses associated to the different load conditions are considered. Therefore, the development and application of new methods are still current needs.
Recently, the contrast index used in image processing for analyzing texture [23,24] has been used for diagnosing broken rotor bars in induction motors through the analysis of electric current signals [25], showing that it can provide information about variations into a signal waveform, which is congruent as it detects variations in color and brightness in an image. In this regard, as the main contribution, this work explores the application of the contrast index to diagnose early SCT faults, where a complete methodology (i.e., signal processing and automatic pattern recognition) is proposed. Also, unlike other works, the proposal is assessed when the transformer is under different load conditions, increasing its applicability in real operating scenarios; besides, it is worth noting that the detection of early SCT faults is not an easy task due to imperceptible changes in the transformer and the high noise into the VA signals. In order to develop and validate the proposed method, the VA signals from a transformer capable to emulate different early SCT severities, i.e., 0, 1, and 2 SCTs, where 0 SCTs represents the healthy condition, are firstly acquired. At this stage, four different load conditions, i.e., (1) no load, (2) linear load, (3) nonlinear load, and (4) both linear and nonlinear loads, are considered. In general, these loads represent real life operating conditions [5]. Once the signals have been acquired, two contrast definitions, i.e., Unser and Tamura, are computed and compared in order to observe which one provides the best sensibility to the fault. Finally, the different values of contrast for the different SCT conditions are processed by an artificial neural network (ANN) for automatic pattern recognition, where the performance of a support vector machine (SVM) is also compared. Results demonstrate the effectiveness of the proposal. The rest of the paper is organized as follows. Section 2 presents the theoretical background for transformer vibrations, contrast index, and ANNs. The proposed methodology is described in Section 3. Section 4 shows the experimental setup and the obtained results. A discussion of works is presented in Section 5. Finally, Section 6 draws the obtained conclusions.

2. Theoretical Background

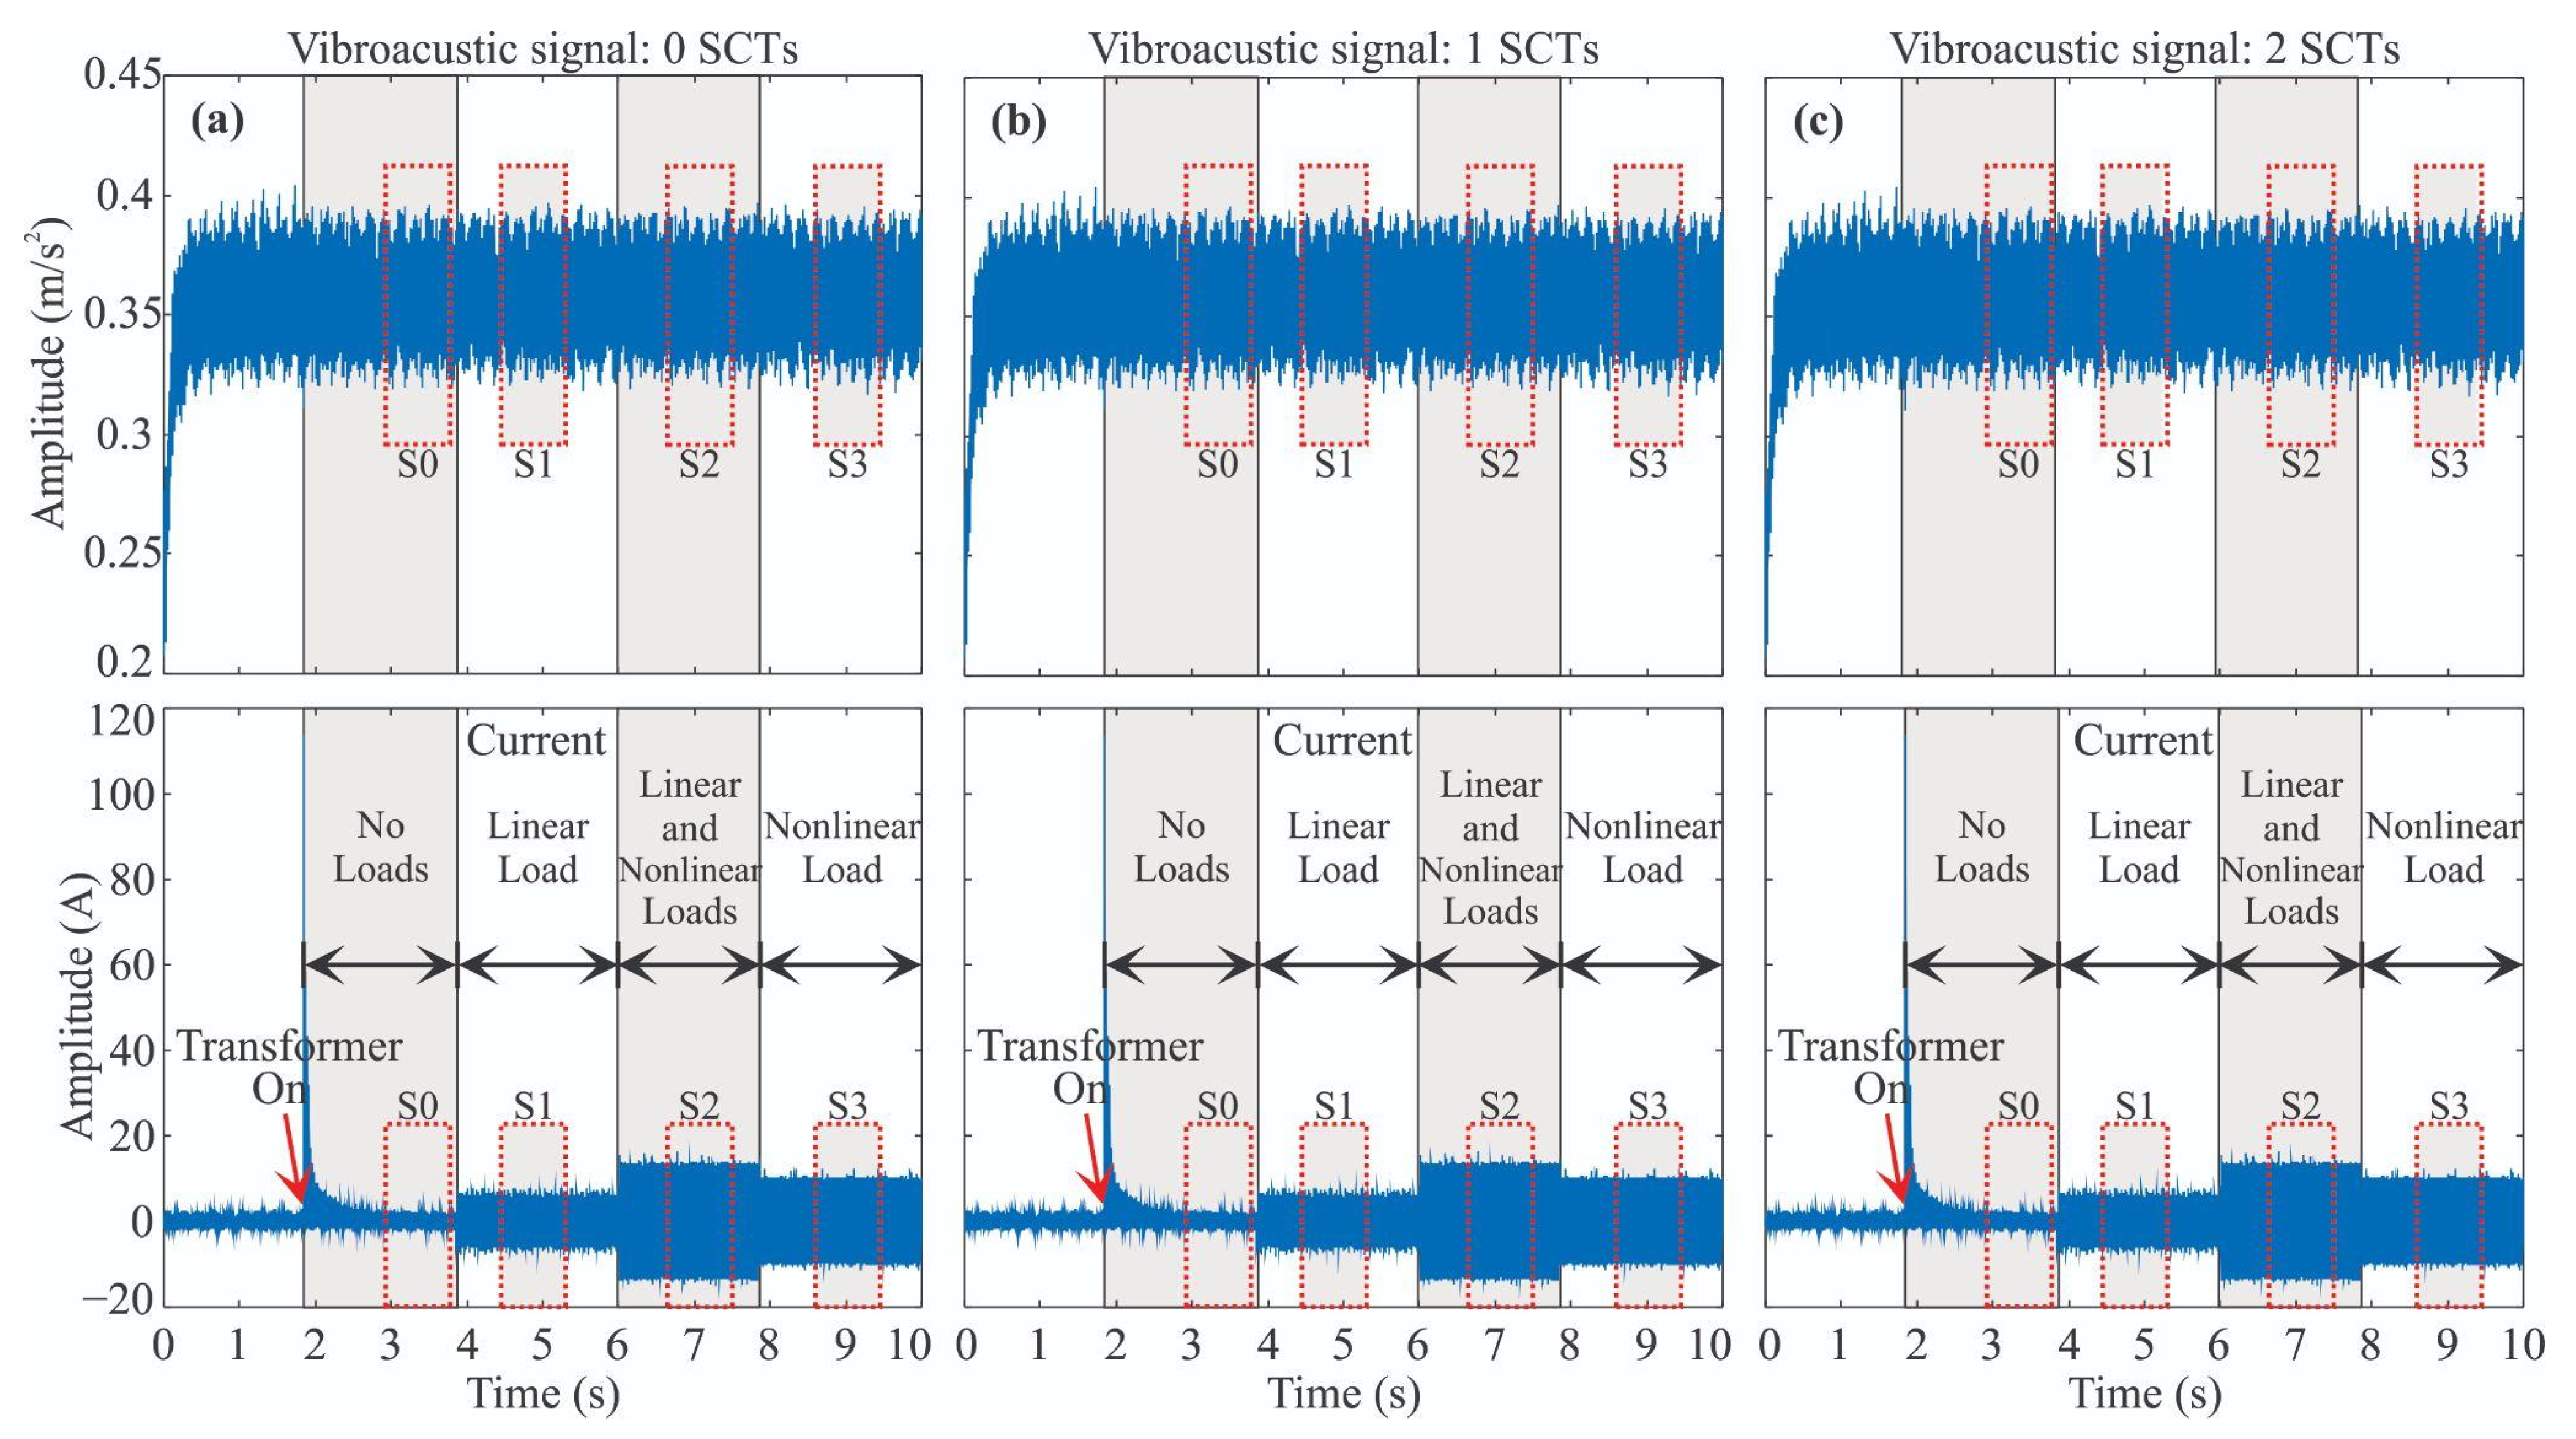
2.1. Transformer Vibration

Transformer vibration is from two principal sources: windings and core. Although the vibration components of each source are distinct, the winding component is smaller than the component from the core [9].
The winding vibration is principally caused by the electric force, which is generated by the current that circulates through the windings and its interaction with the magnetic leakage flux [26]. The forces created by winding vibration have two components: axial and radial, where the force is proportional to the square of the current as shown in Equation (1) and its fundamental frequency is twice the fundamental frequency of the current signal [27].
F w i n d i n g I 2
On the other hand, the main cause of core vibration is the magnetostriction phenomenon. This phenomenon changes the shape of a ferromagnetic material when it is under the influence of a magnetic field. Then, in Equation (2), the force magnitude from core vibration is proportional to the square of the voltage [28]. The fundamental frequency due to the magnetostriction is twice the fundamental frequency of the voltage signal, but high frequency harmonics can appear due to the nonlinear magnetostriction behavior. Also, the force direction is perpendicular to the core plane [29].
F c o r e V 2
As mentioned above, the vibration signals and acoustic signals are homologous. In this regard, any change in the VA signal is directly related to the transformer performance. Therefore, the characterization of these changes through time-domain indicators (e.g., the contrast index) can help to determine the transformer condition.

2.2. Contrast

The contrast index is a textural feature that measures the variations present in an image [30]. In a simple way, it is the difference between a pair of black and white dots. The contrast value can be maximum when two pair of dots have opposite values in the gray scale, e.g., 0 and 255, and be minimum when their values are similar. Although this index is intended for images, it can also be applied to 1D signals. Two simple ways to estimate the contrast are presented by Unser [31] and Tamura et al. [32].

2.2.1. Unser Contrast

Unser employs the sum and difference of histograms to estimate the contrast [31]. In order to do so, firstly, the variation between two points separated by d samples in a signal L ( n ) is computed as follows:
D n , d = L ( n ) L ( n + d )
where n {0, 1, …, N − 1}. With this value, the histogram of differences is computed as:
h d ( j ) = c a r d { n N , D n , d = j }
where j = N g + 1 , N g + 2 , , N g 2 , N g 1 for at least Ng levels of gray. card{ } refers to the number of elements of a set.
The normalized difference histogram is then given by:
P D = h d ( j ) T
where T is the total number of counts. It is computed by:
T = j h ( j )
Finally, the contrast can be computed as:
C = j j 2 P D ( j )

2.2.2. Tamura Contrast

Tamura et al. propose the contrast in function of [32]:
  • Dynamic range of gray levels;
  • Polarization of the distribution of black and white on the histogram of gray levels or the ratio between the black and white areas.
In this regard, the kurtosis provides the polarization factor as:
α 4 = μ 4 σ 4
where μ4 is the fourth moment around the mean and σ2 is the variance that represents the distribution of the gray levels. Therefore, the Tamura contrast is defined as:
C = σ ( α 4 ) n
where n is a positive number, which is experimentally defined as n = 1/4.

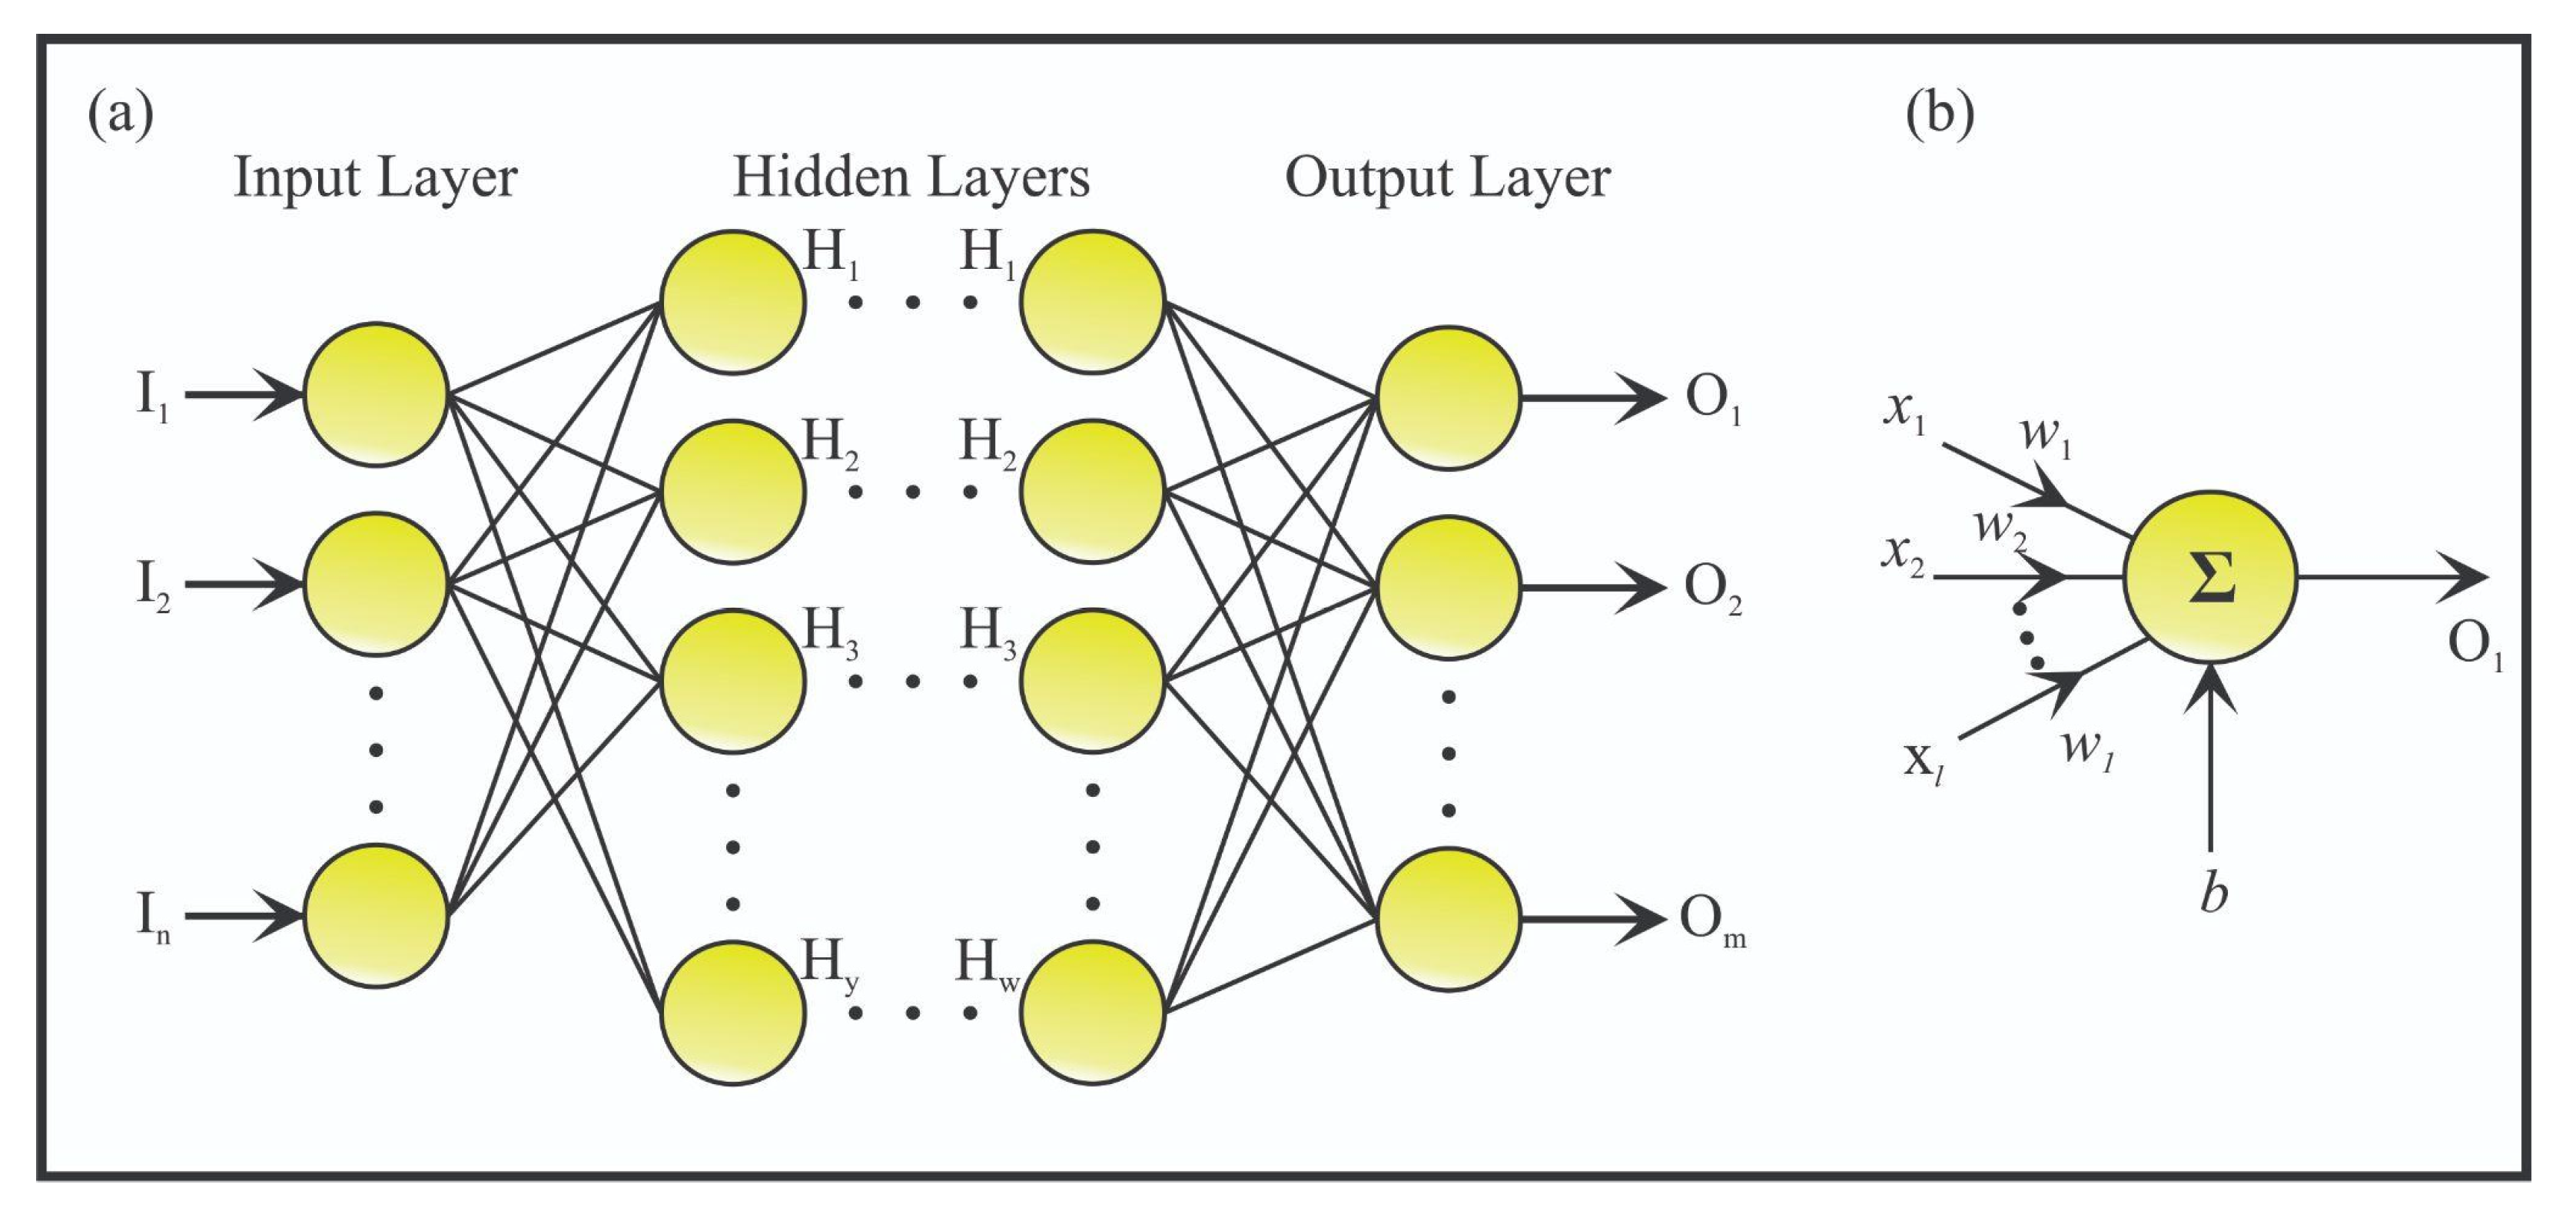
2.3. Artificial Neural Networks

ANNs are a computational structure designed to emulate a neurological structure of a human brain, which are constructed by individual elements with similar behavior to the biologic neuron also called neurons, having the capability to learn and solve problems [33]. One of the most employed ANN architectures is the feed-forward neural network due to its reduced computational load and its simplicity to be used as a classifier [33]. Figure 1a shows the ANN architecture. This architecture includes an input layer, hidden layers, and an output layer. The information moves from the input layer the output layer. In each layer, it can have a single or multiple neurons. In Equation (10), the mathematical function of a neuron is shown, whereas its structure appears in Figure 1b. The neuron consists of a summation of multiplications between the inputs xi and weights wi, which emulates the synapsis process, and a bias b. The result of the summation is evaluated by a function called the activation function f(·), which is a nonlinear function that provides the capability of modeling nonlinear relationships. Finally, a training data stage is carried out to characterize the ANN weights, i.e., a set of inputs and the desired outputs are presented to the ANN. Consequently, comparing the desired outputs and the computed outputs, the error can be estimated. Employing a training rule, the weights can be adjusted to minimize the error in a subsequent iteration. This process is repeated until the error is acceptable.
O 1 = f ( i = 1 l w i x i + b )

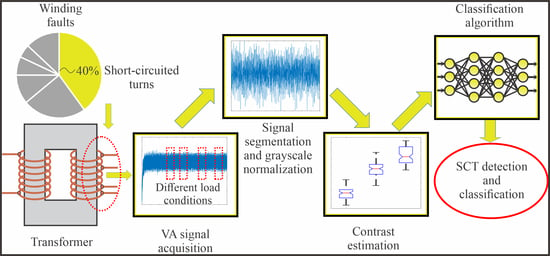
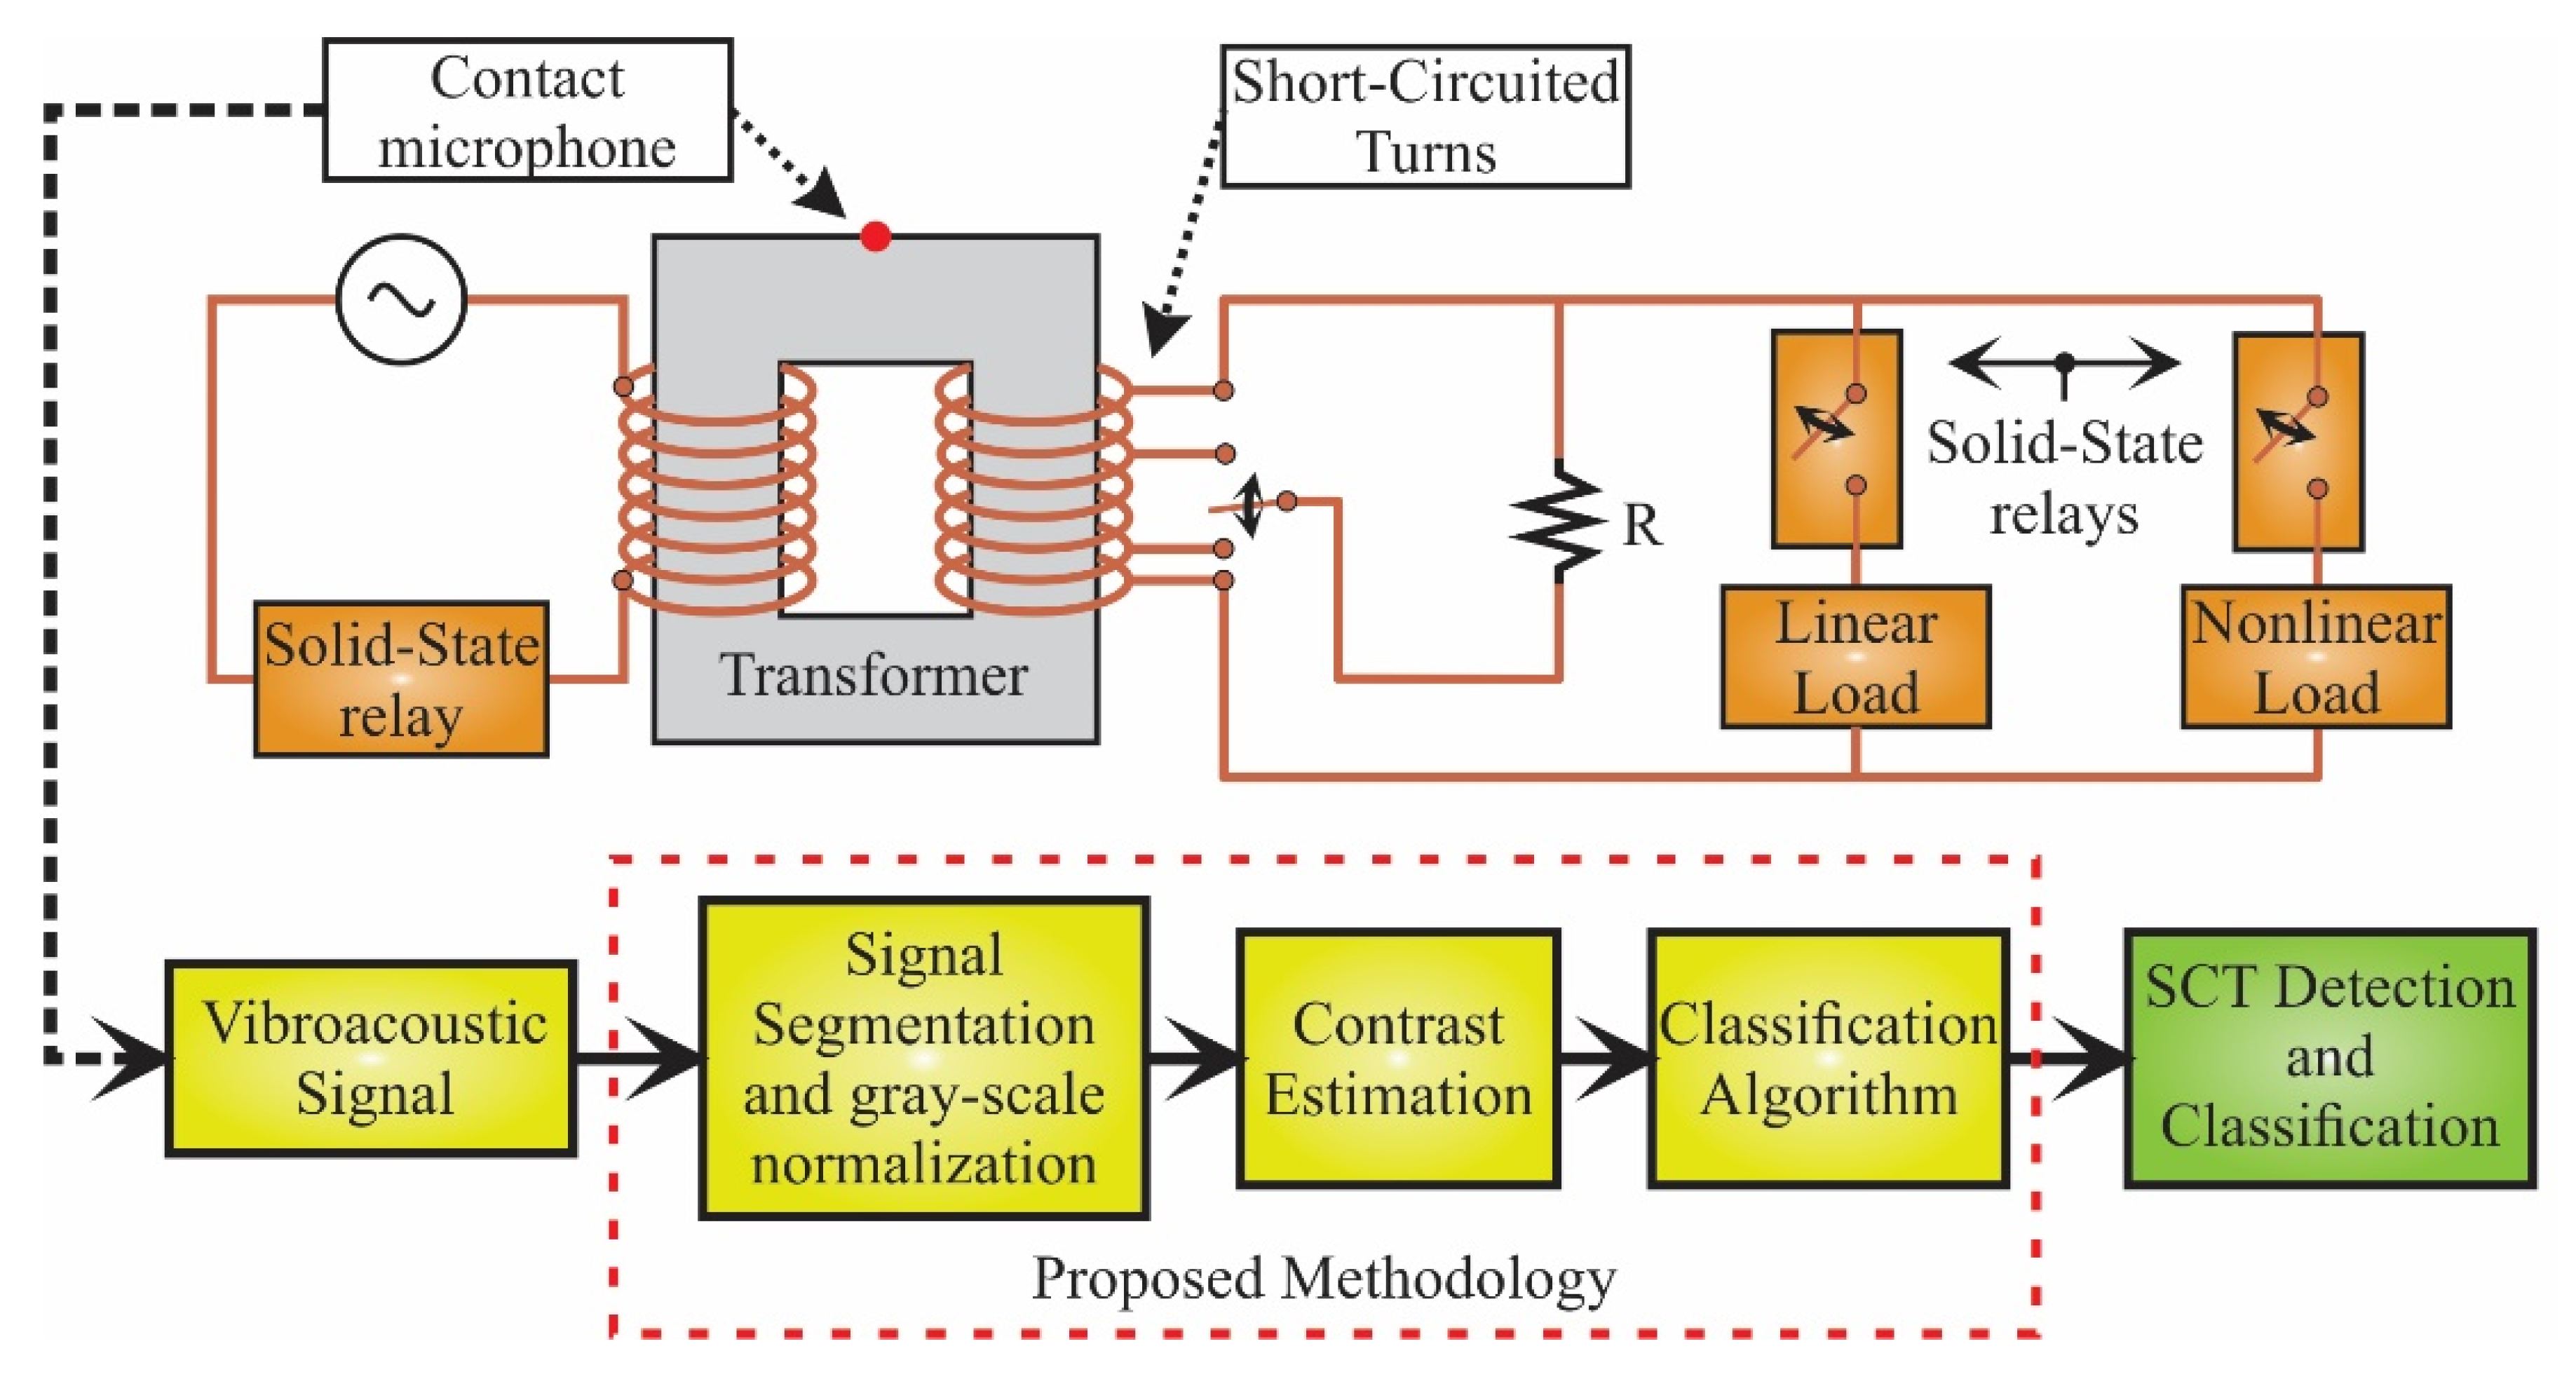
3. Proposed Methodology

Figure 2 shows the flowchart for the proposed methodology. In general, as depicted by the red dashed rectangle, it is a three-step process: (1) signal processing which consists of the signal segmentation and the gray-scale normalization, (2) estimation of contrast as fault index, and (3) design and validation of a classification algorithm. To test the proposal, VA signals from a transformer under early SCT fault conditions and different load conditions are analyzed. In order to do so, firstly, VA signals are acquired from a single-phase transformer which can emulate different early SCT fault conditions: 0, 1, and 2 SCTs, where 0 SCTs is the healthy condition. To select the SCT condition, a conductor cable is connected to different taps with a resistor R. This resistor helps to limit the short-circuit current. For carrying out the transformer energization and connecting/disconnecting the different loads, three solid-state relays are used (see the switches in Figure 2). Once the VA signals are acquired, they are segmented, taking 1 s of the signal in each different load case: (1) no load, (2) linear load, (3) linear and nonlinear loads, and (4) nonlinear load. This process is repeated for all the SCT conditions previously mentioned. Then, as part of the proposed methodology, the VA signals are normalized into a gray-scale, i.e., the VA signal takes values from 0 to 255. For each new signal, two different contrast indicators, i.e., Tamura and Unser, are computed to obtain the best fault indicator. Finally, in the automatic classification step, two different algorithms, i.e., ANN and SVM, are evaluated to detect and classify the SCT transformer condition under different load conditions. Results demonstrates that the Unser contrast and the ANN algorithm present the best results for detection and classification of SCT fault conditions regardless the load type.

4. Experimental Setup and Results

This section shows the experimental setup and the obtained results

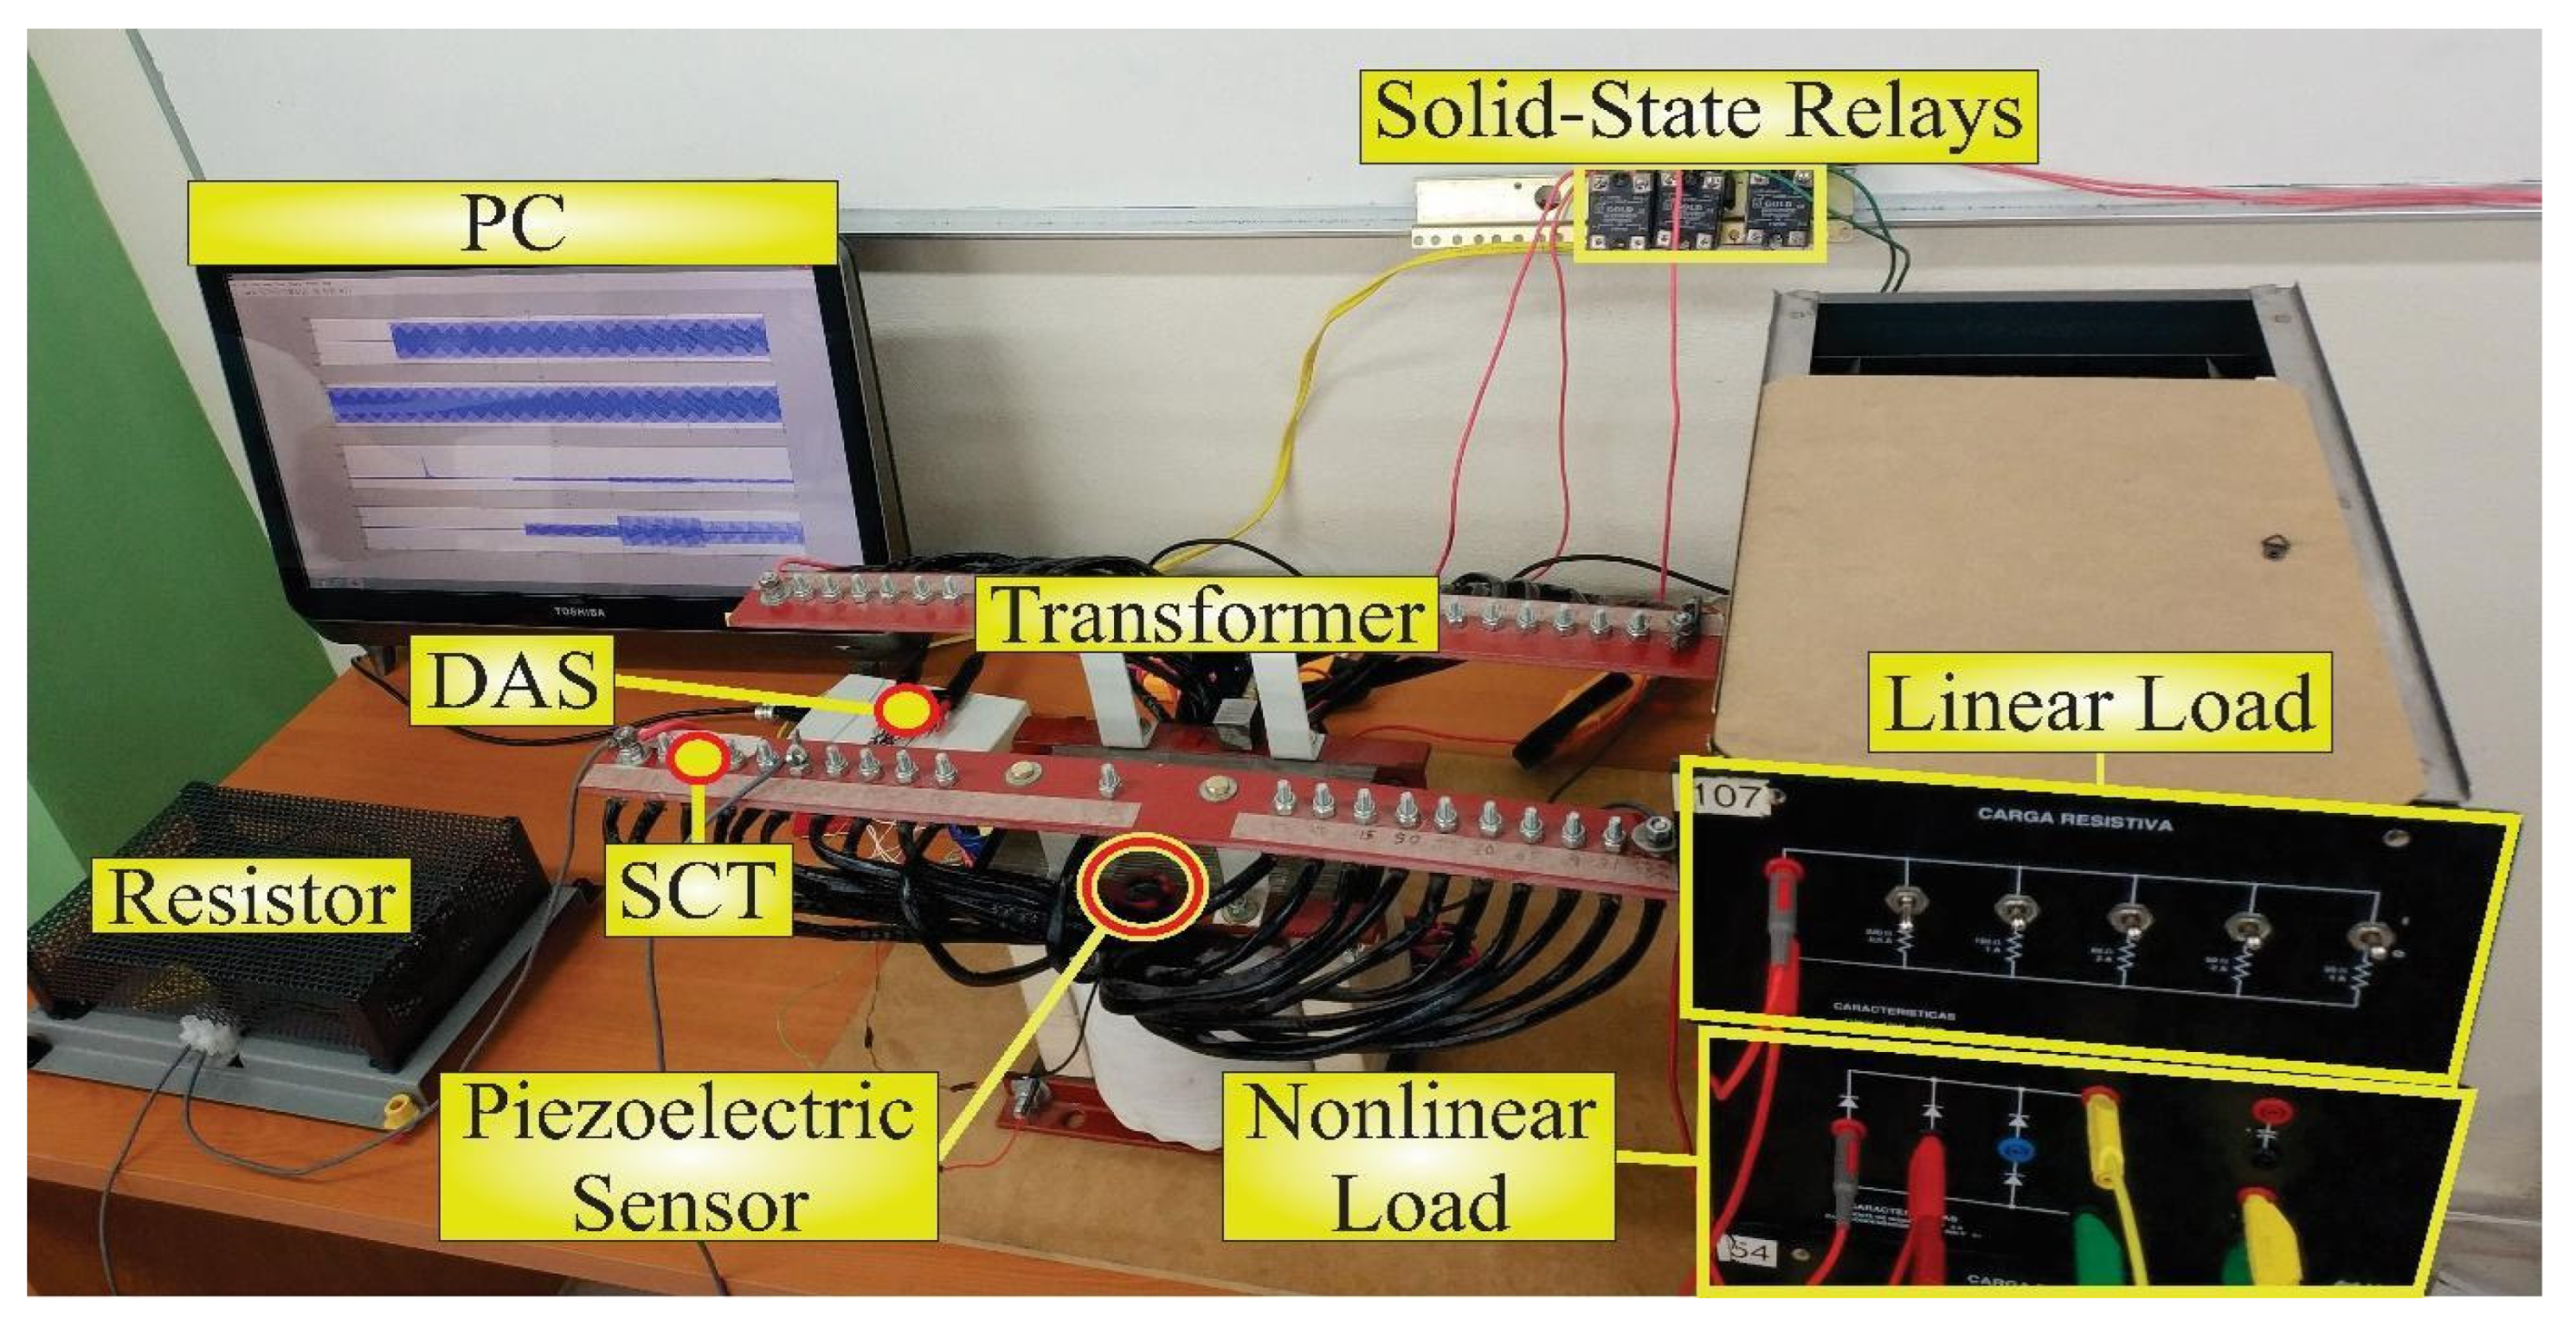
4.1. Experimental Setup

The experimental setup for the proposed work is shown in Figure 3. For the tests, a single-phase transformer of 1.5 kVA operated to 220 V with a relation 2:1 is employed. The transformer is modified to emulate early SCT fault conditions in the secondary winding. In order to do so, the transformer winding is unwound and, then, various taps are pulled out while rewinding. To protect the winding during the SCT fault, a resistor, R, of 2 ohms is used.
For the transformer energization and the connection/disconnection of the linear and nonlinear loads, three solid-state relays, model SAP4050D, are used. The linear and nonlinear loads represent approximately the 93% of the total load of the transformer, i.e., 900 W and 500 W, respectively. The linear load is a resistive array of 15 ohms and the nonlinear load is the combination of a resistive array of 24 ohms and a rectifier. The rectifier is composed by an array of diodes of 800 V and 8 A with a capacitor filter of 210 μF and 450 V. To measure the VA signals from the transformer and provide a low-cost, easy-to-use, and commercial solution, a contact microphone piezoelectric pickup (TP-6 model from RECKLESS) is used. Its operating principle is based on a piezoelectric diaphragm that measures the vibrations (i.e., acceleration in m/s2) from the contact zone with 6.4 kHz of maximum bandwidth which is good enough to capture the frequency range of interest, i.e., 1 kHz. It is located at the top center of the transformer core; in this location, the core and winding vibrations as well as the generated noise can be received in a similar way from a geometrical point of view. The data are acquired by using a data acquisition system (DAS) based on the National Instruments NI-USB-6211 board which is configured with a sampling frequency of 7812.5 samples/s. For each condition, i.e., 0, 1, and 2 SCTs, and the different combinations of load, 20 tests are carried out. All the data acquisition and their processing are on MATLAB software by using a personal computer (PC), featuring Windows 10, a processor 17-4510U at 2.6 GHz, and 8 GB of RAM.
Figure 4 shows an example of the acquired signals. The acquisition time is of 10 s; thus, the transient and steady states can be captured. Current signals (bottom images) show clearly the changes associated to load condition. There are four load conditions: (1) no load (S0), (2) linear load (S1), (3) both linear and nonlinear loads (S2), and (4) nonlinear load (S4), where the activation/deactivation times are 2, 4, 6, and 8 s, respectively. From these time-windows, sections of 1 s are selected. This time-window contains enough information about the steady state and avoids overlaps with other load scenarios (see the red dashed rectangles in Figure 4). Once the signals are segmented, the data processing (i.e., the contrast index estimation and the classification based on a pattern recognition algorithm) is carried out.

4.2. Results

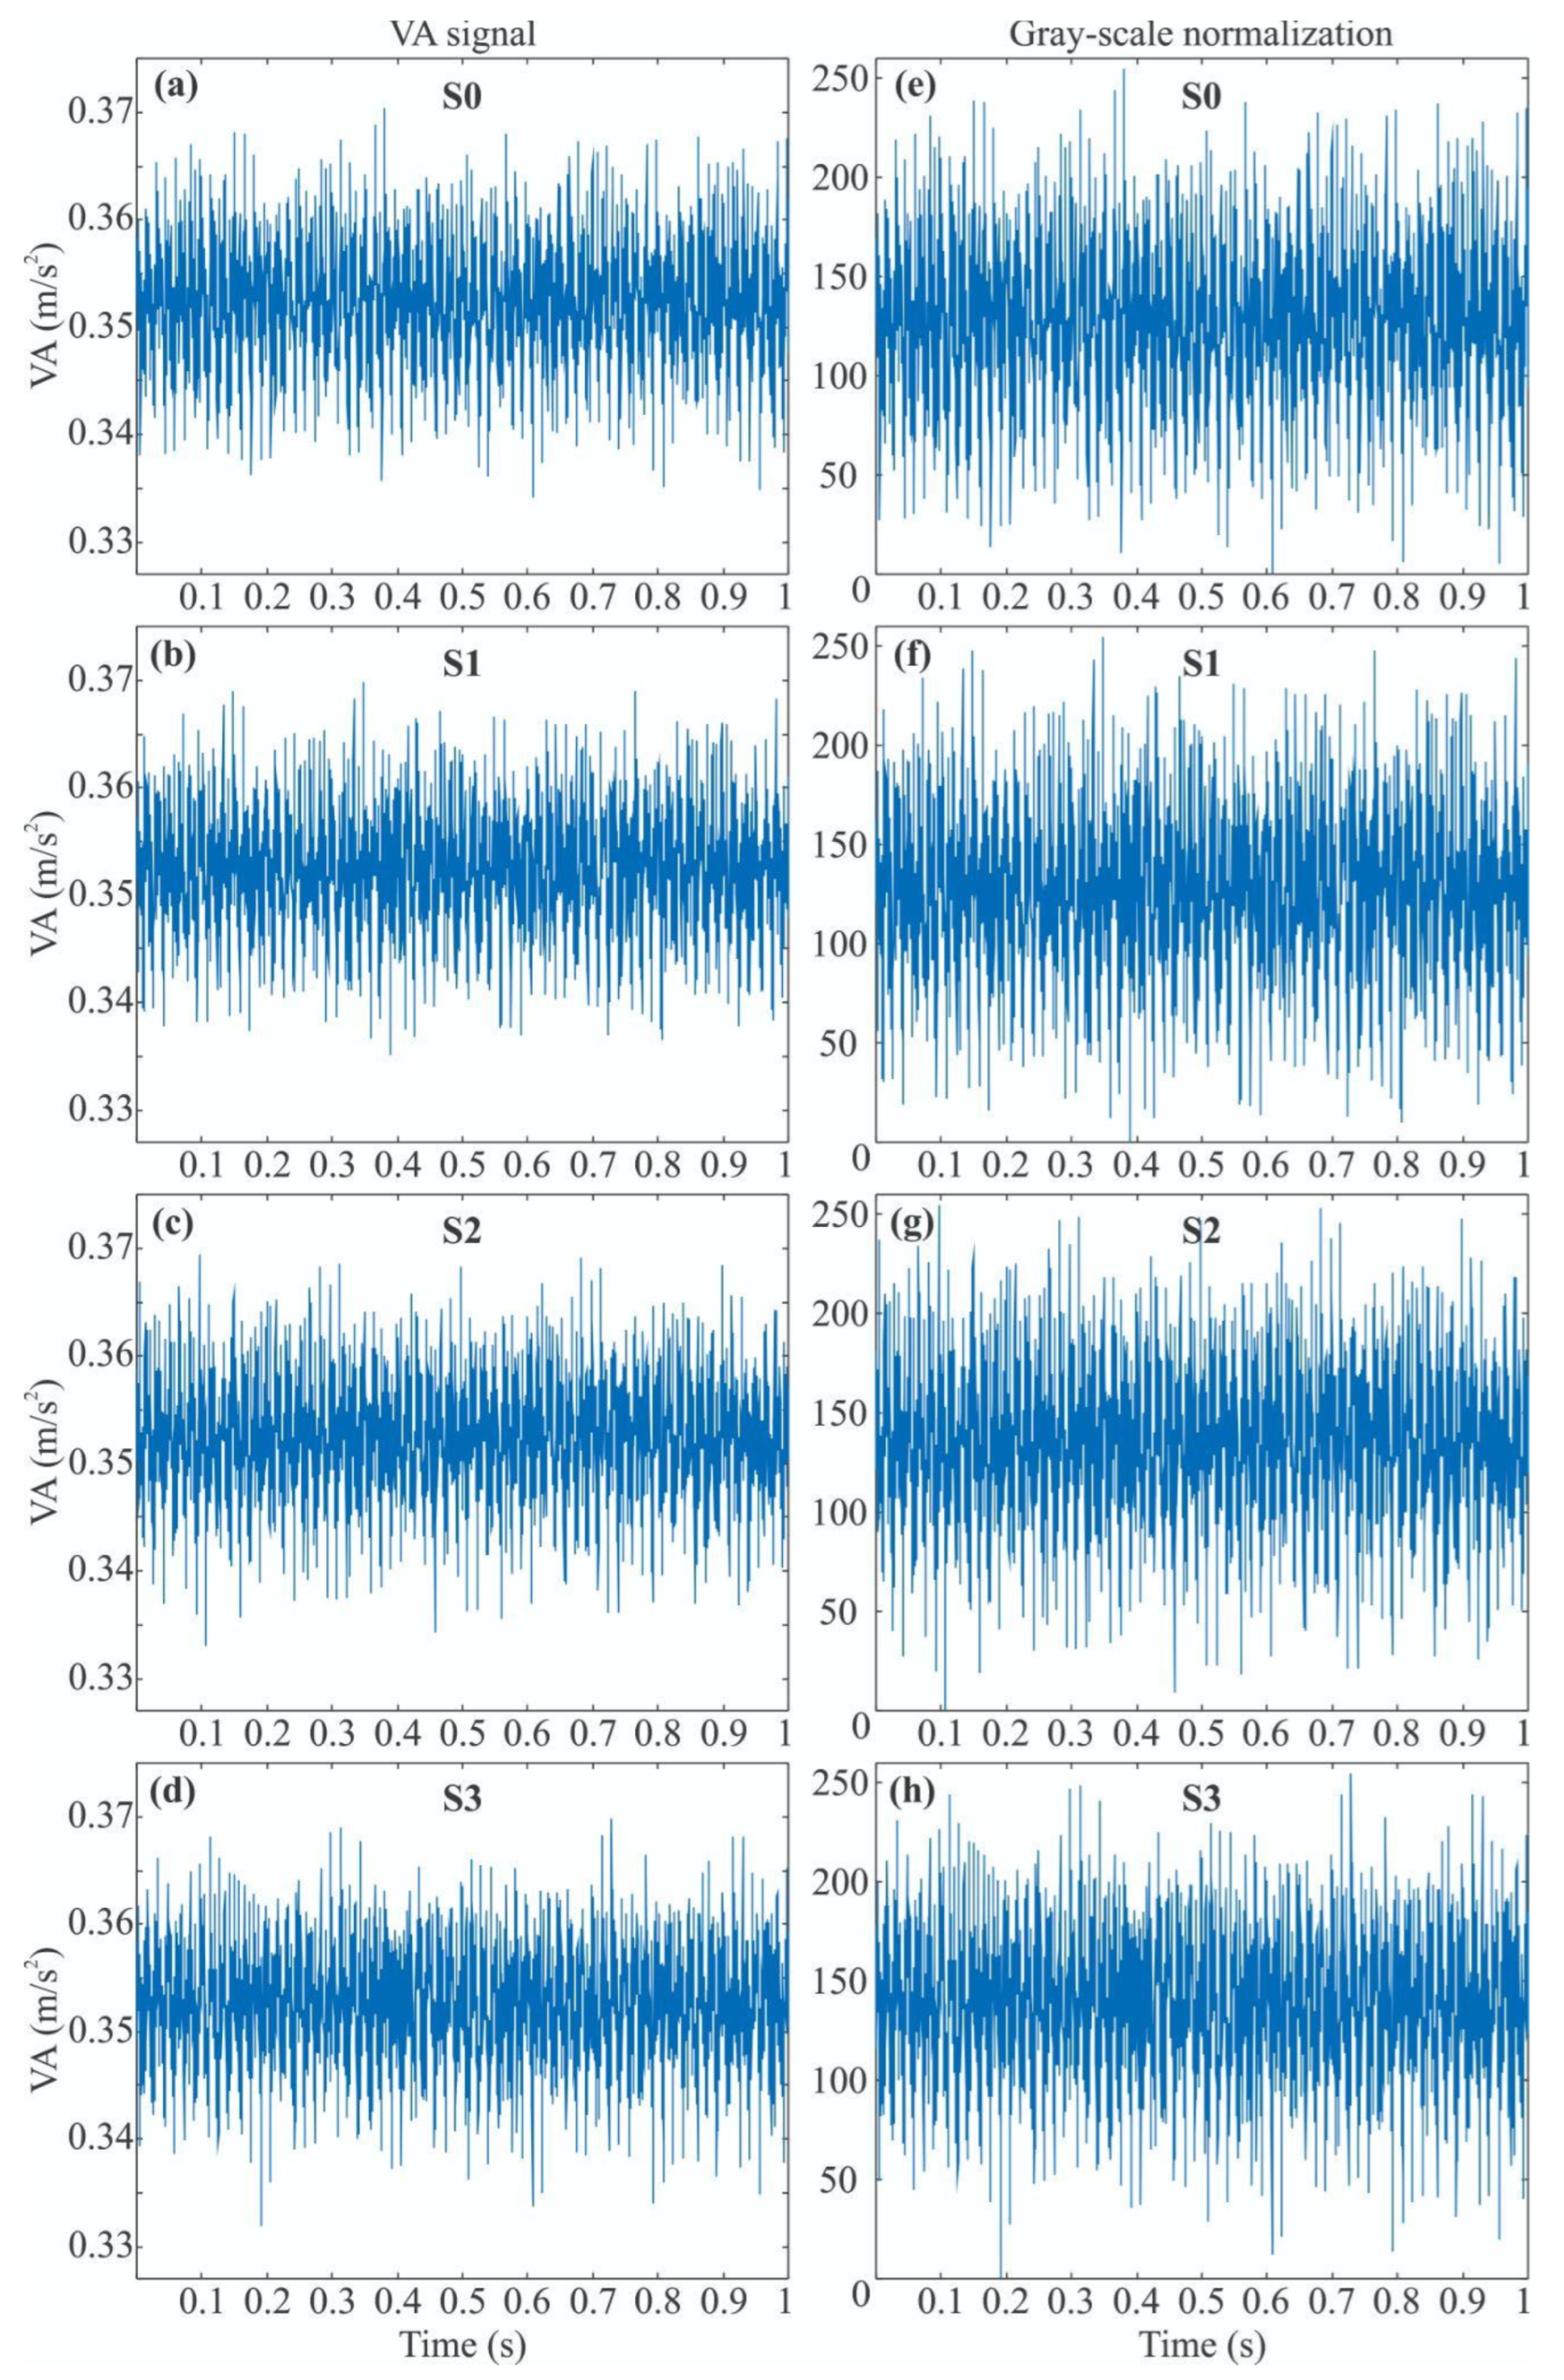
4.2.1. Gray-Scale Normalization

For the contrast estimation, the signals have to be normalized to a grayscale, i.e., to values from 0 to 255. Through this linear conversion, the minimum value of the VA signal is mapped to zero, whereas the maximum value is mapped to 255. Also, rounding down is carried out only to consider integer numbers (see Figure 5e–h). In general, this change in the VA signal values does not modify its behavior but it helps to maintain the same reference level, minimizing and generalizing the impact of different load levels.

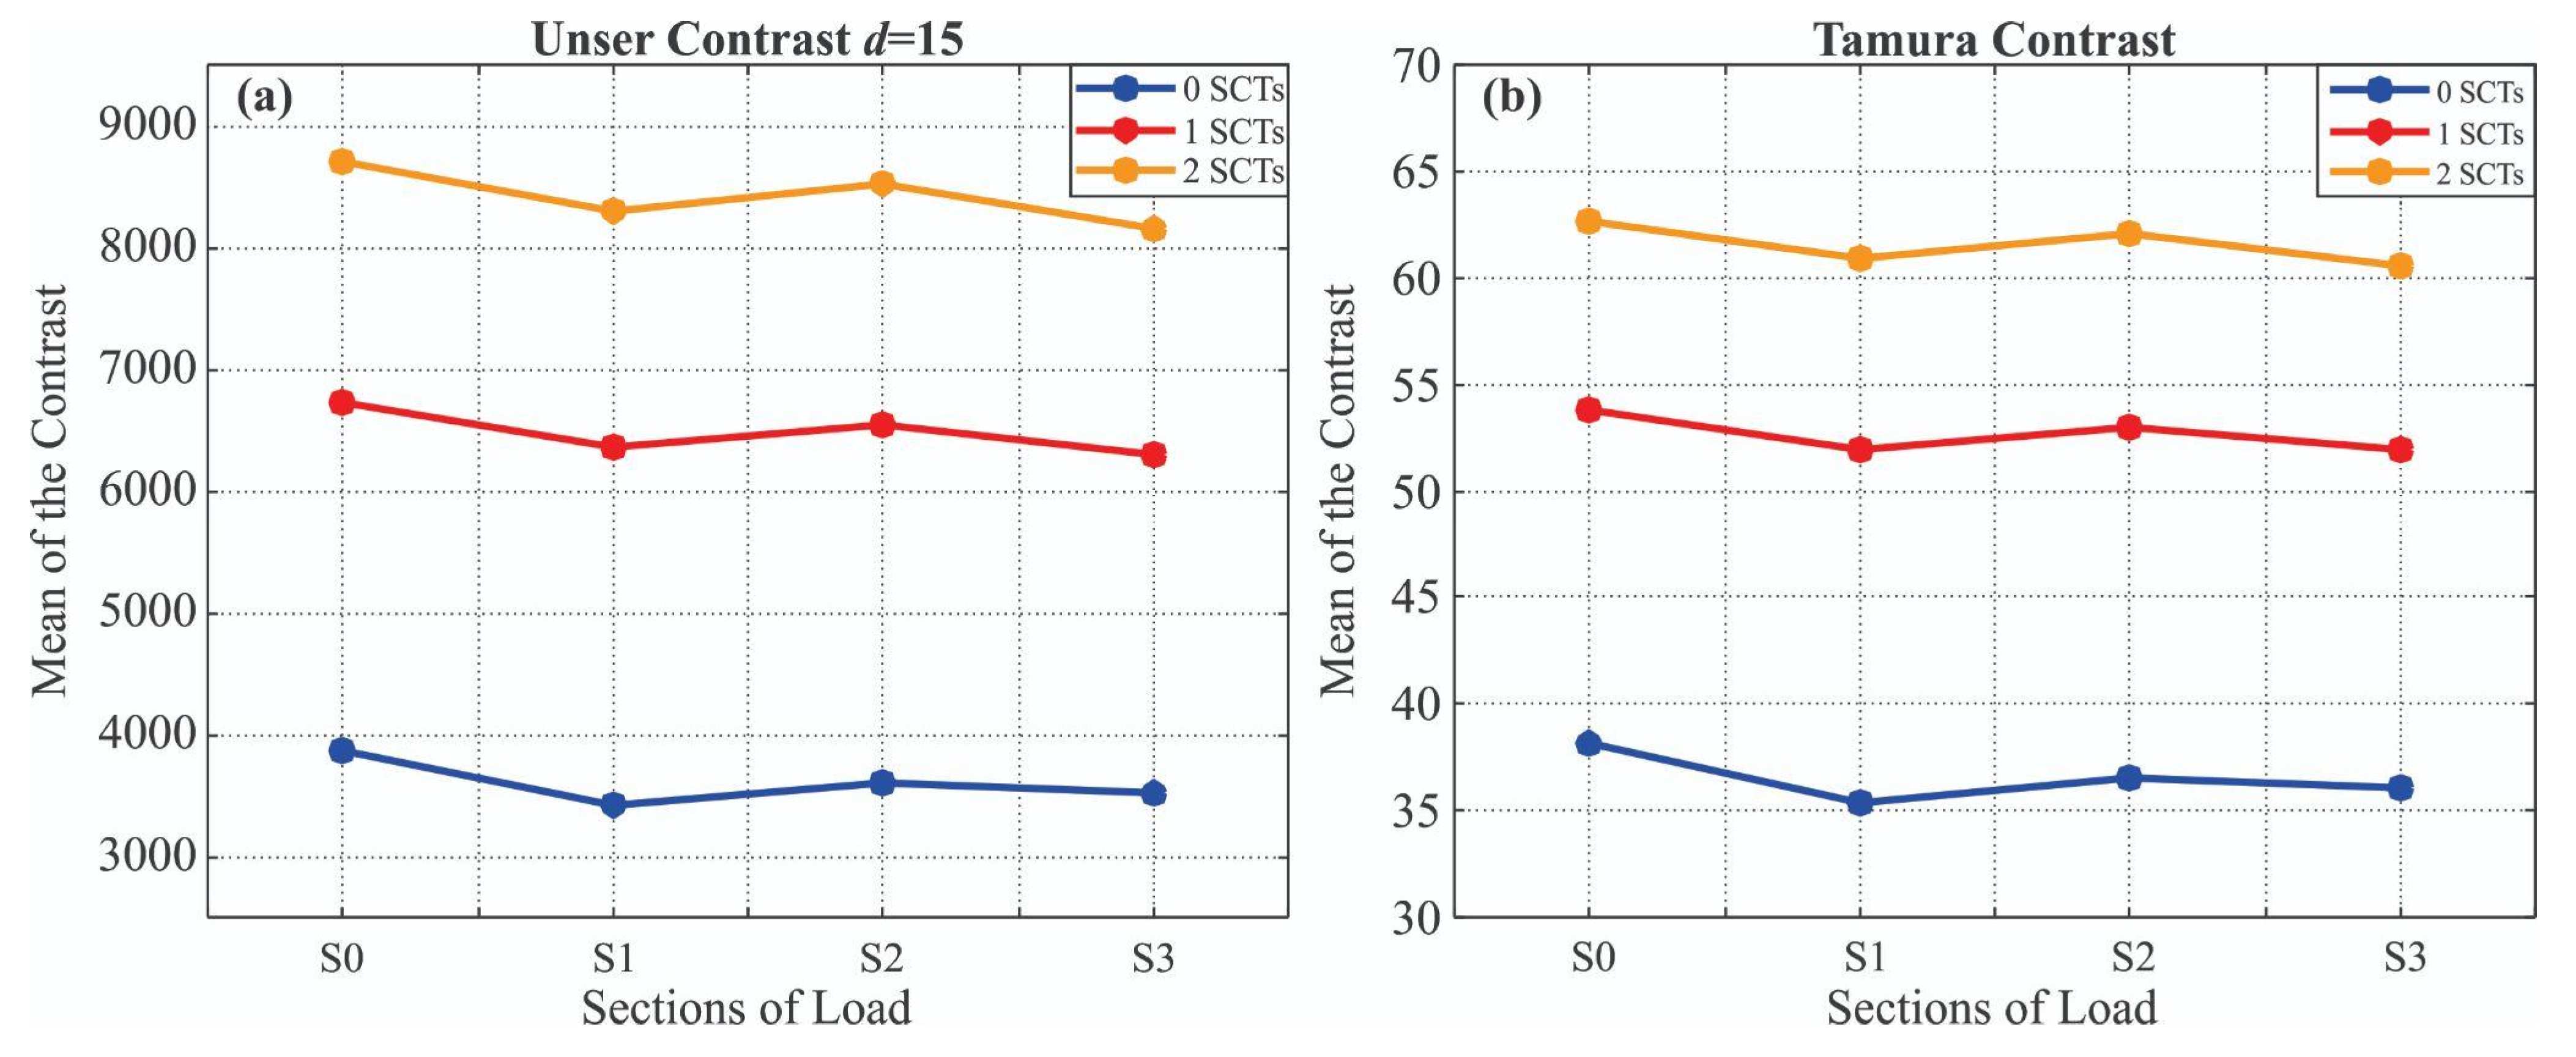
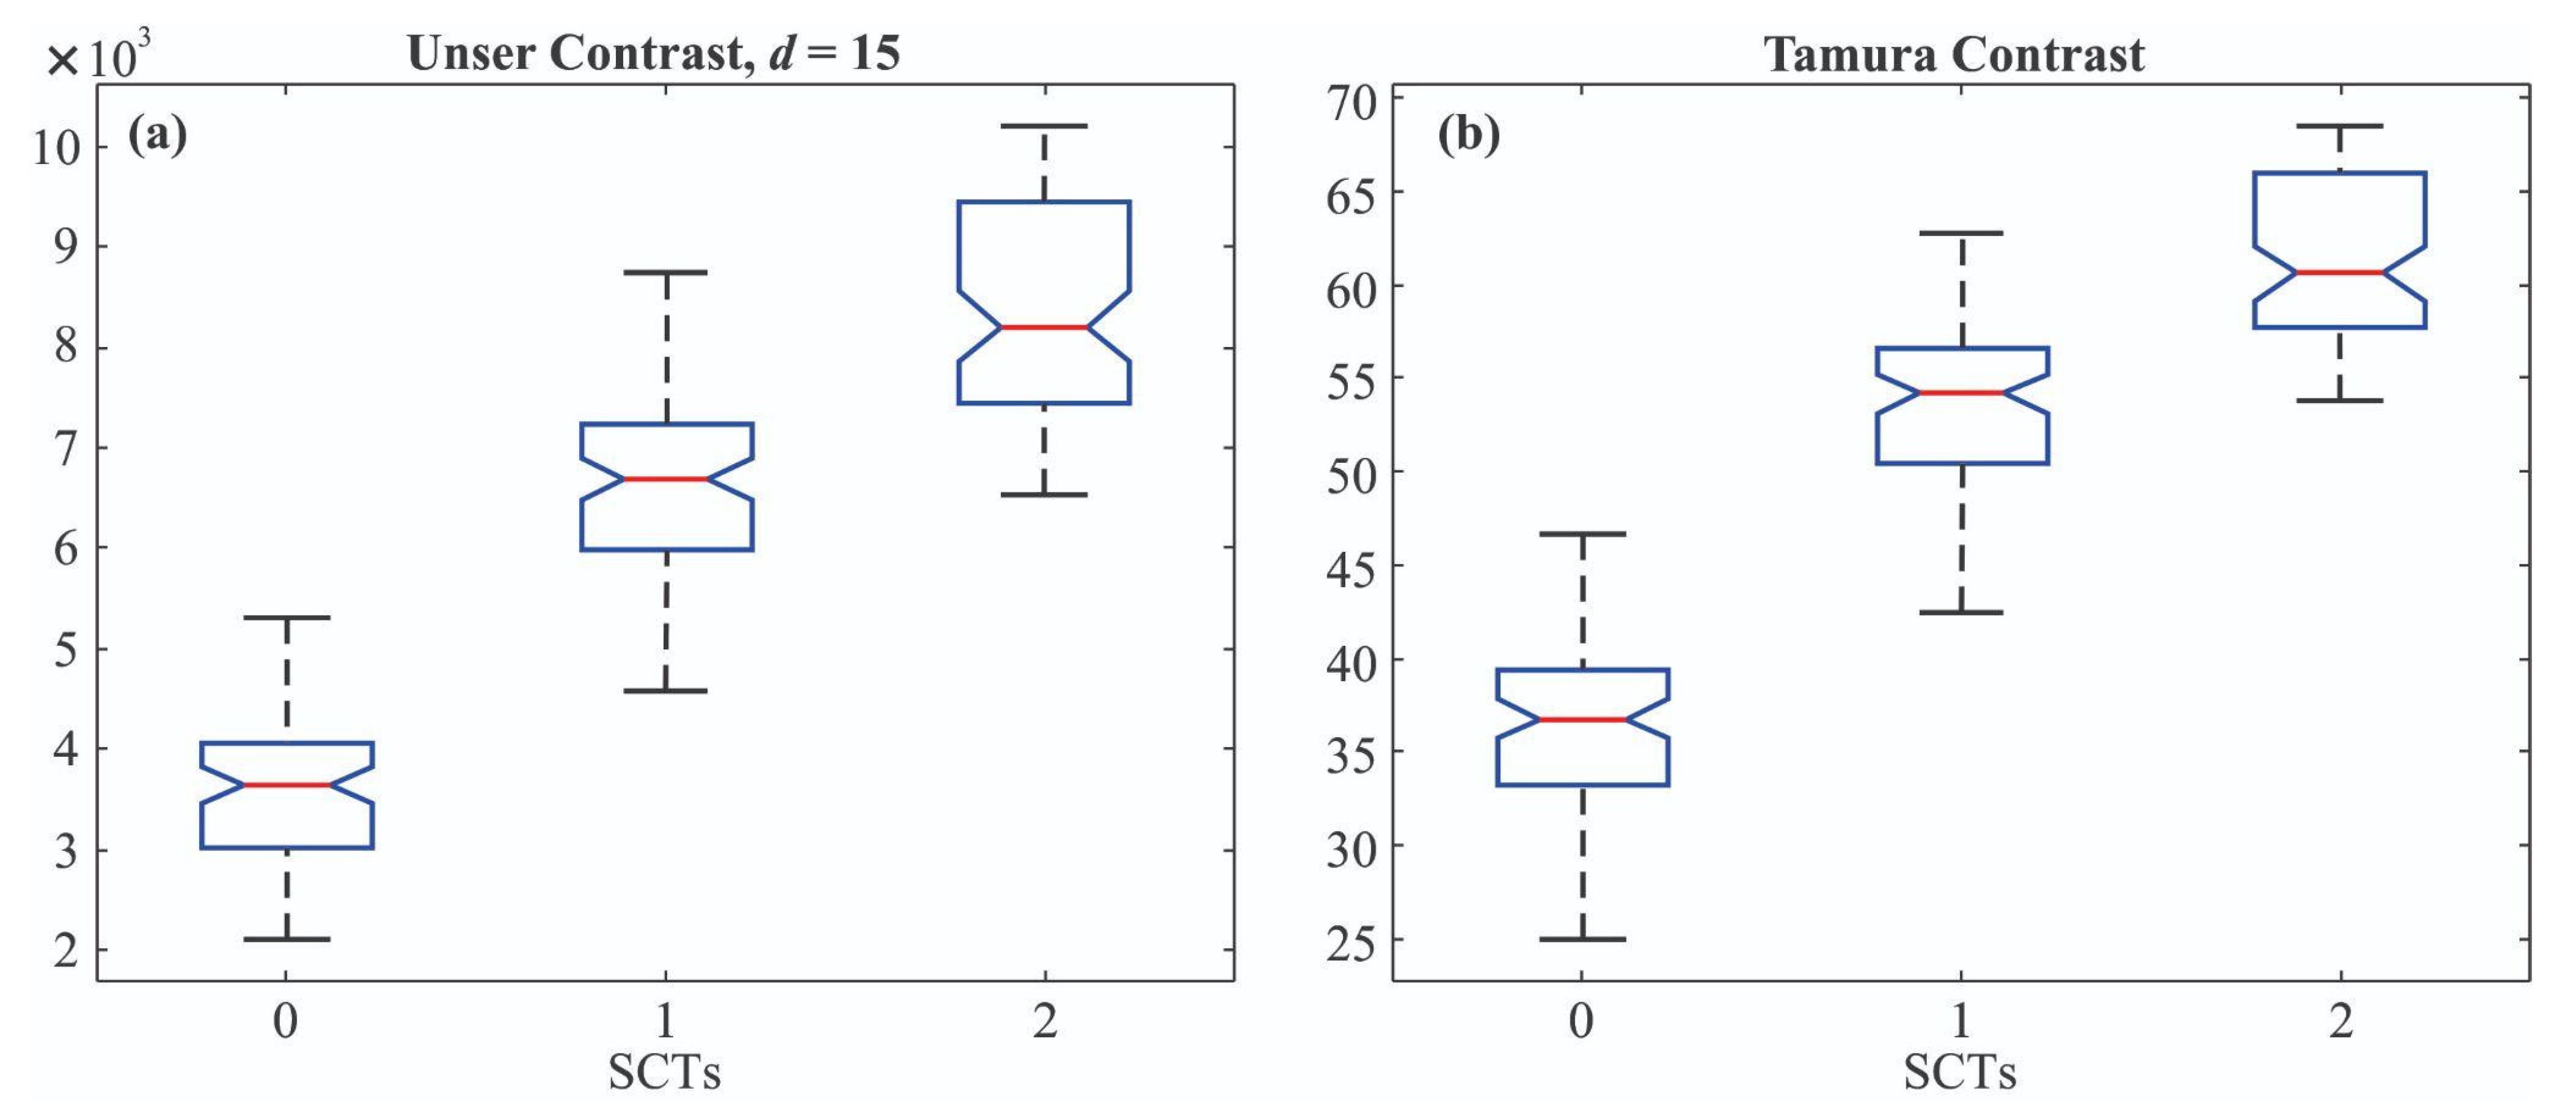
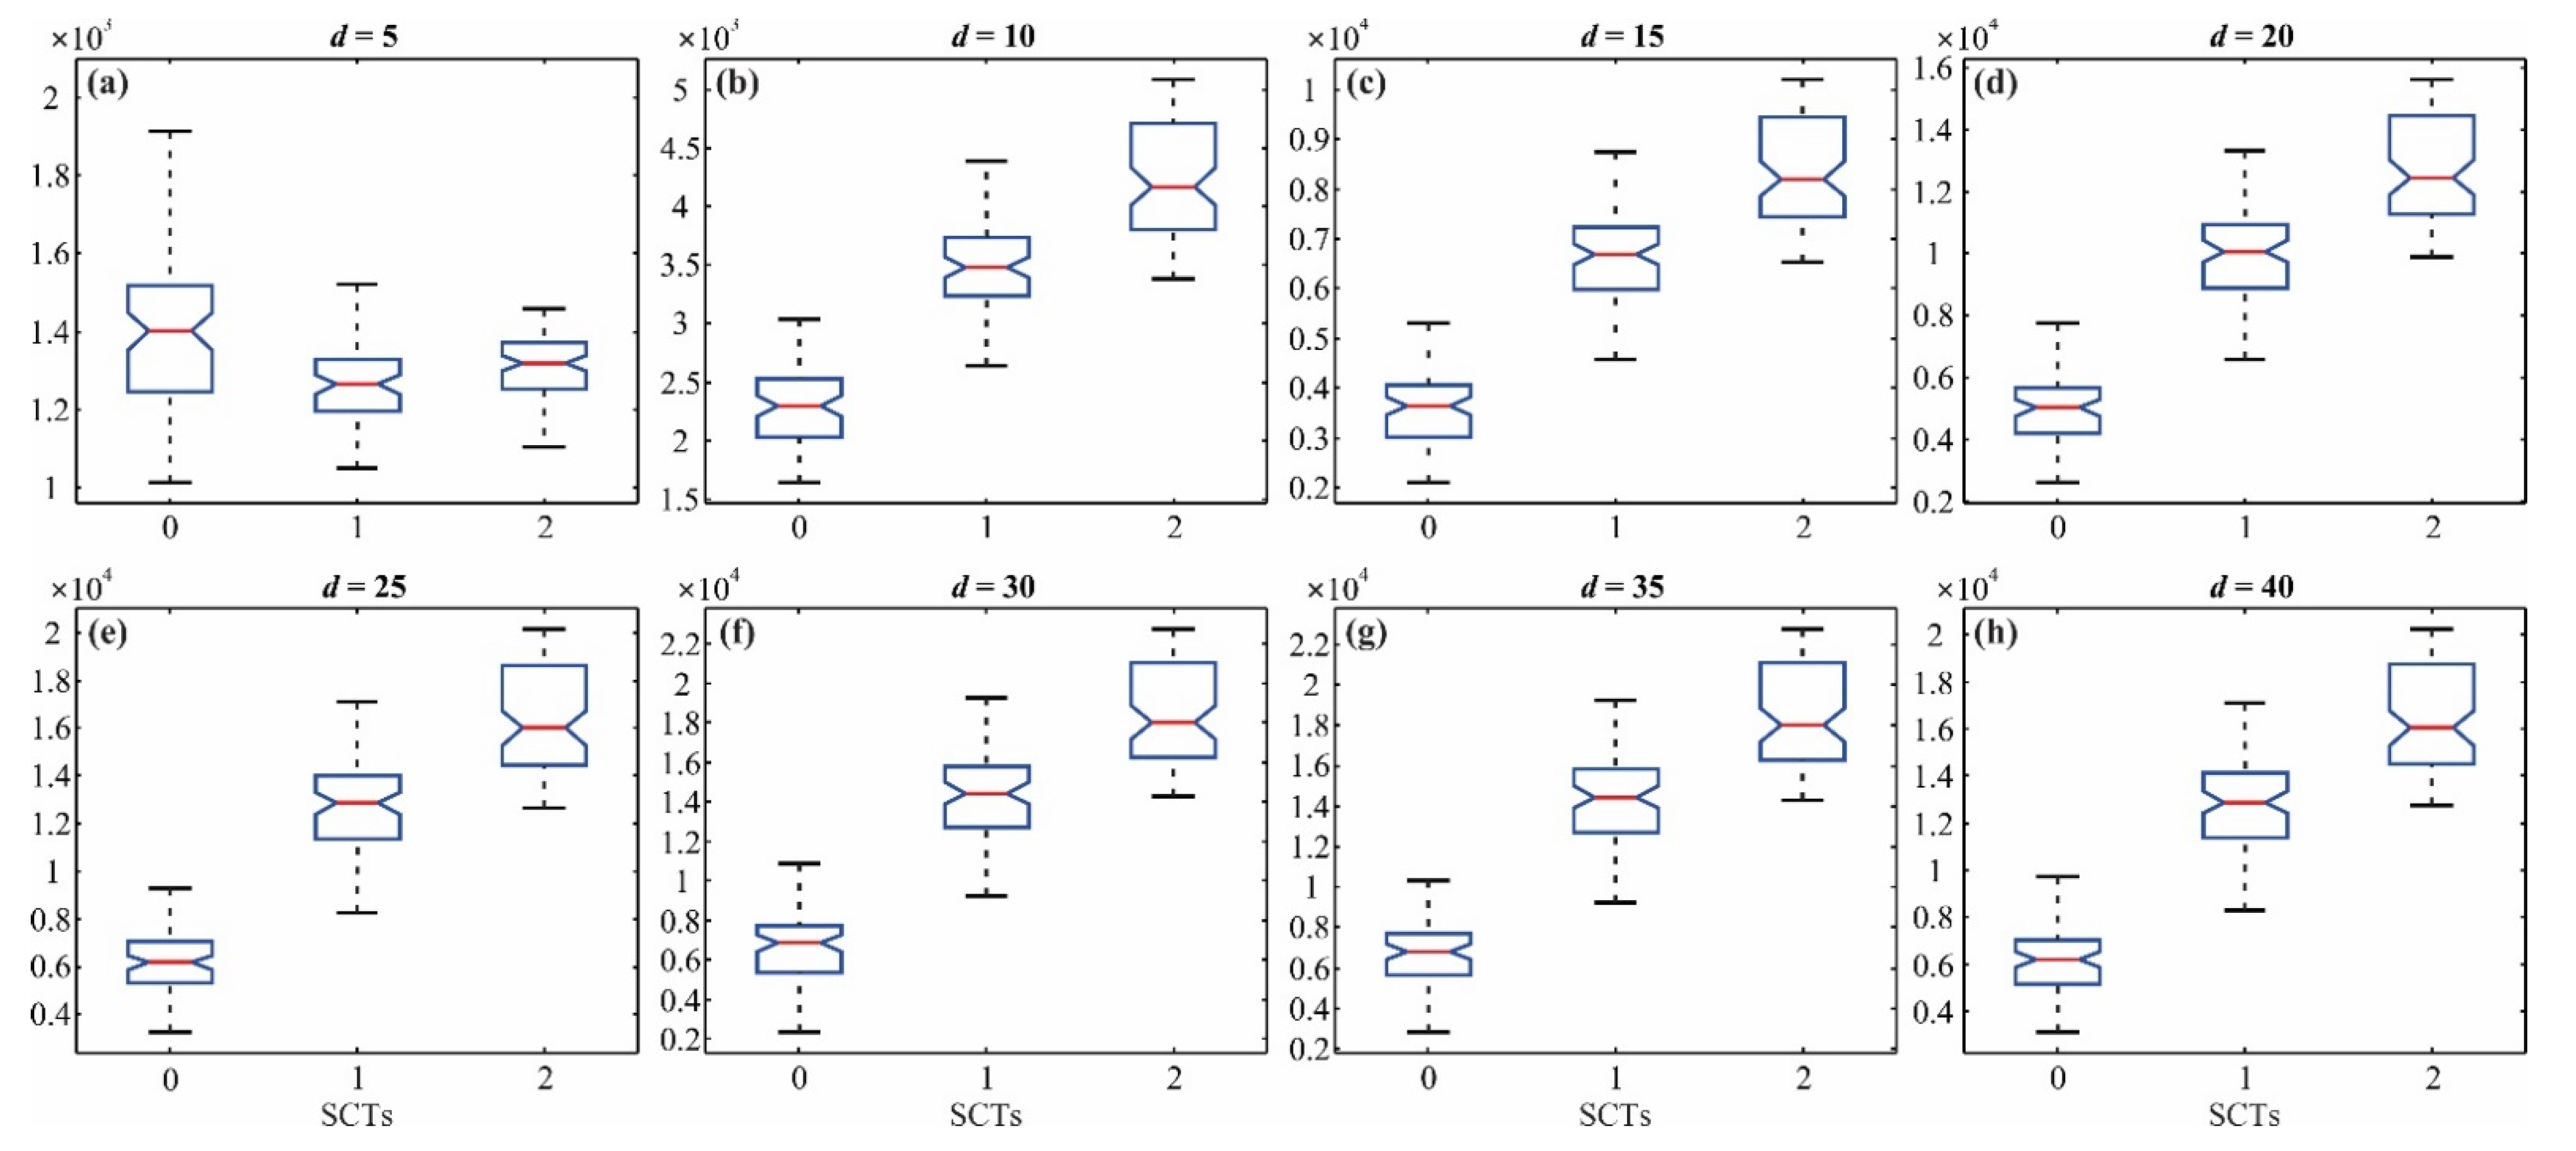
4.2.2. Unser and Tamura Contrast Estimations

Two contrast definitions, i.e., Unser and Tamura, are used with the purpose of determining which approach is the most adequate to characterize variations associated to an early SCT fault condition in VA signals from a transformer.
The Unser [31] definition uses the normalized differences histograms, i.e., Equation (7), to compute the contrast. In order to do so, a distance of separation between two data points from the VA signal, i.e., d, has to be selected. After different trial-and-error tests, a value of d = 15 is selected since it presented the best results as will be discussed at the end of this section. Table 1 and Figure 6 show the obtained results. Table 1 presents the mean (μ) and the standard deviation (σ) for the values of contrast by including the three SCT conditions (i.e., 0, 1, and 2 SCTs), the four load conditions (i.e., S0, S1, S2, and S3), and the 20 tests carried out for each condition. From the results (Table 1 or Figure 6a), it can be observed that the mean of the contrast value does not exhibit considerable variations for the different load combinations, i.e., the load does not influence the contrast index estimation.
In a similar way, the Tamura contrast index is estimated for the SCT fault conditions and their different load conditions, but with the difference that the Tamura contrast is a statistical-based calculation, i.e., Equation (9). As can be observed in both Table 1 and Figure 6, this index also presents a similar behavior for the different load combinations. Although the estimated contrast values for both Unser and Tamura indexes are not on the same scale, both graphs are quite similar, which reaffirms the low influence of the load in the contrast estimation.
As the values of the Unser contrast does not change with the load, the values for each section (load combinations: S0, S1, S2, and S3) can produce a bigger cluster of SCT conditions.
Figure 7 shows the distributions of the clusters for each SCT condition. From this figure, it is also observed that the contrast indices are sensitive to the SCT severity since their value increases when the SCT fault severity increases. In Table 2, the values of the mean (μ) and the deviation standard (σ) for these clusters are shown. All these results characterize in a numerical way the behavior of each SCT condition. It is worth noting that some conventional time features (e.g., peak factor, kurtosis, standard deviation, among others) have also been analyzed. However, although some of them present a certain degree of separation, their clusters are overlapped due to their more significant variances which are also affected by the load condition, resulting in lower classification accuracy.
Once the concept of grouping the contrast values for different load conditions (i.e., the contrast index does not change with the load as was shown in Figure 7) is described, the results for different values of d in the Unser contrast definition are shown for clarity purposes (see Figure 8).
In Figure 8, the clusters for different values of d are shown. For d = 5, the clusters do not show separation among them. The separation can be observed from d = 10, where the clusters maintain a similar separation but in a different scale (y-axis). Despite this fact, as mentioned above, the most suitable value for d is 15. This is not merely for the separation observed between the clusters but also for the accuracy obtained when the classification algorithm is applied.

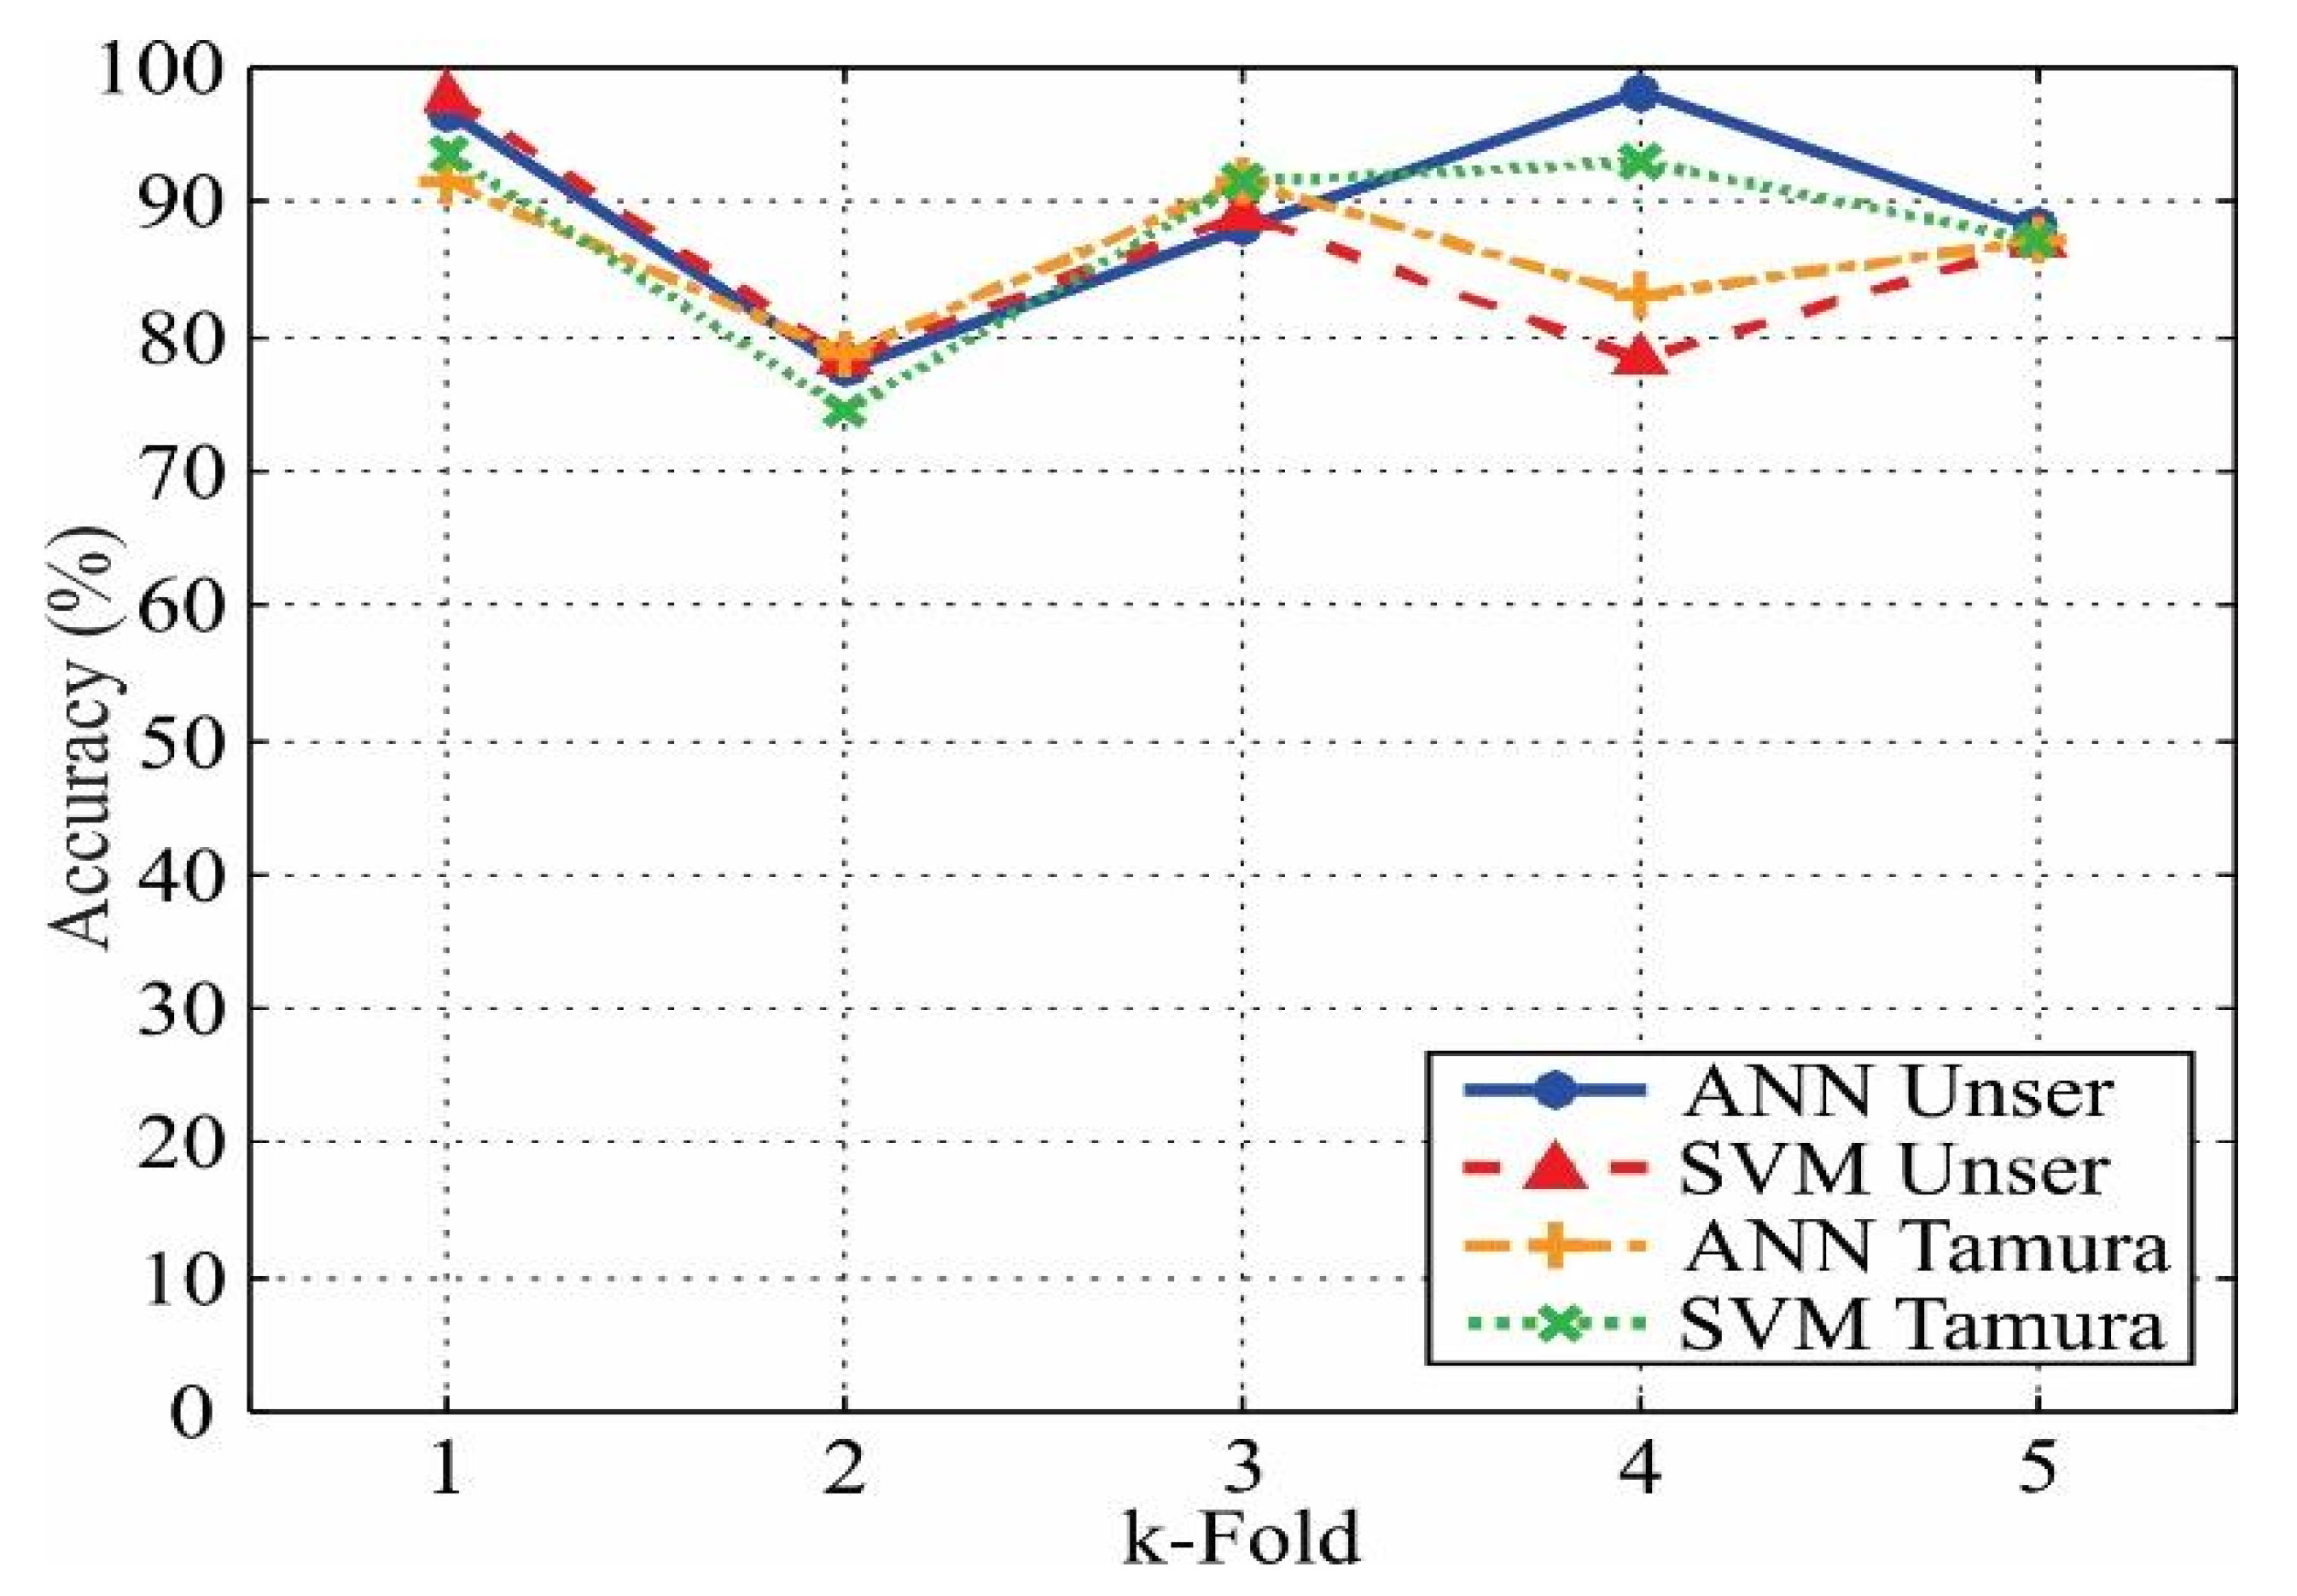
4.2.3. Classification Results

As shown in Figure 7, the contrast index is sensitive to the fault; however, there are some overlaps between the different conditions, which can produce uncertainty and, consequently, misclassification. In order to automate the diagnosis process and improve the classification accuracy, a pattern recognition algorithm is proposed. In this regard, two different classifiers, i.e., ANN and SVM, are tested to detect and classify the early SCT fault. These classifiers are applied to both contrast definitions: Unser and Tamura. The application of both classifiers helps to compare their performance, selecting the best method and obtaining the highest classification accuracy. To obtain the parameters of the classifiers that achieve more accurate results, an exhaustive analysis in a trial-and-error process is carried out, i.e., the algorithms with different parameters are applied and the parameters with the best results are selected. In addition, for both classifiers, the training and validation processes are carried out using the k-fold validation, where k is set to 5 due to the number of samples. Figure 9 shows the accuracy percentage for each k-fold iteration and Table 3 shows their mean (μ).
As can be seen in Table 3, the ANN for Unser contrast has the best performance among the classifiers, i.e., 89.78%. The parameters that provide the accuracy previously mentioned in the ANN configuration are: one neuron as input, two hidden layers with 5 and 25 neurons, respectively, and three neurons in the output layer. The activation functions are log-sigmoid for all the layers. The difference with the ANN used for the Tamura contrast is that in its first hidden layer there are ten neurons, i.e., the hidden layers are of 10 and 25 neurons. On the other hand, when a SVM classifier is employed, the parameters with the most significant influence on the classification accuracy are the kernel scale, δ, and the penalty function, C, [34]. Consequently, the resulting SVM parameters (δ, C) for the Unser contrast are 0.03 and 25, respectively. The parameter d for the Unser contrast definition also changes for the SVM, taking the value of 25. For the Tamura contrast, the SVM parameters (δ, C) are 0.4 and 35, respectively.
Table 4 shows the confusion matrix for the k-fold validation when k = 1 (see Figure 9), in which 91.7% of effectiveness is obtained. It is worth noting that 16 tests, i.e., 20%, from the 80 available tests are used for the testing. In these results, the healthy condition is clearly identified; however, the 1 and 2 SCTs conditions present two errors. These values represent for the healthy condition (0 SCTs) a recall and a specificity of 1, which is a perfect score to diagnose the healthy condition. Despite these results, the effectiveness that is considered corresponds to the average obtained during the k-fold validation, i.e., 89.78%.

5. Discussion

After designing and validating the proposal by using experimental data, two major advantages are observed: (i) its sensitivity to early SCT faults (i.e., it can react to little changes in the vibration patterns) and (ii) its robustness to the load changes (i.e., the contrast index barely changes when different load conditions appear).
Table 5 shows a comparison between the proposal and other works reported in the literature. Although in [28] an early fault condition is presented, it does not report a pattern recognition algorithm for automatic diagnosis unlike the proposed work that implements a neural network with 89.78% of effectiveness. In [20,35], different severity levels of SCT fault are analyzed; however, the impact of the load in the transformer is not taken into account, which compromises and limits their practical application. On the contrary, the proposal is tested under four load conditions: (i) no load, (ii) linear load, (iii) nonlinear load, and (iv) both linear and nonlinear loads. On the other hand, the works presented in [17,36] also demonstrate that vibration signals can provide information to detect faults in windings; however, the analysis of different fault severities and their automatic detection are not presented. Finally, from the works presented in Table 5, the proposal can be considered as the lowest complex method since the contrast index in the time domain is only required to process the VA signal.
Although promising results have been obtained, some opportunities of research still remain. For instance, in this work, the tests are carried out in a controlled environment; therefore, real operating conditions such as load intermittences, power quality issues, vibrations generated by other faults, and vibrations from external sources, among others, can negatively affect the performance of the proposal. In this regard, the obtained results can be considered as preliminary.

6. Conclusions

This paper presents a methodology for detecting and classifying the transformer condition under different early SCT fault conditions (i.e., 1 and 2 SCTs) from its VA signals. To develop, validate, and test the methodology, a transformer capable of emulating the conditions previously mentioned is used, where different load conditions (no load, linear load, nonlinear load, and both loads) are considered to represent a more realistic scenario and open the possibility to offer an online fault detection method.
In this regard, the main findings are:
  • The proposed method can diagnose early SCT fault conditions, i.e., 0, 1, and 2 SCTs. Detection of early SCT faults helps to increase the transformer life, reduce the breakdown maintenance, and avoid possible catastrophic failures.
  • One image processing feature used for the texture analysis, i.e., the contrast, allows characterizing the variations in a VA signal to detect early SCTs in a transformer.
  • Two contrast definitions, i.e., Unser and Tamura, are tested, where the Unser definition with d = 15 demonstrated to provide the best results.
  • The contrast measure is unaffected by the different load combinations connected to the transformer, when early SCTs are present.
  • The classification effectiveness from both the Unser contrast definition and the ANN as classifier (i.e., 89.78%) is higher than the one obtained by the SVM (i.e., 86.1%). The Tamura contrast definition with an ANN obtained 86.38% of effectiveness and with a SVM 85.96% of effectiveness.
Forthcoming work will focus on employing the methodology to diagnose three-phase transformers under different operation conditions, e.g., under unbalance and harmonic content in the power supply, including different types of loads and other faults such as core faults, partial discharges, and winding loosening, among others. In addition, the combination of other signal preprocessing techniques, statistical time features, and pattern recognition algorithms, as well as the fusion of sensors, i.e., the information provided by different types of signals, e.g., current and voltage signals, to improve the fault detection and classification accuracy will be also explored.

Author Contributions

Conceptualization, J.R.H.-R. and M.V.-R.; methodology and software, J.R.H.-R. and M.V.-R.; investigation, validation, and formal analysis, all authors; data curation, J.R.H.-R., D.G.-L. and M.B.-L.; writing—original draft preparation, J.R.H.-R. and M.V.-R.; writing—review and editing, all authors; visualization, A.G.-P. and M.V.-R.; supervision, D.G.-L., J.P.A.-S. and M.V.-R.; project administration, D.G.-L., M.B.-L. and M.V.-R.; resources, funding acquisition, A.G.-P., J.P.A.-S., M.B.-L. and M.V.-R. All authors have read and agreed to the published version of the manuscript.

Funding

This research received no external funding.

Data Availability Statement

The data presented in this study are not publicly available due to privacy issues.

Acknowledgments

This work was partially supported by the Mexican Council of Science and Technology (CONACyT) by the scholarship 734987.

Conflicts of Interest

The authors declare no conflict of interest.

References

  1. Kudelina, K.; Asad, B.; Vaimann, T.; Rassõlkin, A.; Kallaste, A.; Van Khang, H. Methods of Condition Monitoring and Fault Detection for Electrical Machines. Energies 2021, 14, 7459. [Google Scholar] [CrossRef]
  2. Huerta-Rosales, J.R.; Granados-Lieberman, D.; Amezquita-Sanchez, J.P.; Camarena-Martinez, D.; Valtierra-Rodriguez, M. Vibration Signal Processing-Based Detection of Short-Circuited Turns in Transformers: A Nonlinear Mode Decomposition Approach. Mathematics 2020, 8, 575. [Google Scholar] [CrossRef]
  3. Secic, A.; Krpan, M.; Kuzle, I. Vibro-Acoustic Methods in the Condition Assessment of Power Transformers: A Survey. IEEE Access 2019, 7, 83915–83931. [Google Scholar] [CrossRef]
  4. Zhao, Z.; Tang, C.; Chen, Y.; Zhou, Q.; Yao, C.; Islam, S. Interpretation of Transformer Winding Deformation Fault by the Spectral Clustering of FRA Signature. Int. J. Electr. Power Energy Syst. 2021, 130, 106933. [Google Scholar] [CrossRef]
  5. Granados-Lieberman, D.; Razo-Hernandez, J.R.; Venegas-Rebollar, V.; Olivares-Galvan, J.C.; Valtierra-Rodriguez, M. Harmonic PMU and Fuzzy Logic for Online Detection of Short-Circuited Turns in Transformers. Electr. Power Syst. Res. 2021, 190, 106862. [Google Scholar] [CrossRef]
  6. Hu, Y.; Zheng, J.; Huang, H. Experimental Research on Power Transformer Vibration Distribution under Different Winding Defect Conditions. Electronics 2019, 8, 842. [Google Scholar] [CrossRef] [Green Version]
  7. Zheng, J.; Huang, H.; Pan, J. Detection of Winding Faults Based on a Characterization of the Nonlinear Dynamics of Transformers. IEEE Trans. Instrum. Meas. 2018, 68, 206–214. [Google Scholar] [CrossRef]
  8. Kim, M.; Lee, S. Power Transformer Voltages Classification with Acoustic Signal in Various Noisy Environments. Sensors 2022, 22, 1248. [Google Scholar] [CrossRef]
  9. Zhou, Y.; Wang, B. Acoustic Multi-Parameter Early Warning Method for Transformer DC Bias State. Sensors 2022, 22, 2906. [Google Scholar] [CrossRef]
  10. Contreras-Valdes, A.; Amezquita-Sanchez, J.P.; Granados-Lieberman, D.; Valtierra-Rodriguez, M. Predictive Data Mining Techniques for Fault Diagnosis of Electric Equipment: A Review. Appl. Sci. 2020, 10, 950. [Google Scholar] [CrossRef]
  11. Bartoletti, C.; Desiderio, M.; Di Carlo, D.; Fazio, G.; Muzi, F.; Sacerdoti, G.; Salvatori, F. Vibro-Acoustic Techniques to Diagnose Power Transformers. IEEE Trans. Power Deliv. 2004, 19, 221–229. [Google Scholar] [CrossRef]
  12. Romero-Troncoso, R.D.J. Multirate Signal Processing to Improve FFT-Based Analysis for Detecting Faults in Induction Motors. IEEE Trans. Ind. Inform. 2017, 13, 1291–1300. [Google Scholar] [CrossRef]
  13. Borucki, S.; Cichoń, A.; Majchrzak, H.; Zmarzły, D. Evaluation of the Technical Condition of the Active Part of the High Power Transformer Based on Measurements and Analysis of Vibroacoustic Signals. Arch. Acoust. 2017, 42, 313–320. [Google Scholar] [CrossRef]
  14. Valtierra-Rodriguez, M.; Rivera-Guillen, J.R.; Basurto-Hurtado, J.A.; Jesus De-Santiago-Perez, J.; Granados-Lieberman, D.; Amezquita-Sanchez, J.P. Convolutional Neural Network and Motor Current Signature Analysis during the Transient State for Detection of Broken Rotor Bars in Induction Motors. Sensors 2020, 20, 3721. [Google Scholar] [CrossRef]
  15. Goyal, D.; Pabla, B.S. The Vibration Monitoring Methods and Signal Processing Techniques for Structural Health Monitoring: A Review. Arch. Comput. Methods Eng. 2016, 23, 585–594. [Google Scholar] [CrossRef]
  16. Borucki, S.; Cichon, A. Wavelet Analysis of Vibroacoustic Signals Registered during the Transformer Start-Up. In Proceedings of the IEEE 2012 International Conference on High Voltage Engineering and Application, Shanghai, China, 17–20 September 2012; pp. 579–582. [Google Scholar]
  17. Zhao, M.; Xu, G. Feature Extraction of Power Transformer Vibration Signals Based on Empirical Wavelet Transform and Multiscale Entropy. IET Sci. Meas. Technol. 2018, 12, 63–71. [Google Scholar] [CrossRef]
  18. Wu, X.; Li, L.; Zhou, N.; Lu, L.; Hu, S.; Cao, H.; He, Z. Diagnosis of DC Bias in Power Transformers Using Vibration Feature Extraction and a Pattern Recognition Method. Energies 2018, 11, 1775. [Google Scholar] [CrossRef] [Green Version]
  19. Amezquita-Sanchez, J.P.; Adeli, H. A New Music-Empirical Wavelet Transform Methodology for Time-Frequency Analysis of Noisy Nonlinear and Non-Stationary Signals. Digit. Signal Process. A Rev. J. 2015, 45, 55–68. [Google Scholar] [CrossRef]
  20. Valtierra-Rodriguez, M. Fractal Dimension and Data Mining for Detection of Short-Circuited Turns in Transformers from Vibration Signals. Meas. Sci. Technol. 2020, 31, 025902. [Google Scholar] [CrossRef]
  21. Huerta-Rosales, J.R.; Granados-Lieberman, D.; Garcia-Perez, A.; Camarena-Martinez, D.; Amezquita-Sanchez, J.P.; Valtierra-Rodriguez, M. Short-Circuited Turn Fault Diagnosis in Transformers by Using Vibration Signals, Statistical Time Features, and Support Vector Machines on Fpga. Sensors 2021, 21, 3958. [Google Scholar] [CrossRef]
  22. Zhang, Z.; Wu, Y.; Zhang, R.; Jiang, P.; Liu, G.; Ahmed, S.; Dong, Z. Novel Transformer Fault Identification Optimization Method Based on Mathematical Statistics. Mathematics 2019, 7, 288. [Google Scholar] [CrossRef] [Green Version]
  23. Chen, J.; Yu, W.; Tian, J.; Chen, L.; Zhou, Z. Image Contrast Enhancement Using an Artificial Bee Colony Algorithm. Swarm Evol. Comput. 2018, 38, 287–294. [Google Scholar] [CrossRef]
  24. Cai, J.; Gu, S.; Zhang, L. Learning a Deep Single Image Contrast Enhancer from Multi-Exposure Images. IEEE Trans. Image Process. 2018, 27, 2049–2062. [Google Scholar] [CrossRef]
  25. Ferrucho-Alvarez, E.R.; Martinez-Herrera, A.L.; Cabal-Yepez, E.; Rodriguez-Donate, C.; Lopez-Ramirez, M.; Mata-Chavez, R.I. Broken Rotor Bar Detection in Induction Motors through Contrast Estimation. Sensors 2021, 21, 7446. [Google Scholar] [CrossRef]
  26. Wu, Y.; Zhang, Z.; Xiao, R.; Jiang, P.; Dong, Z.; Deng, J. Operation State Identification Method for Converter Transformers Based on Vibration Detection Technology and Deep Belief Network Optimization Algorithm. Actuators 2021, 10, 56. [Google Scholar] [CrossRef]
  27. Zhang, F.; Ji, S.; Shi, Y.; Zhan, C.; Zhu, L. Investigation on Vibration Source and Transmission Characteristics in Power Transformers. Appl. Acoust. 2019, 151, 99–112. [Google Scholar] [CrossRef]
  28. Bagheri, M.; Nezhivenko, S.; Naderi, M.S.; Zollanvari, A. A New Vibration Analysis Approach for Transformer Fault Prognosis over Cloud Environment. Int. J. Electr. Power Energy Syst. 2018, 100, 104–116. [Google Scholar] [CrossRef]
  29. García, B.; Burgos, J.C.; Alonso, Á.M. Transformer Tank Vibration Modeling as a Method of Detecting Winding Deformations—Part I: Theoretical Foundation. IEEE Trans. Power Deliv. 2006, 21, 157–163. [Google Scholar] [CrossRef]
  30. Haralick, R.M.; Shanmugam, K.; Dinstein, I. Textural Features for Image Classification. IEEE Trans. Syst. Man. Cybern. 1973, SMC-3, 610–621. [Google Scholar] [CrossRef] [Green Version]
  31. Unser, M. Sum and Difference Histograms for Texture Classification. IEEE Trans. Pattern Anal. Mach. Intell. 1986, PAMI-8, 118–125. [Google Scholar] [CrossRef]
  32. Tamura, H.; Mori, S.; Yamawaki, T. Textural Features Corresponding to Visual Perception. IEEE Trans. Syst. Man. Cybern. 1978, 8, 460–473. [Google Scholar] [CrossRef]
  33. Amezquita-Sanchez, J.P.; Valtierra-Rodriguez, M.; Camarena-Martinez, D.; Granados-Lieberman, D.; Romero-Troncoso, R.J.; Dominguez-Gonzalez, A. Fractal Dimension-Based Approach for Detection of Multiple Combined Faults on Induction Motors. J. Vib. Control 2016, 22, 3638–3648. [Google Scholar] [CrossRef]
  34. Yang, Z.; Zhou, Q.; Wu, X.; Zhao, Z. A Novel Measuring Method of Interfacial Tension of Transformer Oil Combined PSO Optimized SVM and Multi Frequency Ultrasonic Technology. IEEE Access 2019, 7, 182624–182631. [Google Scholar] [CrossRef]
  35. Mejia-Barron, A.; Valtierra-Rodriguez, M.; Granados-Lieberman, D.; Olivares-Galvan, J.C.; Escarela-Perez, R. The Application of EMD-Based Methods for Diagnosis of Winding Faults in a Transformer Using Transient and Steady State Currents. Meas. J. Int. Meas. Confed. 2018, 117, 371–379. [Google Scholar] [CrossRef]
  36. Borucki, S. Diagnosis of Technical Condition of Power Transformers Based on the Analysis of Vibroacoustic Signals Measured in Transient Operating Conditions. IEEE Trans. Power Deliv. 2012, 27, 670–676. [Google Scholar] [CrossRef]
Figure 1. ANN architecture: (a) ANN with hidden layers and (b) a single neuron.
Energies 15 08508 g001
Figure 2. Flowchart for the proposed methodology.
Energies 15 08508 g002
Figure 3. Experimental setup.
Energies 15 08508 g003
Figure 4. Signals acquired from the transformer: VA signals for: (a) 0 SCTs, (b) 1 SCTs, and (c) 2 SCTs.
Energies 15 08508 g004
Figure 5. Example of a VA acquired signal and its gray-scale normalization: (a) section S0, (b) section S1, (c) section S2, (d) section S3, and gray-scale normalization for sections (e) S0, (f) S1, (g) S2, and (h) S3.
Energies 15 08508 g005
Figure 6. Mean (μ) of the contrast values for different loads: (a) Unser contrast with d = 15 and (b) Tamura contrast.
Energies 15 08508 g006
Figure 7. Data distributions of the contrast values for the VA signals with different SCT fault conditions: (a) Unser contrast and (b) Tamura contrast.
Energies 15 08508 g007
Figure 8. Unser contrast clusters for different values of d: (a) d = 5, (b) d = 10, (c) d = 15; (d) d = 20, (e) d = 25, (f) d = 30, (g) d = 35, and (h) d = 40.
Energies 15 08508 g008
Figure 9. Accuracy results for the ANN and SVM methods during the k-fold validation.
Energies 15 08508 g009
Table 1. Mean (μ) and standard deviation (σ) for the contrast values, different load combinations, and different SCT fault conditions.
Unser Contrast, d = 15Tamura Contrast
S0S1S2S3S0S1S2S3
0 SCTsμ3862.54133426.71463597.48123511.674638.123135.404436.559036.0443
σ683.7739690.3487652.7069848.01764.65034.68494.49675.4222
1 SCTsμ6732.23936363.55086543.86236294.797253.810251.903053.009651.8991
σ1441.47421220.75901301.99521195.62567.57806.69166.99906.5757
2 SCTsμ8699.98848304.69758529.36588147.165562.658960.893362.108660.5648
σ1084.00151022.16351049.81291016.29674.34834.17684.29304.2054
Table 2. Mean (μ) and standard deviation (σ) for the different contrast distributions of the different SCT fault conditions.
Unser Contrast, d = 15Tamura Contrast
0 SCTs1 SCTs2 SCTs0 SCTs1 SCTs2 SCTs
μ3599.60296483.61248420.304336.532752.655561.5564
σ740.9540130.63831064.53404.93047.01834.3420
Table 3. Accuracy percentage mean (μ) for the ANN and SVM classifiers by considering different contrast estimation methods.
Unser with d = 15Tamura
ANN (%)89.7886.38
SVM (%)86.185.96
Table 4. Confusion matrix for SCTs classification.
SCTs012
01600
10142
20214
Accuracy100%87.5%87.5%Average = 91.7%
Table 5. Comparison of the proposed work and other methods.
WorkMethodSignalFault Detected in WindingsEarly Detection/Severities (SCTs)Load ConditionsAutomatic Classification
Proposed WorkContrast indexVibrationsSCTsYes
1, 2
4ANN
[17]Empirical Wavelet transform, HT, and entropiesVibrationsWinding deformationNo--
[20]Fractal algorithms, ANOVA, Data miningVibrationsSCTsNo
5, 10, …, 35
No loadDecision trees, Naïve Bayes, k-nearest neighbor
[28]FFT and total harmonic distortionVibrationsSCTsYes
Initiation
1-
[35]Complete ensemble empirical mode decomposition, Shannon entropy, RMS, and energy indexCurrentSCTsNo
5, 10, …, 40
--
[36]Short time Fourier transform and RMSVibrationsWinding looseningNo1-
- Not mentioned.
Publisher’s Note: MDPI stays neutral with regard to jurisdictional claims in published maps and institutional affiliations.

