1. Introduction
Since the establishment of Directive 2002/91/EC on the energy performance of buildings in 2002, the process of renewing European building stock has begun. Recently, the European Union has promoted the “Green Deal”, a new overall strategy that targets a fair and inclusive society and modern, resource-efficient, and competitive economy capable of guaranteeing climate neutrality by 2050.
In order to achieve the objectives of the “Green Deal”, in 2021, the EU presented the legislative package “Fit for 55%”, which aims to review and update existing legislation on climate, energy, and transport and introduces new initiatives to align with the renewed climate objectives which raise the target for reducing greenhouse gas emissions by 2030 from 40% to 55%.
The European building stock has been the subject of attention since the beginning of this energy improvement process for its high impact on global energy consumption and greenhouse gas emissions. For enhancing energy performance, the renovation of existing buildings should usually consider the technical system’s improvement, preceded by the reduction of thermal losses of the building envelope when possible. Thermal insulation of walls should be considered firstly through acting on the external or internal side and/or by means of cavity wall insulation by filling with loose materials. Obviously, this last opportunity could be considered only if there is an empty air cavity between the masonry leaves of the peripheral walls. Its thickness usually can vary from 50 to 200 mm. Filling the air cavity with insulating materials reduces energy loss by transmission through opaque envelope surfaces, and it represents a cheap solution to obtain a significant reduction in building energy consumption. In fact, this solution deserves to be evaluated for its advantages: Cavity filling would not affect the interior building volume or the façade aspect, and it is cheap and easy to adopt in multistory buildings, i.e., when only a few apartments need to be restored. Sometimes the filling technique could be considered in association with a thin insulation board applied on the external or internal wall surface.
When applicable, this technique could help the energy retrofitting of large building stocks in Europe, and its use could be enhanced by means of national/regional promotion and incentives. Building envelopes with cavity walls are widely spread throughout the EU, typically in the 1950s–1980s buildings, which, in general, are recognized as the subject of urgent and deep energy renovation.
However, a good plan should start by knowing the diffusion of this kind of building envelope, information that is not easily available in a completely organized database. For example, in Italy, national data collection is provided by the regions that send main information on the Energy Performance Certificates (EPC) to the Italian National Agency for New Technologies, Energy, and Sustainable Economic Development (ENEA) by means of XML files. Recently (April 2022), the ENEA and Ministry of the Ecological Transition have launched the National Portal on the Energy Performance of Buildings that presents an overview of ENEA statistics related to the energy performance of buildings (
https://pnpe2.enea.it/ (accessed on 15 September 2022)). Currently, detailed information on building envelopes is not available on the portal, even if they could help to define targeted insulation strategies.
From the analysis of the spatial and temporal diffusion of cavity walls in Europe (Par.2), some main characteristics are highlighted, such as the most recurrent cavity thicknesses, the wall composition, and thermal transmittances. In some countries, detailed information about typical local constructions is collected in documents such as national/regional abacuses.
The effects of wall cavity insulation are shown by means of main thermal parameters (Par.3), such as the thermal transmittance U. When possible, the values corresponding to good performance levels have been indicated with reference to the major renovation (and new buildings) in the Italian national legislation. The thermal features of a wall should be considered strictly related to its hygrometric behavior that depends on climatic conditions and insulating materials; therefore, this aspect has also been taken into account.
The peculiarities of cavity wall insulation have been considered by analyzing insulation advantages and some disadvantages, such as the insulation thickness bonded to the cavity width, the thermal bridges, and vapor condensation increasing effects (Par.4). To quantitatively explain these effects, an example of evaluation is discussed with reference to a common cavity wall layer composition.
The attention is focused on opaque envelope insulation, which has a great influence on building energy performance: The calculations refer specifically to opaque walls and not to the whole building envelope. Information regarding building types distributed over a vast territory is difficult to collect, and in this investigation, the approach that national/local institutions could adopt to support energy-saving strategies is demonstrated by means of the EPC database analysis (Par.5). The regional database interrogation can obtain suggestions for the most suitable energy improvement measures to promote.
2. Cavity Wall Buildings
Several studies regarding the possibility of increasing building energy performance consider the widespread presence of cavity walls in the building stocks of the European community. A detailed description of their diffusion (wall surface, cavity thicknesses, and geographical location) is not available in an organized database, but their presence is testified in studies and research on various European countries in 20th-century buildings. In Par.2.1, some information on existing buildings with cavity walls and data collection are discussed mainly from European projects, while in Par.2.2, indications of their geographical spread and construction periods are derived from research on the improvement of energy efficiency.
2.1. Indications from European Projects and Activities
In Europe, several funded projects developed studies about the energy performance of the existing building stock. Some of them indicate the filling of cavity walls with insulating materials as a solution to be adopted for building retrofitting. In other cases, building samples that include cavity walls were chosen for the high diffusion of this kind of structure.
In the TABULA project (2009–2012) [
1] (or in the EPISCOPE project [
2], launched in 2013 as a follow-up to the TABULA project), some information about typical wall structures was collected for each country. The building layers and structures were described in various ways; an example of the collected data (
Table 1) provides a brief description, image, construction period, and thermal transmittance U.
The EASEE project [
3] (Envelope Approach to improve Sustainability and Energy efficiency in Existing multistory, multiowner residential buildings, 2012–2016) was a research project specifically intended for existing buildings characterized by cavity walls. It targeted residential buildings with cavity walls built before the 1970s and aimed to develop innovative and easy-to-implement solutions. Among other actions, a focus was on improving perlite hydrophobic features with innovative processes to fill cavity walls.
In the INSPIRE project (Development of Systemic Packages for Deep Energy Renovation of Residential and Tertiary Buildings including Envelope and Systems [
4]), wide information on state-of-the-art European building stock was collected for both residential buildings and offices. In the case of cavity walls, the objective difficulty to categorize the upgraded part of the EU-27 stock walls was observed. Some interesting notes were collected on the spread of cavity walls related to different periods and incidences. For example, in Austria, insulated cavity walls did not appear until the 1980s. In the Czech Republic, standardized building types started to be introduced after 1946, but external walls were still mainly solid or cavity brickwork. In Denmark, in master builder houses built before 1930, exterior walls are noninsulated cavity walls with two leaves of brickwork. In Finland, most of the external walls are solid walls; cavity walls are extremely rare. In France, brick cavity external walls are only found in a minority of single-family houses (16%). In the Netherlands, most cavity walls have been insulated. In the UK, cavity walls were introduced in the 1930s. In Italy, the 1965–1990 office stock used cavity walls and prefabricated panels (this indication is partial; wider information can be found in the Italian Technical report UNI TR 11552 as cited in the following Paragraph 3.1).
In Portugal, typical midcentury residential and office buildings comprise a reinforced concrete frame and single or cavity walls. Up until the 1970s, practically all cavity walls had no additional insulation, but they started to be insulated fairly widely since then.
In the Building Stock Observatory (BSO,
https://ec.europa.eu/energy/eu-buildings-database_en (accessed on 15 September 2022)) and some National EPC public databases, the presence of cavity walls in a building is not clearly indicated. The EU Commission, in addition to research projects, has promoted activities about energy efficiency in buildings with indications for cavity walls. Specific recommendations according to the country’s climate conditions have been developed [
5] where it is specifically indicated to proceed to cavity insulation in buildings located in eastern or northeastern EU regions (defined as subregions C and E). A particular mention can be made for the little state of Luxembourg, where the target of improving cavity wall insulation in existing buildings [
6,
7] was specifically indicated in the ordinance of the Grand Duchy on promoting rational energy use and renewable energy sources (December 2007).
Detailed information on whole buildings and not only on envelope structures is increasingly necessary. Energy modeling is reaching higher importance not only for single-building energy simulation but also at an urban scale. The energy consumption of buildings is one of the aspects that must contribute to achieving the objectives proposed by the 2030 Agenda for more sustainable cities [
8]. Urban Building Energy Modeling (UBEM) aims to optimize energy systems through tools and methodologies [
9] on a large scale. Over the years, many tools have been created with different physics-based bottom-ups, e.g., the Sustainable Urban Neighborhood modeling tool (SUNtool, 2009), the City Building Energy Saver (CityBES, 2015), or the Tool for Energy Analysis and Simulation for efficient Retrofit (TEASER).
In general, the energy simulations carried out using UBEM tools start from some common inputs (e.g., physical characteristics of the components, morphology, and climate of the site) necessary for both the definition of individual buildings and entire neighborhoods. UBEM tools use geometrical data (such as building footprints and building heights) taken from existing databases, e.g., CityGML, Shapefile, and OpenStreetMap (OSM) [
10]. Not all databases have reliable data, not all are public, and some can be expensive. However, there are no large databases that include all the information about the parameters that these tools need for the calculations. Usually, when no detailed information is available, it is assumed that archetypes could be used to simplify the geometry characterization process in UBEM tools [
11,
12]. The archetypes are based on some particular characteristics (geometrical, physical, etc.) of a building stock and would be representative of that stock. They are not representative of all buildings, which vary greatly depending on the territory and historical period of the buildings’ edification. The attempt to represent everything through archetypes emphasizes the lack of organized databases.
2.2. Cavity Wall Diffusion
Since there is no organized database to extract information to quantify buildings with cavity walls, some data have been recovered from research works referring to case studies and their geographical location.
In [
13], the predominant diffusion of cavity walls widespread in Europe after World War II in northwestern Europe is asserted. In particular, it is observed that in northwestern Europe, after the 1973 energy crisis, cavity filling was often considered to improve thermal insulation. The analysis concerns the filling effectiveness and considers many factors that lower the thermal quality of filled. The results conclude with a series of recommendations to obtain higher-performing cavity insulation. In the following discussion, it will be seen that cavity walls are also widely diffused in Mediterranean countries.
In a study on building renovation in southern Spain [
14], a case study characterized by thermal envelopes with cavity walls was chosen based on the assumption that this construction typology is quite conventional and frequently found in Andalusia in the last 20 years (already a majority in the rest of the EU). The most common building typologies and constructive solutions were extracted from a statistical database of the Government of Spain [
15], the same database that provided information for several European research projects, such as EPISCOPE. In the case study, a 350 mm thickness wall with a 125 mm air cavity was analyzed.
In research on the building stocks from the 1950s to 1980s in Spain and Portugal [
16], besides the evaluation of the energy performance of insulation on the external side of the walls, an interesting analysis was presented on the diffusion of cavity walls, which are considered widespread in both countries with a mean U-value of 1.1 W/(m
2K) in Portugal and 1.33–1.43 W/(m
2K) in Spain (double brick walls with an air cavity, indicated here as “air chamber”). In Portugal, the diffusion of double walls with an air cavity (indicated as an “air box”) is considered to have started in the 1950s [
17]. It was believed that the air layer alone was enough to ensure good insulation and maintain comfortable conditions inside the house.
More quantitative information, even if related to limited geographic distribution, was presented in a study on a sample of 50 residential buildings from 1950 to 1980 in Madrid, Spain. A total of 56% of them was characterized by cavity walls [
18] with a mean thickness of a 50 mm air cavity and U-values in the range of 1.22–1.56 W/(m
2K).
In the UK [
19], 60% of the 1930s buildings with cavity walls still have not adopted filling insulation, which is estimated to reduce energy loss by up to 40%. However, the efficacy of thermal insulation might be affected by the presence of thermal bridges.
In Belgium, a vast number of houses were built with noninsulated cavity walls. This presents a high potential for blown-in, retrofit cavity wall insulation. On average, cavity widths are indicated to vary from 50 to 80 mm [
20]. These authors argue that the principle of a cavity wall is based on the capacity of the exterior masonry to absorb rainfall and drain the cavity. They observe that filling the cavity between the masonry leaves eliminates the drainage capacity, creating a potential risk for rainwater penetration and that this fact should be considered in performance evaluations. In the Netherlands, in 2015, 1.5 million homes had already insulated their air cavities by filling them, constituting almost a fifth of the entire building stock.
In [
21], the possibility of introducing a quality mark for cavity insulation is evaluated: The authors consider cavity walls a common envelope wall structure in climates characterized by high rainfall loads caused by the wind. Through the insulation of the cavity wall, the advantages are represented by an increase in:
A survey on thermal insulation interventions using cavity fillings in Irish buildings [
22] highlighted the results obtained in buildings isolated from the outside and in air cavities, both in terms of energy and internal environmental quality. The investigation was supported by a qualitative survey of the opinions of the occupants. From an energy point of view, it does not seem that the results of the analyzed case studies were considered very gratifying, but this could be due to the type of building and the significant presence of thermal bridges. In any case, there was an interest in finding intervention solutions for cavity walls, which were considered widely spread throughout the national territory.
In northern Germany, cavity walls were indicated as the predominant typology of envelope walls: In an INTERREG biennial project, a guide on the advantages and limitations of the external insulation of cavity walls in existing buildings was prepared [
23]. The houses characterized by cavity walls were built up to 1970 with an air gap of 40–90 mm. The estimated heat energy saved from cavity filling with insulating material for detached houses was up to 15%. The insulating material properties and effects of thermal bridges were discussed.
One of the most recent contributions to the knowledge on cavity wall diffusion provides a wide analysis of the energy performance of the European building stock [
24,
25] and indicates cavity wall distribution as a function of the construction period (
Table 2). It can be observed that the insulation measures by cavity filling start to grow only after the 1990s.
An analysis of national standards and guidelines can help with the collection of information on cavity wall diffusion. In Italy, for example, a Technical Report of the National Bureau of Standardization (UNI), UNI TR 11552 [
26], provides information on the most common wall typologies of the existing national building stock, their regional diffusion, and their distribution by time period. The presence of cavity walls is attested from 1930 in small buildings, social housing, and residential buildings in various regions.
Unfortunately, no quantitative indications are available, for example, on the diffusion of wall types in terms of the extension of the wall surface, most common thickness of the cavity (indicated in a range of 25–300 mm), the number of buildings, or typical climatic conditions.
In various member states of the European community, national technical standards describe the procedures for insulation filling, conditions, and limits for carrying out the procedure. By British and Belgian standards, the minimum cavity width and maximum height of walls are considered [
21], referring to a minimum cavity width of 50 mm. In the Netherlands, the minimum thickness for cavity filling depends on the insulating material: The limit is 30 mm for expanded polystyrene and 40 mm for urea formaldehyde foam and loose-fill mineral wool, even if such narrow cavities are not highly diffused.
The maximum height of walls represents another constraint in some cases: By British and Dutch standards, insulating walls higher than 12–12.5 m leads to the assessment of the risk of rain penetration. In Belgium, for the maximum wall height, the influence of wind-driven rain must be considered in the risk of rain penetration.
From the literature analysis, useful information can be collected on the presence of cavity walls in different regions; however, no quantitative data is available on the diffusion of buildings characterized by this wall typology. Detailed information on the surface area and thickness would be very important in order to concretely define effective energy loss reduction and to formulate economically sustainable strategies.
To show the effects of cavity filling depending on cavity thickness and insulating materials, below are some calculations referring to a case study. They are preceded by notes on the main parameters for the thermal characterization of walls and typical filling insulating materials.
The development of this type of analysis could constitute the basis of a study to support the decisions of regional and national administrations in relation to the possibility of promoting cavity insulation as a measure for reducing energy consumption.
3. Main Features of Cavity Walls
Some notes are presented on the main thermal and hygrometric parameters for the evaluation of the suitability of cavity wall insulation. Typical characteristics of commonly used filling materials are considered to highlight the main aspects of obtaining satisfactory results.
3.1. Main Parameters for the Thermal Characterization of Walls
3.1.1. Thermal Transmittance U
The calculation of thermal losses through the building envelope is a fundamental starting point to evaluate the energy performance of a building [
27]. One of the main significant parameters for the energy performance assessment of the building envelope in steady conditions is the thermal transmittance U [W/(m
2K)]. Usually, it is subject to legislative indications and limits for the energy consumption of buildings. Through this parameter, the thermal flux φ [W] through a wall can be calculated (one-dimensional and in steady state conditions), depending on the temperature difference from inside (t
i) to outside (t
e), and the wall surface (A [m
2]):
The U-value depends on the thermal conductivity of material layers and their thicknesses and the surface coefficients of heat transfer, as indicated in EN ISO 6946 [
28]. To limit heat transmission, the U-value should be as low as possible, and this can be obtained by using low-conductivity materials. To reduce the U-value of an existing wall, layers of thermal insulating materials can be applied on the external or internal side. If there is an air gap between layers of the wall, it can be filled with bulk insulation material or foam.
In Italy, national law has established upper limit U-values of walls for both new buildings and renovations (Appendix B [
29]). For the latter, in particular, there are different U limits for important restoration, reference building, and cavity wall insulation (
Table 3) according to the climatic zone (defined based on heating degree day (DD) ranges [
30]).
3.1.2. Linear Thermal Transmittance Ψie
The heat losses through the building envelope concern not only plane walls (one-dimensional flow) but also areas in which the heat flow is distributed in two or three directions, i.e., corners and edges, formed by the intersection of two or three surfaces, or any area in which different thicknesses or different materials determine a non-one-dimensional heat flow. These areas are referred to as “thermal bridges”. They represent important elements in energy performance calculations. In the winter, their lower internal surface temperature versus the plane surfaces can lead also to the risk of surface mold problems, as indicated below.
In order to take into account the incidence of a thermal bridge on the whole heat flow, the linear thermal transmittance Ψ [W/(m K)] was used; it allows the calculation of the corresponding heat flow rate in steady state conditions by means of the length of the junction and temperature difference from inside to outside. In other words, with the linear thermal transmittance Ψ, the additional thermal flux due to the thermal bridge is quantified with respect to the one-dimensional thermal flux calculated for the flat building elements whose junction determines the thermal bridge (EN ISO 10211 [
31]). The U-values of the walls, layer thicknesses, and conductivities are used to calculate Ψ. As already said for the U-value, to limit heat transmission, this parameter should also be as low as possible. As it is strongly influenced by the position of the material layers, usually, insulating materials should be positioned on the external side of the thermal bridge to obtain a low Ψ-value.
3.1.3. Periodic Thermal Transmittance Yie, Decrement Factor, and Time Shift
To evaluate the energy performance in dynamic conditions, it is necessary to refer to building simulation models, which consider the heat storage in the structure and time dependence of boundary conditions.
Additional parameters are needed for evaluating the impact of the variation of the climatic conditions outside the building. For example, the analysis of summer behavior takes into account that the external wall surface is subdued not only by the night–day temperature variation, but also by the solar radiation contribution.
A significant parameter to characterize the dynamic thermal performance of the building envelope (EN ISO 13786 [
32]) is the periodic thermal transmittance Y
ie [W/(m
2K)]. It is defined as the amplitude of the heat flow rate through the component surface adjacent to a zone, which is kept at a constant temperature, divided by the amplitude of the temperature in the adjacent zone (which could be represented by the external environment).
In Italy, the dynamic behavior of the building envelope is the subject of national dispositions ([
29], Annex 1) aiming at limiting energy needs for summer air conditioning, internal temperatures of new buildings, and existing buildings undergoing major renovations. The periodic thermal transmittance of vertical walls with a surface mass Ms ≤ 230 kg/m
2 for west, south, and east exposition should be Y
ie ≤ 0.10 W/(m
2K) in locations where the irradiance is I ≥ 290 W/m
2 (I = average monthly value of irradiance on the horizontal plane in the month of maximum summer insolation) with the exception of the climatic zone F.
In the past [
33], two more parameters were considered to assess the dynamic behavior of a building envelope:
The envelope influence on the thermal behavior, represented by the time shift S (or Δt), [h] that corresponds to the period of time between the maximum amplitude of the thermal flux entering the indoor environment and the maximum temperature in the external environment (taken as absolute value).
The effect of the wall on the inward heat flow rate, taken into account by the decrement factor f, expressed by the ratio between the periodic thermal transmittance Yie [W/(m2K)] and the quasisteady state thermal transmittance U [W/(m2K)]:
These two parameters are no longer considered in the more recent national dispositions; however, in this analysis, their values are assumed as useful indications of the wall quality and their combination can provide a quality judgment of the dynamic behavior of the building envelope (
Table 4 [
33]).
The parameters described above (periodic thermal transmittance, decrement factor, and time shift) can help to evaluate the time-variant building envelope behavior that affects environmental comfort and the need for air conditioning. To calculate these parameters, the heat capacity (depending on mass and specific heat) and the density of the materials are needed, in addition to those already indicated for thermal transmittance.
3.1.4. Temperature Factor and Condensation Mass
Moreover, other aspects should be considered in the building envelope renovation related mainly to healthy environments [
34]. In particular, the analysis of thermal insulation benefits should both prevent critical surface humidity by means of a proper internal surface temperature and avoid the risk of interstitial condensation. Therefore, the hygrometric assessment of building components is needed to verify the insulating actions’ suitability [
35].
Surface problems could lead to mold growth and mainly depend on the internal temperature, surface temperature, humidity levels, and human activities in the building (vapor production).
To avoid surface risk, generally, a limit value of 80% relative humidity on the internal surface of the wall is considered. From this value, the minimum acceptable surface temperature and the corresponding dimensionless temperature factor f
Rsi,ref can be calculated [
35]. To assess the avoidance of mold growth, f
Rsi,ref should be lower than the temperature factor on the inner surface, f
Rsi, calculated with the temperature of the internal surface and the internal and external air temperatures.
Interstitial condensation may happen when vapor meets colder zones crossing the wall layers and can determine the degradation of heat transmission properties and the migration of liquid water in the wall.
The risk can be assessed by means of inside and outside temperatures, relative humidity (or vapor pressure), thicknesses, and thermophysical characteristics of its layers (thermal conductivity and vapor permeability). If the vapor flow meets a layer with a temperature lower than its dewpoint temperature, condensation can occur. This phenomenon may not occur if the insulating material has a low vapor permeability.
In the assessment procedure, a wall is considered “free from condensation risk” if there is no condensation or if the amount of condensed water in the cool months evaporates during the rest of the year and if it is lower than the current material allowable limit. In general, the highest limit is considered to be equal to 500 g/m
2 [
35]; however, the Italian National Annex of the EN ISO 13788 Standard indicates more detailed conditions for insulating materials. The maximum value of the condensated mass M
ref [g/m
2] in the insulating material is expressed as a function of the density ρ [kg/m
3], the thickness d [m], and the thermal conductivity λ [W/(m K)]:
In the risk assessment, external temperature and relative humidity are required: In the majority of cases, their monthly values are used. The calculation results depend obviously on the building location.
The parameters considered here with the relative reference values (mostly referred to in Italian National legislation) are used to describe the main thermal and hygrometric features of building walls. An example of the results that can be obtained from their calculation and comparisons with the reference values is presented in Par.4.
3.2. Materials
A brief list of the most common filling materials is indicated below to show the main thermo-physical characteristics.
Insulating materials can be divided into four main categories [
36]:
Inorganic materials (e.g., glass wool and rock wool);
Organic materials (e.g., polystyrene and polyurethane foam);
Combined materials (e.g., wood wool and gypsum foam);
New technology materials (e.g., transparent materials).
Each category can be further divided according to other fundamental characteristics of the materials, such as the origin (natural or synthetic) and structure (cellular or fibrous).
Not all materials are suitable for filling cavity walls: Bulk materials, such as cellulose, rock, or glass wool flakes, expanded or extruded polystyrene foams, or polyurethane and also urea or phenolic resins are mainly used.
The choice of the most suitable material must be made according to the specific objectives, the comparison with the reference values, and the local climatic conditions. In
Table 5, density, thermal conductivity, and vapor permeability are indicated for some common filling materials [
37,
38].
Cellulose is usually made from recycled paper or wood fiber mass [
37]. Its thermal conductivity varies from 0.040 to 0.050 W/(m K) depending on temperature and density, and it can increase a lot with a small increase in moisture content, a problem that can be limited by using additives.
Rock wool and glass wool are made from the same basic materials, such as quartz sand and limestone, but differ in their melting temperature and the size of their fibrous structure. Rock wool is heavier than glass wool, and it is more suitable for high-temperature applications. The mechanical resistance of glass wool can be increased with oils and adhesive materials.
The conductivity of rock wool and glass wool is between 0.038 and 0.054 W/(m K); both the materials have a vapor resistance factor around µ = 1, which can determine a high risk of interstitial and surface condensation, and it is, therefore, necessary to pay attention to the environmental conditions of the building to restore.
From the point of view of material sustainability, both rock wool and glass wool are practically not reusable after the first application, but they can be recycled.
The polyurethane foam is composed of polyurethane polymer, characterized by a closed cellular structure and excellent thermal performance with a thermal conductivity value between 0.032 and 0.035 W/(m K). The material can be used both as foam, suitable for filling cavities, and as rigid panels, especially for external coats. Unlike mineral wool, the vapor resistance factor µ = 60 indicates a very low risk of condensation, as will be shown in the case study examined. Polyurethane is often not considered reusable or recyclable; therefore, is often considered less suitable for a totally sustainable design.
In the 1970s, urea formaldehyde foam began to be used for cavity insulation, but it only lasted for a few years, as the formaldehyde gas inside the foam was found to be carcinogenic and was, therefore, banned in many states [
39]. Currently, a thermosetting urea resin-based foam is commonly used, with thermal conductivity values ranging from 0.032 to 0.054 W/(m K) depending on the size of the air cells enclosed in the foam. This material is easily applicable, as the foam is made on site, mixing water and a dry powdery compound and immediately inserted into the cavity through small holes in the wall. As for mineral wool, the vapor resistance is low, around µ = 2, and therefore, the risk of interstitial condensation must be carefully evaluated. Urea resin, similar to polyurethane, is neither recyclable nor reusable.
4. Cavity Insulation Calculations: A Case Study
This section presents some evaluations of the insulation intervention of a building wall with an air cavity. The purpose of the following analyses is to discuss some quantitative aspects to better understand the potential of cavity wall filling and the importance of some critical aspects.
Table 6 summarizes the characteristics of the sample wall (materials, thicknesses, thermo-physical quantities, wall composition, and thermal bridge typologies) chosen as a case study for its common features in Italy and in other European countries that correspond to the building wall MCV01 described in the UNI TR 11552 [
26]. The same table shows some calculated parameters described in the previous paragraph.
Three common thicknesses of the air cavity (50-100-150 mm) have been considered for the calculations before (AC) and after cavity filling (CI), with three different types of insulation materials with medium, low, and high thermal conductivity (
Table 7). In addition, two combined solutions have been considered to add to the cavity-filling action, the plaster replacement from the external (CI+Pe), or internal (CI+Pi) side, with a 20 mm layer of insulating plaster (lime-based thermo-plaster). The combined solution “CI+Pi” can correspond to situations in which a tenant renovates a single house, while the “CI+Pe” solution can correspond to the case of reconstruction of the facade plaster and contextual improvement of the thermal insulation of the building envelope.
The climatic conditions needed for the surface hygrometric problems and risk of interstitial condensation assessments refer to the typically continental climate of Milan (Cfa, Kopper classification), with characteristics of central Europe (Lyon and Toulouse, France; Belgrade, Serbia; Lugano, Switzerland; Venice, Italy; Sochi, Russia; and Corvo, Portugal), corresponding to the climatic zone E in Italy.
In addition, some evaluations concern the typical climatic conditions of the Mediterranean area (referring to Genoa, Csa Kopper classification, climatic zone D in Italy), as in Par.5, the data analysis is related to the Liguria Region (Genoa is the regional capital), characterized by milder climate, as its territory develops along the seacoast. The reference climatic data of the two locations are taken by the national technical standard UNI 10349 [
40], which indicates the monthly average thermo-hygrometrical data of 120 Italian municipalities. The internal vapor production corresponds to that indicated for buildings with unknown occupancy (humidity class III, Annex A.2, [
35]), usually adopted for residential buildings simulations.
In addition, the effects of the modified thermal bridge after the cavity filling were evaluated, with reference to a vertical edge composed of two walls of the same type with and without insulation (scheme in
Table 6). The most significant results are presented in the following graphs, where the air cavity thickness of 50–100–150 mm has been reported on the x-axis and the value of the parameter under examination has been indicated on the y-axis. In general, for each thickness, the first bar indicates the value referred to for the wall without insulation (Air Cavity, AC), and the subsequent pairs represent each type of insulation (RW = Rock Wool; PF = Polyurethane Foam; UR = Urea Resin, respectively), the value obtained by filling the cavity (Cavity Insulation, CI), and the solution coupled with filling and plaster replacement (CI+P). If there are significant differences depending on the side (external/internal) of the plaster substitution, instead of P, the indication is, respectively, Pe or Pi. Otherwise, in the graphs, the internal plaster substitution is represented, while all the detailed values with both external/internal substitution are indicated in
Table 8 and
Table 9 (Par.4.6). A red line/bar/band indicates a reference value/ranges when available.
Legend for the following figures:
AC = Air Cavity
CI = Cavity Insulation
CI + P = Cavity Insulation + Thermo-Plaster (internal/external: Pi and Pe when needed)
RW = Rock Wool
PF = Polyurethane Foam
UR = Urea Resin
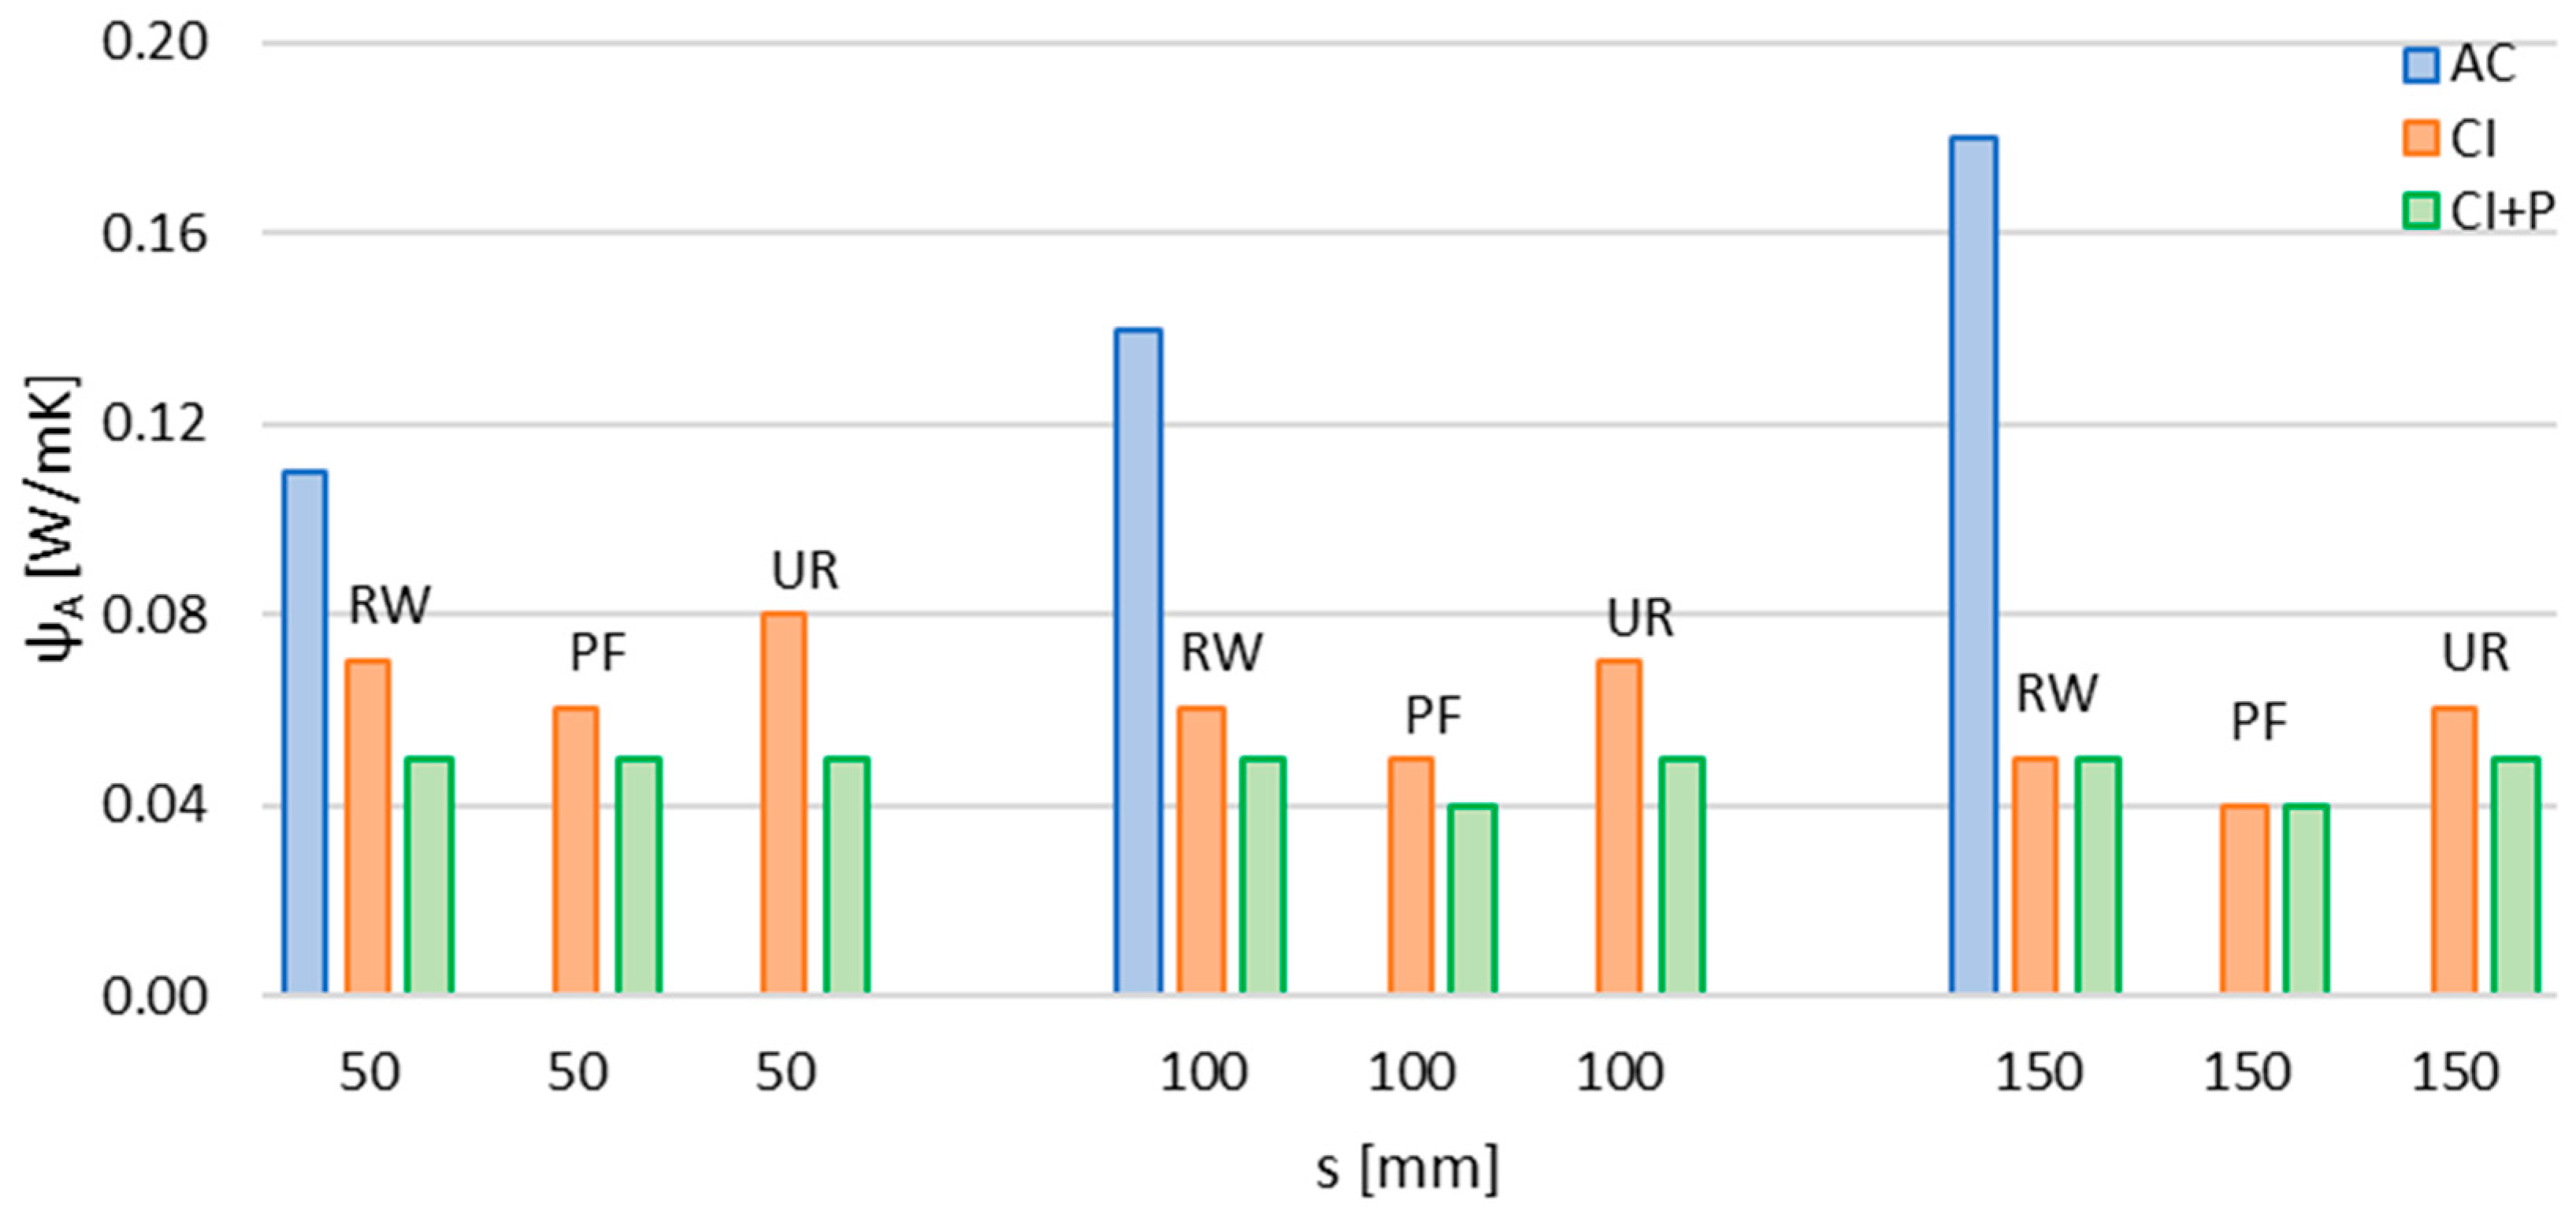
4.1. Building Walls—Thermal Transmittance U in Steady State Conditions
In
Figure 1, the thermal transmittance reduction is shown, depending on insulating materials and cavity thickness. A low U-value represents a well-insulated wall, and it is an index of good energy performance.
The reference U-values, U = 0.28 W/(m
2K) (Milan) and U = 0.32 W/(m
2K) (Genoa), are considered for comparison. They correspond to the most restricting values referring to the “U-value for important restoration of existing buildings” (first row,
Table 3), for the E and D Italian climatic zones, rather than to the “U-value of the reference building for energy restoration” (third row,
Table 3).
The calculated U-value is lower than the reference one for the cavity thickness of 150 mm, while for 50 mm and 100 mm, the U-value remains higher than 0.28 W/(m2K). In any case, it can be observed (Expr. 1) that, even for the thinnest cavity, the thermal flow can be reduced by at least 50% compared to the case of air cavity (AC). For the cavity thickness of 50 mm, in fact, the U-value reduction is about 50% and 55% in the case of thermal plaster application. For masonry with a 100 mm cavity, the percentage decrease is 68.5% and 70.5% if thermal plaster is used in addition. In the case of filling with polyurethane foam (thermal conductivity λ = 0.035 W/(m K)) in combination with insulating plaster, the U-value is 0.26 W/(m2K). By using a filling material with a conductivity lower than 0.035 W/(m K), good results could be obtained even without replacing the original plaster.
For walls with a 150 mm cavity, the percentage decrease is 77% and 78.1% with the plaster replacement addition of the thermal plaster that, therefore, implies a negligible variation of the U-value. In general, higher values of cavity thickness determine a less important contribution of the plaster substitution on the overall insulation of the wall. However, it could be helpful in the case of low-performance filling materials, slightly improving the thermal transmittance.
4.2. Thermal Bridges—Linear Thermal Transmittance Ψie
Among the various thermal bridges, the vertical edge was chosen as it can be one of the most critical ones for cavity walls. In
Figure 2 and
Figure 3, the linear thermal transmittance Ψ
ie [
36] of two configurations (with and without corner pillar) are shown: Higher values of Ψ
ie are an index of worse quality. The CI+P data refer to internal plaster substitution, as external substitution only leads to slightly different results.
The graph in
Figure 2 shows the linear thermal transmittance Ψ
ie of the thermal bridge in the absence of a pillar that, in the absence of insulation, varies between 0.11 and 0.18 W/(m K), while in the case of an insulated thermal bridge, it reduces to a value between 0.04 and 0.08 W/(m K).
The average percentage reduction for a 50 mm cavity thickness is 36.4% with insulation and 54.5% with the addition of thermo-plaster. For a larger thickness of the air cavity, the Ψie value is higher and the percentage reduction is better. In principle, the presence of thermo-plaster has a greater influence on smaller cavity thicknesses, while the difference between cavity insulation alone and cavity insulation with plaster substitution decreases for higher thicknesses.
In the presence of a corner pillar, Ψ
ie assumes values between 0.16 and 0.24 W/(m K) without insulation (
Figure 3). In this case, the cavity filling causes higher linear thermal transmittance, making the situation worse, but if the cavity insulation is coupled with plaster substitution (AC+P), the situation remains almost unchanged with respect to the air cavity (AC).
4.3. Building Walls—Periodic Thermal Transmittance Yie, Decrement Factor, and Time Shift
The periodic thermal transmittance reduction is represented in
Figure 4, depending on insulating materials and cavity thicknesses. The three filling materials were chosen mainly for their different thermal conductivities that directly determine the U-value; the Y
ie-value [
36] also depends on their density and specific heat. A low Y
ie value summarily indicates that the influence of the outside temperature variations is low.
The case study wall (MCV01) has a surface mass “Ms” lower than 230 kg/m2: The comparison with the reference value of Yie = 0.10 W/(m2K) (red line) is needed in Italy in the conditions indicated in Par.3.1 (if Ms ≤ 230 kg/m2, for west–south–east exposition, Yie ≤ 0.10 W/(m2K) in locations with I ≥ 290 W/m2).
The calculations have shown that isolating the cavity reduces the Yie value by at least 60%, compared with the effect produced on the U-value for which the minimum reduction is 43%. The effect of the thermo-plaster brings an average decrease of 30% compared to the cavity insulation alone.
The minimum decrease in Yie (60%) occurs for the thinner thickness (s = 50 mm) and gets better with the addition of the thermo-plaster (72%). For cavity thicknesses greater than 100 mm, very good results are obtained for almost all the solutions.
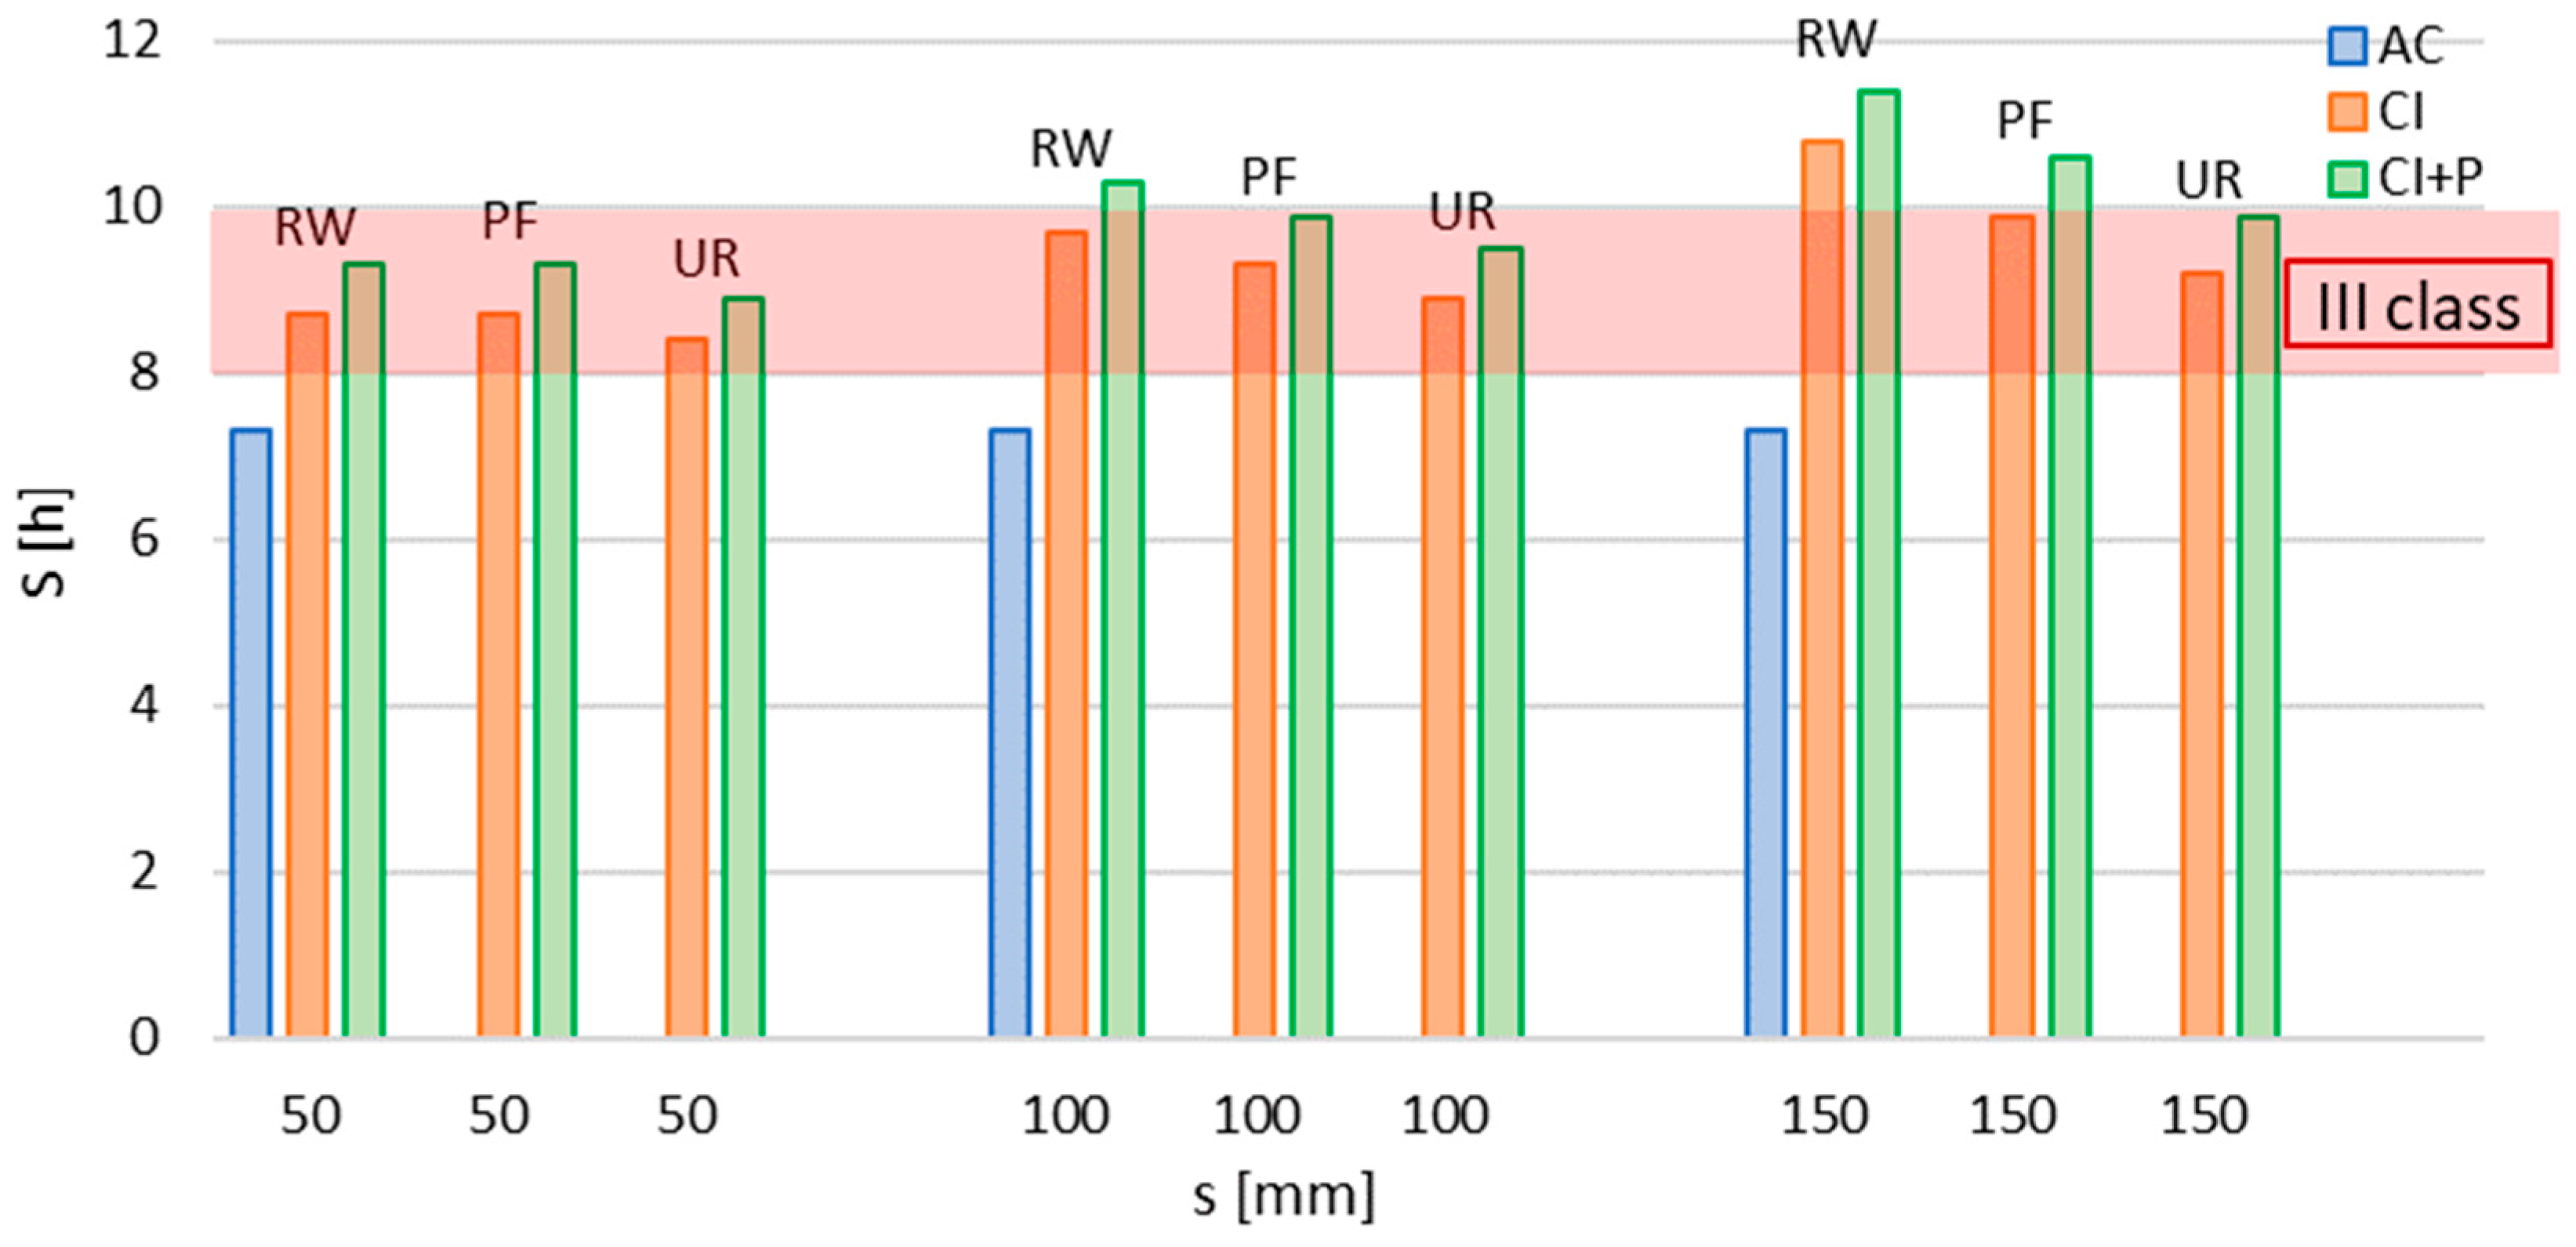
In the dynamic thermal analyses, in addition to the periodic thermal transmittance, it is useful to know the values of the decrement factor and time shift of the thermal flow as a function of the above parameters (cavity thickness and insulating material).
The decrement factor f, already defined in Par.3.1 (Expr. 2), can also be defined as the ratio between the variation in external temperature and the thermal flux that is necessary for the closed environment to keep the internal temperature constant. Its value should be as low as possible. A value between 0.3 and 0.4 (III class,
Table 4) corresponding to a wall of average quality is indicated with a red strip in
Figure 5. The improvement of the decrement factor value with cavity insulation is quite generalized for all types of insulation as well as its increase with the support of thermo-plaster.
The time shift S [
38] is another dynamic parameter useful mainly to evaluate the summer performance of the building envelope; it can provide indications about how much the envelope can reduce the effect of external climatic conditions on the internal environment without the intervention of a thermal system.
The time shift of the thermal wave should be as high as possible: In this analysis, the reference value was considered between 8 and 10 h (III class,
Table 4), corresponding to an average quality of the passive behavior of the wall structure.
For any insulation action, the time shift is always better than the air cavity wall case, and it remains in the reference range or overcomes it, leading to a better quality (
Figure 6) for the largest insulated cavity.
Generally speaking, the best material is rock wool, with percentage variations always higher than other thermal insulating materials with respect to the uninsulated cavity.
4.4. Building Walls—Risk of Mould Growth and Interstitial Condensation
To verify the risk of high surface humidity and mold growth, the temperature factor fRsi was calculated and put in comparison with the reference value, fRsi,ref = 0.678, corresponding to the climatic conditions of Milan, characterized by a cold continental climate, as said before. For the comparison, the fRsi,ref = 0.485 for the city of Genoa was not considered because it is less restrictive.
The f
Rsi value [
40] calculated for the wall before and after the insulation interventions always satisfies the comparison with the reference value (
Figure 7), and therefore, the risk of mold growth does not occur for any type of insulation intervention. The plaster substitution is almost irrelevant.
Together with the verification of surface hygrometric problems, it is also necessary to check the risk of the occurrence of interstitial condensation. In general, a layer of insulating material inside a wall keeps the outermost layers at a lower temperature. In the calculations, the climatic conditions of Milan have been considered, as the milder ones of Genoa do not determine the risk of interstitial condensation.
Figure 8 shows the quantity of condensate M [g/m
2] that accumulates in the wall for rock wool and urea resin cavity filling with and without the internal (CI + Pi) or external (CI + Pe) thermo-plaster at the end of the cold season. The maximum reference value M
ref is calculated with Expr.3, Par 3.1.4.
The assessment of the interstitial condensation provides the following results (
Figure 8):
- (a)
In the air cavity walls or cavities filled with polyurethane foam, there is no interstitial condensation, even if the internal plaster is replaced. Polyurethane foam has a high vapor resistance factor, and therefore, the risk of condensation can be very low or absent, as in this case (zero values are not indicated in
Figure 8).
- (b)
The solutions that use the other two insulating materials, on the other hand, are subject to condensation risk. In this case, the two conditions to assess the wall gave the following results:
- (i)
the condensate formed in the cold season evaporates completely in the annual cycle;
- (ii)
for both insulating materials, for all cavity thicknesses, the condensed water mass is lower than the maximum admissible value.
The addition of thermo-plaster provides the following results for both types of insulation:
- a.
the addition of internal thermo-plaster increases the condensed mass;
- b.
the addition of external thermo-plaster reduces the condensate that goes to zero for 50 mm cavity thickness.
4.5. Thermal Bridge—Surface Temperature
The temperature factor is studied both for the plane wall (Par. 4.4) and in correspondence to the corner thermal bridges with and without the pillar. The calculation is performed with the same conditions (internal temperature and humidity) indicated in Par.4.4: the maximum surface relative humidity is set equal to 80%, the internal winter temperature is considered 20 °C, and the internal relative humidity is corresponding to the undefined occupation conditions. The assessment is made by comparing the calculated temperature factor on the thermal bridge and the reference one, which must be lower.
In
Figure 9 and
Figure 10, the calculated f
Rsi value is always greater than the reference value equal to 0.678, as indicated before (valid for all the internal surfaces). By filling insulation, the temperature factor f
Rsi of the wall increases, and, consequently, the internal surface temperature of the wall also increases. In the absence of the pillar (
Figure 9), the added intervention by replacing the internal plaster does not guarantee a significant improvement: The results are very similar to those of cavity filling alone. Furthermore, as the thickness of the cavity increases, the thermal plaster effect becomes increasingly negligible.
In
Figure 10 (thermal bridge with a pillar) the results of the temperature factor with cavity filling only and with thermo-plaster are very different, as the presence of the pillar interrupts the insulation of the wall and causes discontinuity of materials. The f
Rsi values are always greater than the reference data but with a lower percentage of variation. The addition of the thermo-plaster on the internal or external surface improves the results.
4.6. Comments
The calculation results show the positive and negative effects of the insulating actions by filling the cavity wall and the combined solutions with the external or internal plaster replaced by a thermo-plaster layer.
In
Table 8 and
Table 9, the main results are summarized regarding, respectively, thermal and hygrometric behavior with cavity insulation and the substitution of thermo-plaster from the internal and external side. The comparison with reference values is indicated with “V” if the result is better and with “X” if it is worse.
Some observations can be summarized here below:
For the linear thermal transmittance Ψ, there are no reference values. The results obtained from the calculations are reported for two different cases, relating to the thermal bridge at an angle without pillar (A) and with pillar (A+P). The influence of the thermo-plaster is noted on the linear thermal transmittance ΨA+P (better values with external thermo-plaster), while the other values remain very similar.
For the values of time shift (S) and decrement factor (f), the qualitative judgment is reported according to the classification described in Par. 3. In both tables, it is noted that the quality always improves compared to the air cavity and that in the case of cavities of 150 mm, there is a further leap in quality. In the case of external thermo-plaster, class II is already reached with the 100 mm cavity.
The surface mass (Ms) is always less than 230 kg/m2; therefore, from the national Italian indications, it would be necessary to verify the periodic thermal transmittance value (Yie) (in the case of I ≥ 290 W/m2), which must be less than 0.10 W/m2K. The verification, if needed, is met for the 100 mm and 150 mm cavities.
The check of the temperature factor (f
Rsi) is always positive and therefore is not indicated in
Table 8 and
Table 9. Similarly, the verification of the risk of mold growth (M) is always passed.
The same comments can be made in relation to the climate of Genoa. The only difference concerns the calculation for 100 RW because U < Uref, and therefore, the verification is satisfied. The risk of condensation is always equal to zero (M = 0).
From the comparison between
Table 8 and
Table 9, it can be observed that the replacement of the thermo-plaster on the external side instead of the internal one determines little significant changes since the thermal conductivities of the internal and external plaster are slightly different (
Table 7, λ
est = 0.9 W/(m K) and λ
int = 0.7 W/(m K)), and they do not have a great influence for the reduced thickness (20 mm). For the cavity of 150 mm, the influence is negligible.
The surface mass (Ms) is slightly different because the density of the external/internal replaced plaster is different (
Table 6).
The same behavior is observed for periodic thermal transmittance (Yie) where the sequence of layers and not only the composition of the wall is relevant for dynamic calculations. For the same reason, the classification of S+f has good improvements.
The thermo-plaster placed externally instead of internally greatly reduces the hygrometric problems related to the amount of accumulated condensate (M).
In general, if a 150 mm cavity is available, its filling provides better results than cavities with lower thicknesses, both in terms of thermal insulation and dynamic parameters, while there may be a high interstitial condensation risk, depending on the filling materials.
This analysis has highlighted some advantages and negative effects of cavity wall insulation solutions. The following paragraph presents an overview of the diffusion of cavity walls through the interrogation of a regional database of energy performance certificates.
5. Cavity Wall Diffusion: An Example of Database Analysis
Once the widespread diffusion of cavity wall buildings in Europe and the effects of insulating filling have been attested, some notes on the data needed to set intervention strategies on those buildings were examined as well as their potential support for detailed analyses at the regional/national level.
As already pointed out, there is a lack of an organized and well-structured database on existing building types on the national/regional territory and information relating to their thermal characteristics. The effort made through the energy certification process can help fill this gap: The possibility to query a regional database of the Energy Performance Certificates (EPC) can allow to deepen the knowledge on the diffusion of cavity wall typologies and can, therefore, represent a starting point for the intervention of requalification of buildings. The approach could be applied in all regions/states where the EPC databases implement this kind of information.
A specific query of the EPC database of the Liguria Region and the analysis of the extracted data has been developed by the authors of IRE SpA—Energy Recovery Infrastructure, Ligurian Regional Agency—the operational body, with directive and indication powers of the Region Liguria in the energy sector.
The agency provides technical support for the management of the entire energy certification process of the region. The institutional activities conducted by IRE include the analysis of data extracted from the regional database. Since 2007, the Liguria Region has started the energy certification process and, subsequently, has organized a database of data relating to buildings built in the region. The EPC database, created by means of files with an XML extension, contains numerous data regarding the building envelope and the related technology systems.
In previous analyses [
41], the data extracted from the XML files of the EPCs registered in the period 2017–2019 helped to analyze some significant parameters related to the building envelope, such as the diffusion by the province of various types of walls and the relative surfaces.
The applied methodology can be summarized in the following three phases for each category (province, intended use, and type of structure: wall, floor, ceiling and roof):
Phase 1: The total opaque surface was calculated in correspondence with a structure code (explained here below);
Phase 2: The percentage of use for each structure code was obtained depending on the surface, the structure code, and the total surface area of each category;
Phase 3: The percentage of use was sorted in descending order to identify the most used structures for each category. Subsequently, these values were progressively added up, and the cumulative percentage on the surface was thus defined.
Due to the data processing, it was possible to identify the distribution at the provincial level of the most recurrent structures which characterize the territory of the Liguria Region. The structure codes correspond to those of the sample walls described in the national abacus on building envelope features (Technical Report UNI TR 11552 [
26]). This database regards typical wall structures and their thermophysical parameters of existing buildings: For each building wall typology, some notes on its regional diffusion and typical periods of construction are indicated. The Italian EPC software tools usually propose, for existing buildings, the use of these sample walls when detailed information is missing. Among the EPC data, those analyzed in this context are mostly referred to the sample wall corresponding to a cavity wall, code MCV01 (the same used in Par.4).
The extraction process results are presented here, referring to the following topics:
To consider an adequate period for the investigation and the most comparable information possible, the same period 2017–2019 as in the previous analyses has been considered for all the evaluations.
5.1. Wall Area
Table 10 shows the number of the analyzed EPCs divided into residential and nonresidential buildings, the corresponding total opaque vertical dispersing surface, the part with cavity, and that without cavity. From these data, the incidence of cavity walls on the total surface area of opaque building walls can be put in evidence: It is about 3% for residential buildings and 2% for nonresidential buildings.
This quantitative information represents a first step in estimating the thermal flux (Expr.1) that could be avoided with cavity insulation and the impact of this action on the whole building stock.
5.2. Building Typology
Most of the EPCs refer to cavity walls that characterize the building envelope of apartments than those of whole buildings (
Table 11). Half of the multistory buildings are characterized by cavity walls, and the proportion is quite the same for the whole building.
These data are useful to understand that perhaps apartments (and therefore single owners) could be the target of support from institutions to encourage this energy-saving action (cavity filling): In the selected sample, almost all the apartments are characterized by cavity walls as opposed to 50% for the others.
5.3. Cavity Thickness and Distribution Per Building Periods
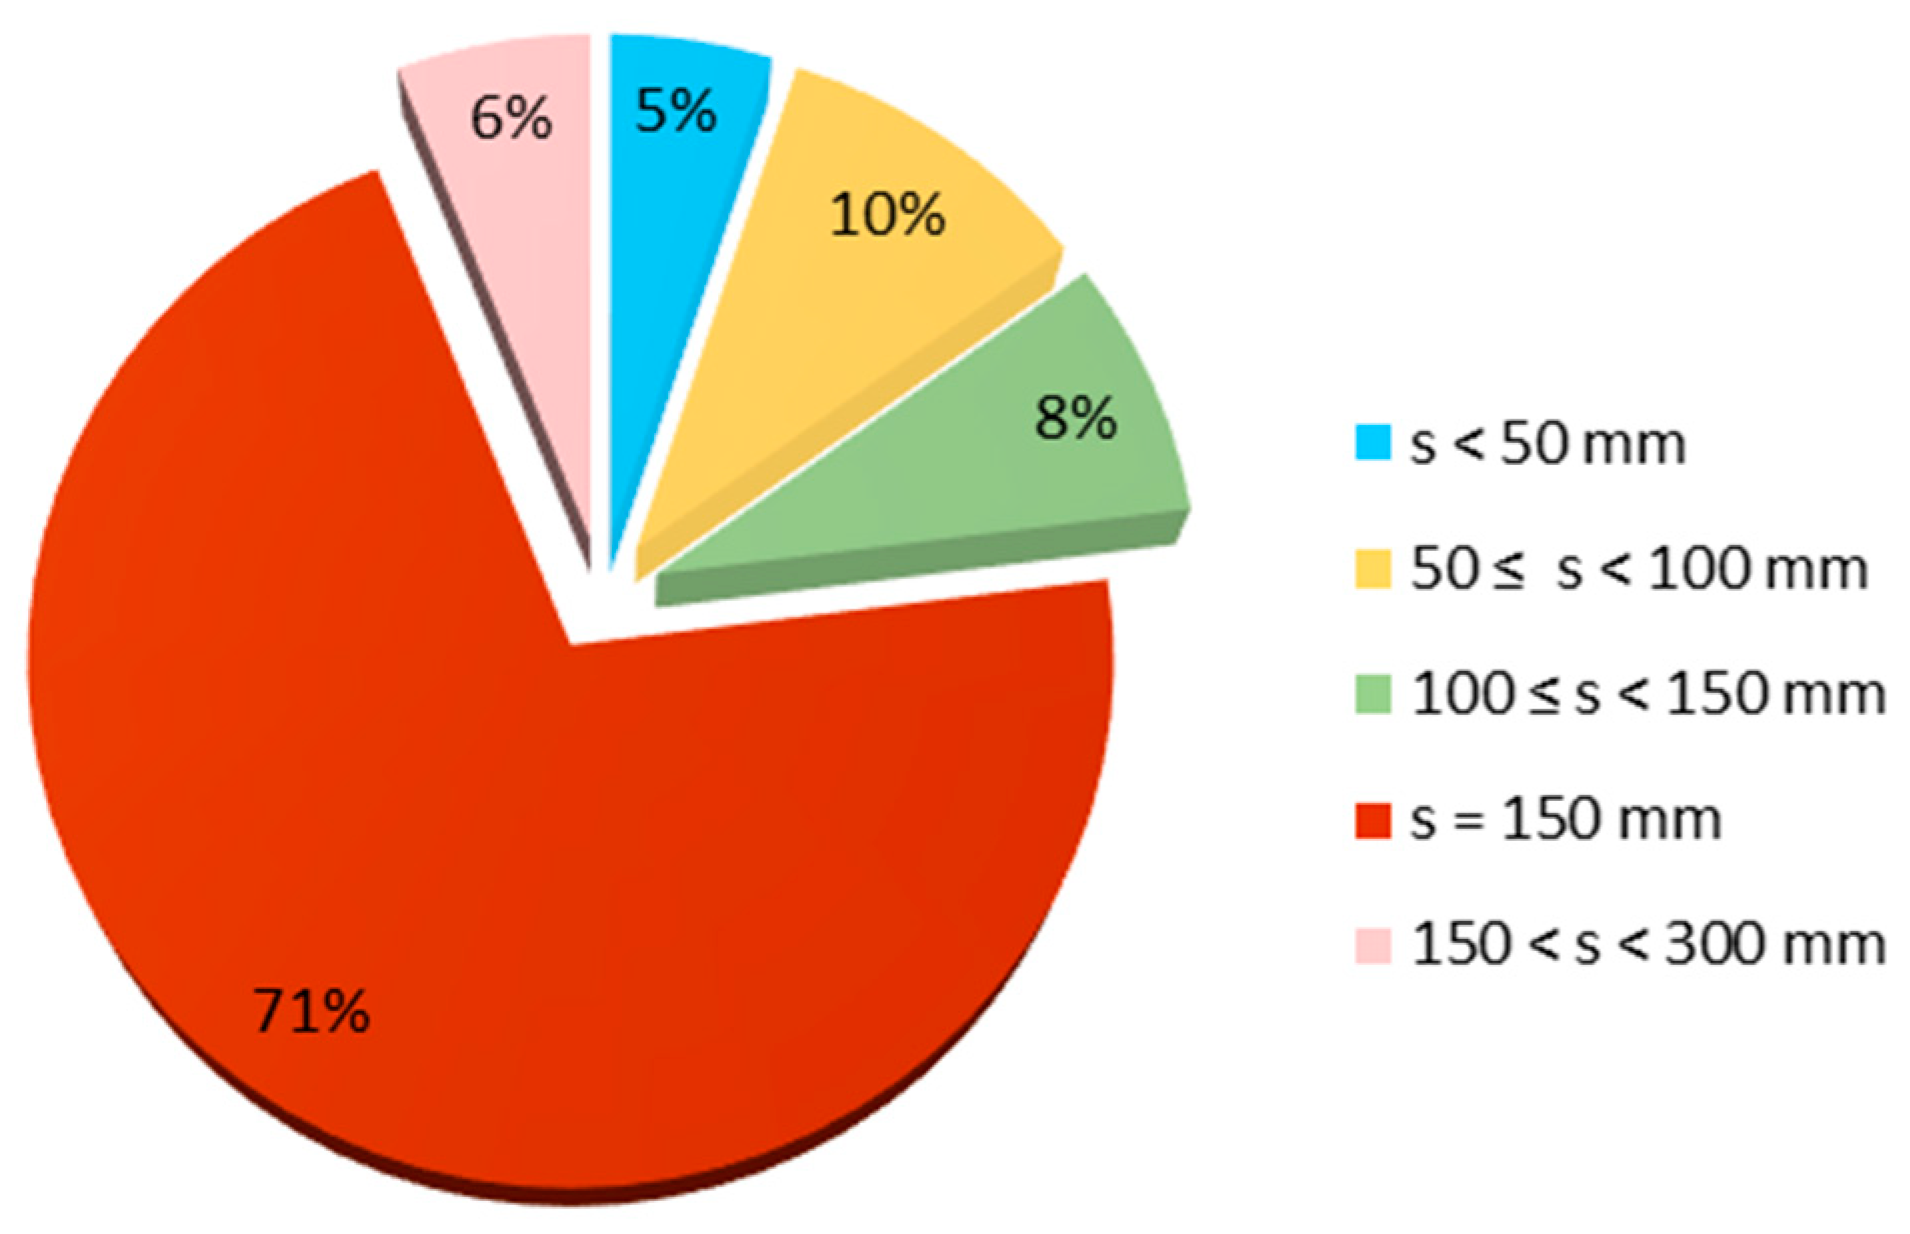
The most extended opaque vertical surface of the external walls is with a cavity thickness of 150 mm (
Figure 11), mainly referred to as the MCV01 type. This information is particularly useful: The presence of a rather large cavity thickness obtains very promising results in terms of thermal insulation, as highlighted in the previous paragraph, for more than 70% of the opaque envelope surface.
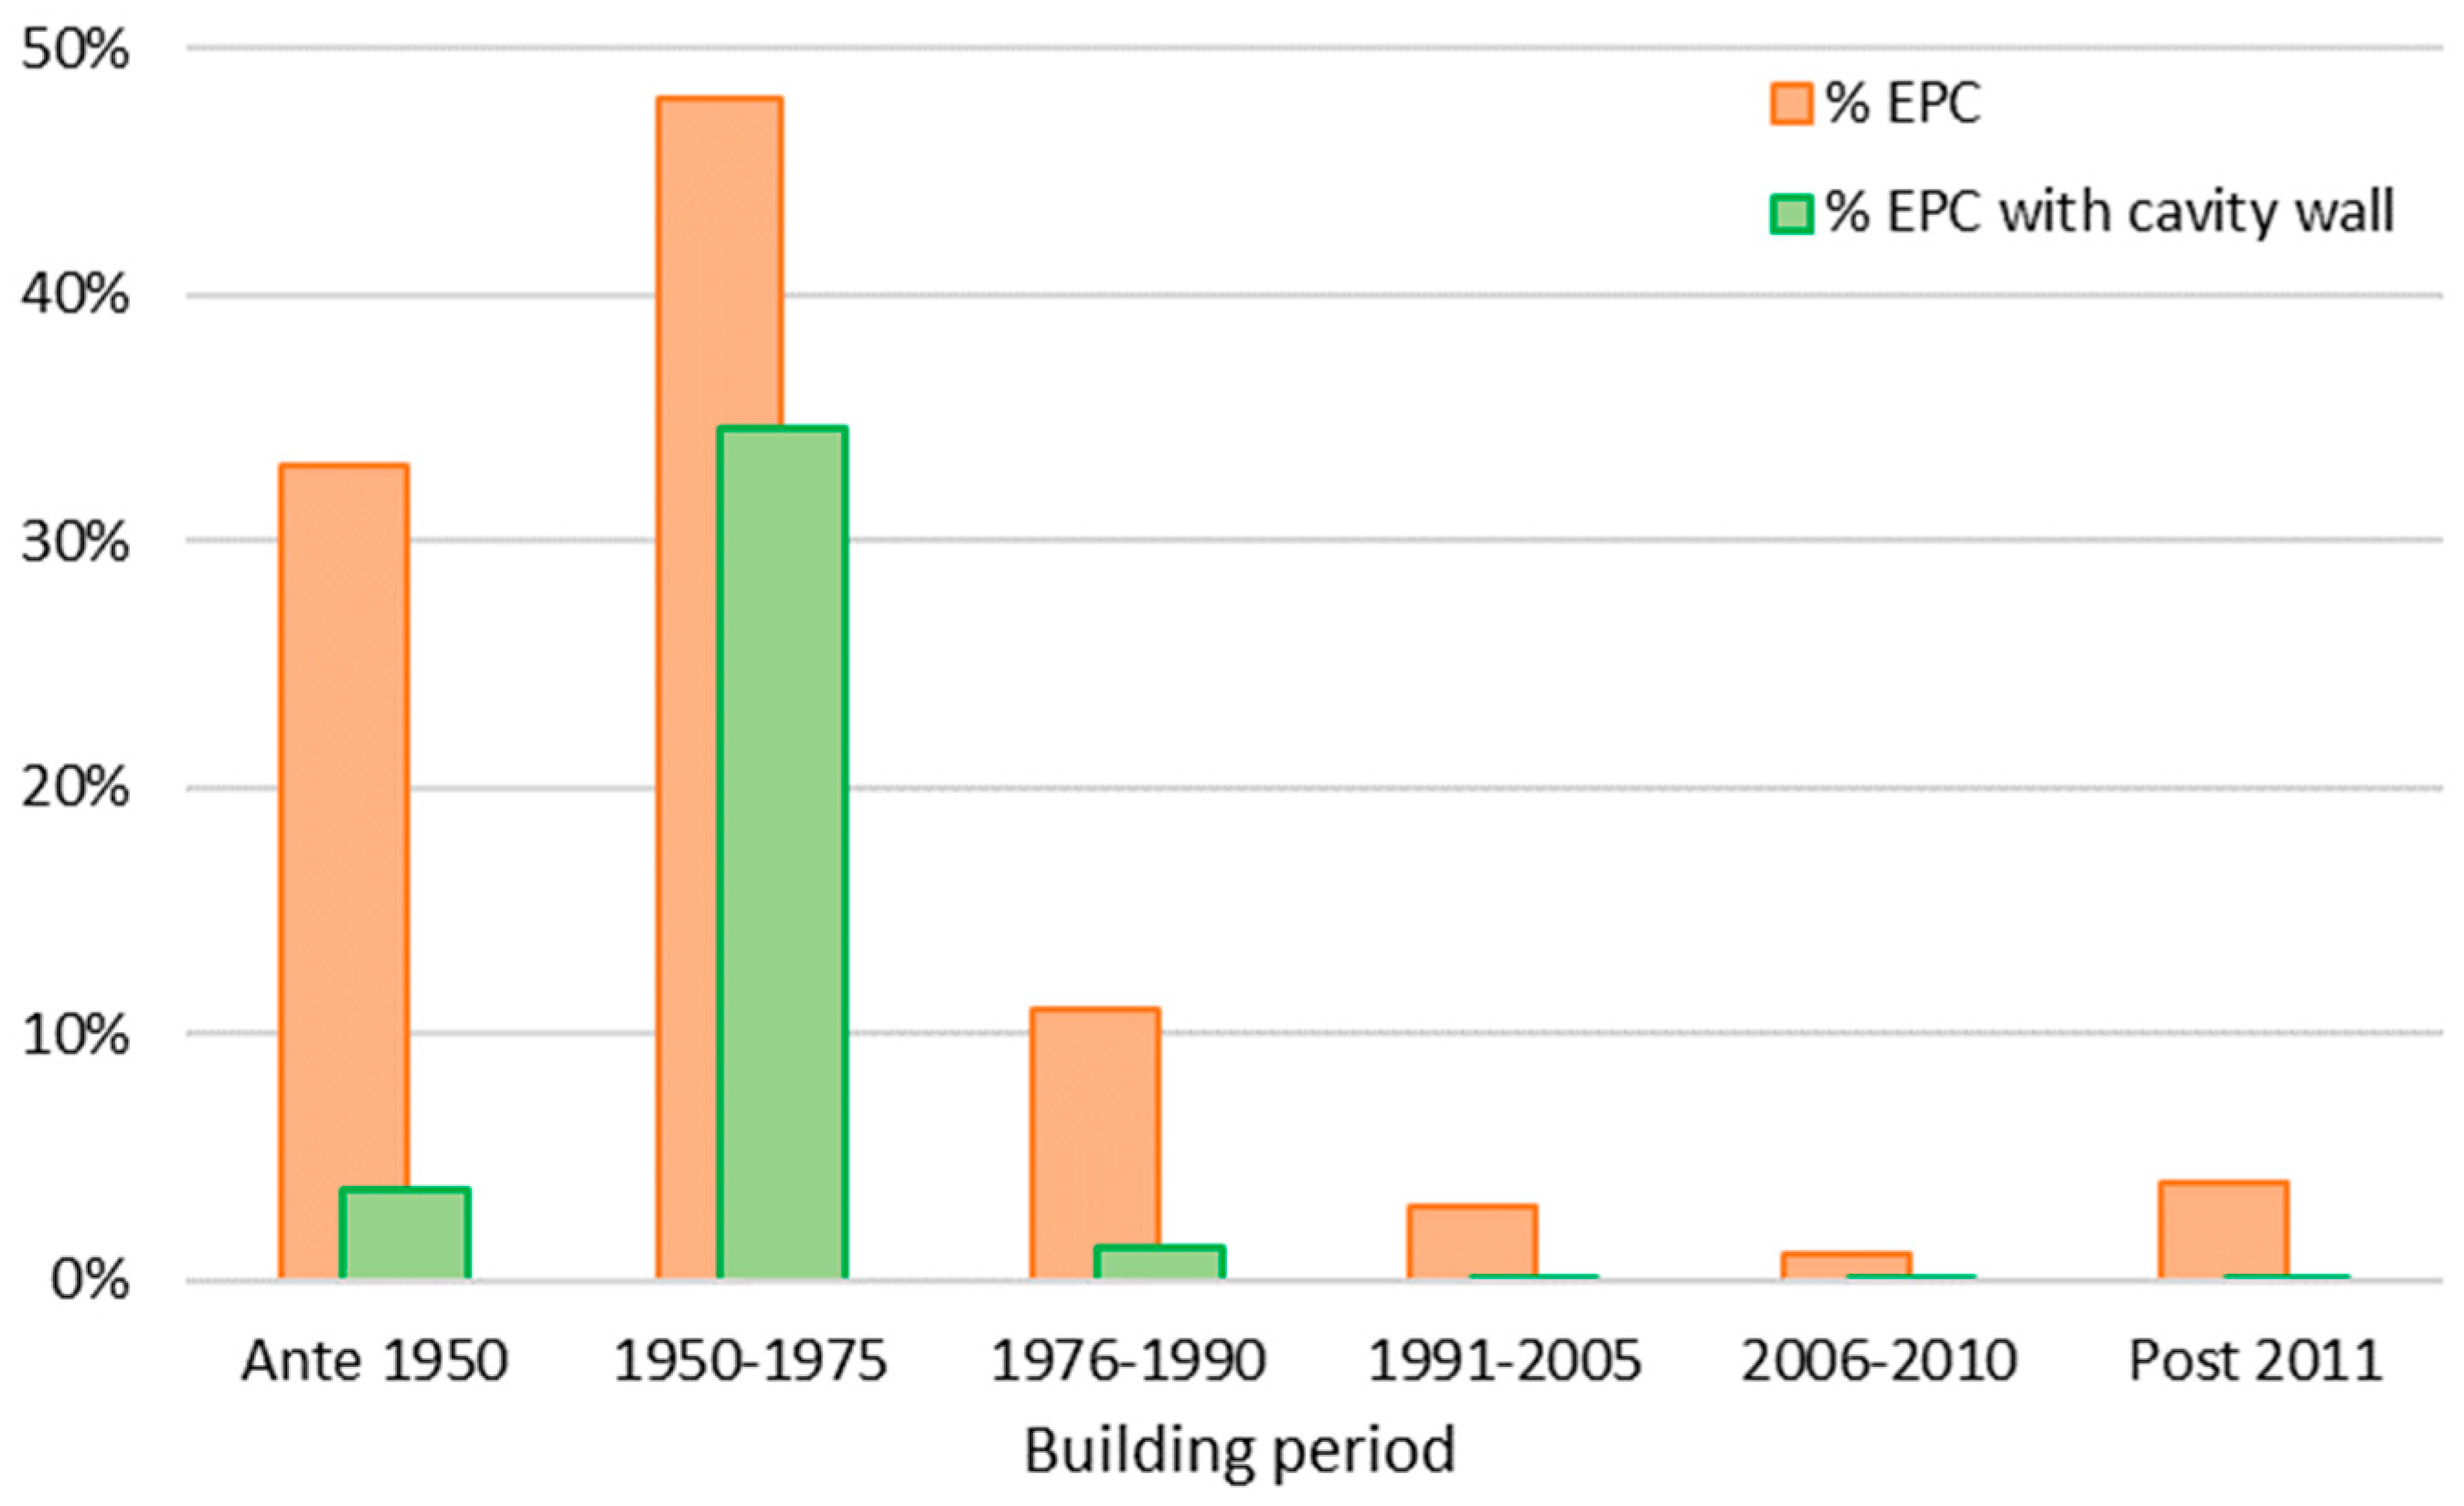
The 1950s–1980s buildings represent most of the building stock in Italy (in Liguria 81% of EPCs refer to pre-1975 buildings): This corresponds to the national building stock situation [
42].
Figure 12 shows the percentage of EPC for each building period and the percentage of EPC with cavity walls within each period. These data could contribute to an indicative evaluation of the impact of cavity wall insulation.
From another point of view, the collected data showed that, in the Liguria Region, about 72% of the buildings with cavity walls were built between 1950 and 1975. In this period, the most frequent cavity thickness is equal to 150 mm (about 53% of the total wall area).
Figure 13 displays the distribution of the opaque vertical surface of external cavity walls by construction period and thickness ranges calculated on the total of the opaque vertical dispersing surface (1,209,290 m
2).
5.4. Climatic Distribution
The percentage distribution of EPCs that contain cavity walls for each climatic zone is similar to the one referred to for the whole analyzed group (
Figure 14). In the Italian strategy for energy retrofitting of the national building stock [
42], it is shown that most of the buildings are in climatic zone E, while in Liguria, the prevailing climatic zone is D.
5.5. Comments on the Results
The data analysis from the regional database in general provides data in line with the average EU diffusion of cavity walls, and therefore, it can be considered a representative model of a broader scenario.
For versatility and simplicity of execution, the cavity wall insulation is particularly interesting for individual properties (
Table 11). In fact, in the case of an intervention in a single apartment in a multistory building, filling the cavity and internal plaster replacement can represent an effective solution. Similarly, associating a cavity filling with an external coat of limited thickness could reach the transmittance reference values or those imposed locally by law for interventions on the entire building. This could be a preferable solution as, for interventions on entire buildings (for example single-family or two-family houses), it would be easier to perform.
The high diffusion of walls with 150 mm air cavities in the Liguria Region provides very promising results, even if it may be necessary to verify compliance with the limit transmittances, the influence of thermal bridges, and hygrometric problems.
6. Conclusions
The importance of the study on cavity walls derives from its diffusion at the regional/national level and can be interesting as a low-complex solution for energy requalification. A well-organized strategy should necessarily start from the knowledge of the physical phenomena associated with heat and vapor transmission through the building walls and should be supported by the impact that could be obtained on the building’s energy improvement.
In the present work, the main parameters for the thermal characterization of walls have been considered, for instance, the U-value [W/(m2K)], the linear thermal transmittance Ψ [W/(m K)], and the temperature factor fRsi [−]. These indices represent the base for thermal evaluation. The use of different materials and the calculation for some cavity thicknesses has helped to identify the differences and choices by means of an example of the improvements that can be obtained by filling insulation with or without external/internal plaster substitution. To evaluate the impact that this type of solution can achieve on the energy saving of the entire building stock, information is needed on the diffusion of the cavity walls in terms of walls surface extension and cavity thickness that can be filled with insulating material.
The collaboration with the regional body (IRE Liguria) responsible for the energy sector of buildings in the Liguria Region (Italy) has allowed some analyses of the consistency of the regional building stock characterized by cavity walls. It was possible to quantify, within the analyzed sample, the percentage of existing buildings with such features and potentialities. This investigation can be a sample for the whole European building stock as the regional one has similar characteristics.
From the results of the analyses, two conclusions can be summarized: on the one hand, the need, highlighted several times, for more organized and deep information on the characteristics of the building stock in each country. On the other hand, the possibility of using databases, related to the Energy Performance Certificates, allows to evaluate the impact that interventions such as cavity filling could represent in particular in all those cases in which other types of energy requalification intervention are not possible. In fact, this type of intervention could be promoted in all those situations that do not fall within the scope of EU directives, national legislation, or in which other constraints limit its achievement (buildings in historic centers, decorated facades, insufficient outdoor space for external insulation, or reduced internal volume for internal insulation).
The discussion presented on cavity walls, their diffusion, and insulation is intended to stimulate the renovation actions on existing buildings focused on this building element and to provide indication on the advantages of the promotion of this technique not only locally by designers but in general by public authorities and government bodies.
This kind of analysis on regional databases, created to manage the building energy certification process, can be a useful starting point for considerations on intervention strategies, mostly if extended to all the certified buildings. The lack of information on building structures is attested also by a recent research project started in 2021, (National Project PRIN 2020, Urban Reference Buildings for Energy Modelling, URBEM [
43]) financed by the Italian Ministry of University and Research (MUR). Through this project, a national database on building typologies and archetypes for energy calculations will be structured. Thanks to this database it will be possible to make greater use of UBEM tools for energy requalification projects on urban scale.
The interventions here discussed, on the other hand, can represent actions that can obtain good results for individual housing units and without incentives: Even if costs were not discussed, this kind of insulation can be cheaper than other actions. To encourage actions for the energy consumption reduction in existing buildings, in the recent past, in Italy, measures to increase energy performance of buildings have been promoted by means of incentives by recognizing different bonus levels. Cavity insulation could be even more promoted and encouraged with a very limited expense compared to other actions, such as, for example, for external thermal insulation, especially due to the need for scaffolding.


