1. Introduction
Understanding occupancy behavior has been highlighted as an essential factor in occupancy modeling to achieve energy efficiency gains [
1]. As a result, the International Energy Agency (IEA) emphasizes the need for more research in predicting building occupancy status, which can save up to 50% of total building energy consumption [
2]. Occupancy status prediction in the buildings benefits several systems, most notably the Heating, Ventilation, and Air Conditioning (HVAC) system. Other building management services, such as security, emergency systems, fire systems, and automated energy management, can also benefit from real-time occupancy information [
3,
4]. The research to detect and estimate building occupants can be classified into direct and environmental sensing methods [
5]. Direct sensing is based on technology that can directly indicate the presence of people through passive infrared, video cameras, and optical tripwires. The performance of the direct sensing approach is excellent in detecting, estimating and tracking occupancy. However, the adoption of this approach in residential buildings and future smart homes has research challenges. One of such challenge is preserving occupancy privacy. A smart indoor occupancy prediction system should be designed to prevent occupancy or their activities from being identified [
6].
On the other hand, environmental sensing predicts the presence of occupancy through sudden changes in environmental surroundings, such as heat or carbon dioxide (CO
2) emissions, without jeopardizing the occupants’ privacy in that specific location [
7]. However, a single environmental sensor data accurately confirm occupancy with a certain degree of certainty without machine learning methods [
3]. Jointly combined sensors with strong data correlation can improve the performance accuracy of the prediction model [
1]. However, when data generated by sensors grows exponentially, conducting data processing, storage, and reporting becomes too expensive. Furthermore, they are incapable of meeting the processing requirements of real-time processes, especially if events monitored at regular intervals are either redundant or have minor variations, resulting in a significant waste of data storage resources and communication energy at relay and sensor nodes.
Researchers proposed incorporating various environmental parameters, such as indoor temperature, humidity, CO
2 concentration, and noise level, to improve precision and accuracy in occupancy models based on single sensing sources. A study used the random forest method to achieve a detection accuracy of up to 98% for dichotomous occupancy status (occupied or vacant) [
8].
For this reason, research on energy efficiency has put more emphasis and growing interest in environmental sensing to improve building infrastructure, enabling smart indoor control. For example, Aliero [
1] uses random forest to perform demand control ventilation to solve the problem of power imbalance during peak load profiles. The predictive control using a fuzzy-based controller proposed in [
9] and adaptive control in [
6] lower the energy consumption of the peak load, such as the HVAC system based on occupant-desired comfort. Predictive control provides a solution for thermal comfort optimization, while adaptive control solutions trade-off between energy consumption and thermal comfort during peak hours [
1].
Despite numerous academic’s efforts to tackle the challenge of building occupancy prediction, little emphasis has been devoted to developing a shared dataset that allows performance comparison of different machine learning algorithms for environmental sensing approaches. There is, however, a limited number of publicly accessible datasets for occupancy prediction [
1]. However, the majority of these are poorly documented or have not been utilized in formal research.
Zhou et al. [
10], from the University of California, Irvine (UCI), offered seven features and over 20,000 records. While this dataset is open to the public, it does not feature some important features or attributes to perform prediction, such as the occupants’ number or range. Barut et al. [
10] and Kane et al. [
11] offered datasets that can be used for occupancy detection. The study of Kane et al. [
11] consisted of a significant quantity of data collected from numerous houses at various seasons of the year. However, this dataset has no ground truth about occupancy, and access is not assured (it can only be accessed upon request from Ecobee).
Several studies have been conducted to estimate occupancy based on environmental sensing (ES) [
11,
12,
13,
14,
15,
16]. However, only a few studies employed non-environmental factors as extra support for occupancy estimation. Studies such as that of Adeogun et al. [
17] used pressure, CO
2 level, humidity, and Passive Infrared (PIR) sensor to reach an estimation accuracy of 91%. Another example is that of Chitu et al. [
18], who, in addition to utilizing CO
2 level, considered the status of all airflow entries and achieved an accuracy of 69%.
Jiang et al. [
19] and Zhou et al. [
13] are two studies that solely employed ES. Both utilized CO
2 to predict occupancy, with 77% and 82% accuracy, respectively. Another example is the work of Viani et al. [
20], who used temperature, humidity, and CO
2 to achieve an accuracy of 82%. This work is one of a few that used temperature and humidity to predict occupancy. To the best of our knowledge, no studies have solely employed ES, without including CO
2 [
21]. Moreover, none of the research based solely on environmental sensing achieved a solid performance comparable to that achieved by works that combined environmental and non-environmental variables [
22]. Moreover, most of these datasets have not captured occupancy numbers (occupant ground truth) or are poorly documented, which is a key attribute for efficient prediction [
1].
The main research question of this work is how the collection and quality of the training dataset for non-intrusive occupancy prediction can be improved. To answer the main research question, the following sub-research questions are posed:
- i.
What are the existing studies for occupancy detection and estimation for energy saving?
- ii.
How can the quality of the training dataset be improved to obtain high-performance prediction?
- iii.
How can the performance of the proposed data collection approach be evaluated using various machine learning methods?
The major objectives of this study are as follows:
- i.
Conducting a literature review analysis.
- ii.
Using a recursive variable feature selection, normality feature cross-validation test, and feature importance, choose and prioritize the most important variables with strong features correlation.
- iii.
Performance comparison of five ML algorithms in terms of prediction accuracy.
This study suggests a new multi-wireless device data model that combines environmental sensing for indoor condition data and camera sensing to capture occupant numbers to establish compressive occupancy prediction datasets.
As a result, this study aims to create an open dataset with environmental variables obtained from a living room setting and to test several Machine Learning (ML) algorithms to predict occupancy levels. Thus, the major contributions of this study are twofold: it generates datasets in real-world scenarios and evaluates five ML algorithms (Random Forest (RF), Naive Bayes Classification (NBC), Support Vector Machine (SVM), Artificial Neural Networks (ANN), and Logistic Regression (LR)) to estimate occupancy levels using the generated datasets.
It is worth noting that this study focuses exclusively on predicting occupancy in enclosed areas based on internal environmental variables. External environmental variables are outside the scope of this study. In addition, because temporal dependency in the data is not considered, the internal environment is deemed static. Furthermore, while the integration of the suggested solution design took place in the design building and EnergyPlus simulator, the actual integration with other building management services with such systems is also beyond the scope of this study.
The research is structured as follows: The second section examines the research on indoor occupancy detection and estimation. The methodology of this investigation is presented in
Section 3. The experimental work is presented in
Section 4.
Section 5 discusses the results and compares them to the current literature. Finally,
Section 6 presents the study’s conclusions.
2. Literature Review
ML occupancy prediction models have demonstrated considerable promise in building energy modeling and forecasting relevant appliances, such as occupancy behavior. The research in [
7] examined the occupancy prediction model both with and without a machine learning method and found that the ML technique considerably increased accuracy and saved 30% of the energy. Although these ML techniques have been widely utilized and tested in previous research, the algorithm employed in each scenario varied. As a result of the increasing quantity of papers, it is vital to investigate model capabilities and issues, and conduct a critical evaluation for future research.
Several data collection approaches have been subsequently devised to improve the precision of occupancy prediction. According to various studies, occupancy detection can reduce energy expenses by up to 30% while boosting indoor air quality [
1,
15]. However, while the usage of such technology is intriguing and offers a peek of future smart homes, privacy concerns must be solved before it can be widely used. Integrating suitable monitoring technologies of the environment with appropriate HVAC or other monitoring capabilities can result in a higher precision and more accurate building simulation methods.
Camera-based occupancy detection, which is frequently used to provide the ground truth of residents, is the most accurate method for detecting people and their number in the building. An experiment using overhead cameras in research students’ office rooms produced over 80% accuracy [
5,
6], and another surveillance system with cameras was used to test the newly suggested occupancy prediction algorithm. However, due to privacy concerns, most cameras were mounted in researchers’ offices or specialized research rooms. In addition to cost and computing power, a camera-based approach is subject to privacy concerns. Additionally, occupancy overlapping is a common challenge in addressed in [
4,
6].
The most basic occupancy detection method is based on a pure analysis of the gradient of the observed CO
2 profile [
7,
8,
14,
23,
24]. The aim is to understand whether occupants are present without regard for the actual quantity of occupiers. According to the authors, the benefit of this approach is its simplicity by simply measuring room CO
2 concentration as an input parameter. Nonetheless, the findings are satisfactory and meaningful only if the room’s air change rate stays unchanged for the duration of the study.
The change in CO
2 generation relative to the number of people present is a typically used statistic. This relation relies on deployment space and, as such, requires either explicit knowledge of the target space [
25,
26,
27] or the capacity to acquire the relation through observation [
9,
14,
16]. The fact that the former models need previous knowledge limits the generality of a solution and would impede any redeployment for a wireless sensor network; consequently, a learned solution is better. Previously, occupancy estimate systems based on learned CO
2-to-occupancy models were presented in [
24]. Artificial neural networks, classification and regression trees, gradient boosting, linear discriminant analysis, random forests, and their derivatives were used in these solutions. In most of the CO
2-based approaches, such as those in [
9,
14,
16,
20,
21], door or window opening (as indicated by the researchers) may result in incorrect occupant detection calculations.
Other systems [
10,
28,
29,
30] provide occupancy detection from people’s perceptions with permanent features, such as a room or entryway, as opposed to user- and activity-centric occupancy approaches. Using sensors such as door contact or passive infrared is useful in identifying people in a target region by monitoring sensor activations throughout a network of deployed devices [
31]. These installations protect privacy, are often low-cost, and are well-suited for wireless sensor network deployments of various sizes. However, the output of these sensors is confined to the binary occupancy state, as these modalities do not generalize well for measuring the number of people unless linked with other sensors.
To enable demand control ventilation, occupancy prediction applications must be incorporated into a control system. The incorporation has taken different forms, including occupancy detection, estimate, identification, and monitoring of occupancy activities [
24]. The research on occupancy-based demand control ventilation is summarized in
Table 1.
The non-intrusive method predicts room occupancy by monitoring ambient conditions. Room occupancy can be measured through various non-intrusive applications, such as multi-sensing technologies, to measure the amounts of CO2 in the room. Recent research combined cameras and ML techniques have been employed in commercial and residential buildings to carefully evaluate and capture picture frames for occupancy prediction. The fusion of these modalities is thought to distinguish human occupancy from other objects releasing thermal heat in the surroundings and to aid in night vision prediction. The vision-based approach can handle multi-class and binary occupancy predictions with up to 96% accuracy and 26% energy savings potential, respectively.
Wearables and acoustic techniques rely on activities accomplished by other systems that can monitor the occupancy position. The ML model can acquire signal strength from statically installed beacons in a target region to generate a fine-grained occupant placement with a geolocation accuracy of five meters. The activation of the selected sensors with known placements has recently been employed in passive infrared and acoustic sensors to obtain occupancy and geolocation information via a multimodal sensing network. In these investigations, multi-modal data fusion and deep learning approach were used to predict occupancy.
In essence, the investigation of related work reveals that satisfactory performance levels for occupancy prediction have been reached. However, disparities in geographical and temporal dimensions, occupancy numbers, and sensor counts make accurate comparisons exceedingly challenging. Likewise, few works that entirely concentrate on environmental sensing without the inclusion of additional sensors were discovered, indicating that this strategy should be researched. A preference for ML and Deep Learning (DL) techniques over physical models was also seen. As a result, the purpose of this work is to focus on a novel multi-model environmental sensing-based monitoring system that collects comprehensive datasets and conducts a performance analysis of the different ML techniques on occupancy prediction.
3. Methodology
3.1. Dataset Collection and Selection Process
Datasets were gathered in a residential building environment, a sitting room in a house that consists of five separate rooms, in Taman Teratai Johor, Malaysia, which has a tropical environment year round with typical temperatures from 25 °C to 30 °C. The case study considered incorporating an innovative lightweight structure approach utilizing a stick-built timber frame and a cassette floor building system. The thermal properties and thicknesses of the building material are shown in
Table 2. These attributes are useful for assessing occupant dynamic and steady behavior.
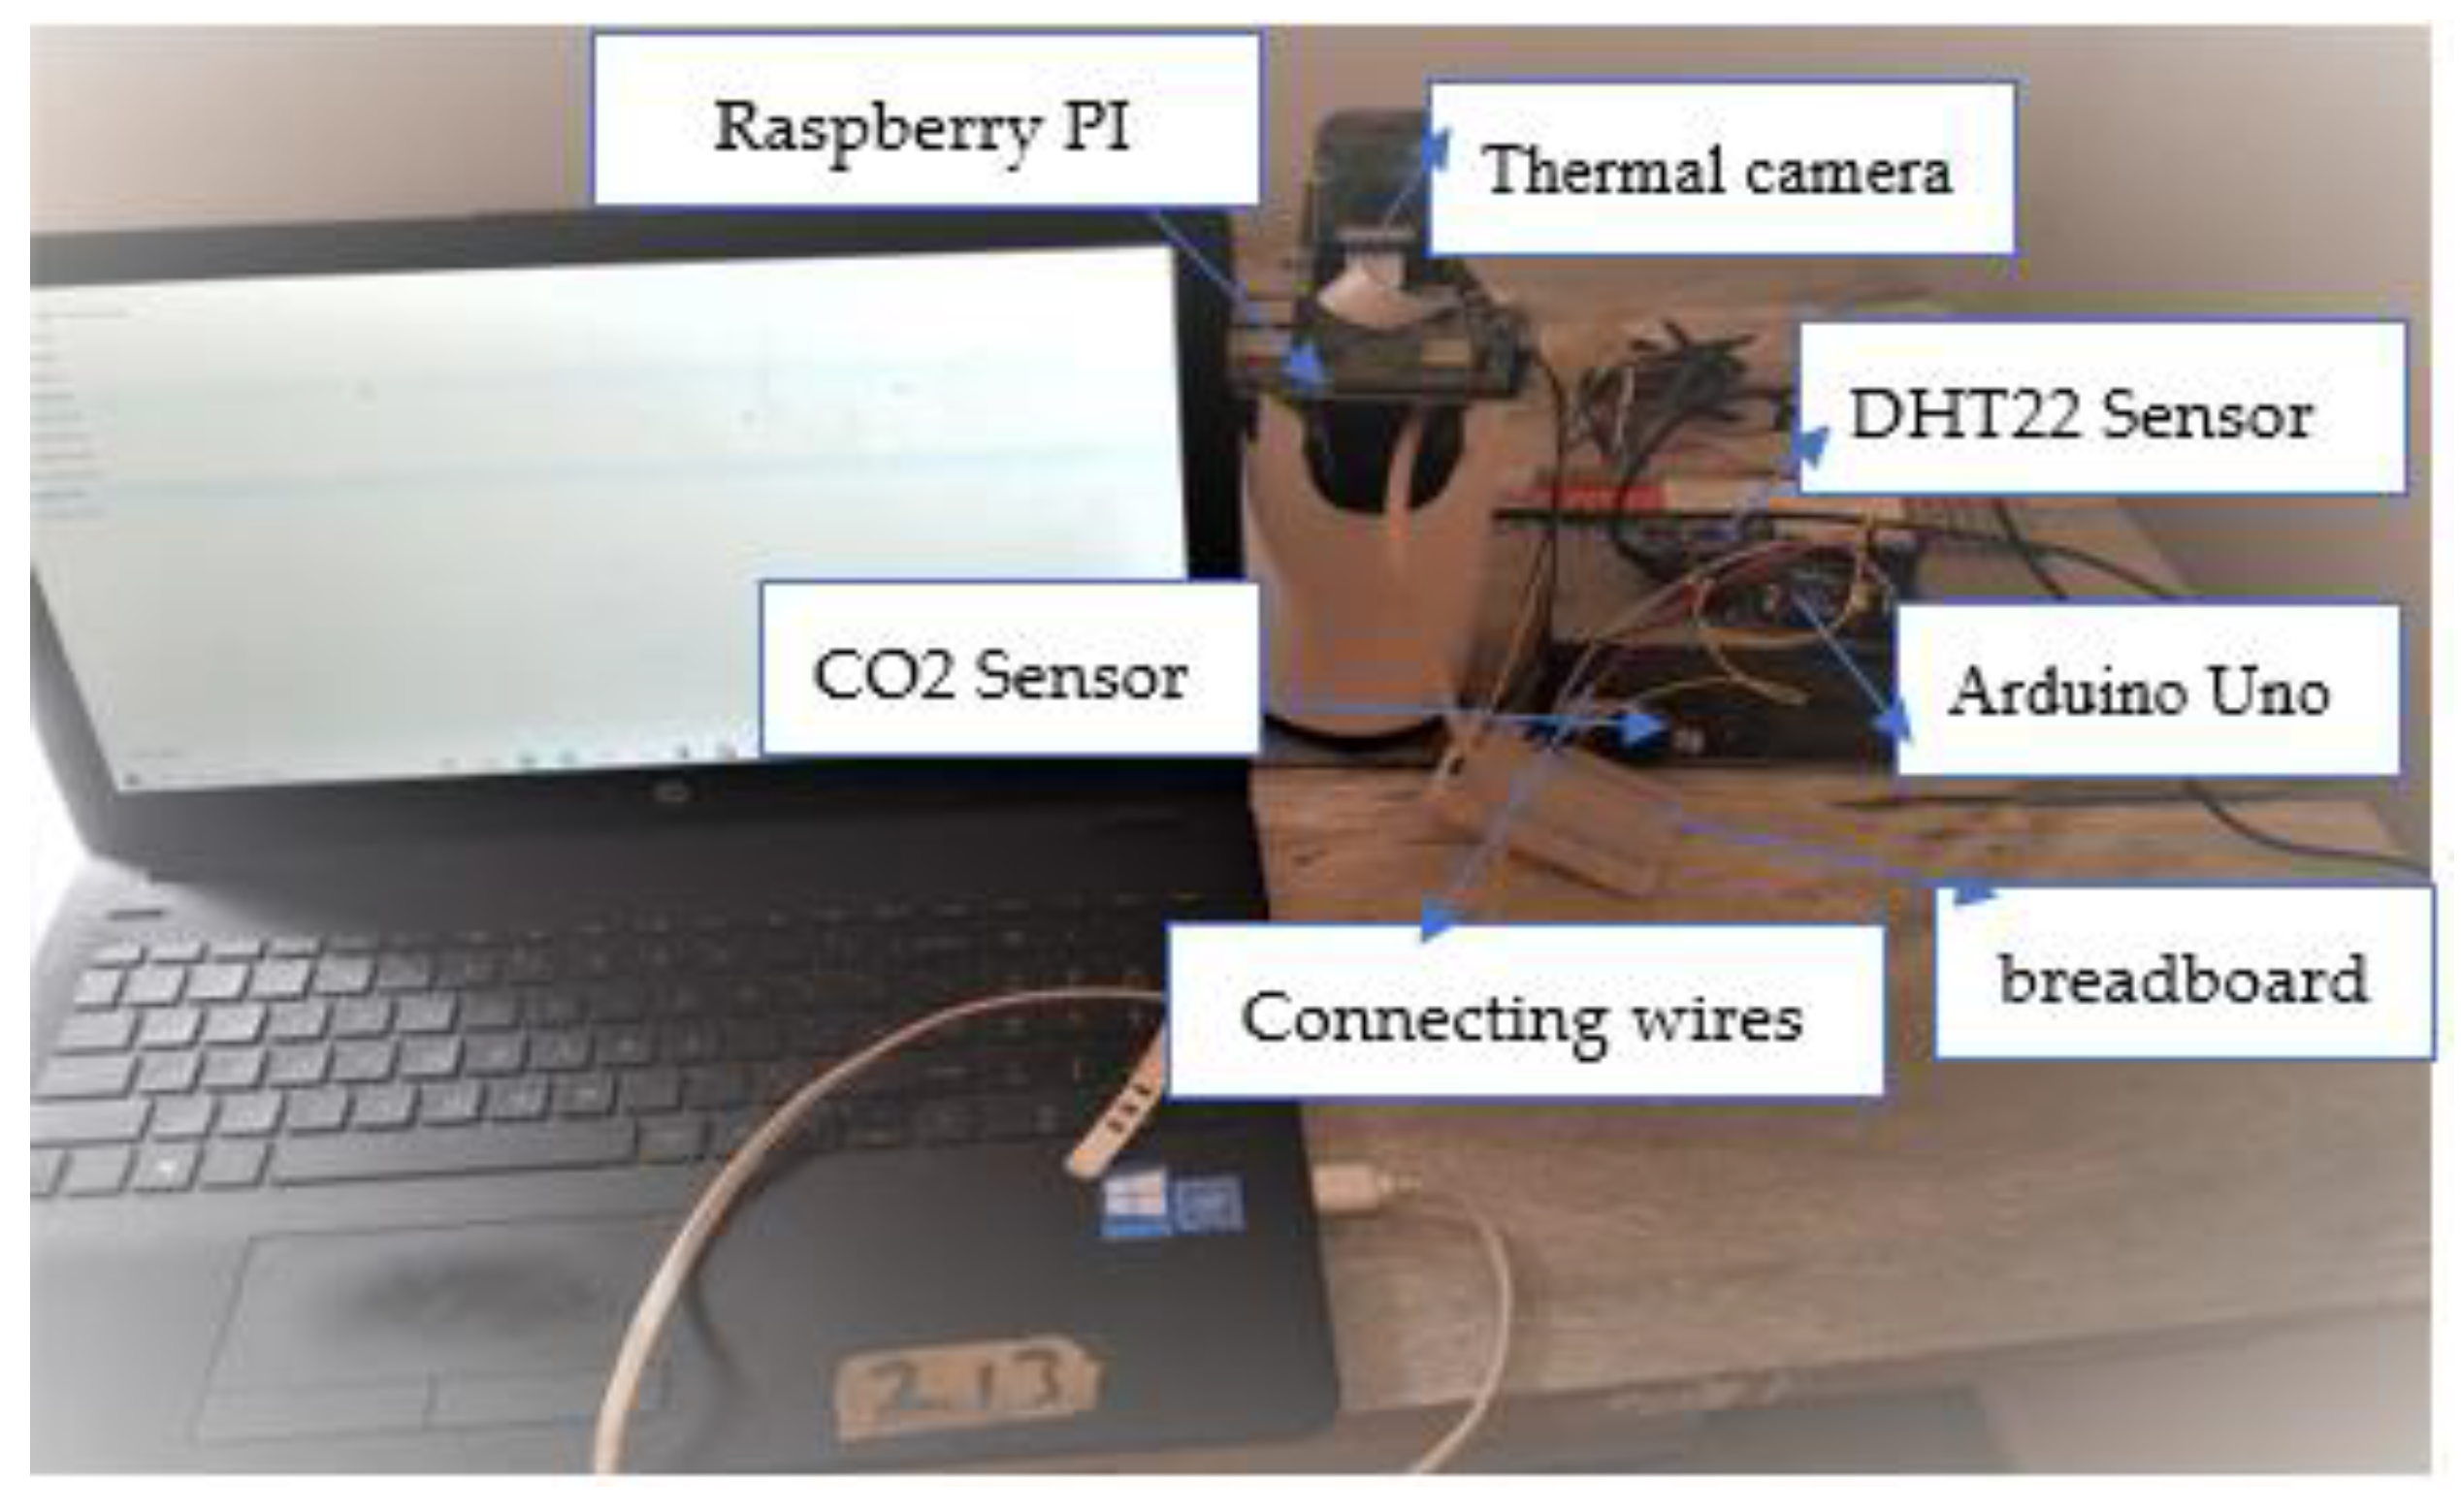
The sitting room is intended for occupants’ social meetings, such as relaxing, eating, and watching TV. Sensors (see
Table 3) were placed on the desk (see
Figure 1) to monitor indoor environmental variables, such as temperature, lighting, relative humidity, and CO
2 levels. Furthermore, people’s arrivals and departures were carefully recorded in the sitting room to confirm that the numbers match the sensor readings.
The temperature and humidity of the room were measured with a DHT22 sensor attached to an Arduino Uno positioned on the desk around 0.5 m away from the occupants. For temperature readings, the DHT22 sensor offers an accuracy of 0.5 °C and a precision of 0.1 °C. A thermal camera sensor situated around 2 m from the occupants and connected to Raspberry PI and CO
2 was used to gather occupancy information regarding room air quality and light intensity. A breadboard was used for a simple wire connections to enable information sharing among sensors (See
Figure 1).
The dataset was collected using consistent readings from 1 April 2021 to 28 April 2021. Only datasets with full-day readings and more than three columns from different streams in a row were used. Furthermore, when datasets were released, records were exchanged to avoid exposing occupancy timelines. CO
2 concentrations, as reported by Schwee et al. [
29], can be anonymized for vulnerable privacy attacks. On odd days (Sunday, Tuesday, and Thursday), the streams of the two successive rows were exchanged at random, whereas on even days (Saturday, Monday, and Wednesday), the streams of the first two rows were exchanged sequentially. Even though it was not taken into account in a recent study by [
8], the researchers decided to include and calculate the humidity ratio from the original dataset stream to improve occupancy estimation accuracy.
3.2. Dataset Pre-Processing
Based on the normality assumption theorem, dataset pre-processing is necessary to ensure that the dataset is normal and does not consist of anomalies that influence the overall accuracy of the estimation method [
20]. Even though it has been noted that, if the sample size of the dataset is 100 or greater, violation of normality is not a serious challenge [
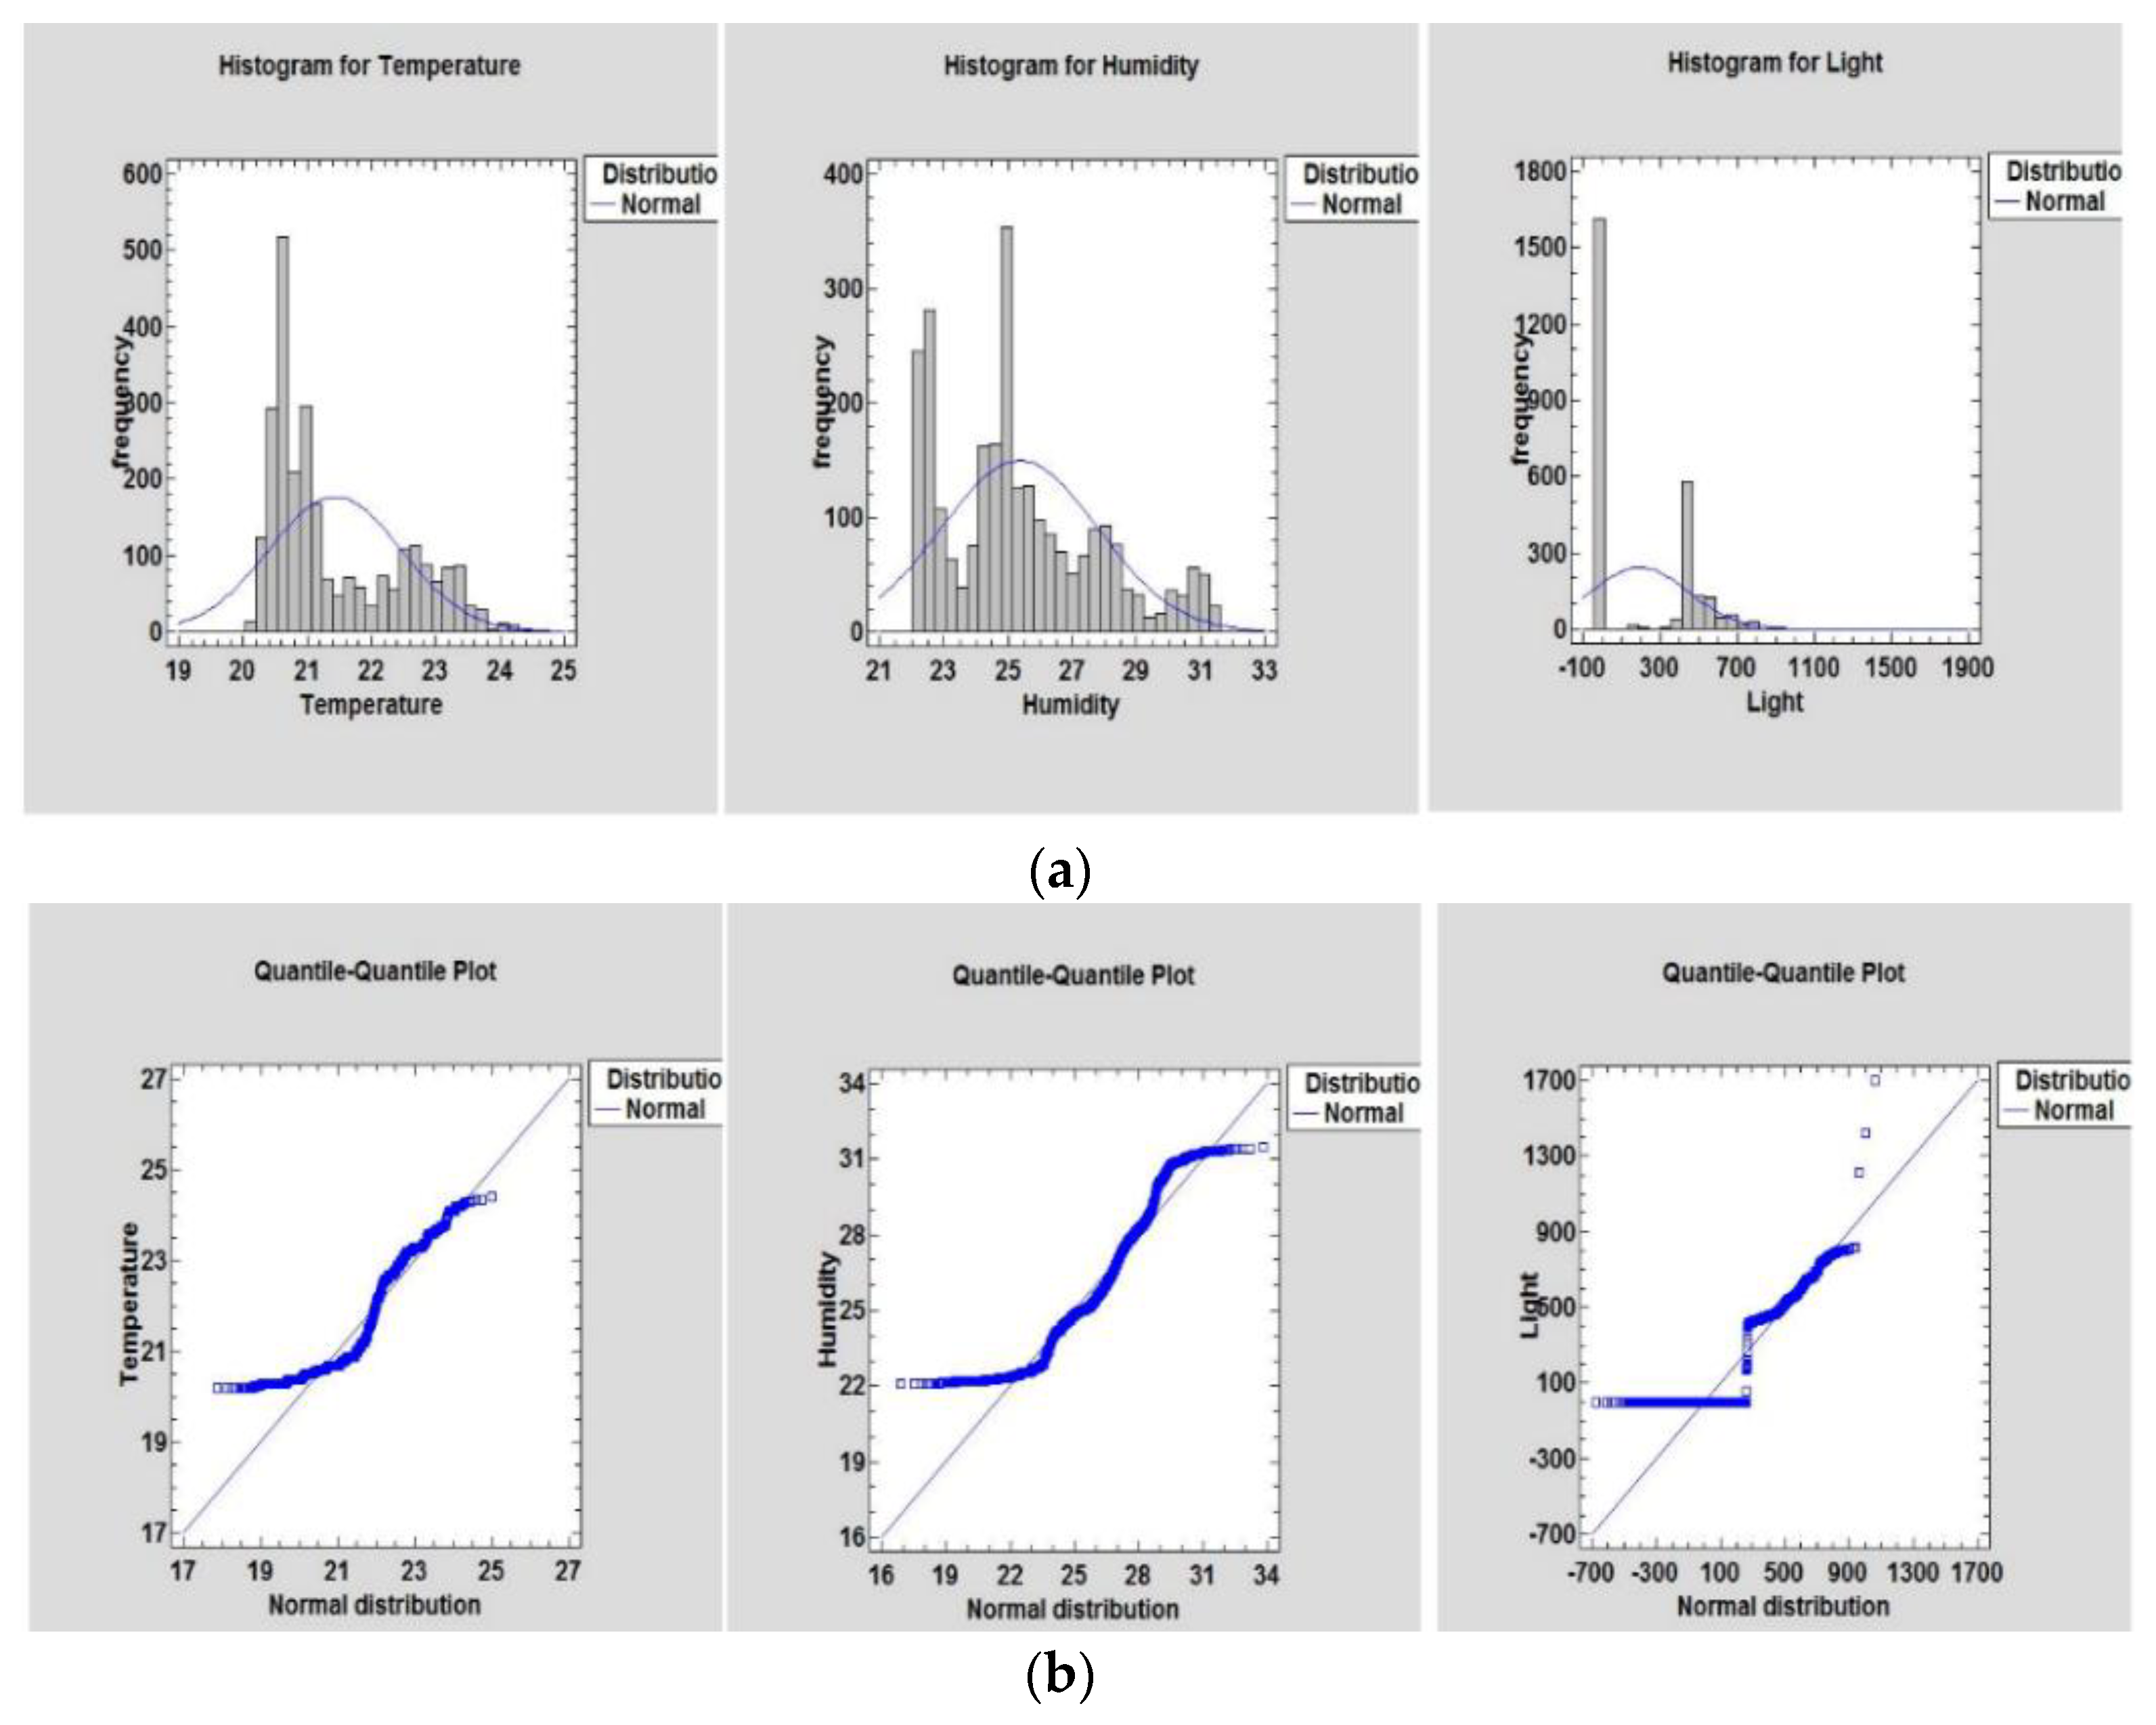
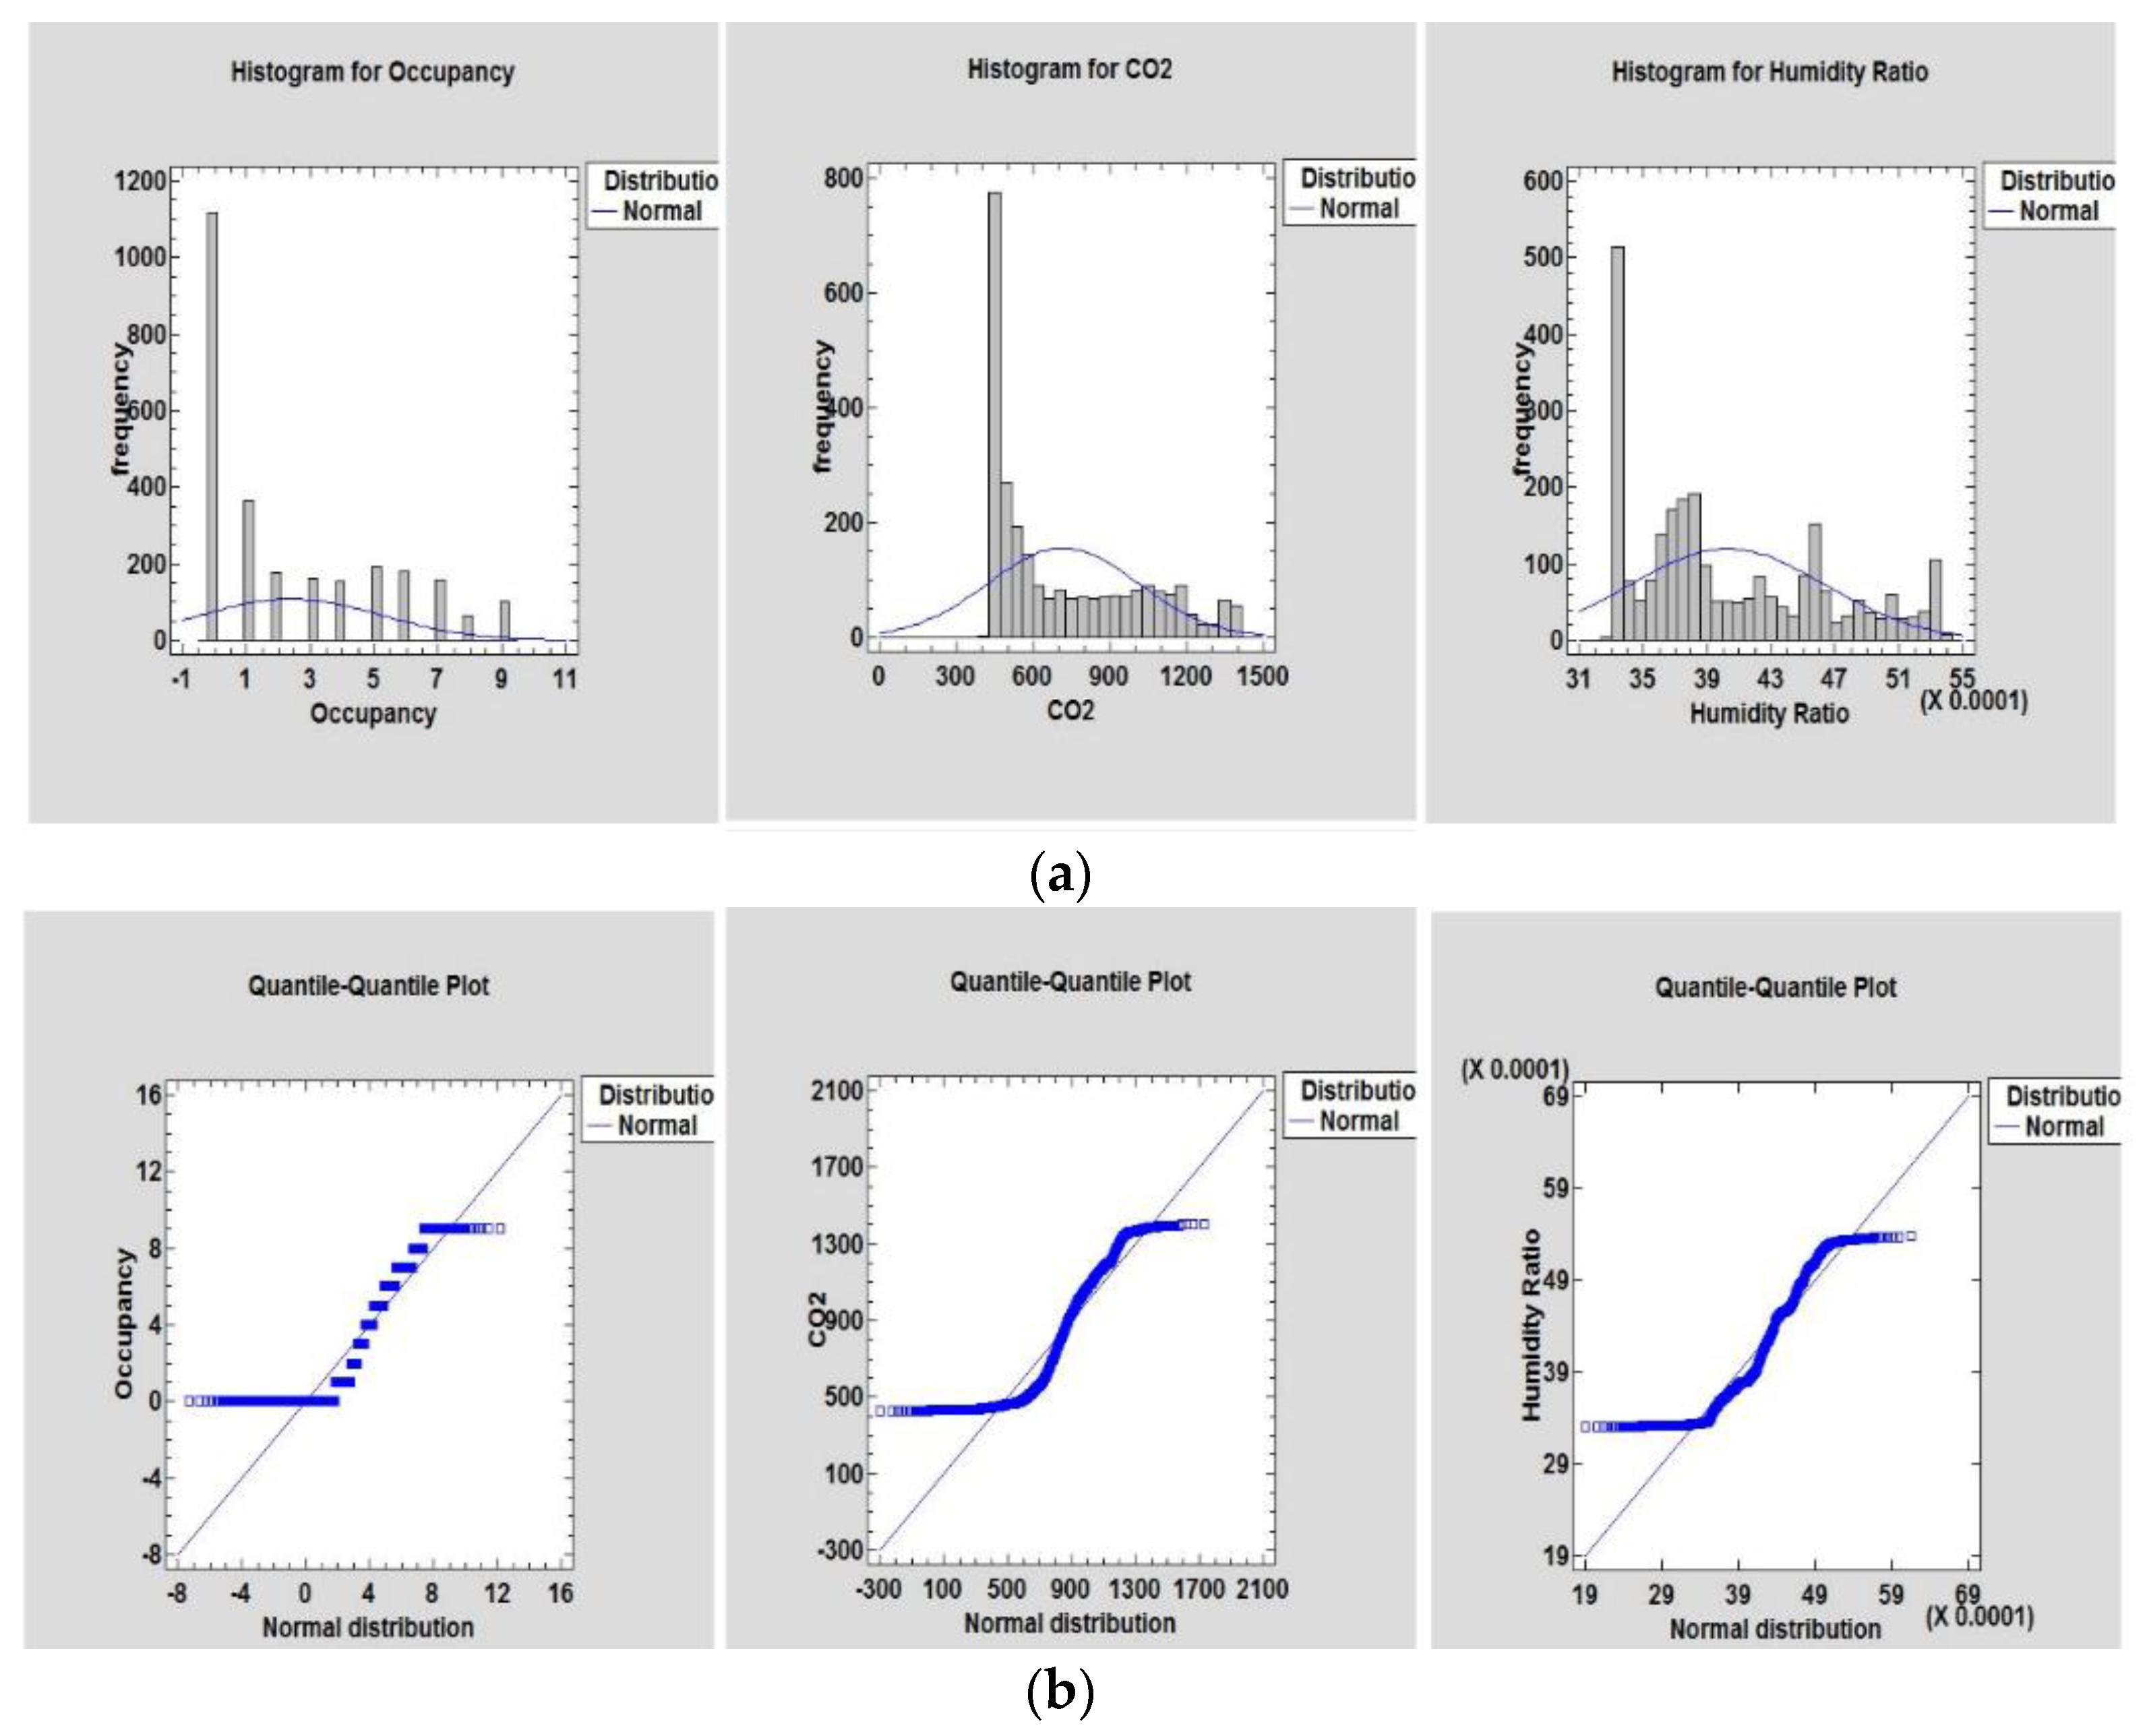
29], the normality assumption should be employed for valid conclusions, irrespective of the sample size. Before analyzing the dataset’s normality, a statistical summary (see
Table 3) and a Q-Q plot (see
Figure 2 and
Figure 3) were performed [
18].
3.2.1. Normality Test
The statistical summary (see
Table 4) approach shows the dataset normality characteristics from statistical terms such as the mean and standard deviation, skewness, and kurtosis. The statistical summary of time streams consisting of 2668 readings on five variables parameters (Date, Temperature, Humidity, Light, CO
2, Humidity Ratio, and Occupancy) is presented in
Table 4.
The standardized skewness and kurtosis determine if the sample has a normal distribution. Notwithstanding, the results’ standardized skewness and kurtosis values range from −2 to +2, demonstrating strong deviations from normality that tend to nullify the normally distributed data theory assumption. Even though the statistical summary provides an unbiased ruling of dataset normality, it may be tolerant to small dataset sample sizes or be overly cautious for large dataset sizes. Because our dataset is not small (it contains over 2000 records), a parametric test was carried out using a graphical Q-Q Plot (see
Figure 2 and
Figure 3). In cases where a statistical summary test can be overly or under sensitive, graphical analysis inspires decisions to assess normality.
However, the graphical representation for assessing normality requires a great deal of expertise to prevent incorrect interpretations. The data for graphic performance is usually presented in histograms or Y and X vectors. According to Gregorutti et al. [
34], suppose
is the variable that depends on the regression matrix of variables
. If
are jointly normal, then
is said to be conditionally on
and
is normally distributed vector. Therefore,
and
can be expressed as:
where
The graphical presentation of the normality distribution of the sample dataset was conducted using the Q-Q plot (see
Figure 2 and
Figure 3).
The graphical presentation sample dataset distribution and normality check were conducted using the Q-Q plot (see
Figure 2 and
Figure 3).
Figure 2a and
Figure 3a show the occupancy present and activities that can influence changes in the indoor surroundings, such as temperature, humidity, lighting, CO
2, and humidity ratio within the building, respectively. A common feature observed on each dataset was the tendency of the similarity of the peak frequency values’ distribution. Similarly,
Figure 2b and
Figure 3b show the normal distribution of the temperature, humidity, occupancy, CO
2, and humidity ratio datasets. A small outlier is observed in the light dataset. This is a result of light penetrating through glass windows when curtains are not drawn or inappropriately drawn. When lighting is observed in a room with empty occupancy, the light sensor assumes occupancy is present. This indicates there is a strong correlation between predicting variables and predictors.
According to the observation in
Figure 2b and
Figure 3b, the dataset points do not entirely conform to the normal distribution comprising slight variance, and thus necessitate data analysis to obtain a Gaussian distribution at this level. After manually inspecting the unfitted points, it was determined that the skew is not induced by inaccurate sensor readings or recordings but is formed unexpectedly and is not inherently a concern that can affect the model prediction results. Unfitted point distributions appear in all variables, with more outliers in the CO
2 and occupancy variables. Many such experiments have shown that approximately 1 in 340 conclusions in a regular distribution would be at least three standard deviations away from the mean [
32]. Randomness, on the other hand, can incorporate outliers in smaller datasets.
3.2.2. Computing Variable Feature Correlation
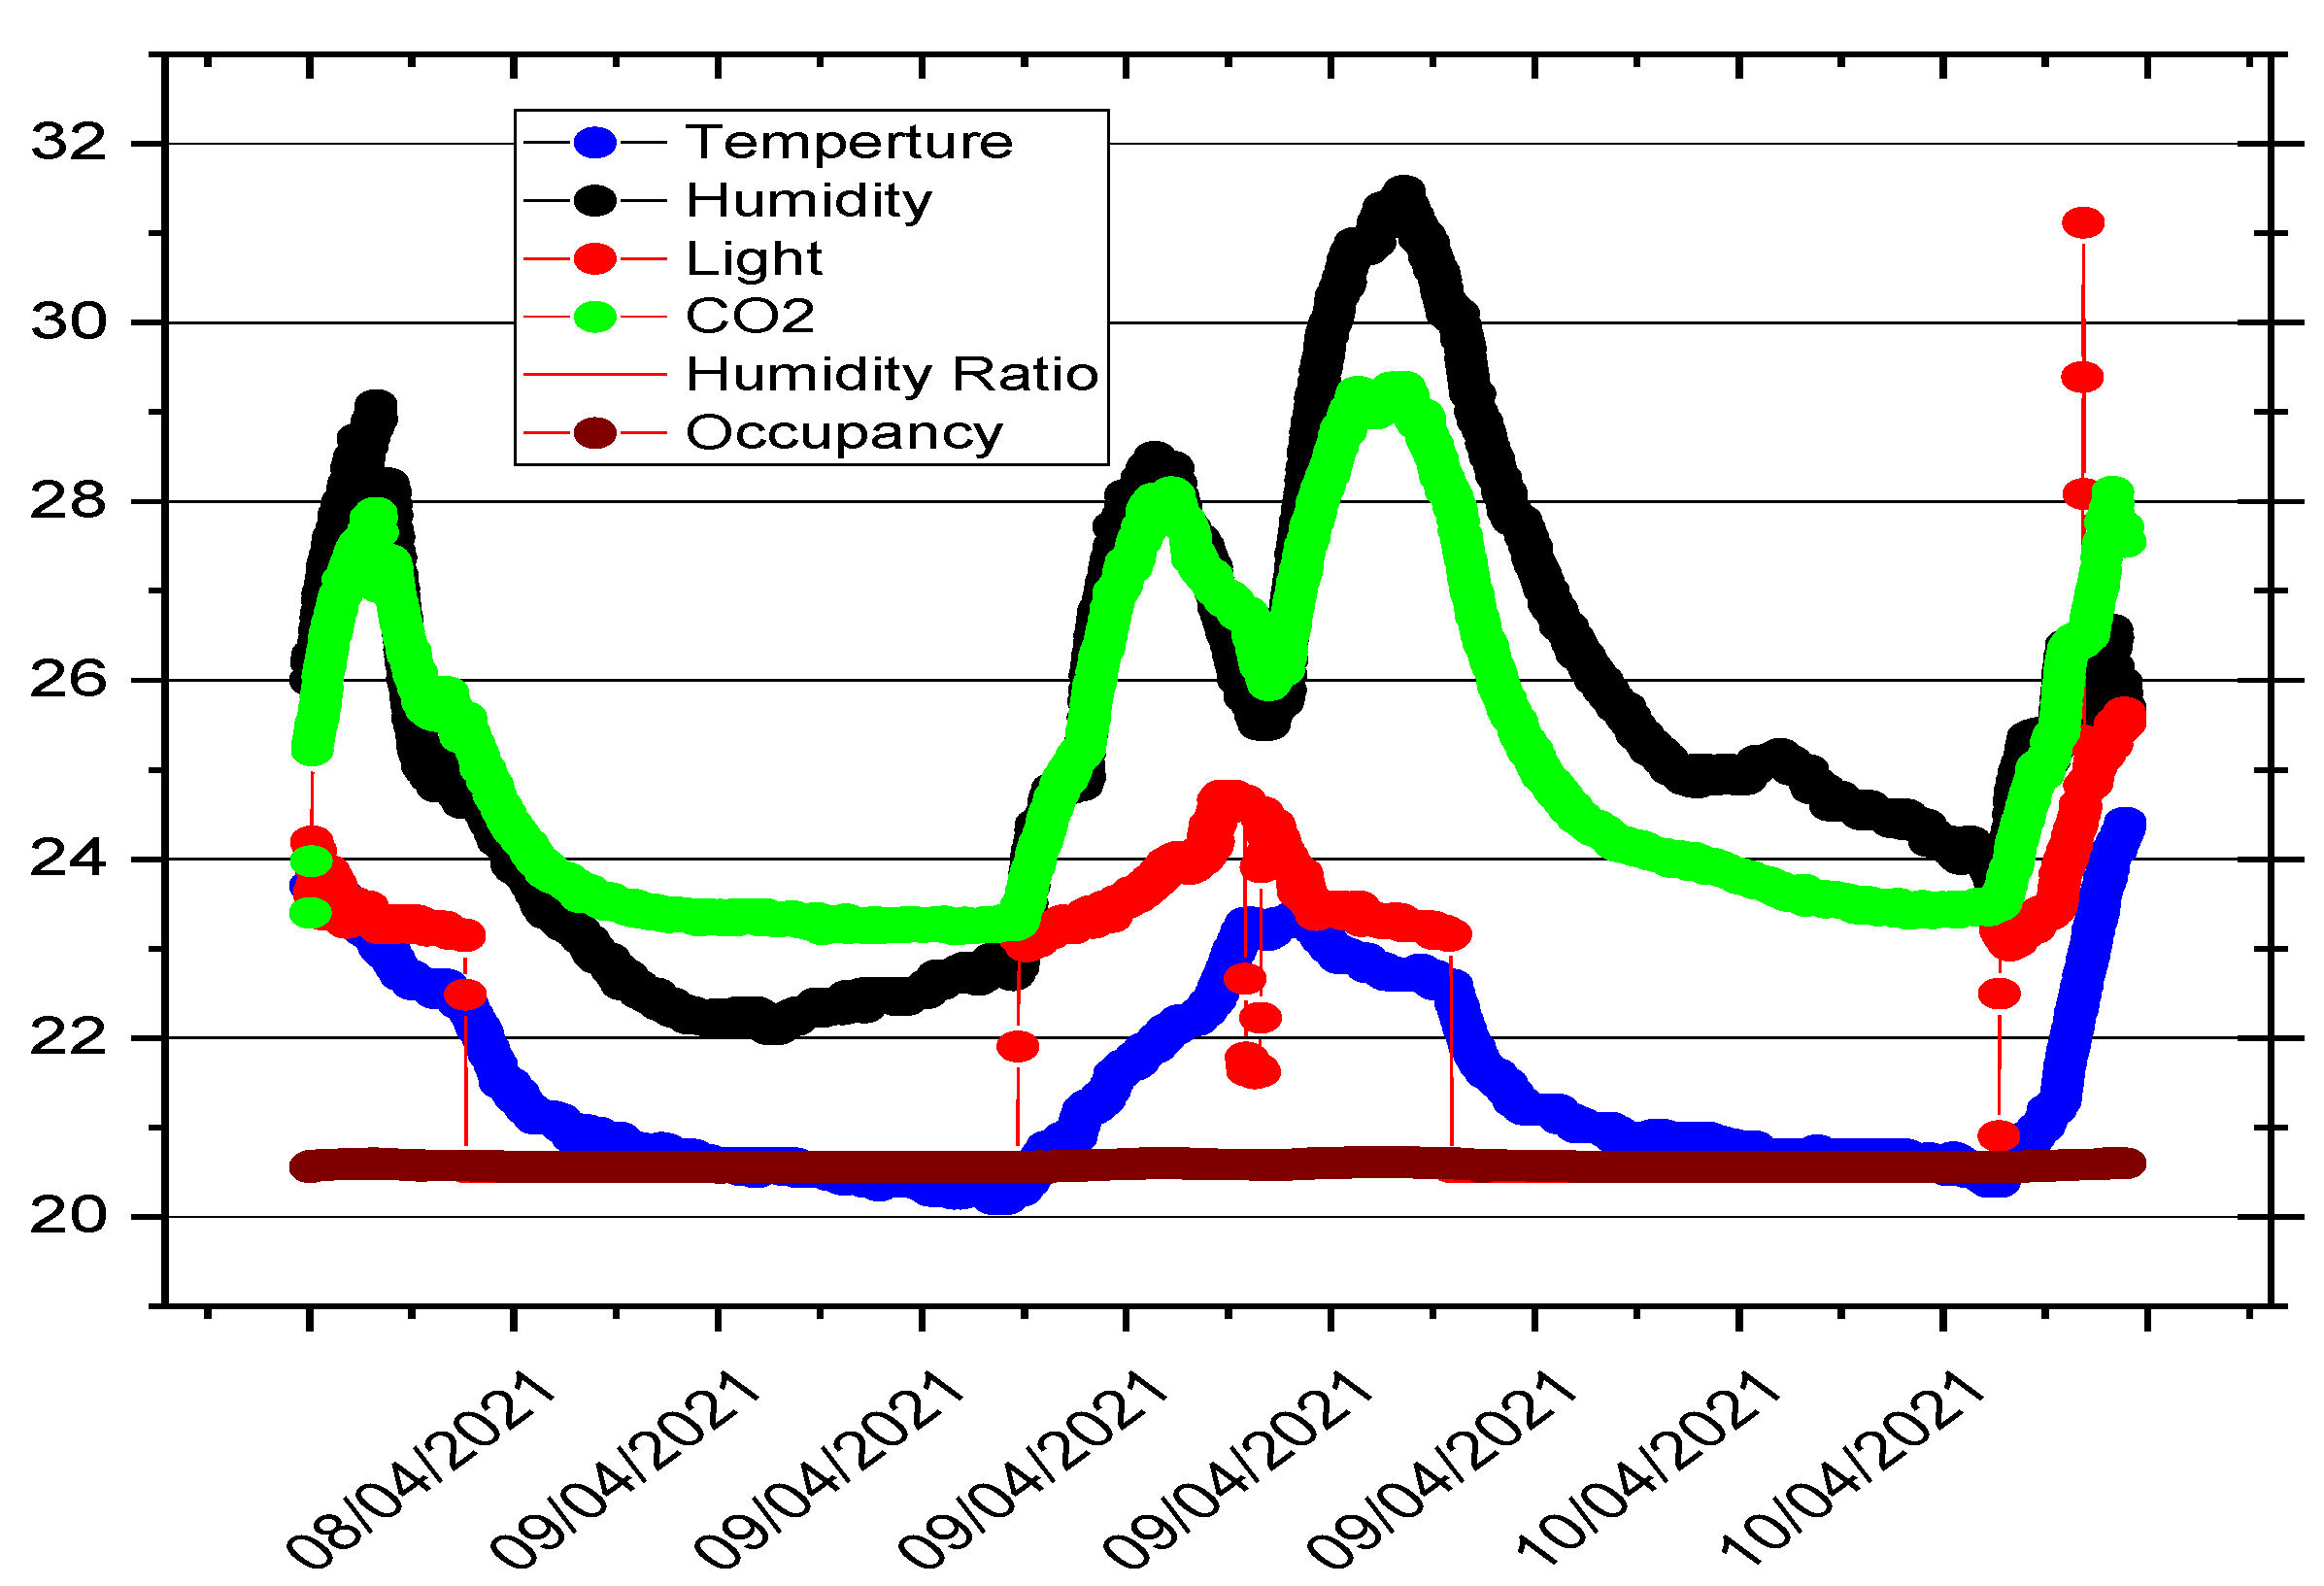
Model feature selection requires variable feature correlation, which can improve model predictive accuracy. The dependence relationship of the predicting variable on predictors was used to evaluate feature correlation.
Figure 4 depicts the distribution of the indoor occupancy variable (predicting variable) to other indoor variables (predictors) during room occupancy.
Figure 4 shows that all variables strongly correlate with room occupation, particularly CO
2 and humidity. The value of the significant correlation between occupancy and other predicting variables, however, cannot be easily determined from
Figure 4.
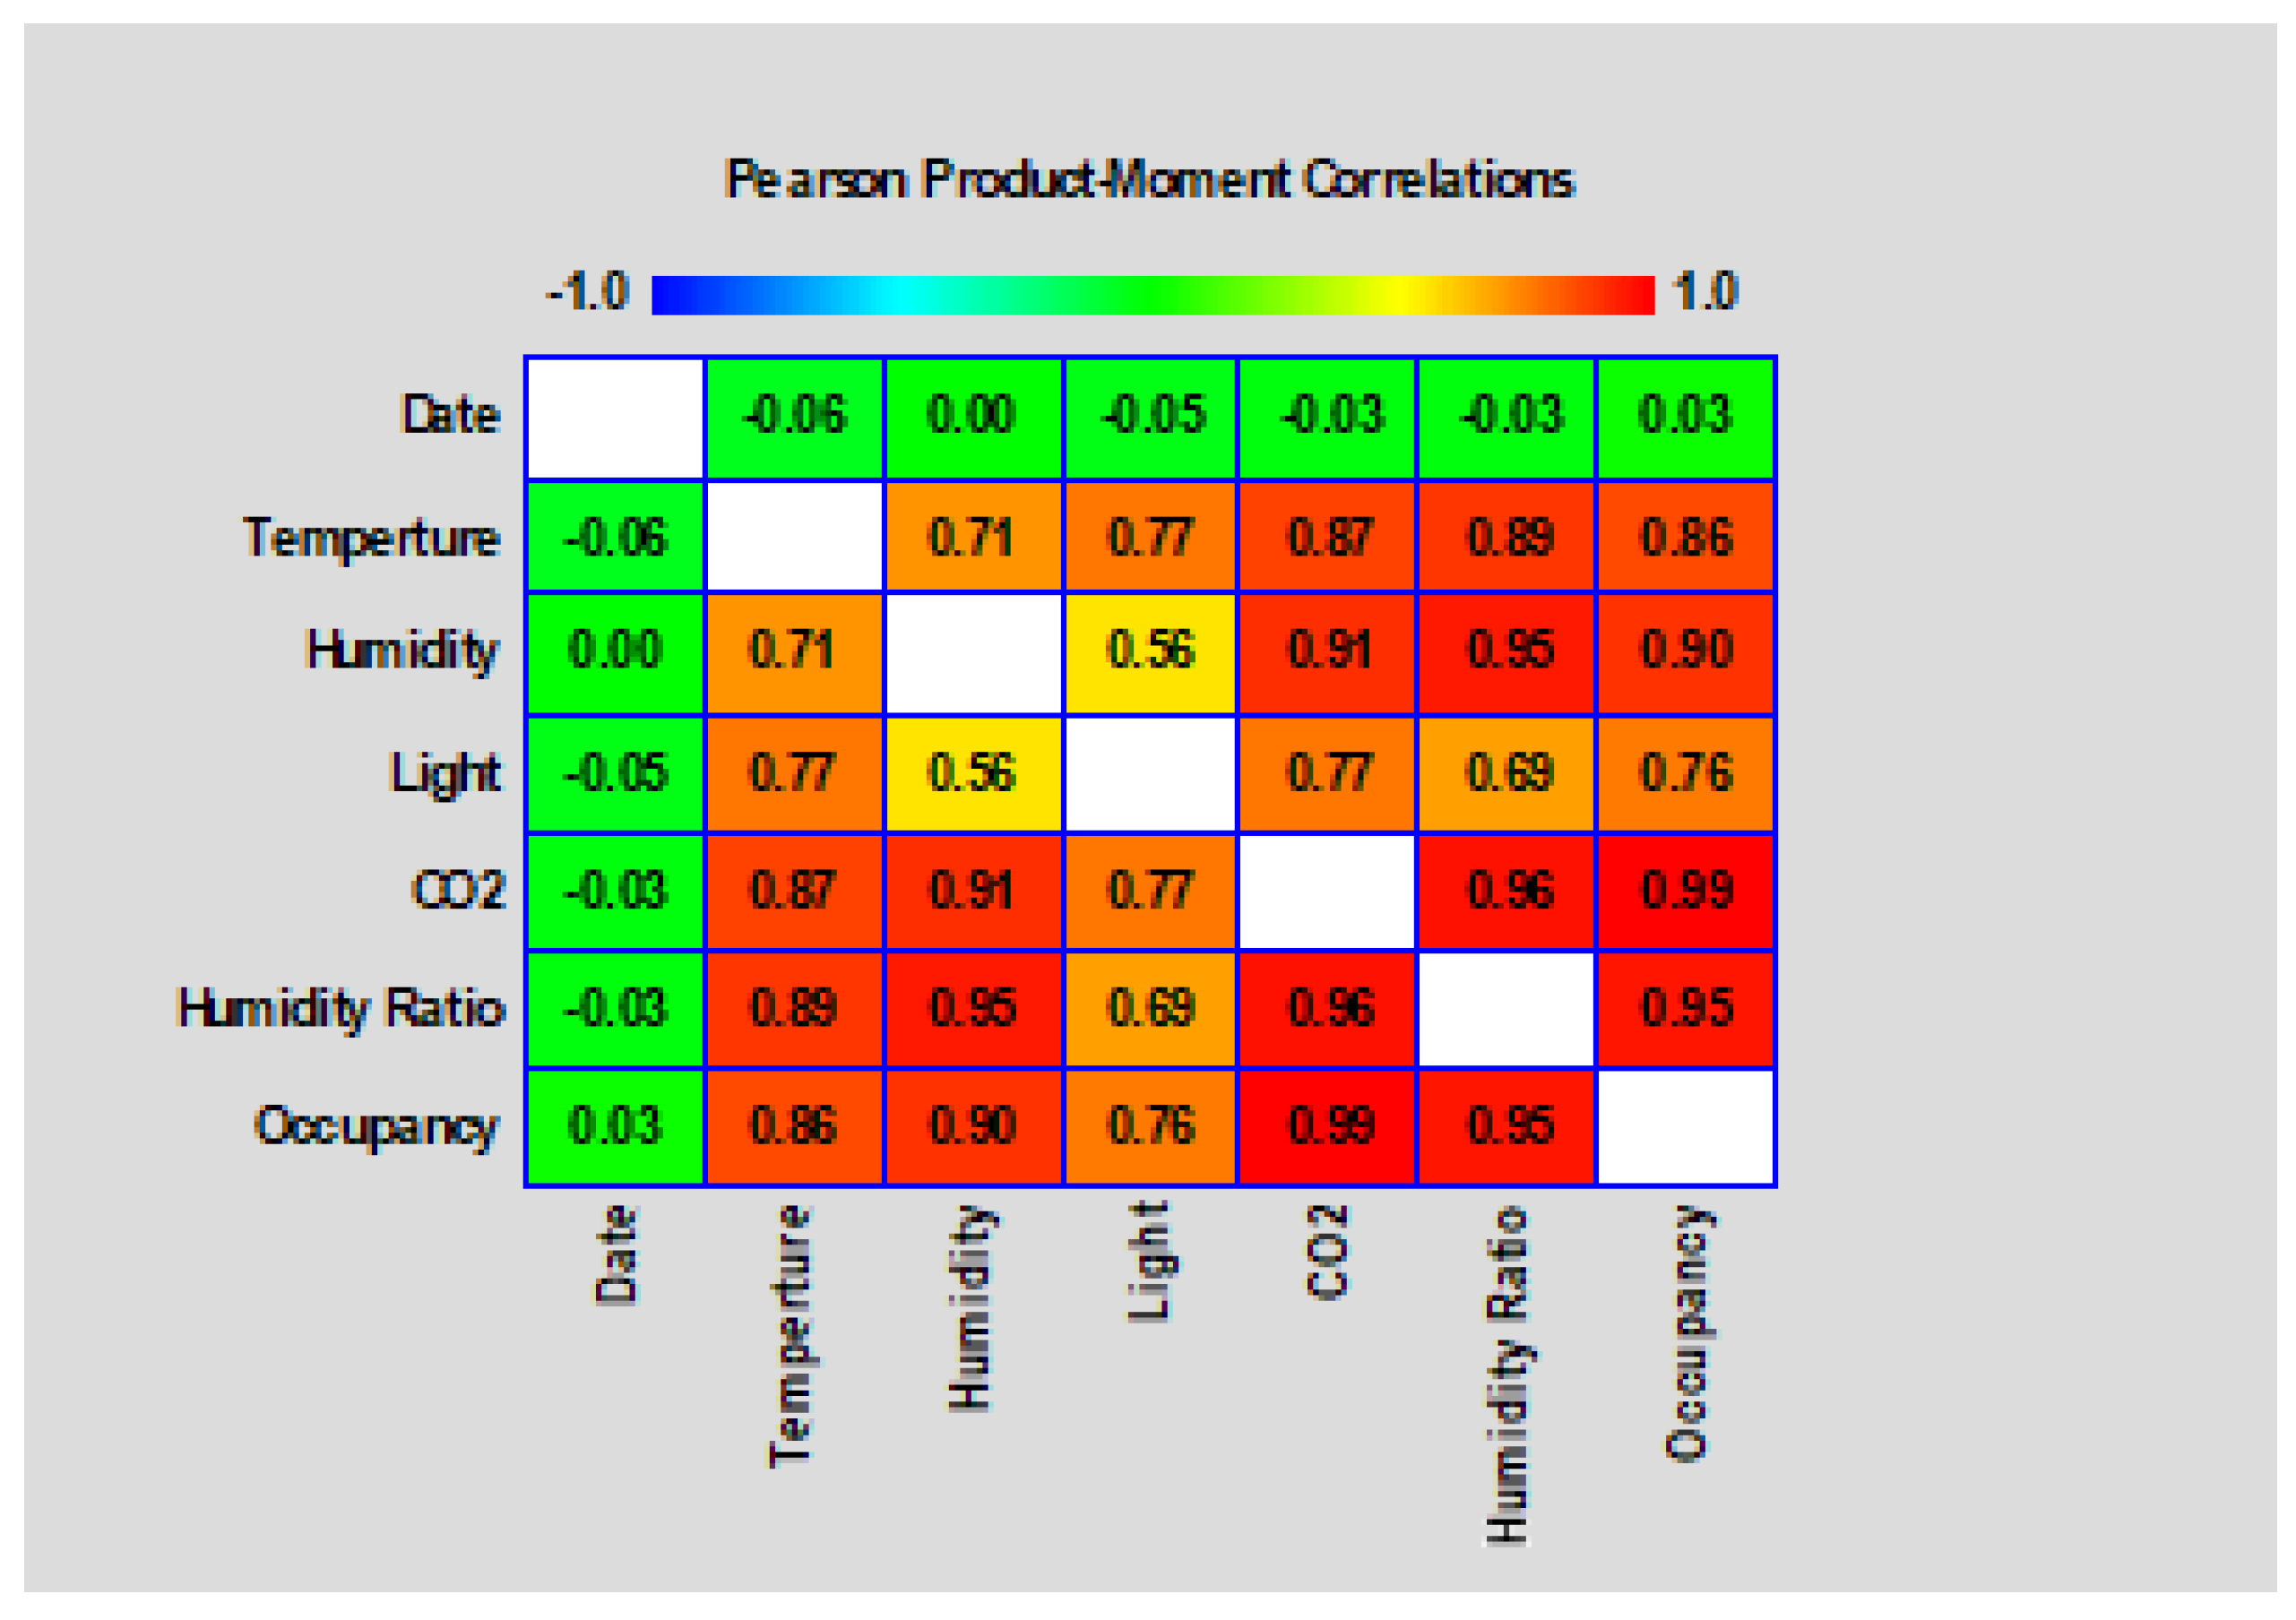
Pearson’s Product-Moment Coefficient (PPMC) was used in this research to calculate the correlation coefficient value. When given a set of paired (x,y) values between −1 and +1, PPMC calculates the dependency strength between the variables x and y [
20,
32].
Figure 5 depicts the computed PPMC values using six variable parameters ranging from −1 to 1. The 1 denotes a strong positive correlation mark colored with a white background color, followed by 0.9 colored with a red background color, and so on, until 0.00 and −0.00 shaded with a green background color denote a weak correlation between the variables.
3.3. Variable Feature Selection
Feature engineering is essential in developing ML models, which requires removing features with weak correlation before deploying the dataset sample into the model for evaluation. A variable importance measure metric in Gregorutti et al. [
34] is considered to remove uncorrelated variables parameters. The theory in Gregorutti et al. [
34] suggests predicting variable Y and predicts
to be a vector of random variables. The rule
in the regression setting for predicting variable Y is a function that can be measured using the values in
The prediction error of
can be defined by
(
) =
and object is to calculate the conditional expectation
=
. Similarly, let
be a set of learning of
replications of
, where
. Since the true prediction error of
is unknown in practice, the observation of a test dataset (
) is considered for prediction and, therefore,
can finally be presented as:
Permutation variable importance is a model inspection technique by Breiman [
35] that has shown proficiency in non-linear estimators such as our model and, therefore, was adopted in this study. The technique considers predictors
as the critical predicting
from Equation (2). If the link between the feature
and
is broken, an increase in the prediction error score may be observed. The score value in the model reflects how much the model is dependent on the feature. This methodology has the advantage of being model agnostic, allowing it to be measured several times with various function permutations. To demonstrate this model, Breiman [
35] randomly permuted the observations of the
’s.
Formalizing the statistical permutation value calculation was conducted as follows: Define a group of out-of-bag samples
. Let
represent permuted out-of-bag samples by randomized permutations of the
variable’s values in each out-of-bag subset. The variable
’s statistical permutation value is defined as:
This quantity is the statistical equivalent of the permutation importance measure
recently formalized by Zhu [
36]. Let
=
be the random vector such that
is an independent replicate of
that is also independent of
and all other predictors, and the permutation significance measure is provided by:
In the expression of
the permutation values of
mimics the identical and independent duplicate of the distribution of
in
. Thus, Equation (4) can compute the correlation index value of predicting variable and independent variable, as presented in
Table 5.
Table 5 displays the predictor’s correlation index in relation to the predictor variable to aid in determining and eliminating predictors with low correlation values. As shown in
Table 5, the variable predictor “Date” has a low correlation index and was thus excluded from the original dataset. The remaining variables can be fed into the model to train it and measure its precision against the test dataset.
4. Experimental Work
4.1. Model Training and Testing
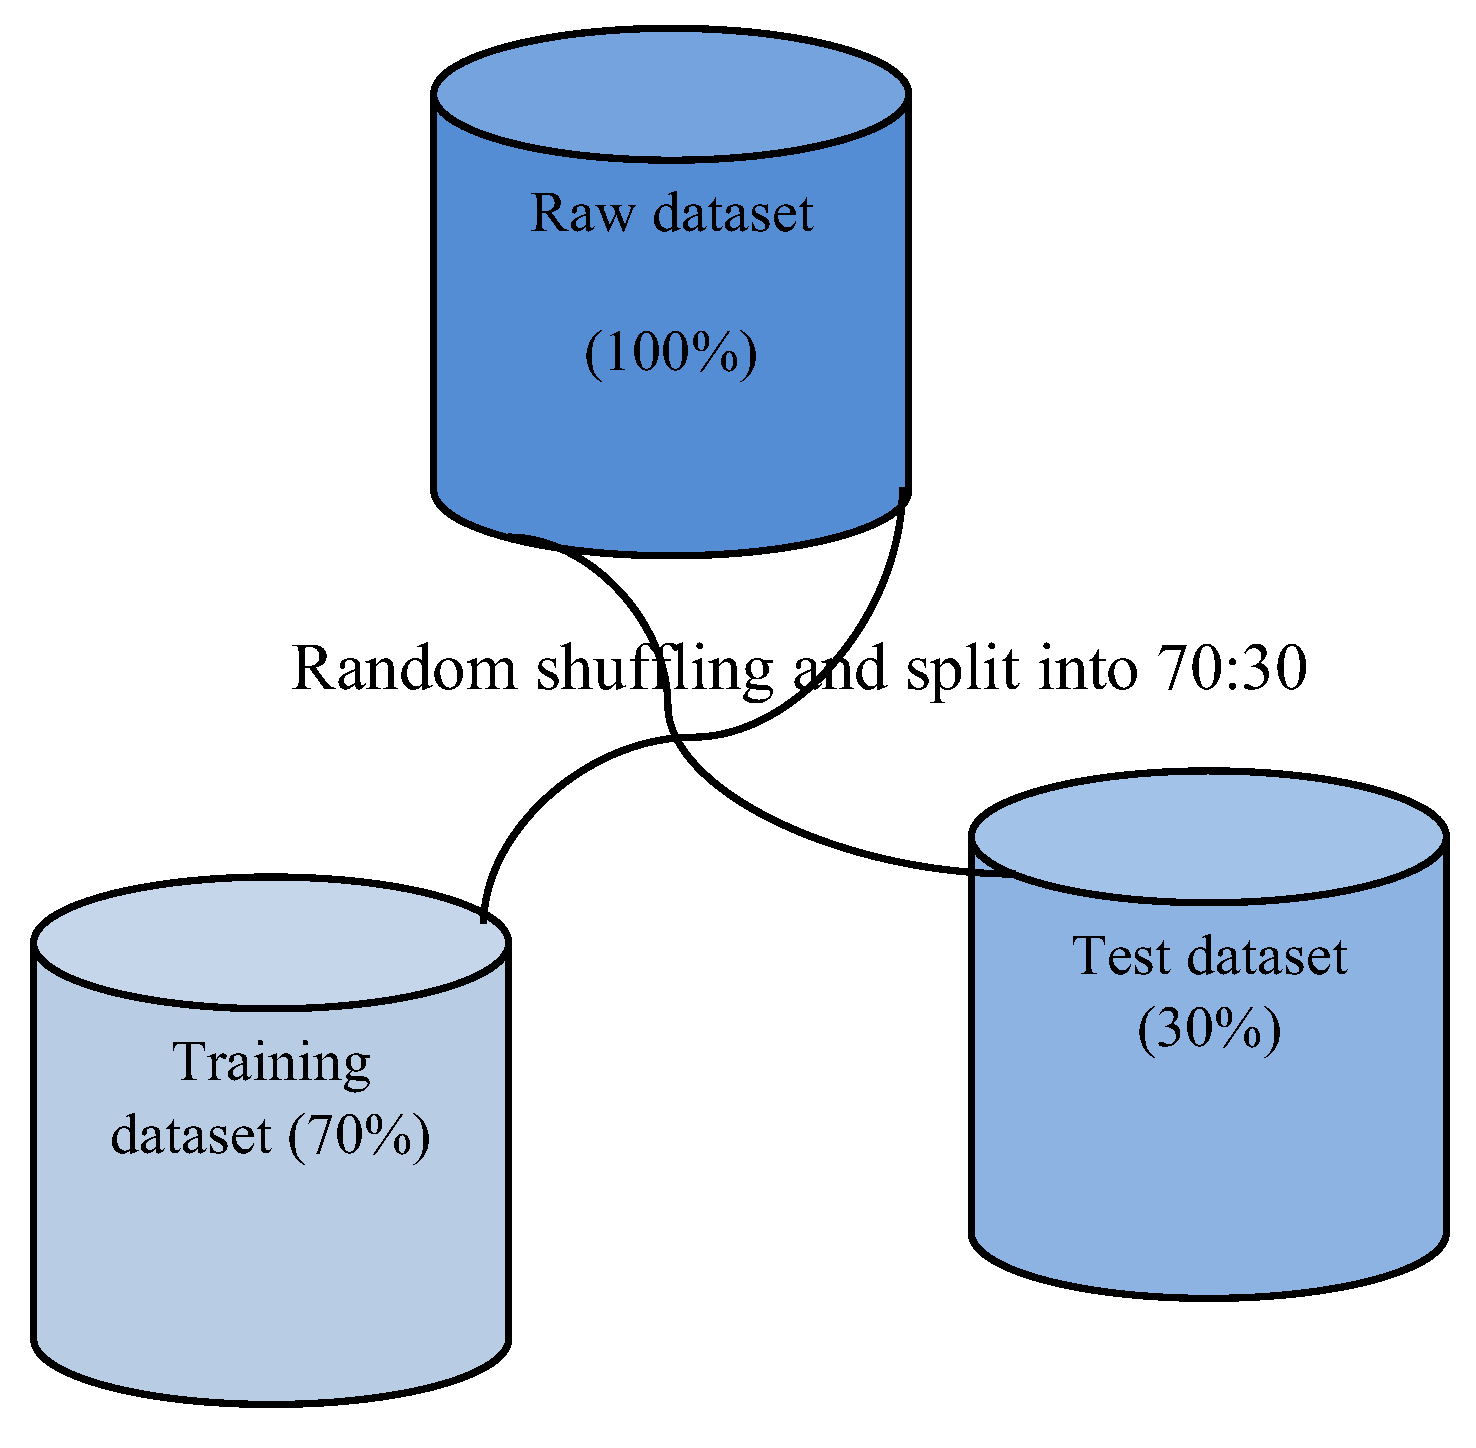
When ML algorithms are used to make accurate predictions on data to evaluate their efficiency, datasets are usually split into training and testing datasets throughout model training. The technique is simple and quick to assessing model prediction performance using various ML techniques and selecting the best techniques for model prediction. The technique involves swapping and dividing the original dataset into training and testing in a 70:30 ratio (see
Figure 6). The first section, the training dataset, is employed to fit the model. The test dataset is used as input to the variables dataset to feed the model, assess prediction, and evaluate the prediction results.
4.2. Machine Learning Occupancy Detection Results
Five candidate ML techniques were selected for further investigation in order to better understand their efficiency in ML, including both occupancy detection and estimation prediction problems. Such techniques are less sophisticated than a lot of the more recent advancements in this field, but they are well-known and frequently serve as efficiency benchmarks. Another benefit of these techniques is that, aside from occupancy detection and estimation, they are fundamental choices for several other applications and, as such, are well-served by ML libraries. The sci-kit learn Python library was employed in implementations in this work, and specifications regarding preset algorithm setups can be observed in the Python Standard Library [
34].
4.2.1. Random Forests
Random Forests (RF) are a set of decision trees that are used consecutively from a root (parent) node to a terminal (or child) node to predict the actions exhibited by the trained data [
31]. To fit training datasets by related features, this technique has multiple conditional rules, which may be as simple as correlating a sensor reading to a threshold. Bootstrap sampling, also known as bagging [
31], is used for both deep and very deep trees, which essentially uses two-thirds of the training samples for prediction and the remainder for evaluating predictive performance.
Table 6 depicts the outcome of this technique.
As can be seen in
Table 6, the RF classifier was evaluated to assess its performance prediction on new data. In many cases, the ML classifiers can perform well when tested with the original training dataset and performed differently with a new dataset. Therefore, the scoring bin in
Table 5 holds the dataset record split into the training and testing datasets. The accuracy of the binary prediction analysis shows a strong positive prediction rate with accuracy performance ranging from 58.3% to 99.6% for accuracy, 73.6% to 99.7% for F1 score, 58.3% to 99.9% using precision, and 97.8% to 100% recall.
4.2.2. Naive Bayes Classification
Naive Bayes Classification is one of the strongest and most efficient classification algorithms (NBC). The algorithm is based on Reverend Thomas Bayes’s [
34] Bayesian Theorem of Probability. According to the theorem, the probability of a hypothesis is a feature of subsequent facts and previous experiences. It is a method for determining how a new piece of evidence directly impacts the probability that a hypothesis is correct. It has been used in a variety of applications. Often these ML techniques in real-world applications focus on learning in a continuous feature set.
Table 7 depicts the efficiency of binary occupancy prediction using NBC.
As can be seen in
Table 7, the RF classifier performed slightly better than the NBC classifier as a result of the presence of a negative rate. The performance results of NBC range from 58.3% to 99.1% for accuracy, 73.6% to 99.2% for F1 score, 58.3% to 99.9% using precision, and 87.4% to 100% recall.
4.2.3. Support Vector Machine
To draw conclusions, the Support Vector Machine (SVM) algorithm does not make the same hypotheses as the LDA model. This method finds the limit that greatly increases the difference among the groups to be partitioned, which is always obtained in a high-dimensional space. The limit is found by matching the data samples with a predetermined kernel function, which notifies the correlation of neighboring data. Linear, polynomial, sigmoid, and radial basis functions are examples of kernels. The kernel in this approach is the radial basis function. This method uses only the data samples closest to the edge, which does not require the entire dataset to be covered to make decisions.
Table 8 depicts the SVM efficiency for binary occupancy prediction.
The data presented in
Table 8 indicate the performance of SVM classifier is a little bit low compared with the RF and NB classifiers due to the high negative rate results. The result analysis shows that the SVM performance results range from 58.3% to 86.7 % for accuracy, from 73.6% to 87.7 % for F1 score, from 58.3% to 99.9% using precision, and from 72% to 100% for recall.
4.2.4. Artificial Neural Networks
Artificial Neural Networks (ANNs) are biologically based structures designed for modeling problem estimation by predicting various variables using sample data during training. The neural net scheme uses a series of dependent and independent variables to learn the model responsible for data. Individual neurons make up these networks. Typically, the weights of neural connections are calculated using specific learning rules. The dataset is used to test a neural net with two hidden layers, each with the same neuron number mixture. The backpropagation algorithm is used to comprehend, and network errors are propagated backward from the output layer to the input layer. The data are simply handled within the network’s layers, and the weights of each neuron are changed to reduce the mean-squared error between the variables t and the target based on a given precision index or after a set of iterative learning processes is completed.
Table 9 depicts the outcome of the ANN efficiency for binary occupancy prediction.
As can be seen in
Table 9, the RF classifier performed slightly better than the ANN classifier, with performance results ranging from 58.3% to 99.1% for accuracy, from 73.6% to 99.2% for F1 score, from 58.3% to 99.9% using precision, and from 87.4% to 100% for recall.
4.2.5. Logistic Regression
Logistic Regression (LR) predicts a dependent variable with two alternative values output and one or more independent variables in logistic configurations. The dataset is used to assess the independent variables, traditionally using a maximum-likelihood calculation to identify which is adequate in predicting depending on the variable. When no or few correlations and variable transformations are used, the potential model sophistication in logistic regression is low.
Table 10 depicts the efficiency of binary occupancy prediction using LR.
5. Evaluation Metrics
When testing new data, it is critical to evaluate model performance on specific ML techniques in order to determine which technique is more efficient for occupancy detection and estimation. Typically, the precision metric alone cannot provide sufficient information for this decision; thus, other metrics members are taken into account as described in this section. Traditionally, a single metric cannot provide adequate knowledge for model performance. As a result, other metrics are taken into account.
5.1. F-Score
Having an ultimate metric to trade off precision and recall efficiency by assessing a single grade value score is critical. As a result, combining the precision and recall metrics makes sense.
5.2. Mean Absolute Error
The magnitude of the difference between the model prediction observation and the actual value of that observation, calculated for the entire group, is referred to as the mean absolute error (MAE). MAE can be expressed mathematically as:
5.3. Root-Mean-Square Error
The Root-Mean-Square Error (RMSE) measures how far projections differ from the actual values. The residual difference between prediction and ground truth for each data point, whether during testing or cross-validation. RMSE can be expressed mathematically as:
5.4. Relative Squared Error
Relative Squared Error (RSE) is straightforward measurements that simply measure the average of the actual values. Thus, the relative squared error normalizes the overall squared error by dividing it by the total squared error of the simple predictor. RSE can be expressed mathematically as:
where P
ij is the predicted value by the model i for sample set j (out of n sets); T
j is the target value for record j; and
is given by the following equation:
5.5. Relative Absolute Error
When a mean error is compared to errors produced by a negligible or naive model, relative absolute error (RAE) is expressed as a ratio. RMSE can be expressed mathematically as RAE, which is expressed mathematically as:
5.6. Coefficient of Determination
The coefficient of determination (CD), also known as R2, describes how well a model performs when replicating observed results. It provides information on the likelihood of certain events occurring within the expected outcomes. CD can be expressed mathematically as:
5.7. Average Log Loss
Average log loss (ALL) is a method for evaluating model prediction efficiency based on the likelihood of a record being classified in a specific class and then assigning the data point to one of two classes (1 or 0) based on whether the probability exceeded a threshold value. ALL can be expressed mathematically as:
where:
6. Machine Learning Occupancy Estimation Results
Unlike the occupancy presence detection problem, in occupancy estimation, the model uses data from five predicting variables that are jointly correlated and combined to estimate the number of occupants present in the room to ensure the model produces reliable results on a new dataset. The model evaluation results on five ML techniques are presented in
Table 11.
The model performance evaluation using various performance measures presented in
Table 11 indicates that the proposed approach achieved high performance using RF compared to other ML models. For example, they demonstrate excellent performance with an F-Score value of 0.993 and an MAE of 0.019526. The literature indicates that the performance of most of the existing environmental sensing approaches tends to reduce as the number of occupants increases in the building due to the low quality of training dataset or lack of strong variables correlation between predicting variables and predictors. The proposed approach utilizes the historical occupancy data from sensors (CO
2, occupancy numbers, and occupancy correlations with building environmental variables) through continuous occupancy monitoring and machine learning techniques. It provides excellent prediction with minimum MAE error when the occupants’ number are more than seven in the building.
7. Comparison of Machine Learning Occupancy Prediction with the Existing Literature
CO
2 is one of the significant environmental parameters that modify the indoor condition to indicate occupant presence in the building. Thus, its application for occupancy detection has been fully utilized in the literature presented in
Table 12. Regarding the classifier’s performance presented in Abade et al. [
7] for occupancy, detection is very poor, with an F-Score value of 6.59% using CO
2. The authors reported that the prototype testing was conducted in a chemical laboratory and was expected to have a good performance in a non-chemical environment. This is because the classifier produces a higher performance when tested using temperature and light parameters (see
Table 12). The F-The scores achieved by the proposed classifiers using CO
2 demonstrate that it is possible to reach a high -performance accuracy for occupancy detection using the RF, SVM, ANN, NBC, and LR algorithms, which is closely aligned with the performance values reported in [
8,
32,
33].
Much of the environmental sensing literature uses two or more indoor variable conditions for occupancy estimation. The prototype proposed in Abade et al. [
7] was tested in commercial buildings using LR, ANN, RF, and SVM for occupancy estimation with prediction performances of 89.7%, 6.59%, 1.28%, and 95.6%, respectively (see
Table 12). The authors noted that the lack of variable correlation between the predictors and predicting variables contributes to a poor model performance. In comparison, the proposed version on occupancy estimation using LR, ANN, and SVM is 96%, 98.9%, 99%, and 87%, respectively (see
Table 12). The research work in [
8] obtained an accuracy of 85–97% for occupancy estimation using the linear discriminant analysis model (see
Table 12). The model performance can be compared with the results obtained in the proposed model using SVM and LR due to the classifiers’ linearity, which reached F-Score values of 87% and 96%, respectively.
Furthermore, the model performance was also tested using classification and regression trees, and the accuracy obtained was around 86–99.3%. In comparison, our model scored 87–99.35% using RF. Similarly, ANN demonstrated an accuracy of 89% in the work of Candanedo and Feldheim [
8], and our ANN model reached 98.9%.
In [
32], the authors demonstrated a correlation between the five indoor predictors that can be used to estimate the occupants’ number in a building. Instead of ML techniques, their approach used statistical analysis correlation coefficients to measure the room occupancy. The CO
2 parameter was concluded to have the highest prediction accuracy among the five parameters considered. The authors developed prototypes and tested them in three different rooms with random occupants. The results indicate that CO
2 obtained an accuracy of 87.7% in room 1, 89.2% in room 2, and 80.65% in room 3 (see
Table 11). Compared with our approach, CO
2 achieved a 99% correlation between CO
2 and the occupant number.
The proposed approach prototype by [
33] was tested in an office environment to demonstrate its performance. The occupancy estimation performance using CO
2 features produced a higher accuracy of 98.12% for occupancy detection and 81.67% for occupancy estimation, followed by relative humidity (see
Table 12). The temperature and pressure feature results were discarded due to the low influence in estimating the occupant number. The proposed model achieved an accuracy of 99.7% for presence detection and 99.35% for occupancy estimation.
8. Application of Occupancy Prediction
The application areas or services that occupancy prediction technologies provide their users include healthcare, security, and resource management. The following are brief descriptions of the key application areas of occupancy prediction.
Elderly persons and some patients want to live independently at home. Keeping them safe at home implies monitoring and telecare, which might be achieved via smart home technology. Examples of healthcare and elderly care services include fall detection, health monitoring, and medication administration. These services should be provided without disturbing the user, without being intrusive, and without restricting movement. Numerous research works have covered various types of these services.
Another significant function of occupancy prediction is to provide smart home technology to its users with security. Traditional home security systems aid in the protection of the house against intruders. However, smart home alarms offer additional benefits such as fire and smoke detection, intruder detection, and home monitoring and surveillance.
Energy management and water are critical resources in smart home systems. Effective resource management is essential for creating more sustainable and cost-effective smart homes. As a result, many study efforts in the field of smart homes concentrate on monitoring resident resource consumption, anticipating requests, and proposing novel algorithms for increasing resource usage in smart homes.
9. Research Implication
The current study adds to the existing body of knowledge on the issue of occupancy prediction. It can help not solely the relevant research and academic sector, as well as smart building engineers and manufacturers, but also the larger building industry players on several fronts.
First, this paper presented a thorough overview of the literature on various occupancy prediction systems. The existing work, for example, primarily focuses on invasive technologies or applications that do not provide or ensure occupant privacy. Drawing on the literature, the limits of occupant privacy should be defined in terms of technical solutions, which has particularly suffered from a lack of attention in occupancy prediction research.
Second, it described a data collection and feature selection technique for determining the variable with the highest correlation. Additionally, this study provided insights into how to choose an ML method for efficient occupancy prediction.
Third, the current study proposed future research suggestions to enhance the functioning and applicability of occupancy prediction.
Lastly, the study might be broadened to include longitudinal and comparative data. In this situation, for example, we hypothesized the existing solution’s thermal comfort and possible energy efficiency levels. More research might improve this element by supplying helpful information for selecting the appropriate methods and datasets. Further investigations may adopt an adaptive strategy, asking whether specific algorithms or methodologies have drastically changed inefficiency in recent decades, which would aid those responsible for choosing or building realistic control systems.
10. Research Limitations
The concept of building occupancy prediction is not a simple process. The proposed approach reported an accurate number of occupants when there is an occupancy overlapping in the building. As a result, our research provides an opportunity for future research to improve occupancy prediction using crowd sensing or another viable approach.
A large-labeled dataset is required for reliable occupancy prediction. However, labeling the occupancy dataset is time-consuming since it usually involves occupant participation. Even though the approach succeeded in ensuring only high-quality datasets are recorded for training, it requires occupants to respond with an available number of occupants in the building each time the environmental sensor records data. Therefore, the current interactive learning strategies require further study to record occupancy data without occupant interaction.
Most anomalies observed during data collection come from the light-variable sensor due to outside light reflection. Currently, the proposed approach does not feature intelligence to ignore outdoor brightness when the indoor light is turned off.
11. Conclusions
Occupancy detection and estimation can support building infrastructure to improve DCA to trade off between energy consumption and thermal comfort in a smart building. Occupancy privacy is critical, especially in residential buildings, and for this reason, the application of many of the proposed occupancy estimation approaches that use invasive technologies, such as cameras and wearable Wi-Fi routers, is not practically suitable for residential environments. For this reason, the environmental sensing approach has received considerable attention. However, the performance of environmental sensing is relatively poor, as reported in the literature, due to the poor training dataset, lack of strong feature correlation between predictors and predicting variables, and inappropriate selection of ML techniques in the prediction model. This makes it difficult to evaluate the efficacy of different ML techniques.
This study offered a direct comparison of five different ML techniques on occupancy detection and presented an estimation approach that used data from five sensor streams strongly correlated with the occupancy in the building. A model prototype was developed, trained, and tested with five popular ML techniques for performance evaluation. The model demonstrated a good prediction performance across the different ML techniques. It indicates RF outperformed in both occupancy detection and estimation, with an overall performance of 99.7% for occupancy detection and 99.3% for occupancy estimation. Moreover, the results demonstrated that incorporating more variable parameters with a strong correlation alongside the ML method can help to improve occupancy prediction problems rather than using a single variable parameter or directly using data from the sensors. Additionally, multivariable parameters or a complex model do not necessarily mean a higher prediction accuracy can be achieved without validating the quality of the training dataset.
The results also confirm that, without the exception of the proposed model, environmental sensing approach performance tends to be reduced or introduce errors in the prediction as the number of occupants grows in the building. It was observed that, during the experiment, the level of CO2 is significantly reduced when a door or window is open as well as when the kitchen or bathroom is opened. This problem needs further study and analysis to be carefully addressed.
12. Future Work
Research on building occupancy prediction has placed more emphasis on and has a growing interest in the fusion of two or more approaches to improve building infrastructure, enabling smart indoor comfort and energy control. However, despite the efforts of numerous academics to tackle this issue, little emphasis has been placed on developing an approach that generates an occupancy dataset that allows the performance comparison of different machine learning algorithms and ranks them based on their performance.
There is, however, a limited number of publicly accessible datasets for occupancy prediction to support building energy management. Therefore, future work includes the following:
- i.
Research will have considered more datasets generated from various buildings for occupancy prediction.
- ii.
This work employed a simple way to predict building occupancy. This approach can be extended in diverse applications, such as building evacuation and emergency, to provide more information about the exact number of occupants in a building and their specific locations.
- iii.
The work can be extended to minimize building energy consumption and ensure satisfactory comfort levels.


 ,
, 


