


Small-Scale Solar-Powered Desalination Plants: A Sustainable Alternative Water-Energy Nexus to Obtain Water for Chile’s Coastal Areas
 ,
,  ,
,  and
and
Abstract
:1. Introduction
2. Methods
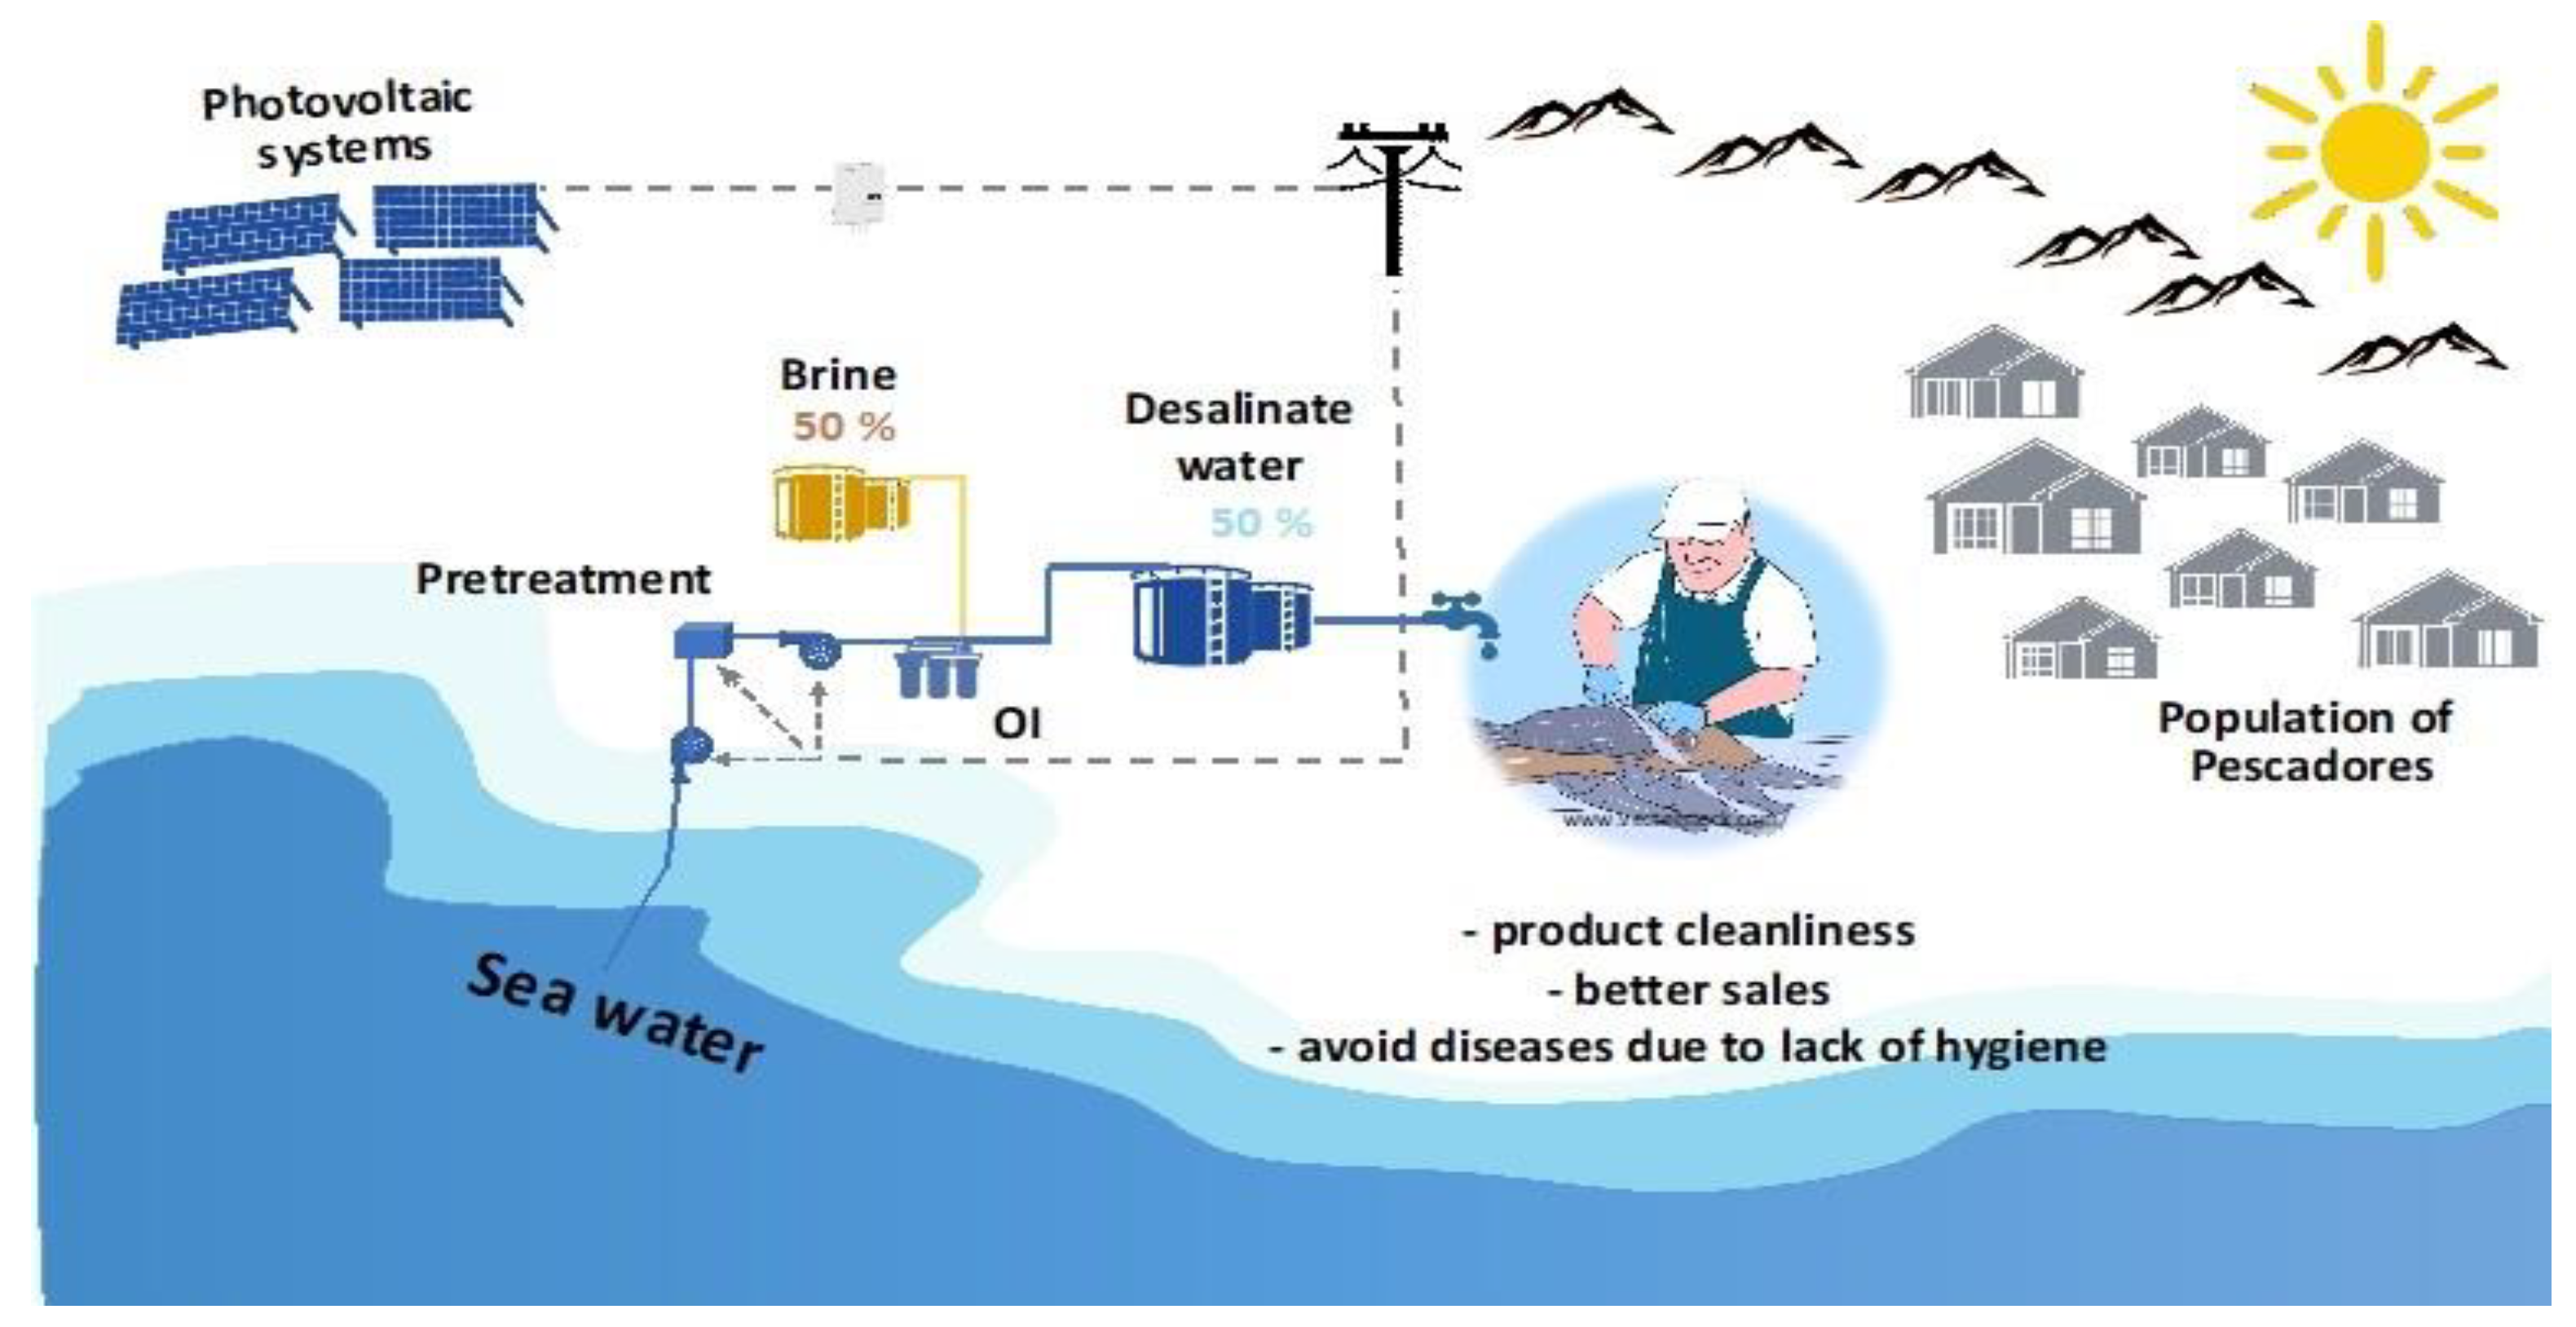
3. Water-Energy Nexus: Desalination Technology/Photovoltaic System
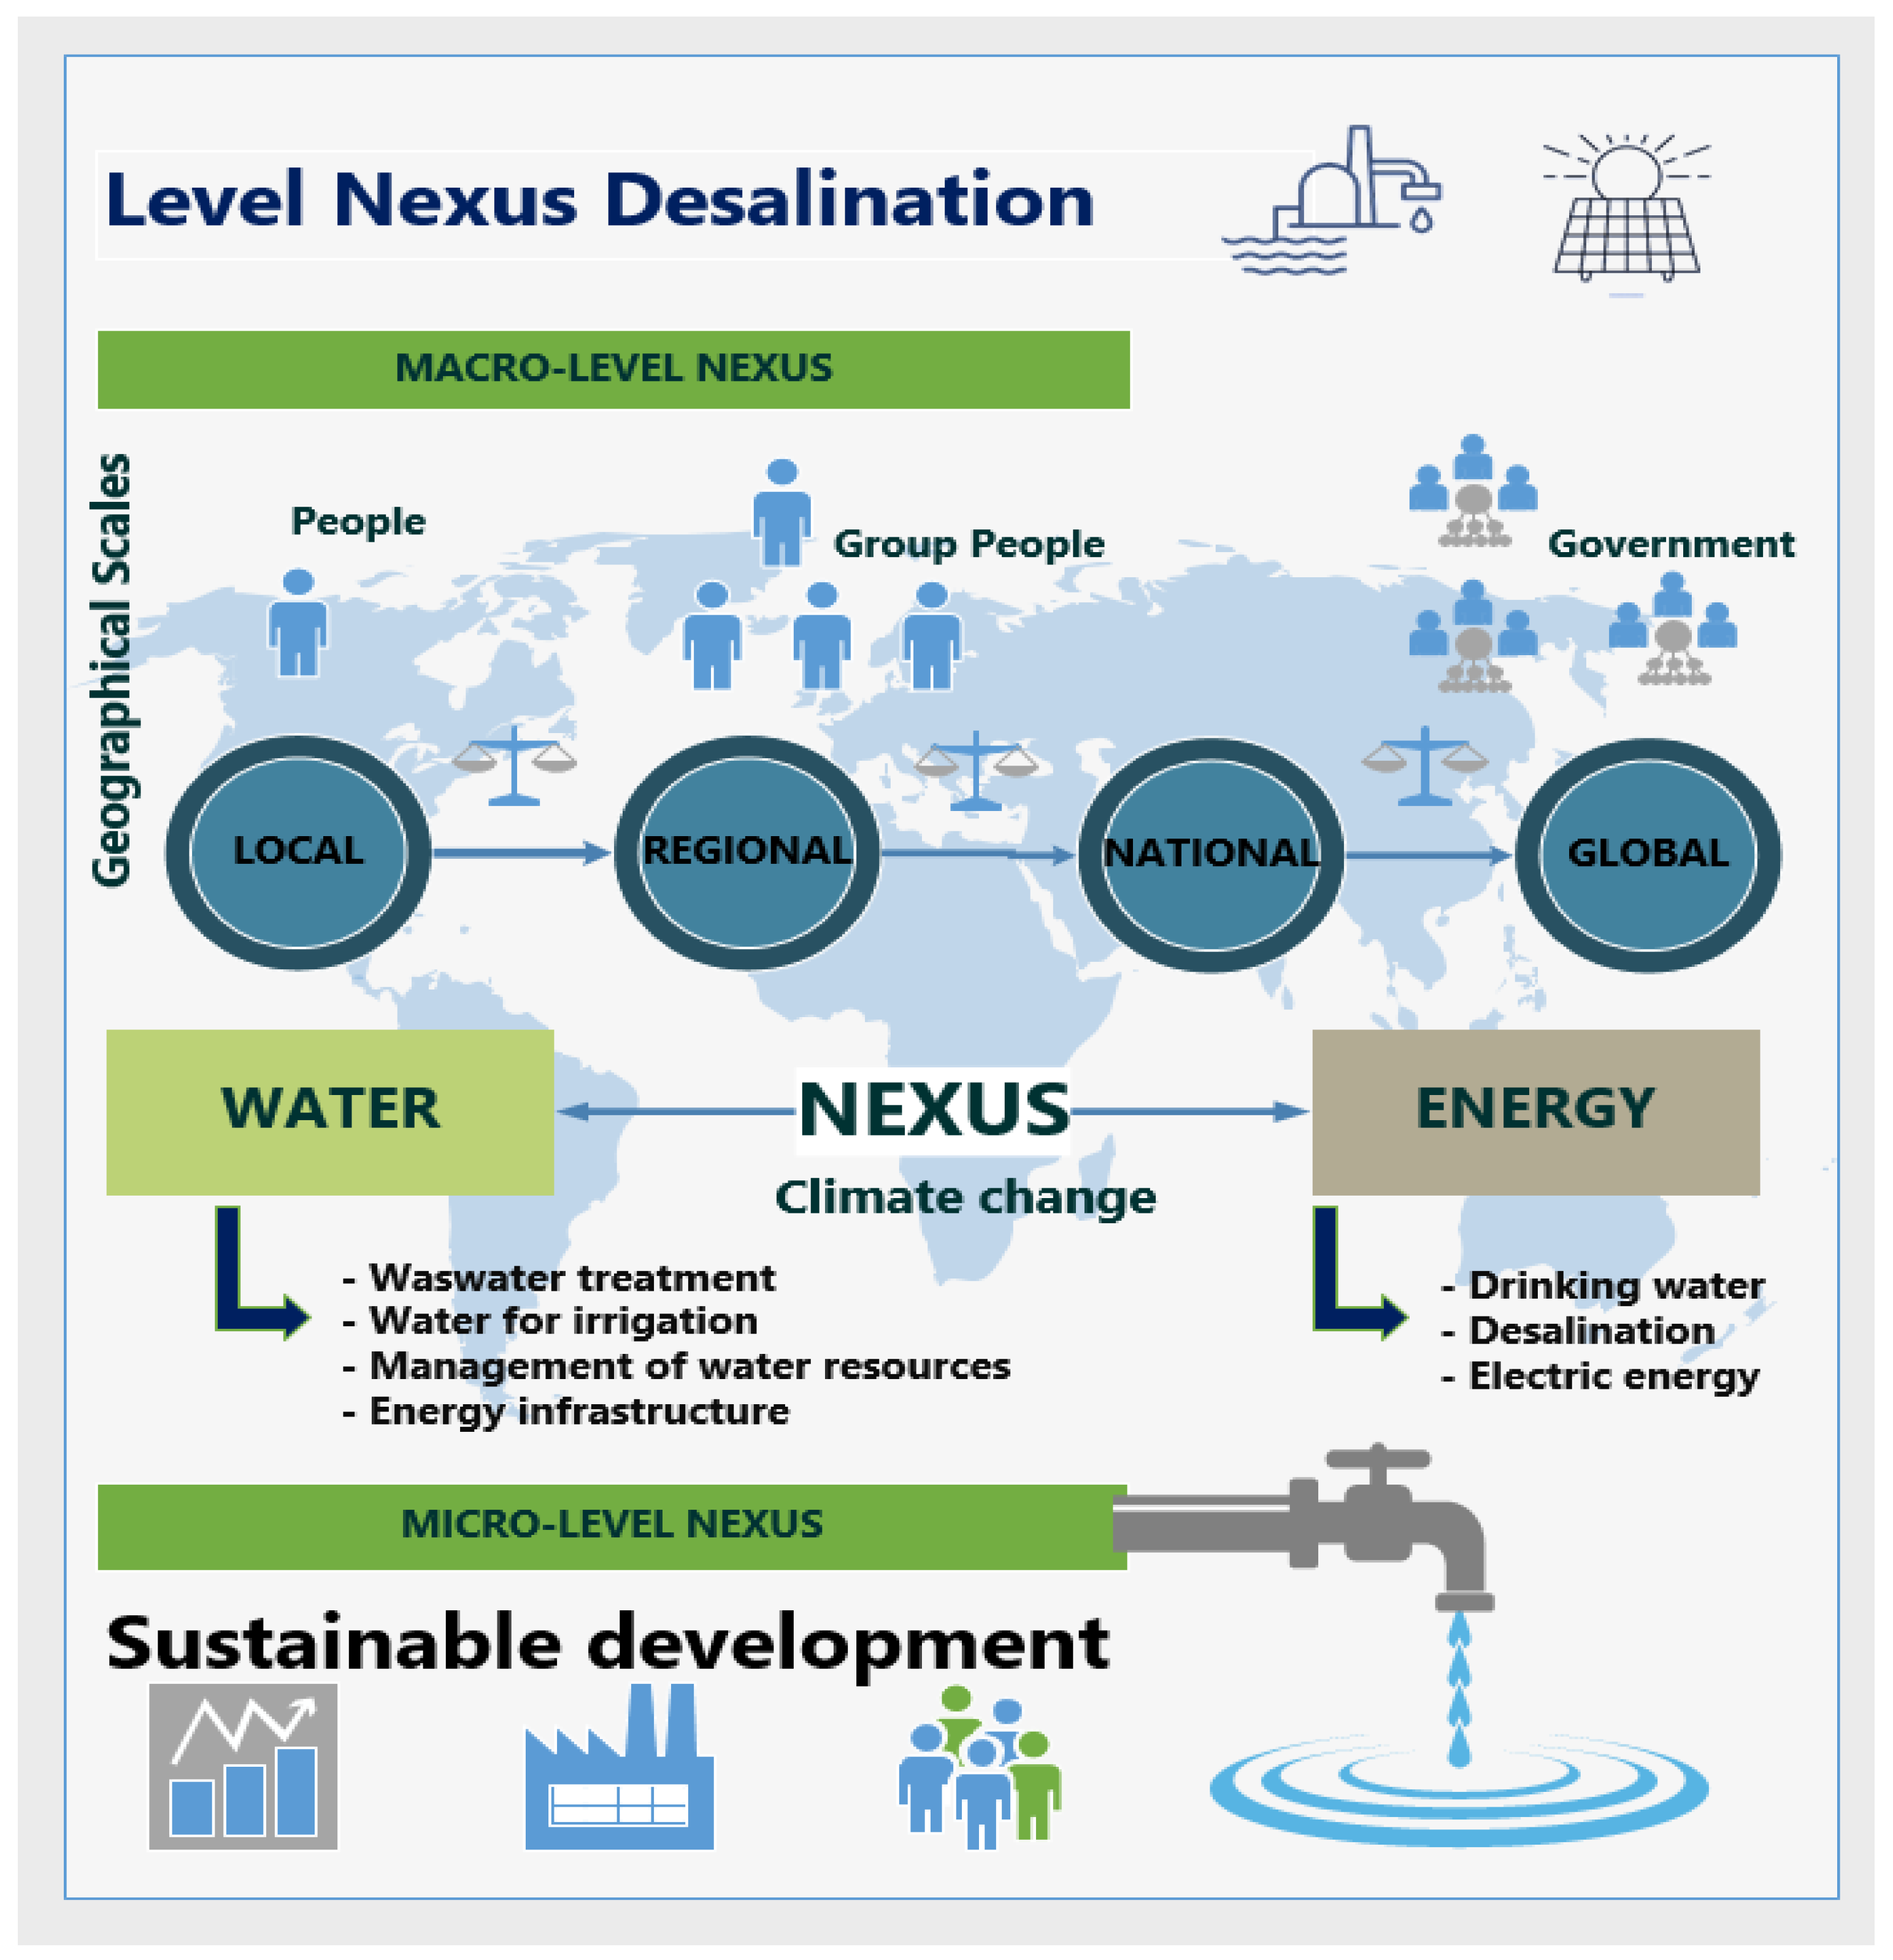
- Implementation of integrated approaches to water management at local, national, and global levels, always considering participatory decision-making;
- Providing safe drinking water in a manner that is affordable, accountable, and economically and environmentally sustainable, thus ensuring hygiene and sanitation services;
- Ensuring that regulations governing the distribution and disposal of water resources are always in place. Considering that the performance of public authorities is responsible for their sustainability over time;
- Strengthening the development of the skills and knowledge transfer.
- Actors: correspond to a social/community organization, a NGO, an association, a private company, a governmental institution (ministries/governments/municipalities), a university, among others, that participate in the nexus;
- Geographical scale: corresponds to the local urban-rural, regional, national, or global scope. In other words, it indicates the locality to which the stakeholder belongs;
- Importance of the stakeholder participation: In order to achieve the goals of a project involving the water-energy nexus, it must be determined whether the stakeholder will be considered throughout the process and how its intervention will be realized;
- Work of the water-energy nexus: this refers to the influence on the direct use, administrative, and regulatory functions, among others, of the components of the nexus.
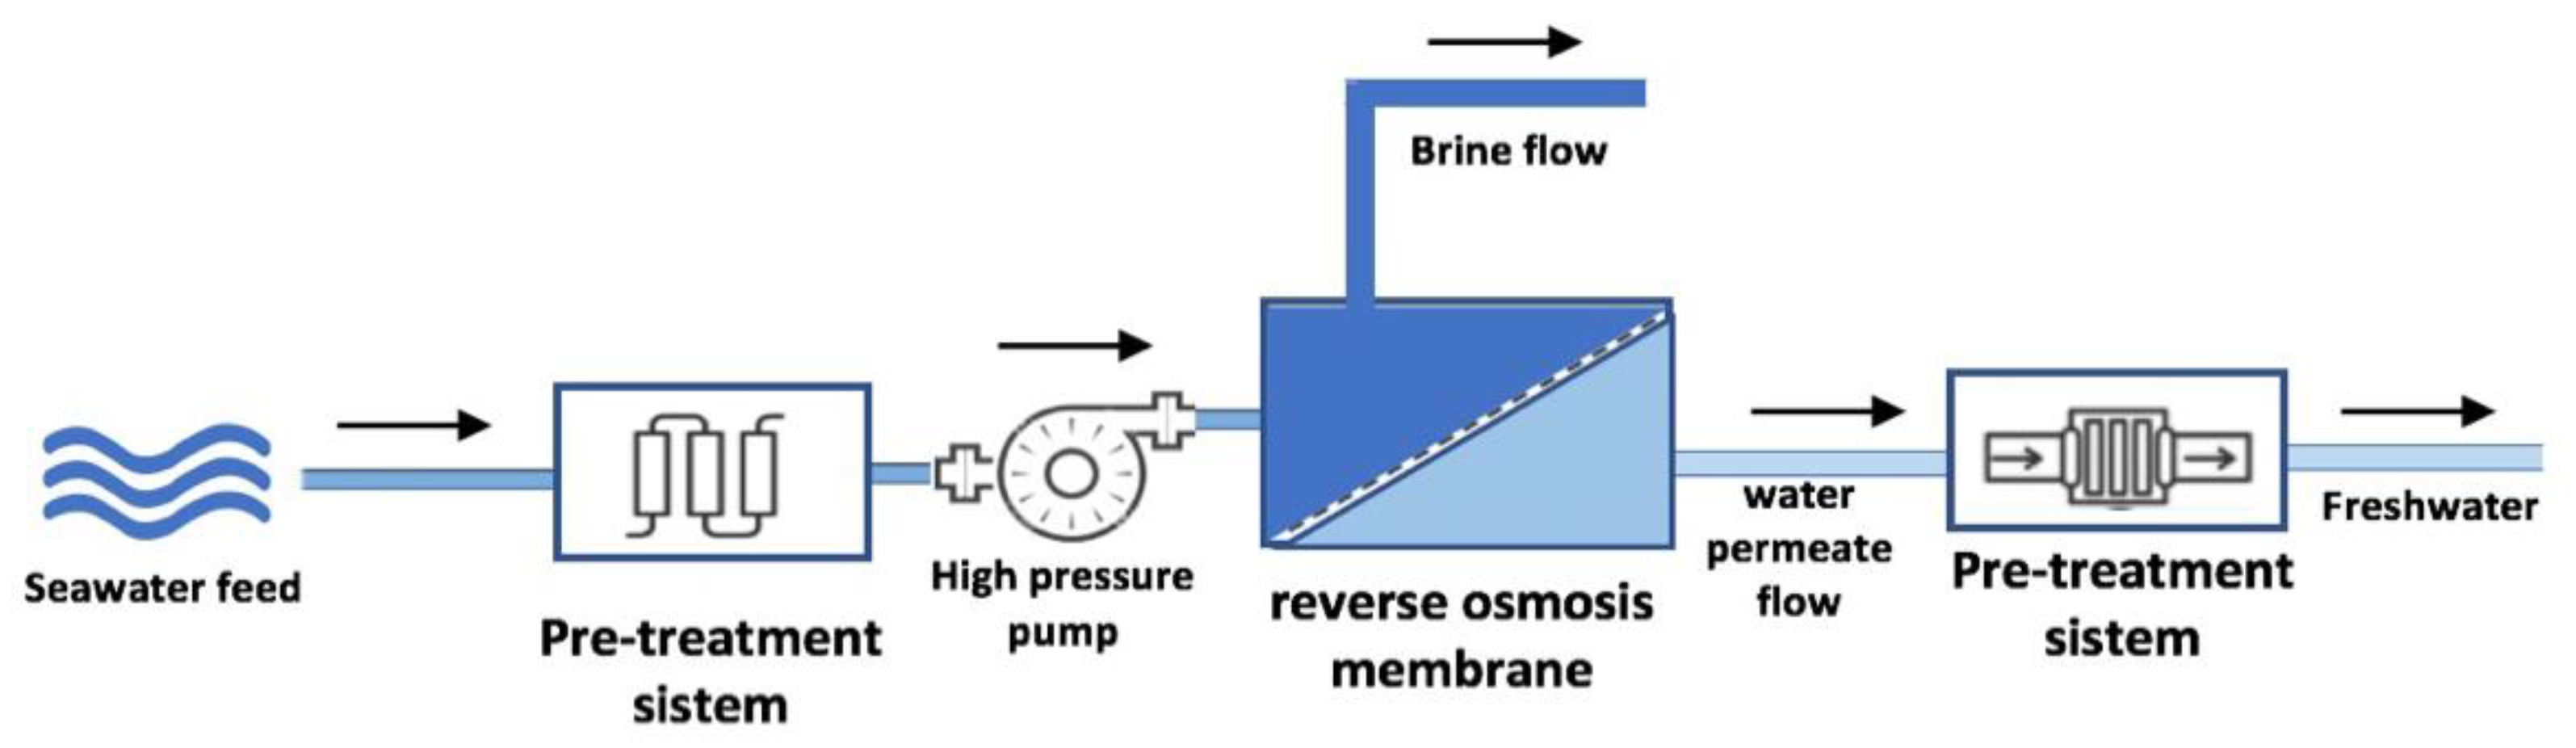
3.1. Conventional Desalination Technologies
3.1.1. Brines
3.1.2. Desalination Plants and Their Impact on the Environment
- i.
- Generates a water product, a relief for communities living in arid or semi-arid areas, that require water for irrigation, considering that 70% of the water in the world is used in agriculture;
- ii.
- Provides available water for human consumption and sanitation. Considering that, according to the World Health Organization (WHO), a person requires 100 L of water per day to meet their basic needs. The current world population is approximately 7.9 billion people in the world;
- iii.
- There would be fewer greenhouse gases if the desalination plants were electrically supported with solar photovoltaic energy. Seawater treatment plants do not generate a significant volume of pollutants. The problem is due to the higher energy consumption; the excess energy consumed can transform fossil fuels into CO2, SOx, NOx, and other suspended particles;
- iv.
- Generate a lower environmental impact if the brine is reused in agriculture, such as in the cultivation of halophyte plants or for aquaculture shrimp farming, among other uses;
- v.
- Allows the brine to be used, extracting the chemical elements, such as Cu, Na, K, Mg, among others;
- vi.
- When brine management and treatment are not intended to produce fresh water but to have a permeated water that is generally not required to meet drinking water quality. As a result, brine treatments can be more affordable and suitable for the end use.
- i.
- The desalination process consumes considerable energy, resulting from the use of fossil fuel energy sources, causing considerable greenhouse gas emissions and affecting the environment;
- ii.
- Another problem with desalination plants is the impact generated by the brine when it is directly disposed of in marine systems, which causes alterations such as:
- Water inlets for processing in desalination plants can trap marine organisms, affecting marine fauna and flora;
- The outfalls of liquid waste from the desalination plants are channeled directly into the sea, causing high seawater temperatures and salinity;
- Chemicals used for corrosion prevention, water pretreatment, and water cleaning are also disposed of through marine outfalls.
3.1.3. Calculations for the Desalination Plants
3.2. Solar Energy
3.2.1. Calculation of the Solar Peak Hour (SPH)
3.2.2. Calculating the Number of Photovoltaic Panels and Batteries
3.2.3. Load Controller Calculation
3.2.4. Current Inverter Calculation
3.2.5. Homer Pro
3.3. Calculations Applicable to the Desalination-Photovoltaic Nexus
3.3.1. Calculation of the Osmotic Pressure in the Desalination
3.3.2. Calculation of the Energy for Desalination
3.3.3. Specific Energy Consumption for the RO Process
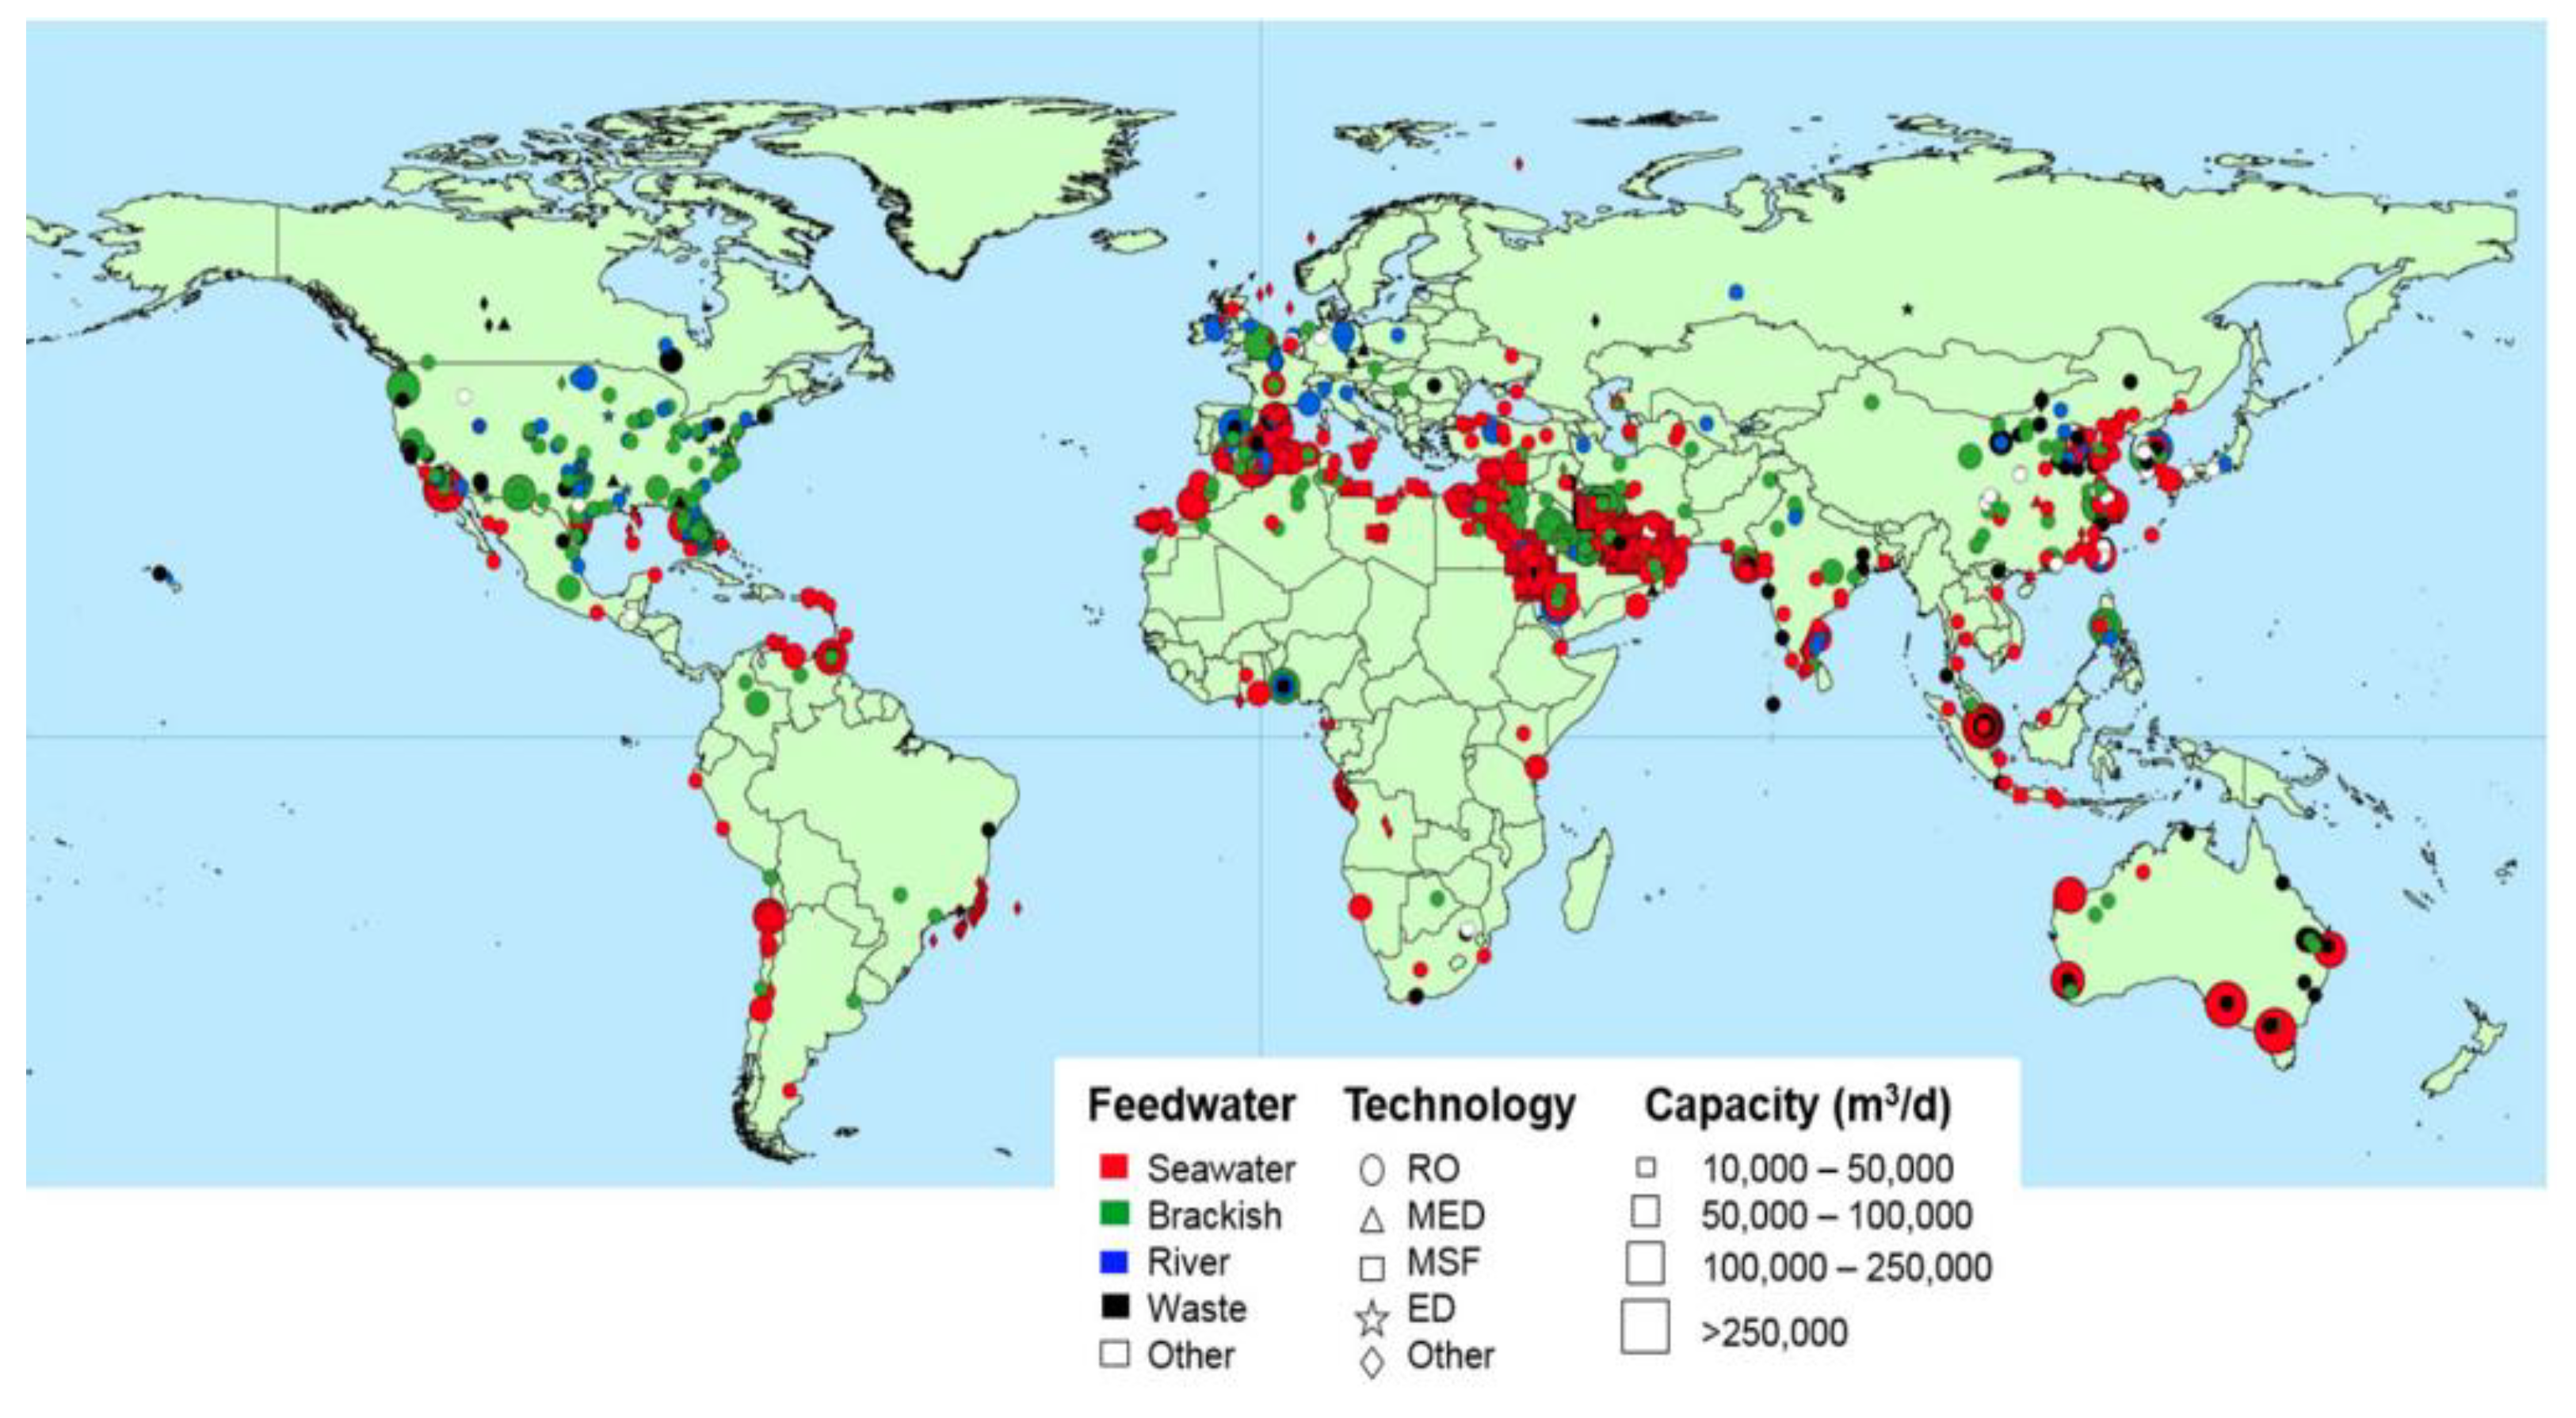
4. Worldwide Desalination and the Chilean Desalination Program
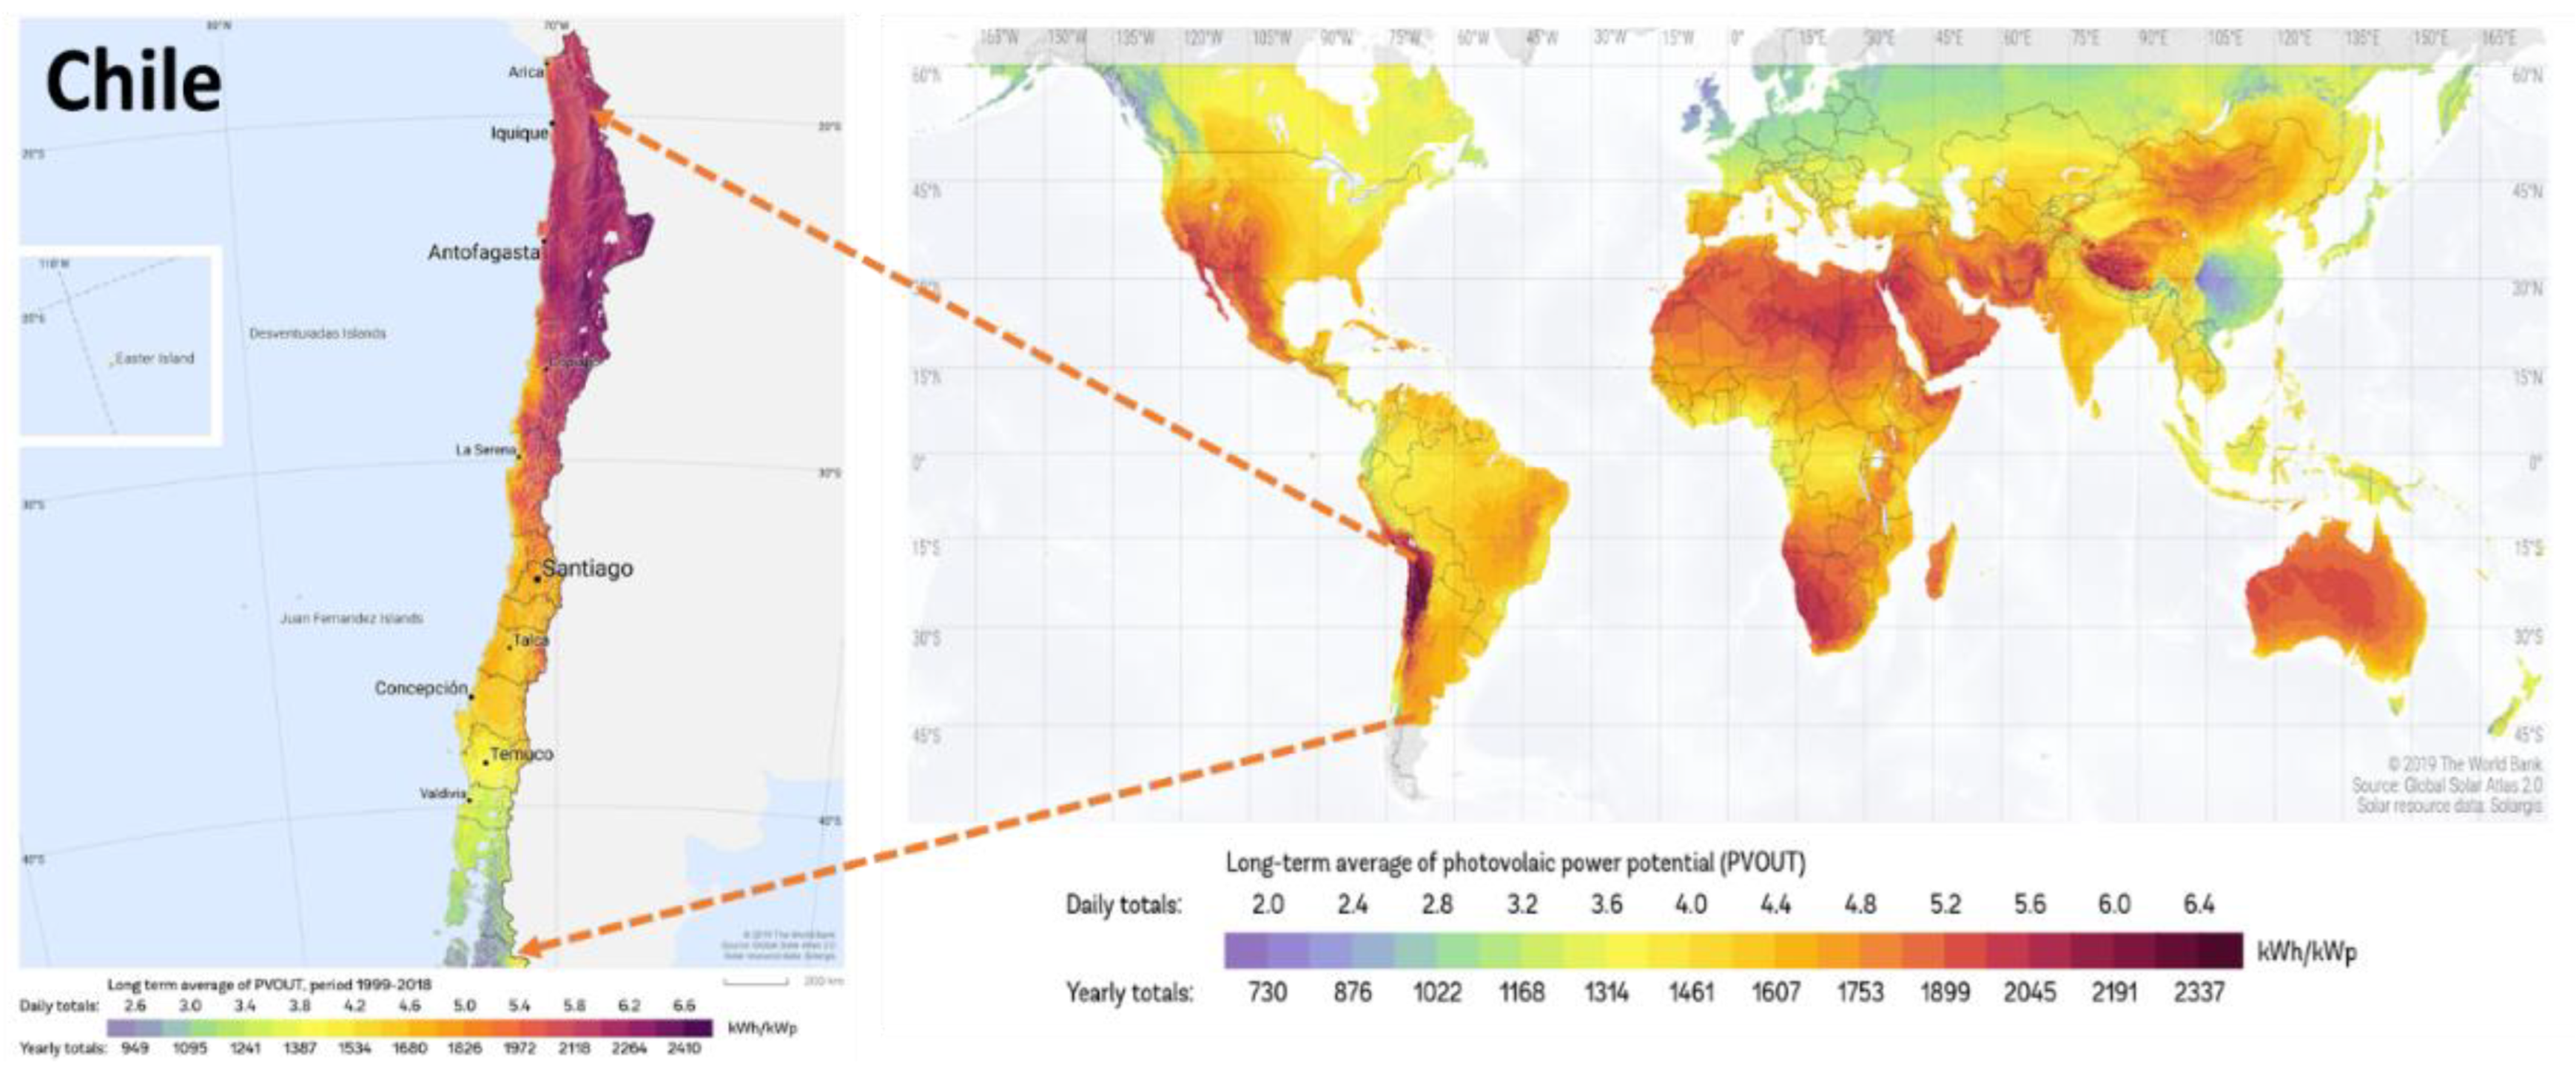
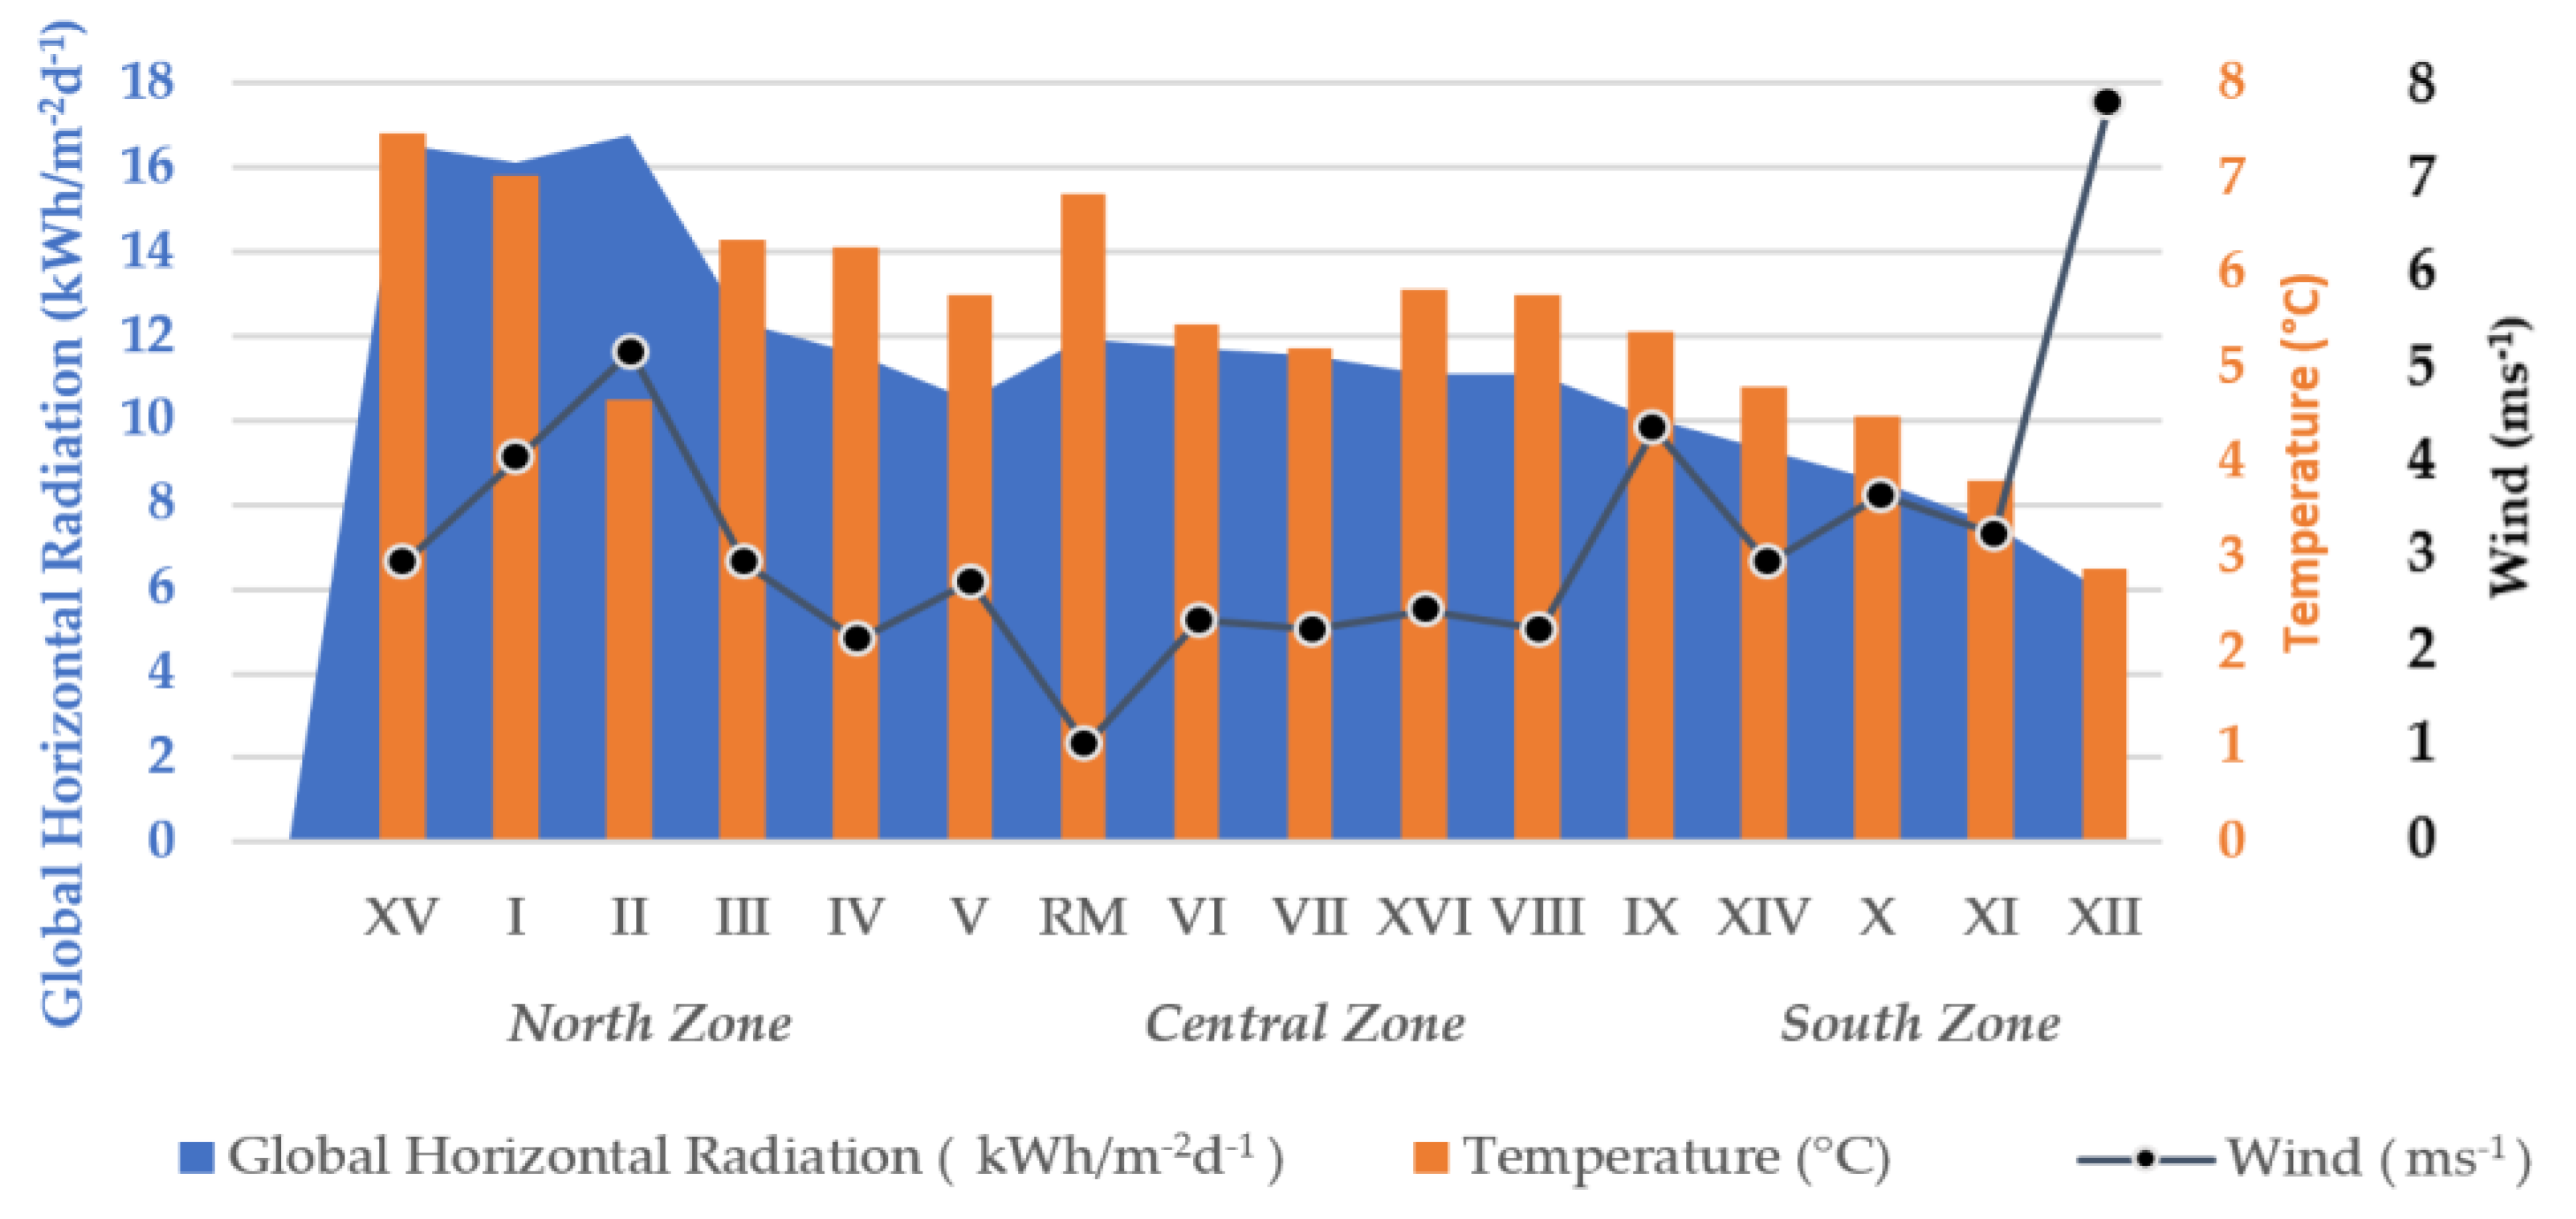
4.1. Solar Potential Worldwide and in Chile
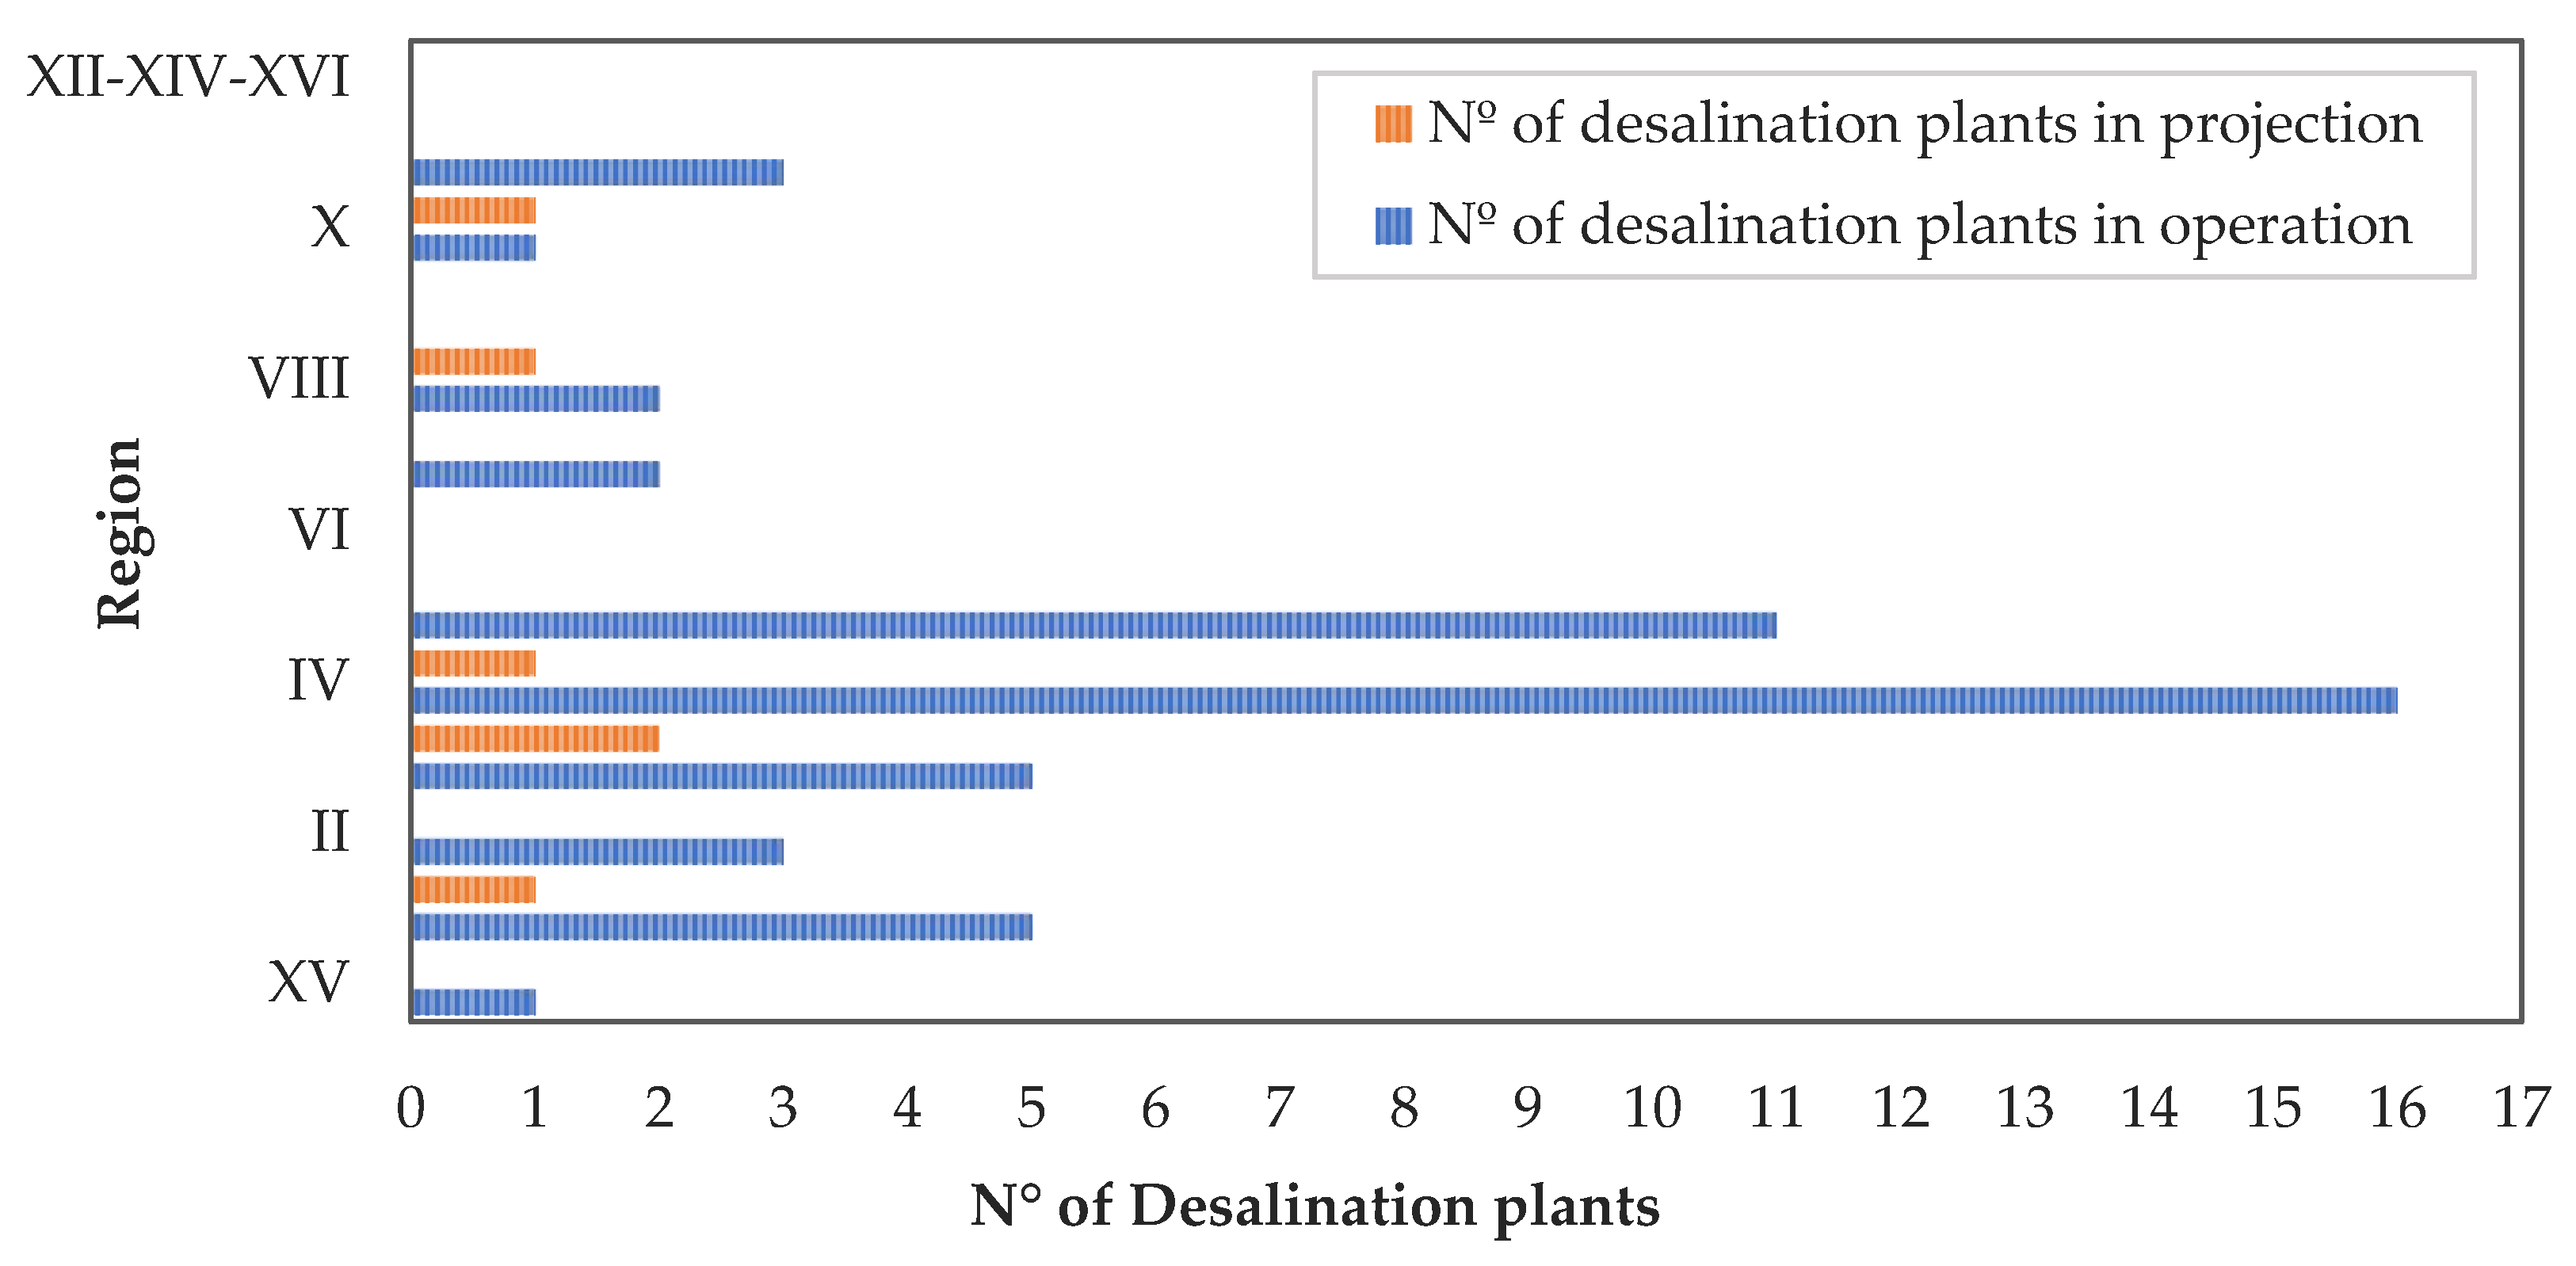
4.2. Small-Scale Desalination Plants in Chile and Around the World
4.3. Legislative and Regulatory Framework Governing Desalination Plants in Chile
- Effect on land use: Desalination plants are located near the coastline, where recreational or tourist use of the land is replaced by the installation of an industrial plant. This could have an impact on the coastal soil;
- Impact on the marine environment: This can be caused by the uptake of seawater or brine discharge (water quality) into the marine ecosystem, on the seafloor, or by the currents generated by the outfalls. Through discharge into the sea, infiltration or evaporation in ponds located on land;
- Aqueduct routes: The use of pipelines to carry seawater and the resulting brine can cause damage to marine ecosystems, causing sediment resuspension and the modification of coastal dynamics, burying benthic communities sensitive to changes in sedimentation. Furthermore, leaks from these pipelines can cause salt to enter the aquifers, affecting the marine flora and fauna;
- Noise impact: This impact is produced when desalination plants utilize high-pressure pumps and turbines, to recover electricity, which generates environmental noise;
- High energy consumption: Gas emissions, such as nitrogen oxide and carbon dioxide, as a result of the high amount of energy required for desalination;
- Social impact: The availability of freshwater produced by the desalination plants (after treatment to make it suitable for human consumption) in areas with shortages, allows the population to grow. Furthermore, the new uses of the territory may cause an imbalance in neighboring and indigenous communities, affecting tourism and reducing the economy of the local communities, causing a negative visual impact due to the installation of large plants, among other aspects.
5. Results
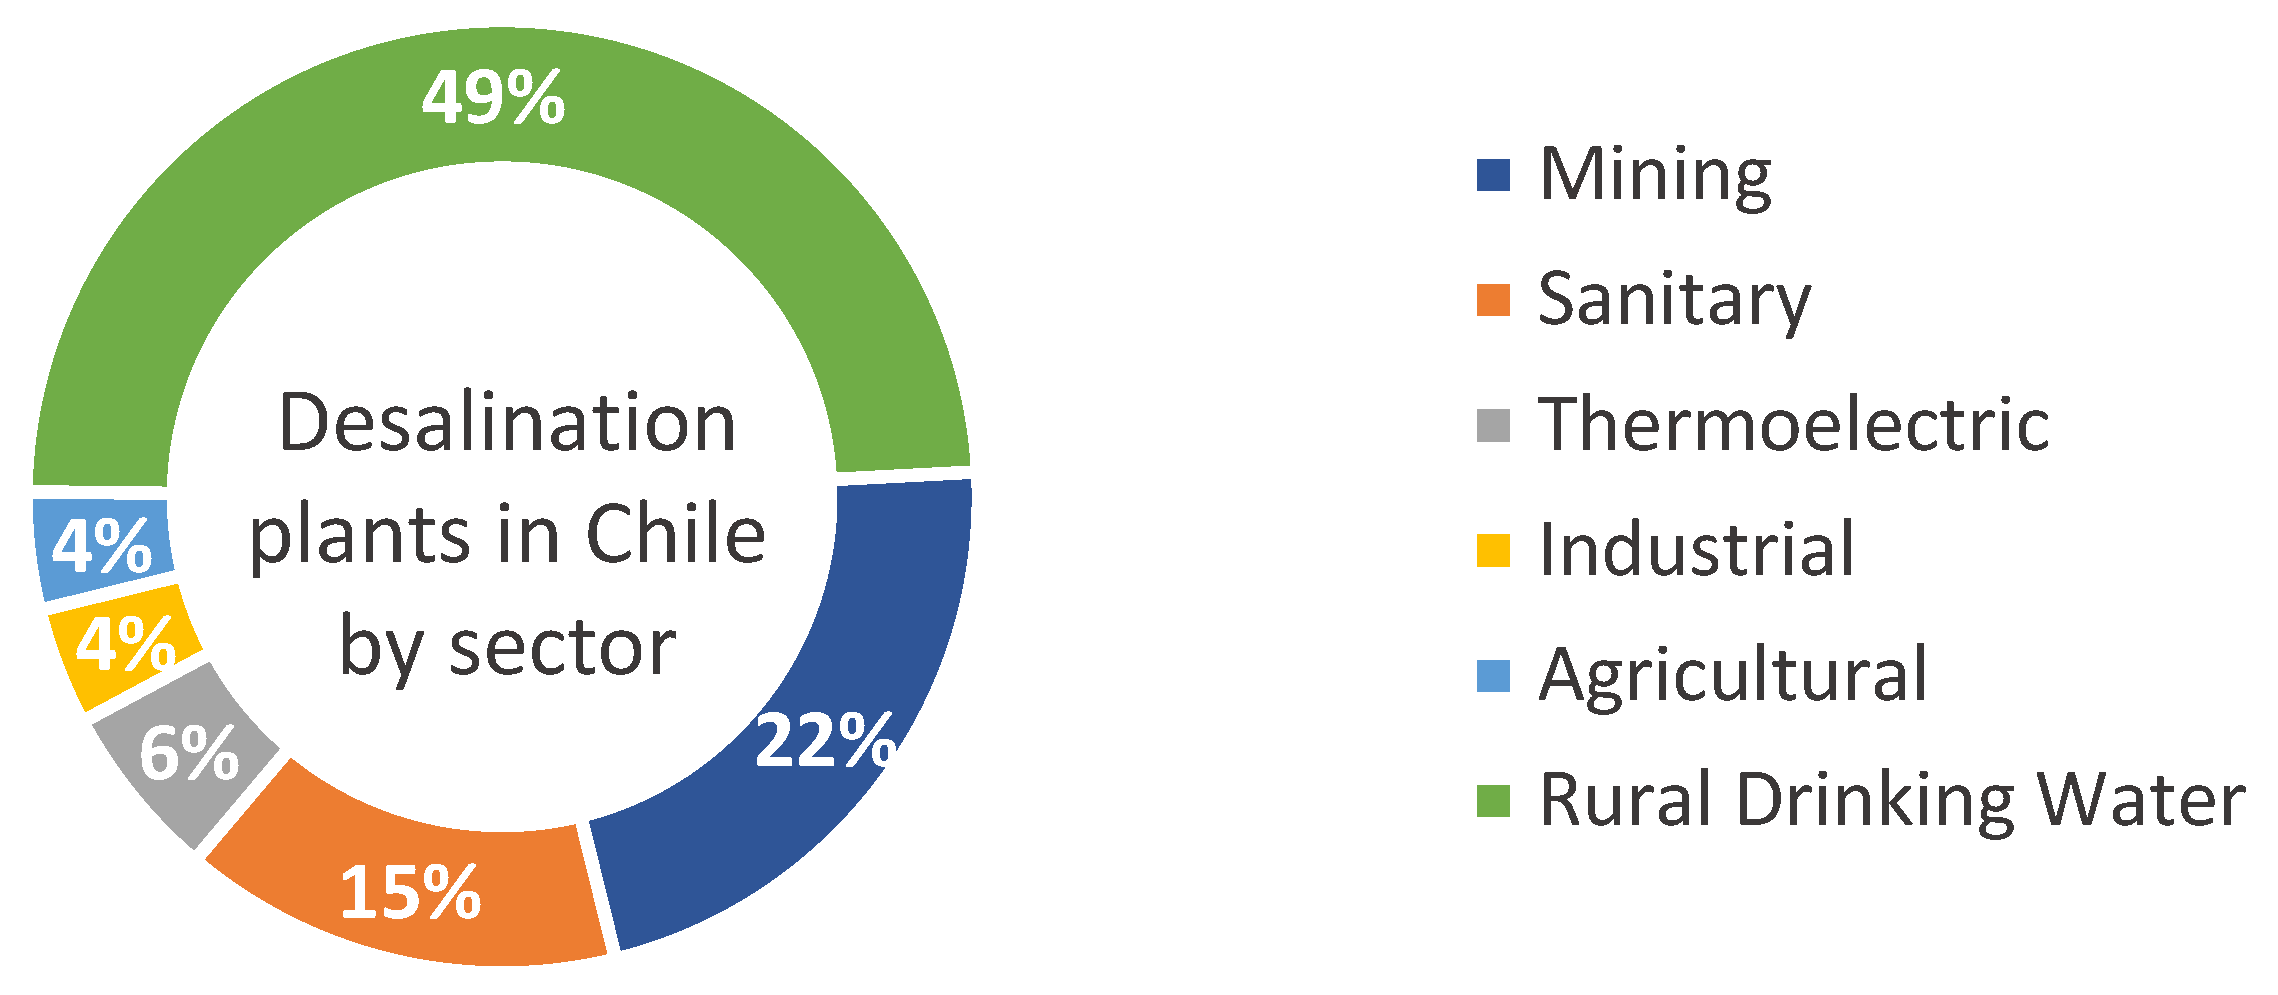
5.1. Chilean Cadaster of Small-Scale Desalination Facilities
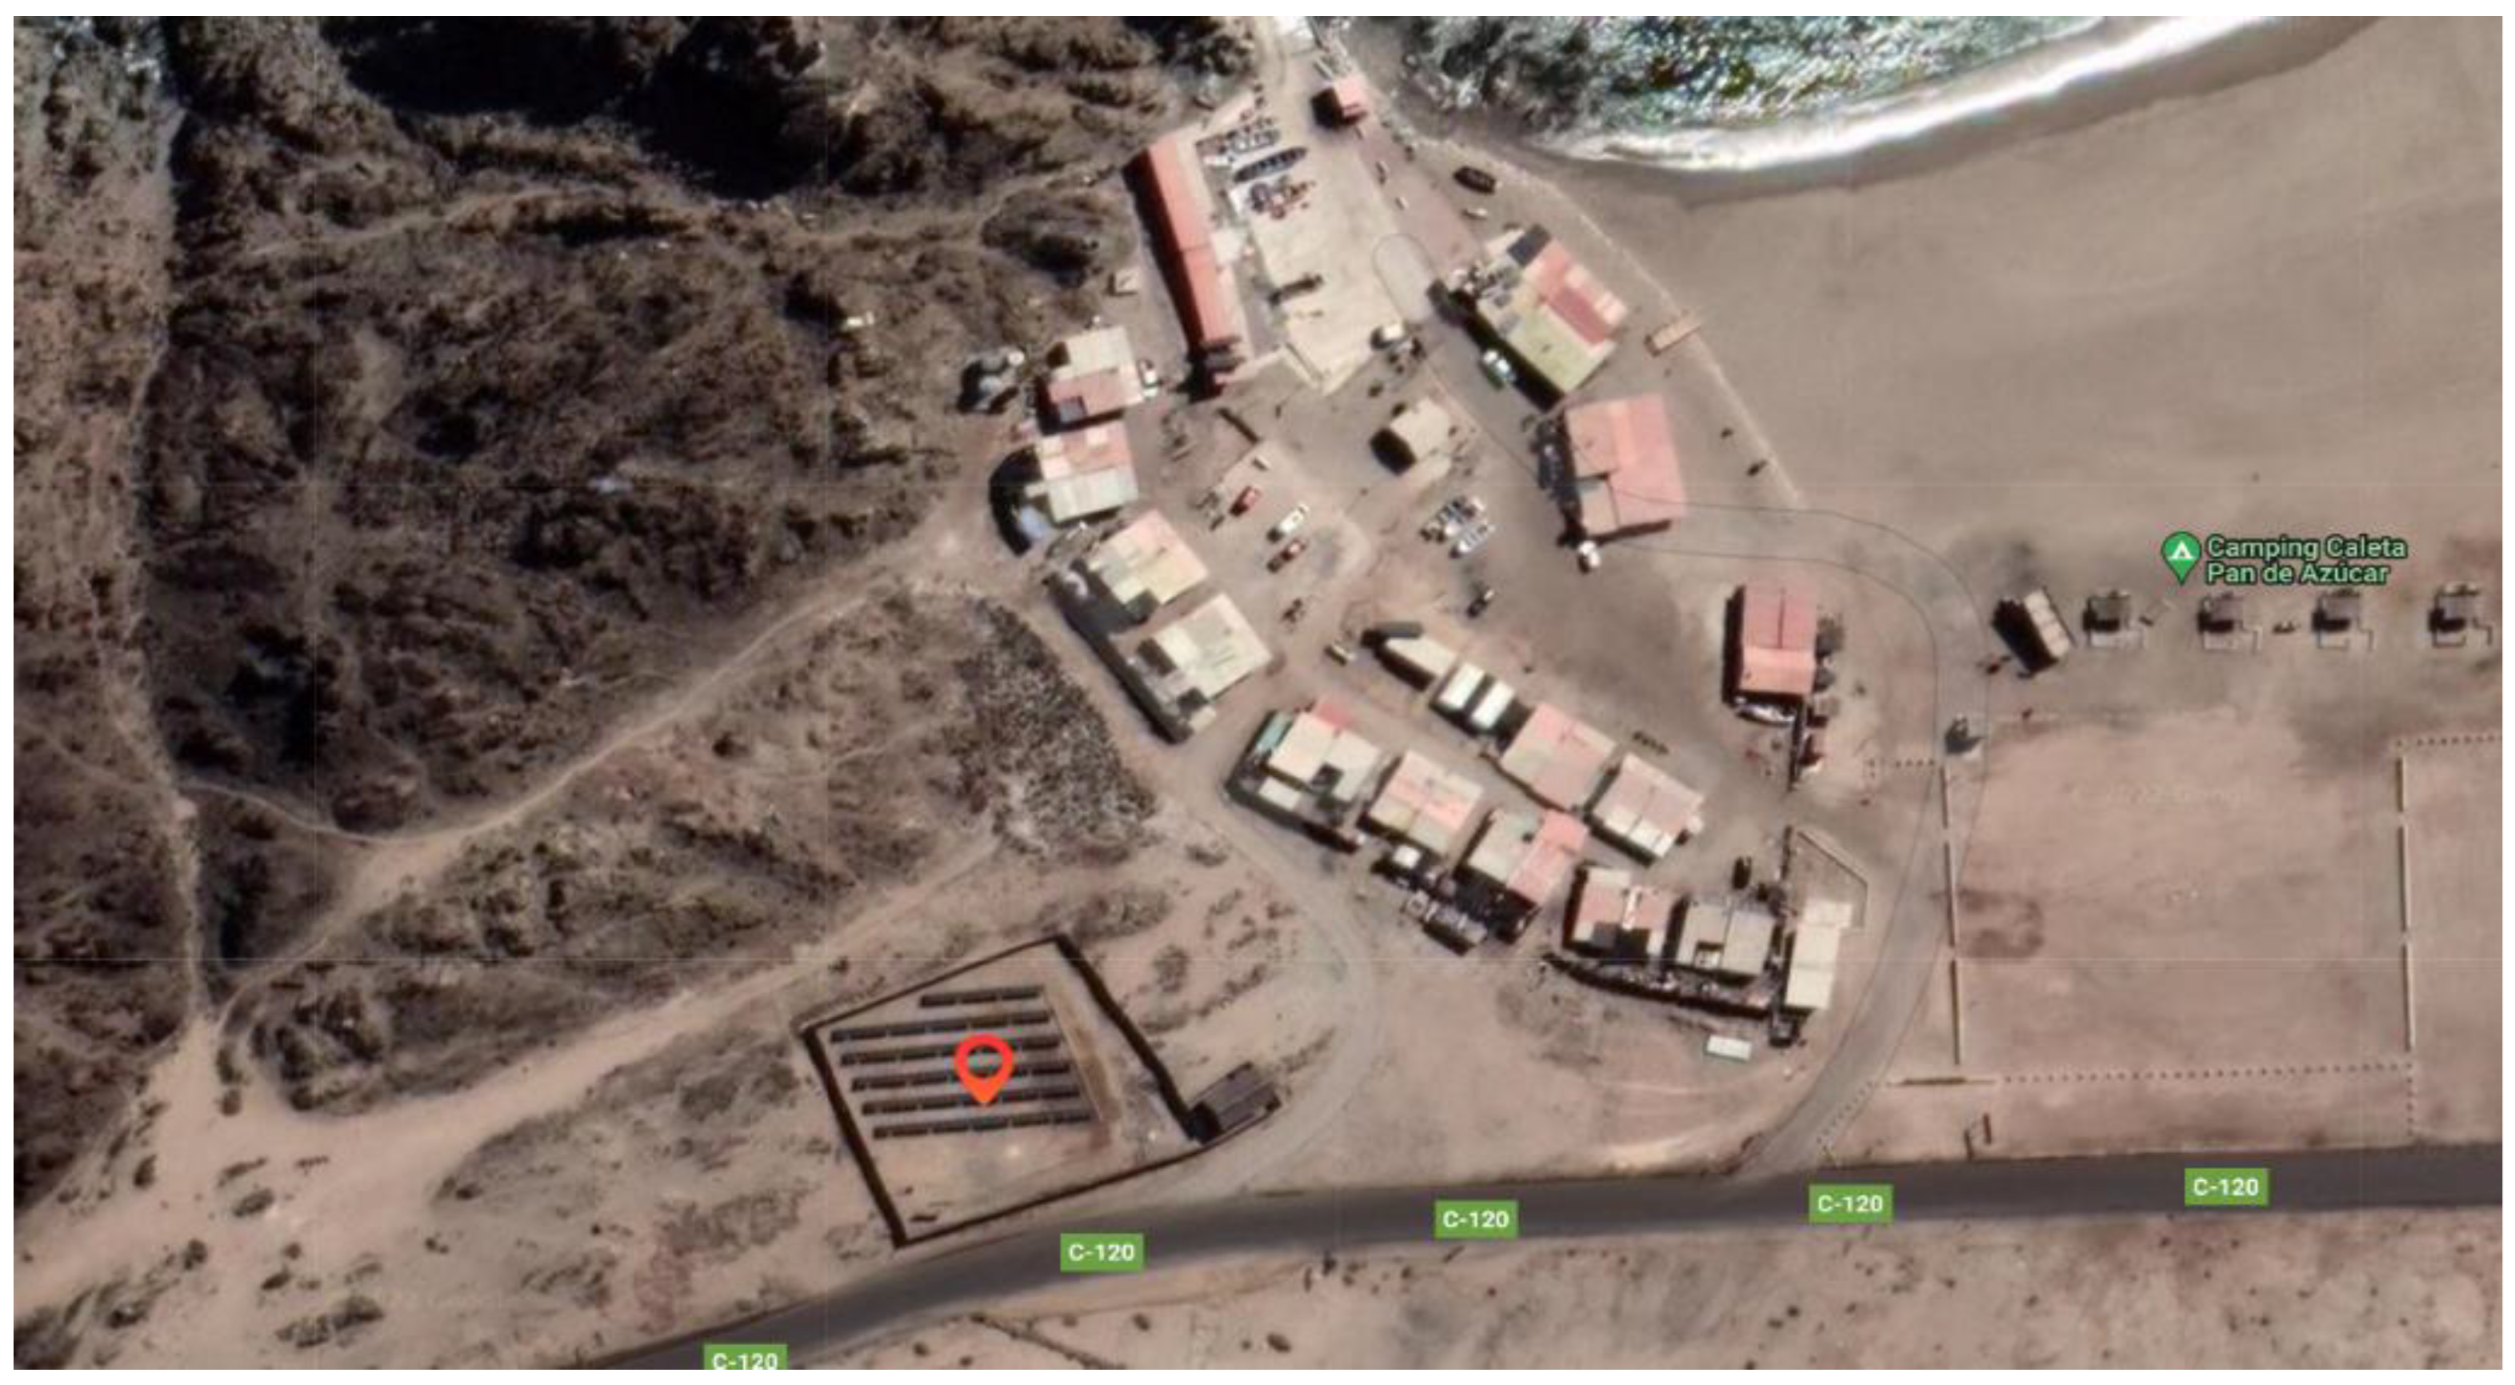
5.2. Localization
5.3. Characteristics of the RODP
5.4. Cases Analysis and Simulation
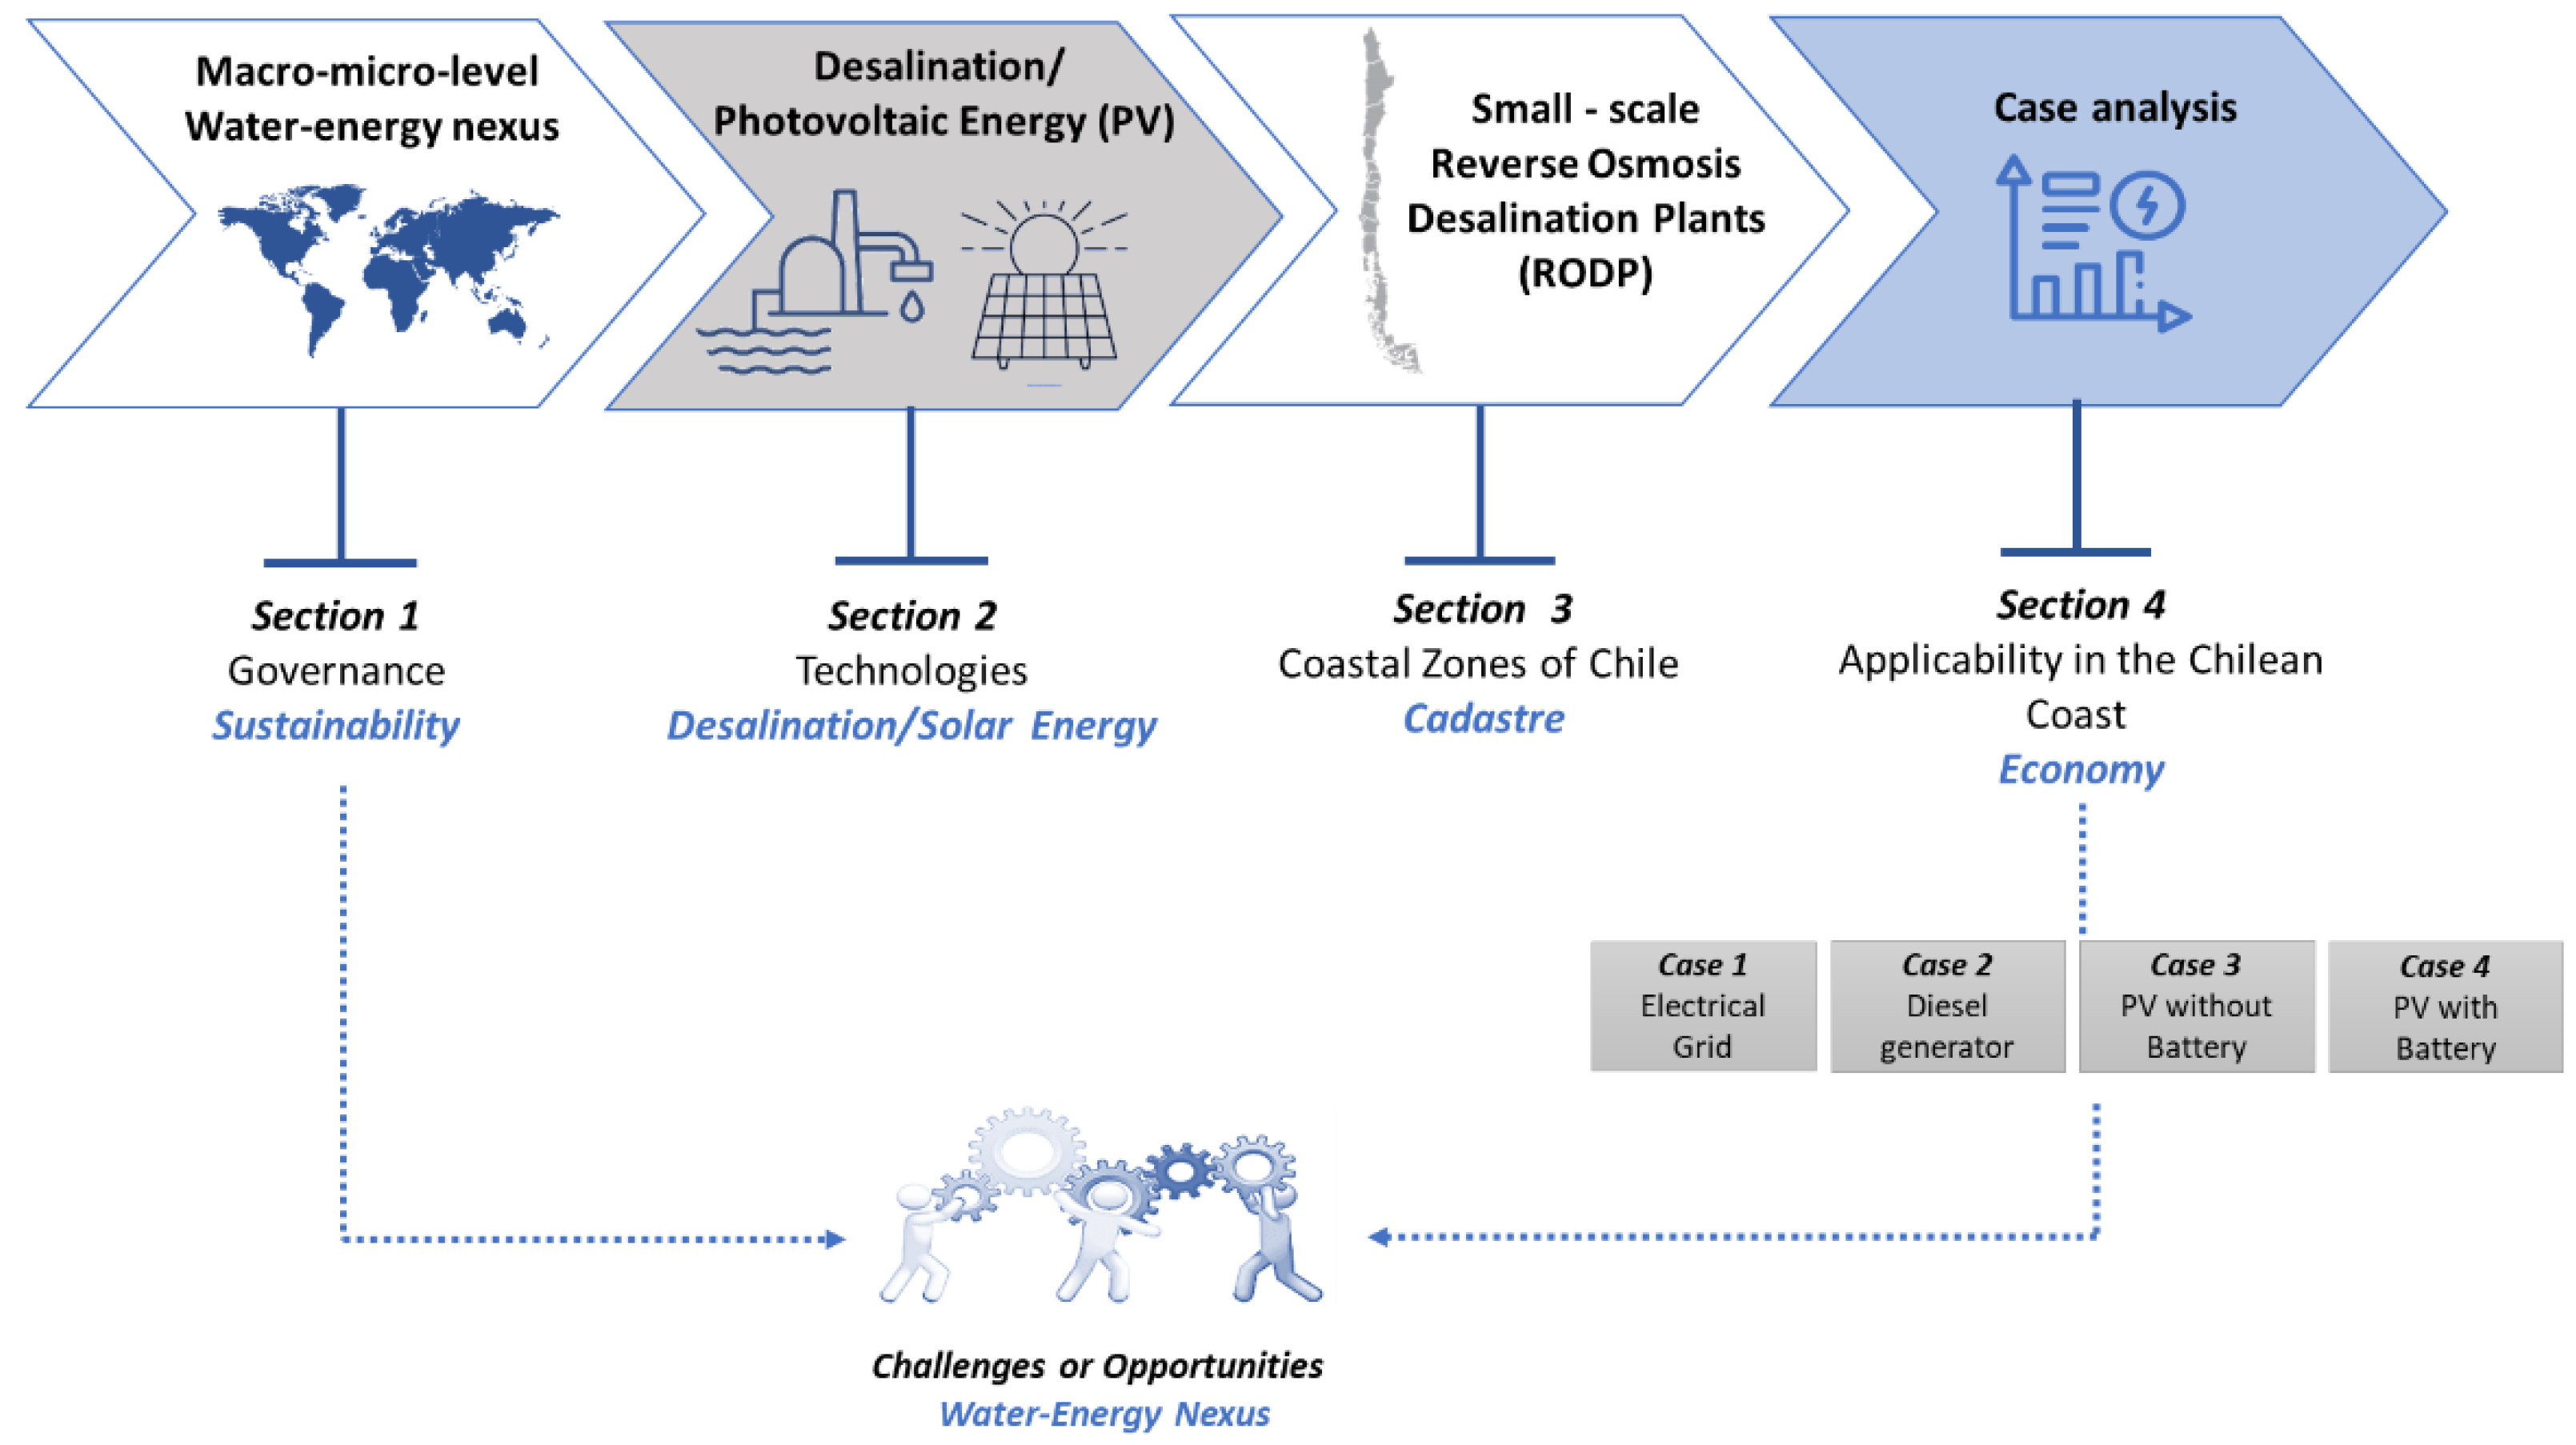
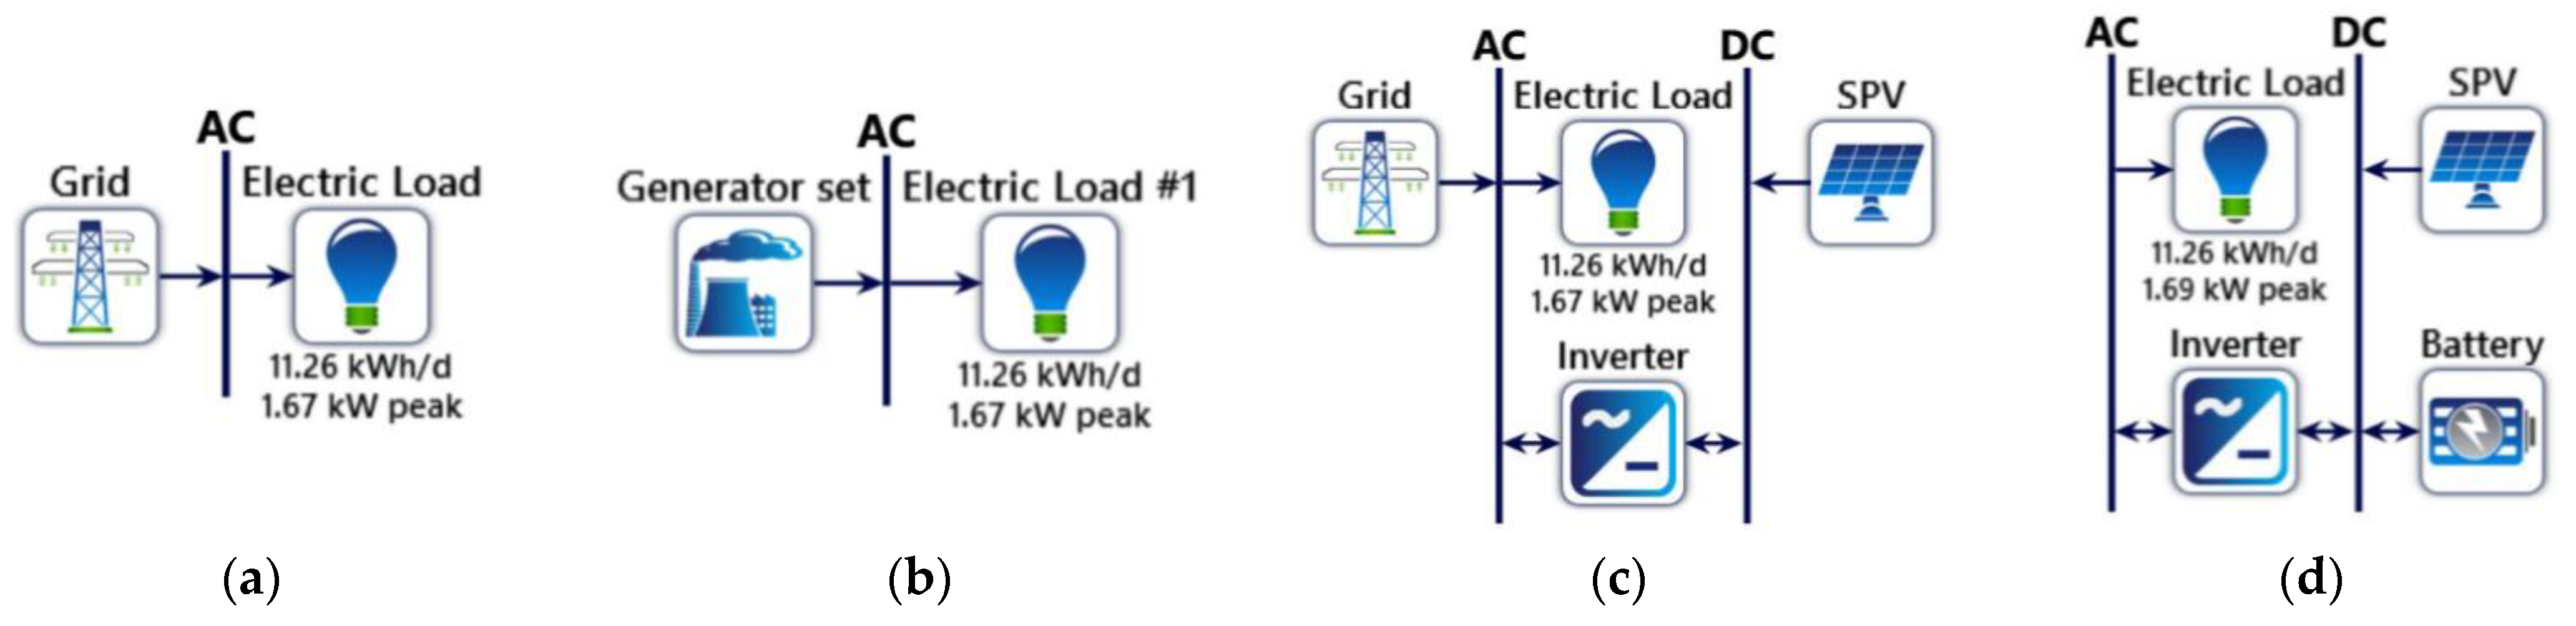
- Case 1: electricity supplied straight from the grid at the cost of a free client with a contract;
- Case 2: power generation using a generator, considering the cost of fossil fuel;
- Case 3: electricity supplied by a photovoltaic facility without battery energy storage;
- Case 4: the provision of electricity via a photovoltaic facility with energy storage in the batteries.
5.4.1. Simulation in Homer Pro
Case Configuration
Technical and Economic Analyses of the Cases
6. Discussion and Comments
7. Conclusions
Author Contributions
Funding
Data Availability Statement
Acknowledgments
Conflicts of Interest
References
- Tan, N.P.B.; Ucab, P.M.L.; Dadol, G.C.; Jabile, L.M.; Talili, I.N.; Cabaraban, M.T.I. A review of desalination technologies and its impact in the Philippines. Desalination 2022, 534, 115805. [Google Scholar] [CrossRef]
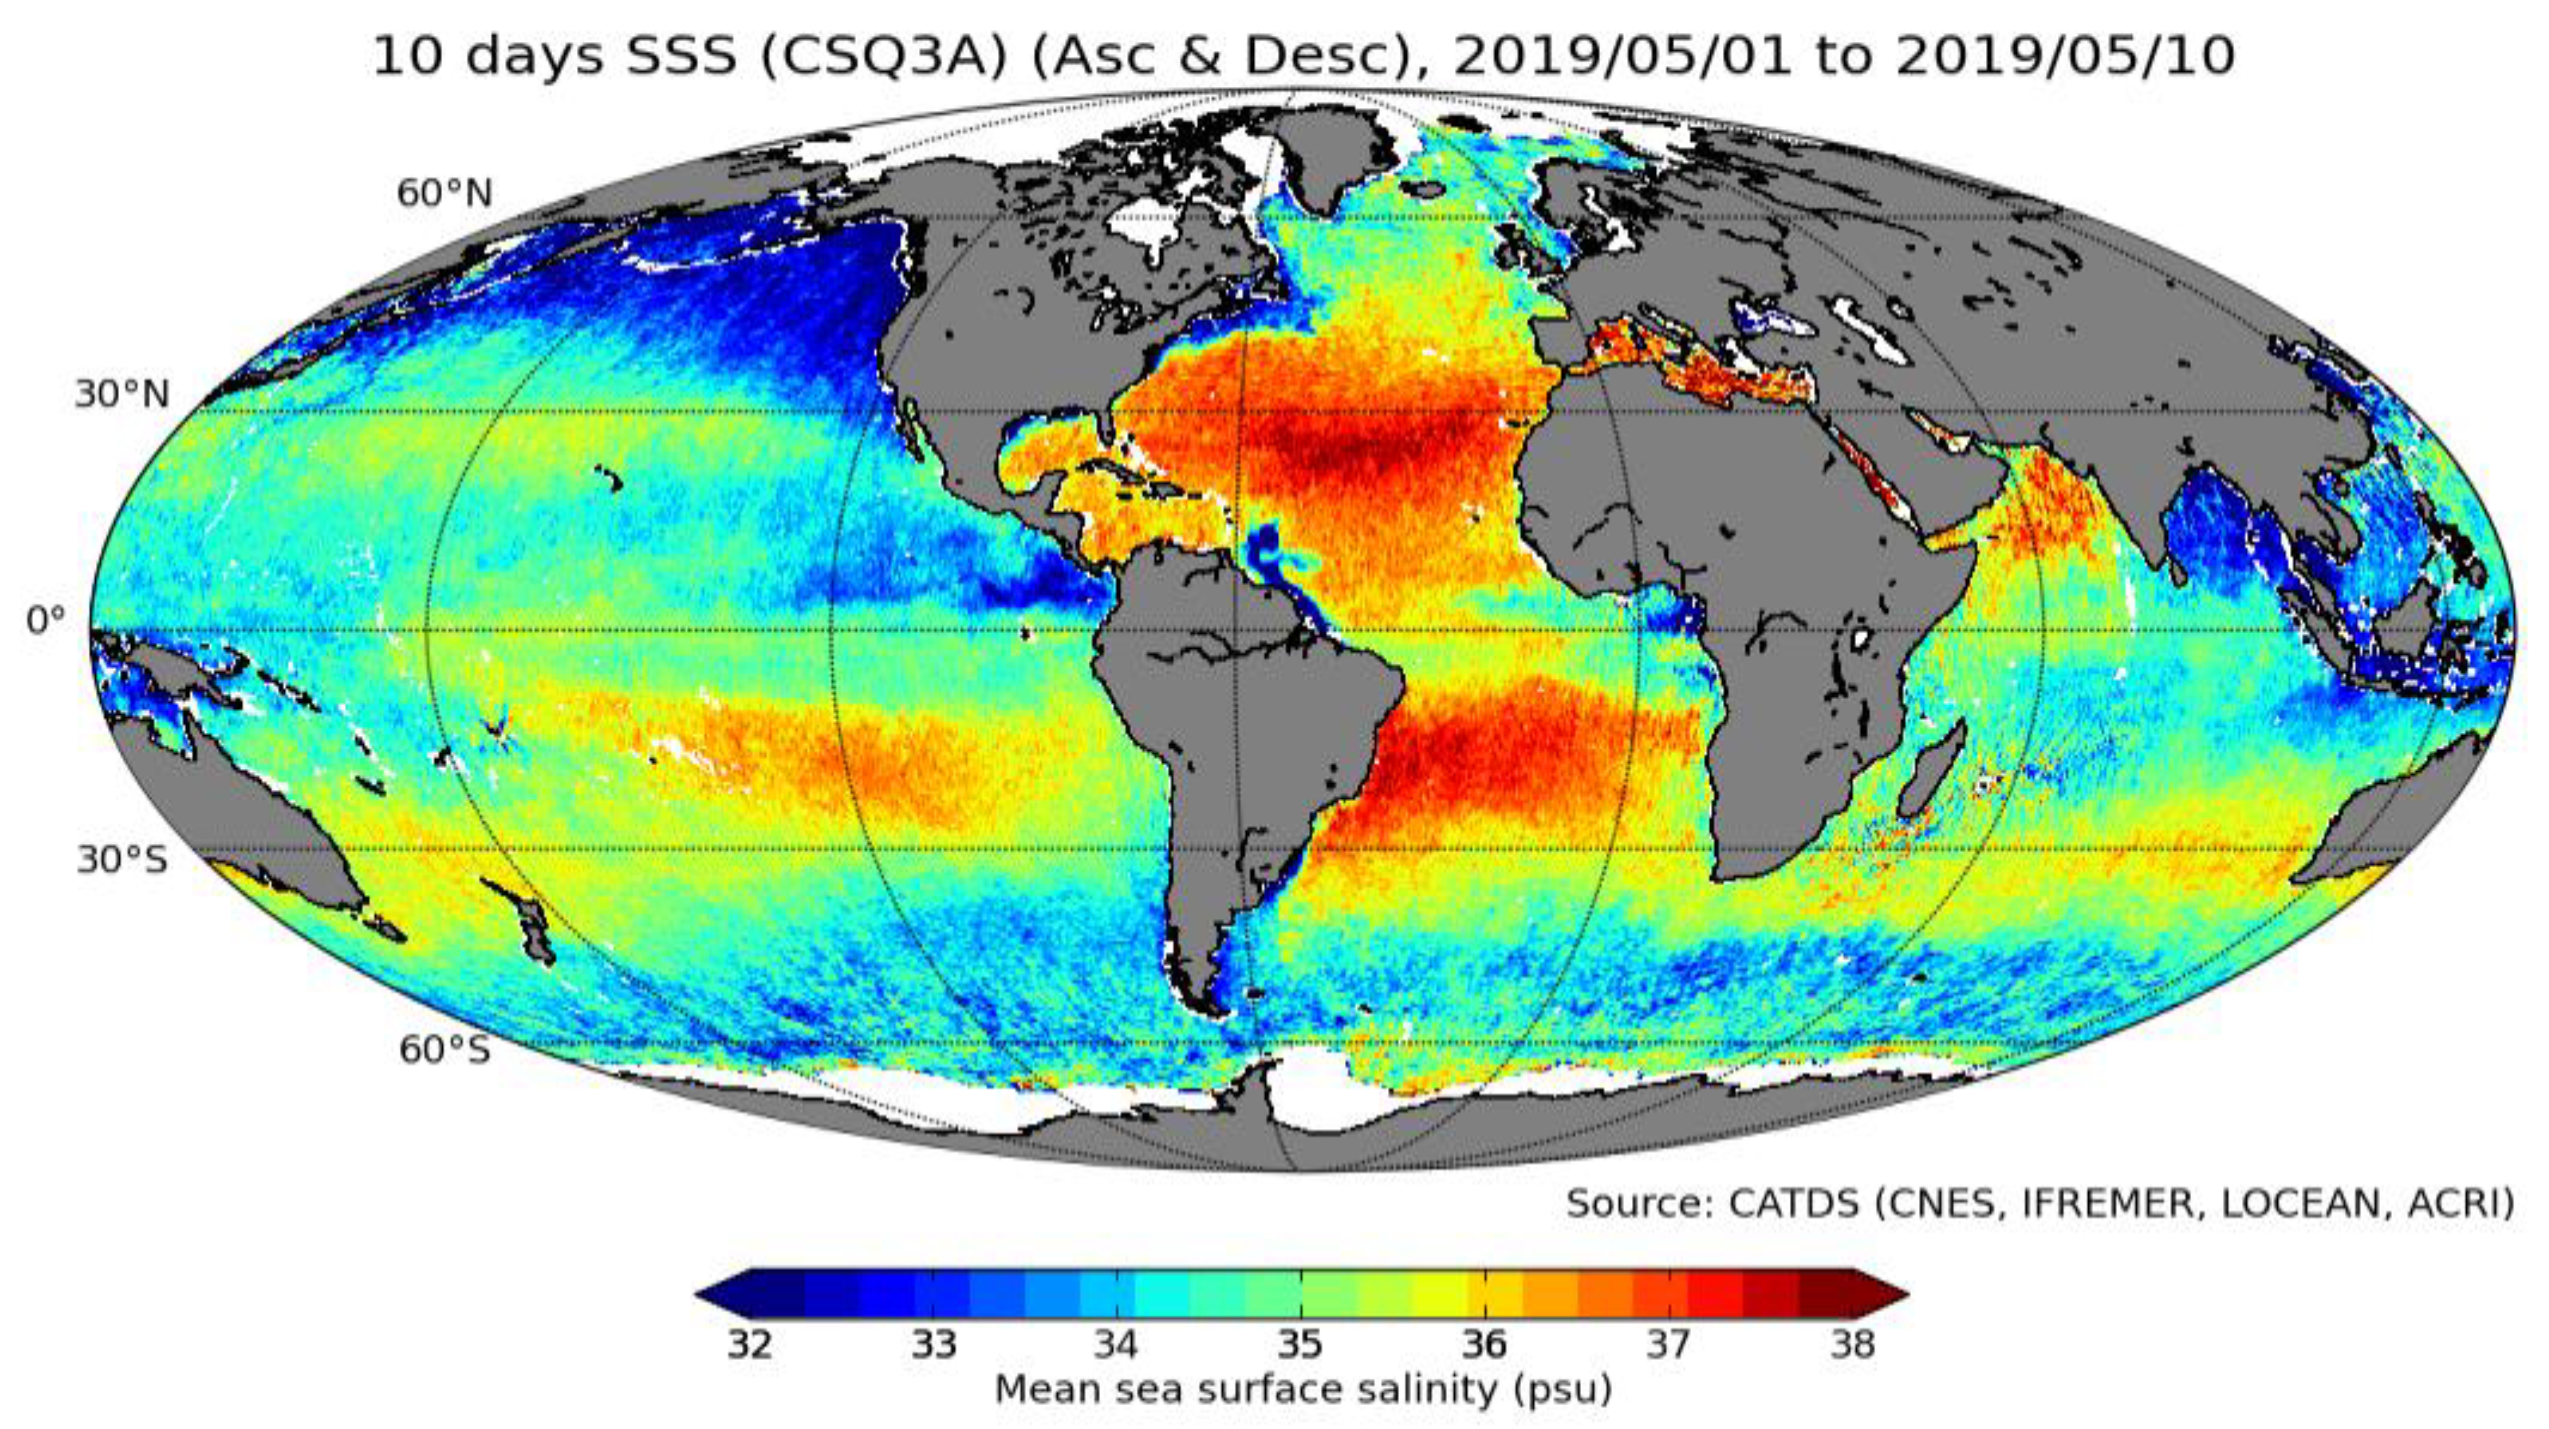
- Boutin, J.; Vergely, J.L.; Marchand, S.; d’Amico, F.; Hasson, A.; Kolodziejczyk, N.; Reul, N.; Reverdin, G.; Vialard, J. New SMOS Sea Surface Salinity with reduced systematic errors and improved variability. Remote Sens. Environ. 2018, 214, 115–134. [Google Scholar] [CrossRef] [Green Version]
- Cornejo-Ponce, L.; Moraga-Contreras, C.; Vilca-Salinas, P. Analysis of Chilean legal regime for brine obtained from desalination process. Desalination Water Treat. 2020, 203, 91–103. [Google Scholar] [CrossRef]
- Ahmed, F.E.; Khalil, A.; Hilal, N. Emerging desalination technologies: Current status, challenges and future trends. Desalination 2021, 517, 115183. [Google Scholar] [CrossRef]
- United Nations. Climate Action. Renewable Energy—Powering a Safer Future. 2022. Available online: https://www.un.org/en/climatechange/raising-ambition/renewable-energy (accessed on 10 March 2022).
- Ai, C.; Zhao, L.; Song, D.; Han, M.; Shan, Q.; Liu, S. Identifying greenhouse gas emission reduction potentials through large-scale photovoltaic-driven seawater desalination. Sci. Total Environ. 2023, 857, 159402. [Google Scholar] [CrossRef]
- Liu, J.; Hull, V.; Godfray, H.C.J.; Tilman, D.; Gleick, P.; Hoff, H.; Pahl-Wostl, C.; Xu, Z.; Chung, M.G.; Sun, J.; et al. Nexus approaches to global sustainable development. Nat. Sustain. 2018, 1, 466–476. [Google Scholar] [CrossRef]
- Gómez-Gotor, A.; Del Río-Gamero, B.; Prieto Prado, I.; Casañas, A. The history of desalination in the Canary Islands. Desalination 2018, 428, 86–107. [Google Scholar] [CrossRef]
- Dai, J.; Wua, S.; Han, G.; Weinberg, J.; Xie, X.; Wua, X.; Songd, X.; Jiaa, B.; Xuea, W.; Yanga, Q. Water-energy nexus: A review of methods and tools for macro-assessment. Appl. Energy 2018, 210, 393–408. [Google Scholar] [CrossRef]
- Zhang, X.; Vesselinov, V. Energy-water nexus: Balancing the tradeoffs between two-level decision makers. Appl. Energy 2016, 183, 77–87. [Google Scholar] [CrossRef]
- Lin, S.; Zhao, H.; Zhu, L.; He, T.; Chen, S.; Gao, C.; Zhang, L. Seawater desalination technology and engineering in China: A review. Desalination 2021, 498, 114728. [Google Scholar] [CrossRef]
- Ayaz, M.; Namazi, M.A.; ud Din, M.A.; Ershath, M.M.; Mansour, A. Sustainable seawater desalination: Current status, environmental implications and future expectations. Desalination 2022, 540, 116022. [Google Scholar] [CrossRef]
- de Souza Moreira, F.; Lopes, M.P.C.; de Freitas, M.A.V.; de Souza Antunes, A.M. Future scenarios for the development of the desalination industry in contexts of water scarcity: A Brazilian case study. Technol. Forecast. Soc. Chang. 2021, 167, 120727. [Google Scholar] [CrossRef]
- Ayou, D.S.; Ega, H.M.; Coronas, A. A feasibility study of a small-scale photovoltaic-powered reverse osmosis desalination plant for potable water and salt production in Madura Island: A techno-economic evaluation. Therm. Sci. Eng. Prog. 2022, 35, 101450. [Google Scholar] [CrossRef]
- Stehr, A.; Álvarez, C.; Álvarez, P.; Arumí, J.L.; Baeza, C.; Barra, R.; Berroeta, C.A.; Castillo, Y.; Chiang, G.; Cotoras, D.; et al. COP25, 2019. Recursos Hídricos en Chile: Impactos y Adaptación al Cambio Climático. Mesa del Agua. Cop 25. Ministerio de Ciencias. Available online: https://cdn.digital.gob.cl/filer_public/e6/ff/e6ff260a-d926-4210-83e6-ad7b840b320c/19agua-recursos-hidricos-stehr.pdf (accessed on 10 March 2022).
- Molinos-Senante, M.; Gonzalez, D. Evaluation of the economics of desalination by integrating greenhouse gas emission costs: An empirical application for Chile. Renew. Energy 2019, 133, 1327–1337. [Google Scholar] [CrossRef]
- ENRH. Chile Cuida su Agua. Estrategia Nacional de Recursos Hídricos 2012–2025. 2013. Available online: http://www.mop.cl/Documents/ENRH_2013_OK.pdf (accessed on 8 April 2022).
- PNRH. Política Nacional para los Recursos Hídricos 2015. Delegación Presidencial para los Recursos Hídricos, Ministerio del Interior y Seguridad Pública. Enero. 2015, pp. 1–104. Available online: http://www.interior.gob.cl/media/2015/04/recursos_hidricos.pdf (accessed on 10 April 2022).
- DGA, Dirección General de Aguas, Decretos Declaración Zona de Escasez Vigentes, Ministerio de Obras Publicas. 2022. Available online: https://dga.mop.gob.cl/DGADocumentos/Decretos_vigentes.jpg (accessed on 12 April 2022).
- Ministerio de Hacienda. Minuta Ejecutiva Nº 4 Programa de Agua Potable Rural. 2007. Available online: http://www.dirplan.cl/centrodedocumentacion/Documents/Planes/Monitoreo_Planes/Evaluacion_Programas/Eval_Dipres_APR/MINUTA_EJECUTIVA_EVALUACION_APR_2007.pdf (accessed on 15 April 2022).
- SUBPESCA. Gobierno Promulga ley Que Crea el Instituto Nacional de Desarrollo Sustentable de la Pesca Artesanal y de la Acuicultura de Pequeña Escala (INDESPA). 2018. Available online: https://www.subpesca.cl/portal/617/w3-article-99780.html (accessed on 28 April 2022).
- Herrera-León, S.; Cruz, C.; Negrete, M.; Chacana, J.; Cisterna, L.; Kraslawski, A. Impact of seawater desalination and wastewater treatment on water stress levels and greenhouse gas emissions: The case of Chile. Sci. Total Environ. 2022, 818, 151853. [Google Scholar] [CrossRef] [PubMed]
- SEA. Servicio de Evaluación Ambiental. 2022. Available online: https://www.sea.gob.cl/ (accessed on 5 June 2022).
- Molina, A.; Falvey, M.; Rondanelli, R. A solar radiation database for Chile. Nat. Sci. Rep. 2017, 7, 14823. [Google Scholar] [CrossRef] [Green Version]
- Homer Pro. Microgrid Software for Designing Optimized Hybrid Microgrids. 2022. Available online: https://www.homerenergy.com/products/pro/index.html# (accessed on 4 October 2022).
- Kholod, N.; Evans, M.; Khan, Z.; Hejazi, M.; Chaturvedi, V. Water-energy-food nexus in India: A critical review. Energy Clim. Chang. 2021, 2, 100060. [Google Scholar] [CrossRef]
- Asadi, S.; Mohammadi-Ivatloo, B. Food-Energy-Water Nexus Resilience and Sustainable Development, 3rd ed.; Springer International Publishing: Cham, Switzerland, 2020; pp. 154–196. [Google Scholar]
- United Nations Development Programme. Water Governance; Issue Sheet; United Nations Development Programme: Stockholm, Sweden, 2016; Available online: https://www.h2o-initiative.org/wp-content/uploads/documents-public/Generic/UNDP-2016-Issue-sheet-Water-Governance.pdf (accessed on 2 December 2022).
- Naciones Unidas. Informe Mundial de las Naciones Unidas Sobre el Desarrollo de los Recursos Hídricos 2021: El Valor del Agua; UNESCO: París, France, 2021; Available online: https://unesdoc.unesco.org/ark:/48223/pf0000378890 (accessed on 15 May 2022).
- Prajapati, M.; Shah, M.; Soni, B. A review of geothermal integrated desalination: A sustainable solution to overcome potential freshwater shortages. J. Clean. Prod. 2021, 326, 129412. [Google Scholar] [CrossRef]
- Sarathe, S.; Baredar, B.V.; Dwivedi, G.; Tapdiya, S.; Gaurav, A. Review of various types of renewable-powered desalination technologies with economic analysis. Mater. Today Proc. 2022, 56, 326–335. [Google Scholar] [CrossRef]
- Sabogal, D.G.; Carlos, M.; del Castillo, B.; Willems, S.; Bleeker, F.; Meza, H.; Bellfield, C.; Rengifo, T. Peñaherrera. 2018. Manual Metodológico Para el Análisis del Nexo Agua-Energía-Alimentos en Cuencas Amazónicas; Global Canopy: Oxford, UK, 2018. [Google Scholar]
- De la Fuente, J.A.; Ovejero, M.; Queralt, I. Gestión Medioambiental de Salmueras en Plantas de Desalación Marina; España, Geo-Temas 10: 2008; Sociedad Geológica de España: Salamanca, Spain, 2008; ISSN 1567-5172. [Google Scholar]
- Alsarayreh, A.A.; Al-Obaidi, M.A.; Al-Hroub, A.M.; Patel, R.; Mujtaba, I.M. Evaluation and minimisation of energy consumption in a mediumscale reverse osmosis brackish water desalination plant. J. Clean. Prod. 2020, 248, 119220. [Google Scholar] [CrossRef]
- Elsaid, K.; Kamil, M.; Taha Sayed, E.; Ali Abdelkareem, M.; Wilberforce, T.; Olabi, A. Environmental impact of desalination technologies: A review. Sci. Total Environ. 2020, 748, 141528. [Google Scholar] [CrossRef] [PubMed]
- Dévora-Isiordia, G.E.; Gonzalez-Enriquez, R.; Ruiz Cruz, S. Evaluación de procesos de desalinización y su desarrollo en México. Tecnol. Cienc. Agua 2013, 4, 27–46. [Google Scholar]
- Lattemann, S.; Höpner, T. Environmental impact and impact assessment of seawater desalination. Desalination 2008, 220, 1–15. [Google Scholar] [CrossRef]
- Kabeel, A.E.; Hamed, A.M.; El-Agouz, S.A. Cost analysis of different solar still configurations. Energy 2010, 35, 2901–2908. [Google Scholar] [CrossRef]
- Ihsanullah, I.; Atieh, M.A.; Sajid, M.; Nazal, M.K. Desalination and environment: A critical analysis of impacts, mitigation strategies, and greener desalination technologies. Sci. Total Environ. 2021, 780, 146585. [Google Scholar] [CrossRef]
- Behnam, P.; Faegh, M.; Khiadani, M. A review on state-of-the-art applications of data-driven methods in desalination systems. Desalination 2022, 532, 115744. [Google Scholar] [CrossRef]
- Cornejo-Ponce, L.; Vilca-Salinas, P.; Lienqueo-Aburto, H.; Arenas, M.J.; Pepe-Victoriano, R.; Carpio, E.; Rodríguez, J. Integrated Aquaculture Recirculation System (IARS) Supported by Solar Energy as a Circular Economy Alternative for Resilient Communities in Arid/Semi-Arid Zones in Southern South America: A Case Study in the Camarones Town. Water 2020, 12, 3469. [Google Scholar] [CrossRef]
- Kinnari, M.S.; Billinge, I.H.; Chen, X.; Fan, H.; Huang, Y.; Winton, R.K.; Yip, N.Y. Drivers, challenges, and emerging technologies for desalination of high-salinity brines: A critical review. Desalination 2022, 538, 115827. [Google Scholar]
- Giwa, A.; Dufour, V.; Al Marzooqi, F.; Al Kaabi, M.; Hasan, S.W. Brine management methods: Recent innovations and current status. Desalination 2017, 407, 1–23. [Google Scholar] [CrossRef]
- Hajbi, F.; Hammi, H.; M’nif, A. Reuse of RO Desalination Plant Reject Brine. J. Phase Equilibria Diffus. 2017, 31, 4. [Google Scholar] [CrossRef]
- Alameddine, I.; El-Fadel, M. Brine discharge from desalination plants: A modeling approach to an optimized outfall design. Desalination 2007, 214, 241–260. [Google Scholar] [CrossRef]
- Soliman, M.N.; Guen, F.Z.; Ahmed, S.A.; Saleem, H.; Khalil, M.J.; Zaidi, S.J. Energy consumption and environmental impact assessment of desalination plants and brine disposal strategies. Process Saf. Environ. 2021, 147, 589–608. [Google Scholar] [CrossRef]
- Manju, S.; Sagar, N. Renewable energy integrated desalination: A sustainable solution to overcome future fresh-water scarcity in India. Renew. Sustain. Energy Rev. 2017, 73, 594–609. [Google Scholar] [CrossRef]
- Fuentes-Bargues, J.L. Analysis of the process of environmental impact assessment for seawater desalination plants in Spain. Desalination 2014, 347, 166–174. [Google Scholar] [CrossRef]
- Chenoweth, J.A.; Al-Masri, R. Cumulative effects of large-scale desalination on the salinity of semi-enclosed sea. Desalination 2022, 526, 115522. [Google Scholar] [CrossRef]
- Worldmeters. Población Mundial Actual. 2022. Available online: https://www.worldometers.info/es/poblacion-mundial/ (accessed on 15 May 2022).
- Cornejo-Ponce, L.; Vilca-Salinas, P.; Arenas, M.J.; Lienqueo-Aburto, H.; Moraga-Contreras, C. Use of saline waste from a desalination plant under the principles of the circular economy for the sustainable development of rural communities. In Circular Economy—Recent Advances of Sustainable Waste Management, 2nd ed.; Zhang, T., Ed.; Intech Open: London, UK, 2022; p. 25. [Google Scholar]
- Sanna, A.; Buchspies, B.; Mathias Ernst, M.; Kaltschmitt, M. Decentralized brackish water reverse osmosis desalination plant based on PV and pumped storage—Technical analysis. Desalination 2021, 516, 115232. [Google Scholar] [CrossRef]
- Saavedra, A.; Valdes, H.; Mahn, A.; Acosta, O. Comparative Analysis of Conventional and Emerging Technologies for Seawater Desalination: Northern Chile as A Case Study. Membranes 2021, 11, 180. [Google Scholar] [CrossRef]
- HS Eficiencia Energética, Hora Solar Pico (HSP). 2022. Available online: https://certificacionenergetica.info/hora-solar-pico-hsp/ (accessed on 21 September 2022).
- Área Tecnológica, Cálculo de Baterías. 2022. Available online: https://www.areatecnologia.com/electricidad/calculo-fotovoltaica.html/ (accessed on 21 September 2022).
- Estevan, A.; García, M. El consumo de energía en la desalación de agua de mar por ósmosis inversa: Situación actual y perspectivas. Ing. Civ. 2007, 148, 113–121. [Google Scholar]
- Xu, H.; Gu, X.; Jia, T.; Dai, Y. Experimental investigation and optimization of a solar desalination unit with high heat recovery ratio using weak air compression process. Energy Convers. Manag. 2022, 255, 115369. [Google Scholar] [CrossRef]
- Delgado-Torres, A.M.; García-Rodríguez, L. Off-grid SeaWater Reverse Osmosis (SWRO) desalination driven by hybrid tidal range/solar PV systems: Sensitivity analysis and criteria for preliminary design. Sustain. Energy Technol. Assess. 2022, 53, 102425. [Google Scholar] [CrossRef]
- Karabelas, A.J.; Koutsou, C.P.; Kostoglou, M.; Sioutopoulos, D.C. Analysis of specific energy consumption in reverse osmosis desalination processes. Desalination 2018, 431, 15–21. [Google Scholar] [CrossRef]
- Jones, E.; Qadir, M.; Van Vliet, M.T.H.; Smakhtin, V.; Kang, S. The state of desalination and brine production: A global outlook. Sci. Total Environ. 2019, 657, 1343–1356. [Google Scholar] [CrossRef] [PubMed]
- GIZ, Centro de Energía Universidad de Chile, Ministerio de Energía Revisión. Identificación de Zonas Para el Desarrollo de Proyectos Integrales de Agua y Energía. Agua–Energía–SIG–Análisis Territorial; Palma Behnke, R., Tello Guerra, P., Eds.; Centro de Energía Universidad de Chile: Santiago, Chile, 2020; p. 118. Available online: https://4echile.cl/wp-content/uploads/2022/01/Anexos_Informe_final_Agua_Energia_publicable.pdf (accessed on 27 November 2022).
- Alvez, A.; Aitken, D.; Rivera, D.; Vergara, M.; McIntyre, N.; Concha, F. At the crossroads: Can desalination be a suitable public policy solution to address water scarcity in Chile’s mining zones? J. Environ. Manag. 2020, 258, 110039. [Google Scholar] [CrossRef] [PubMed]
- Solargis. Solar Resource Maps of Chile. Photovoltaic Electricity Potential. © 2020 The World Bank, Source: Global Solar Atlas 2.0, Solar Resource Data: Solargis. Available online: https://solargis.com/es/maps-and-gis-data/download/chile (accessed on 28 November 2022).
- Aladyr, Asociación Latinoamericana de Desalación y Reúso de Agua. Desalación de Agua de Mar: Situación en Chile y en el Mundo. Presentación Comisión Especial Sobre Recursos Hídricos del Senado de Chile. 2019. Available online: https://www.senado.cl/appsenado/index.php?mo=tramitacion&ac=getDocto&iddocto=7039&tipodoc=docto_comision (accessed on 8 November 2022).
- Das, S.; Ray, A.; De, S. Optimización tecnoeconómica del proceso de desalinización alimentado por energía renovable: Un estudio de caso para un pueblo costero del sur de la India. Sustain. Energy Technol. Assess. 2022, 51, 101966. [Google Scholar]
- Hamdan, H.; Saidy, M.; Alameddine, I.; Al-Hindi, M. The feasibility of solar-powered small-scale brackish water desalination units in a coastal aquifer prone to saltwater intrusion: A comparison between electrodialysis reversal and revers osmosis. J. Environ. Manag. 2021, 290, 112604. [Google Scholar] [CrossRef]
- Bundschuh, J.; Kaczmarczyk, M.; Ghaffour, N.; Tomaszewska, B. State-of-the-art of renewable energy sources used in water desalination: Present and future prospects. Desalination 2021, 508, 115035. [Google Scholar] [CrossRef]
- Eltawil, M.A.; Alamri, A.M.; Azam, M.M. Design a novel air to water pressure amplifier powered by PV system for reverse osmosis desalination. Renew. Sustain. Energy Rev. 2022, 160, 112295. [Google Scholar] [CrossRef]
- Jones, M.A.; Odeh, I.; Haddad, M.; Mohammad, A.H.; Quinn, J.C. Economic analysis of photovoltaic (PV) powered water pumping and desalination without energy storage for agriculture. Desalination 2016, 387, 35–45. [Google Scholar] [CrossRef]
- SUBPESCA, Desaladoras, Internet y Reparación de Embarcaciones: Gobierno Dispone Fondo por más de $1.100 Millones Para Apoyar a Pescadores. 2021. Available online: https://www.subpesca.cl/portal/617/w3-article-110582.html (accessed on 8 September 2022).
- Boletín N° 13.191-12, Proyecto de Ley Marco de Cambio Climático. 2022. Available online: https://leycambioclimatico.cl/wp-content/uploads/2020/04/ProyectoLey-Boletin1319212.pdf (accessed on 25 May 2022).
- United Nations Framework Convention on Climate Change (UNFCCC). Available online: https://unfccc.int/es/process-and-meetings/que-es-la-convencion-marco-de-las-naciones-unidas-sobre-el-cambio-climatico (accessed on 25 June 2022).
- Campero, C.; Harris, L.M.; Kunz, N.C. De-politicising seawater desalination: Environmental Impact Assessments in the Atacama mining Region, Chile. Environ. Sci. Policy 2021, 120, 187–194. [Google Scholar] [CrossRef]
- Jiménez, S.; Wainer, I. Serie informe Económico 263. Realidad del Agua en Chile: ¿Escasez o falta de infraestructura? Lib. Y Desarro. 2017, 263, 20. [Google Scholar]
- Bulletin No. 9862-33, Empowers the State to Create Desalination Plants, House of Representatives. 2015. Available online: https://www.camara.cl/pley/pley_detalle.aspx?prmID=10286 (accessed on 25 May 2022).
- DIRECTEMAR, Guía para la Evaluación Ambiental de Proyectos Industriales de Desalación en Jurisdicción de la Autoridad Marítima. Dirección General del Territorio Marítimo y de Marina Mercante. Armada de Chile. 2021. Available online: https://www.directemar.cl/directemar/site/docs/20211115/20211115120951/guia_desaladoras_2021__vf_2.pdf (accessed on 30 May 2022).
- Liu, T.-K.; Sheu, H.-T.; Tseng, C.-N. Environmental impact assessment of seawater desalination plant under the framework of integrated coastal management. Desalination 2013, 326, 10–18. [Google Scholar] [CrossRef]
- Declaración de Impacto Ambiental, "Módulos de desalación de agua de mar, Ventanas Nº 3". Plan de Cumplimiento de la Legislación Ambiental Applicable. Empresa Eléctrica Ventanas S.A. 2018. Available online: https://seia.sea.gob.cl/archivos/2018/03/14/Plan_de_cumplimiento_de_la_legislacion_ambiental_aplicable.pdf (accessed on 25 May 2022).
- PROY-NOM-013-CON AGUA/SEMARNAT-2015, Which Establishes Specifications and Requirements for Supply and Discharge Installations in Desalination Plants or Processes that Generate Brackish or Saline Wastewater, Draft of Official. Mexican Standard. 2017. Available online: https://www.cmic.org.mx/comisiones/Sectoriales/infraestructurahidraulica/Normas/Seguimiento_CMIC_en_las_Normas/NOM_3_Plantas_Desalinizadoras/15_reunion/PROY-NOM-013-CONAGUA-2015%20c.pdf (accessed on 2 December 2022).
- Natura Energy. 2022. Available online: https://www.naturaenergy.cl/article/off-grid-desalinizadora-pan-de-azucar (accessed on 21 September 2022).
- SeaTemperature, Temperatura del Agua en Chañaral. 2022. Available online: https://seatemperature.info/es/chanaral-temperatura-del-agua-del-mar.html (accessed on 16 November 2022).
- Biblioteca del Congreso Nacionl de Chile, Decreto 57, Fija Fórmulas Tarifarias de los Servicios de Producción y Distribución de Agua Potable y Recolección y Disposición de Aguas Servidas Para la Empresa Nueva Atacama S.A. (Antes Aguas Chañar S.A.). 2022. Available online: https://www.bcn.cl/leychile/navegar?i=1167267&f=2021-10-29 (accessed on 17 November 2022).
- Papapetrou, M.; Cipollina, A.; La Commare, U.; Micale, G.; Zaragoza, G.; Kosmadakis, G. Assessment of methodologies and data used to calculate desalination costs. Desalination 2017, 419, 8–19. [Google Scholar] [CrossRef]
- Fthenakis, V.; Atia, A.A.; Morin, O.; Bkayrat, R.; Sinha, P. New prospects for PV powered water desalination plants: Case studies in Saudi Arabia. Prog. Photovolt. Res. Appl. 2015, 24, 543–550. [Google Scholar] [CrossRef]


| Type of Process | Technology | Key Influential Parameter | Main Remarks | Energy Type | Energy Used kWhm−3 |
|---|---|---|---|---|---|
| Filtration | Electrodialysis (ED) |
|
| Electric | 5.5 |
| Forward Osmosis (FO) |
|
| Electric | 0.5 | |
| Membrane Distillation (MD) |
|
| Thermal | 0.75 | |
| |||||
| Reverse Osmosis (RO) |
|
| Electric | 8.2 | |
| Thermal | Multistage Stage Flash (MSF) Distillation |
|
| Thermal | 5.2 |
| Solar Still (SS) |
|
| Thermal | - | |
| HDH |
|
| Electric | 0.3 | |
| MED |
|
| Electric/Thermal | 5.5–9 |
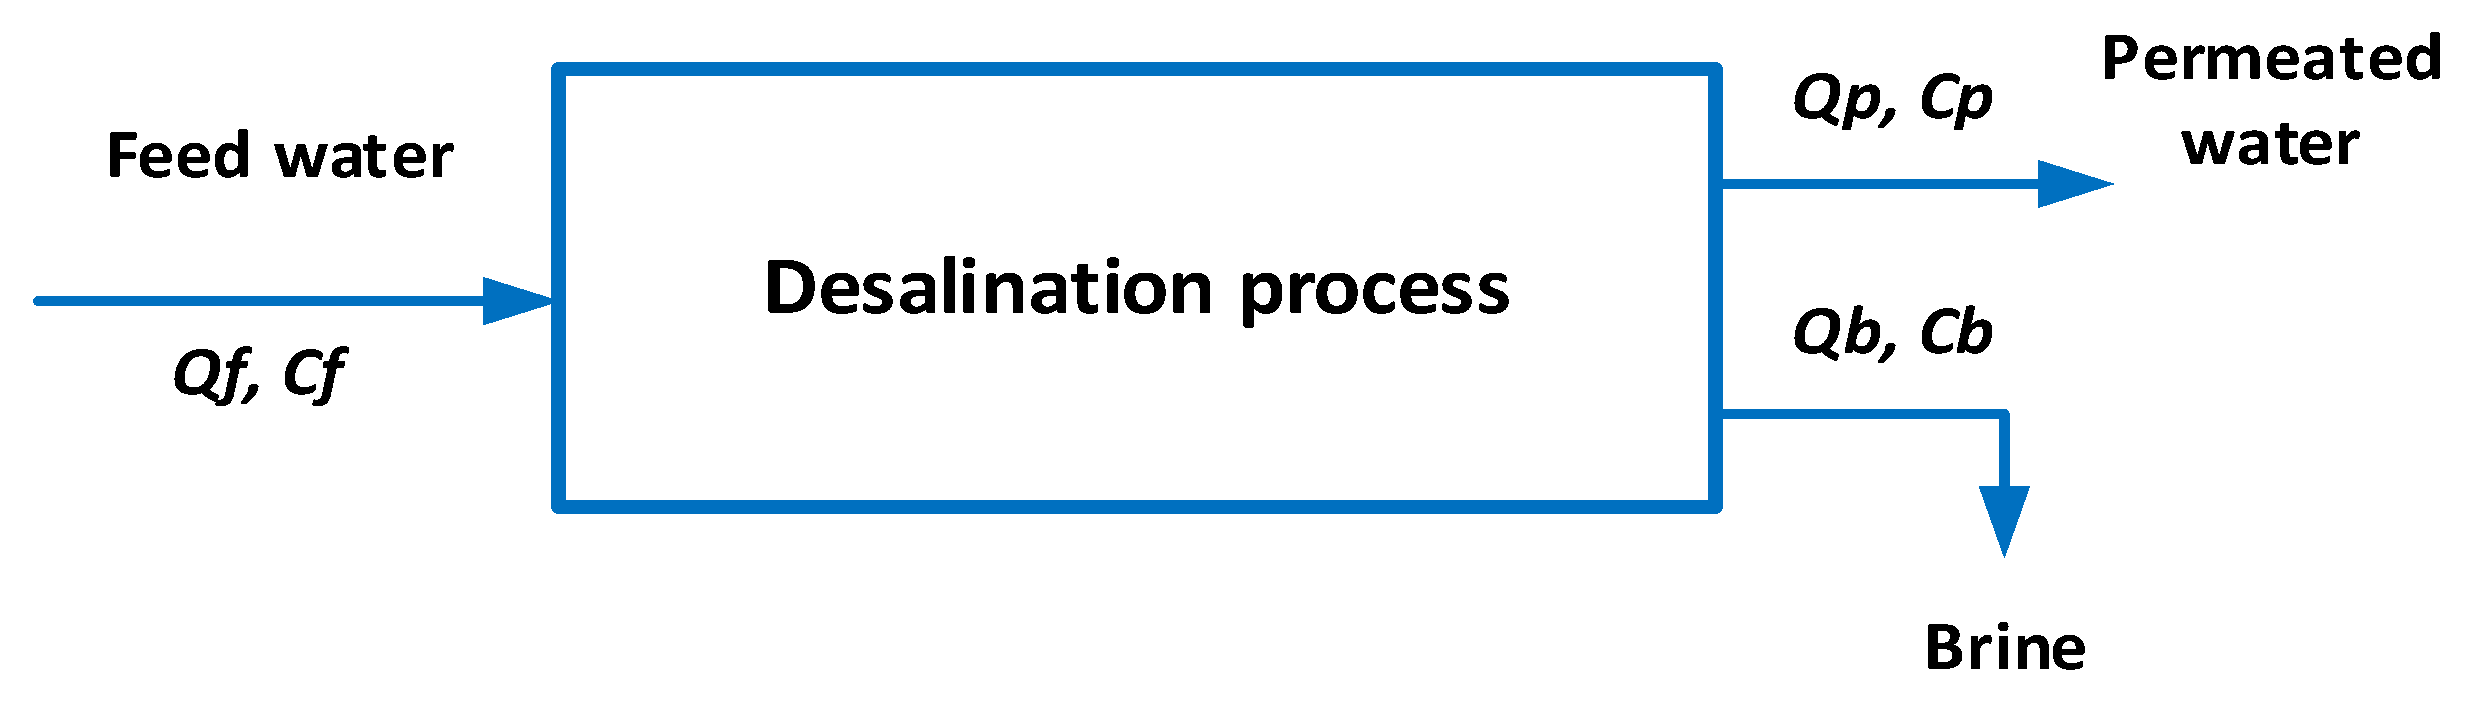
| Item | Equation | Definition |
|---|---|---|
| Charge balance (Qf) | Qf = Qp + Qb (1) | Corresponds to the production of permeated water plus reject water, in proportions of 50% and 50%, respectively, in the case of reverse osmosis. |
| Rejection factor (R) | R = (Cf − Cp)/Cf × 100 (2) | Corresponds to the rejection of salts from the membranes and in a membrane system, it is the factor that determines the final quality of the permeated water of a distillation system. |
| Salt passage (SP) | SP (%) = 100 − R (3) | It corresponds to the ratio between the salt concentration of the product and the feed, measured as a percentage. |
| Conversion (Y) | Y (%) = Qp/Qf ∗ 100 (4) | It corresponds to the percentage ratio between the permeated flow rate and the water flow rate entering the desalination process. |
| Concentration factor (CF) | CF = 100/(100 − Y) (5) | Corresponds to the number of times the brine is concentrated with respect to the feed water. |
| Technology | Location | Capacity m3d−1 | Salinity mgL−1 | Specific Energy Consumption kWhm−3 | Cost USD m−3 |
|---|---|---|---|---|---|
| PV-RO without battery | Australia | 0.4 | 5000 | 1.86 | 10–12 |
| PV-RO with biodiesel | India | 0.5 | SW * | - | - |
| PV-RO with battery | West Bank | 10 | 2680 | 2.30 | 3.17 |
| PV-RO with battery | Indonesia | 12 | 3500 | 8.00 | 3.68 |
| PV-RO | UAE | 20 | SW * | 7.33 | 6.87 |
| PV-RO with diesel | UAE | 20 | SW * | 7.73 | 7.39 |
| Wind-diesel-battery | Turkey | 24 | SW * | 4.38 | 2.20 |
| PV-RO with battery | KSA | 100 | SW * | 6.30 | 4.55 |
| PV-RO with battery | KSA | 100 | SW * | 5.70 | 4.55 |
| PV-RO grid | UAE | 200 | SW * | 6.99 | 2.06 |
| RO | Chile | - | 3500 | 3.50 | - |
| Country/State | Applicable to | National Regulation | Maximun Limited |
|---|---|---|---|
| Brazil | Promotes and manages the implementation of desalination units to serve low-income populations in remote communities in the Brazilian semi-arid region. | Agua Doce, a permanent public policy aimed at ensuring access to good-quality water for human consumption, since 1994. | |
| Chile | Effluent standards. | Environmental norms, established in the Supreme Decree N° 90/01. | Discharge of liquid wastes into marine waters inside the coastal protection zone. Discharge of liquid waste into marine water outside of the coastal protection zone. |
| Mexico | General specifications and requirements for desalination plants, considering the discharge of wastewater into the sea, the quality of wastewater, and the discharge of wastewater on sea beaches, as well as the infiltration or injection of reject water into wells. | “PROY-NOM-013-CON AGUA/SEMANAT-2015: establishes the specifications and requirements for the intake and discharge works, that must be met in the desalination plants or processes that generate brackish or saline rejection water.” | pH 6–9 SST 20 mgL−1 DQO 100 mgL−1 Total phosphorus 5 mgL−1 Copper 6 mgL−1 Cadmium 0.4 mgL−1 Among others |
| Kingdom of Saudi Arabia | Comply with guidelines in the discharge permit. | The Public Environmental Law (Royal Decree No. M/34, 2001) guidelines for the concentrations in the discharge and at the edge of the mixing zone (size on a case by case basis). | |
| For the direct discharge: water desalination plants. | General Environmental Regulations and Rules for the Implementation Guidelines for the Classification of Industrial and Development Projects. Key Principles for the Environmental Assessment of the Project. | Chlorine only (residual) 0.5 mgL−1. | |
| Countries bordering the Mediterranean Sea (France, Greece, Israel, Italy, Lebanon, Libya, Malta, Morocco, Monaco, Syria, Tunisia, Turkey, and Yugoslavia) | Agreement limiting the physicochemical discharge rates (salt, chlorine, temperature, etc.) and requiring an environmental impact study. | Benaissa et al., 2017. BTelluric Protocol to the Barcelona Convention Annex I: A1; B Annex II: A13 “Substances which, although not of a toxic nature, may be harmful to the marine environment or hinder any legitimate use of the sea, as a result of the quantities discharged.” | Does not report the maximum allowable limit. Does not report the maximum allowable limit. |
| Spain | A wastewater treatment plant when any of the following situations occurs: i. The capacity of the plant exceeds 150,000 in population equivalents. ii. When the discharge of the effluent affects an aquatic environment, classified as sensitive. iii. When the location of the effluent discharge is close to the human supply intakes upstream, in the case of a river. | Royal Decree 1302/1986, Group 8. Hydraulic engineering and water management projects. | |
| United States, California | All desalination facilities discharging brine into ocean waters, including facilities that commingle brine and wastewate. | Water Quality Control Plan for the Ocean Waters of California, Effective 7 April 2016 Clean Water Act, National Pollutant Discharge Elimination System Permit Program, National Environmental Policy Act. | Discharges shall not exceed a daily maximum of 2.0 parts per thousand (ppt) above the natural background salinity. Considering seawater salinity is 35,000 ppm. |
| Region | Qf m3d−1 | Qp m3d−1 | Qb m3d−1 | R % | SP % | Y % | CF |
|---|---|---|---|---|---|---|---|
| XV | 226 | 113 | 113 | 50 | 50 | 50 | 2 |
| I | 80 | 40 | 40 | 50 | 50 | 50 | 2 |
| II | 185 | 92 | 92 | 50 | 50 | 50 | 2 |
| III | 62 | 31 | 31 | 50 | 50 | 50 | 2 |
| IV | 158 | 79 | 79 | 50 | 50 | 50 | 2 |
| V | 1369 | 684 | 684 | 50 | 50 | 50 | 2 |
| VI * | 0 | 0 | 0 | 0 | 0 | 0 | 0 |
| VII | 1028 | 514 | 514 | 50 | 50 | 50 | 2 |
| VIII | 260 | 130 | 130 | 50 | 50 | 50 | 2 |
| IX * | 0 | 0 | 0 | 0 | 0 | 0 | 0 |
| X | 6.04 | 3.02 | 3.02 | 50 | 50 | 50 | 2 |
| XI | 56 | 28 | 28 | 50 | 50 | 50 | 2 |
| XII-XIV-XVI * | 0 | 0 | 0 | 0 | 0 | 0 | 0 |
| RODP Plant Information | Value | Units |
|---|---|---|
| Model of the reverse osmosis membrane | 4040 VONTRON * | |
| Number of membranes | 2 | - |
| Raw water pump | ||
| Power | 0.75 | kW |
| Voltage | 220 | V |
| Frequency | 50 | Hz |
| Pressure pump | ||
| Power | 1.5 | kW |
| Voltage | 220 | V |
| Minimum salt rejection | 99.7 | % |
| Freshwater nominal flow | 45.7 | m3d−1 |
| Maximum operating pressure | 600 | psi |
| Maximum recovery rate | 15 | % |
| Maximum water temperature | 45 | °C |
| Brackish water pH range | 3–10 | - |
| System power | 2.25 | kW |
| Properties | Value | Units | |
|---|---|---|---|
| Case 1 | |||
| EG | Type of electrical network | BT1 | |
| Tariff sector | STxB-1-A * | ||
| Electric company | Emelat | ||
| Case 2 | |||
| DG | Model (Brand) | HYG7750E (Hyundai) a | |
| Feeding | Gasoline | ||
| Voltage | 220 | V | |
| Rated energy (Maximum energy) | 5000 (5500) | W | |
| Frequency | 50 | Hz | |
| Tank capacity | 25 | L | |
| Lifetime | 15,000 | hr | |
| Case 3 | |||
| PV without Battery | Solar module | ||
| Module type (Brand) | Poli SPLITMAX (Trinasolar) b | ||
| Nominal Power | 335 | Wp | |
| Cell orientation | 144 polycrystalline cells (6 × 24) | ||
| Module cover | AR Coated tempered glass | ||
| Temperature coefficient of the solar module | −0.41 | %°C−1 | |
| NOCT | 44 (±2) | °C | |
| Maximum efficiency | 17.4 | % | |
| Module dimensions | 2000 × 992 × 40 | mm | |
| Weight | 23 | kg | |
| Inverter | |||
| Model (Brand) | 7–8 (Single Phase Inverter, Solis) c | ||
| Input DC | |||
| Recommended max. PV power | 12 | kW | |
| Max. input voltage | 600 | V | |
| Rated voltage (Start-up voltage) | 330 (120) | V | |
| MPPT voltage range | 90–520 | V | |
| Max. input current | 12.5/25 | A | |
| Max. short circuit current | 19.5/30 | A | |
| Output AC | |||
| Max. output power | 8 | kW | |
| Rated grid frequency | 50/60 | Hz | |
| Max. output current | 34.8 | A | |
| Inverter efficiency | 98.1 | % | |
| Photovoltaic generator | |||
| No. solar module | 24 | - | |
| Array type | Fixed inclined plane | ||
| Tilt | 20 | degrees | |
| Azimuth (Orientation) | 0 (North oriented) | degrees | |
| Case 4 | |||
| PV with Battery | Solar module | Same Case 3 | USD |
| Inverter | Same Case 3 | USD | |
| Battery bank | |||
| Model (Brand) | Battery-Box Premium HVM (BYD) d | ||
| Battery Module | HVM (2.76 kWh, 51.2 V, 38 kg) | ||
| Number of Modules | 5 | - | |
| Usable Energy | 13.8 | kWh | |
| Max output current (peak output current) | 50 (75) | A | |
| Nominal voltage | 256 | V | |
| Operating voltage | 200–300 | V | |
| Dimensions | 1411 × 585 × 298 | mm | |
| Weight | 205 | kg | |
| SmartSolar Charge Control | |||
| Model (Brand) | MPPT 250/85 (Victron energy) e | ||
| Efficiency | 99 | % | |
| Voltage | 12/24/48 (Auto Select) | V | |
| Max. PV short circuit current | 70 | A | |
| Operating temperature | (−30, 60) | °C | |
| Battery terminals | 35 | mm²/AWG2 | |
| Small-scale RODP | |||
| RODP | Model of reverse osmosis membrane | 4040 VONTRON | |
| System power | 2.25 | kW | |
| Minimum salt rejection | 99.7 | % | |
| Properties | Value | Units | |
|---|---|---|---|
| Case 1 | |||
| EG | Consumer price | 0.161 | USD/kW−1h−1 |
| Injection price | 0.079 | USD/kW−1h−1 | |
| Case 2 | |||
| DG | Initial capital | 798.4 | USD |
| Replacement | 798.4 | L hr−1kW−1 | |
| O&M | 0.274 | USD/hr−1 of operation | |
| Fuel price | 1.24 | USD/L−1 | |
| Lifetime | 15,000 | hr | |
| Case 3 | |||
| PV without Battery | Solar module | 146.6 * | USD |
| Inverter | 1631.6 * | USD | |
| Photovoltaic structure installation | 184.4 * | USD | |
| 2 Victron MPPT Smart Solar 85A 250V controllers | 2251.5 | USD | |
| Caso 4 | |||
| PV with Battery | Solar module | 146.6 * | USD |
| Inverter | 1631.6 * | USD | |
| Photovoltaic structure installation ** | 184.4 * | USD | |
| 2 Victron MPPT Smart Solar 85A 250V controllers | 2251.5 | USD | |
| Battery bank | 9372.9 | USD | |
| Battery O&M | 100 | USD/year−1 | |
| PV O&M | 144 | USD/year−1 | |
| Inverter O&M | 50 | USD/year−1 | |
| Small-scale RODP | |||
| RODP | Investment cost | 10,396.6 | USD |
| Cost of O&M | 2.7% of cost of capital | ||
| Component | Capital USD | Replacement USD | O&M USD | Fuel USD | Salvage USD | Total USD | LCOE USD |
|---|---|---|---|---|---|---|---|
| Case 1 (EG) | 0.0 | 0.0 | 7661.1 | 0.0 | 0.0 | 7661.1 | 0.16 |
| Case 2 (DG) | 1516.9 | 9725.6 | 52,811.3 | 32,668.6 | (154.75) | 96,567.7 | 2.03 |
| Case 3 (Grid + PV without Battery) | 5303.1 | 1336.6 | (3415.9) | 0.0 | (499.3) | 2724.5 | 0.02 |
| Inverter | 1631.6 | 525.7 | 540.9 | 0.0 | 82.4 | 2615.9 | |
| PV | 3671.5 | 810.9 | 1596.9 | 0.0 | 416.9 | 5662.4 | |
| Grid | 0.0 | 0.0 | (5553.8) | 0.0 | 0.0 | (5553.8) | |
| Case 4 (PV with Battery) | 34,089.5 | 14,048.6 | 2571.4 | 0.0 | (246.3) | 50,463.2 | 1.24 |
| Inverter | 1672.4 | 538.8 | 509.1 | 0.0 | (246.3) | 2474.1 | |
| PV | 3671.5 | 0.0 | 1466.2 | 0.0 | $0.0 | 5137.7 | |
| Battery | 28,745.7 | 13,509.8 | 596.0 | 0.0 | $0.0 | 42,851.5 |
| Month | Permeated Water m3 | RO Unit Energy Consumption kWh | Case 1 (RODP + EG) | Case 2 (RODP + GE) | Case 3 (RODP + PV + Grid) | Case 4 (RODP + PV + Battery) | ||||||
|---|---|---|---|---|---|---|---|---|---|---|---|---|
| Net Energy Purchased to the Grid kWh | Energy Charge USD | Generator Set Output Power kWh | Fuel Consumption L | Fuel Consumption Expense USD | PV Power Output kWh | Grid Purchases kWh | Grid Purchases USD | PV Power Output kWh | Battery Energy Content kWh | |||
| Jan | 248 | 341 | 341 | 54.9 | 477.8 | 191.8 | 237.8 | 1386.6 | 47.7 | 7.7 | 1386.6 | 30,693.9 |
| Feb | 224 | 305 | 305 | 49.1 | 429.6 | 172.9 | 214.4 | 1262.3 | 45.4 | 7.3 | 1262.3 | 27,712.8 |
| Mar | 248 | 360 | 360 | 58.0 | 496.2 | 196.2 | 243.3 | 1180.6 | 73.6 | 11.9 | 1180.6 | 30,268.1 |
| Apr | 240 | 339 | 339 | 54.6 | 471.2 | 187.9 | 233.0 | 870.0 | 93.2 | 15.0 | 869.9 | 28,865.2 |
| May | 248 | 342 | 342 | 55.1 | 480.1 | 192.5 | 238.6 | 731.4 | 108.2 | 17.4 | 731.4 | 28,897.5 |
| Jun | 240 | 341 | 341 | 54.9 | 473.1 | 188.4 | 233.6 | 665.6 | 122.6 | 19.7 | 665.6 | 27,188.4 |
| Jul | 248 | 346 | 346 | 55.6 | 483.3 | 193.3 | 239.7 | 726.6 | 115.6 | 18.6 | 726.6 | 29,377.6 |
| Aug | 248 | 364 | 364 | 58.6 | 499.9 | 197.2 | 244.6 | 787.7 | 116.3 | 18.7 | 787.7 | 28,154.2 |
| Sept | 240 | 343 | 343 | 55.2 | 474.7 | 188.7 | 234.0 | 910.1 | 92.0 | 14.8 | 910.1 | 28,241.0 |
| Oct | 248 | 344 | 344 | 55.4 | 481.9 | 192.9 | 239.2 | 1031.3 | 72.7 | 11.7 | 1031.3 | 30,261.6 |
| Nov | 240 | 334 | 334 | 53.8 | 467.4 | 187.1 | 232.0 | 1126.4 | 72.4 | 11.7 | 1126.4 | 29,237.5 |
| Dec | 248 | 348 | 348 | 56.1 | 485.6 | 194.0 | 240.6 | 1345.4 | 58.4 | 9.4 | 1345.4 | 30,596.9 |
| Annual Average | 2920 | 4109 | 4109 | 661.6 | 5720.8 | 2282.8 | 2830.6 | 12,024.0 | 1018.1 | 163.9 | 12,023.9 | 349,494.7 |
| Challenges | Opportunities | |
|---|---|---|
| Environmental |
|
|
| Economic |
|
|
| Social |
|
|
Publisher’s Note: MDPI stays neutral with regard to jurisdictional claims in published maps and institutional affiliations. |
© 2022 by the authors. Licensee MDPI, Basel, Switzerland. This article is an open access article distributed under the terms and conditions of the Creative Commons Attribution (CC BY) license (https://creativecommons.org/licenses/by/4.0/).
Share and Cite
Cornejo-Ponce, L.; Vilca-Salinas, P.; Arenas-Herrera, M.J.; Moraga-Contreras, C.; Tapia-Caroca, H.; Kukulis-Martínez, S. Small-Scale Solar-Powered Desalination Plants: A Sustainable Alternative Water-Energy Nexus to Obtain Water for Chile’s Coastal Areas. Energies 2022, 15, 9245. https://0-doi-org.brum.beds.ac.uk/10.3390/en15239245
Cornejo-Ponce L, Vilca-Salinas P, Arenas-Herrera MJ, Moraga-Contreras C, Tapia-Caroca H, Kukulis-Martínez S. Small-Scale Solar-Powered Desalination Plants: A Sustainable Alternative Water-Energy Nexus to Obtain Water for Chile’s Coastal Areas. Energies. 2022; 15(23):9245. https://0-doi-org.brum.beds.ac.uk/10.3390/en15239245
Chicago/Turabian StyleCornejo-Ponce, Lorena, Patricia Vilca-Salinas, María Janet Arenas-Herrera, Claudia Moraga-Contreras, Héctor Tapia-Caroca, and Stavros Kukulis-Martínez. 2022. "Small-Scale Solar-Powered Desalination Plants: A Sustainable Alternative Water-Energy Nexus to Obtain Water for Chile’s Coastal Areas" Energies 15, no. 23: 9245. https://0-doi-org.brum.beds.ac.uk/10.3390/en15239245