
Power Grid Structure Performance Evaluation Based on Complex Network Cascade Failure Analysis

1
State Key Laboratory of Rail Transit Control and Safety, Beijing Jiaotong University, Beijing 102206, China
2
China Institute of Energy and Transportation Integration Development, Beijing 102206, China
3
School of Control and Computer Engineering, North China Electric Power University, Beijing 102206, China
*
Author to whom correspondence should be addressed.
Energies 2023, 16(2), 990; https://0-doi-org.brum.beds.ac.uk/10.3390/en16020990
Submission received: 27 November 2022
/
Revised: 9 January 2023
/
Accepted: 12 January 2023
/
Published: 16 January 2023
(This article belongs to the Special Issue Research on Operation Optimization of Energy Systems)
Abstract
:A safe and stable operation power system is very important for the maintenance of national industrial security and social economy. However, with the increasing complexity of the power grid topology and its operation, new challenges in estimating and evaluating the grid structure performance have received significant attention. Complex network theory transfers the power grid to a network with nodes and links, which helps evaluate the system conveniently with a global view. In this paper, we employ the complex network method to address the cascade failure process and grid structure performance assessment simultaneously. Firstly, a grid cascade failure model based on network topology and power system characteristics is constructed. Then, a set of performance evaluation indicators, including invulnerability, reliability, and vulnerability, is proposed based on the actual functional properties of the grid by renewing the power-weighted degree, medium, and clustering coefficients according to the network cascade failure. Finally, a comprehensive network performance evaluation index, which combines the invulnerability, reliability, and vulnerability indicators with an entropy-based objective weighting method, is put forward in this study. In order to confirm the approach’s efficacy, an IEEE-30 bus system is employed for a case study. Numerical results show that the weighted integrated index with a functional network could better evaluate the power grid performance than the unweighted index with a topology network, which demonstrates and validates the effectiveness of the method proposed in this paper.
1. Introduction
With the development of power systems, the rapid growth of the power grid and the expansion of its interconnection has led to a dramatic growth in the complexity of the system. Grid failures are also causing more and more economic losses and impacts on industrial communities and civil lives [1]. This indicates that there are significant difficulties with the power system’s stability, security, and reliability, and it is very important to analyze the nature of the grid structure and help put forward improvement strategies. As commonly known, the power system is a typical complex network with a large number of nodes and transmission lines, with complex topology and operating characteristics. Complex networks comprise some or all of the properties of self-organization, self-similarity, attractors, small worlds, and scale-free systems. In order to scientifically analyze the structural performance of power systems, it is helpful to find the weak points of power grids and then analyze the operational characteristics of the grids, which can be carried out with a complex network method [2].
Many scholars have investigated the structural characteristics of power grids using the complex network theory. One of the important research branches is to model the cascading failure process of power grids and evaluate the characteristics of the systems. Cascade failure is the phenomenon that occurs when the network fails and the faulty node causes other related nodes to fail, possibly leading to the collapse of the whole network [3]. Most existing cascade failure studies of power systems focus on two aspects. One aspect is the study of power system cascade failure propagation mechanism modeling [4,5,6,7,8,9,10,11,12,13], and the other one is the dynamic cascade failure study using power flow information [14,15,16,17,18,19].
In modeling the cascade failure propagation mechanism of power systems, Wu et al. [4] proposed a novel cascade failure propagation model to evaluate the robustness of several complex networks. Lee et al. [5] modeled complex networks of smart grids and performed cascading dynamic vulnerability analysis. Guo et al. [6] proposed a transmission line cascade failure probability model and analyzed the system vulnerability. Rahnamay-Naeini et al. [7] proposed a novel dynamic probabilistic model for grid cascading faults analysis. Fan et al. [8] presented a cascading fault model based on complex network theory that integrates hidden transmission line faults and node overload faults during outages. Peng et al. [9] proposed an updated cascading fault model. Fan et al. [10] proposed a complex network–based structure retention model for grid cascading failures. Li et al. [11] considered the performance impact of spurious data injection attacks on cascading failures of physical systems in power networks. Dai et al. [12] proposed a new time-based cascading fault dynamic model. Gao et al. [13] introduced a stochastic cascading failure model based on complex network theory to study the robustness of power CPS in virtual power plants (VPPs).
In terms of dynamic cascade failure research using power flow information, Guo et al. [14] analyzed the robustness through cascade failure simulation based on alternating current(AC) theory. Sun et al. [15] developed a complex network cascade failure model by combining dynamic AC currents. Yan et al. [16] analyzed the efficiency of a typical direct current(DC) power flow–based cascading fault simulator in critical moment cascading fault analysis. Azzolin et al. [17] combined synthetic grid generators with a DC cascade failure simulator to study the key factors affecting cascade failures in power systems. Li et al. [18] proposed a cascading fault model based on AC optimal currents. Noebels et al. [19] proposed an integrated AC cascade failure model to analyze grid resilience.
The above studies mentioned complex network theory and grid cascade failures. However, the impact of the functional properties of the grid itself on the structural properties of the grid has rarely been taken into consideration.
In addition, some scholars have studied the evaluation method of network characteristics by analyzing the effect of cascade failure [4,5,6,19,20,21,22]. Peng et al. [20] used complex theory to build a smart grid system model and proposed a reliability analysis method that takes into account the effects of cascading failures and other factors. Jiang et al. [21] proposed a heuristic critical node identification method to study network robustness against cascading faults. Fan et al. [22] proposed a method for grid vulnerability analysis considering cascading faults. Li et al. [23] studied the robustness of Chinese power grid systems under various attack and defense scenarios by considering cascading failures. However, the above studies mostly analyzed from a single perspective and rarely proposed multiple evaluation indices for a comprehensive evaluation of the global characteristics of the power grid.
Therefore, this paper proposes a method for evaluating the performance of power grid structures based on cascading failures. This method does not need to consider the power flow characteristics and greatly simplifies the grid cascade failure analysis process. At the same time, a variety of evaluation indices are proposed for different grid characteristics. The objective weighting method is also employed to synthesize the indices so that a comprehensive evaluation of the grid characteristics can be made in a proper manner. The differences between the work in this paper and the existing literature are shown in Table 1. By conducting numerical experiments on an IEEE-30 bus system, we have come to the following three findings:
- The comprehensive evaluation index of a power grid structure performance proposed in this paper can analyze the grid operation status more comprehensively than previous indices;
- With the cascading failure analysis on the network, we find out that the performance loss of the grid structure is not directly related to the number of failed nodes of the network;
- The functional weighted integrated evaluation index proposed in this paper can better reflect the changes in network structure performance in the case of node failure than the unweighted topology evaluation index.
The contents of this article include four sections. In Section 2, a complex network model of the power grid based on complex network theory is put forward, and basic network indicators are constructed to evaluate the basic model characteristics with power grid information. In Section 3, a comprehensive, objectively weighted index, which combines the power-weighted network reliability, vulnerability, and invulnerability indicators simultaneously, is created using the entropy value method to evaluate the performance of the network structure. In Section 4, a cascade failure model and grid structure performance evaluation process are proposed to further evaluate the dynamic performance of the network structure. Finally, an IEEE-30 bus system is employed for a case study, which helps verify and validate the feasibility and effectiveness of the method and indices proposed in this paper.
2. Grid Modeling Based on Complex Network Theory
Based on complex network theory, this section constructs a power-weighted grid complex network model and puts forward the indicators to evaluate the grid network characteristics.
In order to model the power system by complex network theory, we made the following assumptions:
(1) A complex network with values and directions is created. The power plants, substations, and transmission line terminals are abstracted to the nodes in the complex network model, respectively;
(2) Connections in grid devices where power flows exist can be abstracted as edges of the complex network. The weights of the edges in the model are influenced by the rated power of the grid nodes that are proposed in (1);
(3) The direction of grid power flow is abstracted as the inflow and outflow directions of each node in the complex network model, with consideration of the energy transfer characteristics of the power system. Specific cases, such as power flow flip, are not considered in this paper.
2.1. Construction of Complex Network Models for Power Grids
According to complex network theory, the network consists of a node set N and an edge set E, which can be denoted as G = (N, E). In order to construct a grid model based on complex network theory and carry out network characteristic analysis, this paper abstracts power plants, substations, and transmission line terminals as complex network nodes and the transmission lines between substations as the edges of the complex network. If two nodes are connected by a physical line, an edge is built between the two nodes. To facilitate the calculation process, the underlying connection between the nodes is stored in the form of an adjacency matrix, in which element 1 represents the existence of a connection relationship and element 0 means no connection relationship. A directed network is defined by distinguishing the direction of the edges, so the adjacency matrix of a directed network is not necessarily symmetric.
In order to make the constructed network reflect the real-world grid functional characteristics and grid state information more realistically and precisely, the power attributes of the nodes are combined as weighted coefficients into the complex network adjacency matrix by certain rules. We define it as follows:
where is the power weight of the edge connecting nodes i, j at moment t; are the corresponding elements of the adjacency matrix; is the power state coefficient, which is set as 1 when the x-th power tributary flows through the target edge and 0 otherwise; is the power of the k-th branch out of node i; K is the total number of power bars flowing out of node i; is the power of the l-th branch flowing into node j. L is the total number of power bars flowing into node j; is the m-th branch power out of node j; M is the total number of power bars flowing out of node j; is the n-th branch power flowing into node i; N is the total number of power bars flowing into node i.
The inflow and outflow power at each node at any moment t satisfies
The above model satisfies
That is, when nodes i and node j are connected with a two-way exchange function in the network, at any moment t, there are two system statuses between them, either connected or not connected. However, at a certain moment t, there can only be a one-way power exchange or no power exchange; thus, it still meets the constraint .
2.2. Grid Complex Network Model Characteristics Indicators
Based on the weighted model in the previous section, grid network model characteristics indicators were constructed based on complex network theory.
2.2.1. Degree
Degree value is a basic measure in complex network theory, which can reflect the importance of a node in the whole network, and a single node degree can be calculated with Formula (4).
where kj takes 1 when i and j are connected with an edge and 0 otherwise.
2.2.2. Clustering Coefficient
Clustering coefficient is the measure for a network aggregation, which can reflect the degree of network node clustering. Let the neighbor sets of node v be , , then the clustering coefficient of node v is defined as the ratio of the number of edges between these nodes to the total number of possible edges , as Formula (5).
The clustering coefficient is an important indicator to describe the structural characteristics of the network. The average of all node clustering coefficients is called the average clustering coefficient C (C∈[0, 1]), where C = 0 when all the nodes of the network are isolated and, conversely, C = 1 when there are connected edges between each pair of nodes within the network.
2.2.3. Betweenness
Betweenness is mainly divided into point centrality and edge centrality, which means the number of times the shortest path of the network passes through a node or edge, respectively, and reflects the influence of the node or edge on the network globally. The larger the betweenness, the more times the shortest paths go through the node (edge); the greater the flow load, and the more likely accidents occur.
The average of the betweenness of node i can be calculated as follows:
where denotes the number of all shortest paths from node j to node k and denotes the number of all shortest paths from node j to node k that pass through node i. The more times the shortest paths pass through node i, the more important the node.
3. Grid Structure Performance Evaluation Index
Based on the power-weighted grid complex network model characteristics metrics proposed in the previous section, this section constructs grid resilience, reliability, and vulnerability metrics. Then, the three types of indicators are objectively weighted and combined using the entropy value method. Finally, a comprehensive evaluation index to evaluate the complex network structure performance of power grids is constructed.
3.1. Grid Structure Performance Indicators
3.1.1. Grid Invulnerability
In this paper, a grid is considered the expression of a real power system. The generalized exponential distribution of the invulnerability index proposed by Gupta and Kundu [24] is introduced to calculate the distribution network invulnerability by changing the form of some expressions. A quantitative method of network invulnerability based on the structural and functional characteristics of the network is proposed as Formula (7).
where is the network invulnerability without node i, is the normalized value of the weighted node degree of the corresponding metric of the network after removing node i. is the normalized value of the weighted betweenness of the corresponding metric of the network after removing node i. is the normalized value of the weighted clustering coefficient of the corresponding indicator of the network after removing node i. is the average node degree of the network after removing node i. is the average node degree in the original network. ,, are three adjustment coefficients.
3.1.2. Grid Reliability
The reliability of complex networks is represented by their ability to remain healthy and stable when they are subject to natural or synthetic disasters. Network reliability is generally assessed by the distance from any node of the network to other nodes and the closeness of the nodes. In this paper, the average node degree is chosen to evaluate the grid reliability quantitatively. The average node degree L is an important metric to describe the connectivity of the network. For most practical cases, if there is good connectivity, the average number of search steps between any two nodes will be low. Therefore, the average node degree L before and after the network is attacked can be compared to show the strength and danger factors of this attack.
In this paper, l0 denotes the average node degree value of the network before being attacked, and l1 denotes the value after being attacked; thus, L can be defined as follows:
Formula (8) reflects the intensity of the attack. If the network is not disturbed by the attack and after an attack, it means that the network is stable. If after an attack, it indicates that the connectivity of the network is increased and has a strong self-protection and repair capability; if after an attack, it means that the connectivity of the network is reduced and the reliability has also dropped down.
3.1.3. Grid Vulnerability
Vulnerability is a measure of the degree to which a system and its components are affected and damaged. For an energy internet, vulnerability can be defined as the extreme impact of individual disturbances on the system. A small perturbation may lead to catastrophic consequences. In this paper, we select the network average clustering coefficient ratio to quantitatively analyze the grid vulnerability.
The network average clustering coefficient ratio C can be calculated with Formula (9).
where N denotes the number of nodes in the network and C0 and C1 represent the average clustering coefficients of the network before and after being attacked, respectively.
3.2. Objective Empowerment Method
Since there exist different scales and metrics between indicators, the anomalies of the data will affect the results of the weight calculation. Data standardization needs to be applied before the weight calculation, as defined in Equation (10).
After the data is pre-processed, the variables are assigned weights by applying the entropy method based on the information content of the data. The entropy value method calculates the weight according to the size of information carried by the data. The entropy value is a measure of uncertainty; the smaller the amount of information, the greater the uncertainty and corresponding entropy value of the system [25]. The calculation can be processed with the model from Formula (11) to Formula (14).
where j is the grid structure performance index data and z is the sample size. The analysis step can be summarized as follows.
First, calculate the weight of the ith indicator for the jth data point with Equation (11); then, calculate the entropy value of the ith indicator with Equation (12); finally, calculate the coefficient of variation of the ith indicator and derive the weights with Equation (13), where a larger gi represents a more important indicator, and the weight of each indicator can be found with the normalization step per Formula (14).
3.3. Comprehensive Assessment Index of Grid Structure Performance
The objective weighting method is used to combine the network destructiveness Pi, reliability L, and vulnerability C to obtain the comprehensive evaluation index of grid structure performance, as shown in Equation (15).
where Q is the comprehensive assessment index of the grid structure performance.
4. Comprehensive Grid Structure Performance Assessment Process
The cascading failure process is selecting a node from the network and letting it fail, evolving the system to another balanced status, and then repeating with selecting the next node until all the nodes come to failure. When the cascading failure process is over, the grid structure performance evaluation metrics constructed in the previous section are applied to evaluate the comprehensive performance index of the network.
4.1. Grid Cascade Failure Process
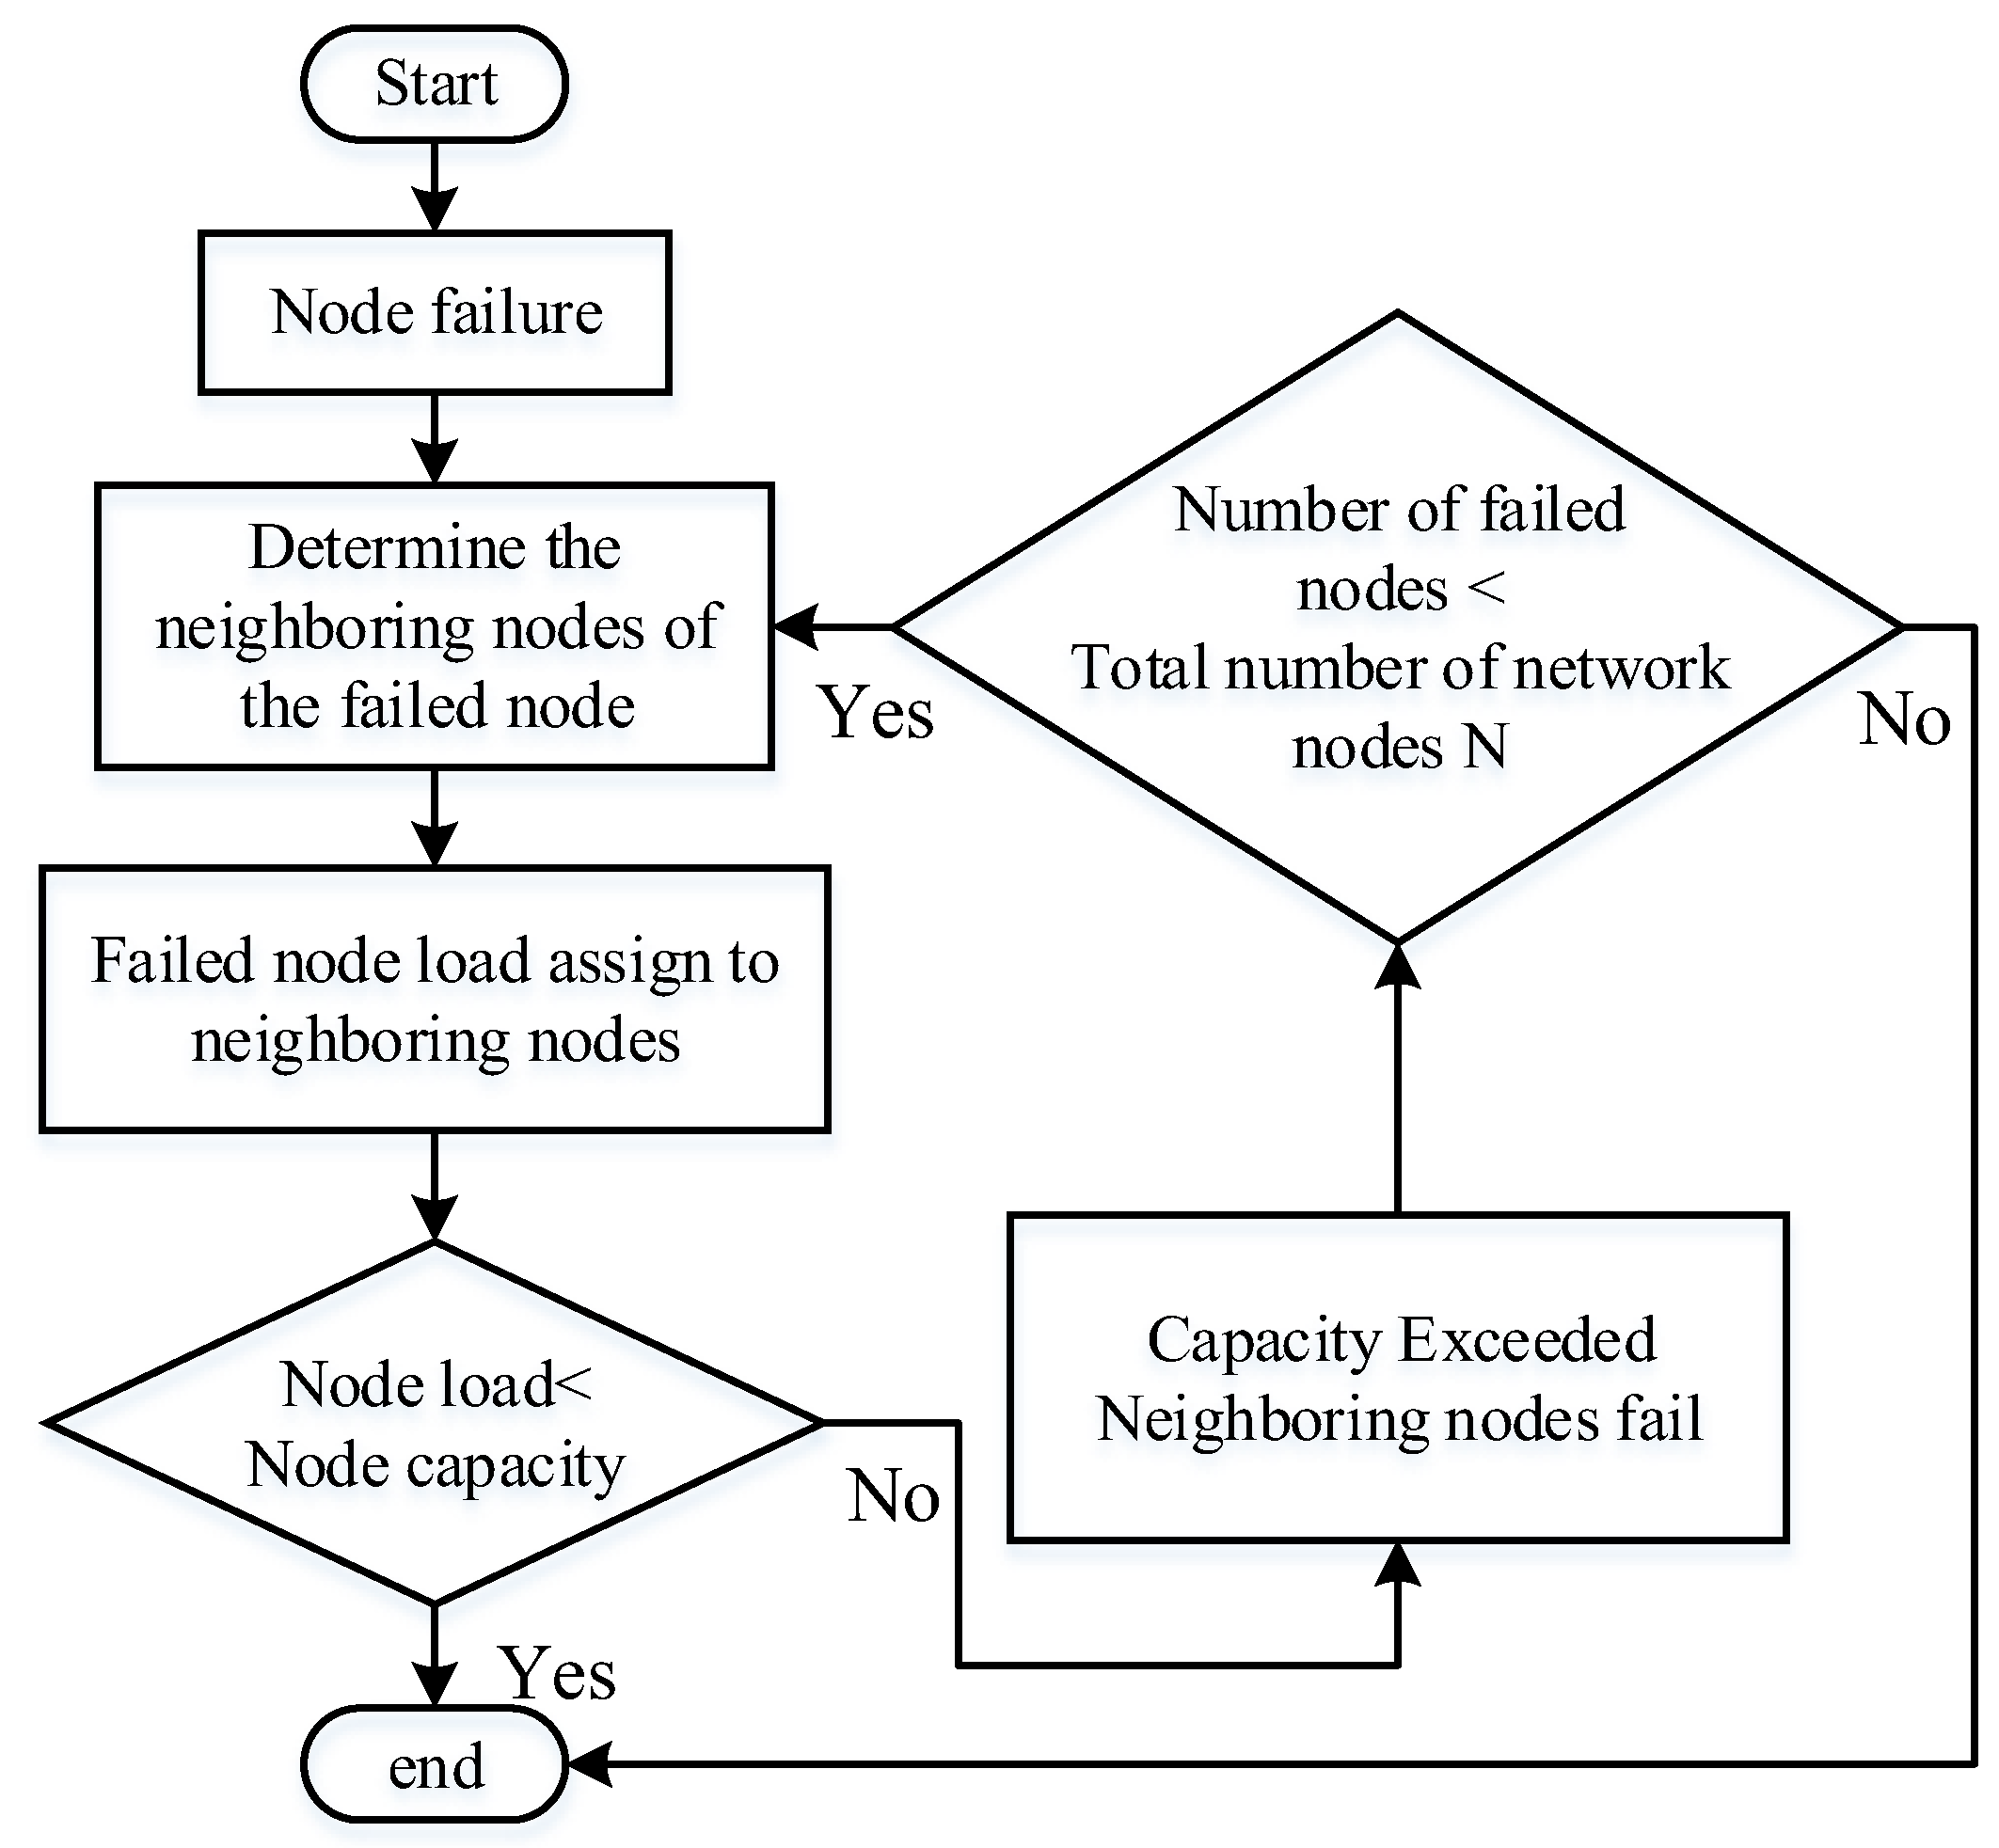
At the very beginning, the network operates normally, and the initial load of any node in the network is less than the node capacity. When a node failure occurs, its load is allocated to the neighborhood nodes of the failed one in priority. When the load assigned to a neighbor node exceeds its maximum capacity, it causes the neighbor node to fail, which in turn leads to a new cycle of load dispatch. The load distribution process is carried out until no new node fails or until all nodes fail. The flowchart of the grid cascade failure can be described in Figure 1.
4.2. Comprehensive Evaluation Process of Grid Structure Performance
This paper addresses the grid structure performance evaluation with the following steps.
- Calculate the grid characteristics indicators. Construct the weighted network of grid functional attributes according to Formulas (1)–(3), and then calculate the weighted network measures before and after node failure happened, respectively, according to Formulas (4)–(6) and the cascade failure model;
- Calculate the network structure performance indicators. Calculate the network invulnerability according to Formula (7), the network reliability according to Formula (8), and the network vulnerability according to Formula (9);
- Combine performance indicators by the entropy method to obtain the comprehensive indicators. Combine the calculated invulnerability, reliability, and vulnerability by the entropy method into the comprehensive evaluation index of grid performance;
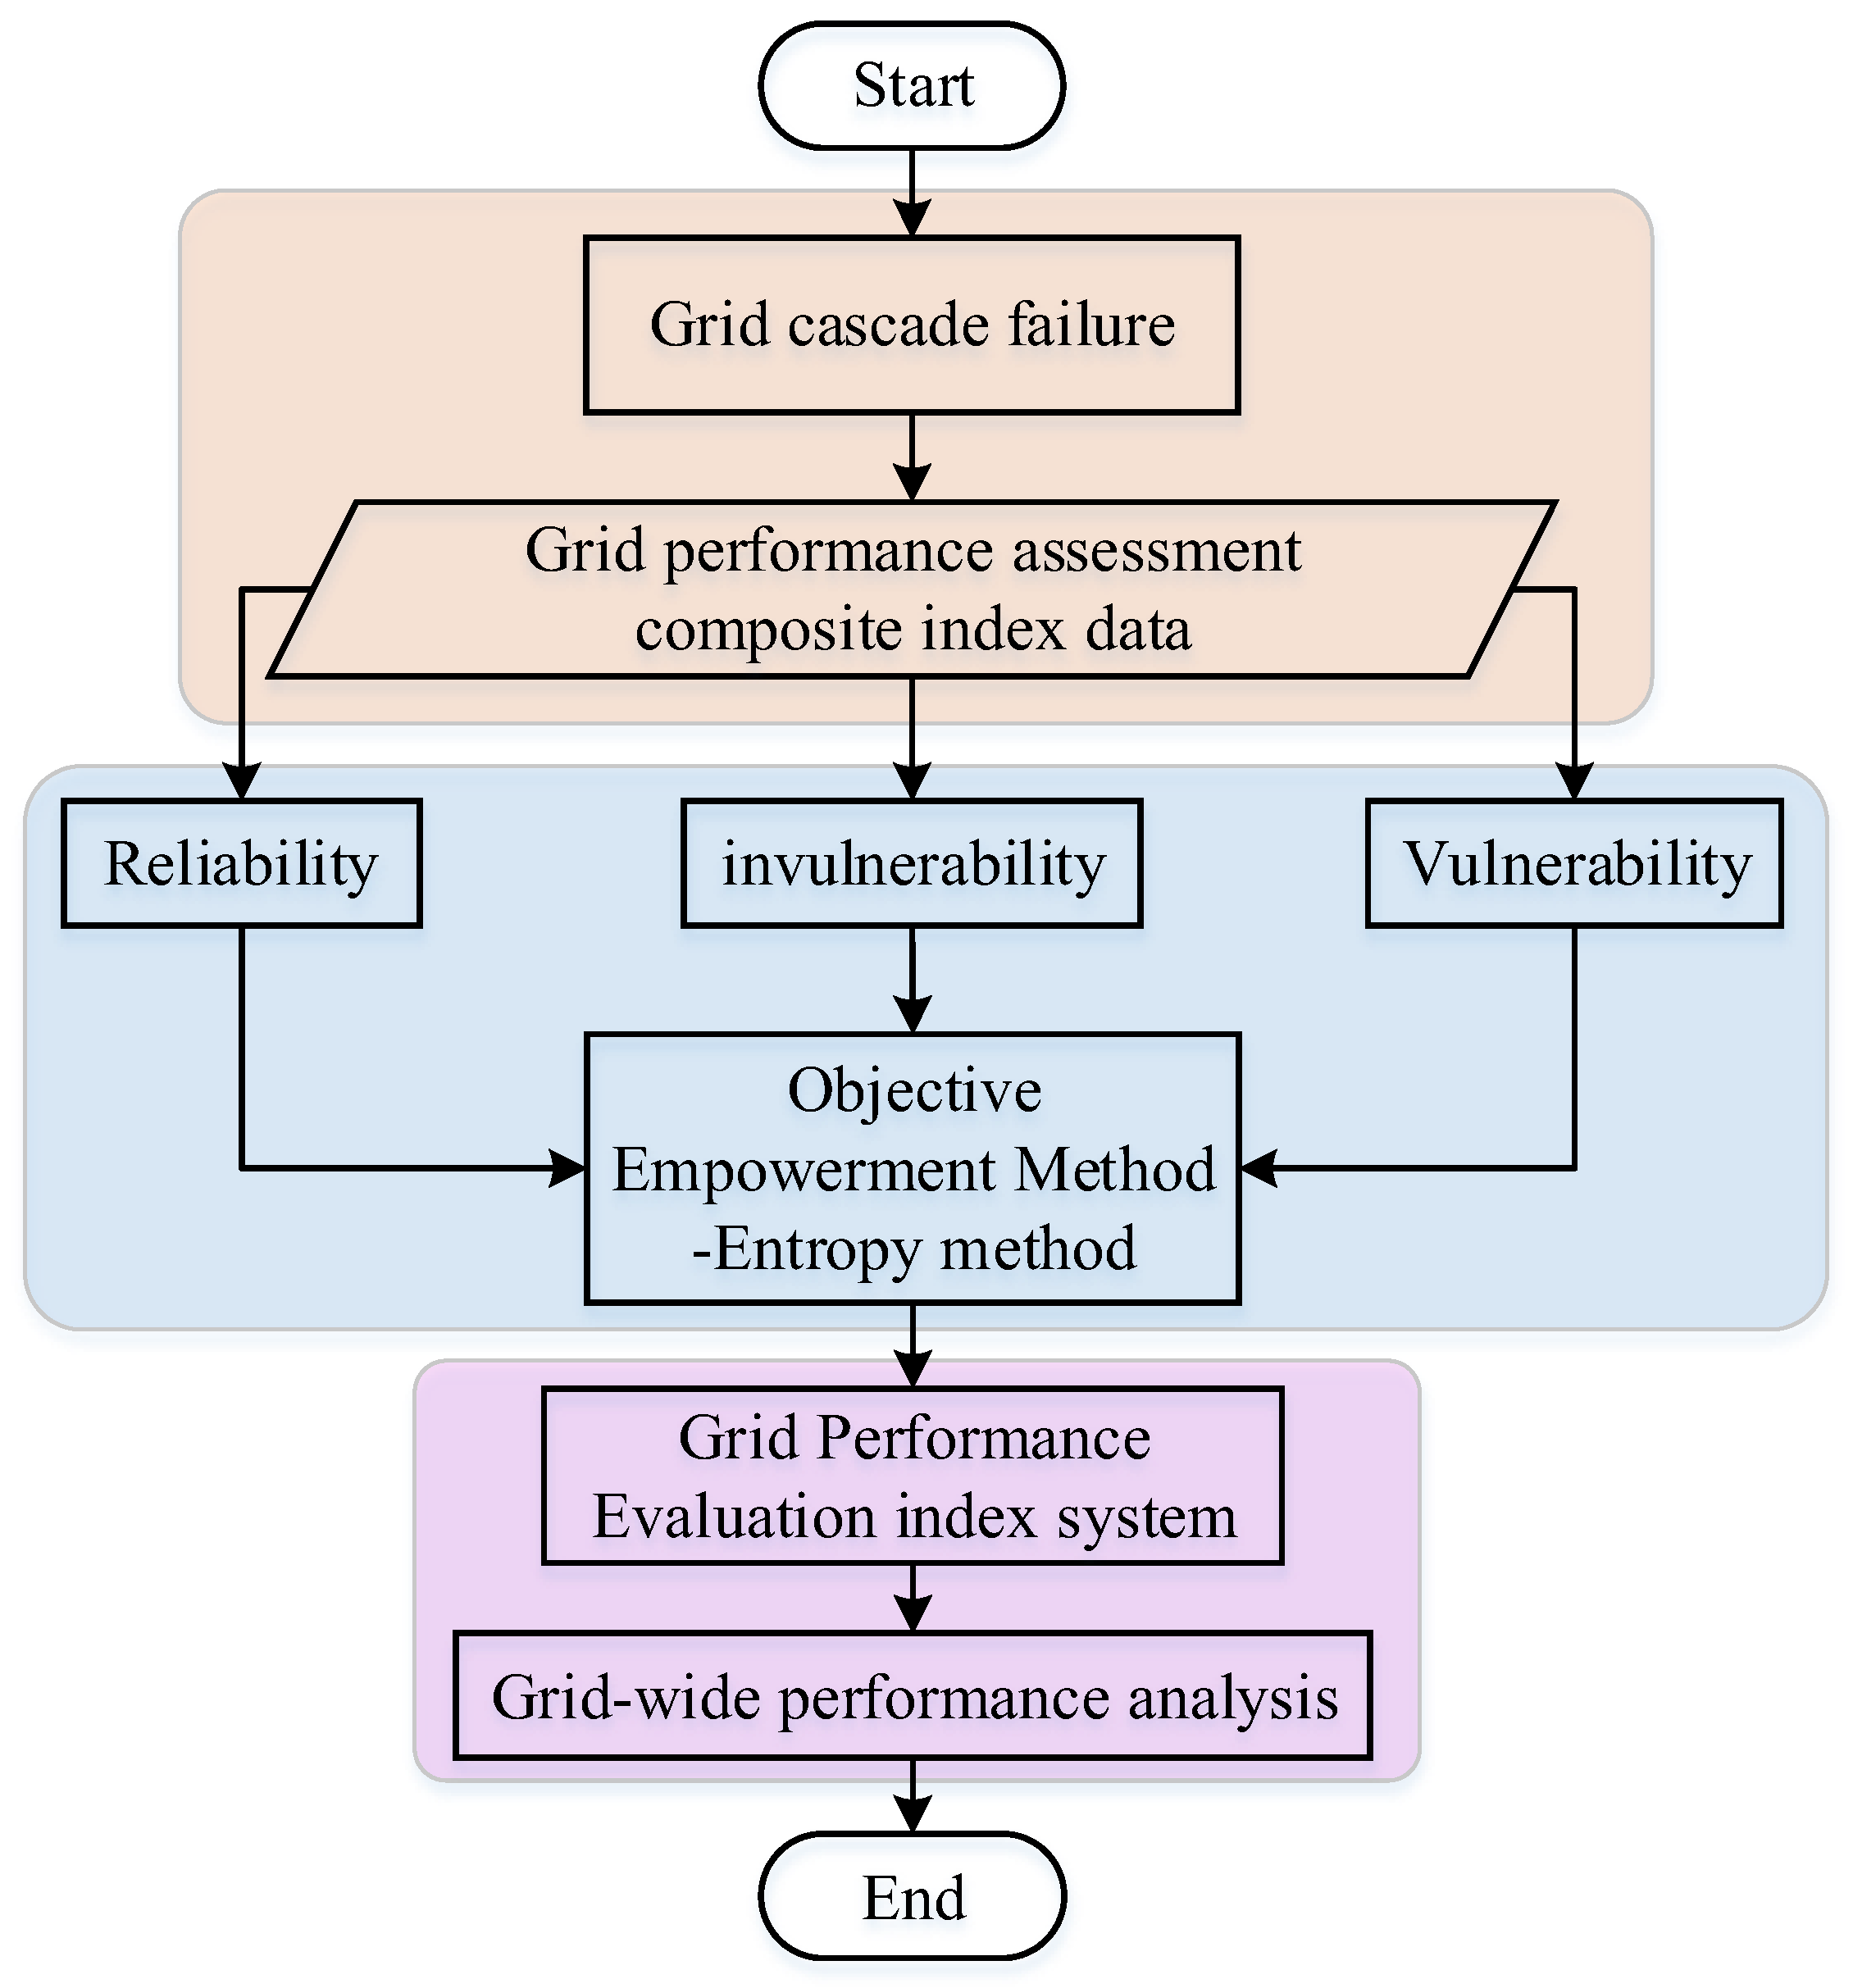
- Apply the comprehensive index to analyze the current network’s structure performance, and provide reference suggestions for future grid-expanding planning. The process is shown in Figure 2.
5. Case Study
In this paper, an IEEE-30 bus system is adopted for a cascade failure case study to verify the validity of the weighted grid complex network structure performance evaluation method.
5.1. Problem Description
This paper adopts an IEEE-30 bus system for the numerical experiment, and the data come from the MATPOWER package in MATLAB, which is dedicated to providing an updateable and convenient simulation tool for academic research. The IEEE-30 bus system is employed for case studies in many recent studies [26,27].
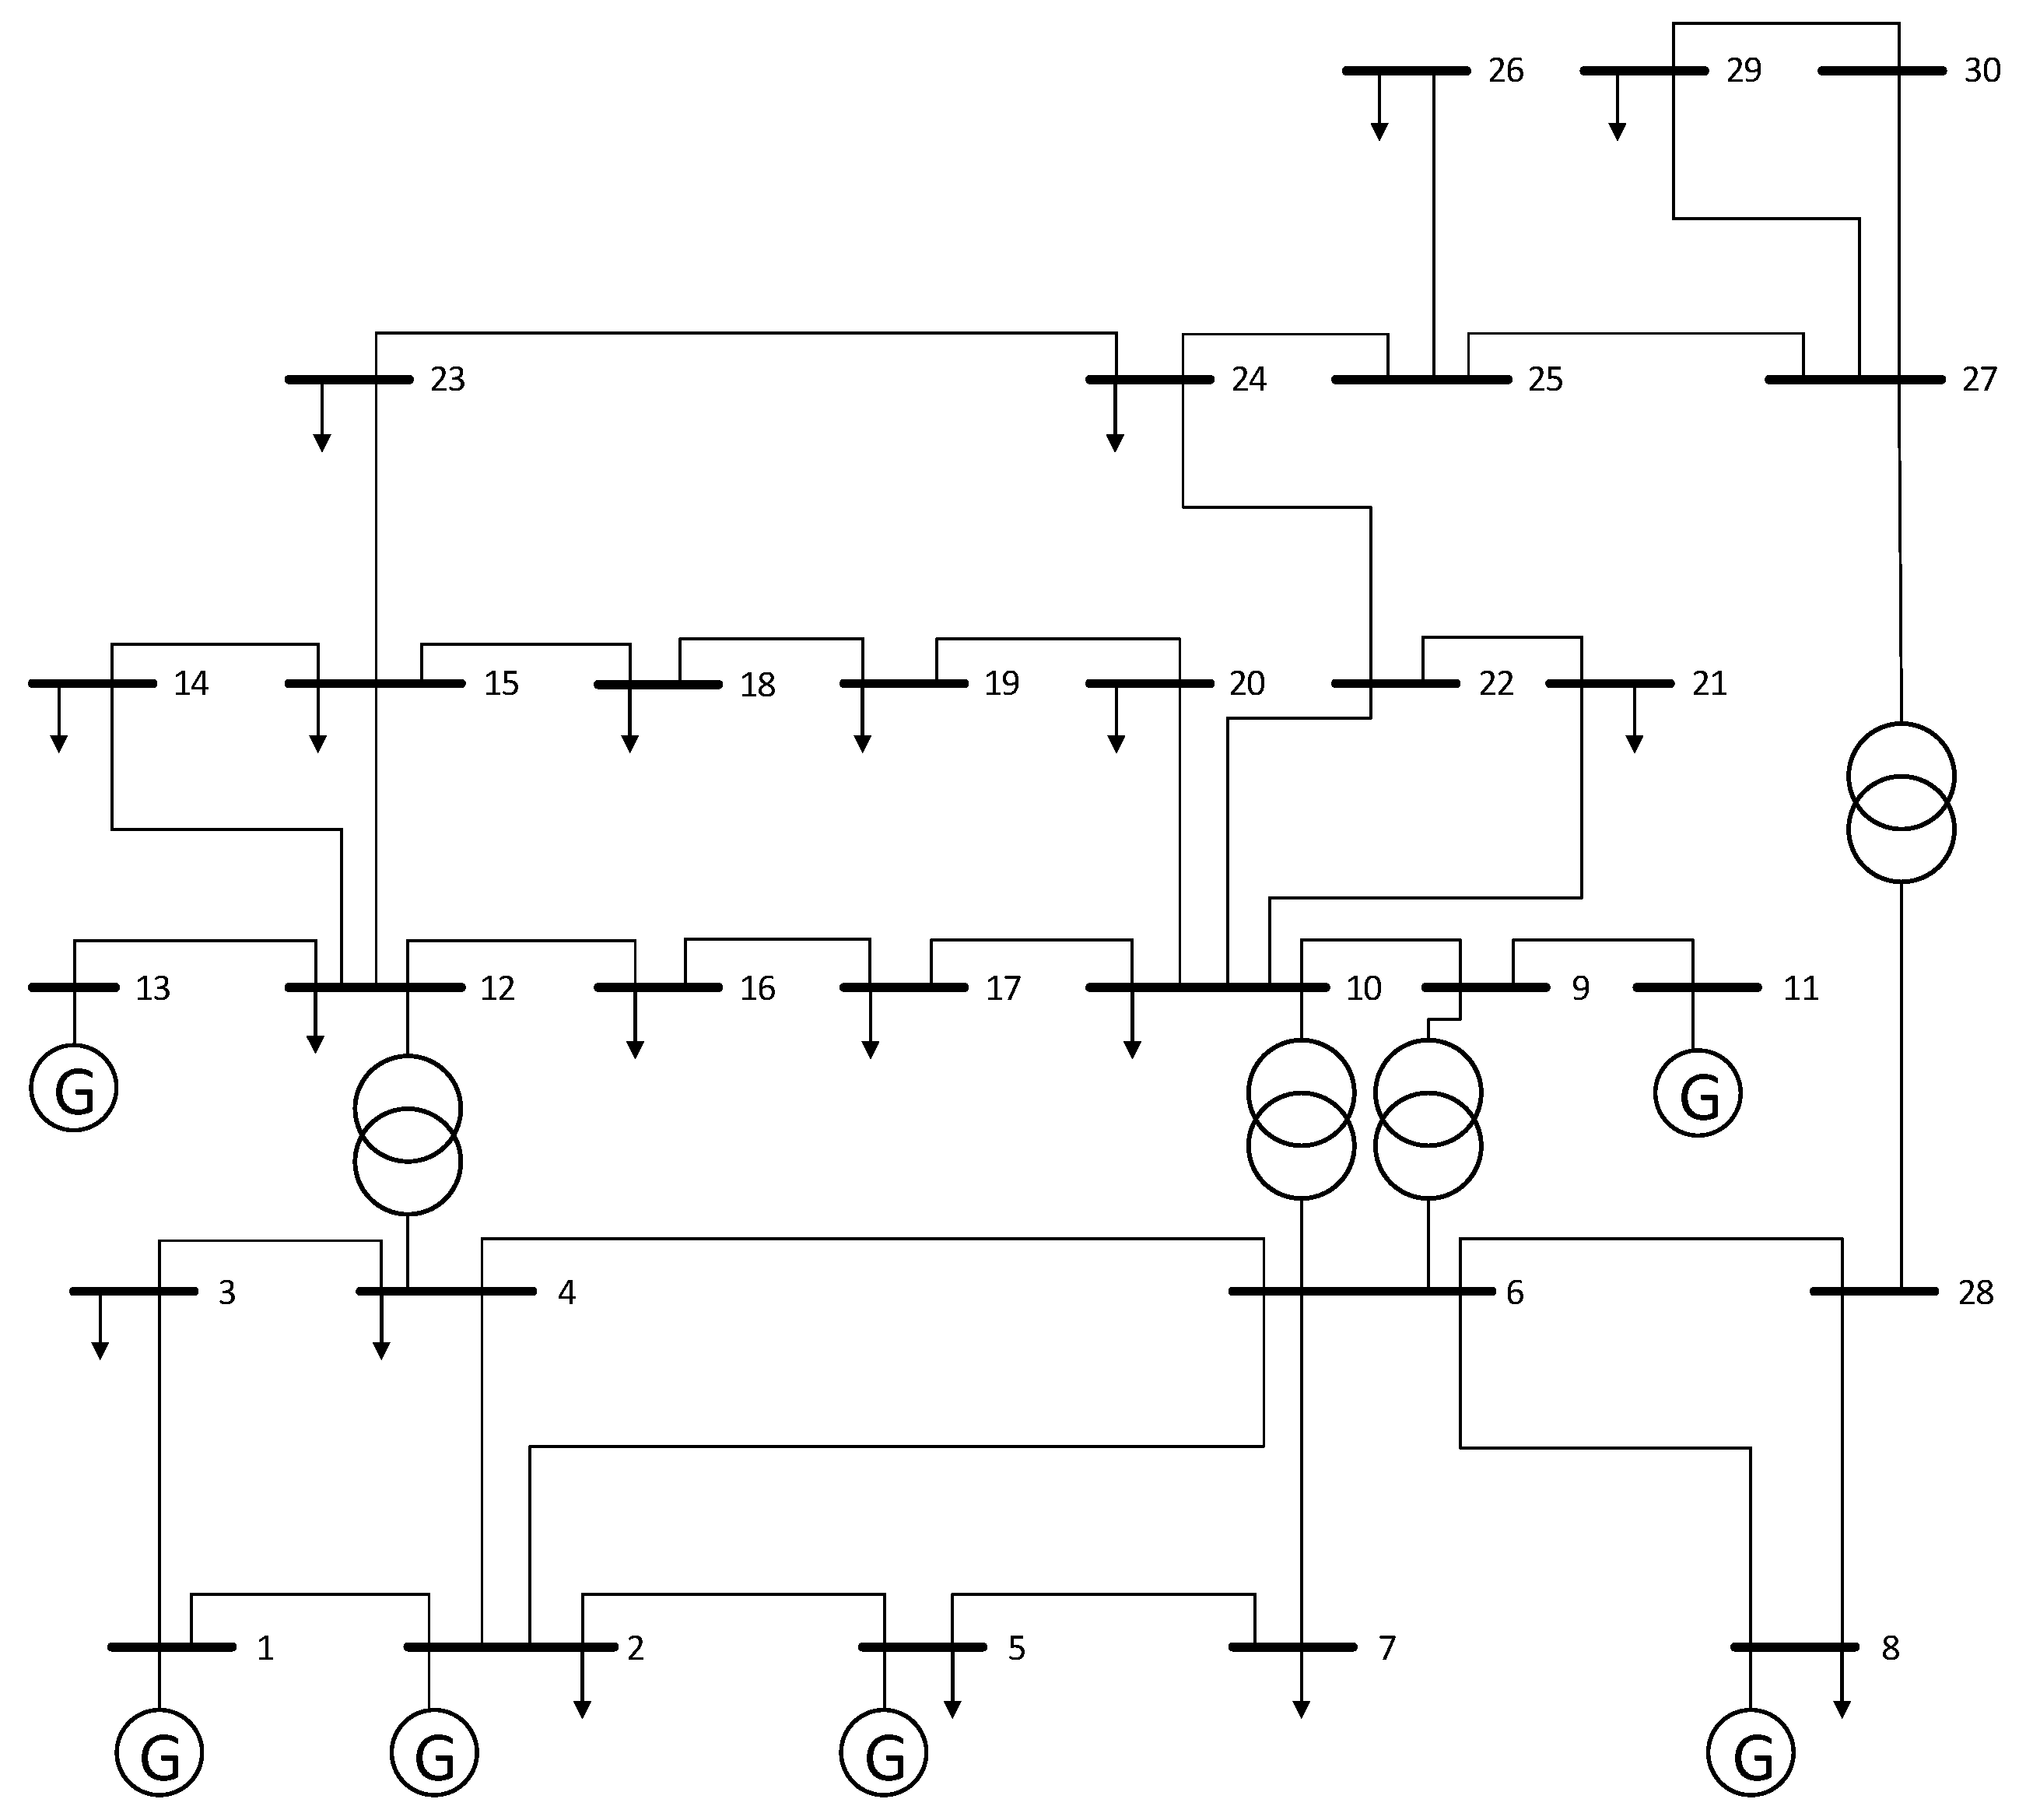
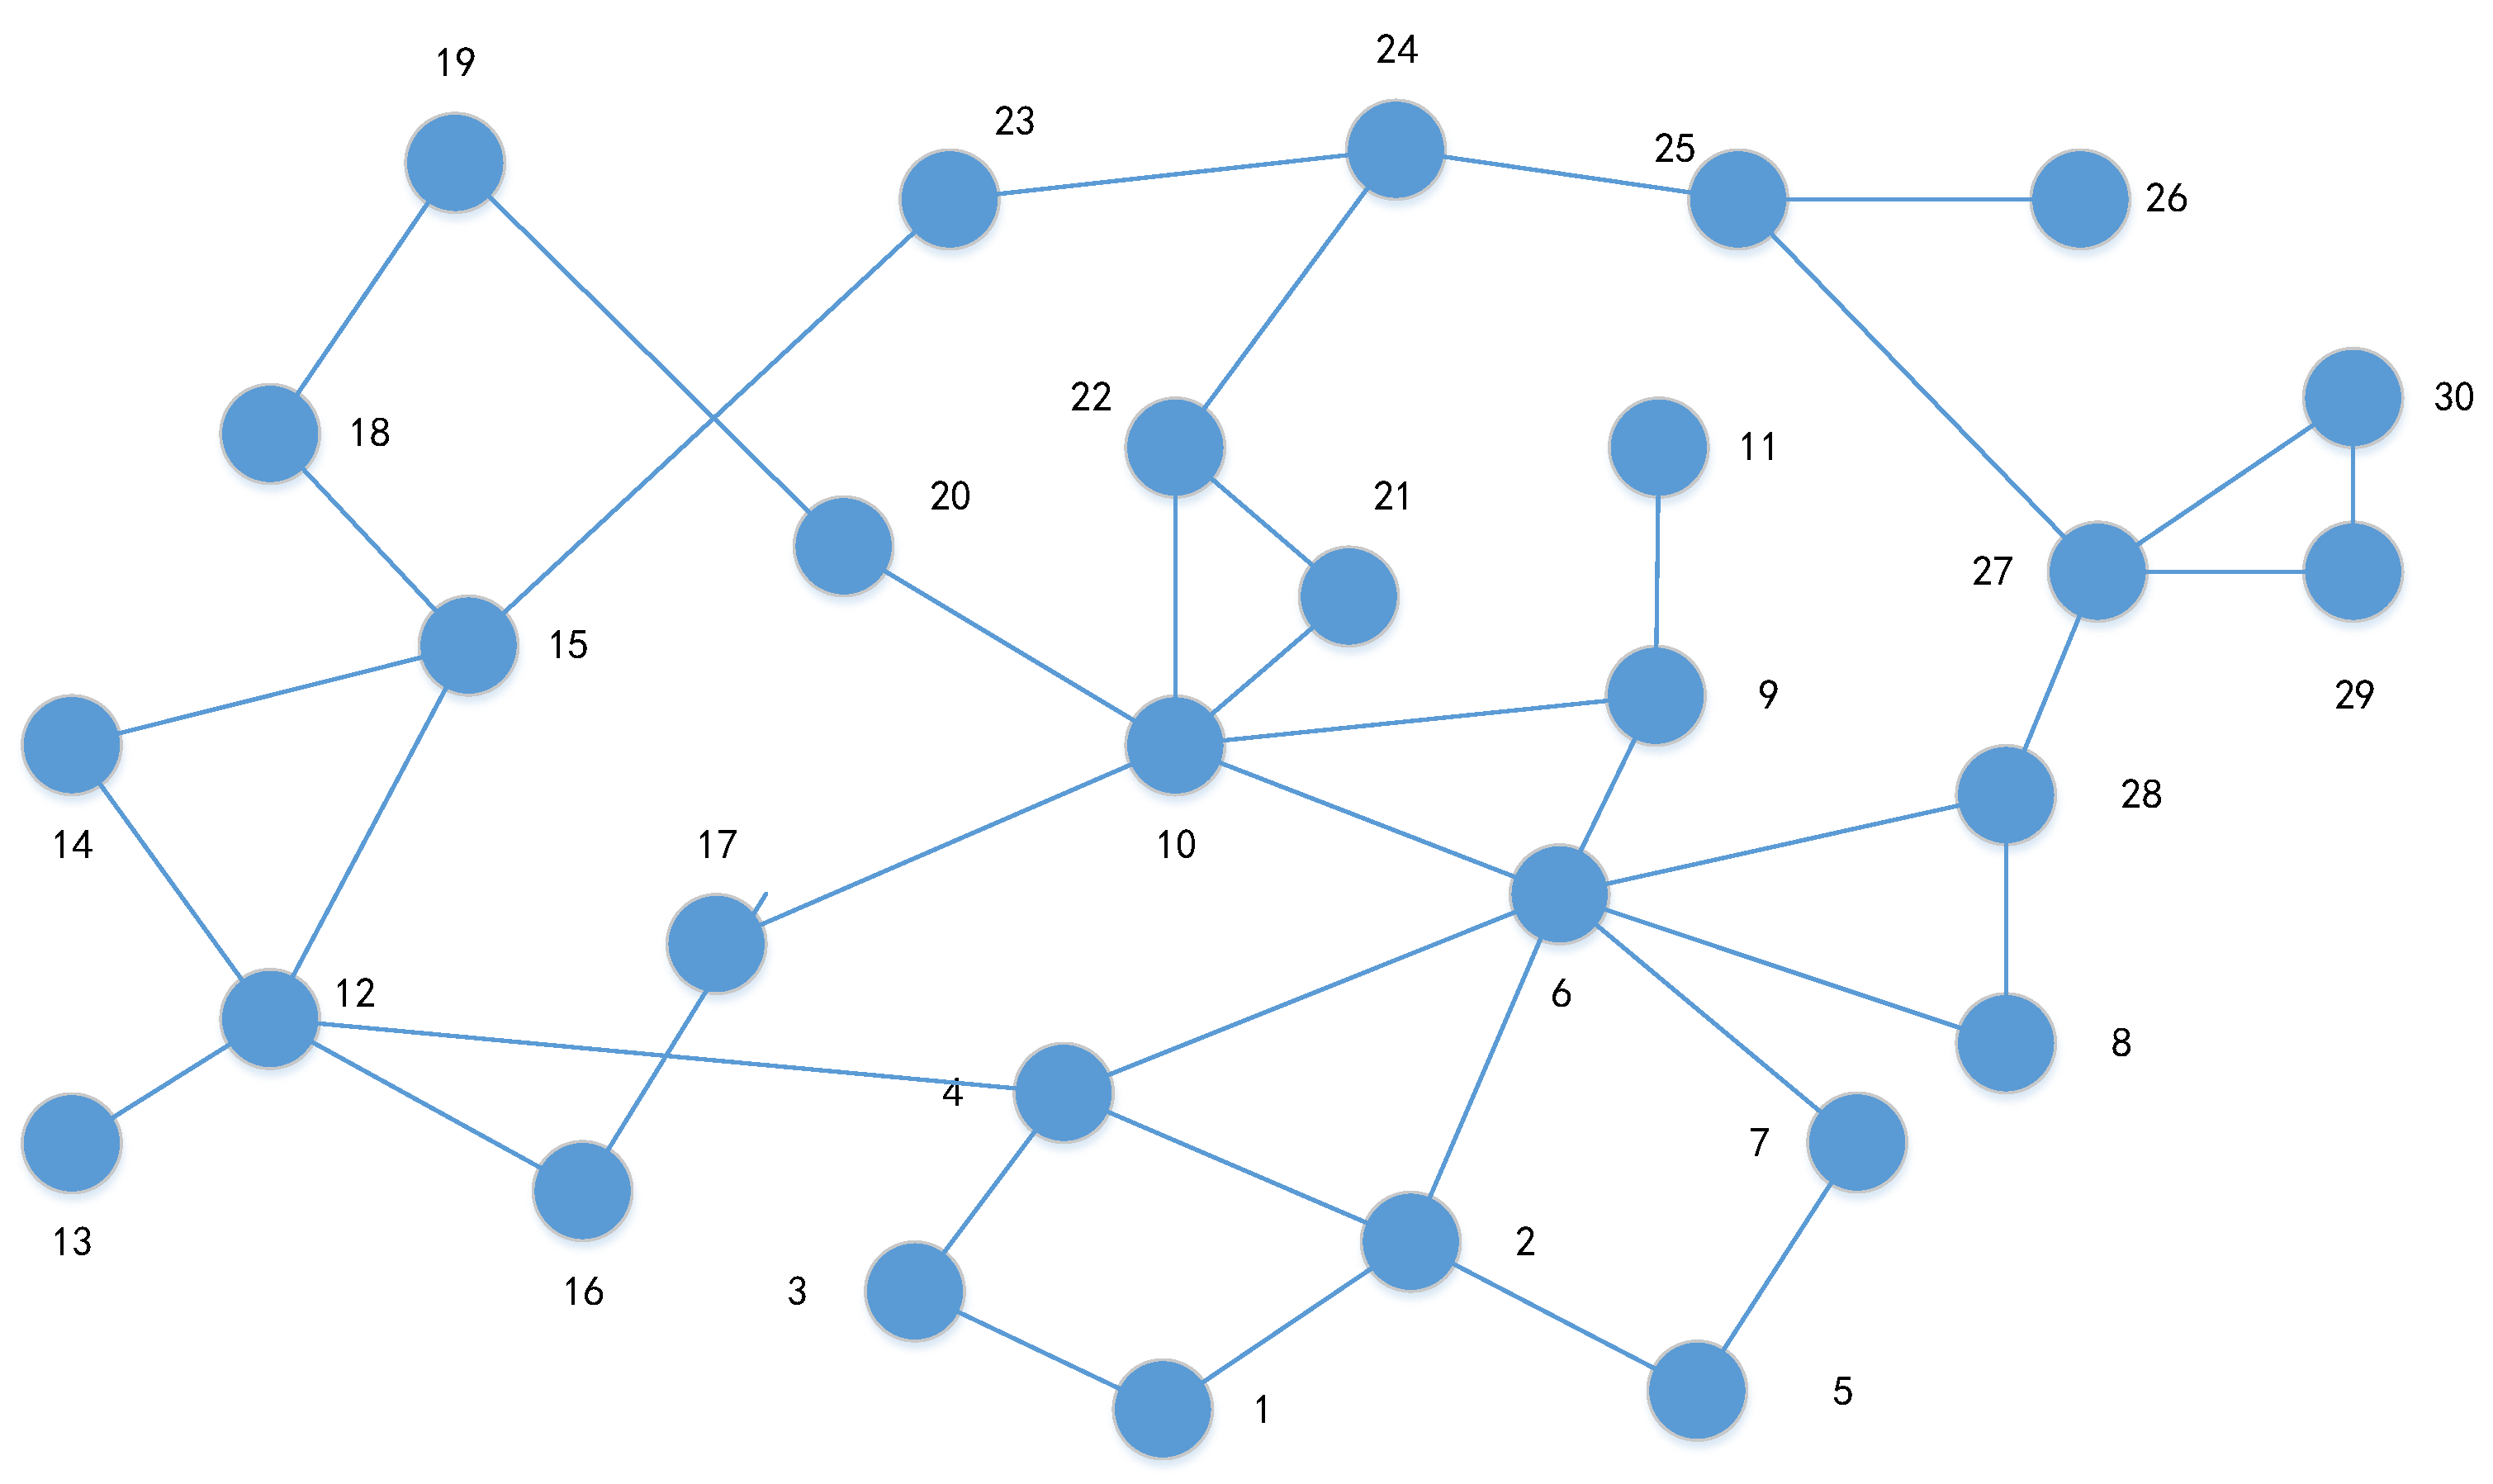
The electrical wiring diagram and network structure of the IEEE-30 bus system are shown in Figure 3 and Figure 4, respectively. Six generators are included as 1, 2, 5, 8, 11, and 13, and the nodes where the generators are located are generator nodes, referred to as PV nodes. Nine reactive power compensation devices are located at 10, 12, 15, 17, 20, 21, 23, 24, and 29. Four transformers are located at 6-9, 6-10, 4-12, and 28-27.
5.2. Experimental Schemes
Firstly, the IEEE-30 bus system power-weightless network model is constructed based on the network adjacency matrix, and the cascading failure matrix is constructed by sequentially failing all nodes in the network. Secondly, the power-weighted and cascading failure matrix is adopted to measure the grid’s complex network characteristics. Finally, the characteristics are substituted into the reliability, destructiveness, and vulnerability measurement model, and the network structure performance changes of the IEEE-30 bus system due to the different deleted nodes can be obtained by the model.
To verify the validity of the comprehensive index of power-weighted grid network structure performance, two comparison experiments are set up in this paper:
Experiment 1: In order to verify that the integrated metrics are more comprehensive than the individual metric, the IEEE-30 bus system network model is employed as the unweighted adjacency matrix. The cascade failure simulations are performed by nodes 1–30, one by one. The results are recorded for each simulation step so that the average degree, average betweenness, and average clustering coefficient of the network can be recorded directly and separately. Thirty sets of data for the above three categories of metrics are recorded. The data of the above three indicators are then used to calculate the integrated assessment index of the network. The results of the integrated assessment are also recorded and then compared to verify the effectiveness of the method.
Experiment 2: In order to verify the privilege of the power-weighted comprehensive evaluation index on assessing the actual power grid status, the IEEE-30 bus system network model is constructed with the unweighted adjacency matrix and then applied to the cascading failure simulation from nodes 1–30, one by one. The comprehensive evaluation index of the performance of the unweighted network structure can be obtained with the average degree, average betweenness, and average clustering coefficient of the unweighted network after 30 simulations. With the network cascade failure extending, the power-weighted degree, weighted betweenness, and weighted clustering coefficient can be calculated at the same time. Then, the power-weighted composite evaluation index is measured and analyzed. Finally, the results of the two methods are compared to draw a conclusion.
5.3. Results Analysis
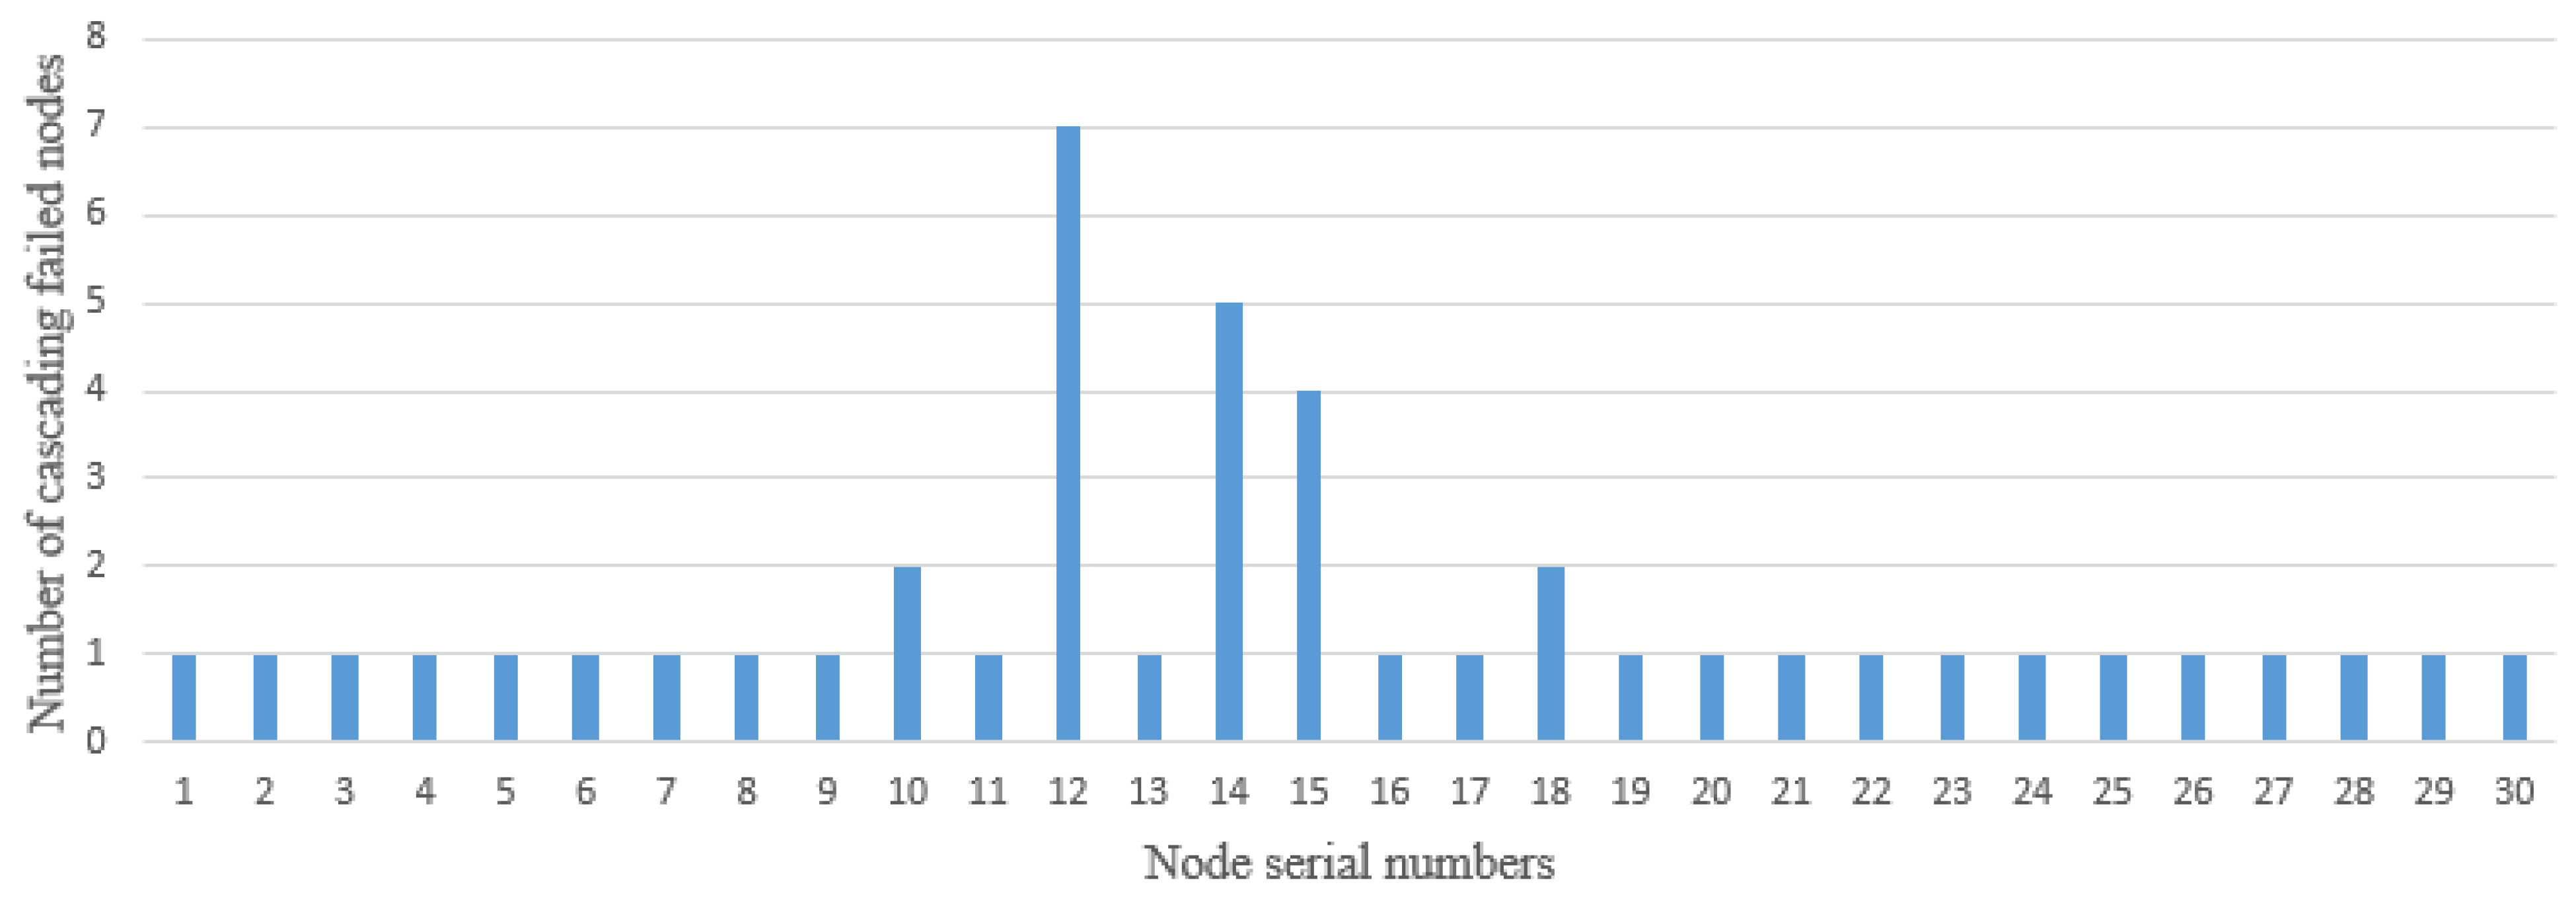
By cascading the network to failure, the node serial numbers corresponding to the number of cascading failed nodes are shown in Figure 5.
Figure 5 shows that the failure of nodes 10, 12, 14, 15, and 18 causes network cascade failure, and node 15 especially has a crucial role in the network topology.
The simulation results of the network weighted degree, weighted betweenness centrality, and weighted clustering coefficient calculated using the cascade failure matrix are shown in Table 2.
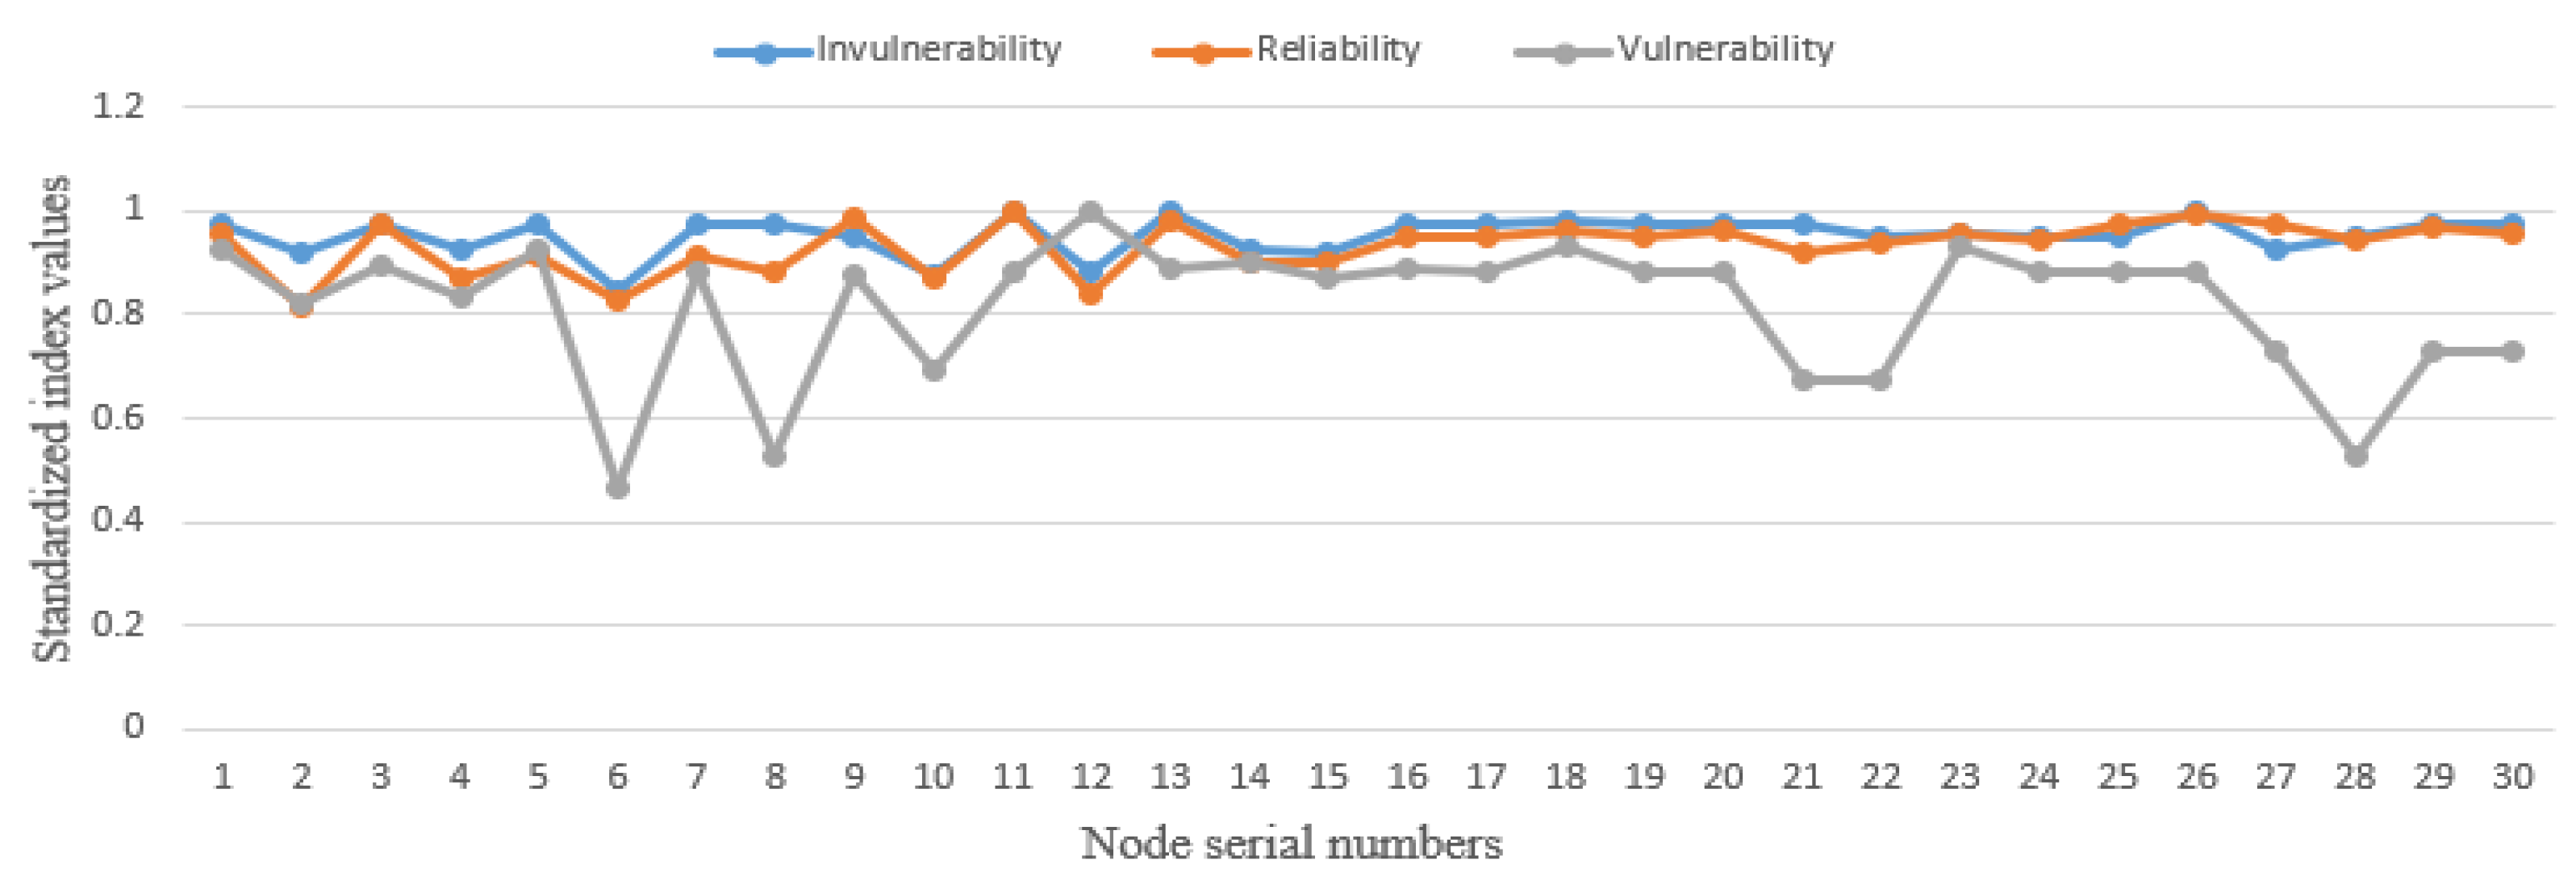
The data in Table 2 are substituted into models (7) to (9) to obtain the changes in network invulnerability, reliability, and vulnerability, as shown in Table 3 and Figure 6.
As shown in Figure 6, the network has high invulnerability and reliability. The failure of nodes 6, 7, and 28 has a high impact on the network vulnerability.
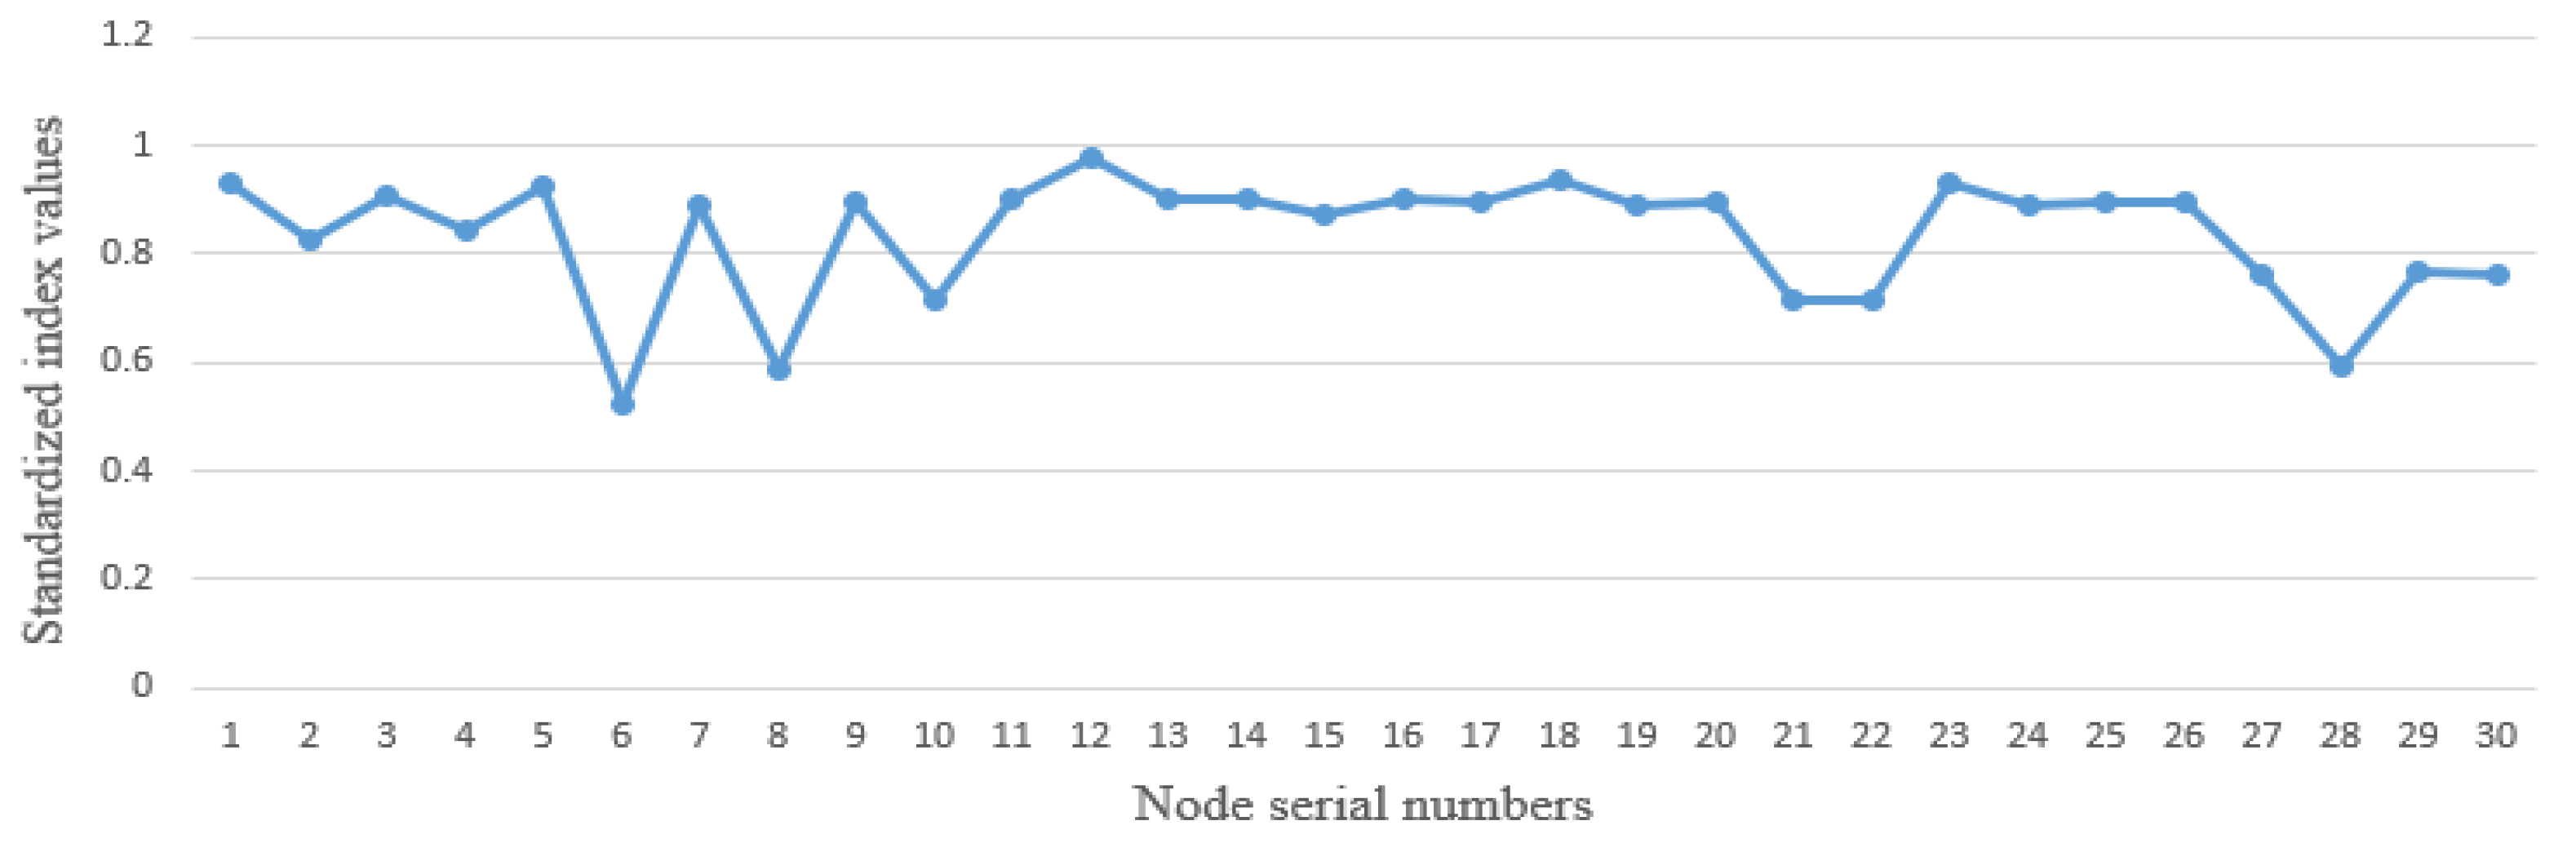
Substituting results of the above indices into Formula (15) yields a comprehensive network performance index change with a sequential deletion of nodes, as shown in Figure 7.
Figure 7 shows that the IEEE-30 bus system network has good comprehensive performance, and it is relatively stable as nodes 1 to 30 fail in cascade, one by one. It was also found that the failure of nodes such as 6, 8, 10, 21, 22, and 28 in the network produced a large loss in the overall performance of the network. This indicates the presence of critical nodes in the network, which play a crucial role in maintaining the network performance.
Comparing Figure 5 and Figure 7, it can be seen that the number of failed nodes is not directly related to the performance loss of the network structure. In Figure 5, the failure of nodes 12, 14, and 15 causes cascading failure with multiple nodes. However, these nodes are not included in the key nodes in Figure 7, which have an impact on global performance. This means that power-weighted networks reflect the vulnerable nodes of the network better than topological networks; in other words, power-weighted networks reflect real-world grid functional characteristics and state information better than simple complex network topological models on comprehensive performance evaluation.
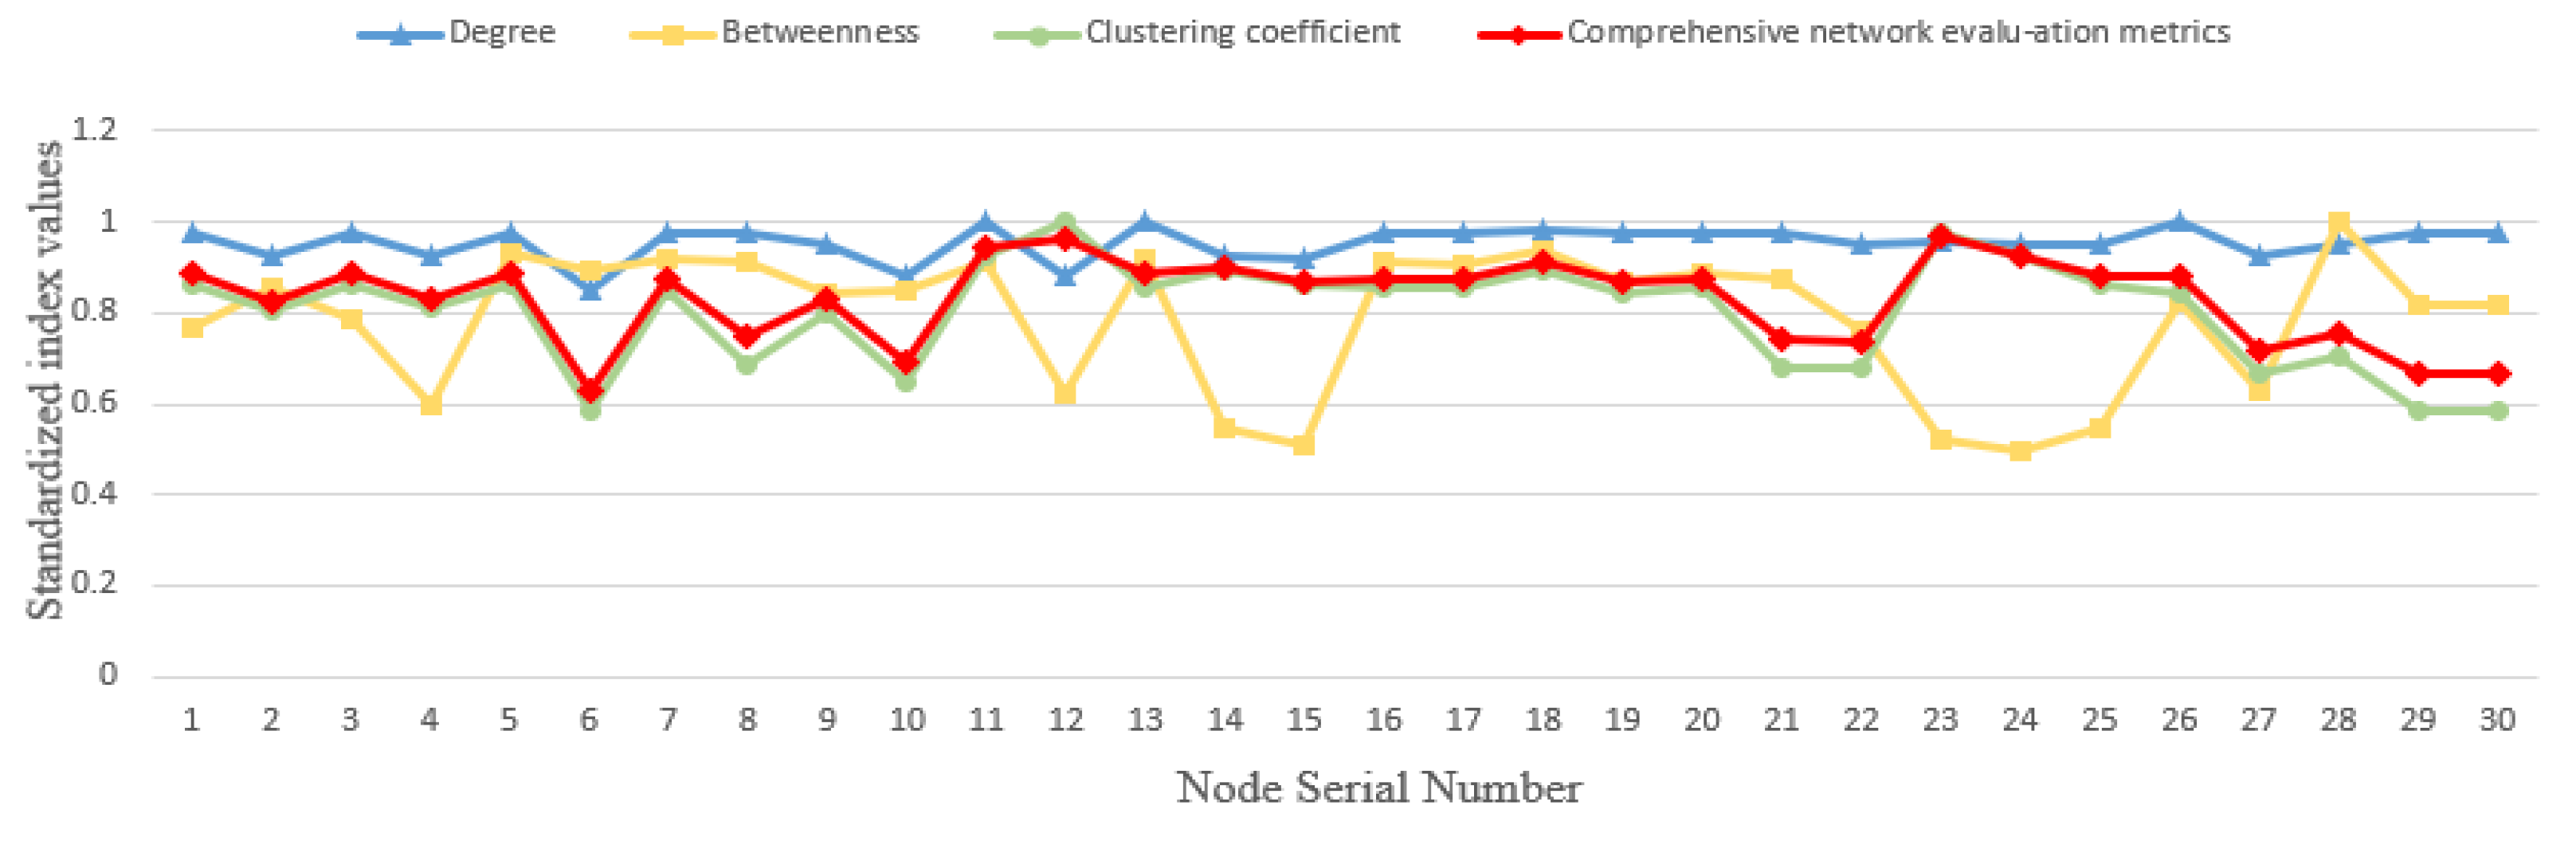
5.3.1. Experiment 1: Comparing Topological Eigenvalues with Unweighted Composite Evaluation Metrics
The adjacency matrix is applied to construct the unweighted network model and calculate the network topological eigenvalues, as shown in Table 4. The comprehensive network evaluation metrics are calculated by substituting the unweighted eigenvalues to the model, as shown in Table 5. The topological characteristic values and the comprehensive evaluation indices vary with the serial number of failed nodes, as shown in Figure 8.
Figure 8 shows that, compared with the individual feature indices that focus on one aspect of the properties and ignore the other structural properties, the comprehensive indices constructed in this paper can better characterize the overall network performance. The integrated index curve in Figure 8 is similar to the clustering coefficient curve. The reason for this phenomenon mainly lies in that the entropy method assigns weights according to the data characteristics and the weights in Formula (15) can be adjusted according to the problem in practical applications.
5.3.2. Experiment 2: Comparison Study of Unweighted Composite Assessment Metrics with Power-Weighted Composite Assessment Metrics
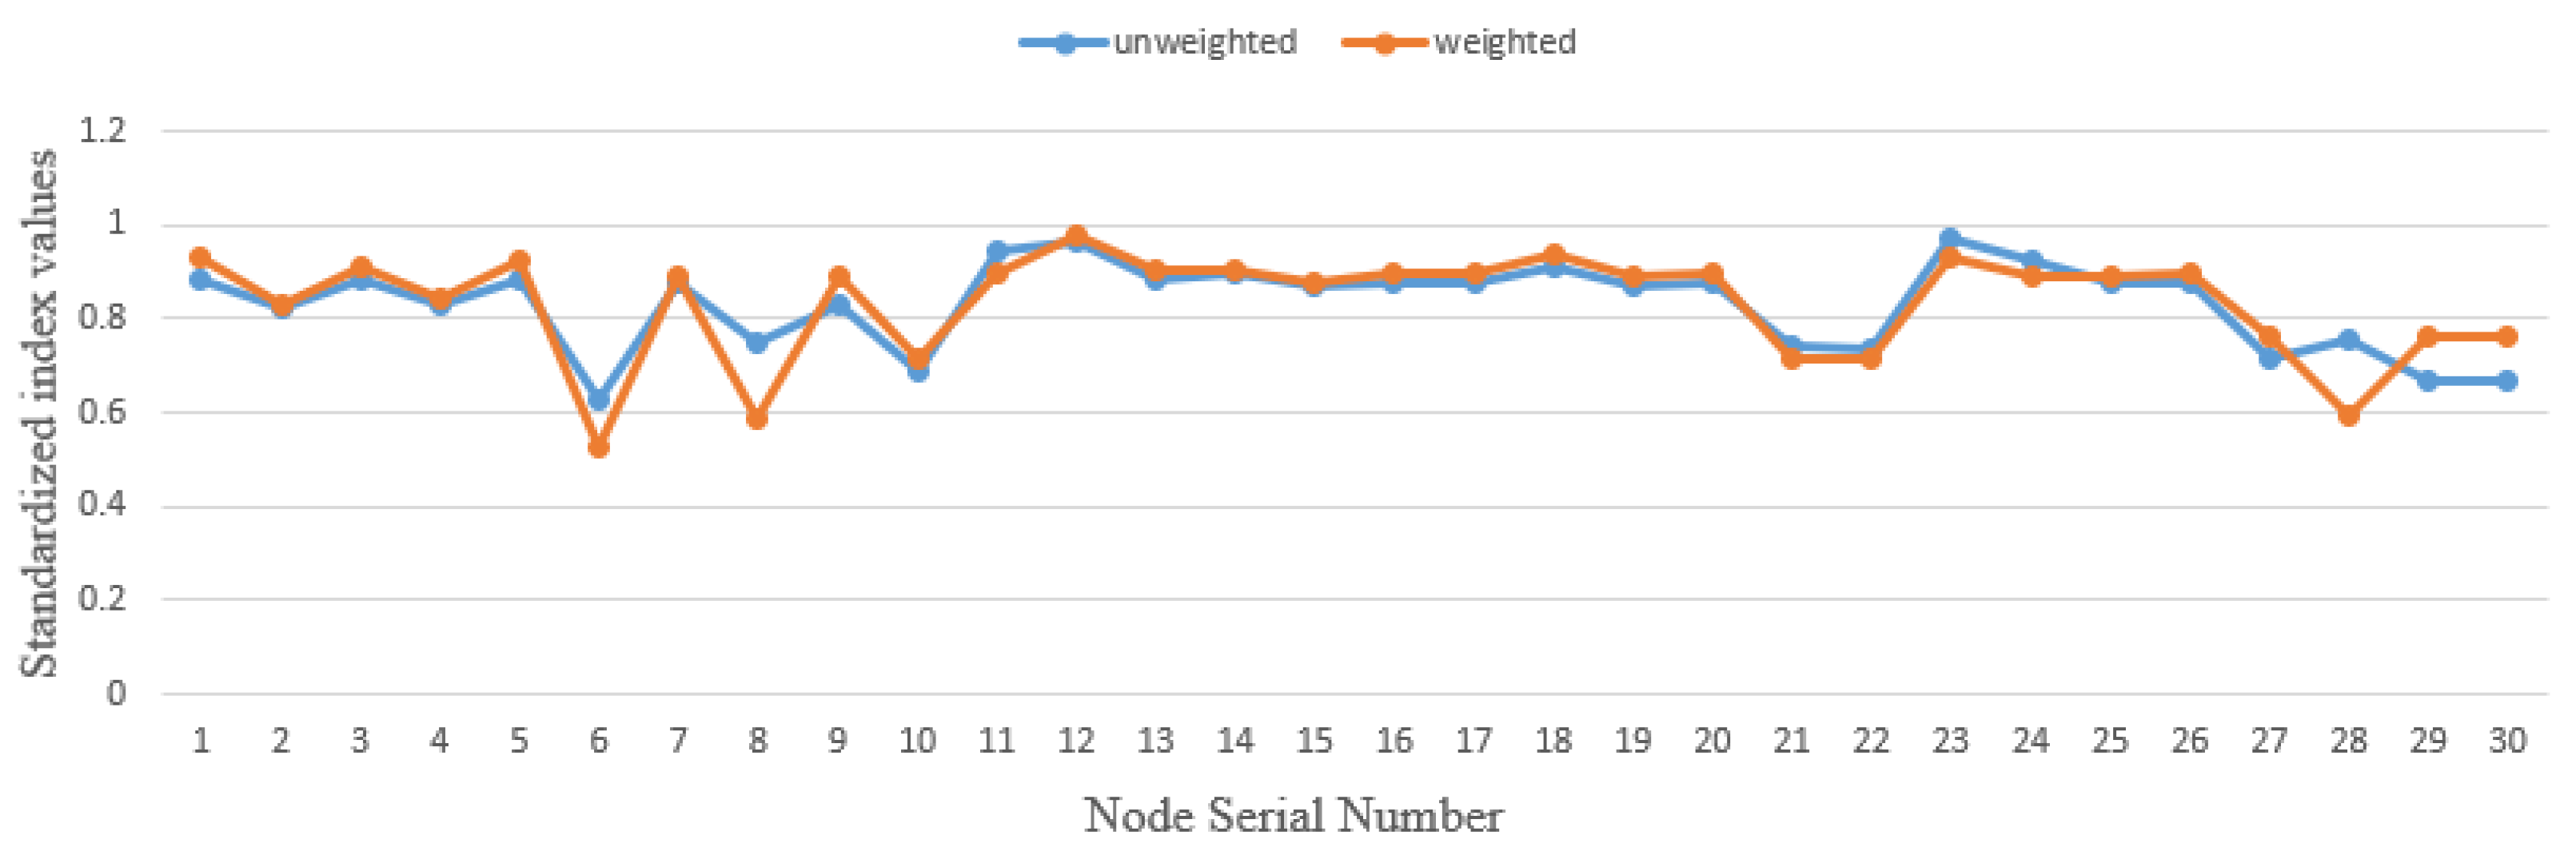
The data characteristics of the unweighted comprehensive network evaluation metrics are shown in Table 5, and the data characteristics of the weighted comprehensive network evaluation metrics are shown in Table 6. The two comprehensive network evaluation metrics vary with the failed node serial number, shown in Figure 9.
As can be seen from Figure 9, although the two comprehensive indices have the same trend, the actual values of each node are different, which indicates that the topology network cannot provide a good explanation of the actual losses caused by cascade failures on the network structure performance. That is, the power-weighted grid complex network structure performance integrated assessment index can reflect the actual state of the grid better.
From the above two comparison experiments, it can be seen that the power-weighted grid complex network structure performance comprehensive evaluation index proposed in this paper can reflect the network structure performance comprehensively and realistically.
For the grid cascade failure phenomenon, this paper performs some research on the grid complex network model and grid structure performance analysis. However, there are still some shortcomings that need to be further improved:
- The cascade failure model in this paper only considers the mode of node overload failure removal; the actual grid may be a mixture of node and line failure modes simultaneously, which should be taken into consideration in the system attack strategy analysis;
- The model in this paper is not pilot-run in the real grid, and the results obtained in the real grid may vary from the simulation results. Further real application studies need to be carried out to make the model better for application;
- The entropy method applied in this paper assigns weights according to the data characteristics, and the weights obtained by this indicator become larger when there are large fluctuations in the data types of individual indicators, which makes the influence of the indicator on the comprehensive performance assessment of the network larger, and the limitations of this assignment method can be improved in the future study.
6. Conclusions
This paper combines power grid structure performance assessment, complex networks, cascading failures, and grid power characteristics to propose a power-weighted grid complex network structure performance assessment index. By analyzing the standard nodes, we can have the conclusion as follows:
- The cascading failure of the grid to individual nodes has a good overall performance, but there are still individual weak nodes that exist;
- The number of failed nodes in the network does not have a direct effect on the comprehensive performance loss of the network. Topology is not a direct factor affecting the network performance
The power-weighted grid complex network structure performance evaluation index proposed in this paper reflects the real-world grid functional characteristics and state information more realistically. With the increasing complexity of power systems and the expansion of renewable energy penetration, this evaluation index proposed in this paper will have more applicable scenarios in the future.
Author Contributions
Conceptualization, D.Z. and L.J.; methodology, D.Z. and L.J.; software, J.N. and Y.Y.; validation, J.N., Y.Y., and H.S.; formal analysis, D.Z. and R.S.; investigation, H.S.; resources, R.S. and L.J.; data curation, D.Z.; writing—original draft preparation, D.Z. and J.N.; writing—review and editing, D.Z. and L.J.; visualization, Y.Y.; supervision, L.J.; project administration, R.S.; funding acquisition, R.S. and L.J. All authors have read and agreed to the published version of the manuscript.
Funding
This research was funded in part by the National Key R&D plan Foundation of China (Grant No. 2021YFB2601300).
Data Availability Statement
Not applicable.
Conflicts of Interest
The authors declare no conflict of interest.
References
- Fan, W.; Liao, Y. Wide area measurements based fault detection and location method for transmission lines. Prot. Control. Mod. Power Syst. 2019, 4, 53–64. [Google Scholar] [CrossRef]
- Chu, C.C.; Iu, H.H.C. Complex networks theory for modern smart grid applications: A survey. IEEE J. Emerg. Sel. Top. Circuits Syst. 2017, 7, 177–191. [Google Scholar] [CrossRef]
- Xiao, F.; Li, J.; Wei, B. Cascading failure analysis and critical node identification in complex networks. Phys. A Stat. Mech. Its Appl. 2022, 596, 127117. [Google Scholar] [CrossRef]
- Wu, Y.P.; Chen, Z.L.; Zhao, X.D.; Liu, Y.; Zhang, P.; Liu, Y. Robust analysis of cascading failures in complex networks. Phys. A Stat. Mech. Its Appl. 2021, 583, 126320. [Google Scholar] [CrossRef]
- Lee, L.; Hu, P. Vulnerability analysis of cascading dynamics in smart grids under load redistribution attacks. Int. J. Electr. Power Energy Syst. 2019, 111, 182–190. [Google Scholar] [CrossRef]
- Guo, J.; Feng, T.; Cai, Z.L.; Lian, X.L.; Tang, W.H. Vulnerability Assessment for power transmission lines under typhoon weather based on a cascading failure state transition diagram. Energies 2020, 13, 3681. [Google Scholar] [CrossRef]
- Rahnamay-Naeini, M.; Wang, Z.; Ghani, N.; Mammoli, A.; Hayat, M.M. Stochastic analysis of cascading-failure dynamics in power grids. IEEE Trans. Power Syst. 2014, 29, 1767–1779. [Google Scholar] [CrossRef] [Green Version]
- Fan, W.L.; Liu, Z.G.; Hu, P.; Mei, S.W. Cascading failure model in power grids using the complex network theory. IET Gener. Transm. Distrib. 2016, 10, 3940–3949. [Google Scholar]
- Peng, X.Z.; Yao, H.; Du, J.; Wang, Z.; Ding, C. Invulnerability of scale-free network against critical node failures based on a renewed cascading failure model. Phys. A 2015, 421, 69–77. [Google Scholar] [CrossRef]
- Fan, X.K.; Dudkina, E.; Gambuzza, L.V.; Frasca, M.; Crisostomi, E. A network-based structure-preserving dynamical model for the study of cascading failures in power grids. Electr. Power Syst. Res. 2022, 209, 107987. [Google Scholar] [CrossRef]
- Li, J.; Sun, C.W.; Su, Q.Y. Analysis of cascading failures of power cyber-physical systems considering false data injection attacks. Glob. Energy Interconnect. 2021, 4, 204–213. [Google Scholar] [CrossRef]
- Dai, Y.T.; Preece, R.; Panteli, M. Risk assessment of cascading failures in power systems with increasing wind penetration. Electr. Power Syst. Res. 2022, 211, 108392. [Google Scholar] [CrossRef]
- Gao, X.X.; Li, X.J.; Yang, X.Y. Robustness assessment of the cyber-physical system against cascading failure in a virtual power plant based on complex network theory. Int. Trans. Electr. Energy Syst. 2021, 31, e13039. [Google Scholar] [CrossRef]
- Guo, W.Z.; Wang, H.; Wu, Z.P. Robustness analysis of complex networks with power decentralization strategy via flow-sensitive centrality against cascading failures. Phys. A Stat. Mech. Its Appl. 2018, 494, 186–199. [Google Scholar] [CrossRef]
- Sun, Y.S.; Tang, X.S.; Zhang, G.W.; Miao, F.F.; Wang, P. Dynamic power flow cascading failure analysis of wind power integration with complex network theory. Energies 2017, 11, 63. [Google Scholar] [CrossRef] [Green Version]
- Yan, J.; Tang, Y.F.; He, H.B.; Sun, Y. Cascading failure analysis with DC power flow model and transient stability analysis. IEEE Trans. Power Syst. 2014, 30, 285–297. [Google Scholar] [CrossRef]
- Alberto, A.; Dueñas-Osorio, L.; Cadini, F.; Zio, E. Electrical and topological drivers of the cascading failure dynamics in power transmission networks. Reliab. Eng. Syst. Saf. 2018, 175, 196–206. [Google Scholar]
- Li, J.; Shi, C.L.; Chen, C.K.; Dueñas-Osorio, L. A cascading failure model based on AC optimal power flow: Case study. Phys. A Stat. Mech. Its Appl. 2018, 508, 313–323. [Google Scholar] [CrossRef]
- Noebels, M.; Preece, R.; Panteli, M. AC cascading failure model for resilience analysis in power networks. IEEE Syst. J. 2022, 16, 374–385. [Google Scholar] [CrossRef]
- Peng, H.; Kan, Z.; Zhao, D.D.; Han, J.M.; Lu, J.F.; Hu, Z.L. Reliability analysis in interdependent smart grid systems. Phys. A Stat. Mech. Its Appl. 2018, 500, 50–59. [Google Scholar] [CrossRef]
- Jiang, Z.Y.; Liu, Z.Q.; He, X.; Ma, J.F. Cascade phenomenon against subsequent failures in complex networks. Phys. A Stat. Mech. Its Appl. 2018, 499, 472–480. [Google Scholar] [CrossRef]
- Fan, W.L.; He, X.F.; Xiao, Y.Q.; Li, Q.Y. Vulnerability analysis of power system by modified H-index method on cascading failure state transition graph. Electr. Power Syst. Res. 2022, 209, 107986. [Google Scholar] [CrossRef]
- Li, K.W.; Liu, K.; Wang, M. Robustness of the Chinese power grid to cascading failures under attack and defense strategies. Int. J. Crit. Infrastruct. Prot. 2021, 33, 100432. [Google Scholar] [CrossRef]
- Guo, J.K.; Wang, S.B.; Wang, D.D.; Liu, T.B. Spatial structural pattern and vulnerability of China-Japan-Korea shipping network. Chin. Geogr. Sci. 2017, 27, 697–708. [Google Scholar] [CrossRef]
- Gull, S.F.; Skilling, J. Maximum entropy method in image processing. Commun. Radar Signal Process. 2008, 131, 646–659. [Google Scholar] [CrossRef]
- Hu, F.N.; Chen, L.J.; Chen, J. Robustness evaluation of complex power grids containing renewable energy. Int. J. Electr. Power Energy Syst. 2021, 132, 107187. [Google Scholar] [CrossRef]
- Zhou, D.Y.; Hu, F.N.; Wang, S.L.; Chen, J. Power network robustness analysis based on electrical engineering and complex network theory. Phys. A Stat. Mech. Its Appl. 2020, 564, 125540. [Google Scholar] [CrossRef]
Figure 1.
Grid cascade failure flowchart.

Figure 2.
Grid structure performance assessment process.

Figure 3.
Electrical wiring diagram of IEEE-30 bus system.

Figure 4.
Network structure diagram of IEEE-30 bus system.

Figure 5.
The number of cascade failure nodes caused by each node.

Figure 6.
Grid performance metrics changing with sequential deletion of nodes.

Figure 7.
Sequential deletion of node grid performance composite index changes.

Figure 8.
Variation of topological characteristic values and comprehensive evaluation indices with the serial number of failed nodes.
Figure 8.
Variation of topological characteristic values and comprehensive evaluation indices with the serial number of failed nodes.

Figure 9.
The two comprehensive network evaluation metrics vary from the failure node serial number.
Figure 9.
The two comprehensive network evaluation metrics vary from the failure node serial number.


Table 1.
The differences between the work done in this paper and the existing literature.
| The Work in Existing Literature | The Work Conducted in This Paper | |
|---|---|---|
| Research Focus | 1. The study on power system cascade failure propagation mechanism modeling; 2. The dynamic cascade failure study using power flow information. | 1. No need to take the power flow characteristics into consideration; 2. A variety of evaluation indices are proposed for different grid characteristics; 3. Objective weighting method is employed to synthesize the indices so that a comprehensive evaluation of the grid characteristics can be made in a proper manner. |
Table 2.
Data characteristics of network weighted degree, weighted betweenness centrality, and weighted clustering coefficient.
Table 2.
Data characteristics of network weighted degree, weighted betweenness centrality, and weighted clustering coefficient.
| Characteristic Indicators | Maximum Value | Minimum Value | Average Value | 0.25 Quantile |
|---|---|---|---|---|
| Degree | 17.7724 | 14.5172 | 16.5719 | 16.0308 |
| Betweenness | 0.1199 | 0.0549 | 0.0893 | 0.0707 |
| Clustering coefficient | 1.4657 | 0.6856 | 1.1956 | 1.0663 |
Table 3.
Data characteristics of network invulnerability, reliability, and vulnerability.
| Indicators | Maximum Value | Minimum Value | Average Value | 0.25 Quantile |
|---|---|---|---|---|
| Invulnerability | 1.0239 | 0.8669 | 0.9761 | 0.9489 |
| Reliability | 1.0491 | 0.8569 | 0.9782 | 0.9462 |
| Vulnerability | 1.0835 | 0.5068 | 0.8838 | 0.7882 |
Table 4.
Data characteristics of network’s unweighted degree, unweighted betweenness, and unweighted clustering coefficient.
Table 4.
Data characteristics of network’s unweighted degree, unweighted betweenness, and unweighted clustering coefficient.
| Characteristic Indicators | Maximum Value | Minimum Value | Average Value | 0.25 Quantile |
|---|---|---|---|---|
| Degree | 2.7586 | 2.3448 | 2.6325 | 2.5600 |
| Betweenness | 0.0220 | 0.0109 | 0.0174 | 0.0138 |
| Clustering coefficient | 0.1437 | 0.0839 | 0.1156 | 0.0983 |
Table 5.
Data characteristics of comprehensive network evaluation metrics.
| Indicators | Maximum Value | Minimum Value | Average Value | 0.25 Quantile |
|---|---|---|---|---|
| Comprehensive network evaluation metrics | 0.9705 | 0.6297 | 0.8335 | 0.7458 |
Table 6.
Data characteristics of weighted comprehensive network evaluation metrics.
| Indicators | Maximum Value | Minimum Value | Average Value | 0.25 Quantile |
|---|---|---|---|---|
| Comprehensive network evaluation metrics | 0.9773 | 0.5244 | 0.8348 | 0.7635 |
Disclaimer/Publisher’s Note: The statements, opinions and data contained in all publications are solely those of the individual author(s) and contributor(s) and not of MDPI and/or the editor(s). MDPI and/or the editor(s) disclaim responsibility for any injury to people or property resulting from any ideas, methods, instructions or products referred to in the content. |
© 2023 by the authors. Licensee MDPI, Basel, Switzerland. This article is an open access article distributed under the terms and conditions of the Creative Commons Attribution (CC BY) license (https://creativecommons.org/licenses/by/4.0/).
Share and Cite
MDPI and ACS Style
Zhang, D.; Jia, L.; Ning, J.; Ye, Y.; Sun, H.; Shi, R. Power Grid Structure Performance Evaluation Based on Complex Network Cascade Failure Analysis. Energies 2023, 16, 990. https://0-doi-org.brum.beds.ac.uk/10.3390/en16020990
AMA Style
Zhang D, Jia L, Ning J, Ye Y, Sun H, Shi R. Power Grid Structure Performance Evaluation Based on Complex Network Cascade Failure Analysis. Energies. 2023; 16(2):990. https://0-doi-org.brum.beds.ac.uk/10.3390/en16020990
Chicago/Turabian StyleZhang, Di, Limin Jia, Jin Ning, Yujiang Ye, Hao Sun, and Ruifeng Shi. 2023. "Power Grid Structure Performance Evaluation Based on Complex Network Cascade Failure Analysis" Energies 16, no. 2: 990. https://0-doi-org.brum.beds.ac.uk/10.3390/en16020990
Note that from the first issue of 2016, this journal uses article numbers instead of page numbers. See further details here.