
Condition Monitoring Accuracy in Inverter-Driven Permanent Magnet Synchronous Machines Based on Motor Voltage Signature Analysis


Department of Electrical and Computer Engineering, Michigan State University, East Lansing, MI 48824, USA
*
Author to whom correspondence should be addressed.
Energies 2023, 16(3), 1477; https://0-doi-org.brum.beds.ac.uk/10.3390/en16031477
Submission received: 27 December 2022
/
Revised: 23 January 2023
/
Accepted: 28 January 2023
/
Published: 2 February 2023
(This article belongs to the Special Issue Condition Monitoring and Failure Prevention of Electric Machines)
Abstract
:Condition monitoring and preventative maintenance are essential for reliable and efficient operation of permanent magnet synchronous machines driven by inverters. There are two types of industrial inverter drives available: field oriented control and direct torque control. Their compensation nature and control structure are distinct and, therefore, the condition monitoring approach designed for the former control may not be applicable to the latter one. In this paper, we investigate the Motor Voltage Signature Analysis approach for both inverter drives under healthy and faulty conditions. Four typical fault conditions are addressed: turn-to-turn short circuit, high resistance contact, static eccentricity, and local demagnetization. High fidelity cosimulation is developed by coupling the finite element machine model with both control drives. The spectral elements of the commanded stator voltage are utilized as indicators for supervised classification to identify, categorize, and estimate the severity of faults. Linear discriminate analysis, k-nearest neighbor, and support vector machines are the classification techniques used. Results indicate that the condition monitoring based on the Motor Voltage Signature Analysis performs adequately in field oriented control. Nevertheless, the utilized monitoring scheme does not exhibit satisfactory performance in direct torque control owing to the nonlinear characteristics and tolerance nature of this drive.
1. Introduction
The use of Permanent Magnet Synchronous Machines (PMSMs) has increased dramatically during the last three decades. This is due to the development of new magnets with high residual flux density, high energy product, and considerable demagnetization resilience, such as the Neodymium-Iron-Boron (NdFeB) magnet [1]. Therefore, PMSMs outperform induction machines in terms of efficiency, rotor mass, and torque density [2,3]. Such advantages make PMSMs more prevalent in different critical industries such as automotive, aerospace, and renewable energy applications [4]. In these critical applications, where safety is a must, highly reliable and efficient electricity-driven PMSMs systems are required. However, a failure may occur unexpectedly due to material aging, assembly defects, poor installation, or inappropriate operation, all of which may result in costly shutdowns and tragic loss of human lives [5,6,7]. Therefore, inverter-driven PMSMs systems necessitate health monitoring and fault diagnosis algorithms to guarantee the highest level of safety and reliability.
Fault diagnosis is considerably demanding and challenging in inverter-driven PMSMs as compared to the line-fed ones. This is evidenced by the fact that fault detectability in inverter-driven PMSM systems is diminished by the compensatory capability of the drive system [8]. The two most common drives for PMSMs are Field Oriented Control (FOC) and Direct Torque Control (DTC). FOC was introduced in the late 1960s for alternating current machines and then first adopted by the Toshiba industry a decade later. The main concept of FOC is to control the stator current vector in the rotor flux linkage frame at fixed switching frequency [9,10]. DTC, on the other hand, aims to directly control the stator flux linkage and the electromagnetic torque through hysteresis comparators. Thus, the switching frequency is variable and a position sensor is not necessary to achieve the complex current orientation into the rotor flux linkage frame [11]. It was proposed in the early 1970s and then commercialized by the ABB industry two decades later [12,13]. Both control schemes have a simple structure and provide satisfactory performance with better steady-state behavior in the case of FOC and faster torque dynamics in DTC. However, one control scheme can be more appropriate than the other based on the drive requirements of the application.
Intensive research on fault diagnosis has been conducted in the literature for FOC-driven PMSMs under different faults [14,15,16]. For the most precise fault detection in various operating conditions, the Machine Voltage or Current Signature Approach (MVSA/MCSA) has been commonly used at high loads. This method allows remote machine monitoring through the Motor Control Center (MCC) with no extra hardware for implementation. Turn-to-Turn Short Circuit (TTSC) and eccentricity faults cause changes in the sideband harmonics of the stator current; therefore, they could be used as features for fault presence [17,18]. As the Signal-to-Noise Ratio (SNR) of the utilized features drops in the presence of increasing noise levels, so does the reliability of the detection method. Therefore, the main spectral elements in the stator current or voltage have been considered because of their higher SNR for identifying and classifying TTSC, eccentricity, and demagnetization faults using Linear Discriminate Analysis (LDA) classifier [19]. Harmonics in the stator current or voltage waveforms, however, are sensitive to the bandwidth of the controller. Thus, it is recommended that the harmonics in the voltage waveform be used for fault diagnosis since they are prominent when a high bandwidth is utilized to obtain better control performance [20]. Despite the fact that the MVSA method has had widespread use in the research community for FOC drives, it has not been examined for DTC-driven PMSMs.
The change in commanded voltages in the rotor flux linkage frame, according to [14], may be utilized to identify and discriminate eccentricity, demagnetization, and TTSC faults. Monitoring magnitude variations of these voltage signals present in the FOC drives allows for nonintrusive fault detection. Due to the DTC drive being executed in the stationary reference frame, where these voltages are not accessible and the position sensor is unnecessary, this method could not be extended for DTC.
Few contemporary studies examine condition monitoring for DTC-driven PMSMs [20,21,22,23,24]. Zero-sequence voltage component (ZSVC) magnitude and its initial phase have been proposed by authors in [21] for TTSC fault detection. The negative influence of TTSC on DTC performance is then compensated by using torque injection and an enhanced flux observer. To calculate the zero-sequence network, however, neutral point access is required by paralleling a balanced three-phase resistive load with the machine. In [22], the High Resistance Contact (HRC) fault has been investigated by including a fixed flux deviation in the stator flux linkage estimate necessary for DTC drive operation. However, further analysis is needed to ensure reliable DTC operation considering the importance of accurate flux estimation to DTC. To accommodate PMSM drives with open phase fault, recent research adapted the DTC system for use as a fault tolerant control [25,26,27].
Fault identification is required to enhance drive performance considering multiple faults to avoid false alarms. Fault diagnosis methods of PMSMs that exist in the literature based on the FOC scheme are not suitable for DTC-driven PMSMs as they have a different nature of compensation, a different structure, and a different regulation principle. There is a clear gap in the research on the reliability of DTC-driven PMSMs. The major contributions of this work are: (1) Reliable multiple fault detection and separation is introduced by adopting multifeature analysis to avoid misclassification and false alarms, as the vast majority of the existing detection methods in the literature consider single fault. (2) Evaluating the supervised learning techniques in fault diagnosis for both FOC and DTC-driven PMSMs. (3) Reducing the research gap in the reliability of DTC-driven PMSMs by addressing the MVSA approach and examining its performance in detecting and discriminating faults for DTC-driven PMSMs. (4) The challenges in fault diagnosis for DTC-driven PMSMs are highlighted in order to pave the path for further development in monitoring approaches that suit the DTC scheme.
2. Theoretical Background
2.1. PMSM Faults and MVSA Approach
Stator faults are most commonplace in low and medium power machines [28]. They could be TTSC due to the degradation in winding insulation or HRC due to the loose connection between the machine and inverter terminals. Machine overloading in harsh environments and electric stress from switching devices lead to electrical stator faults eventually. TTSC fault propagates faster than the other faults and results in further insulation degradation and motor outage in the end [29]. HRC results in excessive heat at the motor–inverter joints and can lead to open phase fault if left unaddressed [22]. Therefore, stator fault detection and discrimination help in reducing the risk of motor outage, reducing the maintenance cost, and selecting the proper mitigation scheme.
Rotor faults occur more commonly in high power machines; they are 49% of failure distribution [30]. Eccentricity faults are an example of the mechanical rotor failures that inherently exist at the manufacturing phase. It increases the Noise, Vibration, and Harshness (NVH) and can lead to rotor rubbing the stator laminations [18]. Additionally, demagnetization is another rotor fault that could take place within driven PMSMs if the electromagnetic constraints are exceeded by improper operation in the field weakening region or due to the severe TTSC fault occurrence [31]. As a result, the rotor magnets get demagnetized causing asymmetric flux distribution in the air gap. Reduction in the average torque and increase in the torque ripple are the main consequences of the demagnetization fault. Therefore, rotor fault detection is crucial to avoid any damage to the machine structure and improve the drive performance.
Stator and rotor faults manifest themselves in the spectrum of the machine voltage signal and leave either distinct or similar trends. Proper utilization of these trends, which is known as MVSA, does not help only in identifying whether the PMSM is healthy or faulty but also helps in fault classification and severity estimation. Several signal processing techniques are available to obtain the frequency spectrum of the machine voltage signal [32]. The spectrum is obtained at a steady state using Fast Fourier Transform (FFT), or under nonstationary conditions using time–frequency analysis methods like Short Time Fourier transform (STFT). Variations in magnitude and/or phase of the obtained spectral elements could be utilized as features for supervised classifiers to detect faults.
2.2. PMSM Drives
2.2.1. Field Oriented Control
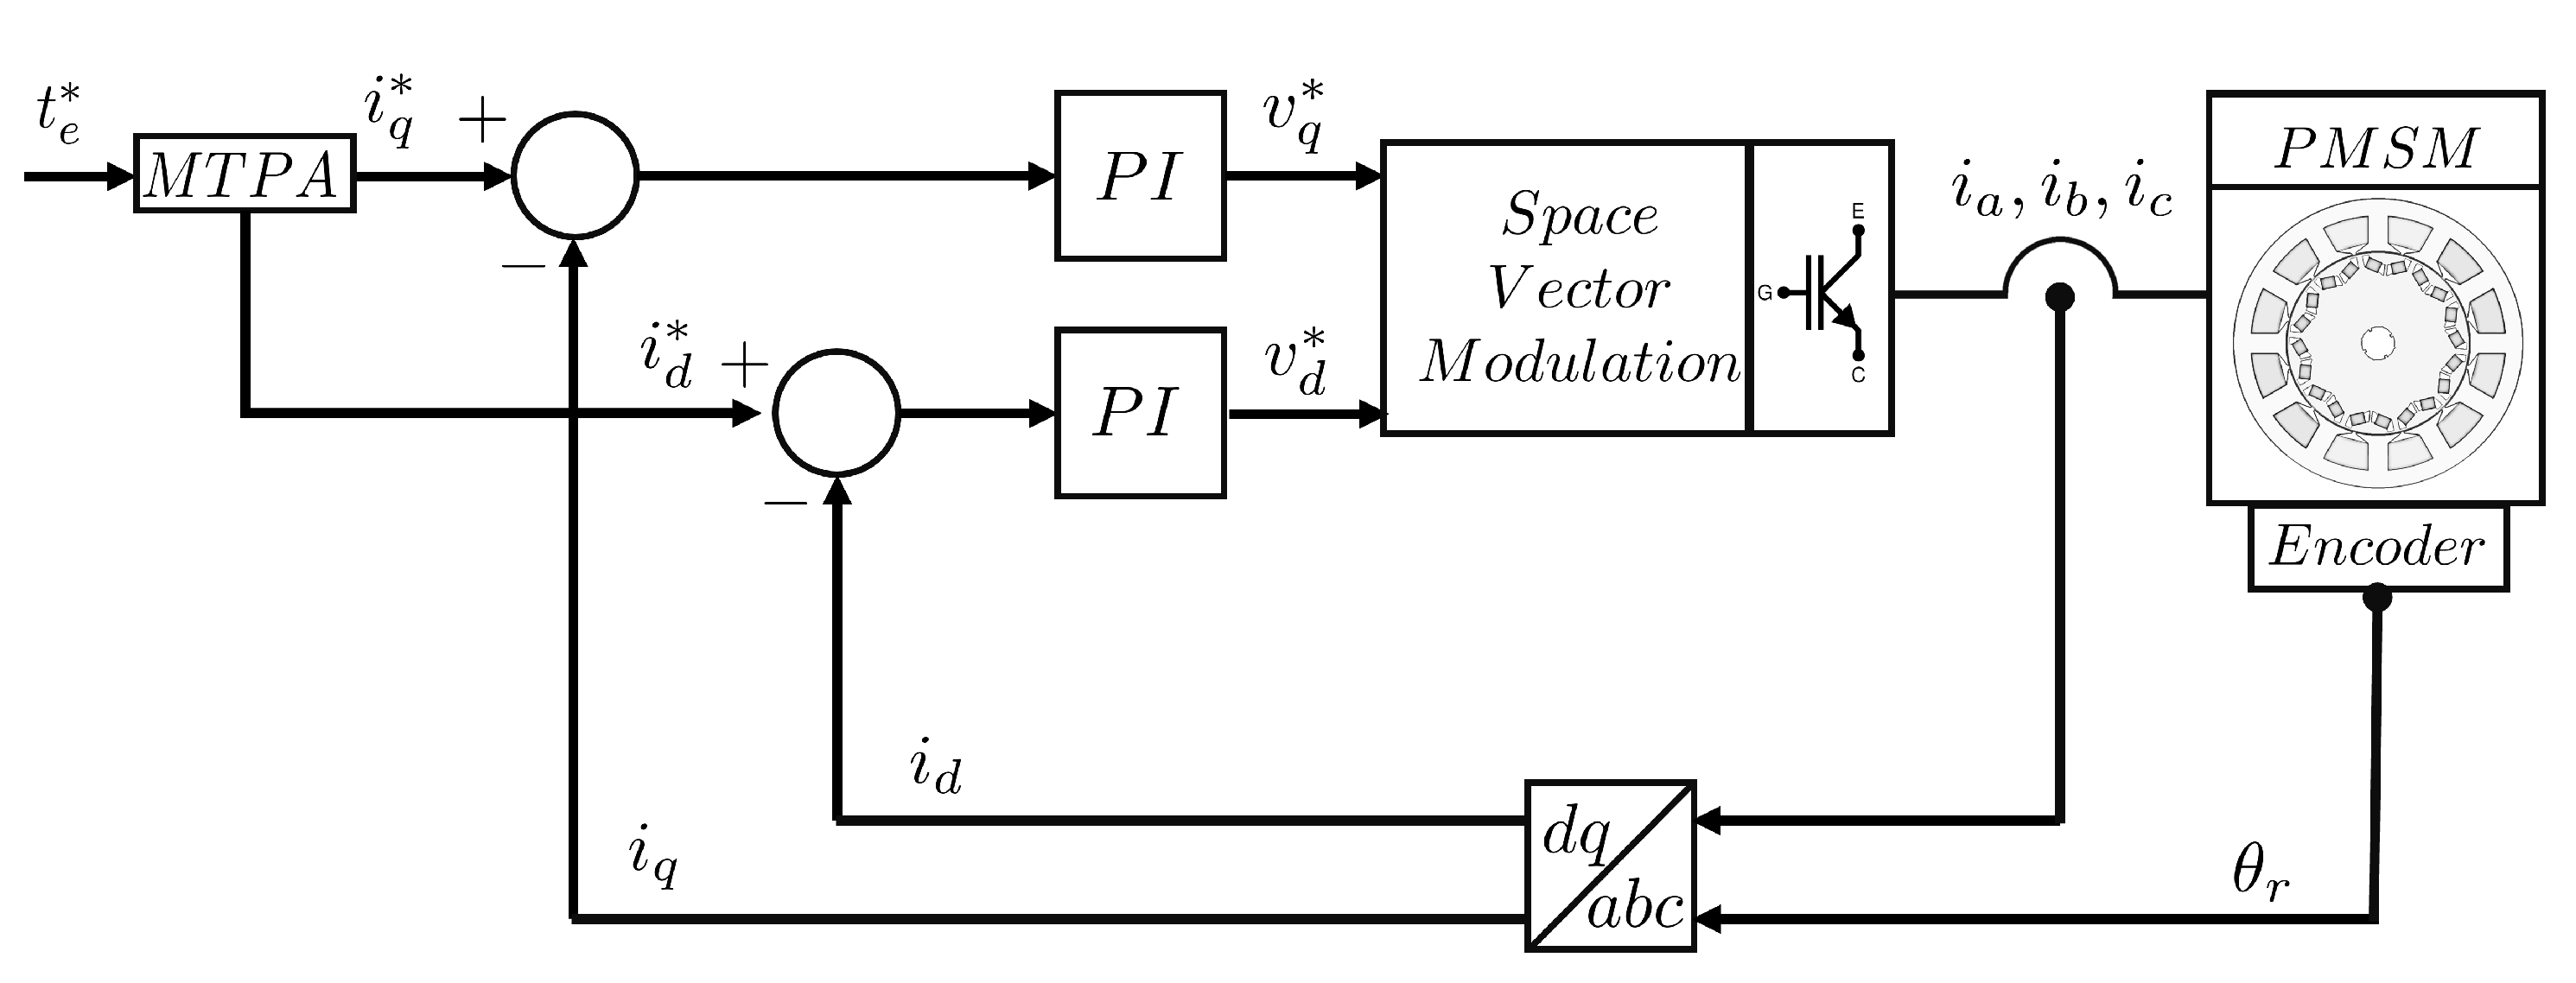
Magnetizing and torque current components in the direct and quadrature axes (id and iq) of the rotor flux linkage frame are regulated separately using a proportional–integral (PI) controllers in FOC so that the output torque is regulated indirectly. Hence, FOC is also called indirect torque control. Figure 1 depicts the implementation of FOC-driven PMSM, where an encoder is needed to estimate the rotor position () required for current vector decoupling. The widely applied modulation technique to control the inverter switching scheme in FOC is the Space Vector Pulse Width Modulation (SVPWM) due to its high utilization of the DC link and low harmonic distortion [33]. The principle behind SVPWM is to synthesize a reference space voltage vector using timely applied active and zero voltage vectors at a fixed switching frequency.
The expressions of dq currents and the corresponding machine torque as a function of both currents are shown in (1) and (2), respectively.
where and are the stator current magnitude and angle measured from the q-axis, respectively. is the machine electromagnetic torque. is the number of rotor poles in PMSM. and are the inductance of the direct and quadrature axes. is the magnet flux linkage.
By controlling and , different (,) combinations can be generated and different control modes can be achieved as follows: Maximum Torque Per Ampere (MTPA), field weakening, maximum torque per voltage, and unity power factor [34]. The control mode selection is based on the PMSM type and operating speed. Below the base speed, the MTPA control is utilized to generate the maximum torque for a given current in order to minimize the copper losses [35,36]. The excitation angle in MTPA region () is expressed in (3). PMSM control in MTPA region is used in this work. Here, the excitation angle (), to get the optimum currents, for a given torque is found.
PMSM control in MTPA region is used in this work. Here, the excitation angle (), to get the optimum currents, for a given torque is found.
2.2.2. Direct Torque Control
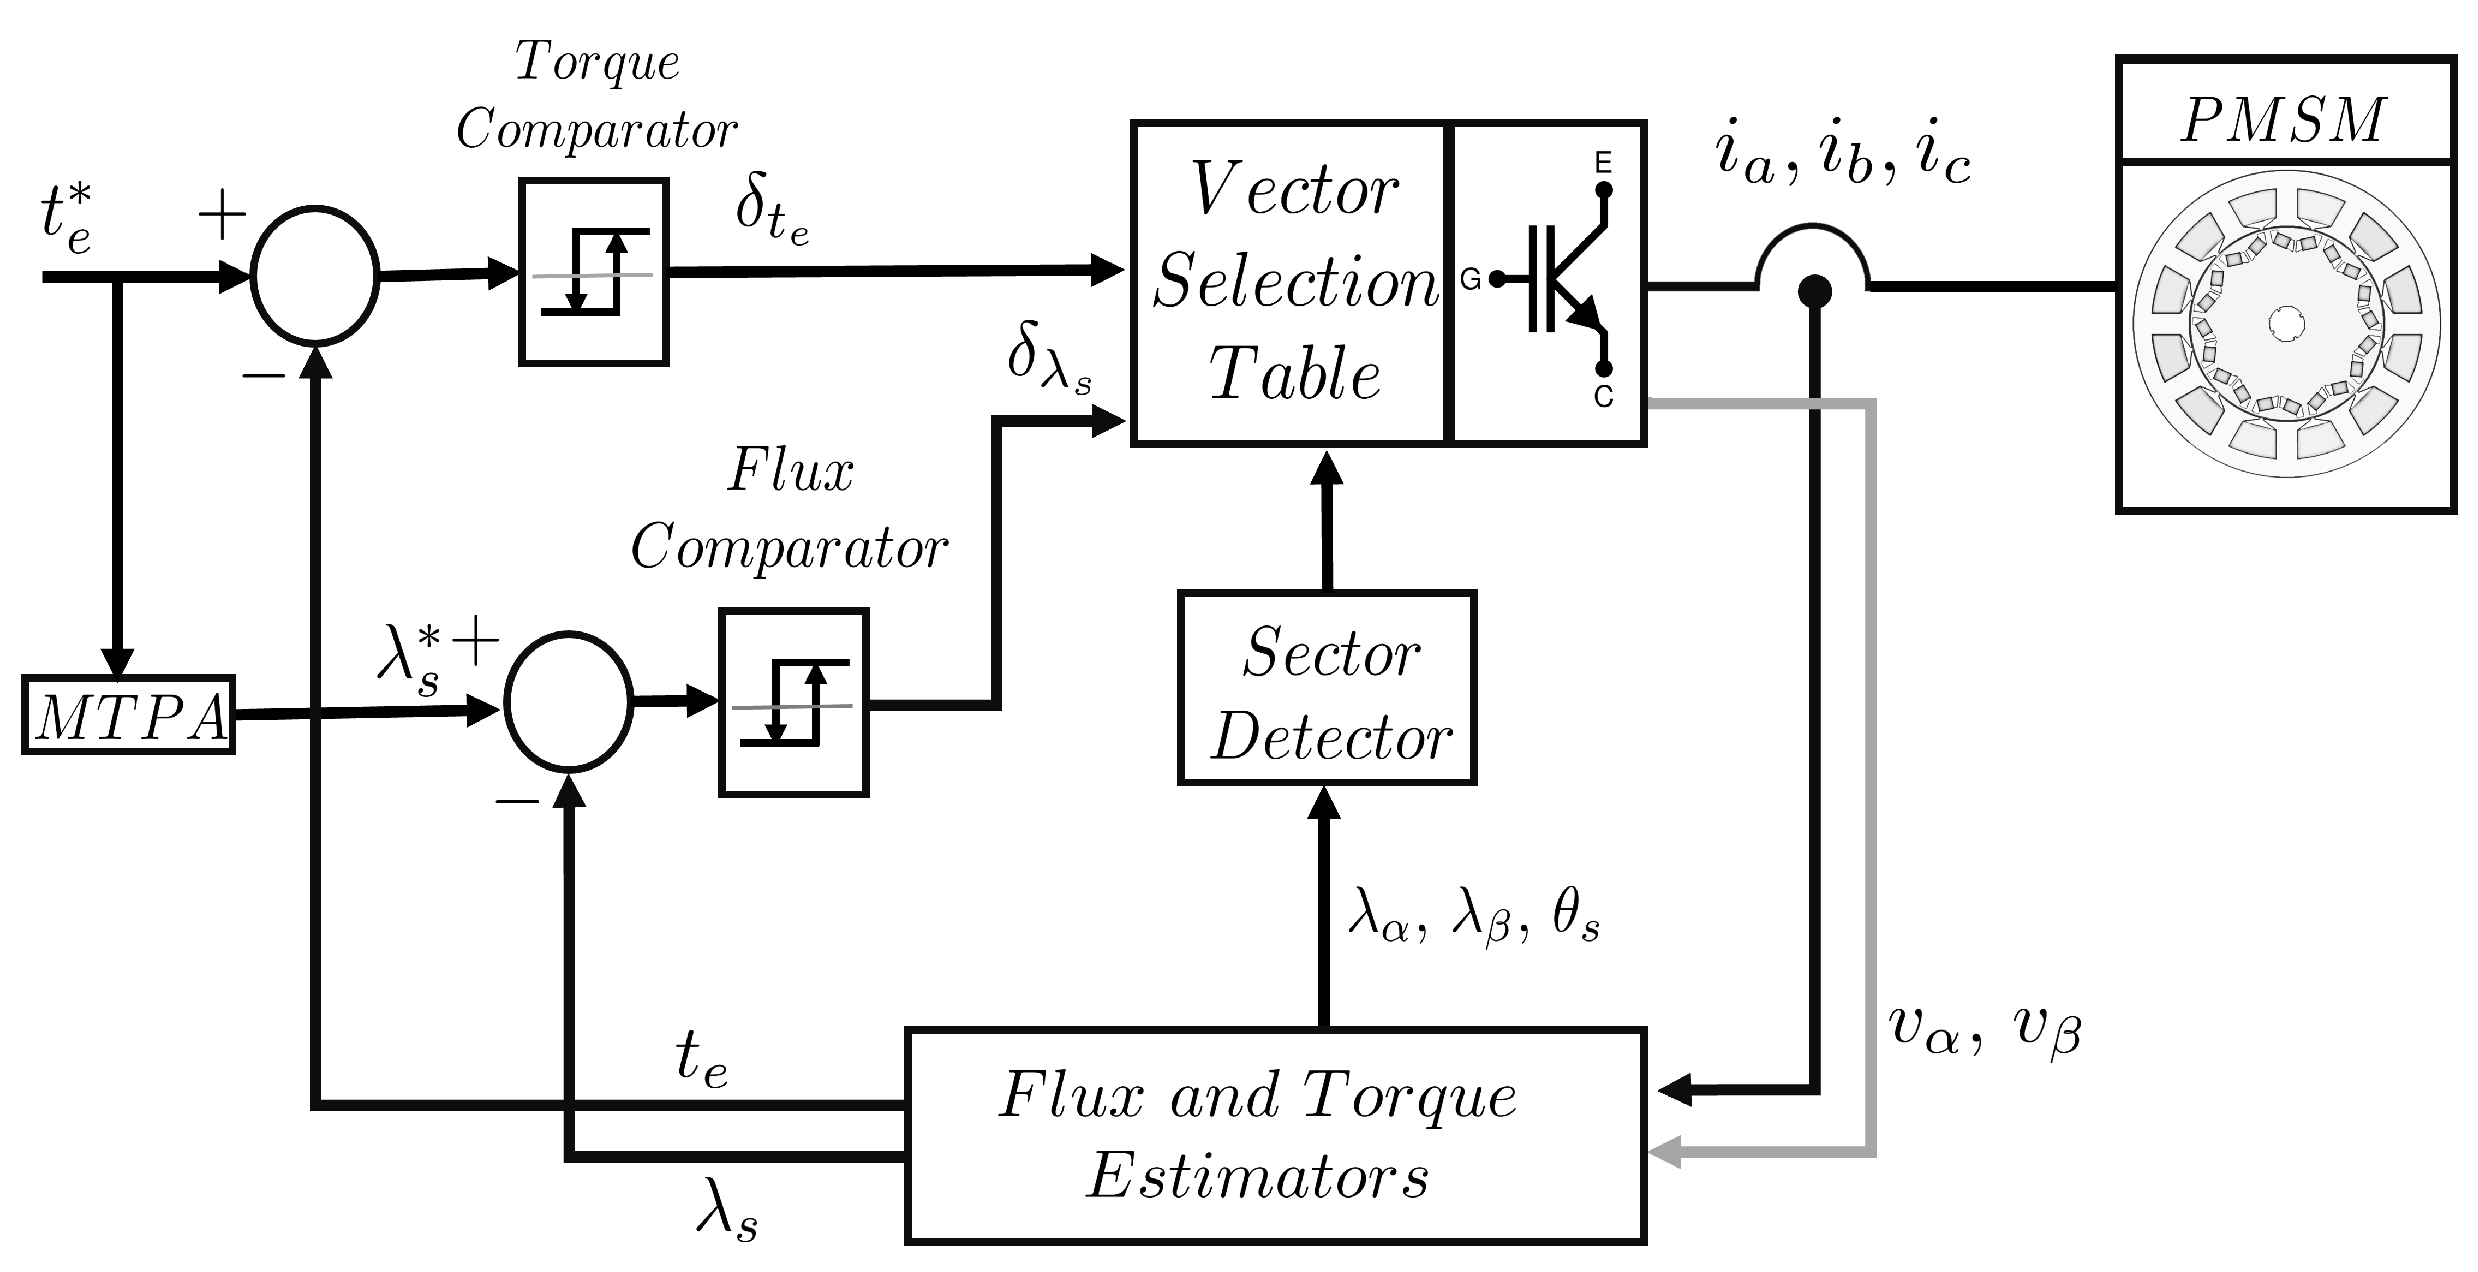
The nonlinear form of DTC drive, which employs hysteresis comparators, was first presented for PMSMs in [37]. Figure 2 depicts the basic block diagram utilized for DTC implementation where and are the outputs of hysteresis comparators.
The amplitude of the torque output () and the stator flux linkage () are both adjusted by using two hysteresis comparators. Thus, the feedback loop needs flux and torque estimates. These estimates are typically computed in the stationary frame, as explained in (4) and (5), to obviate the requirement for a position sensor.
where and are the currents in the stationary frame. is the stator phase resistance. and represent the initial flux linkage estimates based on the frame alignment. The voltages and in stationary frame are calculated as in (6) where () are the switching signals to the inverter legs and () is the bus link voltage.
2.3. Supervised Classification
The method of developing a prediction model using specified data input is known as supervised machine learning [38]. A class may be anticipated for a sample that has not yet been classified using this data-driven method. Three classification methods are utilized in this paper: LDA, k-nearest neighbor (k-NN), and support vector machines (SVM).
The training data in LDA are assumed to have a normal distribution with a fixed class-independent covariance matrix. The decision border partitioning classes in a two-indicator situation is linear using LDA. Nevertheless, this discriminant technique is highly biased if the assumption of normal data distribution is violated [39]. Here, the dataset is split to (K) classes, with every class containing a number of samples belonging to the same class. Each class is associated with weighting factors that are used to determine the discriminant function for that class. The discriminant function () for kth class is calculated as following:
where is the N dimensional observation vector and is the matrix of weighting elements of the group. A sample will be placed in a given class if and only if its discriminant function is greater than those of other classes. For example, an unidentified sample will be assigned to a class b if
Both k-NN and SVM may be used to eliminate the reliance on the assumption of normal data distribution, but their classification capability is proportional to the amount of training data provided. An assessment of k-NN and SVM classifiers is carried out in [40] for the purpose of identifying bearing and uneven shaft rotation failures in directly line connected induction motors. The k-NN method classifies an unidentified sample according to the majority vote of its closest neighbors. Its performance is determined by the distance measure being used to locate the neighbors and the number of these neighbors. The Euclidean distance measure and the closest four neighbors demonstrate the highest level of classification accuracy for this work when employing k-NN. The Euclidean distance is given by:
where is the tested samples vector, is the vector of training data, is the sample counter for unidentified samples and is the sample counter for labeled samples.
Another type of supervised machine learning is SVM, which is notable for its resistance to any bias or noise in the training sample space [41]. The aim of the SVM classification model is to generate the optimal hyperplane using support vectors that results in the best discrimination between two distinct data sets. Support vectors are the outlying samples closest to the discrimination boundary. The optimal hyperplane obtained by SVM is used to classify an unidentified sample by measuring the perpendicular distance between the sample and the hyperplane. SVM training will be a constrained optimization problem in which the weighting vector is minimized so that every sample satisfies the following criteria:
where is the vector containing each class weight and is a threshold setpoint for classifier modeling. SVM incorporates kernel functions if the data classification cannot be achieved linearly in the original dimensional space of the training data. As a consequence, SVM turns the training data into higher-dimensional spaces where it may be separated linearly. It is possible that the SVM classification model might be modified to handle situations involving more than one class by pitting one class against all of the other classes or by pitting one class against another class at a time. The latter method is the one that is used to investigate the various fault classes in this research.
One way to evaluate the effectiveness of the abovementioned classifiers is by using the leave-one-out method, in which a selected sample from the training dataset is removed and thereafter treated as an unidentified sample to be predicted. This procedure is repeated until all samples in all classes have been processed. The classifier accuracy is then evaluated as follows:
where represents classifier accuracy and represents the number of properly labeled samples out of the total samples count in the training pool .
3. Finite Element Analysis Simulations
Coupling the finite element model (FEM) of an electric machine with a control circuit demonstrates the capability of simulating the machine harmonics due to the slotting, saturation, and switching frequency. Such a model would allow the efficient representation of the PMSM, considering the aforementioned faults, at different operating states. Besides that, this high-fidelity simulation would allow the maintenance and reliability engineers to study the extreme fault severities on the machine without destructive or dangerous experimentation. PMSM modeling, control, and fault implementation are discussed in this section. FOC- and DTC-driven PMSM are assessed in both healthy and faulty situations by integrating the control circuit of FOC or DTC in SIMPLORER simulator with the FEM model of the studied PMSM in MAXWELL simulator within the ANSYS software. Four faulty situations are considered: TTSC, HRC, static eccentricity, and local demagnetization.
3.1. Healthy Machine Modeling and Control
To develop a fault diagnosis approach, it is necessary to model the PMSM in the healthy case and use the obtained measurement as a reference in case of fault occurs. Any deviation from the processed healthy data could be considered as fault symptoms. In order to implement the aforementioned faults in the FEM of the studied PMSM, geometric and electrical modifications should be made. Table 1 lists the main electric and geometrical parameters of the investigated PMSM.
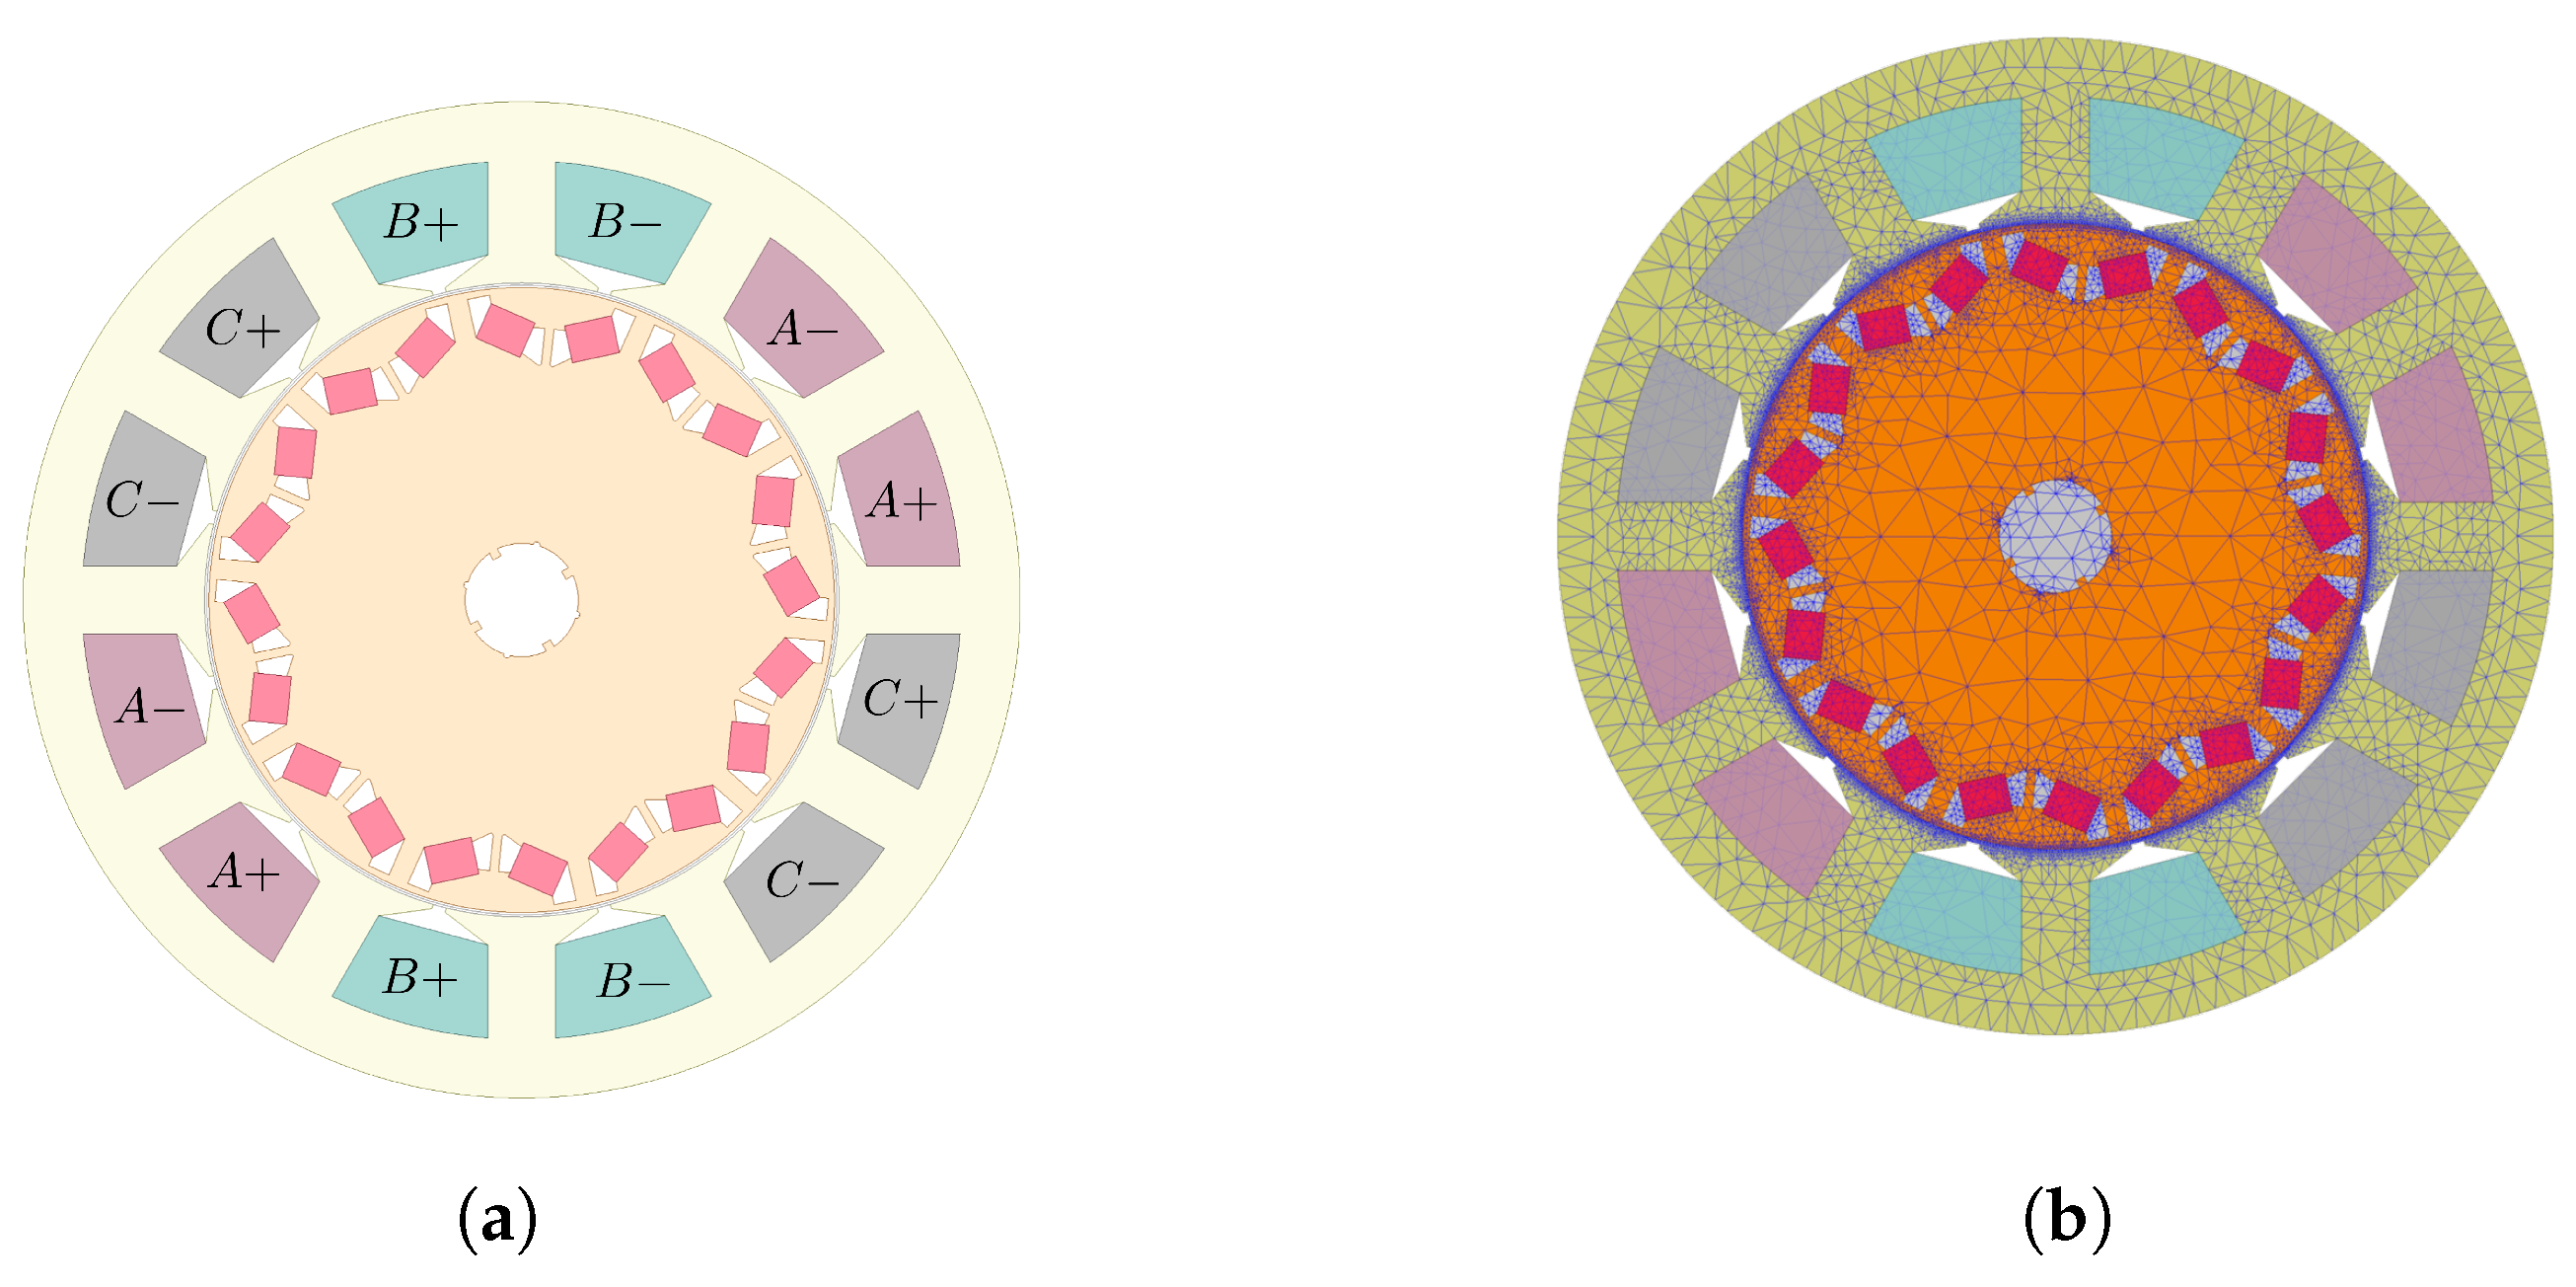
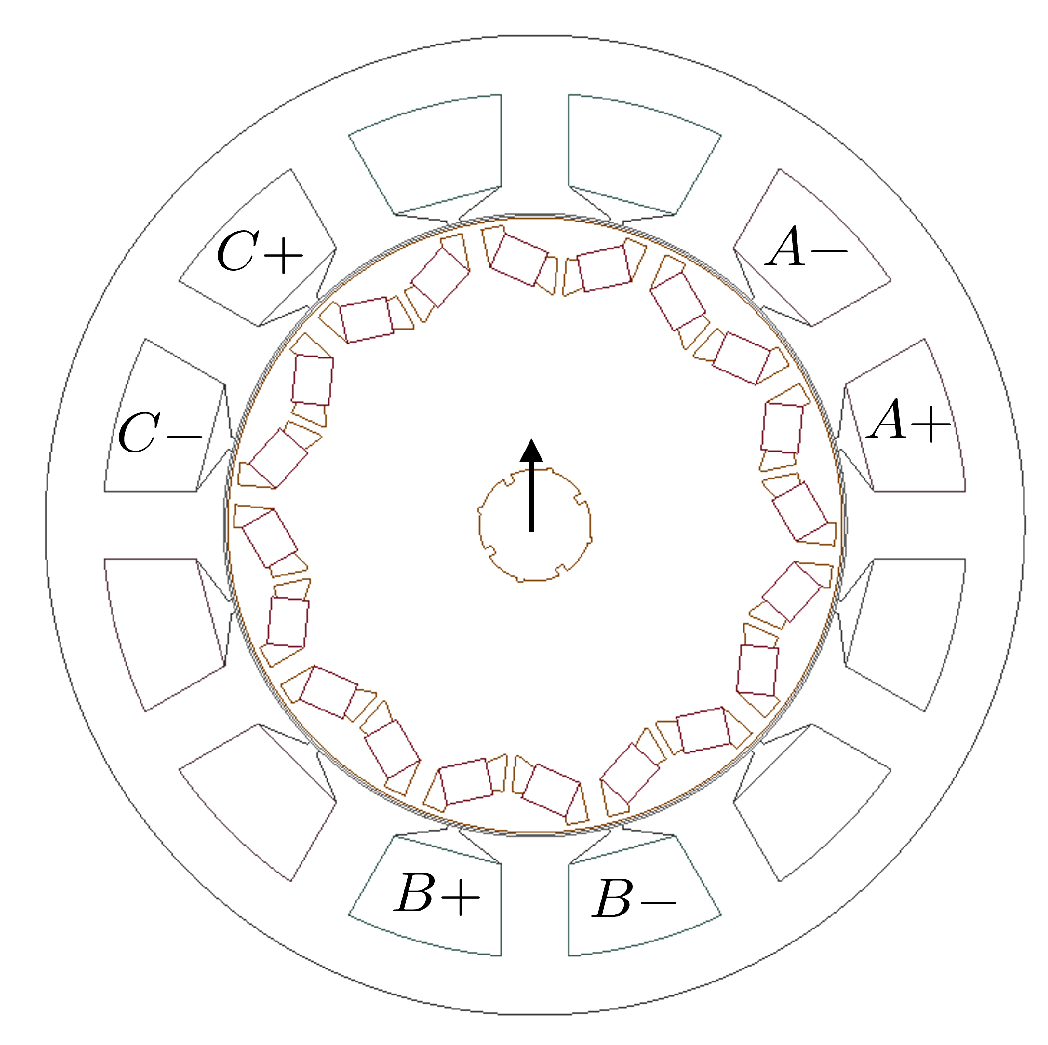
The FEM of the simulated PMSM in ANSYS MAXWELL software is depicted in Figure 3. It could be observed that the machine winding of each phase are wound around one slot. This winding configuration is referred as concentrated winding machine where the winding are physically isolated and, therefore, the mutual inductance is negligible.
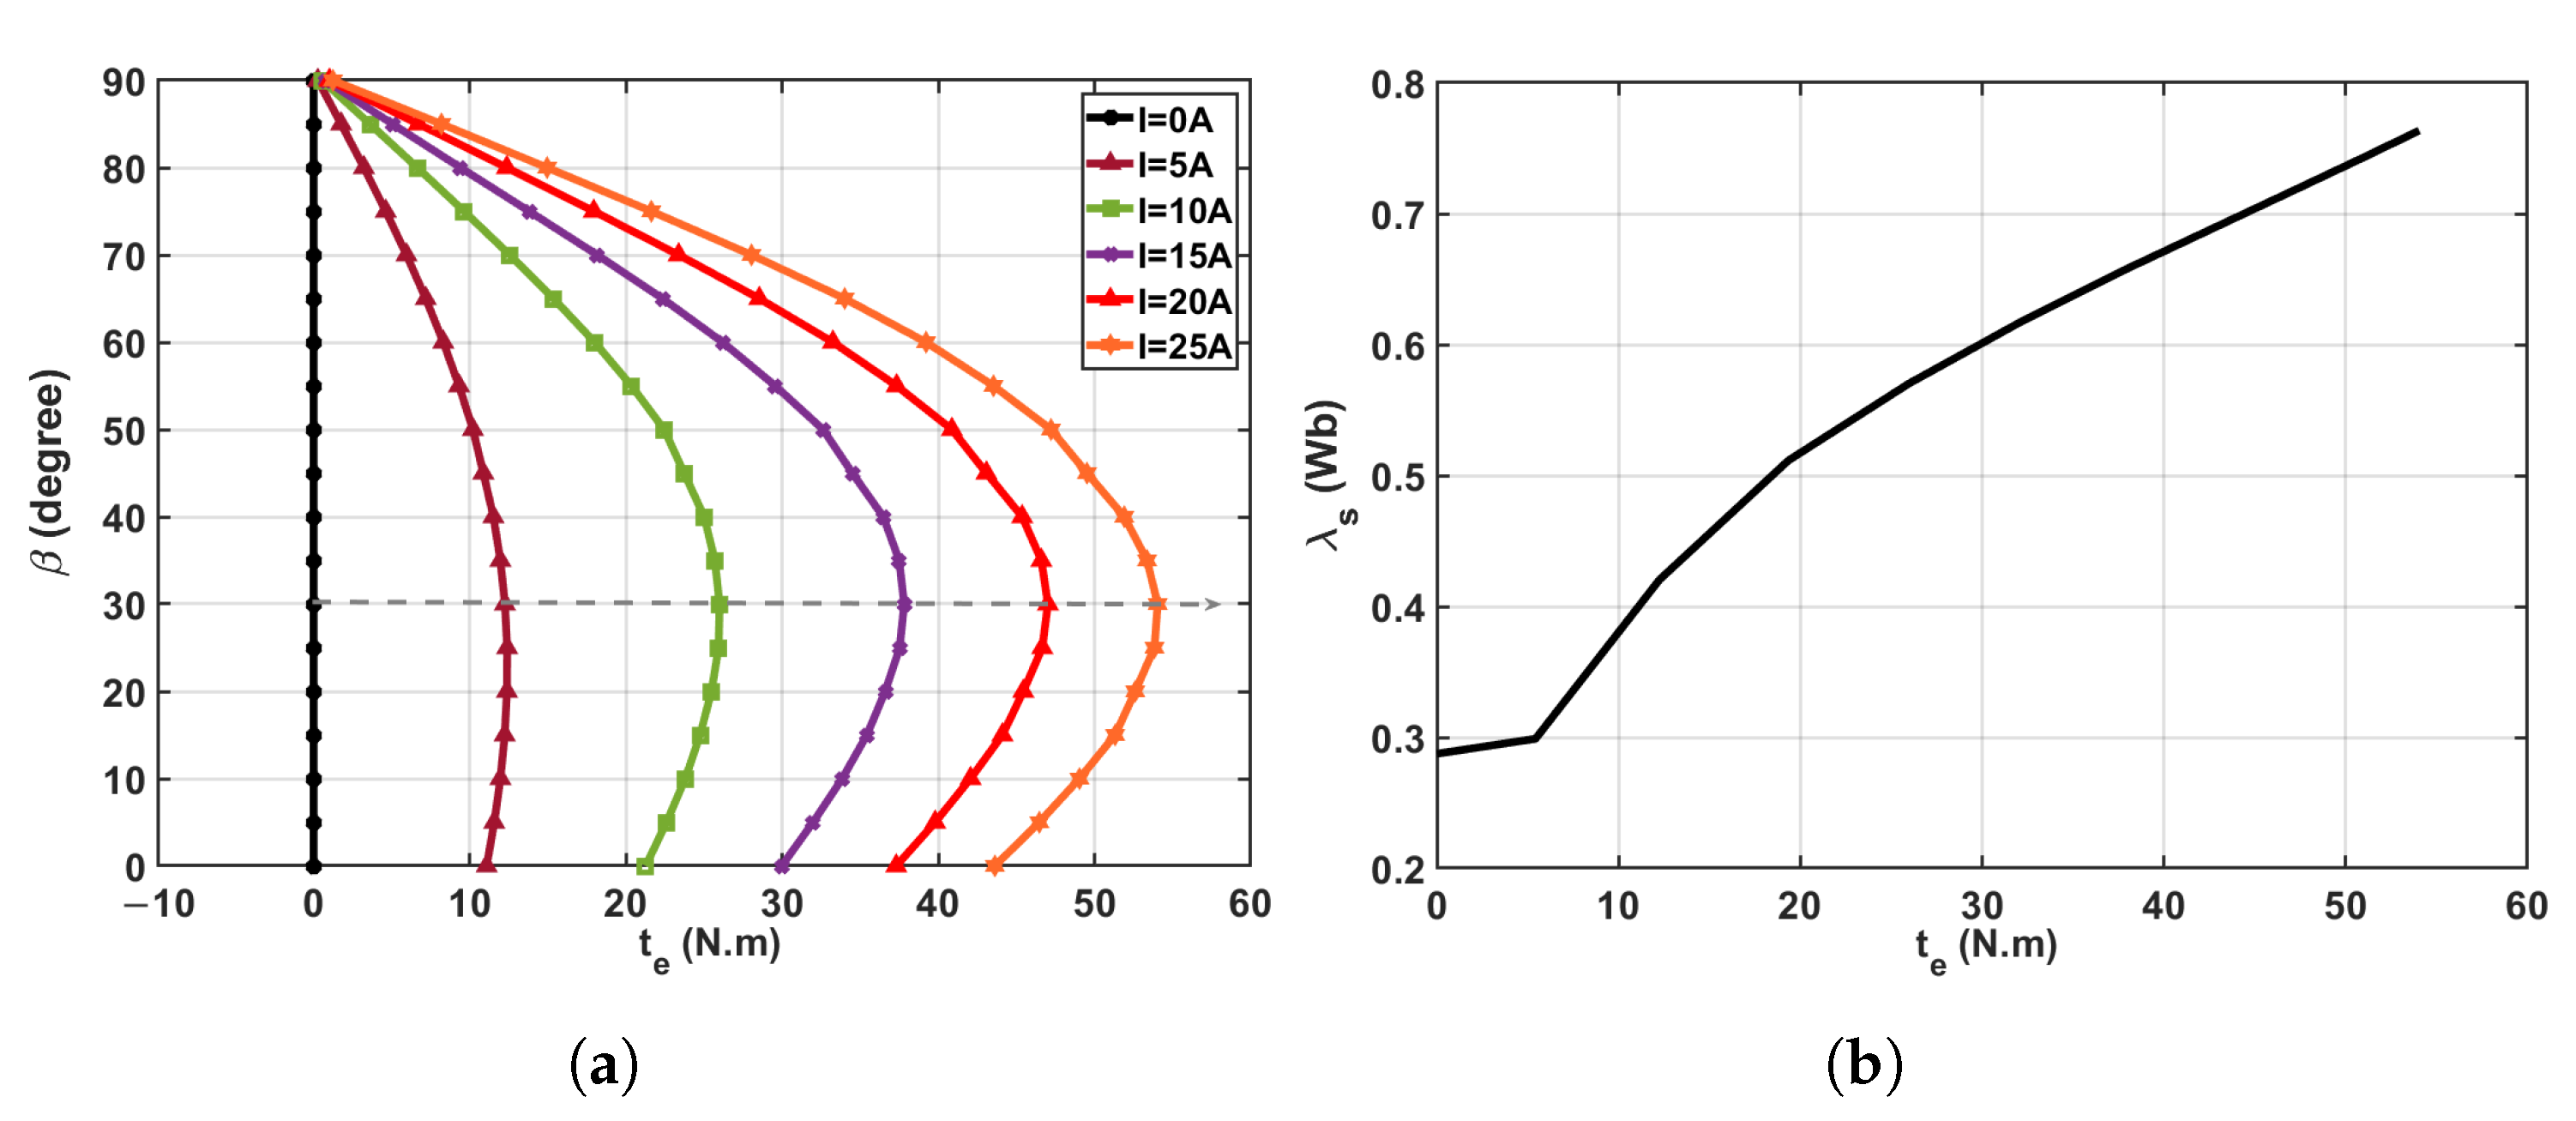
The MTPA profile was first obtained by characterizing the PMSM using the approach described in [35]. Figure 4a depicts the MTPA profile for various operating currents. For FOC-driven PMSM, it can be noticed that the excitation angle should be to get the MTPA operation below the rated speed. For DTC, the stator flux linkage () was changed in step of 0.25 Wb from the permanent magnet flux linkage to the rated one at different operating torque levels. A look-up table stores the stator flux linkage that yields the minimal current for different torque levels. Figure 4b shows the machine MTPA profile for the operating torque range.
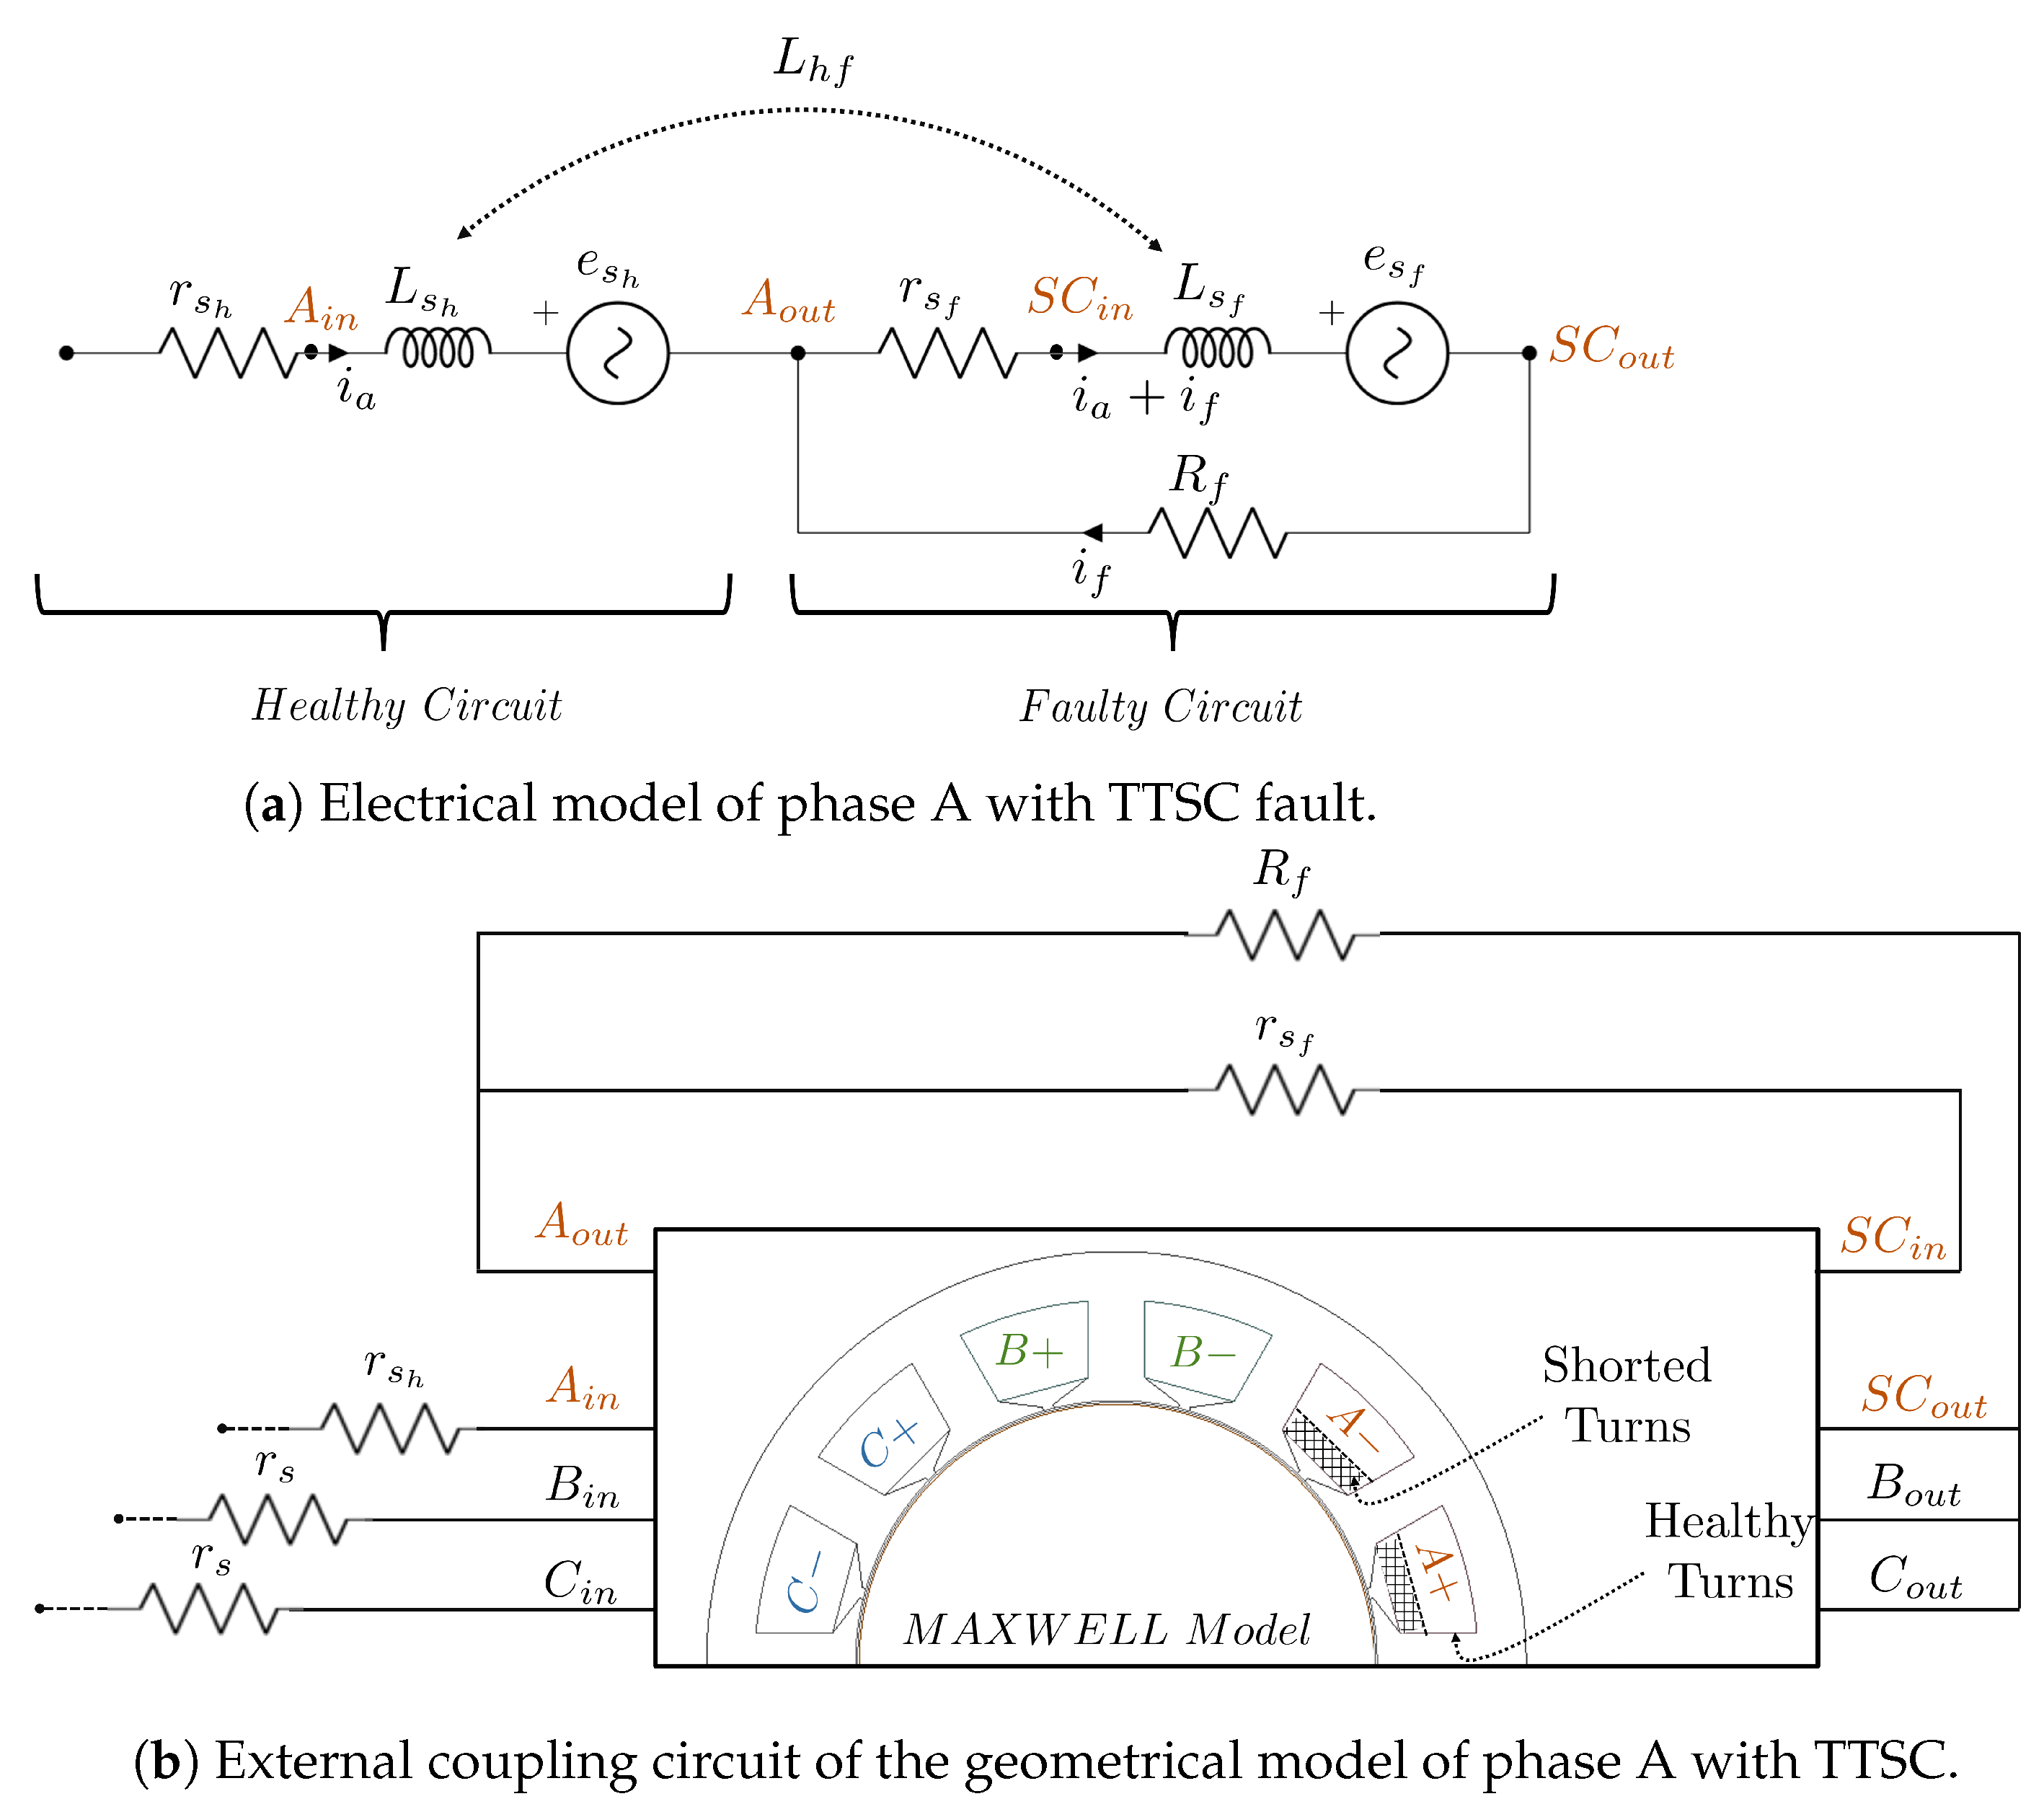
3.2. Turn-to-Turn Short Circuit Fault Implementation
The implementation of TTSC fault requires modification to the geometrical model in MAXWELL by dividing the coil region into two: (1) a region reflecting the healthy turns and (2) one proportional to the faulty turns. Figure 5 depicts the PMSM model as well as the phase A circuit with a TTSC fault, assuming that phase A is the one that is faulty. After splitting the coil region of the faulty phase in MAXWELL, additional terminals appear in the PMSM model in SIMPLORER to provide access to the shorted turns, as shown in Figure 5b. Consequently, the electric circuit in SIMPLORER has been modified by inserting a short circuit path with fault resistance () over the shorted turns of the faulted phase.
Where , , and are the resistance, inductance, and back-EMF of the healthy turns. , , and are the resistance, inductance, and back-EMF of the shorted turns. is the mutual inductance between healthy and faulty turns of the faulted phase. is the fault circulating current in the short circuit path between the healthy and faulted turns. Early detection of an incipient TTSC fault enables better treatment and prevents total machine failure. The worst-case scenario for a TTSC fault is a bold short circuit with almost zero fault resistance while an incipient short circuit fault is represented with higher fault resistances [42]. As indicated in Table 2, different severities of incipient TTSC fault are examined by adjusting the faulted turns and the resistance shorting them . The fault resistance is selected high, in this work, to mimic incipient stages of TTSC fault.
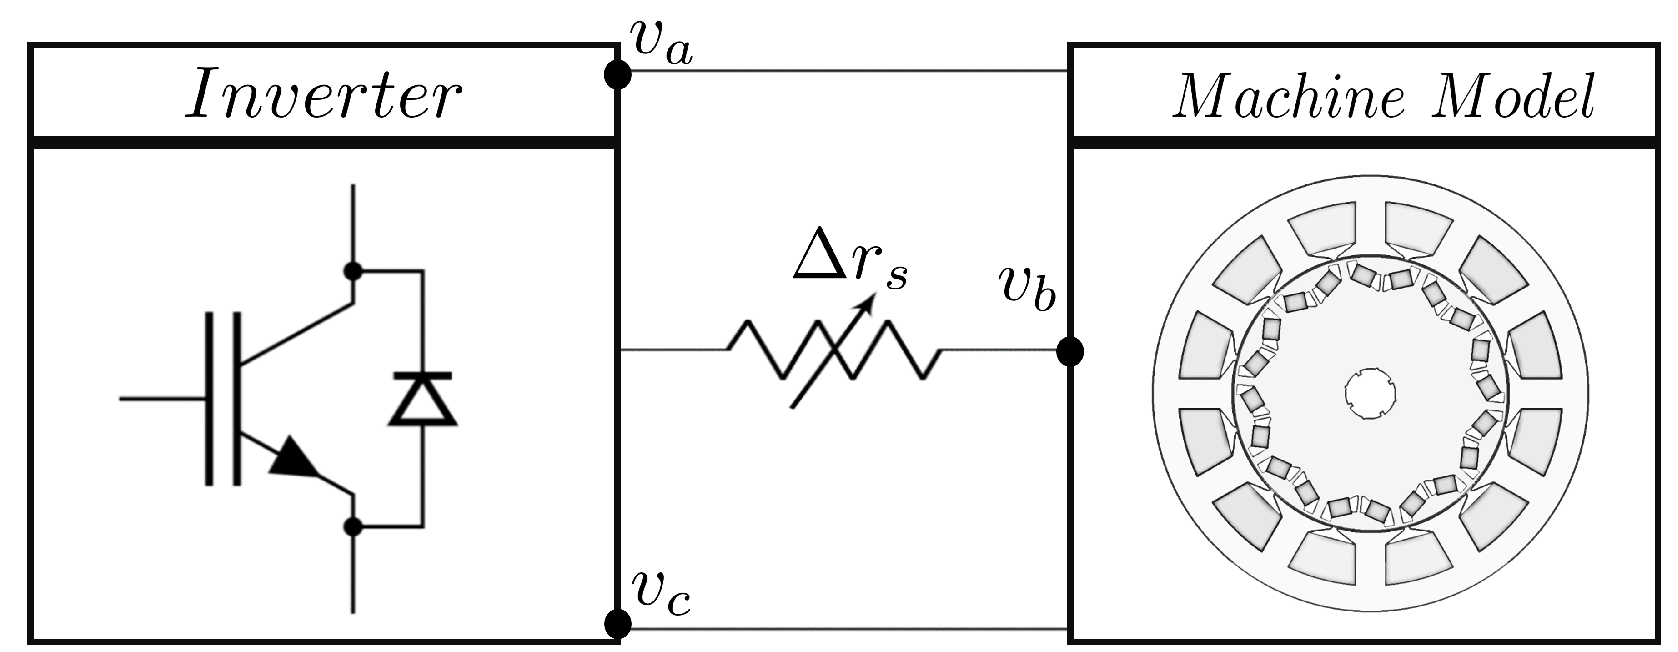
3.3. High Resistance Contact Fault Implementation
The implementation of the HRC fault involves simply a change to the SIMPLORER circuit in which the affected phase circuit is linked in series with an adjustable fault resistance () proportional to the fault severity. The extreme case of HRC fault is when a relatively large fault resistance is used with the faulted phase circuit. This situation is considered as an open phase fault. Figure 6 depicts the HRC fault implementation in phase B circuit of the faulted driven PMSM.
Three different fault severity levels of HRC are analyzed as given in Table 3, all based on the assumption that the fault occurred in the phase B circuit.
3.4. Static Eccentricity Fault Implementation
The machine is considered healthy if the stator and rotor geometrical centers are concentric with the rotational axis. If the rotor center and rotational axis are shifted from the stator center by a constant value, the machine is considered faulty with static eccentricity. The coordinate center of the stator remains unchanged while the rotor and its axis of rotation move in the direction of the fault as shown in Figure 7.
The fault is simulated along the positive Y-axis by modifying the shift () value, taking the three severities shown in Table 4 into account. Since the eccentricity fault is inherently available during the manufacturing process, the machine is considered healthy if the severity level of static eccentricity is below than 10%.
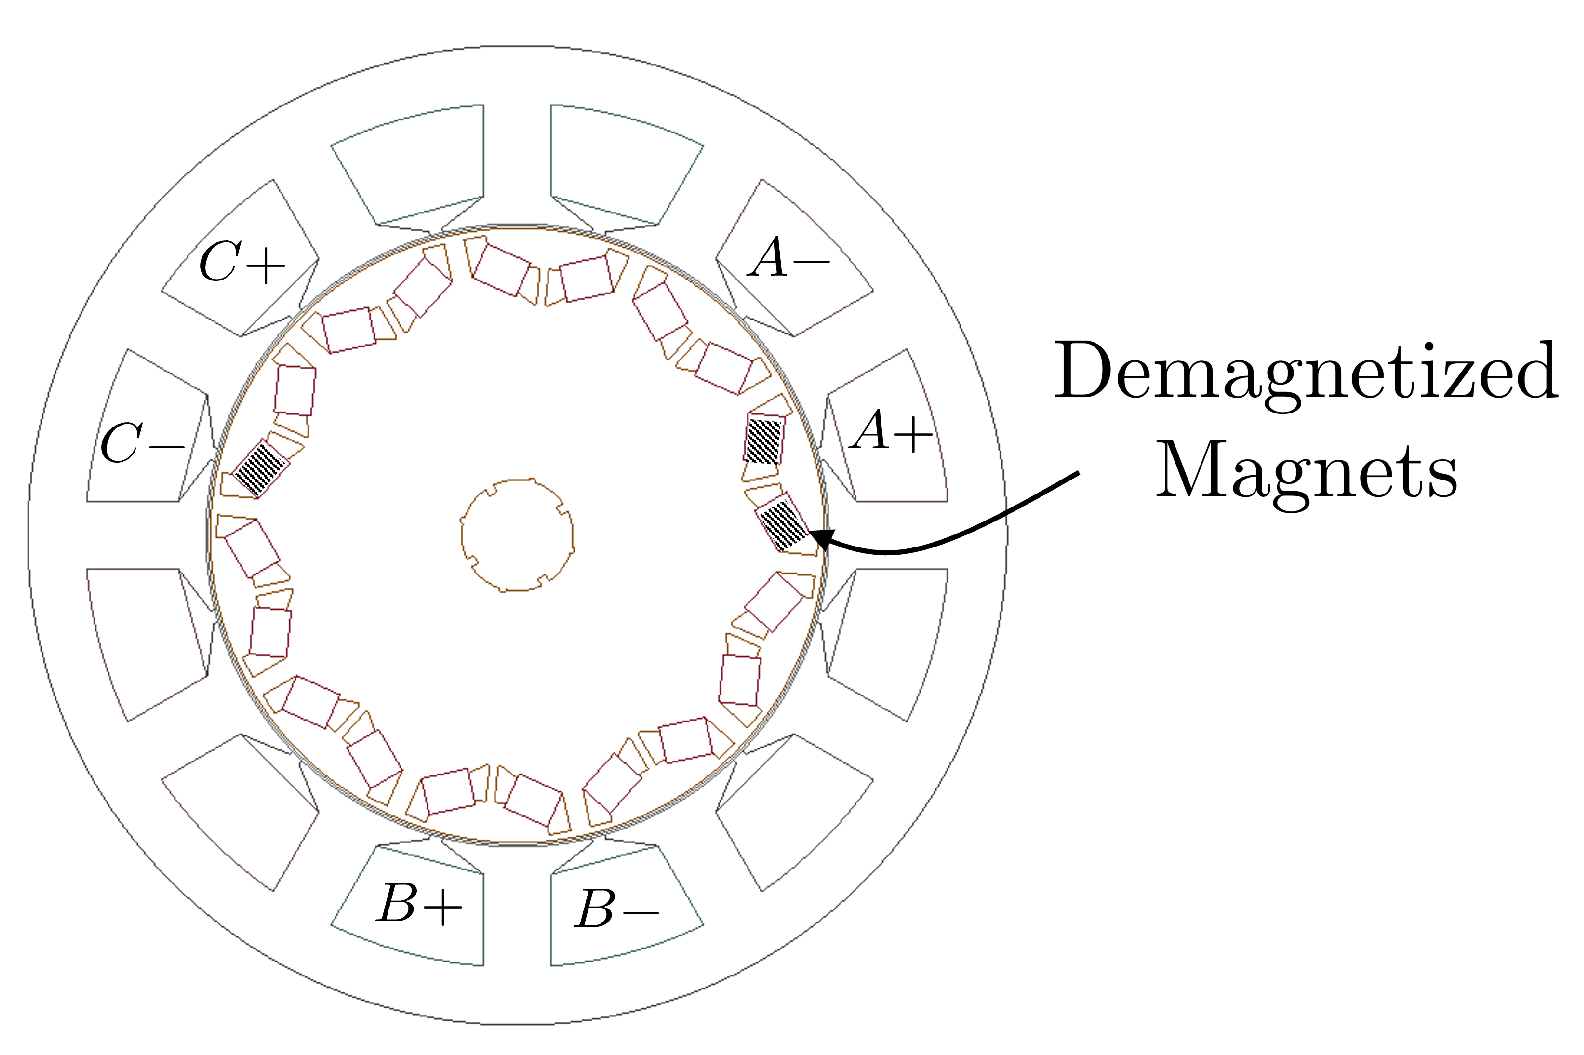
3.5. Local Demagnetization Fault Implementation
The demagnetization fault is applied in FEM by lowering the density of the remnant flux in the affected magnets. This could be uniform demagnetization in all magnets or locally in some magnets. Three magnets have their top corners (near to the air gap) replaced with an identical material with flux density reduced to 1 T. This is the most prevalent case for demagnetization failures in PMSM. Figure 8 shows the affected magnets by demagnetization fault.
Changes in the number of demagnetized magnets in the modeled machine provide different fault severities, as shown in Table 5. The local demagnetization fault is considered in this study as some magnets get demagnetized in the machine model.
4. Numerical Results
4.1. Analysis in FOC-Driven PMSM
The spectral domain of the commanded phase A voltage is obtained using FFT for different machine health conditions. The sampling period is set to 400 s. The fundamental, 5th, and 7th harmonics are used here to show the fault effect on the voltage spectrum at different severity levels. For FOC, the results are shown for the considered PMSM when it is loaded with ( A). The machine is running at 600 rpm; therefore, the electrical frequency of the machine is (50 Hz). Figure 9 shows the commanded voltage of phase A in FOC drive for the healthy case.
The stator voltage spectrum is shown in Figure 10 for healthy and faulty machine under different severity levels of TTSC fault.
It could be observed that the magnitude of the fundamental, 5th, and 7th harmonics in the voltage spectrum is reduced when TTSC fault is present and becomes more severe. The magnitude changes in the spectrum are significant to distinguish between the healthy case and TTSC fault. Besides that, it has been noticed that there is an increase in the 2nd harmonic when TTSC is present. However, this analysis will show the fault effect on the fundamental, 5th, and 7th harmonics in the voltage spectrum. Nevertheless, the first eight harmonics will be used as features for diagnosis, as will be described in the following section.
The stator voltage spectrum is shown in Figure 11 for healthy and faulty machine under different severity levels of HRC fault.
It could be observed that the magnitude of the fundamental harmonic in the voltage spectrum is increasing significantly when HRC fault is present and become more severe. On the other hand, the magnitude of the 5th and 7th harmonics is reduced, but these magnitude changes might be too small to distinguish between the healthy case and the HRC fault. However, the considered severity levels of HRC are relatively low, and this would justify the insignificant changes in the magnitude of the 5th and 7th harmonics. Nevertheless, these changes would be higher once the fault was present at a higher severity level.
The stator voltage spectrum is shown in Figure 12 for healthy and faulty machine under different severity levels of eccentricity fault.
It could be observed that the magnitudes of the fundamental and seventh harmonics in the voltage spectrum are increasing when the eccentricity fault is present and becoming more severe, while the magnitude of the fifth harmonic is significantly reduced. These magnitude changes are significant to distinguish between the healthy case and eccentricity fault. Besides that, these magnitude changes due to eccentricity faults are different from those for TTSC and HRC faults. This would help in fault classification later on.
The stator voltage spectrum is shown in Figure 13 for healthy and faulty machine under different severity levels of demagnetization fault.
It could be observed that the magnitude of the fundamental and 5th harmonics in the voltage spectrum is increasing when demagnetization fault is present and becoming more severe, while the magnitude of the 7th harmonic is reduced. These magnitude changes could be used to distinguish between the healthy case and demagnetization fault. It is worth mentioning that the considered severity levels of demagnetization fault are relatively low as the outer corners of selected magnets get demagnetized only from T to 1 T. Besides that, the trend in magnitude change of the fundamental harmonic due to demagnetization fault is similar to the trend due to HRC and eccentricity faults, while it is the opposite in case of the 5th harmonic. This would help the classifier in discriminating between these three faults, for instance.
4.2. Analysis in DTC-Driven PMSM
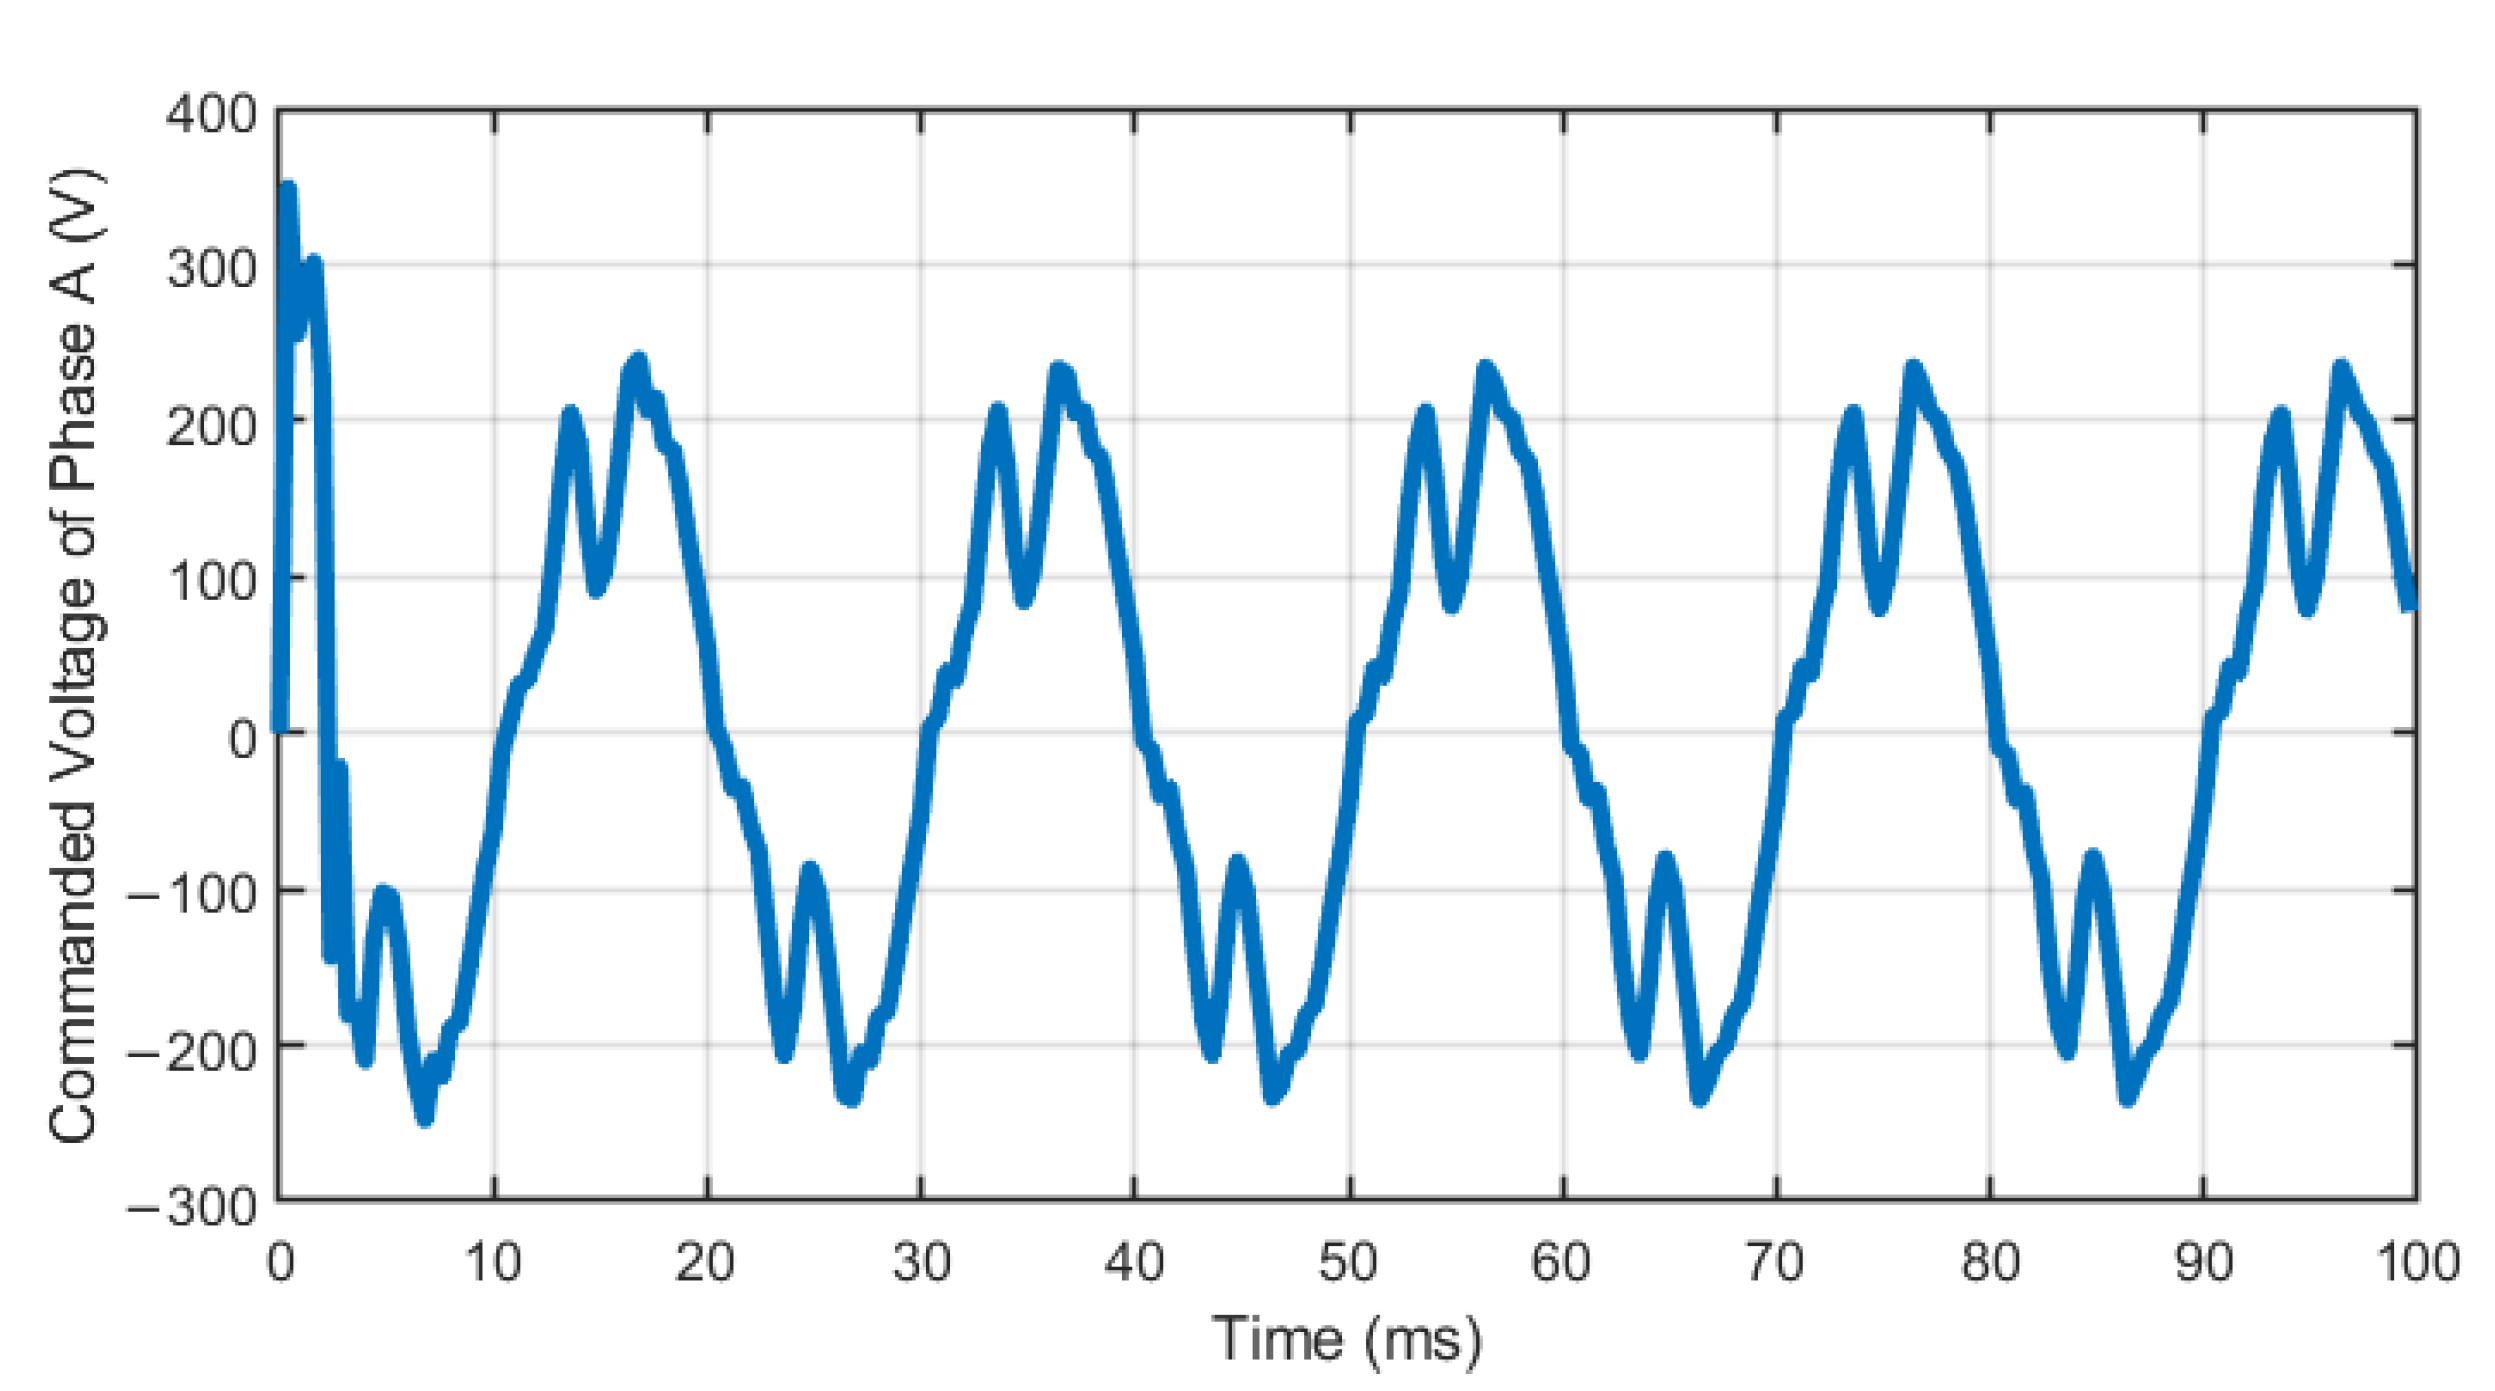
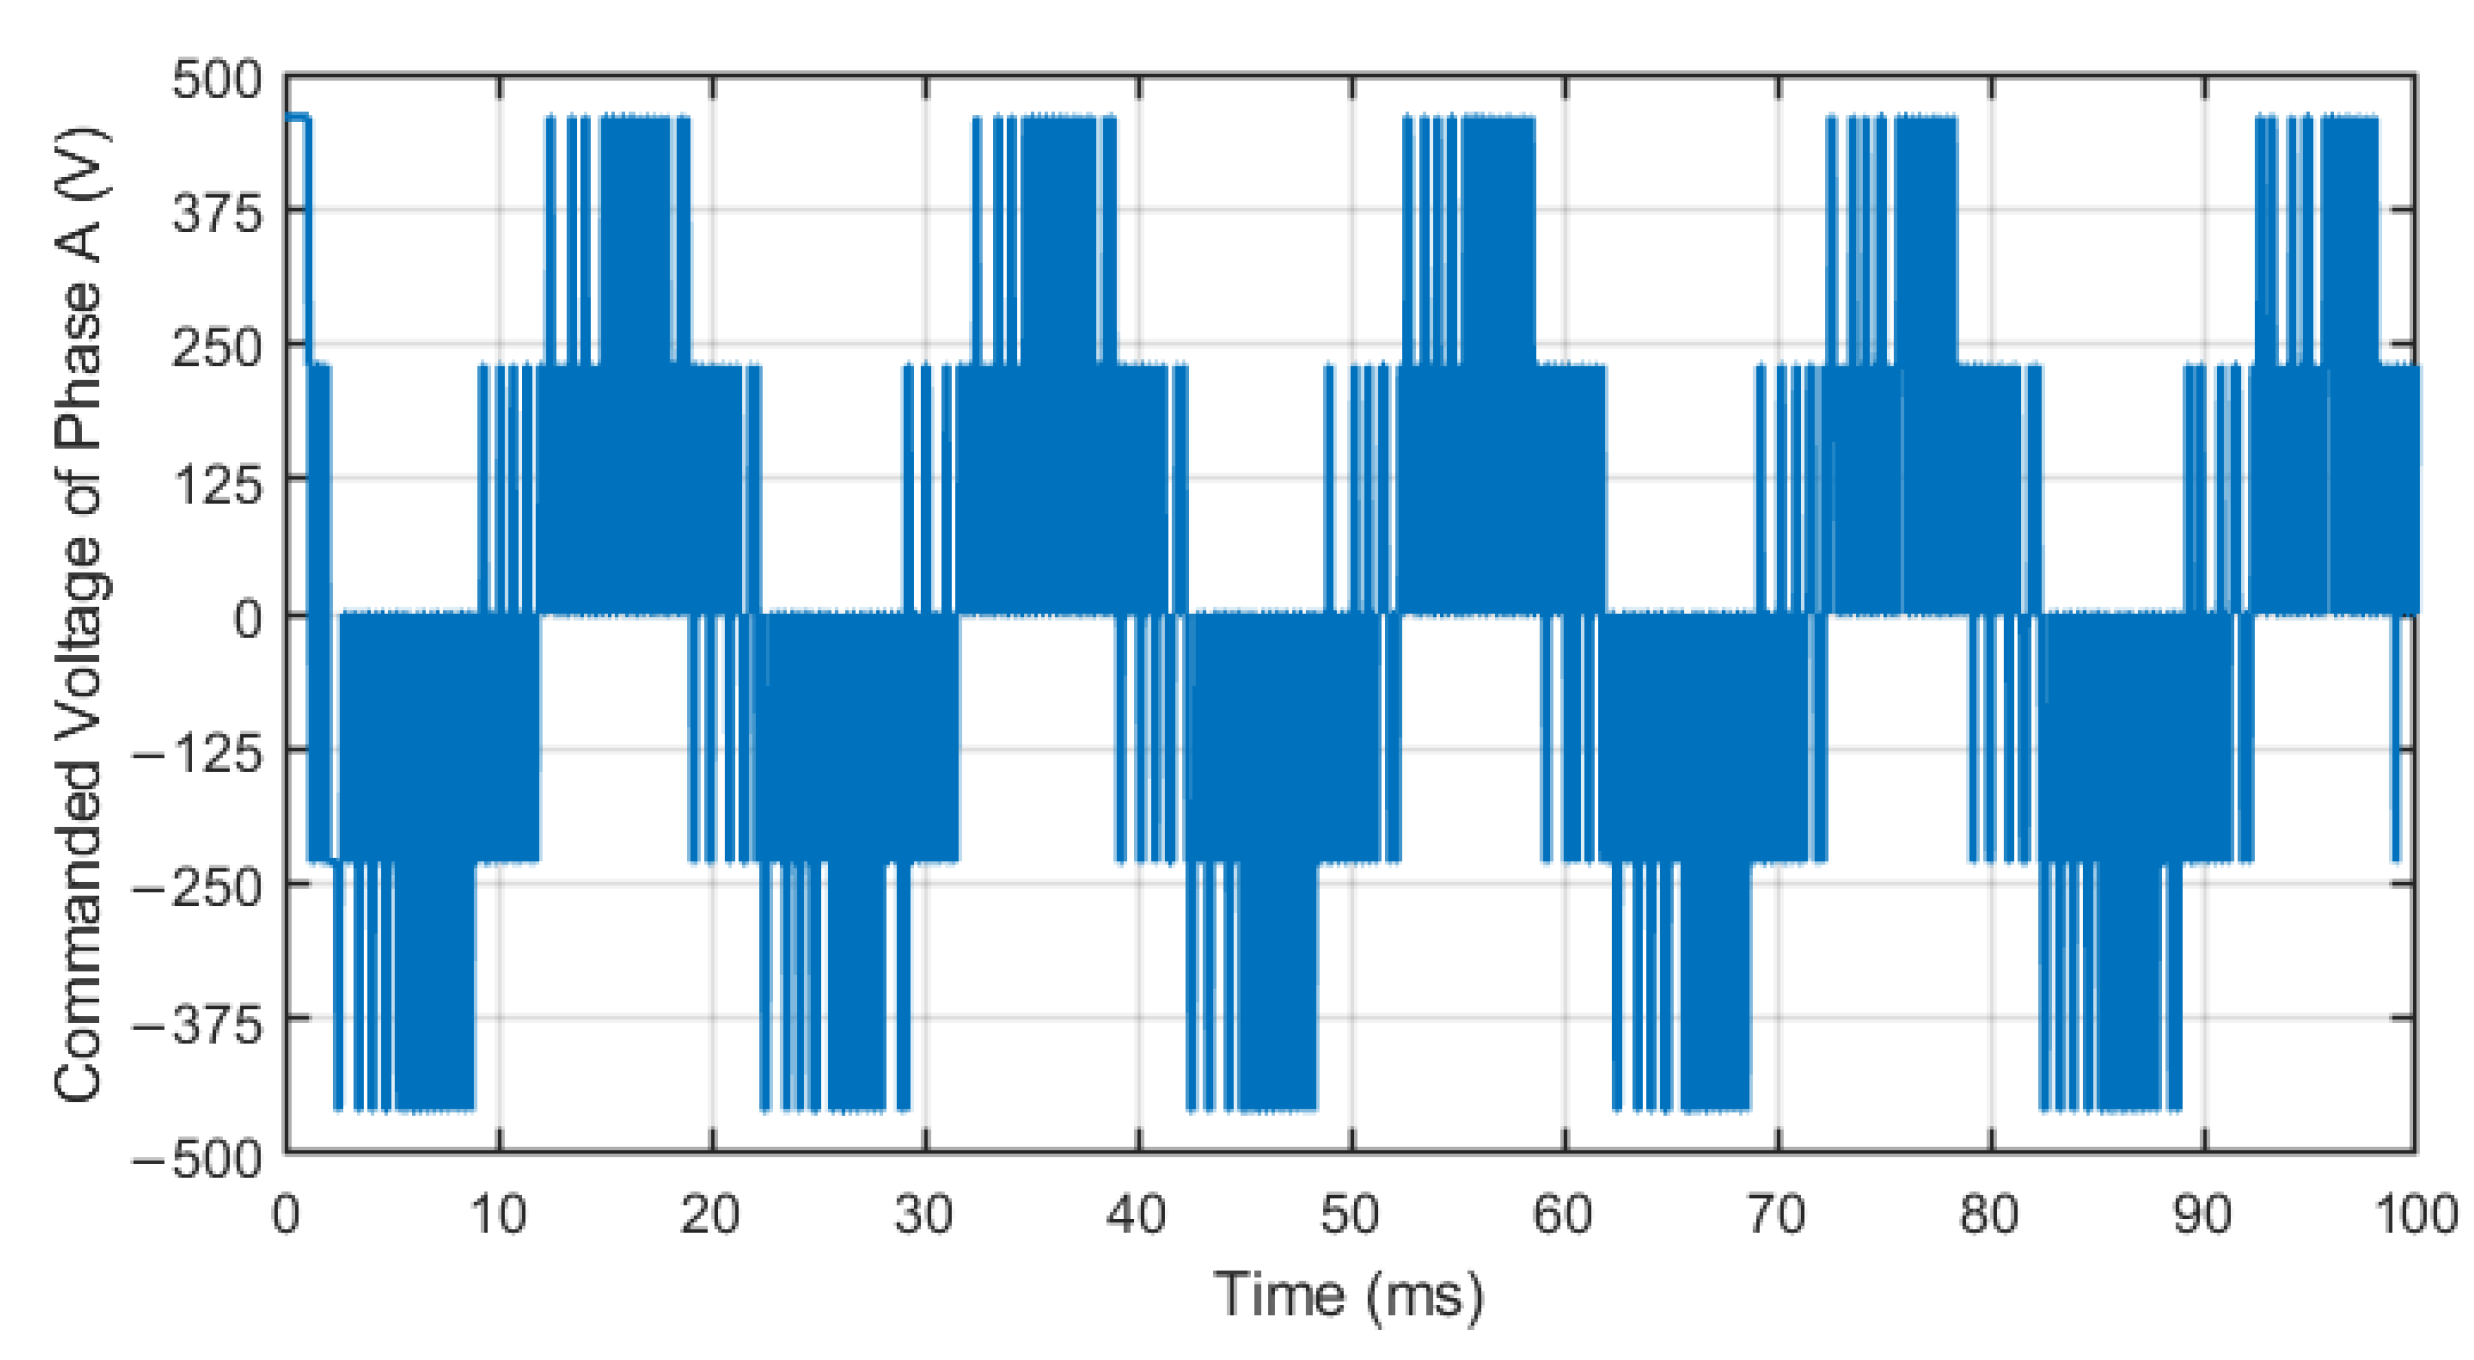
The spectral domain of the commanded phase A voltage is obtained using FFT for different machine health conditions under DTC drive. The sampling period is set to 100 s; DTC requires a high sampling frequency to function properly. The fundamental, 5th, and 7th harmonics are also used here to show the fault effect on the voltage spectrum at different severity levels. For DTC, the results are shown for the considered PMSM when it is loaded with ( N·m). The machine is running at 600 rpm; therefore, the electrical frequency of the machine is (50 Hz). Figure 14 shows the commanded voltage of phase A in DTC drive for the healthy case.
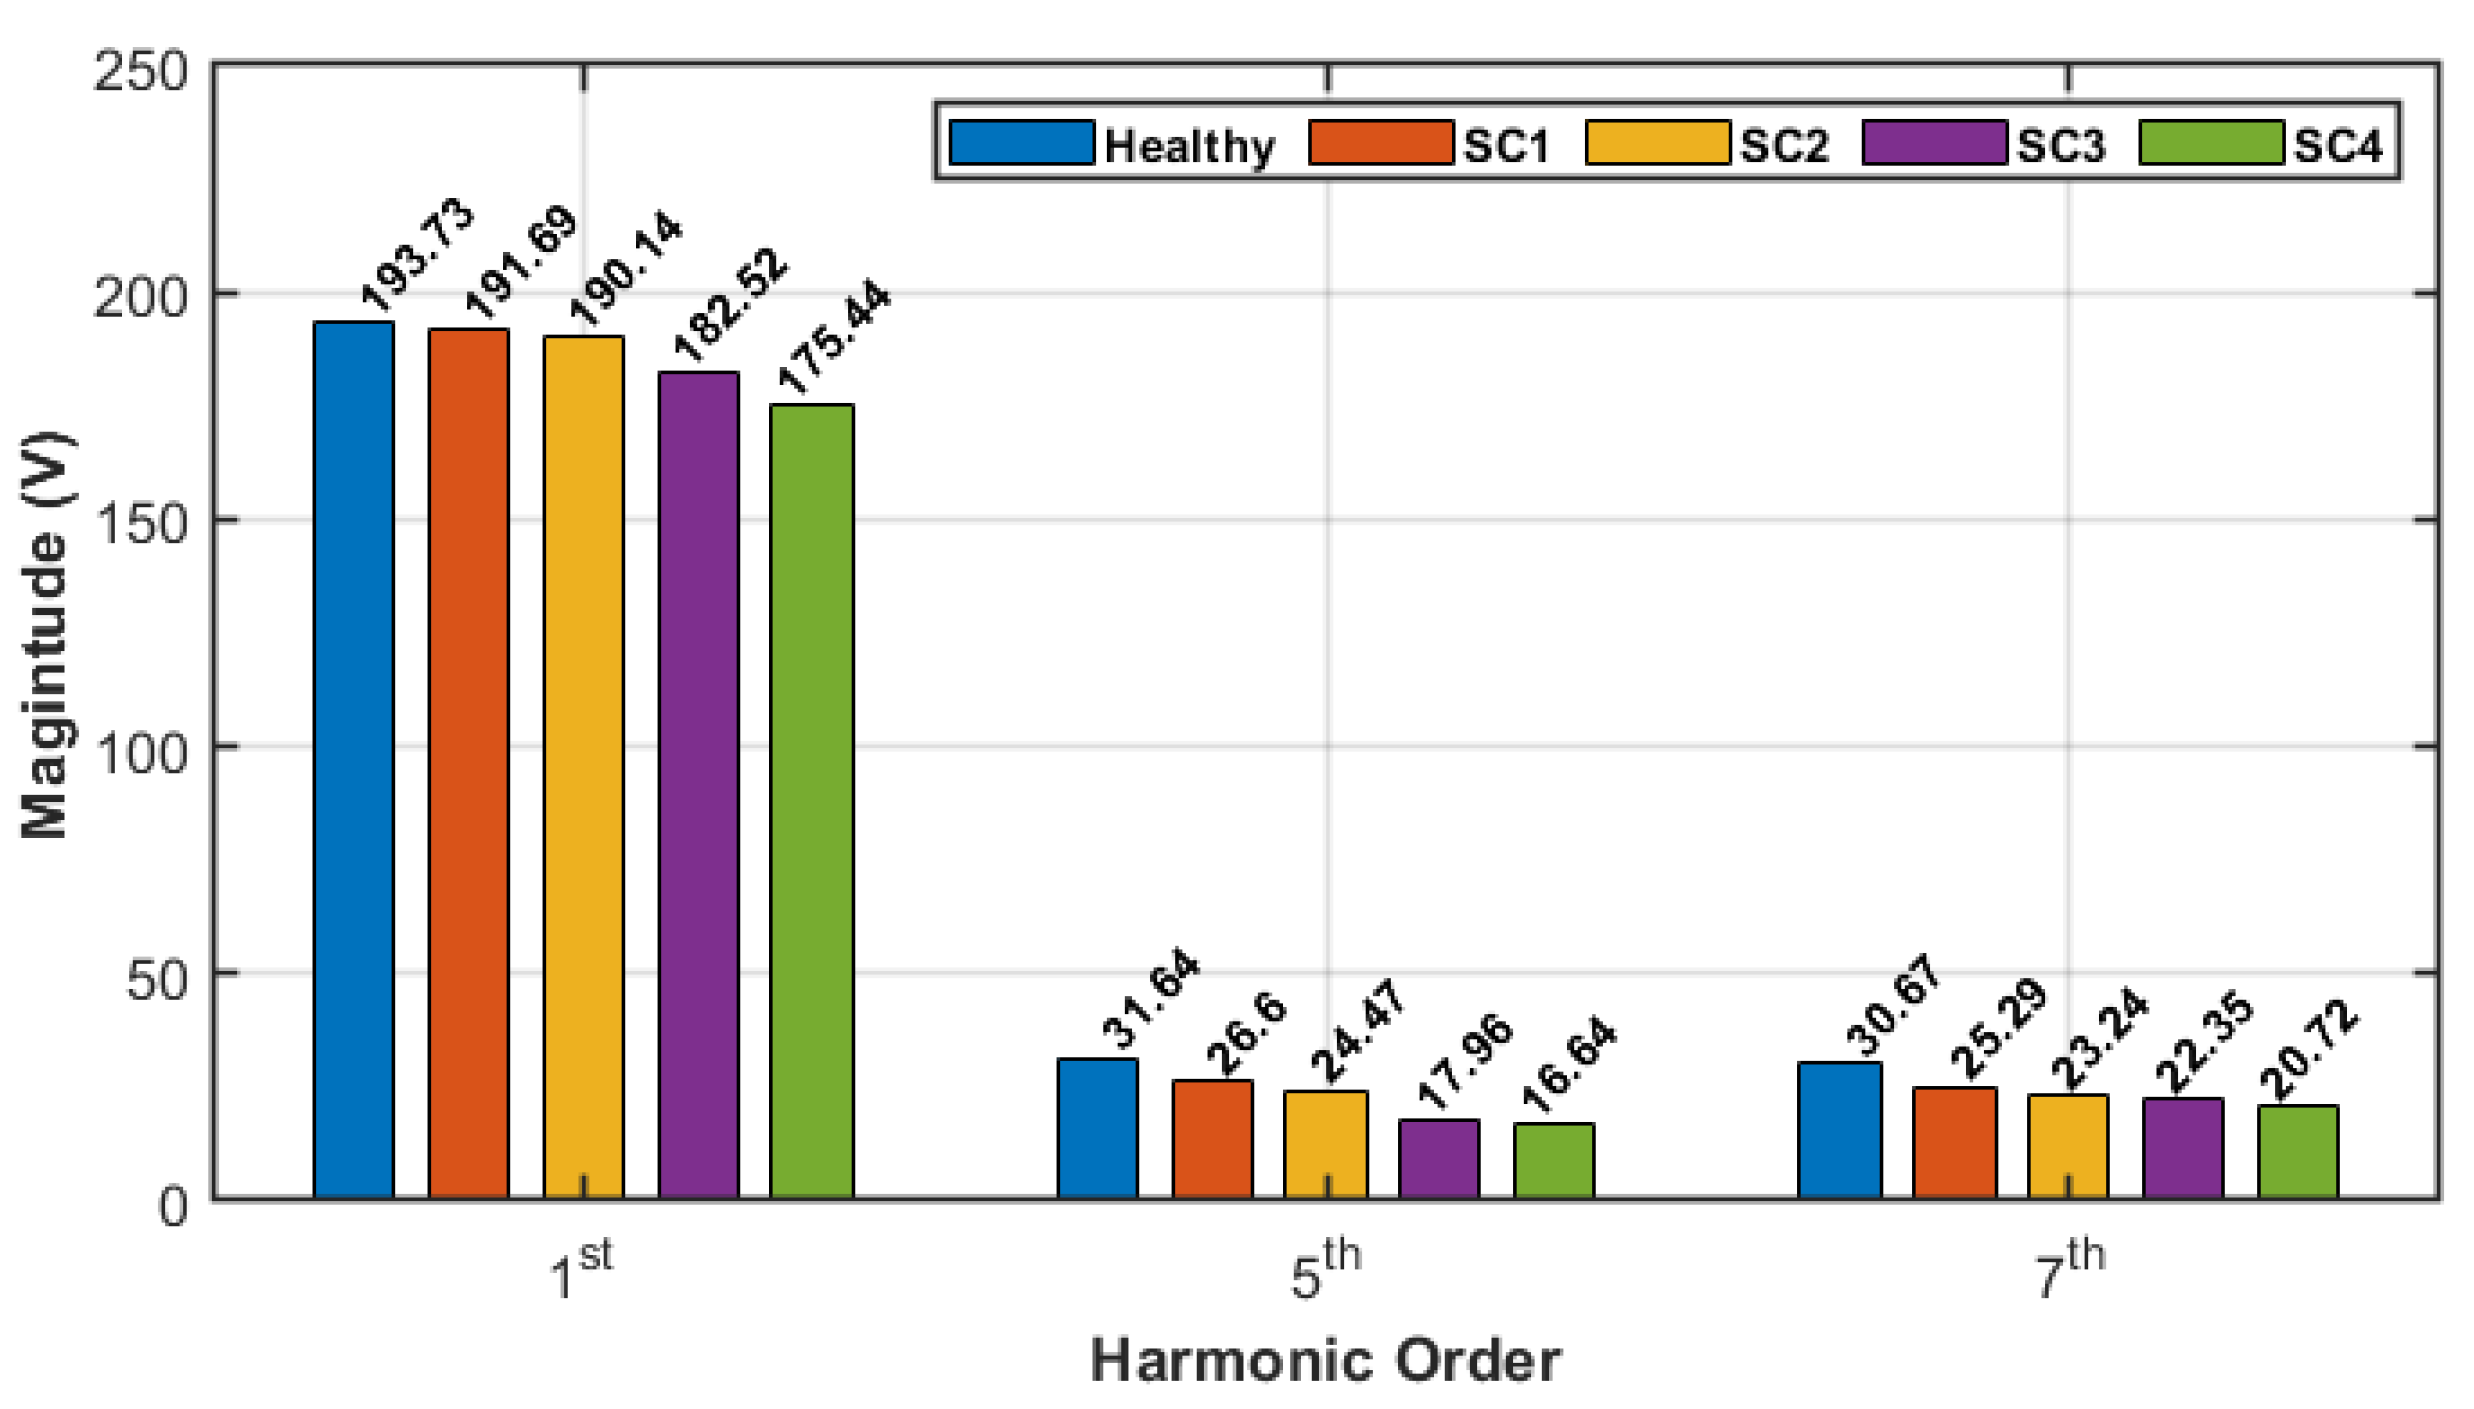
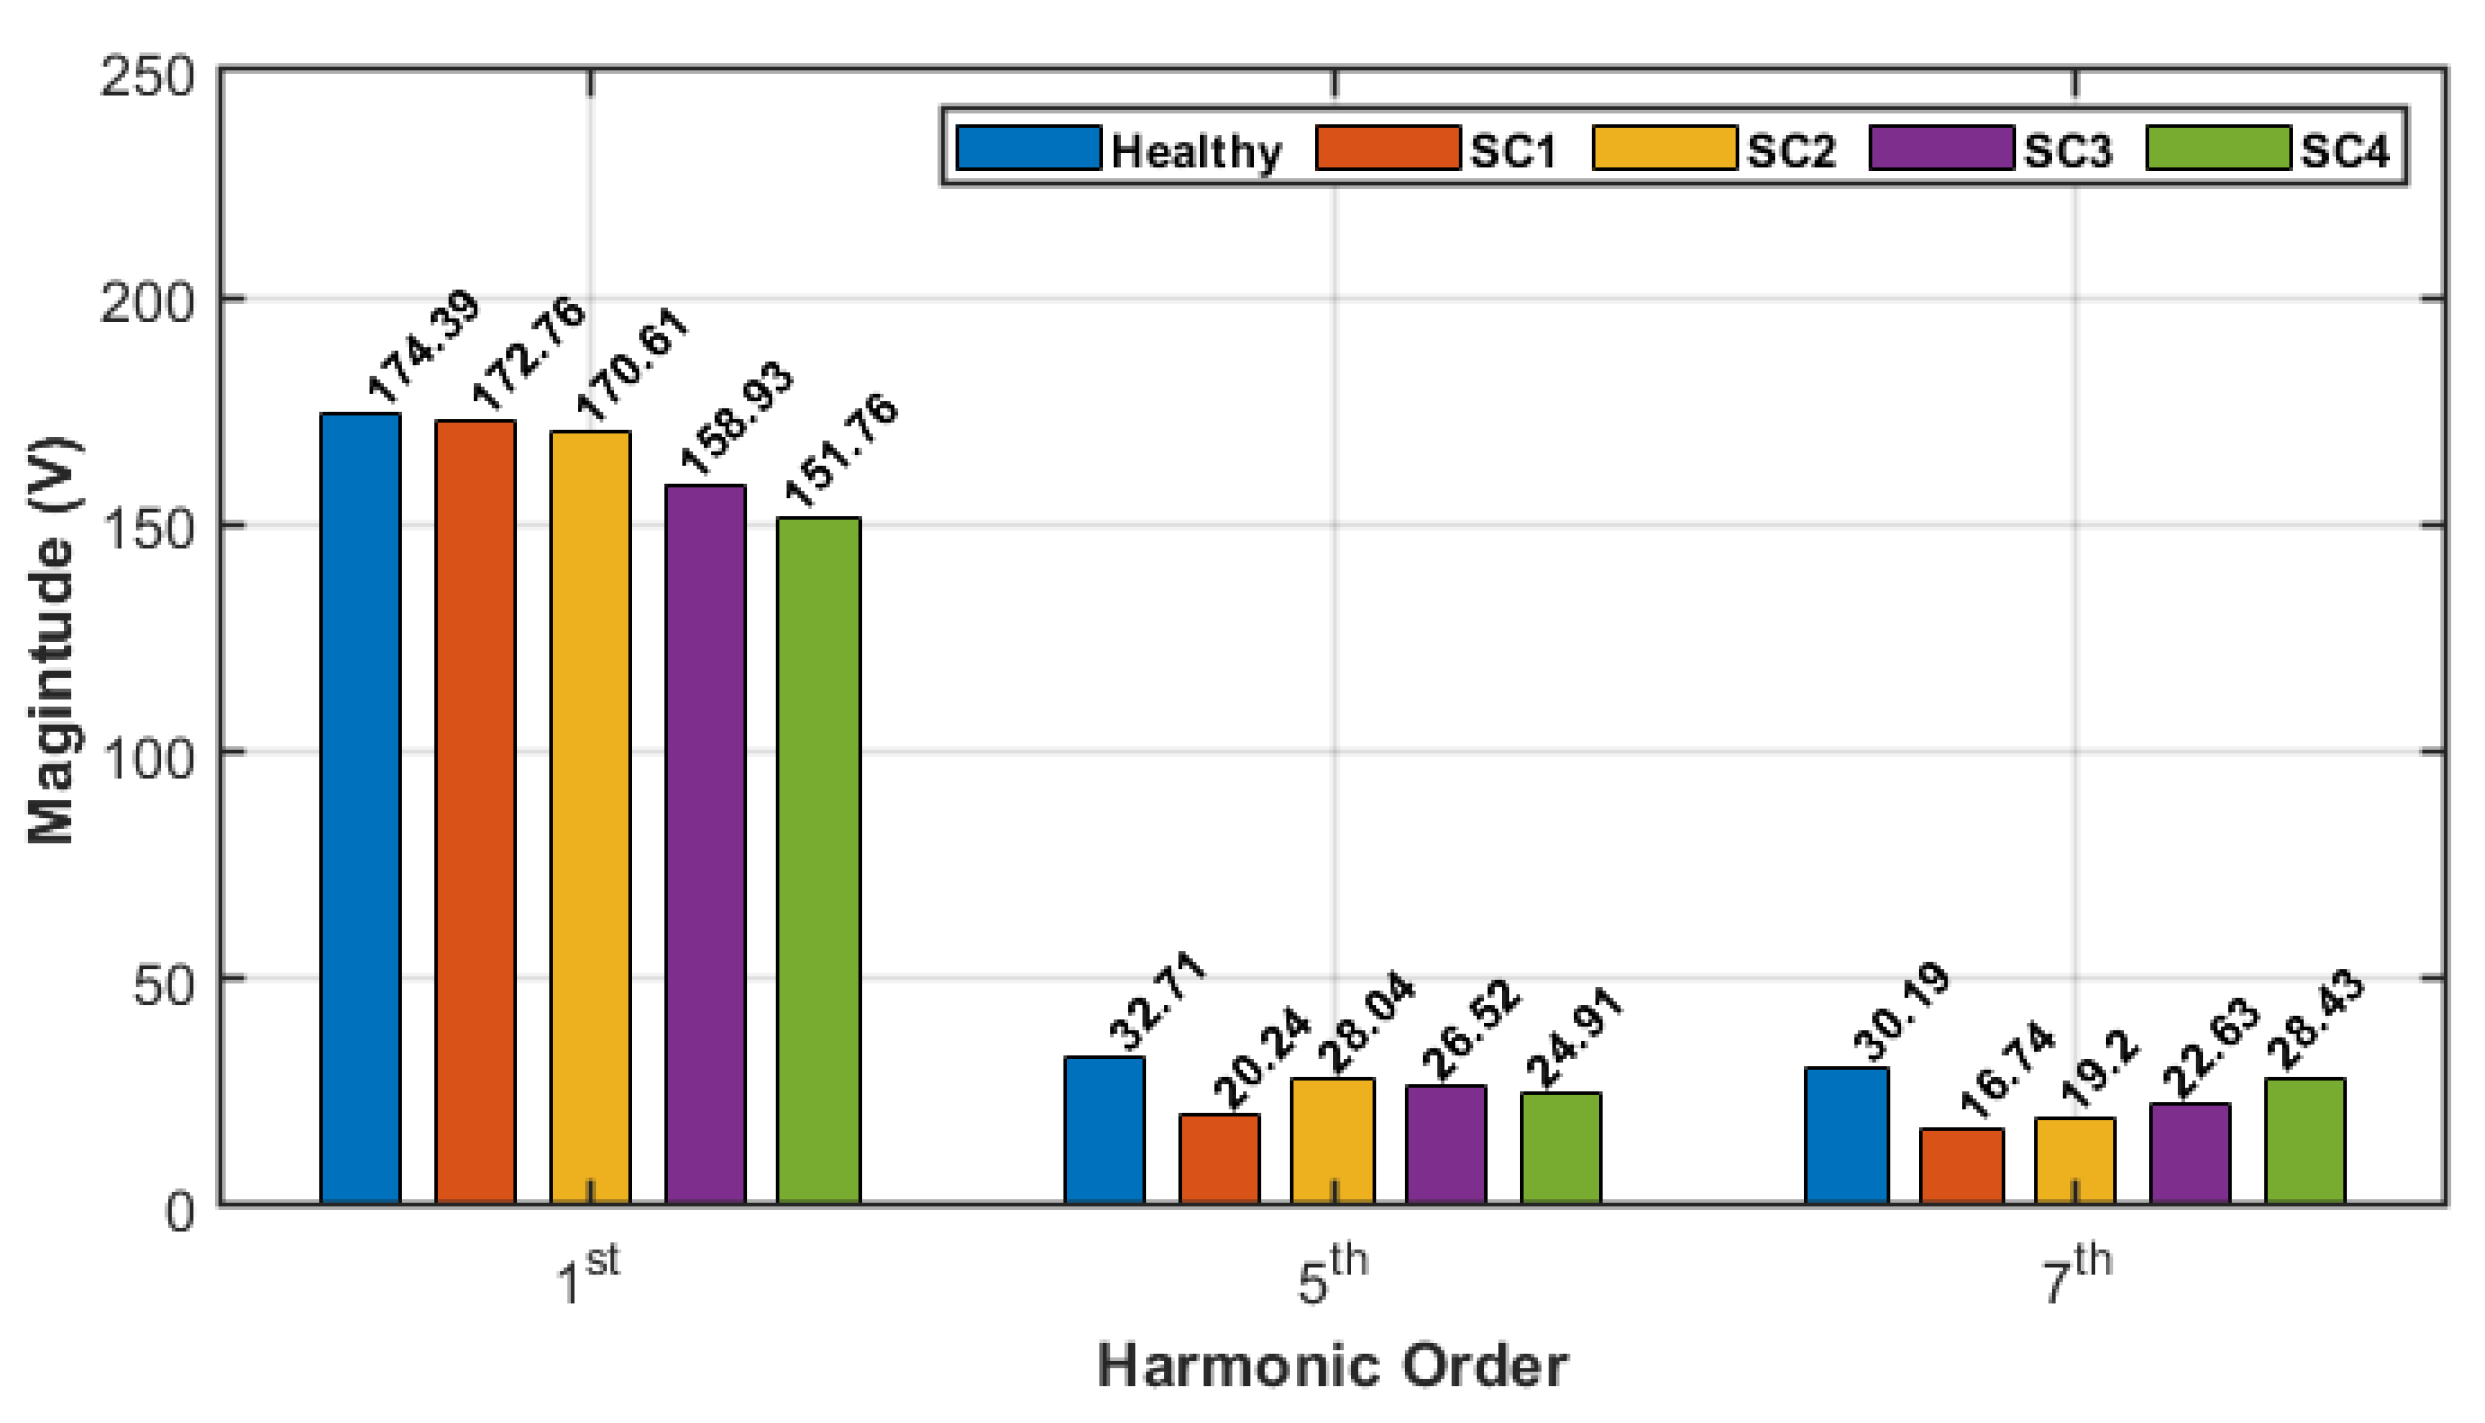
The stator voltage spectrum is shown in Figure 15 for healthy and faulty machine under different severity levels of TTSC fault when the machine is driven by DTC.
It could be observed that the magnitude of the fundamental, 5th, and 7th harmonics in the voltage spectrum is reduced when TTSC fault is present, similar to the fault effect in the FOC drive. However, it could be noticed that the magnitude of the 7th harmonic is increased from SC1 to SC2 and from SC3 to SC4, where the number of shorted turns is the same but different fault resistance is used. This is the same case for the 5th harmonic from SC1 to SC2 but it is not from SC3 to SC4. Additionally, the magnitude of the 7th harmonic is increased from SC1 to SC3 and from SC2 to SC4, where the number of shorted turns is different but with the same fault resistance. This is the same case for the 5th harmonic from SC1 to SC3, but it is not from SC2 to SC4. If these harmonics are used as features for diagnosis approach, the classifier will be overwhelmed since the changes in the used harmonics due to different TTSC severity levels are not consistent with an increase in the fault severity.
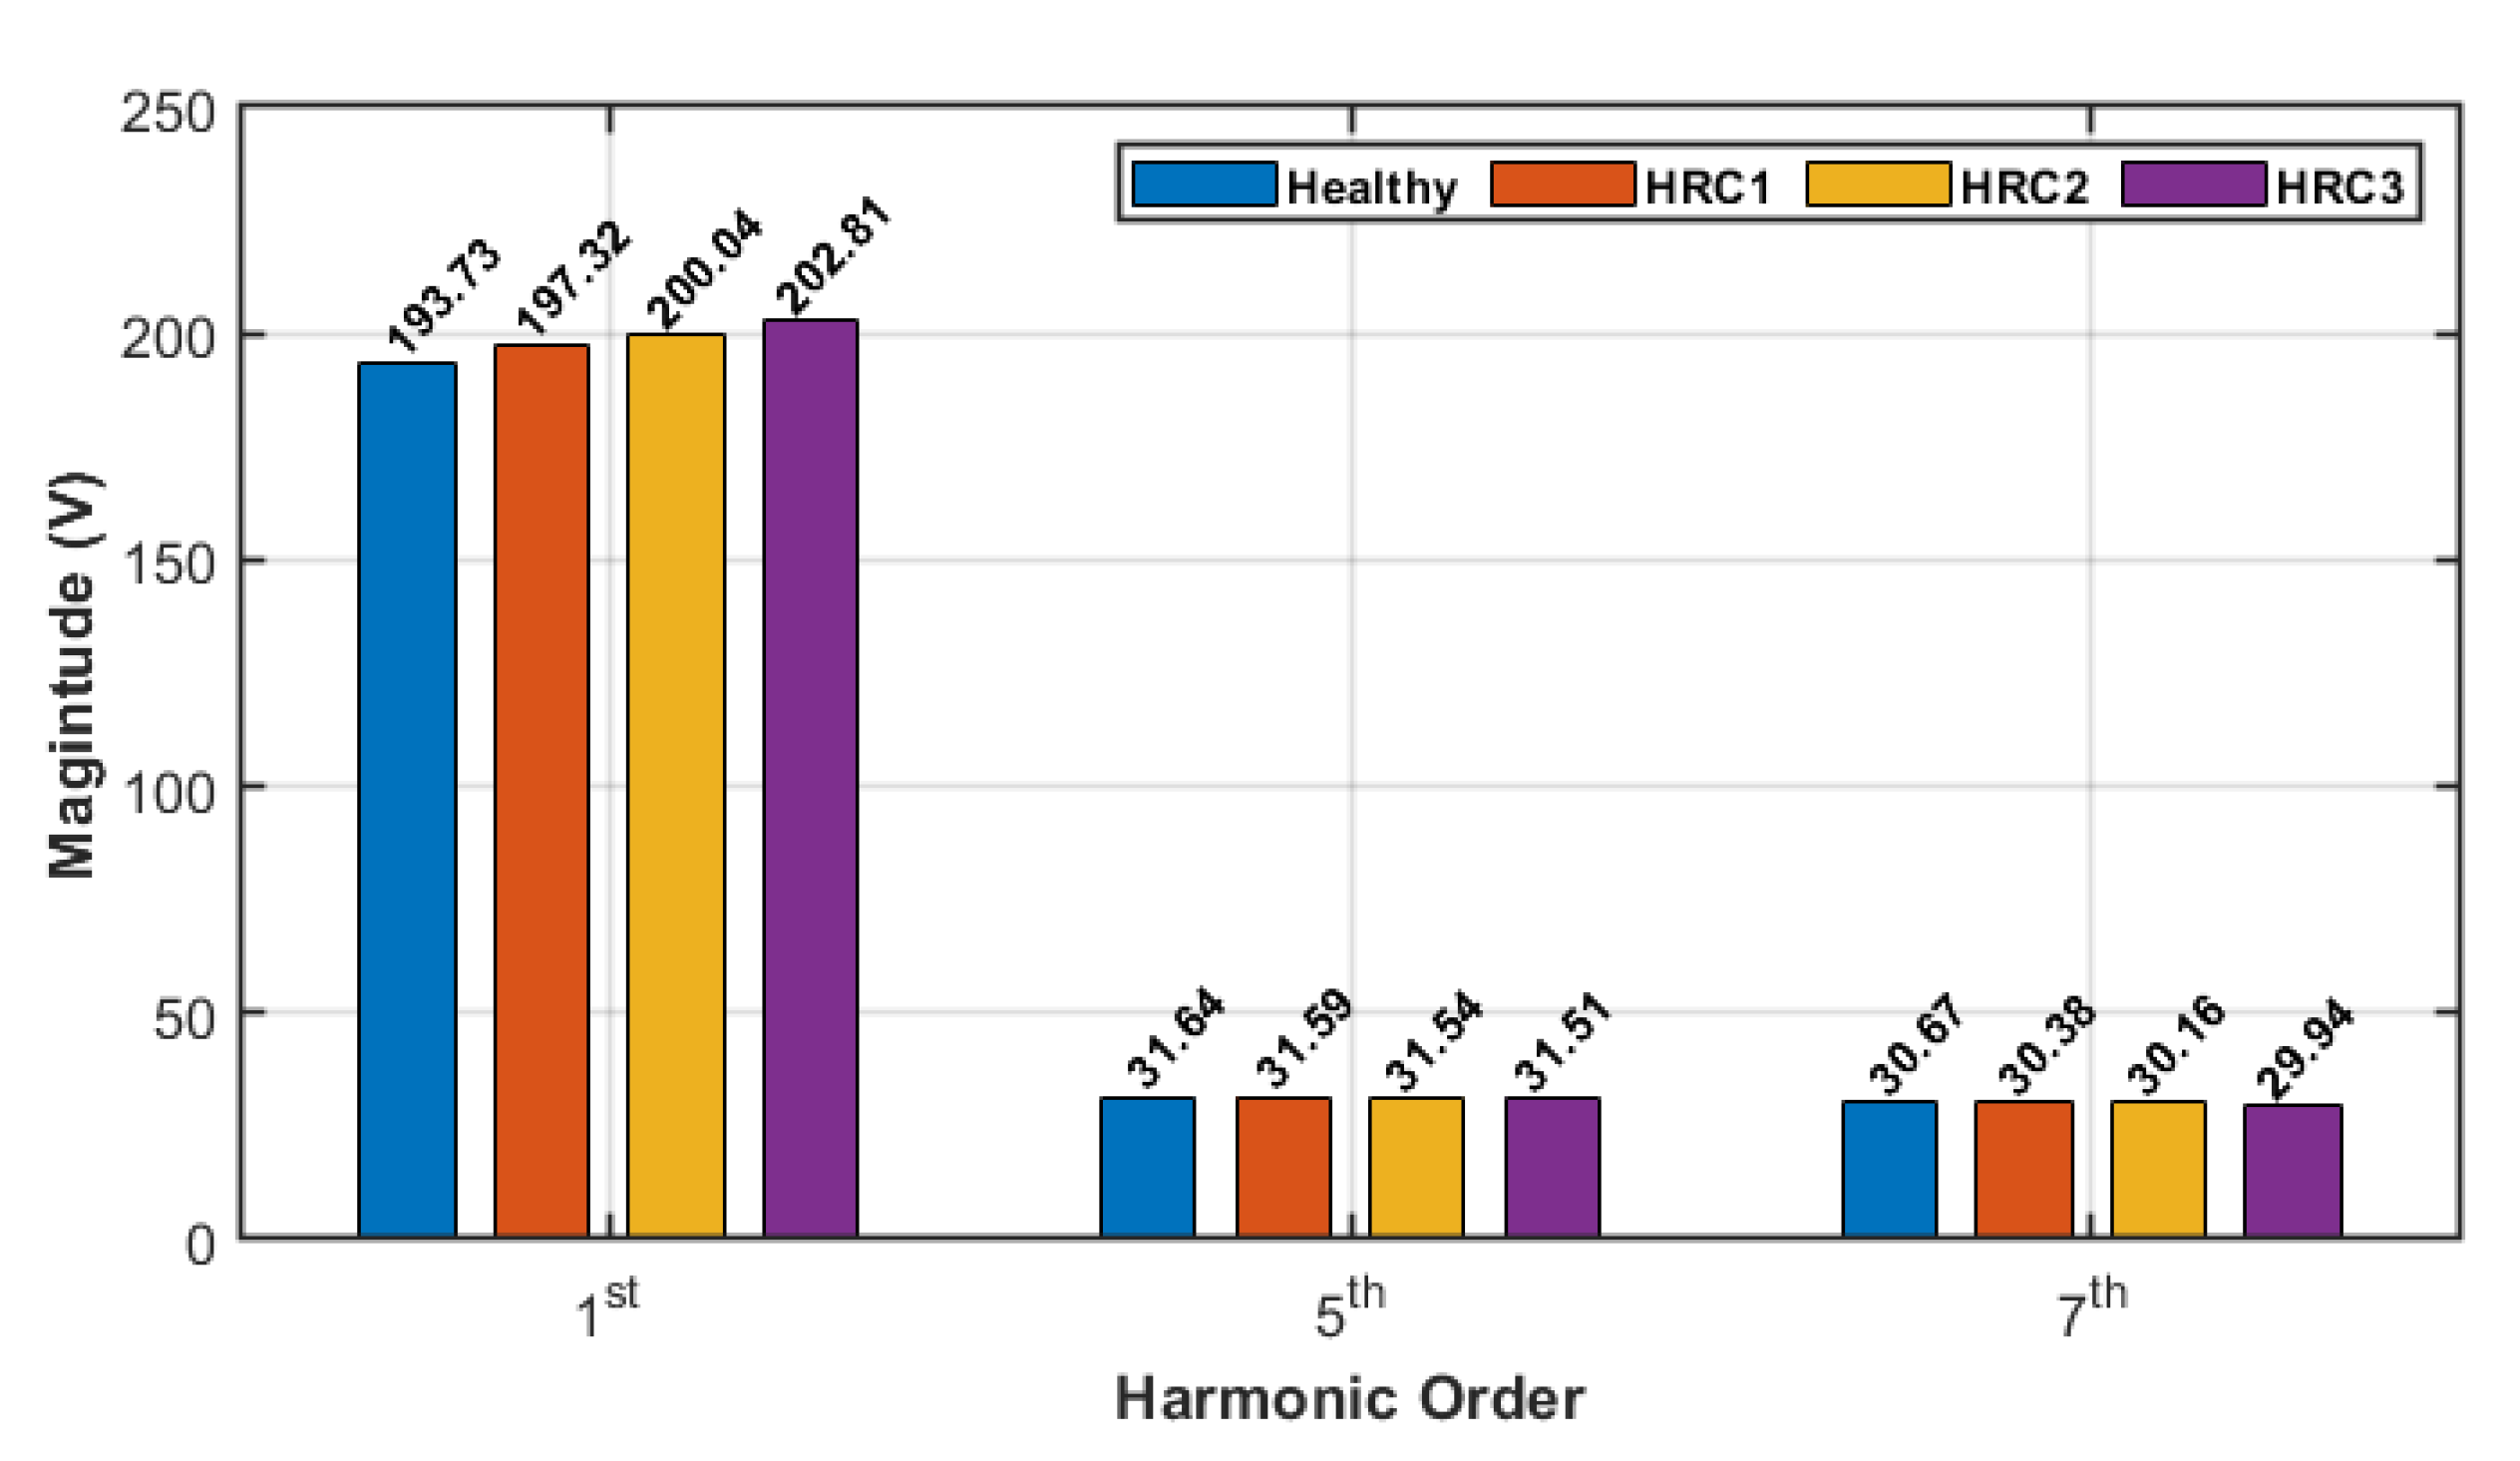
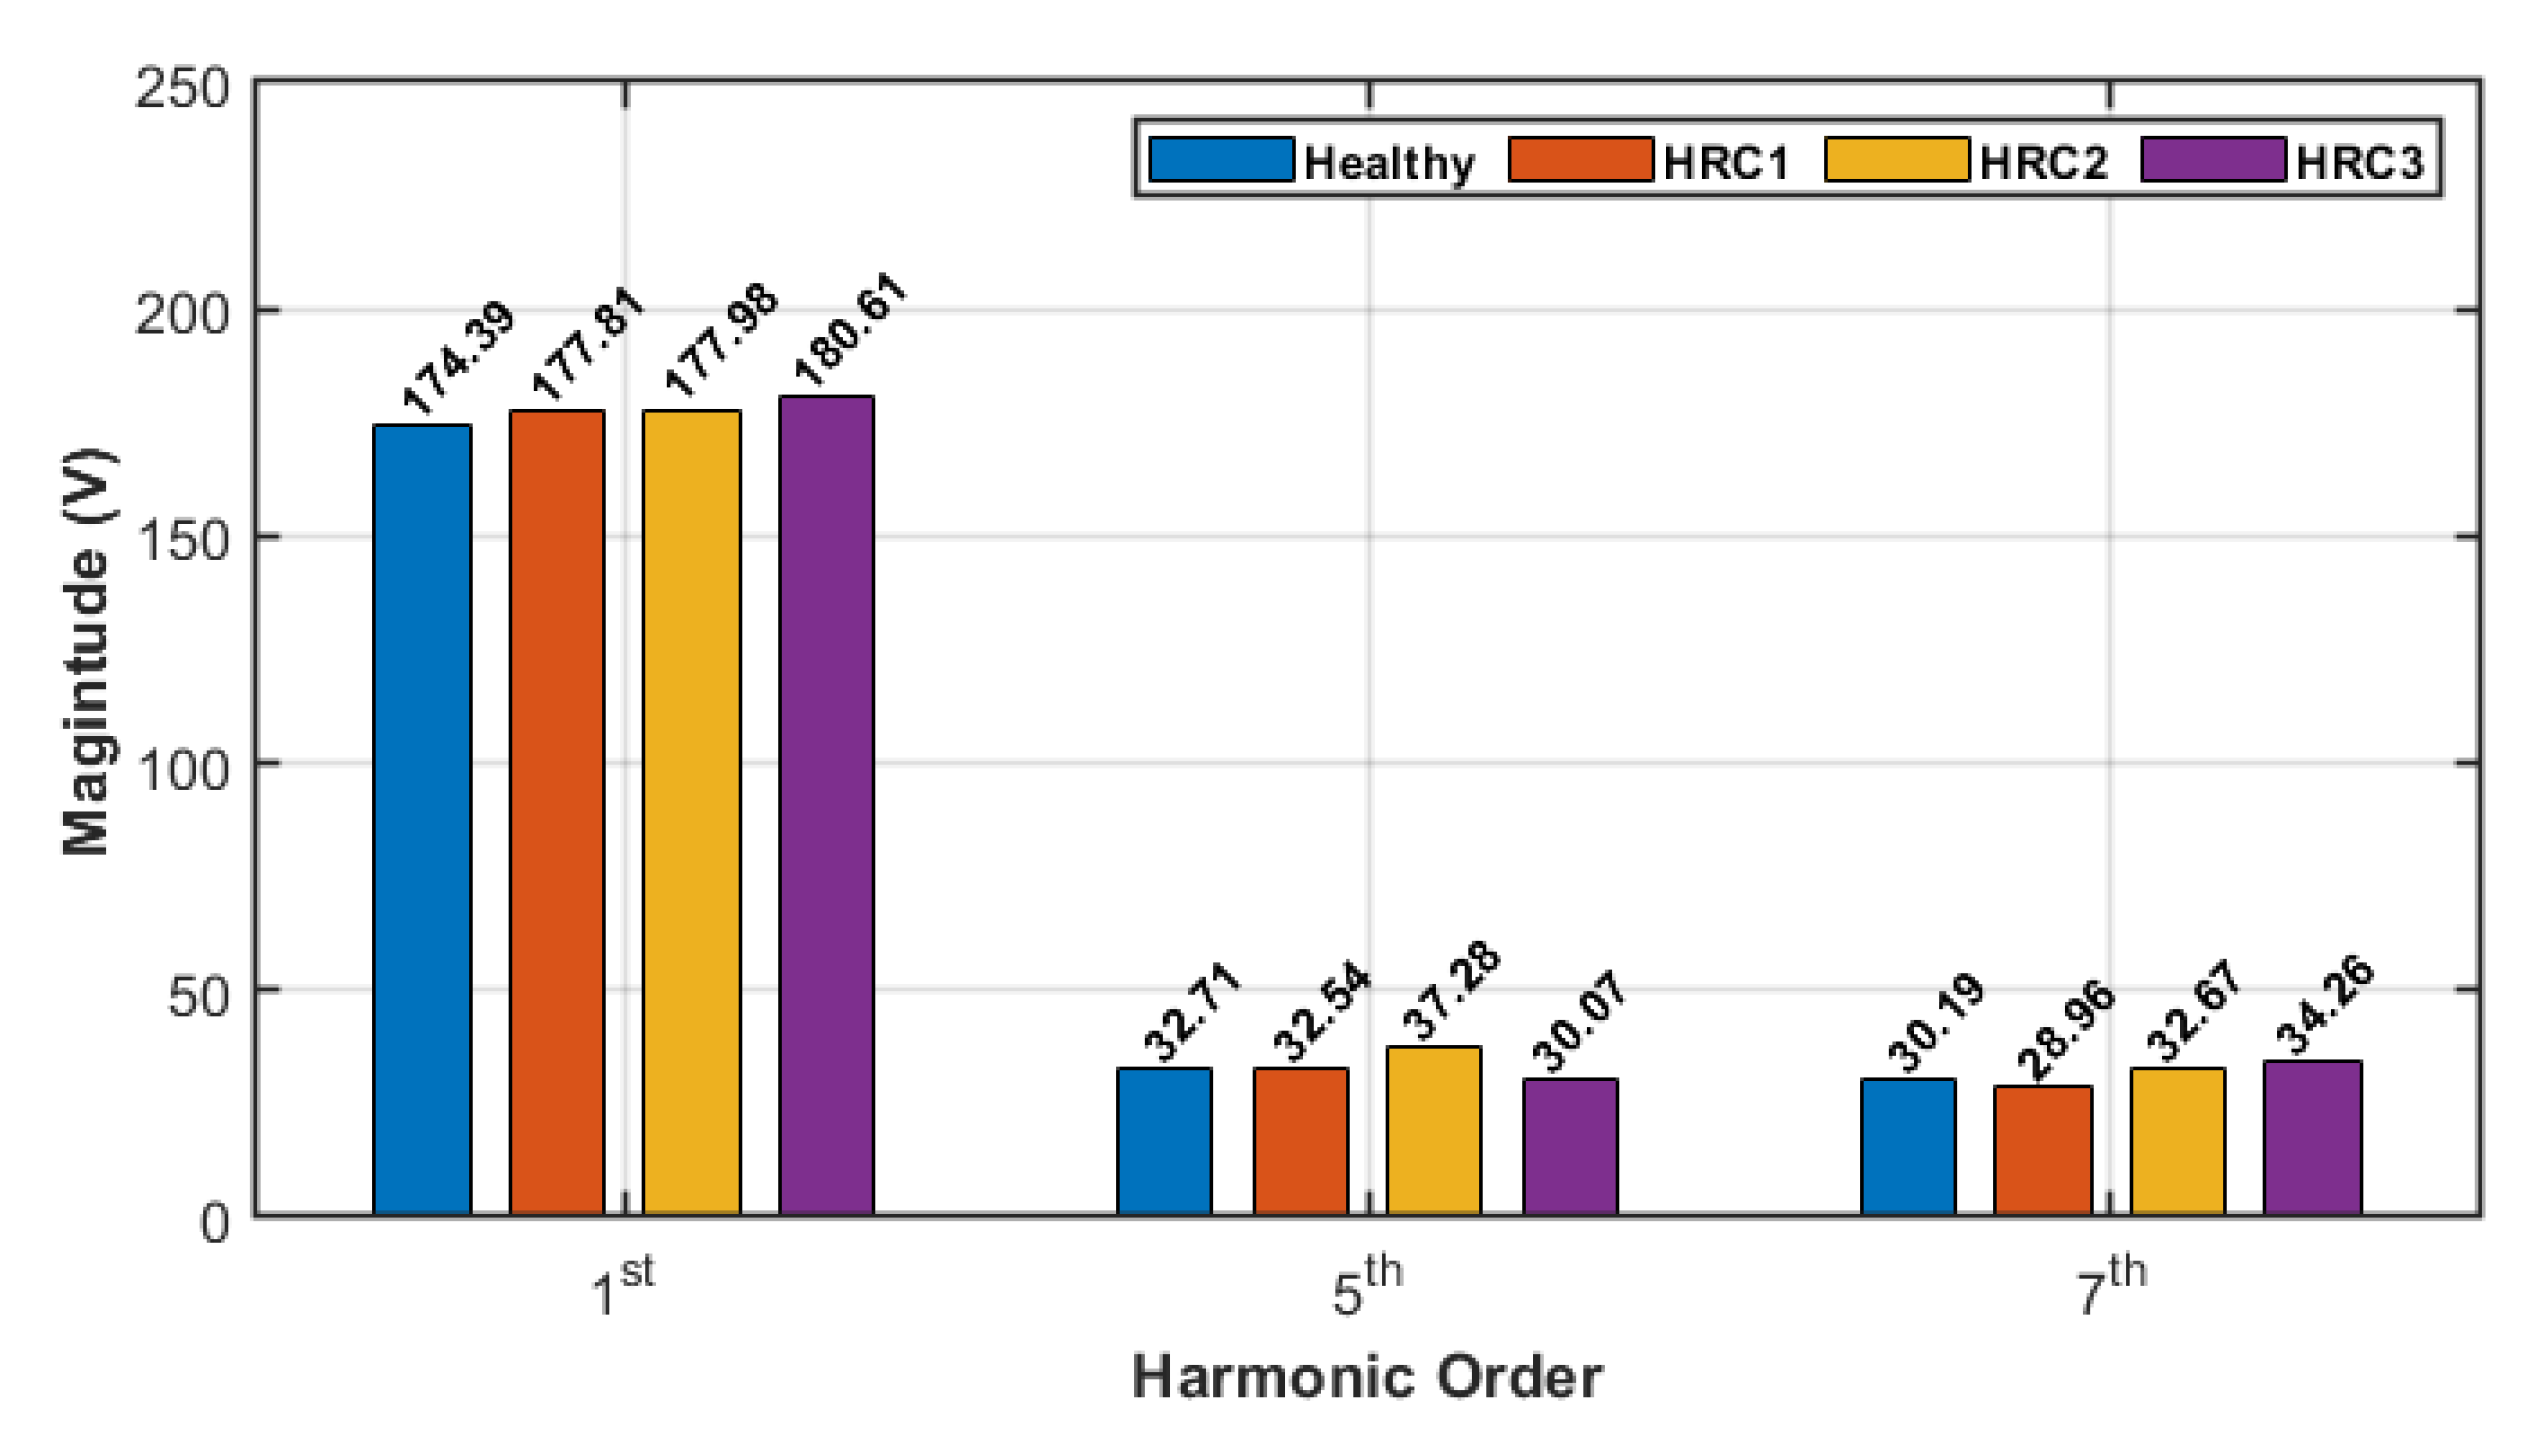
The stator voltage spectrum is shown in Figure 16 for healthy and faulty machine under different severity levels of HRC fault when the machine is driven by DTC.
It could be observed that the magnitude of the fundamental harmonic in the voltage spectrum is increasing significantly when HRC fault is present and become more severe. On the other hand, the magnitude of the 5th has inconsistent change, where it does not change significantly at HRC1 but it increases at HRC2 and then decreases at HRC3. Similarly, the magnitude of the 7th starts decreasing at HRC1 but then starts increasing at HRC2 and HRC3. Once again, these inconsistent changes in the voltage spectrum due to different HRC severity levels will result in high false classification results.
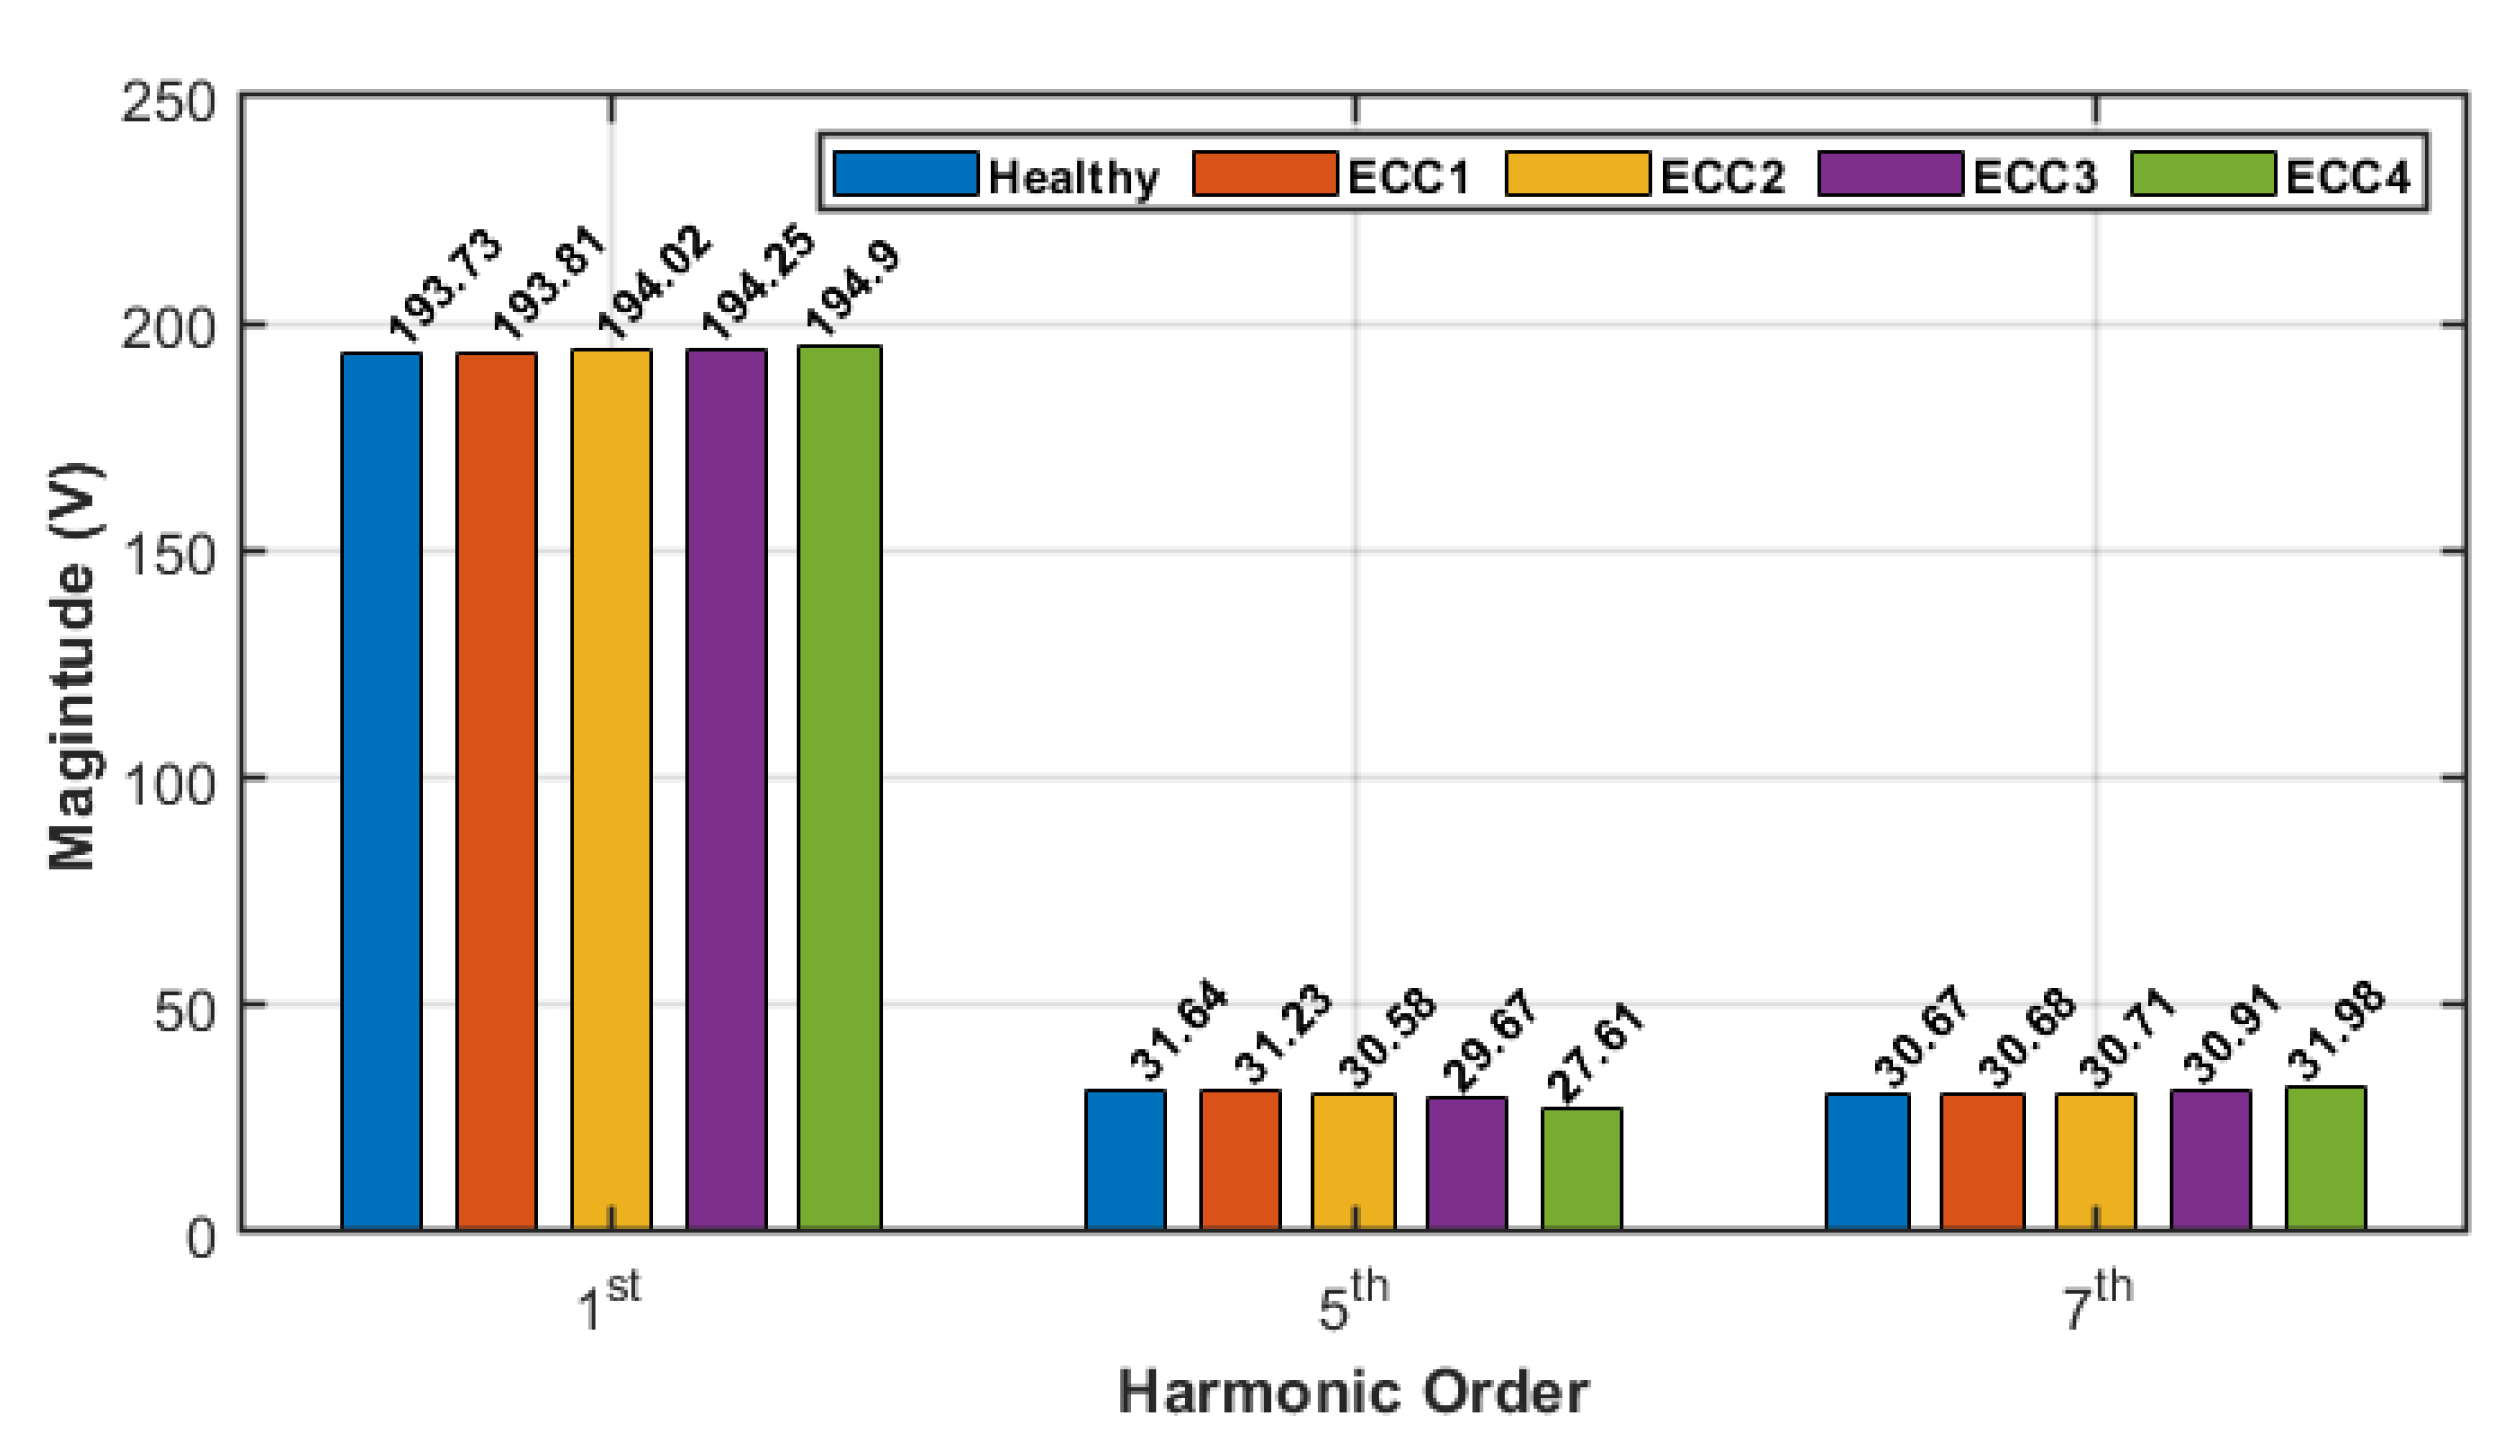
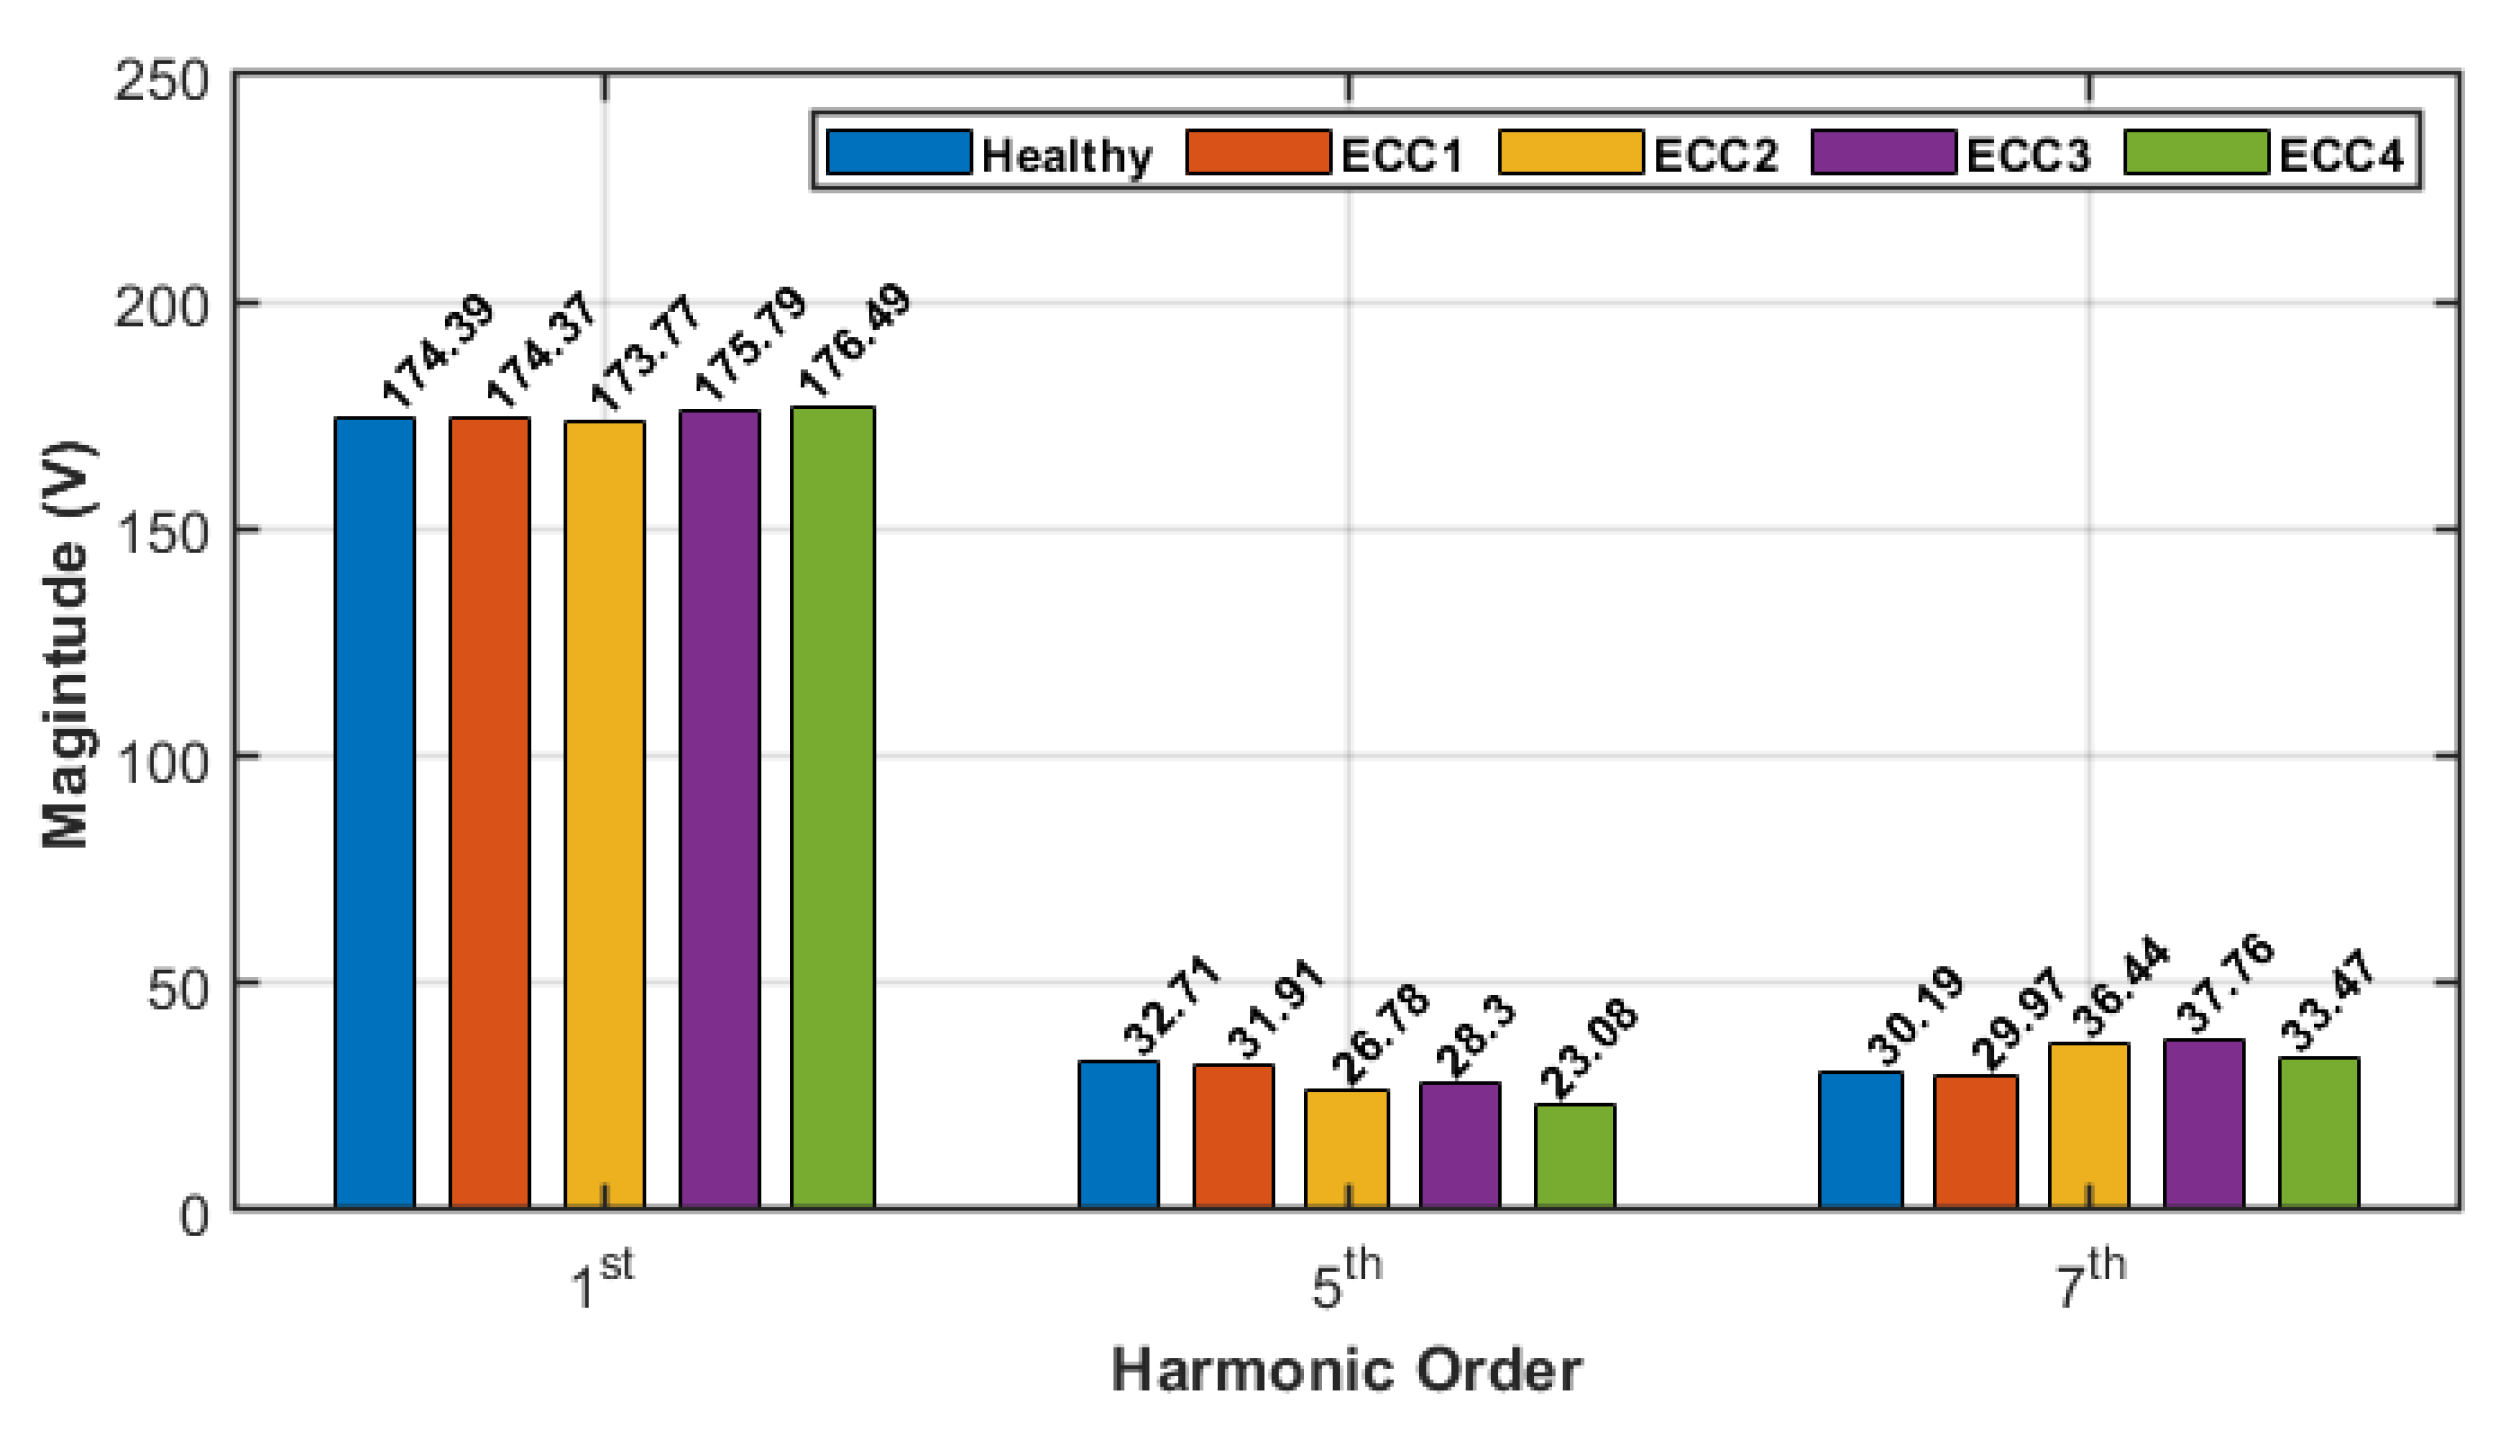
The stator voltage spectrum is shown in Figure 17 for healthy and faulty machine under different severity levels of eccentricity fault when the machine is driven by DTC.
It could be observed that the magnitude of the fundamental harmonic in the voltage spectrum has inconsistent changes due to different severity levels of the eccentricity fault, where it is reducing at ECC1 and ECC2 while it is increasing at ECC3 and ECC4. Similarly, the magnitude of the 5th harmonic reduces at all eccentricity severity levels. However, it decreases from healthy case to ECC1 and ECC2, increases from ECC2 to ECC3, and then decreases from ECC3 to ECC4. It could be also noticed a similar inconsistent pattern happens with the 7th harmonic. These irregular changes in the spectrum will result a difficulty in performing fault detection and separation in DTC drives.
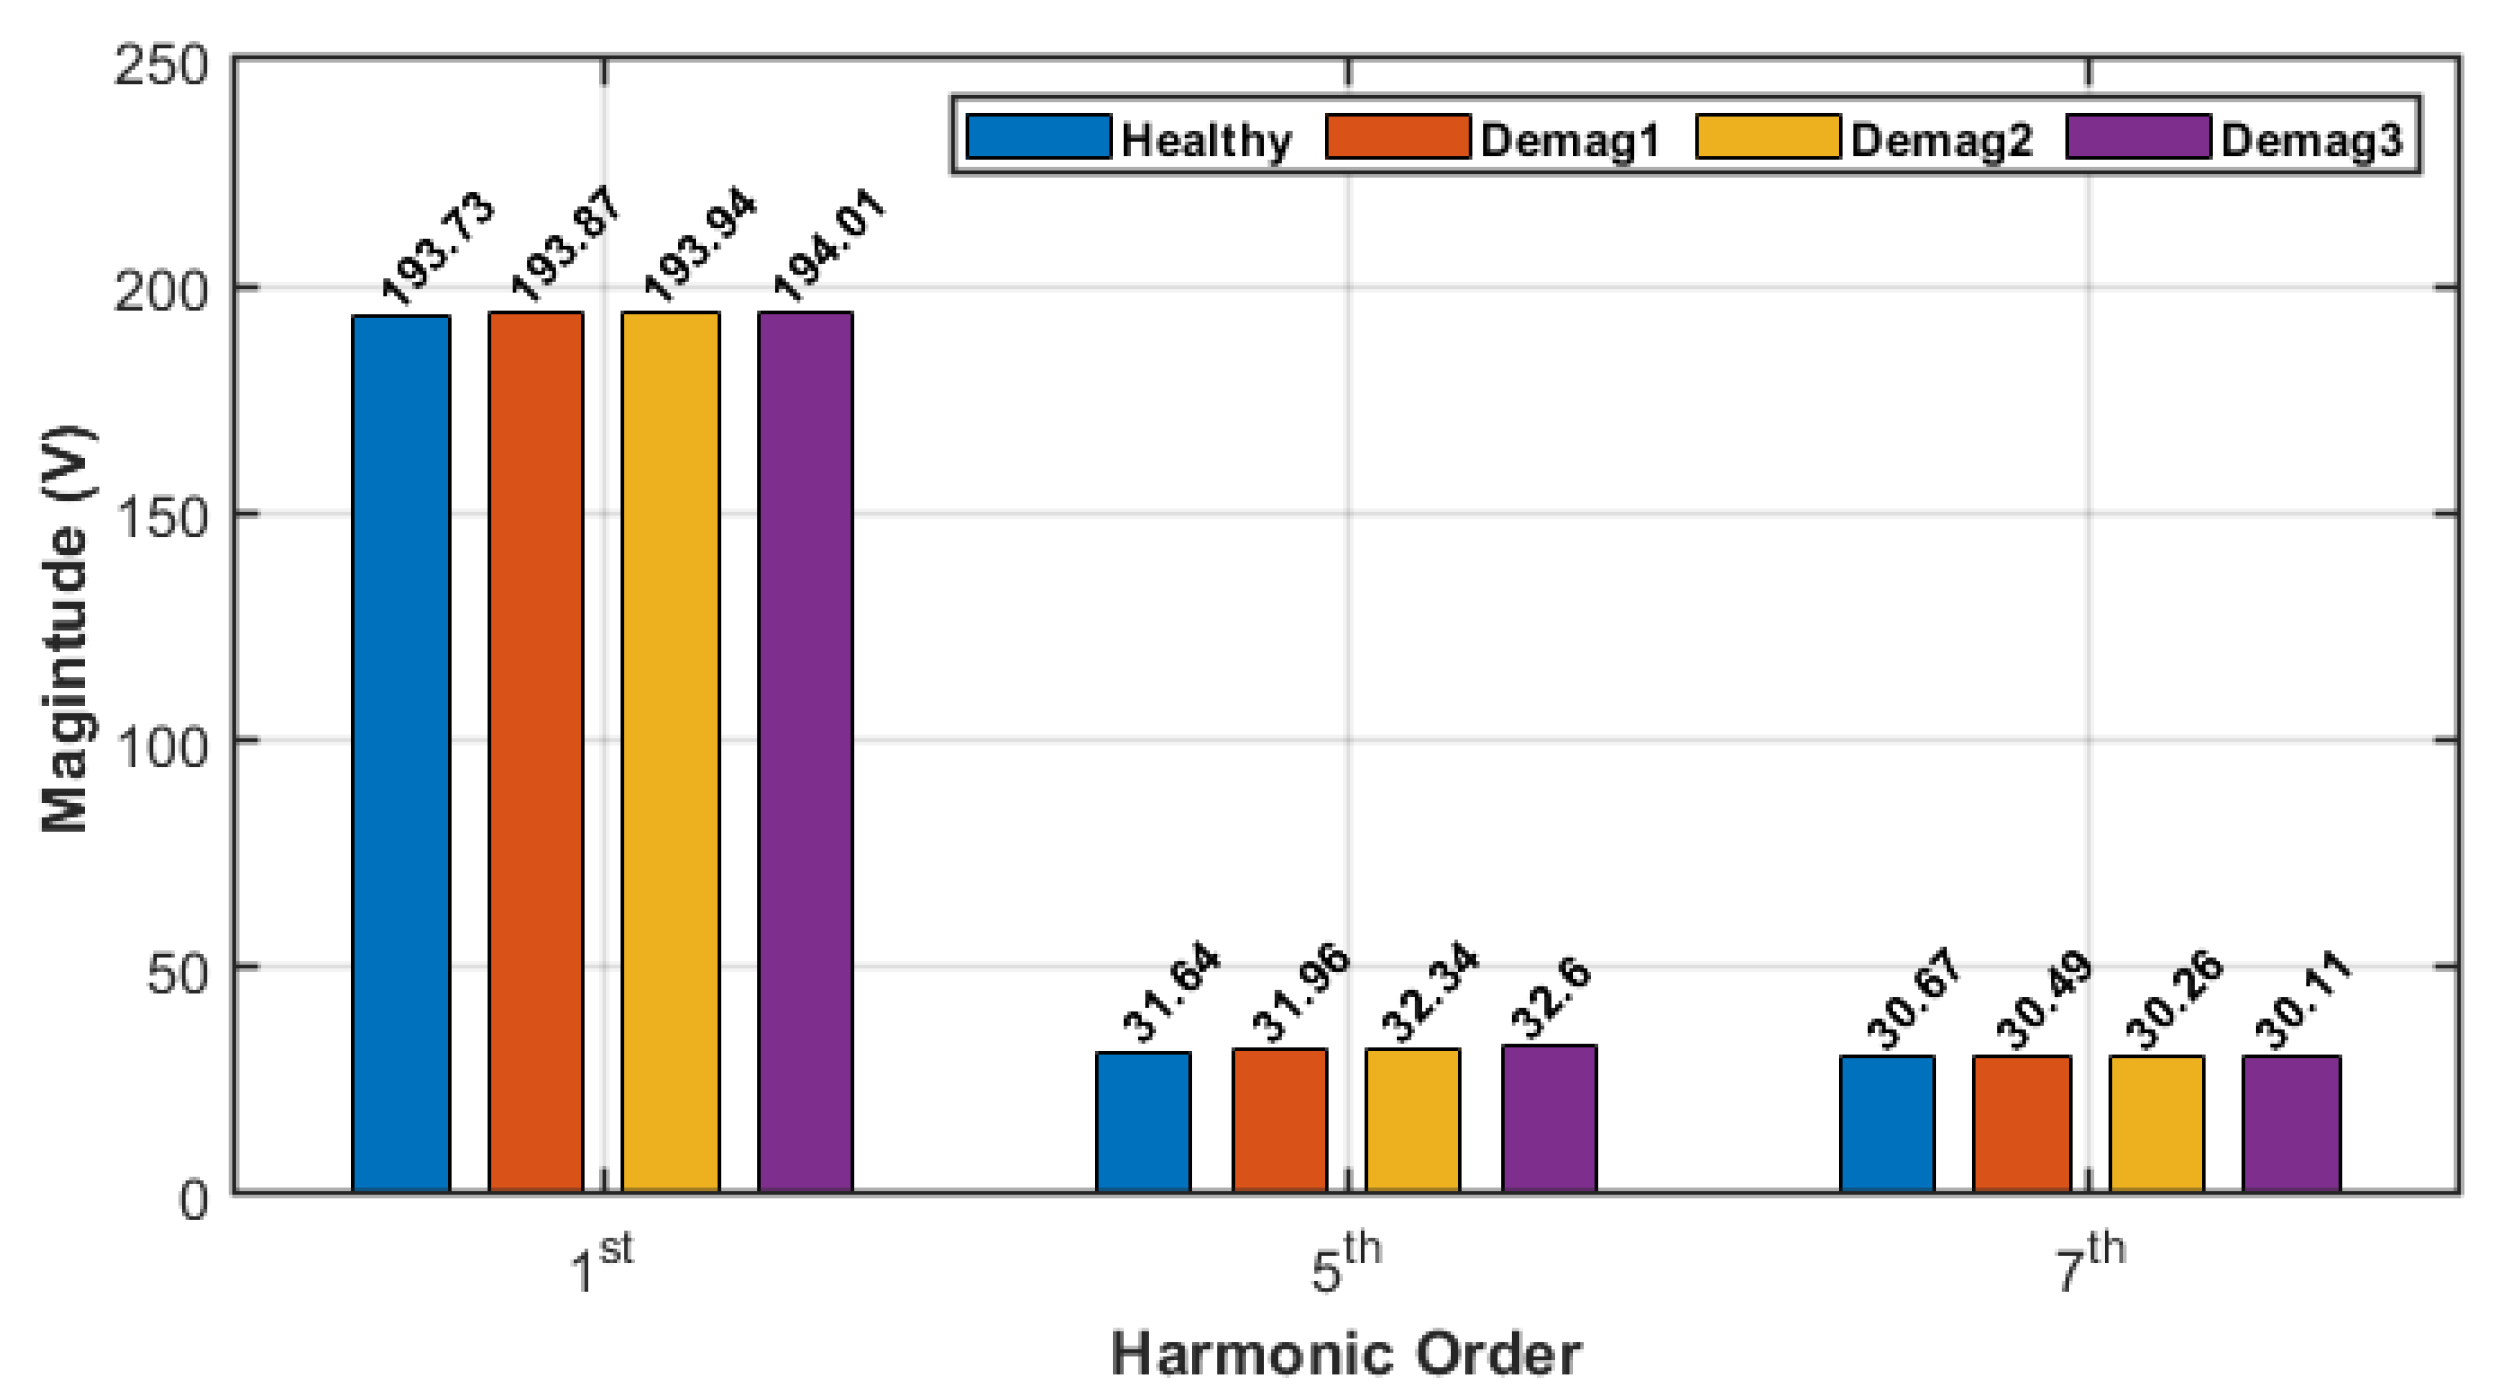
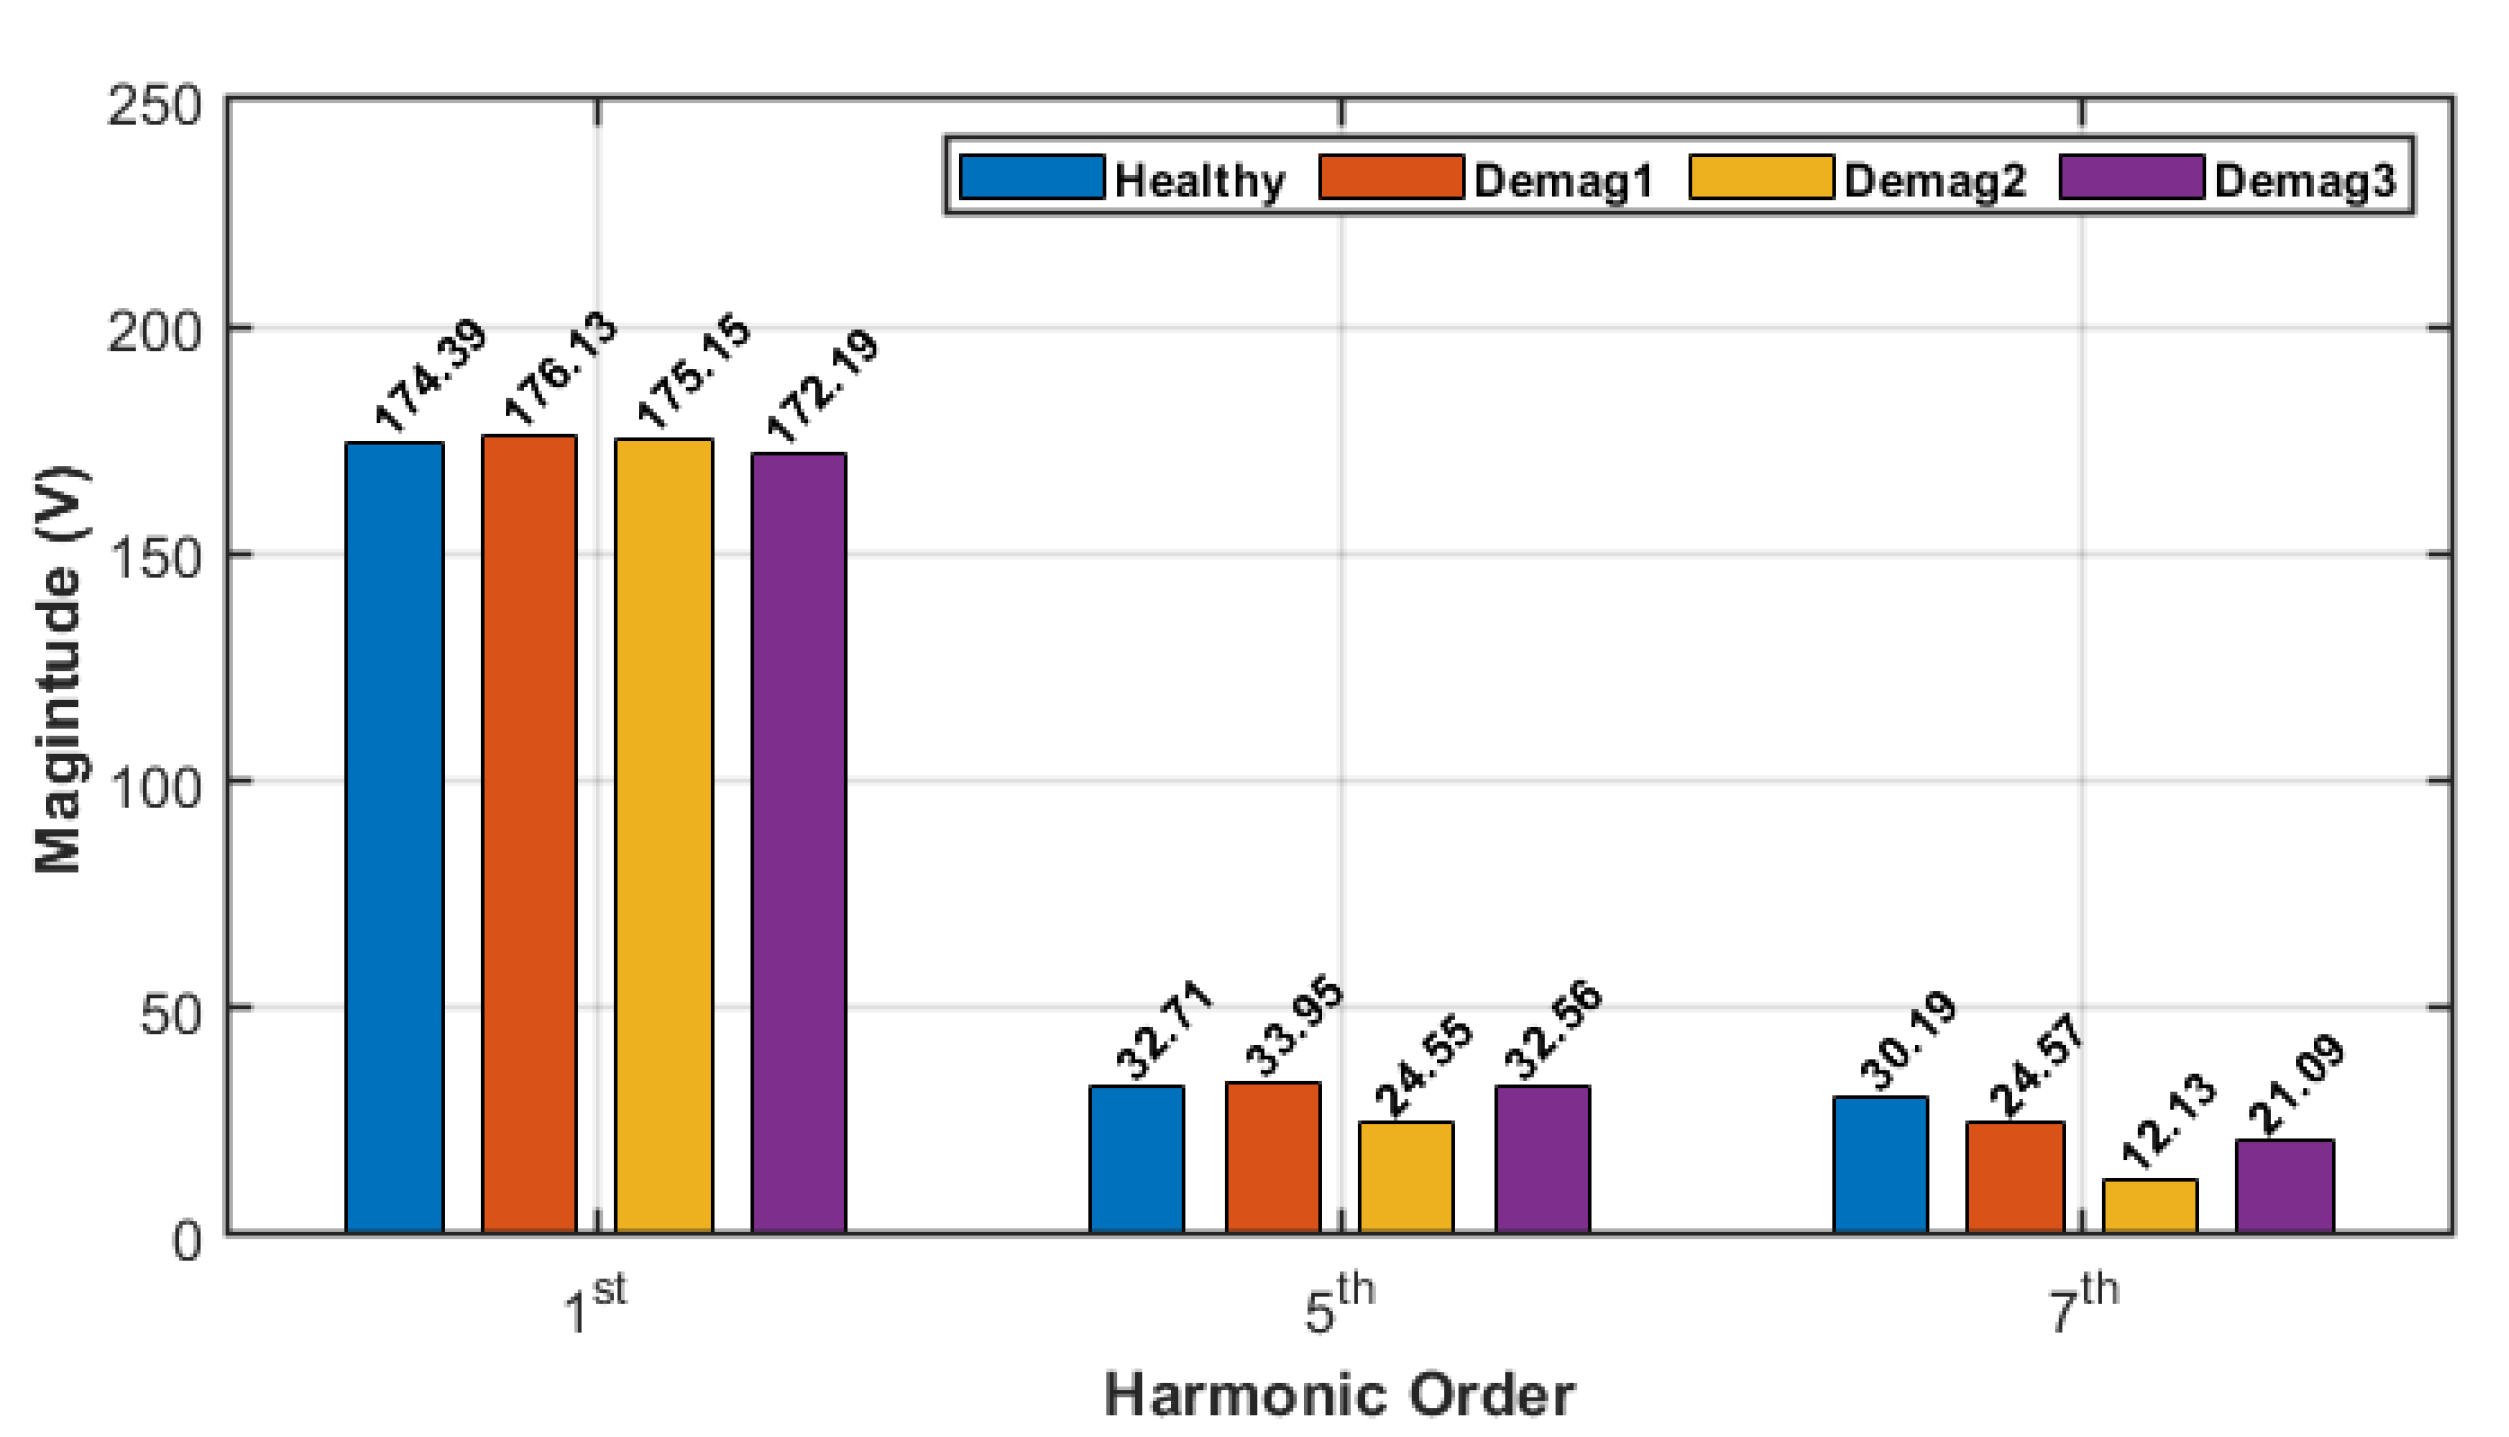
The stator voltage spectrum is shown in Figure 18 for healthy and faulty machine under different severity levels of demagnetization fault when the machine is driven by DTC.
It could be noticed that the magnitude of the fundamental harmonic in the voltage spectrum has inconsistent changes due to different severity levels of demagnetization fault where it is increasing at Demag1 and Demag2 but then reducing at Demag3. Similarly, the magnitude of the 5th and 7th harmonics have inconsistent changes with increasing the demagnetization fault severity. In comparison with applying FOC drives, the changes in the voltage spectrum would not help the classifier in identifying fault, discriminating between them, and estimating their severity.
5. Diagnosis Approach
The spectrum of the commanded phase A voltage was obtained using the FFT method in MATLAB, and the amplitude of the first eight harmonics was then extracted. The inclusion of additional harmonics allows fault identification, categorization and estimate for TTSC, HRC, static eccentricity and local demagnetization without the need for extra sensors. This limits possible false indication using the proposed detection methods in the literature that rely on using only single feature for fault diagnosis.
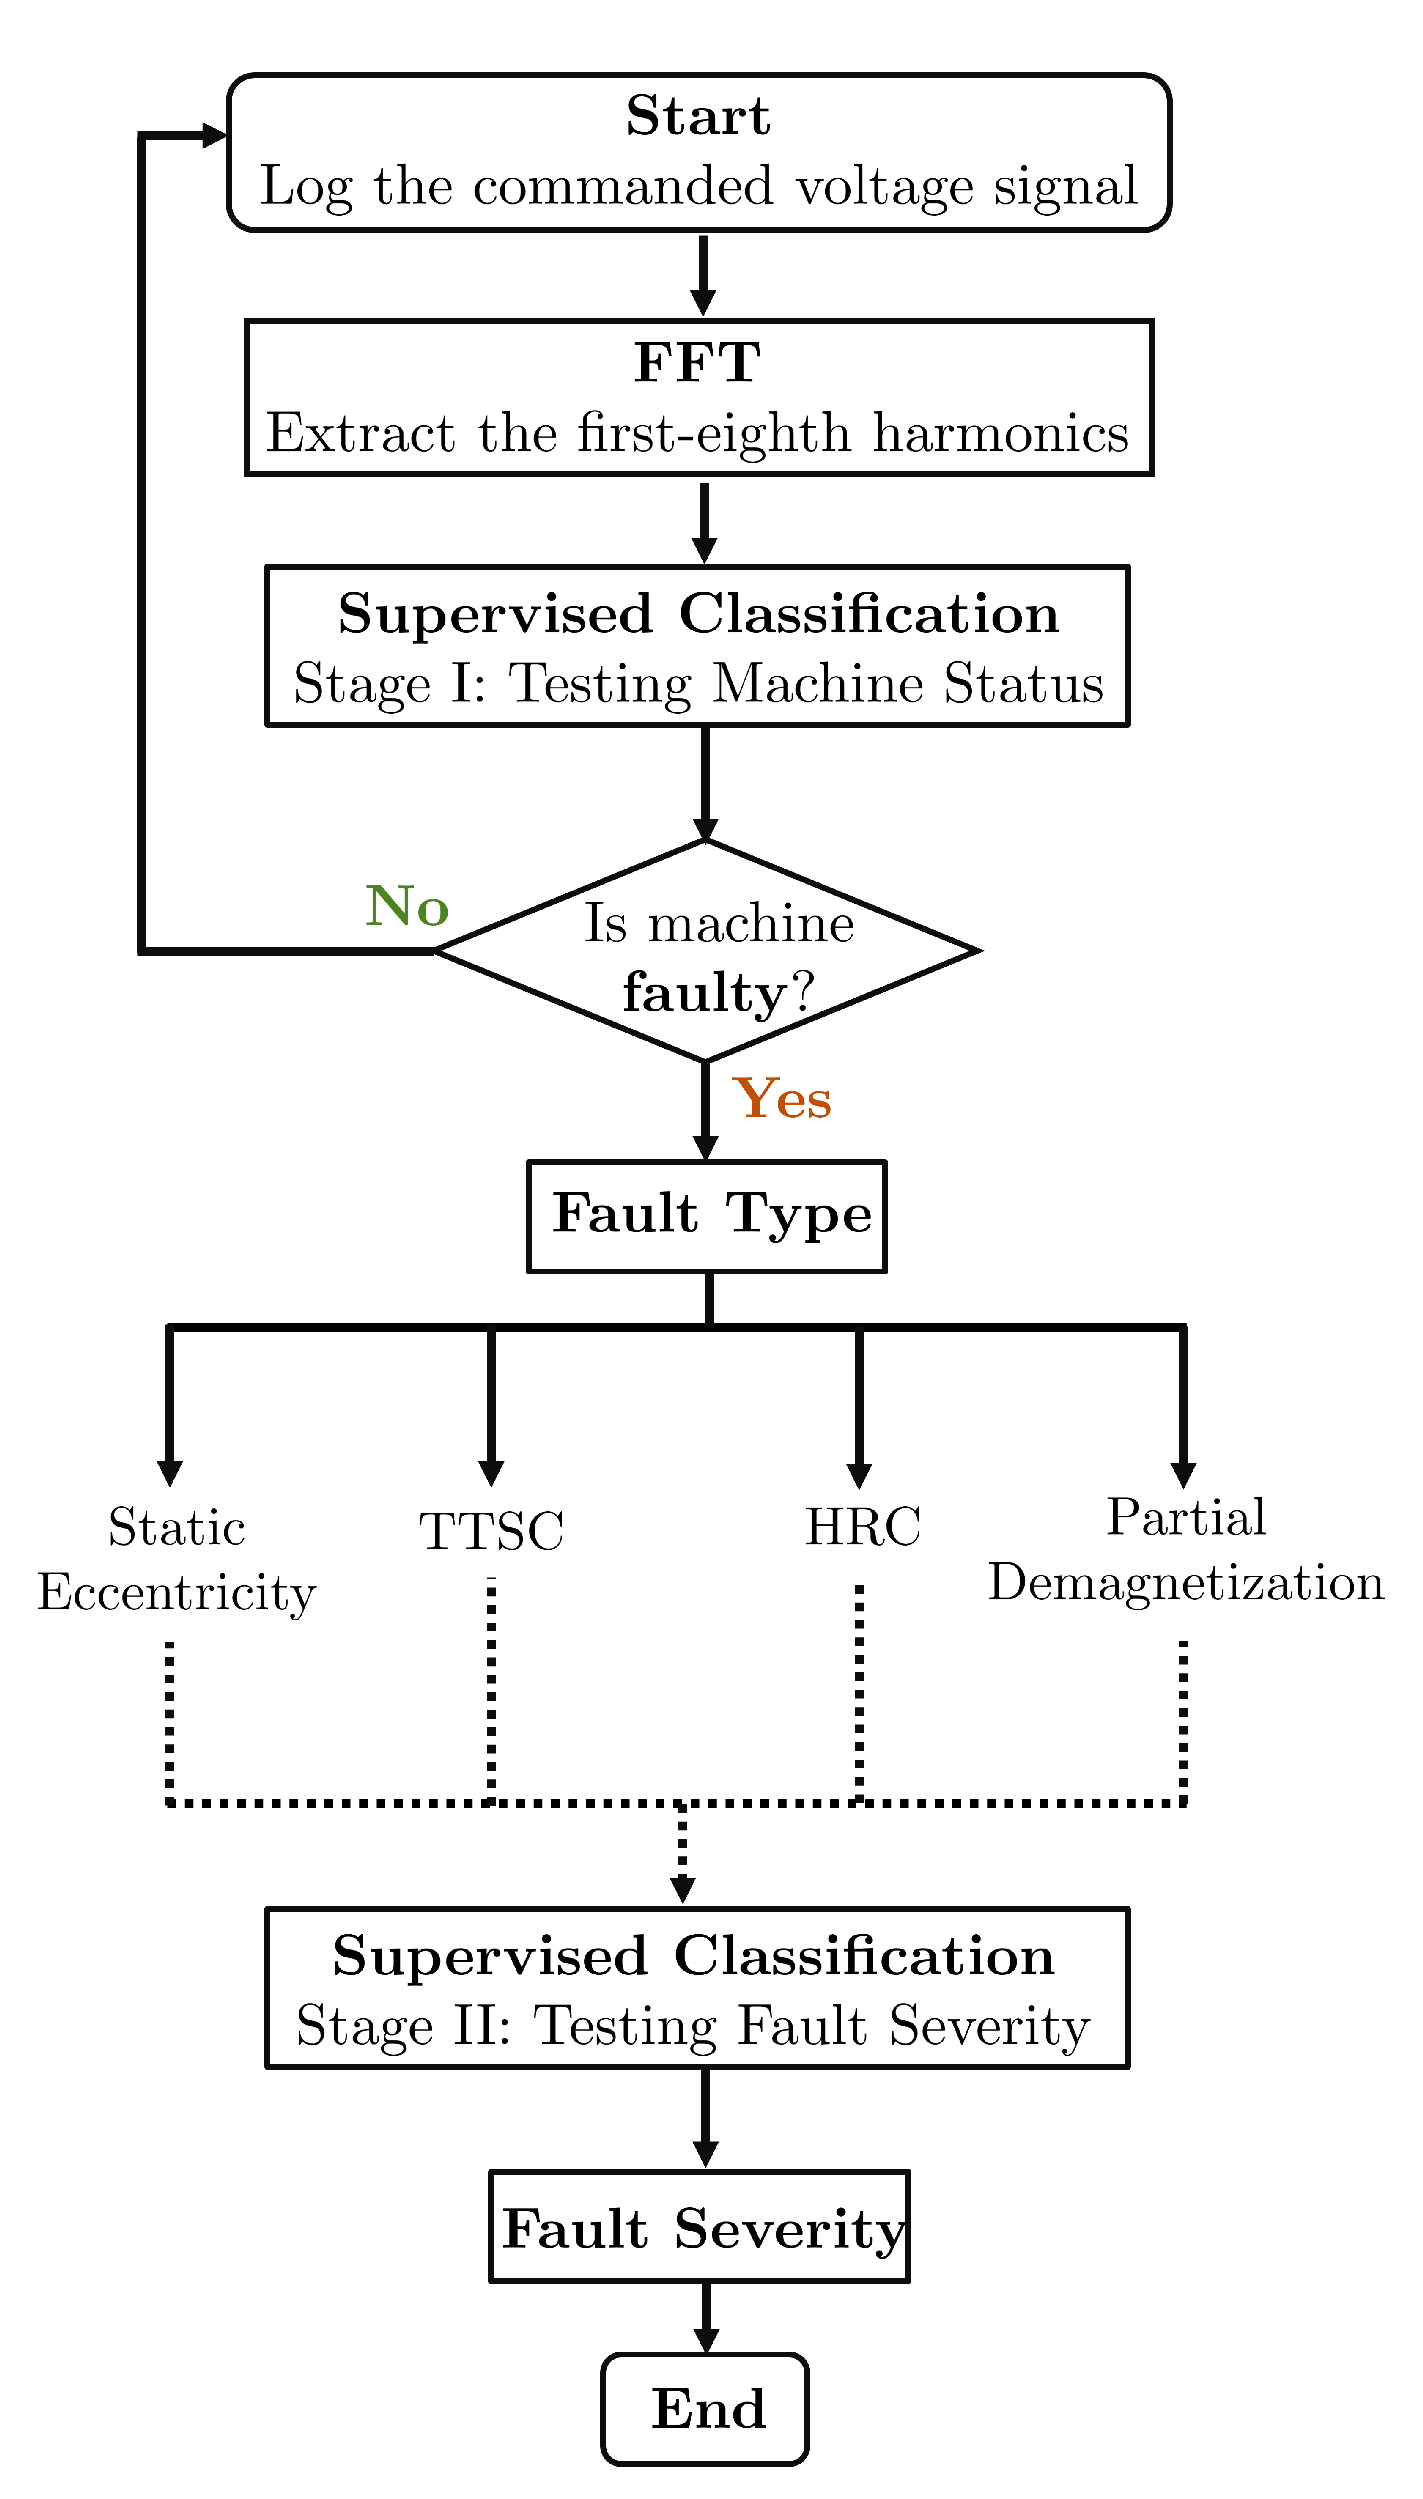
In this section, supervised classification algorithms (LDA, k-NN, and SVM) are compared in regards to their capability in identifying faulty cases, discriminating them, and evaluating their severity. Figure 19 shows the flowchart of the fault detection, separation, and severity estimation algorithm.
In the stage of classification, the amplitude of considered harmonics serves as features for fault occurrence and its severity increase. The number of samples for each machine condition should be greater than the number of features that are utilized for detection in order to ensure that the training of the classifier will eventually converge to a representative classification model [43]. In this work, eight features are used for detection; therefore, ten samples are utilized. Therefore, the speed is adjusted in FEM from 250 rpm up to 700 rpm in 50 rpm increments to obtain representative samples for healthy and faulty conditions. For FOC, the magnitude of the stator current is set to be 10 A at , while the commanded torque in DTC is set at 20 N·m at 0.57 Wb to get the MTPA operation for both controllers. The numerical setup generates from each drive system a total of 140 data samples: 10 for a healthy case, 40 for all severity levels of TTSC fault, 30 for all severity levels of HRC fault, 40 for all severity levels of static eccentricity fault, and 30 for all severity levels of local demagnetization fault.
The first stage of the classification approach is aimed at identifying the fault type at its early level, allowing for the application of appropriate mitigation techniques to avoid any further damage, if possible. The fault severity is monitored using the second stage of the classifiers and the severity estimation could be used to determine remedial actions. Therefore, samples of the faulty cases at the lowest severity are considered only in the training pool to perform fault detection and separation in the first stage. The overall detection accuracy may be determined by averaging the sum of the accuracy of each individual case as the sample size is ten for each case. Table 6 displays the accuracy of identifying and classifying the faults using the classifiers under consideration.
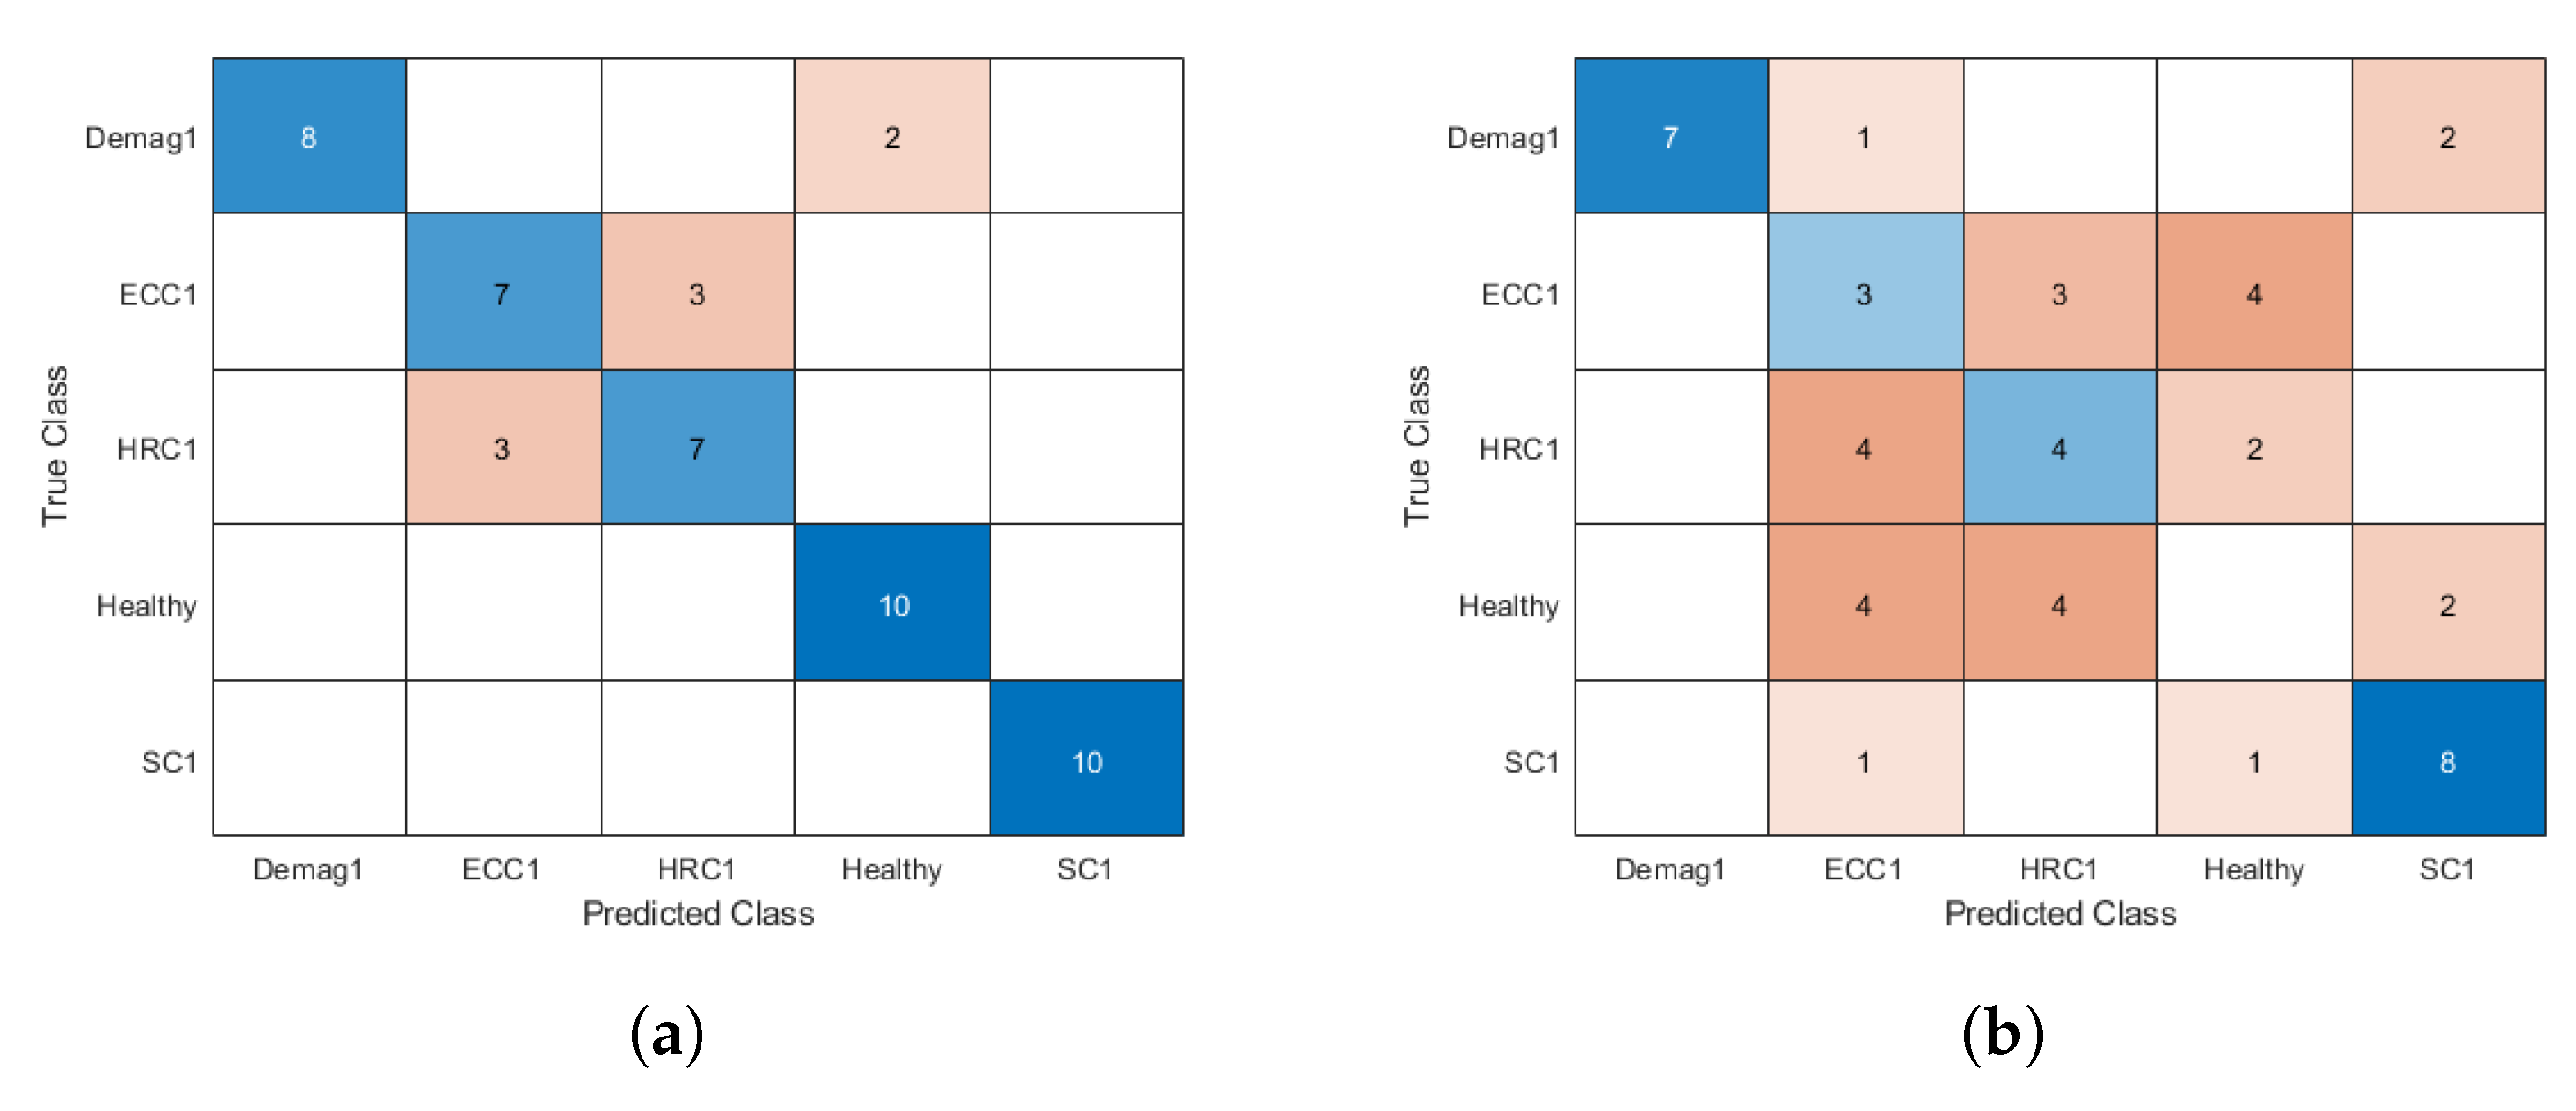
It is clear that the considered classifiers are capable of fault detection and separation using the MVSA approach in FOC-driven PMSM while their overall performance is significantly degraded in case of DTC-driven PMSM. Moreover, in contrast to FOC drives, it can be observed that all classifiers achieve reduced detection accuracy of the healthy machine status in DTC drives. This results in a high number of erroneous indications in DTC drives and unneeded drive shutdowns. Furthermore, in both drives, the SVM classifier has the best detection and separation accuracy. Therefore, it is demonstrated that relying on the MVSA approach for fault diagnosis in DTC drives would result in poor performance and significant amount of false alarms.
Figure 20 provides the confusion matrix of LDA classifier for fault diagnosis to show the false alarms and incorrect classification in FOC and DTC drives.
The accuracy of the fault severity estimation using the LDA and SVM classifiers is shown in Table 7. Once the faulty operation is indicated and fault type is detected from the first stage of the supervised classification, then the second classification stage will be dedicated for severity estimation of the detected fault. Therefore, samples of the detected fault at each severity level are considered in the training pool to perform fault severity estimation.
It can be observed from Table 7 the degradation in the performance of LDA and SVM classifiers for the fault severity estimation when DTC is applied in comparison with FOC. This is related to the earlier mentioned fact of inconsistent changes in the voltage spectrum due to different severity levels of each fault in case of DTC drives. Therefore, further investigation for reliable fault diagnosis is required in DTC-driven PMSMS. It is also important to note that the classification accuracy of the studied approach is directly impacted by the density of the supervised learning. Accuracy may be enhanced by collecting more samples. Furthermore, the investigated method is appropriate for steady-state PMSM operations. Different signal processing techniques may be incorporated to study the PMSM during nonstationary operation. Nevertheless, the incorporation of extra harmonics enables fault recognition, classification, and estimation for TTSC, HRC, static eccentricity, and local demagnetization without the need for additional sensors. This reduces the likelihood of false indication utilizing detection techniques presented in the literature that depend on a single feature for fault diagnosis.
6. Conclusions
The accuracy of the MVSA approach and three supervised classifiers (LDA, k-NN, and SVM) for fault identification and severity estimation in inverter-driven PMSM was investigated. Features used for classifier training to identify fault type and severity were the amplitudes of harmonics in the phase voltage signal. Four faults were addressed: TTSC, HRC, static eccentricity, and local demagnetization. The results show that the studied MVSA diagnostic strategy worked well in FOC-driven PMSM while deteriorating in DTC-driven PMSM. This is due to the compensatory nature of each controller. When FOC drive is applied, there is a consistent correlation between the magnitude variations in the voltage spectrum that are caused by the incidence of faults and the rise in the severity of faults. The utilization of hysteresis comparators and variable switching frequency cause these variations to be inconsistent in the case of DTC-driven PMSM, despite the fact that these features are present. The vast majority of the existing detection and separation methods in the literature for inverter-driven PMSMs were developed either for FOC drives or without addressing the controller type. As a result, when developing fault diagnosis algorithms, the controller type and its impact on fault detectability should be addressed.
Author Contributions
Conceptualization, I.M.A. and S.N.F.; methodology, I.M.A.; software, I.M.A.; validation, I.M.A.; formal analysis, I.M.A.; investigation, I.M.A.; resources, S.N.F.; data curation, I.M.A.; writing—original draft preparation, I.M.A.; writing—review and editing, S.N.F.; visualization, I.M.A.; supervision, S.N.F. All authors have read and agreed to the published version of the manuscript.
Funding
This work was partially funded by Michigan State University (MSU), USA, and the Jordan University of Science and Technology (JUST), Jordan. The APC was funded by Michigan State University (MSU).
Data Availability Statement
Data will be made available on request.
Acknowledgments
Ibrahim M. Allafi sincerely appreciates the Jordan University of Science and Technology (JUST) for sponsoring his graduate studies.
Conflicts of Interest
The authors declare no conflict of interest.
Abbreviations
The following abbreviations are used in this manuscript:
| DTC | Direct Torque Control |
| FEM | Finite Element Model |
| FFT | Fast Fourier Transform |
| FOC | Field Oriented Control |
| HRC | High Resistance Contact |
| k-NN | K-Nearest Neighbor |
| LDA | Linear Discriminate Analysis |
| MCC | Motor Control Center |
| MTPA | Maximum Torque Per Amperes |
| MVSA/MCSA | Machine Voltage or Current Signature Analysis |
| NdFeB | Neodymium-Iron-Boron Magnet |
| NVH | Noise, Vibration, and Harshness |
| PMSM | Permanent Magnet Synchronous Machine |
| SNR | Signal-to-Noise Ratio |
| STFT | Short Time Fourier transform |
| SVM | Support Vector Machines |
| SVPWM | Space Vector Pulse Width Modulation |
| TTSC | Turn-to-Turn Short Circuit |
| VFD | Variable Frequency Drives |
| ZSVC | Zero-Sequence Voltage Component |
References
- Petrov, I.; Egorov, D.; Link, J.; Stern, R.; Ruoho, S.; Pyrhönen, J. Hysteresis Losses in Different Types of Permanent Magnets Used in PMSMs. IEEE Trans. Ind. Electron. 2017, 64, 2502–2510. [Google Scholar] [CrossRef]
- Melfi, M.J.; Evon, S.; McElveen, R. Induction versus permanent magnet motors. IEEE Ind. Appl. Mag. 2009, 15, 28–35. [Google Scholar] [CrossRef]
- Cao, W.; Mecrow, B.C.; Atkinson, G.J.; Bennett, J.W.; Atkinson, D.J. Overview of Electric Motor Technologies Used for More Electric Aircraft (MEA). IEEE Trans. Ind. Electron. 2012, 59, 3523–3531. [Google Scholar] [CrossRef]
- Jung, S.Y.; Mi, C.C.; Nam, K. Torque Control of IPMSM in the Field-Weakening Region With Improved DC-Link Voltage Utilization. IEEE Trans. Ind. Electron. 2015, 62, 3380–3387. [Google Scholar] [CrossRef]
- Choi, S.; Haque, M.S.; Tarek, M.T.B.; Mulpuri, V.; Duan, Y.; Das, S.; Garg, V.; Ionel, D.M.; Masrur, M.A.; Mirafzal, B.; et al. Fault Diagnosis Techniques for Permanent Magnet AC Machine and Drives—A Review of Current State of the Art. IEEE Trans. Transp. Electrif. 2018, 4, 444–463. [Google Scholar] [CrossRef]
- Lee, S.B.; Stone, G.C.; Antonino-Daviu, J.; Gyftakis, K.N.; Strangas, E.G.; Maussion, P.; Platero, C.A. Condition Monitoring of Industrial Electric Machines: State of the Art and Future Challenges. IEEE Ind. Electron. Mag. 2020, 14, 158–167. [Google Scholar] [CrossRef]
- Roux, W.L.; Harley, R.G.; Habetler, T.G. Detecting faults in rotors of PM drives. IEEE Ind. Appl. Mag. 2008, 14, 23–31. [Google Scholar] [CrossRef]
- Wang, B.; Wang, J.; Griffo, A.; Sen, B. Stator Turn Fault Detection by Second Harmonic in Instantaneous Power for a Triple-Redundant Fault-Tolerant PM Drive. IEEE Trans. Ind. Electron. 2018, 65, 7279–7289. [Google Scholar] [CrossRef]
- Mohanraj, D.; Gopalakrishnan, J.; Chokkalingam, B.; Mihet-Popa, L. Critical Aspects of Electric Motor Drive Controllers and Mitigation of Torque Ripple—Review. IEEE Access 2022, 10, 73635–73674. [Google Scholar] [CrossRef]
- Wang, Z.; Chen, J.; Cheng, M.; Chau, K.T. Field-Oriented Control and Direct Torque Control for Paralleled VSIs Fed PMSM Drives With Variable Switching Frequencies. IEEE Trans. Power Electron. 2016, 31, 2417–2428. [Google Scholar] [CrossRef]
- Niu, F.; Wang, B.; Babel, A.S.; Li, K.; Strangas, E.G. Comparative Evaluation of Direct Torque Control Strategies for Permanent Magnet Synchronous Machines. IEEE Trans. Power Electron. 2016, 31, 1408–1424. [Google Scholar] [CrossRef]
- Geyer, T.; Mastellone, S. Model Predictive Direct Torque Control of a Five-Level ANPC Converter Drive System. IEEE Trans. Ind. Appl. 2012, 48, 1565–1575. [Google Scholar] [CrossRef]
- Geyer, T.; Papafotiou, G.; Morari, M. Model Predictive Direct Torque Control—Part I: Concept, Algorithm, and Analysis. IEEE Trans. Ind. Electron. 2009, 56, 1894–1905. [Google Scholar] [CrossRef]
- Haddad, R.Z.; Lopez, C.A.; Foster, S.N.; Strangas, E.G. A Voltage-Based Approach for Fault Detection and Separation in Permanent Magnet Synchronous Machines. IEEE Trans. Ind. Appl. 2017, 53, 5305–5314. [Google Scholar] [CrossRef]
- Zanardelli, W.G.; Strangas, E.G.; Aviyente, S. Identification of Intermittent Electrical and Mechanical Faults in Permanent-Magnet AC Drives Based on Time–Frequency Analysis. IEEE Trans. Ind. Appl. 2007, 43, 971–980. [Google Scholar] [CrossRef]
- Chen, H.; He, J.; Guan, X.; Demerdash, N.A.O.; EL-Refaie, A.M.; Lee, C.H.T. High-Resistance Connection Diagnosis in Five-Phase PMSMs Based on the Method of Magnetic Field Pendulous Oscillation and Symmetrical Components. IEEE Trans. Ind. Electron. 2022, 69, 2288–2299. [Google Scholar] [CrossRef]
- Ebrahimi, B.M.; Faiz, J. Feature Extraction for Short-Circuit Fault Detection in Permanent-Magnet Synchronous Motors Using Stator-Current Monitoring. IEEE Trans. Power Electron. 2010, 25, 2673–2682. [Google Scholar] [CrossRef]
- Ebrahimi, B.M.; Faiz, J.; Roshtkhari, M.J. Static-, Dynamic-, and Mixed-Eccentricity Fault Diagnoses in Permanent-Magnet Synchronous Motors. IEEE Trans. Ind. Electron. 2009, 56, 4727–4739. [Google Scholar] [CrossRef]
- Haddad, R.Z.; Strangas, E.G. On the Accuracy of Fault Detection and Separation in Permanent Magnet Synchronous Machines Using MCSA/MVSA and LDA. IEEE Trans. Energy Convers. 2016, 31, 924–934. [Google Scholar] [CrossRef]
- Allafi, I.M.; Foster, S.N. Fault Detection and Identification for Inverter-Driven Permanent Magnet Synchronous Machines. In Proceedings of the 2021 IEEE 13th International Symposium on Diagnostics for Electrical Machines, Power Electronics and Drives (SDEMPED), Dallas, TX, USA, 22–25 August 2021; Volume 1, pp. 358–364. [Google Scholar] [CrossRef]
- Hang, J.; Ding, S.; Ren, X.; Hu, Q.; Huang, Y.; Hua, W.; Wang, Q. Integration of Interturn Fault Diagnosis and Torque Ripple Minimization Control for Direct-Torque-Controlled SPMSM Drive System. IEEE Trans. Power Electron. 2021, 36, 11124–11134. [Google Scholar] [CrossRef]
- Hang, J.; Wu, H.; Ding, S.; Hua, W.; Wang, Q. A DC-Flux-Injection Method for Fault Diagnosis of High-Resistance Connection in Direct-Torque-Controlled PMSM Drive System. IEEE Trans. Power Electron. 2020, 35, 3029–3042. [Google Scholar] [CrossRef]
- Allafi, I.M.; Foster, S.N. On the Accuracy of Frequency Based Fault Diagnosis for DTC-driven PMSM. In Proceedings of the 2022 International Conference on Electrical Machines (ICEM), Valencia, Spain, 5–8 September 2022; pp. 1628–1634. [Google Scholar] [CrossRef]
- Allafi, I.M.; Foster, S.N. Condition Monitoring of Direct Torque Controlled Permanent Magnet Synchronous Machines. In Proceedings of the 2022 IEEE Energy Conversion Congress and Exposition (ECCE), Detroit, MI, USA, 9–13 October 2022; pp. 1–7. [Google Scholar] [CrossRef]
- Qiu, X.; Ji, J.; Zhou, D.; Zhao, W.; Chen, Y.; Huang, L. A Modified Flux Observer for Sensorless Direct Torque Control of Dual Three-Phase PMSM Considering Open-Circuit Fault. IEEE Trans. Power Electron. 2022, 37, 15356–15369. [Google Scholar] [CrossRef]
- Wang, Z.; Wang, X.; Cao, J.; Cheng, M.; Hu, Y. Direct Torque Control of T-NPC Inverters-Fed Double-Stator-Winding PMSM Drives With SVM. IEEE Trans. Power Electron. 2018, 33, 1541–1553. [Google Scholar] [CrossRef]
- Wang, X.; Wang, Z.; Cheng, M.; Hu, Y. Remedial Strategies of T-NPC Three-Level Asymmetric Six-Phase PMSM Drives Based on SVM-DTC. IEEE Trans. Ind. Electron. 2017, 64, 6841–6853. [Google Scholar] [CrossRef]
- Strangas, E.G.; Clerc, G.; Razik, H.; Soualhi, A. Applications and Specifics. In Fault Diagnosis, Prognosis, and Reliability for Electrical Machines and Drives; Wiley-IEEE Press: Piscataway, NJ, USA, 2022; pp. 125–344. [Google Scholar] [CrossRef]
- Zhao, J.; Guan, X.; Li, C.; Mou, Q.; Chen, Z. Comprehensive Evaluation of Inter-Turn Short Circuit Faults in PMSM Used for Electric Vehicles. IEEE Trans. Intell. Transp. Syst. 2021, 22, 611–621. [Google Scholar] [CrossRef]
- Thorsen, O.; Dalva, M. A survey of faults on induction motors in offshore oil industry, petrochemical industry, gas terminals, and oil refineries. IEEE Trans. Ind. Appl. 1995, 31, 1186–1196. [Google Scholar] [CrossRef]
- Hong, J.; Park, S.; Hyun, D.; Kang, T.j.; Lee, S.B.; Kral, C.; Haumer, A. Detection and Classification of Rotor Demagnetization and Eccentricity Faults for PM Synchronous Motors. IEEE Trans. Ind. Appl. 2012, 48, 923–932. [Google Scholar] [CrossRef]
- Espinosa, A.G.; Rosero, J.A.; Cusidó, J.; Romeral, L.; Ortega, J.A. Fault Detection by Means of Hilbert–Huang Transform of the Stator Current in a PMSM With Demagnetization. IEEE Trans. Energy Convers. 2010, 25, 312–318. [Google Scholar] [CrossRef]
- Yao, H.; Yan, Y.; Shi, T.; Zhang, G.; Wang, Z.; Xia, C. A Novel SVPWM Scheme for Field-Oriented Vector-Controlled PMSM Drive System Fed by Cascaded H-Bridge Inverter. IEEE Trans. Power Electron. 2021, 36, 8988–9000. [Google Scholar] [CrossRef]
- Nam, K.H. AC Motor Control and Electrical Vehicle Applications, 2nd ed.; CRC PRESS: Boca Raton, FL, USA, 2018. [Google Scholar]
- Cintron-Rivera, J.G.; Babel, A.S.; Montalvo-Ortiz, E.E.; Foster, S.N.; Strangas, E.G. A simplified characterization method including saturation effects for permanent magnet Machines. In Proceedings of the 2012 XXth International Conference on Electrical Machines, Marseille, France, 2–5 September 2012; pp. 837–843. [Google Scholar] [CrossRef]
- Babel, A.S.; Cintron-Rivera, J.G.; Foster, S.N.; Strangas, E.G. Evaluation of a Parameter Identification Method for Permanent Magnet AC Machines Through Parametric Sensitivity Analysis. IEEE Trans. Energy Convers. 2014, 29, 240–249. [Google Scholar] [CrossRef]
- Zhong, L.; Rahman, M.; Hu, W.; Lim, K. Analysis of direct torque control in permanent magnet synchronous motor drives. IEEE Trans. Power Electron. 1997, 12, 528–536. [Google Scholar] [CrossRef]
- Untaroiu, C.D.; Adam, T.J. Performance-Based Classification of Occupant Posture to Reduce the Risk of Injury in a Collision. IEEE Trans. Intell. Transp. Syst. 2013, 14, 565–573. [Google Scholar] [CrossRef]
- Ibraheem, I. Linear and Quadratic Classifier to Detection of Skin Lesions “Epicutaneus”. In Proceedings of the 2011 5th International Conference on Bioinformatics and Biomedical Engineering, Wuhan, China, 10–12 May 2011; pp. 1–5. [Google Scholar] [CrossRef]
- Ali, M.Z.; Shabbir, M.N.S.K.; Liang, X.; Zhang, Y.; Hu, T. Machine Learning-Based Fault Diagnosis for Single- and Multi-Faults in Induction Motors Using Measured Stator Currents and Vibration Signals. IEEE Trans. Ind. Appl. 2019, 55, 2378–2391. [Google Scholar] [CrossRef]
- Cortes, C.; Vapnik, V. Support-vector networks. Mach. Learn. 1995, 20, 273–297. [Google Scholar] [CrossRef]
- Cintron-Rivera, J.G.; Foster, S.N.; Strangas, E.G. Mitigation of turn-to-turn faults in fault tolerant permanent magnet synchronous motors. IEEE Trans. Energy Convers. 2015, 30, 465–475. [Google Scholar] [CrossRef]
- Martinez, A.; Kak, A. PCA versus LDA. IEEE Trans. Pattern Anal. Mach. Intell. 2001, 23, 228–233. [Google Scholar] [CrossRef] [Green Version]
Figure 1.
Stator current regulation loop in FOC drive.

Figure 2.
Torque and flux regulation loop in DTC drive.

Figure 3.
The electromagnetic simulation of studied PMSM machine: (a) FEM of the studied machine and (b) Mesh of the machine model.
Figure 3.
The electromagnetic simulation of studied PMSM machine: (a) FEM of the studied machine and (b) Mesh of the machine model.

Figure 4.
The MTPA profile of the driven PMSM: (a) In FOC drives and (b) In DTC drives.

Figure 5.
TTSC fault simulation in the PMSM model.

Figure 6.
Electrical model of inverter-driven PMSM with HRC fault in phase B.

Figure 7.
Shift direction of the static eccentricity fault.

Figure 8.
Demagnetized magnets.

Figure 9.
The commanded voltage of phase A in FOC drive.

Figure 10.
Variations in the harmonic content of stator voltage spectrum for healthy and faulty machine under TTSC fault in FOC drive.
Figure 10.
Variations in the harmonic content of stator voltage spectrum for healthy and faulty machine under TTSC fault in FOC drive.

Figure 11.
Variations in the harmonic content of stator voltage spectrum for healthy and faulty machine under HRC fault in FOC drive.
Figure 11.
Variations in the harmonic content of stator voltage spectrum for healthy and faulty machine under HRC fault in FOC drive.

Figure 12.
Variations in the harmonic content of stator voltage spectrum for healthy and faulty machine under eccentricity fault in FOC drive.
Figure 12.
Variations in the harmonic content of stator voltage spectrum for healthy and faulty machine under eccentricity fault in FOC drive.

Figure 13.
Variations in the harmonic content of stator voltage spectrum for healthy and faulty machine under demagnetization fault in FOC drive.
Figure 13.
Variations in the harmonic content of stator voltage spectrum for healthy and faulty machine under demagnetization fault in FOC drive.

Figure 14.
The commanded voltage of phase A in DTC drive.

Figure 15.
Variations in the harmonic content of stator voltage spectrum for healthy and faulty machine under TTSC fault in DTC drive.
Figure 15.
Variations in the harmonic content of stator voltage spectrum for healthy and faulty machine under TTSC fault in DTC drive.

Figure 16.
Variations in the harmonic content of stator voltage spectrum for healthy and faulty machine under HRC fault in DTC drive.
Figure 16.
Variations in the harmonic content of stator voltage spectrum for healthy and faulty machine under HRC fault in DTC drive.

Figure 17.
Variations in the harmonic content of stator voltage spectrum for healthy and faulty machine under eccentricity fault in DTC drive.
Figure 17.
Variations in the harmonic content of stator voltage spectrum for healthy and faulty machine under eccentricity fault in DTC drive.

Figure 18.
Variations in the harmonic content of stator voltage spectrum for healthy and faulty machine under demagnetization fault in DTC drive.
Figure 18.
Variations in the harmonic content of stator voltage spectrum for healthy and faulty machine under demagnetization fault in DTC drive.

Figure 19.
Flowchart of fault detection, separation, and severity estimation algorithm.

Figure 20.
Confusion matrix of LDA classifier for fault diagnosis for: (a) FOC drives and (b) DTC drives.
Figure 20.
Confusion matrix of LDA classifier for fault diagnosis for: (a) FOC drives and (b) DTC drives.


Table 1.
Nameplate data of the studied PMSM.
| Machine Specification | Symbol | Value | Machine Specification | Symbol | Value |
|---|---|---|---|---|---|
| Pole pairs | 5 | d-axis inductance | 31.3 mH | ||
| Slots | Q | 12 | q-axis inductance | 62.4 mH | |
| Turns per slot | 150 | Mutual inductance | ≈0 H | ||
| Air gap length | g | 1 mm | Rated phase current | 18 A | |
| Residual flux density | 1.2 T | Rated line voltage | 480 V | ||
| Magnet flux linkage | 287 mWb | Rated torque | 65 N·m | ||
| Phase resistance | 1.5 | Rated speed | 800 rpm |
Table 2.
Severity levels of TTSC fault.
| Case | ||
|---|---|---|
| SC1 | 15 | 0.5 |
| SC2 | 15 | 0.25 |
| SC3 | 30 | 0.5 |
| SC4 | 30 | 0.25 |
Table 3.
Severity levels of HRC fault.
| Case | |
|---|---|
| HRC1 | 50% |
| HRC2 | 100% |
| HRC3 | 150% |
Table 4.
Severity levels of static eccentricity fault.
| Case | |
|---|---|
| ECC1 | 10% |
| ECC2 | 40% |
| ECC3 | 60% |
| ECC4 | 80% |
Table 5.
Severity levels of demagnetization fault.
| Case | Severity |
|---|---|
| Demag1 | One Magnet |
| Demag2 | Two Adjacent Magnets |
| Demag3 | Three Nonadjacent Magnets |
Table 6.
Detection accuracy using MVSA approach for FOC- and DTC-driven PMSM.
| Case | FOC | DTC | ||||
|---|---|---|---|---|---|---|
| LDA | k-NN | SVM | LDA | k-NN | SVM | |
| Healthy | 100% | 100% | 97.5% | 0% | 0% | 50% |
| TTSC | 100% | 100% | 100% | 80% | 70% | 75% |
| HRC | 70% | 100% | 80% | 40% | 40% | 67.5% |
| Eccentricity | 70% | 100% | 97.5% | 30% | 50% | 57.5% |
| Demagnetization | 80% | 70% | 87.5% | 70% | 40% | 80% |
| Overall | 84% | 94% | 92.5% | 44% | 42% | 66% |
Table 7.
The accuracy of fault severity estimation using MVSA approach for FOC- and DTC-driven PMSM.
Table 7.
The accuracy of fault severity estimation using MVSA approach for FOC- and DTC-driven PMSM.
| Fault Type | FOC | DTC | ||
|---|---|---|---|---|
| LDA | SVM | LDA | SVM | |
| TTSC | 85% | 97.5% | 42.5% | 64.167% |
| SC1 | 100% | 100% | 50% | 63.333% |
| SC2 | 100% | 100% | 40% | 66.667% |
| SC3 | 80% | 93.333% | 30% | 66.667% |
| SC4 | 60% | 96.667% | 50% | 60% |
| HRC | 96.667% | 86.667% | 30% | 38.333% |
| HRC1 | 100% | 100% | 30% | 35% |
| HRC2 | 90% | 80% | 20% | 30% |
| HRC3 | 100% | 100% | 40% | 50% |
| Eccentricity | 100% | 100% | 30% | 62.5% |
| ECC1 | 100% | 100% | 20% | 53.333% |
| ECC2 | 100% | 100% | 20% | 53.333% |
| ECC3 | 100% | 100% | 40% | 70% |
| ECC4 | 100% | 100% | 40% | 73.333% |
| Demagnetization | 86.667% | 71.667% | 46.667% | 56.667% |
| Demag1 | 100% | 100% | 80% | 75% |
| Demag2 | 90% | 50% | 20% | 55% |
| Demag3 | 70% | 60% | 40% | 40% |
Disclaimer/Publisher’s Note: The statements, opinions and data contained in all publications are solely those of the individual author(s) and contributor(s) and not of MDPI and/or the editor(s). MDPI and/or the editor(s) disclaim responsibility for any injury to people or property resulting from any ideas, methods, instructions or products referred to in the content. |
© 2023 by the authors. Licensee MDPI, Basel, Switzerland. This article is an open access article distributed under the terms and conditions of the Creative Commons Attribution (CC BY) license (https://creativecommons.org/licenses/by/4.0/).
Share and Cite
MDPI and ACS Style
Allafi, I.M.; Foster, S.N. Condition Monitoring Accuracy in Inverter-Driven Permanent Magnet Synchronous Machines Based on Motor Voltage Signature Analysis. Energies 2023, 16, 1477. https://0-doi-org.brum.beds.ac.uk/10.3390/en16031477
AMA Style
Allafi IM, Foster SN. Condition Monitoring Accuracy in Inverter-Driven Permanent Magnet Synchronous Machines Based on Motor Voltage Signature Analysis. Energies. 2023; 16(3):1477. https://0-doi-org.brum.beds.ac.uk/10.3390/en16031477
Chicago/Turabian StyleAllafi, Ibrahim M., and Shanelle N. Foster. 2023. "Condition Monitoring Accuracy in Inverter-Driven Permanent Magnet Synchronous Machines Based on Motor Voltage Signature Analysis" Energies 16, no. 3: 1477. https://0-doi-org.brum.beds.ac.uk/10.3390/en16031477
Note that from the first issue of 2016, this journal uses article numbers instead of page numbers. See further details here.