
Smart Energy Meters for Smart Grids, an Internet of Things Perspective
by
 , and
, and
Yousaf Murtaza Rind
,
Muhammad Haseeb Raza
,
Muhammad Zubair
,
Muhammad Qasim Mehmood
and
Yehia Massoud
* Innovative Technologies Laboratories (ITL), King Abdullah University of Science and Technology (KAUST), Thuwal 23955-6900, Saudi Arabia
*
Author to whom correspondence should be addressed.
Energies 2023, 16(4), 1974; https://0-doi-org.brum.beds.ac.uk/10.3390/en16041974
Submission received: 15 January 2023
/
Revised: 7 February 2023
/
Accepted: 11 February 2023
/
Published: 16 February 2023
Abstract
:Smart energy has evolved over the years to include multiple domains integrated across multiple technology themes, such as electricity, smart grid, and logistics, linked through communication technology and processed in the cloud in a holistic way to deliver on global challenges. Advances in sensing, communication, and computation technologies have been made that enable better smart system implementations. In smart energy systems, sensing technologies have spanned multiple domains with newer techniques that are more accurate, have greater dynamic ranges, and are more reliable. Similarly, communication techniques have now evolved into very high-speed, flexible, and dynamic systems. Computation techniques have seen a quantum leap with greater integration, powerful computing engines, and versatile software stacks that are easily available and modifiable. Finally, the system integration has also seen advances in the form of management, automation, and analytics paradigms. Consequently, smart energy systems have witnessed a revolutionary transformation. The complexity has correspondingly grown exponentially. With regard to smart meters, the measurement component has to scale up to meet the demands of the evolved energy eco-system by relying on the advancements offered. The internet of things (IoT) is a key technology enabler in this scenario, and the smart meter is a key component. In recent years, metering technology has evolved in both complexity and functionality. Therefore, it must use the advances offered by IoT to deliver a new role. The internet of things (IoT) is a key technology enabler in this scenario and the smart meter a key component. In recent years, metering technology has evolved in both complexity and functionality. To deliver on its new role, it must use the advances offered by IoT. In this review, we analyze the smart meter as a combination of sensing, computing, and communication nodes for flexible and complex design paradigms. The components are, in turn, reviewed vis-à-vis the advances offered by IoT. The resultant gaps are reported for future design challenges in the conclusion. The identified gaps are the lack of usage of the full spectrum of the available technology and the lack of an inter-disciplinary approach to smart meter design.
1. Introduction
Energy is the core component of the modern world. To increase the efficiency and functionality of the energy, information, and communication technologies (ICT), integration has been key driver. Energy is a complex, multi-layered, and multi-dimensional field and so is the integration of ICT, which has led to the field of smart energy. The smart energy paradigm has evolved over the years to include many technologies, such as the smart grid, automated metering infrastructure, asset management, energy mix, renewable energy, cross-sectoral control, and integration, as in fuel logistics scheduling, etc. The term “smart energy” has been used with a variety of meanings, but it conveys the paradigm shift from a single-sector approach [1]. The review in [1] has pointed out several uses of the term smart energy and grouped them into two classes, in which the first group is primarily focused on smart grids and then on their extensions, such as cross-sector control and simulation [2] and heating systems efficiency [3], whereas the papers in the second group focus on cross-sectoral integration, as in [4], a component of a more complex interactive system of systems [5], or a component in renewable energy integration [6]. These scenarios represent a paradigm shift in systems thinking regarding energy.
Smart energy now represents cross-sectoral integration, control, and optimization [7], which ultimately increase efficiency and enable hitherto unprecedented functionality, such as enabling smarter living [8], human centered development [9], etc. In such an evolved and diverse system of systems, the components that enable the functionality also evolve and need more functionality, are more integrated in the sense of connectivity, and are more intelligent [10]. The characteristics stem from the fact that the integrated whole is greater than the sum of the parts. More functionality is required as each node or component now must gather more information; greater integration is required because of the greater demand on the information flow, both in terms of content and destinations; and finally, intelligence is required to manage the complexity and to enable novel functionality. Thus, each component of the complex system, such as smart energy, must evolve as well. Smart energy components include generation, distribution, metering, computing, communication, etc. The scenario is presented in Figure 1, which represents smart energy and its semantics at the center, connecting to different domains and functions in the energy paradigm.
Metering is an important functionality of smart energy systems and enables an accurate state estimation [11] of the system. The smart meter is one of a core component in modern energy systems and enables the metering functionality. Typically, a smart meter consists of sensing, computation, and communication subsystems. Each of the components is usually defined for the energy sector in which the meter is to be operated. For the scenario of smart energy, however, an increasing level of integration is required. Computation and communication technologies have evolved at lightning pace over the years, driven by Moore’s law and the insatiable drive for software and communication technologies to be ahead of the transistor count, no what matter the numbers [12]. This has led to the miniaturization of the computational footprint, enhanced functionality, and the increased speed of the communication, leading to complex designs and a multiplicity of tasks for computational platforms, which have evolved, in modern times, from simple microcontrollers to sophisticated single-board computers for the embedded realm in which the smart meter’s design happens. Consequently, the possibilities of the operational framework have also been extended, and simple measurement and reporting have given way to advanced AI-based designs for various advanced features, such as tampering detection, non-intrusive load monitoring, peak shaving, grid estimation, etc. Thus, the architecture and design of the smart meter have become varied because of the application needs that vary over the functional domains. In a similar vein, the evolution of computational hardware brings with it the flexibility and the resultant complexity in the configuration and software. To review the computational infrastructure in the smart meter, it is again pertinent to compare it with the evolution of computational devices, making it possible to point out the obvious gaps and the missed opportunities. Communication systems have evolved to the point of a paradigm shift. With the introduction of 5G, hitherto un-explored concepts have made their way into cellular communications, opening new paradigms, especially in configurability and programmability, which can be optimized on the fly according to the underlying situation and application. Integrating such communication facilities into smart meters can open new vistas in applications. Finally, the complexity of the underlying hardware has led to the introduction of software stacks to simplify the development and operation of the sensing node. These include operating systems, development environments, cross-chain development setups, programming languages and runtimes, special purpose libraries, and stacks for communication protocols, which make the increasingly complex tasks of developing an IoT-based node simpler. A review of such tools in the field of smart meters is warranted owing to the increasing complexity and broad application spectrum. The nature of the smart meter and its functionality in smart energy are presented in Figure 2.
While the smart meter has to evolve from a simple reading and reporting design and there are numerous application scenarios which rely on the integration of the sensing of different energy variables, computation, and communication technologies at the smart metering level, there is a lack of a review that presents an integrated and holistic state of the art in the smart metering paradigm. Table 1 lists the different reviews on smart meters and the applications. Though the list is not exhaustive, it is indeed a representative one, and in general, the reviews report either a single technology or an application.
These factors warrant an overview of the advancement of the underlying technology vis-à-vis the current and the prospective applications that are or can be enabled by such an advance. While there are numerous papers that review the smart meters, measurement technologies, edge applications for smart metering, communication protocols and interfaces, software stacks, and computation hardware for IoT and, to some extent, for smart meters, a holistic review that sets each of the components in the context of smart metering for smart energy is lacking, to the best of our knowledge. With this review, the intention is to bridge this gap.
In this review, an overview of the architectural composition of the different solutions for the smart meter reported in the literature is presented. The main aim is to follow the evolution of the functionality and the capability of the smart meter, predict the trajectory for future designs and, most essentially, point out the unexplored opportunities presented by the advancement of the underlying technologies. At a fundamental level the smart meter consists of sensing circuitry, a data logging and reporting interface, and a communication interface. In the following sections, we review each of the components in turn in the setting presented here. The paradigm of smart energy has evolved to include electricity, heat, and gas. While most of the smart meters are focused on electricity measurement, it is pertinent to review other sensing circuitries and their integration in the smart meter as well. In Section 2, we review the different sensing techniques. Section 3 reviews the hardware/software platforms and communication systems for the IoT domain and their implementation status for the smart meters. Section 4 concludes the review by presenting a brief outline of the several opportunities available in the current technology landscape for smart meters.
2. Sensing Techniques
Sensing systems for smart meters measure the energy being consumed. Depending upon the type and usage of the energy supplied, the sensing systems are of varied types; however, the most common types of measured variables in the energy domain are electricity, heat, and gas, with electricity being the most common; heat, in most cases, is a derived variable from either the electric or the gas supply, but due to its impact, it is usually measured separately. In some cases, it is the heat that is directly being supplied to the consumer, with district heating in different European countries being a prime example [43]. While an integrated smart meter to measure all the quantities has not been reported, individually these variables are increasingly being measured, monitored, processed, and controlled for smart energy scenarios [44]. Currently, an integrated application scenario is also not being implemented at the physical level; rather, these variables are processed at a higher level of integration and abstraction, typically at the applications layer and in the cloud [45,46], leading to the obstruction of the working mechanism, which might translate to data underutilization and other data collection artifacts. Smart meter designers usually think of measurement technique as an external factor, which is exemplified by the fact that most of the smart meter research takes off the shelf components, whereas in industry different types of meters in different scenarios result in different designs. This points to the fact that the sensing technique is an important factor in the overall design which is often overlooked in the reviews and research. Thus, to make smart meters more relevant and integrated, the review is presented for each type of energy supply sensing technique in the following section. The smart meter as a physical node is described in Figure 3.
2.1. Heat Meters
The thermal energy or heat is measured by integrating the flow of the liquid with the differential temperature of the fluid that supplies or removes heat. A basic sensing of the heat supplied or removed is obtained by multiplying the fluidic mass flow by the specific heat and the temperature difference between the supplied and the return fluid. Heat supply systems use either steam or some other fluid, with fluidic systems becoming more commonplace. The temperature difference is measured using a temperature sensor, while the flow is measured using either a dynamic or a static technique. Dynamic techniques use a moving mechanical part such as an impeller or a turbine to measure the mass flow, whereas static meters use electronic techniques, with the most common being ultrasonic and magnetic induction. Heat flux meters are also becoming commonplace in modern building systems to measure the heat flow across the insulation for better control of environmental temperature.
The heat meters have been extensively researched and designed. The earliest works on measuring latent heat using mechanical flow meters, such as impellers and rotary wing sensors, are carried out in [47,48,49]. The ultrasonic meter for measuring flow in heat meters is reported in [50]; it corrected the errors induced due to temperature variations, resulting in increased dynamic range for heat flux measurements. Furthermore, in [51] the authors proposed a method to increase the range of heat meters. Thin film-based heat flux meters are discussed in [52]. The parametric study of different aspects of the design and operation of heat meters is also discussed in the literature. Ref. [53] carried out a theoretical study on the conditions of the minimum error of the heat flux meters. Ref. [50] discusses the design trade-off of small thickness/width ratios for the heat flux meters. Ref. [54] reviews the effect of installation conditions on the working of heat flux meters. Ref. [55] reviews the temperature-sensing techniques in heat flow measurements. Refs. [56,57] review the techniques for heat flux measurement with regard to the theoretical and developmental aspects for different applications. These reviews are somewhat dated, but the techniques detailed by them are still pertinent and are still being used in the heat flow measurements. Based on the solid theoretical framework, there is an abundance of practically built heat flow meters, ranging from simple ones to electronically integrating meters. Ref. [58] designed a simple heat flow meter using off-the-shelf electronics component. Though the efficiency has not been compared to commercially available solutions, the meter is functioning, cheap, and reliable. Ref. [59] added communication capability for automated reading. Ref. [60] designed a heat exchanger-based heat flow meter that uses mechanical parts in static configuration. Refs. [61,62] use electronic circuits for the flow calculation and compensation of related perturbations, increasing the reliability of the electronics-based systems. Ref. [63] uses a non-magnetic electronic flow calculation technique for heat meters for increased robustness against perturbations in flow, liquid compression, and rapid temperature changes. Heat flux meter designs are reported in [64], which uses silicon to measure heat flux, and [65], which implements a thin film-based heat flux meter. With the existence of strong theoretical literature, varied implementations, and real-world usage, several standards have been developed for heat metering, such as those in [66,67,68,69]. The list is of course not exhaustive but is a representative one which covers the ground of the research, implementation, and standards in heat metering and is indicative of the importance in the smart energy scene. The integration of the heating system in the business intelligence and middleware integration is not commonly reported, and the diversity of techniques hinted at is not reflected in these scenarios. It is pertinent to measure the impact of perturbations and the installation techniques at a higher level of integrations and to include the heating as a component in smart energy scenarios. Table 2 reviews the different types of heat meters presented above.
2.2. Gas Meters
In smart energy domains, gas meters are used to measure the total volume of gaseous fuel delivered by a system that is usually held at constant pressure. Gas measurements are usually difficult as the volumetric readings from the flow measurements are cumbersome and prone to error due to the dependence of the volume on temperature and pressure [70]. Flow metering is a very active research area, and numerous techniques have been developed and reported, but there are very few commercially deployed techniques [71] due to the strict nature of the legal and commercial standards. A brief review of the commonly used gas flow metering techniques is provided in Table 3, which includes dynamic and static meters. Dynamic meters include diaphragm-based meters and mechanical rotatory measuring device-based flow meters. Diaphragm-based flow meters are the most common, with the greatest consumer and industrial installation base; they are robust and reasonably accurate, especially for the energy gases. Greater accuracy and range could be achieved using mechanically precision-machined rotatory meters that measure the speed of the gas flow [72] and infer the volumetric flow rate. Dynamic meters are prone to wear, tear, measurement drifts, and limited response speeds. Static meters use measurement processes that do not require the movement of measuring elements for the flow measurement, such as ultrasonic meters and Coanda effect meters; hence, they are more robust with regard to errors, wear, tear, and fatigue, resulting in better performance, longevity, and smaller size [70].
The Coanda effect is the preferential nature of the fluid jet towards the stable solid surface, which is employed in gas meteorology by making a gas jet flow in the chamber with feedback, resulting in induced oscillations whose frequency can be measured by a piezoelectric sensor, for example, which is proportional to the gas flow [73]. These meters are commonly known as fluidic oscillator meters [74] and include feedback oscillator and target fluidic oscillator meters [75]. Other types of fluidic flow meters are vortex shedding [76], which is the oscillation when a fluid flows past a bluff, and vortex whistle meters [77], which measure the frequency of sound generated as the gas passes through the cylinder downstream, in the cylindrical cavity that is tangentially connected to the inlet. Another commonly used static flowmeter is the ultrasonic flow meter, which uses the difference of frequency of the ultrasound waves travelling along and opposite to the flow of the gas [78]. Ultrasound meters are not commonly employed in domestic and industrial fuel gas measurements due to the cost, complexity, and dynamic range, but are finding increasing applications in metrology [79]. Another type of static meter is the Coriolis meter, which uses oscillating tubes, whose oscillations vary with the variation of the mass flow, thus directly measuring mass flow instead of using volumetric flow [80]; this makes the Coriolis meter arguably the most accurate meter in flow measurement, with a long life [81] and wide industrial usage in the food, beverage, and chemical sectors [82], and it is now finding increasing usage in domestic metrology [83]. Finally, several international organizations have drafted gas metrology standards for domestic and commercial installations, such as the OIML reference document R-137 part 1 and 2, which specifies the requirements and technical guidelines for domestic gas metrology.
Based on the designs, several implementations have been reported in the literature. Two types of domestic gas meters using a mechanical sensor fitted with an electronic index and an ultrasonic mechanism with temperature compensation are reported in [84], where both of these meters are fitted with an electronic communication mechanism for smart metering. A radio module for automatic reading is reported in [85]; it interfaces with the pulse interface of the gas meter to transmit the volume consumed. One of the earliest ultrasound meters is designed in [86] for domestic application. A high-resolution retrofit module for a mechanical meter is designed in [87]; it uses an encoder with 90 pulses per revolution for measuring the gas usage at finer scales. An ultrasonic domestic meter is developed and tested in [88] for industrial scale productions. An application note describing the design of a simple fluid flow meter is given in [89]; it can be built at lower cost and, hence, can be used frequently for increasing the sampling of the domain in the smart solution. In [90], a bi-directional communicating gas meter for IoT-enabled operation is developed and tested for smart gas management, reporting a reduction of 37% in consumption. An automated meter reading framework for the smart metering domain is implemented for utility gas in [91]; it can integrate automated billing using consumption slab data. A novel polysilicon-based thermal flow sensor is developed and tested for domestic gas metering in [92]. An integrated CMOS-based gas mass flow meter for multiple applications in measuring mass flow is developed in [93]. Another method to read the mechanical meter via an electronic technique is given in [94]; it uses reed switches and Hall effect sensors interfaced to an MCU for the electronic readout. The authors in [95] discuss the manufacturability of ultrasonic gas meters to reap the benefits of higher accuracy and greater range at lower cost due to the economies of scale. Another interesting implementation is reported in [96]; it uses a microprocessor embedded inside a simple diaphragm-based flowmeter to estimate the gas usage of individual appliances. One of the earliest fluidic flow meter implementations is reported in [97]. This review of gas meters is a sampling of different implementation techniques and gives a broad overview of the technologies mainly in use for domestic and industrial energy gas metrology; it does not cover industrial process flow metering technologies, which are considerably advanced and varied owing to the variation and stringent requirements of the process technologies. Again, the integrated gas and electricity meter has not been reported, to the best of authors’ knowledge. This translates to the aggregation of the energy consumption data at higher levels, which adds complexity and restricts analysis of the finer resolutions of energy consumption.
2.3. Electricity Meters
Electricity is the most common type of energy produced and distributed for consumption by the domestic, industrial, and other sectors owing to its ease of production, distribution, and control, coupled with the economies of scale at play at every level in the electricity business; this also makes it one the most affordable energy solutions worldwide. The electricity network has continually evolved alongside the evolution of the generation techniques and methods, the distribution networks, and the integration of computation and communication technologies into the electricity eco-system, resulting in the modern smart grid concept, which is increasingly being put into the implementation phase at various levels. This conceptual and practical evolution of the electricity network has resulted in the tighter integration of different components across the different domains. Net metering, distributed generation, reactive power injection, grid stability and control, peak shaving, etc., are just few examples of such an integration, which allows the fine-grain control, up to the end user, of consumption and production, and then again up to the main production facility, to optimize the increasingly complex cost functions, such as minimizing the carbon footprint of the water storage facility, etc. Such tight integration and increasing complexity have resulted in the veracity of the measurement techniques for electricity consumption monitoring, resulting in different types of meters at different levels that are now increasingly being called smart grid sensors and include techniques beyond simple domestic meters. In contrast with the other energy networks discussed earlier, the rapid evolution and cross-layer integration of the electricity network warrants a more complex review of the sensing techniques across the network strata as effect of each measured value can propagate across the grid, even to the end user. To systematically review the state of the art in smart grid sensing, we will begin with the basic measurement techniques for currents and voltages and move towards increasing complexity by considering the phasor and temporal nature of the measured quantities. These complexities could lead to the identification of event data, for which specialized sensing techniques exist and will be briefly discussed. Finally, we move on to the actual implementations that exist in the literature. The gap that exists between the reported designs and the required measurements for the smart grids will thus be apparent and point to the future development for smart electric meters.
2.3.1. Instantaneous Measurements
At the fundamental level, electricity measurement is about measuring the instantaneous values of currents and voltages. The voltage measurement is summarized in Table 4. The voltage is measured by bleeding a very small amount of current across the nodes, between which the potential difference is to be measured using a very high value of resistance in a series with the voltage sensor. Primitively, voltage sensors use the force experienced by a current conductor in the magnetic field and commonly include a permanent magnet moving coil, moving iron, an electrodynamometer, and an induction type of meters. The induction type of meter is most commonly employed in domestic and industrial electricity meters. The rectifier type of meter is another common voltage measuring technique which uses a diode bridge and a permanent magnet moving coil sensor to measure AC voltages. Electrostatic meters use capacitive coupling to induce a motion proportional to the voltage applied across the capacitor plate. Voltage measurement using an optical technique is reported in [98]; it uses the Pockels effect, which is a change in the refractive index of the material attributed to the applied voltage. The Pockels effect-based sensors have a wide bandwidth and are able to measure high voltages [99]. Finally, digital voltmeters use a comparator and a pulse train to measure the voltage level of the input signal and convert it into a stream of binary digits, with each digit indicating the result of the comparator for each pulse [100]. The design variation found in the digital voltage sensor is tremendous and is primarily divided between isolated and non-isolated techniques; both of these use high-performance, high-bandwidth, programmable-gain, and versatile and high-dynamic-range A/D converters for high-performing instruments.
Current measurement is performed either by a non-isolated technique involving placing a very low resistance in the series with the current-measuring circuitry or by an isolated technique involving sensing the electromagnetic field generated by the flowing current [105]. A basic technique is the shunt resistor technique, which measures the voltage drop across the resistor in the current path and uses an isolation amplifier to provide amplification whilst trying to minimize the effect of electrical contact, which introduces ohmic losses at the expense of a deterioration in bandwidth and accuracy along with the drift in the reported values [106]. Basically, shunt current sensors are usually coaxial shunts [107] or a series of surface-mounted shunts [108], where the former are used for high-magnitude pulses with stringent transient responses such as fast rise time [109], whereas the latter are used in power electronics and industrial, consumer, and electronics systems [110]. Instead of SMD shunts, copper trace can also be used as a series shunt [111]; it is inexpensive but also has large thermal drift and low dynamic range, limiting its applications [112].
Isolated current measurement enables non-contact floating voltage measurement using the magnetic field generated by the current flow, allowing greater dynamic ranges and electrical safety [105]. The magnetic field can be sensed using induction or using magnetic field sensors. Popular induction-based techniques for isolated current include sensing using the Rogowski coil [113] and current transformers [114,115,116], the basic limitation being the inability to measure DC current, as DC current cannot produce alternating magnetic fields that can induce current in the sensing side circuit. The Rogowski coil has the advantages of linear response without saturation [117], less insertion impedance, easier integration into the PCB, and allowance of flexible coils for ease of use, whereas the disadvantages include the need for output signal integration [118] and thermal drift [119]. Rogowski coils are used in industrial instrumentation and high-power scenarios, such as distribution systems, short circuit testing, fault detection, induction motors, etc. [120]. Current transformers use simple transformer action to induce current at the secondary/sensing side using an alternating magnetic field the produced by primary current and are arguably the most widely used current-sensing devices in power conversion [121] due to their low cost [122], ADC compatible signal [123], proportional output that does not need integration, and robust low-frequency application. The primary disadvantages [124] of current transformers are saturation, droop, and hysteresis due to magnetizing inductance, core losses, especially at high frequencies, and the requirements of core resetting in pulsed operation.
Magnetic field sensors are used to sense both static and magnetic fields and, hence, are applicable in more general scenarios. The two fundamental aspects of magnetic field sensors are the connection topology and the sensing mechanism itself, where the former includes open loop, closed loop, and connection with either a current transformer or a Rogowski coil, whereas the latter includes the Hall effect, fluxgate, and magneto resistance mechanisms [125]. Open loop topology directly places the sensor in the magnetic field, which can be “focused” by placing the sensor in a gap of highly permeable core, which can induce a permanent offset requiring degaussing of the core [126] and parasitic voltages due to field fringing. In closed loop sensing, the magnetic sensor is used as an error-correcting device, whose signal compensates the magnetizing current by forcing a proportional current through the secondary winding [127]. Closed loop sensing minimizes drift and the heat losses due to reduction in the eddy currents and greater bandwidth, whereas its main disadvantage is that it is not suitable for all types of sensing mechanisms, such as anisotropic magneto resistance [128]. The combination of the magnetic field sensor with either CT or Rogowski sensors produces a sensor that can use the best of both worlds: the DC measurement capability of the former with the accuracy and the bandwidth of the latter, resulting in active current probes [129], an eta current sensing principle [126], and a combination of the open loop Hall sensor with the Rogowski coil to measure the high frequency part of the current [130]. Such a combination of sensing topologies and techniques is usually expensive and not suitable for mass production, and hence, it is used for specialty applications.
The sensing of magnetic field uses, as previously stated, the Hall effect, fluxgate, and magnetoresistance sensors. The Hall effect is voltage generated across a thin, conductive current-carrying sheet placed in a magnetic field that inversely depends upon the thickness and directly on the resistance of the plate; hence, thinner plates produce small outputs with fewer ohmic losses with lesser resistance and vice versa for thicker plates [131]. Additionally, Hall effect sensors suffer from misalignment voltage and thermal drift. Hall sensors find usage in power conversion, motor drives, BLDC motor control, position sensing, etc. [132]. Fluxgate sensors sense the magnetic field generated by the current-carrying conductor by driving excitation windings into saturation at opposite polarities, which results in alternating voltage at the sensing coil, the peak of which depends upon the ambient or external electromagnetic field [133], and they can pick up very weak external magnetic fields, providing excellent sensitivity and accuracy [134]. Various techniques for the excitation and sensing of the field have resulted in numerous fluxgate-based sensors [133,135]. As fluxgate sensors are quite accurate but expensive, difficult to integrate, and consequently costly, they are seldom used in current commercial and consumer electricity metrology; instead, these are used in high-accuracy applications, such as calibration, electromagnetic-based diagnosis systems, precision laboratory equipment, etc. However, sensors for current metrology do exist [136]. Finally, the magneto-resistive sensors are based on the variation of the material resistance as a function of the applied magnetic field [137], the popular magneto-resistive effects being anisotropic magnetoresistance resonance (AMR) and giant magnetoresistance resistance (GMR), with other techniques continually being developed [138]. The AMR phenomenon depends upon the variation of resistance due to the magnitude and direction of the applied magnetic field and the direction of the current flow through it; it is maximum when the electric current and applied magnetic field are perpendicular [139]. The GMR phenomenon depends upon the change in material resistance due to the magnetization state of the ferromagnetic materials separated by a non-magnetic layer; it is minimum when the fields in both layers are parallel and maximum when both fields are anti-parallel [140]. Both of these techniques suffer from thermal drift, nonlinearity, and alteration of the sensing function due to strong external fields. Novel magnetic sensor techniques such as giant magneto impedance (GMI) and tunnelling magneto resistance (TMR) [141] are also being explored for current sensing. These techniques have potential applications in grid sensing, electric vehicle charging, welding, motor drives, and industrial large current sensing, but the state of the art has not reached the maturity for the development of low cost, low complexity sensors for extensive usage [142].
The Faraday effect is another technique to sense magnetic fields using light; in particular, it employs induced birefringence in a material subjected to an external magnetic field. Assuming negligible intrinsic circular birefringence, the rotation induced to a linearly polarized light is then proportional to the path integral of the applied magnetic field [143]. Generally, polarimetric and interferometric techniques are used to detect the polarization change induced in a circularly arranged fiber optic cable by the magnetic field, which, in turn, is induced by the current-carrying conductor passing through the fiber optic coils [144]. The polarimetric technique simply measures the polarimetric state of the light that depends upon the rotation of the polarization vector, which is dependent upon the magnetic field and hence on the current carried by the conductor passing through the optical fiber core [145]. Interferometric techniques use a Sagnac interferometer to perform interference measurements on two counter-propagating light beams in fiber optic coils enclosing the current-carrying conductor, inducing the magnetic field to alter the polarization state of the light beams [146]. Whereas polarimetric sensors suffer from linearity of measurement and inaccuracy due to bend stress-induced birefringence, polarimetric techniques eliminate or attenuate these artefacts but are themselves prone to thermal drift and vibration vulnerabilities, but the overall Faraday effect-based metrology offers superior accuracy, galvanic isolation, and large dynamic range, albeit at high costs [147].
Apart from the sensing technique employed, other important system-level considerations also need to be taken into account and are usually implemented in the metering infrastructure. As described earlier, these analogue sensors are almost always tied to an analogue-to-digital (A/D) interface that converts the sensed values into a digital domain, where the major issues at the grid level are the sampling rate, the reporting rate, and the accuracy. Another aspect is the number of phases, with the typical number being either one or three. The connection of the sensing device with the power interface determines the type of measurement being made as either line-to-neutral or line-to-line. The values being recorded are usually in RMS and are averaged out to reduce the noise. The recorded values are further processed statistically to measure the spread and trend of the consumption and production.
2.3.2. Grid Sensing
Apart from basic sensing at the simple end nodes, typically home and office, the meters are required to perform advanced analysis at higher levels of integration and complex end nodes, such as factories or buildings. Such measurement takes into the account the continuous as well as the complex nature of the current and voltages (complex as in magnitude and angle) in the steady state. Transient responses are also measured and recorded for advanced metering systems, allowing the system-level implementation of fault identification and preventive maintenance, along with other higher level algorithms and statistical inferences. The oscillatory responses in the power systems are very important for the wealth of information they contain, especially about the stability of the system. Usually, modal analysis using frequency domain, time–frequency, or fundamental modes decomposition techniques is performed at the meter, and the data are used by a higher layer in the smart solution for event detection, or the meter can also be programmed remotely to report specific events using AI techniques, among others, such as statistical processing, for specific event detection and reporting.
The current sensing techniques presented are summarized in Table 5.
Phasor measurements are also an important aspect of modern metering systems that measure the phase of the current and voltage along with the magnitude using phase measurement units (PMU), which extract the fundamental frequency component using Fourier transform and extracting real and imaginary components for complete phasor description. Adding a time reference to different PMUs will give a synchro-phasor that can provide frequency measurements across the grid to detect the grid events that cause changes in frequency. Synchro-phasors are also used to measure relative phase angle difference (RAPD), which can be used to detect complex power flow, tripping, and inter-area oscillations at higher levels of data processing. When the phase difference is measured at the same PMU, a phasor differential (PD) is obtained that can be used to detect frequency change for local event detection and to calculate a differential synchro-phasor by combining measurements from different PMUs, which are used to detect the same event by measuring its effect at different locations in the interconnected power system. PMUs are also used to detect phase unbalance and related events. At higher levels of data processing, the state estimation algorithms on the PMU data can provide a thorough picture of the state of the smart power system, enabling the control and optimization of the complete system.
The instantaneous measurements of voltage and current provide useful information about the state of the system, but a power system is inherently a continuous system, and waveform centric measurement can provide additional information, especially in the case of non-sinusoidal waveforms that arise due to distortions. Such instruments, aptly named waveform sensors, are of various types, such as power quality (PQ) meters and digital fault recorders (DFRs). Common measurements made by PQ meters include voltage harmonics, crest factor, total harmonic distortion, phase harmonic index, inter-harmonics, and notching. DFRs monitor continuous waveforms and capture an instantaneous image in the case of triggering, referred to as a waveform snapshot, which is set by comparing the current waveform (windowed signal) with a reference waveform, which is usually the previous waveform instance. An event is triggered when the comparison exceeds the set threshold for at least a minimum set period of time, with the popular comparison techniques being THD, RMS, or point-to-point comparison and sub-cycle comparison. Cycle boundary identification and frequency variation compensation are important aspects of point-to-point comparison, introducing complexities which lead to methods such as comparing sub-cycles. Event and signal processing can also be performed on derived waveforms such as the differential waveform, which is obtained by subtracting two synchronous parts of the waveform. Similarly, harmonic waveforms can be analyzed for different parameters by decomposing the waveforms using Fourier transform and can be further time stamped to generate harmonic synchro-phasor waveforms, which provide sparse bases for state estimation of the grid. Such synchro-phasors are used in topology identification, amongst other applications. Fourier decomposition and time stamping of differential waveforms give rise to differential harmonic synchro-phasors, which are used to detect fault location. These waveform analyses can be used at higher levels for fault detection, topology estimation, grid state estimation, fault location, energy leakage, efficiency, etc. The synchronization of waveform measurements gives rise to waveform measurement units (WMUs), which are increasingly being used in transient analysis. A typical parameter reported by WMUs is relative waveform difference (RVWD), which can be used for event detection and classification in transmission lines. Finally, the voltage and current measured is used to derive the power which is actually reported and extensively used for different applications in smart metering. The different types of power parameters calculated are the reactive power, load factor, true power factor, displacement power factor, load profiles, etc., which are employed in grid estimation, demand-side load management, peak shaving, energy forecasting applications, etc.
The sensing technologies outlined above constitute a basic system that can monitor and compute various parameters to optimally represent the state of the consumption at various levels, from a single household to complex interconnecting grids. The state of art in energy metering is evolving with new parameters and paradigms, and techniques continue to evolve, requiring computation and communication enhancements, which tend to keep up with this advancement. This constitutes the next component of the sensing node at the physical level, the computing and communication infrastructure.
Different grid sensors, their functionality, and usage are summarized in Table 6.
3. Computational Platforms
Computing devices for the embedded domain have exploded in complexity, functionality, and versatility, resulting in the enabling of ever-growing complexity in the IoT sensing or physical layer design. From microcontrollers to single-board computers to application-specific integrated chips to programmable devices to integrated systems on chip, the computing hardware scene has exploded with complexity of choice and configuration, making it difficult to holistically review the state of the art; the task is only further complicated by the myriad of architectural requirements of modern smart metering solutions and the related intelligence. The technological evolution of embedded devices is presented in brief before delving into the specific architectural ecosystems employed.
Microcontrollers are small, embedded computers finding extensive, rather unparalleled, usage in the modern technology-driven world. From the earliest x86-based architecture to the more recent ARM-centered designs, microcontrollers have grown in breadth and integration to offer a broad spectrum of design choices and performances. The current, and by no means exhaustive, list of commercial offerings includes x86, 68HC11, PIC, STM, ARM, RISC-V, AVR, M8C, S08, Parallax propeller, MIPS, and DSP-based designs, supplemented by a range of storage, RAM, communication, and power options. The popular offerings are listed in Table 7 against the main characteristics, such as memory, architecture, instruction set, bus width, and peripherals.
The microcontrollers, though ubiquitous and programable, are limited by the initial design configuration and do not allow reconfiguration at the hardware level. Programmable hardware architectures such as field-programmable gate arrays (FPGA) and system on chip (SoC) provide a solution to this bottleneck. Xilinix, Altera, Infineon, Lattice, and Actel are some of the leading solution providers in this domain. FPGAs are essentially blank devices that need codes to implement functionality, resulting in application-specific hardware that speeds up execution and improves efficiency manyfold at the cost of the increasing complexity of the hardware design, which has spurred libraries of design by all vendors to aid speedy development. The essential characteristics of a modern FPGA are programmable, computational, storage, and interface units of different kinds such as look-up tables (LUTs), DSP slices, distributed memory, tri-state encoders, etc. The different solutions on offer from the vendors are listed in Table 7, describing key properties of FPGA solutions. The FPGA trades design complexity for flexibility with microcontrollers; SoC takes the best of both worlds with on-chip microprocessor units, communication, interface, and special processing IPs interfaced with on-chip reconfigurable hardware via a specially designed high-bandwidth, low-latency interface. Xilinx seems to be the leader in this field, with Zynq being most used SoC platform and Infineon PSoC being a popular choice as well. A board-level integration of SoC with highly specialized peripherals for particular application constitutes the next level of specialized hardware, often termed as system on module (SoM); Kria from Xilinx, phyCORE from PHYTEC, and COMXpress from ReFLEX CES are some examples of SoMs for vision, multimedia, machine learning, and embedded applications. Some common SoM solutions are listed in Table 7. Another interesting computing eco-system is commonly termed the single-board computer (SBC); though similar to SoMs in organizational specification, the architectural configuration of SBCs has a general-purpose computing flavor, allowing flexibility and price advantage at the cost of performance, and they are found to be suitable for an extensive range of applications compared to SoMs, which find usage in highly specialized high-performance applications. In fact, SBCs represent the most popular segment for IoT developers and account for most of the designs reported in the scientific literature on the range of topics including smart meters, with Raspberry PI and Arduino as the most popular examples. Reviewing the architectural choices for AI processing on the edge warrants special attention because of the continued evolution of the smart meter functionality into the realm of processing data on the edge involving AI-based operations for various smart energy applications. Edge AI processing hardware can be integrated as special acceleration units in the form of independent processors. The Intel Neural Compute Engine, MediaTek AI processing unit, Google Edge TPU, Gyrfalcon Matrix Processing Unit, Mythic analog matrix processor, Syntiant Neural Decision Processors, and Halio AI processors are some examples of the available solutions. FPGA-based solutions are based on specialized soft processor design for AI applications or specialized FPGA architecture intended for AI. Former optimizations include designs of accelerators for object detection [148], the YOLO framework [149], the recurrent neural network (RNN) [150], the long short-term memory network (LSTM) [151], and processors for the edge and IoT [152], whereas the latter include matrix multipliers, pipeline architectures, and DSP slices, etc., such as MAX V CPLD and cyclone FPGAs from Intel. The single-board computers for edge applications include Raspberry Pi 4, Apollo 3 Blue, Hailo 8, Coral Dev, Jetson Nano boards, etc. Some specialized SoCs for smart metering have also been designed. The details of these are provided in Table 7.
Finally, the advancement in hardware is well supported by the software eco-system in the AI edge development. Real-time operating systems, programming libraries, and tool chains have been developed to ease the research and production of AI and edge solutions for smart systems such as smart energy and components such as the smart metering infrastructure. Popular OSs for the embedded edge are Linux and its variants, Android, Azure, Windows, FreeRTOS, mu-Linux, VxWorks, Mbed, embOS, Lynx, RTX, QNX Neutrino, MIPS Embedded OS, TI-RTOS, etc.; these are just few of the examples. Tool chains are collections of programs that can use the development system to develop and debug the program and then compile it for the end system and are very popular in the embedded system design domain. The resource-constrained microcontrollers use special boot loaders that solely act to load the user program directly from the development system directly to the microcontroller chip for short-cycle embedded development such as Arduino. Other popular tool chains are based around GCCs, e.g., the ARM tool chain. Due to the explosion in architectures and systems, cross-tool chain development is also becoming a commonplace practice. Popular tools such as crosstool-NG [153] and Yocto project [154] can develop complete development systems for custom hardware or can modify Linux distribution for the target board. The topic of operating systems and tool chains for embedded development is too vast to be covered here and lies at the heart of smart systems development. Another popular approach is to use tools for optimizing the neural networks for embedded systems such as TensorFlow Lite [155], PyTorch Mobile [156], Android Neural Network API [157], Apple OS Core ML [158], Qualcomm Neural Processing SDK [159], and HUAWEI HiAI [160]; these are some examples of the APIs to run and train neural networks on embedded, edge, and mobile platforms. There are several projects, such as uTensor [161], deepC [162], Glow [163], openVINO [164], nncase [165], X-CUBE-AI [166], ONNC [167], TVM [168], and eIQ [169], that convert standard neural network models such as the Open Neural Exchange [170] (ONNX) compatible format to C/C++ code for direct deployment on microcontrollers. The myriad of options available to add flexibility to the development life cycle comes at the cost of complexity and compatibility, which tools such as oneAPI [171] aim to address by defining a hardware-independent and vendor-neutral framework for computing intensive tasks.
In short, the computing domain has progressed by leap and bounds in multiple dimensions, and a brief review pertinent to the physical node in the smart system is presented, which covers the hardware and software from the development and operational point of view. The final piece of the hardware node is the communication protocols, which will be discussed in another section, but a brief overview is presented to discuss the smart meters’ state of the art as a physical node.
From the perspective of IoT, the communication protocols could be divided into personal area, local area and wide area networks (PAN, LAN and WAN, respectively). PANs and LANs include ZigBee, 6LoWPAN, LoRa, 802.11, 802.15.4, RFID, BLE, NFC, Z-Wave, and Sigfox, whereas WAN technologies include cellular, terrestrial, and satellite communications, such as NB-IoT, LTE, 5G, etc. [172,173]. The protocols are utilized to transfer the data across different semantic layers and for different applications using MQTT, AMQP, CoAP, DNS-SD, and JSON-LD [174].These IoT protocols are mapped to the smart metering infrastructure for the home area network (HAN) and different levels of grid communications. The review of relevant communication protocols is given in Table 8.
Based on the sensing, hardware, and communication protocol employed, the various physical implementations of the smart meter are reviewed as follows.
The authors in [175] use a commercial TED meter [176] and the ARM Linux board to implement a smart meter to detect user activity patterns from consumption data. Ref. [177] uses a simple microcontroller to implement a smart meter that uses GSM as a communication protocol. A smart meter-based complete home energy management system is proposed using power line communication in [178]. An energy meter using a PIC microcontroller, an ADE7756 energy meter, and a Bluetooth module is implemented in [179]. A smart meter for remote PV installation is implemented in [180]; it allows flexibility in the power measurement and communication setup. In [181], a smart multi-power tap is added to a smart meter for service management in a smart home. Modal analysis for power measurement by a smart meter is reported in [182]. The Portable Power System Monitor (PPSM) is LabVIEW-controlled hardware that performs basic measurements which are then processed by MATLAB for oscillation analysis in power systems [183]. A smart meter using a PIC microcontroller and an ADE 7757 with a current shunt is designed for the power consumption-based control of home appliances in [184]. A low-cost system to measure electrical power from PV panels is designed in [185]; it uses a single-board computer and a split-core transformer for current sensing and a simple parallel circuit for voltage readout. A high reliability and a long-life energy measurement IC interfaced to a DSP chip for smart metering function is reported in [186]. A smart meter for low-voltage micro-grids is reported in [187]; it uses op-amps for signal conditioning, PIC for signal processing, and ZigBee for communication. A wireless metering for a smart solar grid is implemented in [188]; it uses Hall effect sensors for measurements of current, voltage, and power and ZigBee for communication systems. In [189], a STM32F4DISCOVERY board is used for measurement and signal processing, and Bluetooth is used for data communication with computers where MATLAB/Simulink is used for data analysis. A phase identification method for smart metering is given in [190]. Another technique for a phase identification program for a smart meter is given in [191]; it is used in various techniques for smart grids, as mentioned earlier. In [192], an embedded energy meter is designed that can implement a prepaid electricity tariff, which uses inductive measurement techniques for measurement and a microcontroller for communication. An apparent energy calculation algorithm is designed in [193] for a smart meter. An Arduino-based GSM and ZigBee wireless communication smart meter is implemented in [194]. In [195], a GSM-based smart meter using an IEC 61,036 compliant power measurement meter is designed. An active energy meter with an MPC3905A microcontroller and a GSM network is implemented in [196]. An 8051-based energy meter consisting of an LCD, EEPROM, RTC (real-time clock), EMM (energy measuring module), tempter detection unit, and GSM module is implemented in [197]. Another GSM-based smart meter using an 89C52 MCU, a DS12887 clock, X25045 timer, and a UART chip to interface to a GSM module is reported in [198]. To utilize a pre-built GSM-based AMR (automatic meter reading) infrastructure, a ZigBee interface is designed to collect metering data and relay to GSM collection modules in [199]. A ZigBee-based smart meter is designed in [200]; it has an interface protocol implemented for star topology. A power line communication (PLC) SoC-based watt-hour meter is reported in [201]. An ARM-based power and power quality meter using Wi-Fi is implemented in [202]. In [202], a legacy modem-based power meter is designed and implemented that uses a plain old telephony network system (POTS). Another ARM-based Wi-Fi system is implemented in [203] that augments the meter reading with control functionality. Using an ARM-based processor, a load management and meter reading system is implemented that uses a GPRS network in [204]. YoMo [205] is an Arduino pin compatible power meter which can use Arduino and its eco system for implementing a smart meter. Another Arduino smart meter using GSM as a network is reported in [206]. An Arduino-based meter that uses MATLAB as analysis software is reported in [207]. An IoT server-based smart meter using Arduino as a processor, ACS712 as a current sensor, and ZMPT101B as a voltage sensor is reported in [208]. A smart meter using ESP8266 and built-in Wi-Fi is reported in [209]. The Hall effect-based galvanic isolation sensors are employed for sensing voltage and current in an Arduino Duo-based smart meter in [210]. Non-invasive measurements for smart metering using Arduino or IoT are given in [211]. A Wi-Fi smart meter using ESP8266 and Arduino Uno is reported in [212]. Arduino Yun, Arduino Uno, and ESP8266 are used to deliver real-time measurements of a smart meter to a user, as given in [213]. An edge platform using Jetson Nano for edge implementation communicating with Arduino Uno is reported in [214]. A Raspberry Pi-based real-time energy IoT monitoring system is reported in [215]. A low-voltage smart meter for monitoring power quality disturbances using classification and detection based on a single-board computer is reported in [216]. An IoT-based smart meter for AI-based power measurement and quality assessment is reported in [217]. Table 9 further summarizes the implementations in a structured manner.
Though one can find extensive literature on smart meters employing IoT techniques, the state of the art is usually not employed. FPGA and FPGA/SoC systems are seldom used though the complex scenarios of modern day metrology warrant such usage, such as to assess the energy mix, for dynamic pricing engines, for advanced signal processing for power quality, for theft detection, and for multi-protocol conversions, to name only a few. Though industry has developed SoC specifically for the metering, it is not used extensively for research. Some modular platforms have also been reported by the industry, again finding little usage. As the complexity of meteorology is evolving, the smart meters are not employing modular architecture to cope with the increased demands and usually employ single-function execution models, while multiple interacting functionalities might enhance the prospects of smart energy manifold. A modular platform is also discussed for its necessity but has not been implemented so far. Similarly, 5G networks have not been studied for slicing in this domain though it has been reported that smart metering generates a heterogeneous type of data with respect to network functionality. Another issue that is not discussed frequently in the literature is that of the service architecture for smart metering. Finally, the smart meters reported are very much measurement-agnostic devices which will not fare well in a modern AI-driven big data world as measurement techniques might impact the algorithms and the quality of the measurement. For system-oriented implementation, the measurement techniques should be considered while designing the smart meter. Moreover, it will allow for the designing of flexible platforms that could be well suited to a wide variety of metering applications. To sum up the point made in this passage, the Figure 4 presents the “usage cube”, which color codes the different combinations of technologies used by smart meter research community.
To conclude the discussion of the smart meter implementations, we present a brief review of the various applications of smart meters. Table 10 lists some of the smart meter data applications; the list is by no means exhaustive or even numerous. These applications present the use cases of smart meter component usage. Load forecasting predicts the future energy demands based on current meter readings. Theft detection uses smart meter data to estimate the total non-technical losses, whereas anomaly detection estimates unwarranted fluctuations in the power grid or generation. Consumer profiling gauges the type of consumer, e.g., commercial or small industrial, from the smart meter data. Activity detection uses energy data to predict the occupants’ daily life activities, e.g., sleeping or watching T.V., etc., and finally, fault detection uses measurements to detect the type and location of fault for the protection of the grid.
4. Conclusions and Future Direction
The literature for smart meter implementation is vast and implements the various technologies that are reported here. However, the implementation technologies offered by the IoT ecosystem are not exploited fully. Firstly, the hardware utilized is usually single-node architecture, whereas modern hardware design choices have enabled multiple small, distributed node-based implementation, which is not yet fully exploited in the smart meter implementations reported in the literature. Another aspect is the design of a framework, while there are multiple solutions with regard to sensors, sensed values, pre-processing, application area, AI algorithms, and development eco-systems, a coherent framework that can be used as an automated solution deployment is lacking. With the advent of smart solutions and the increasing complexity that smart metering system is expected to handle in such smart solutions, such an automated deployment system might prove to be useful and allow access to the ever-increasing options available to smart meter designers with transparent complexity and portability. Similarly, newer technologies such as block chain, federated learning, and the vast number of measurement tools and techniques at the disposal of academics and researchers have yet to be tapped. With the ever-increasing complexity and energy demands, this untapped spectrum presents a great opportunity.
The suggested research gaps could lead to smart energy systems that are based on cutting edge technologies in sensing, communication, and computation, increasing efficiency and functionality. Using heterogeneous and distributed nodes with automated design and integration would mean the usage of advanced software paradigms that allow the handling of complex implementations. Such an integration of measurement infrastructure could lead to the promised benefits of smart energy systems. Additionally, the distributed processing and sensing nature proposed by the current survey necessitates new theoretical breakthroughs or extensions of current distributed computing research for smart meter systems such as the one proposed in [274]. This includes agent-based, hierarchical and managed systems, perspectives, algorithms, frameworks, etc. By allowing cross-disciplinary theoretical interventions, novel energy applications could result in even more novel application dimensions.
Future research in smart meter platforms clearly points towards greater functionality, integration, and flexibility. Allowing more powerful infrastructure and intelligence in the smart metering layer could lead to the revolution, rather than evolution, of smart energy systems, allowing optimizations that could lead to a better environment and natural resource usage and even better living.
Author Contributions
Conceptualization, Y.M.R., M.H.R. and Y.M.; methodology, Y.M.R. and M.H.R.; validation, Y.M.R. and M.H.R.; formal analysis, Y.M.R. and M.H.R.; investigation, Y.M.R. and M.H.R.; resources, Y.M.; data curation, Y.M.R., M.H.R. and M.Z.; writing—original draft preparation, Y.M.R. and M.H.R.; writing—review and editing, M.Q.M., M.Z. and Y.M.; visualization, Y.M.R., M.H.R., M.Z., M.Q.M. and Y.M.; supervision, M.Q.M., M.Z. and Y.M.; project administration, M.Q.M. and Y.M.; funding acquisition, Y.M. All authors have read and agreed to the published version of the manuscript.
Funding
The authors would like to acknowledge the research funding to the KAUST Innovative Technologies Laboratories (ITL) from King Abdullah University of Science and Technology (KAUST).
Data Availability Statement
No new data were created or analyzed in this study. Data sharing is not applicable to this article.
Conflicts of Interest
The authors declare no conflict of interest.
References
- Lund, H.; Østergaard, P.A.; Connolly, D.; Mathiesen, B.V. Smart Energy and Smart Energy Systems. Energy 2017, 137, 556–565. [Google Scholar] [CrossRef]
- Saito, K.; Jeong, J. Development of General Purpose Energy System Simulator. Energy Procedia 2012, 14, 1595–1600. [Google Scholar] [CrossRef] [Green Version]
- van Pruissen, O.; van der Togt, A.; Werkman, E. Energy Efficiency Comparison of a Centralized and a Multi-Agent Market Based Heating System in a Field Test. Energy Procedia 2014, 62, 170–179. [Google Scholar] [CrossRef] [Green Version]
- Hvelplund, F.; Möller, B.; Sperling, K. Local Ownership, Smart Energy Systems and Better Wind Power Economy. Energy Strategy Rev. 2013, 1, 164–170. [Google Scholar] [CrossRef]
- Hu, M.-C.; Wu, C.-Y.; Shih, T. Creating a New Socio-Technical Regime in China: Evidence from the Sino-Singapore Tianjin Eco-City. Futures 2015, 70, 1–12. [Google Scholar] [CrossRef]
- Söder, L. Simplified Analysis of Balancing Challenges in Sustainable and Smart Energy Systems with 100% Renewable Power Supply. WIREs Energy Environ. 2016, 5, 401–412. [Google Scholar] [CrossRef]
- Xu, Y.; Yan, C.; Liu, H.; Wang, J.; Yang, Z.; Jiang, Y. Smart Energy Systems: A Critical Review on Design and Operation Optimization. Sustain. Cities Soc. 2020, 62, 102369. [Google Scholar] [CrossRef]
- Thellufsen, J.Z.; Lund, H.; Sorknæs, P.; Østergaard, P.A.; Chang, M.; Drysdale, D.; Nielsen, S.; Djørup, S.R.; Sperling, K. Smart Energy Cities in a 100% Renewable Energy Context. Renew. Sustain. Energy Rev. 2020, 129, 109922. [Google Scholar] [CrossRef]
- Lund, H.; Thellufsen, J.Z.; Sorknæs, P.; Mathiesen, B.V.; Chang, M.; Madsen, P.T.; Kany, M.S.; Skov, I.R. Smart Energy Denmark. A Consistent and Detailed Strategy for a Fully Decarbonized Society. Renew. Sustain. Energy Rev. 2022, 168, 112777. [Google Scholar] [CrossRef]
- Boardman, J.; Sauser, B. System of Systems-the Meaning of Of. In Proceedings of the 2006 IEEE/SMC International Conference on System of Systems Engineering, Los Angeles, CA, USA, 24–26 April 2006; p. 6. [Google Scholar]
- Wang, G.; Giannakis, G.B.; Chen, J.; Sun, J. Distribution System State Estimation: An Overview of Recent Developments. Front. Inf. Technol. Electron. Eng. 2019, 20, 4–17. [Google Scholar] [CrossRef]
- Thompson, N.C.; Ge, S.; Manso, G.F. The Importance of (Exponentially More) Computing Power. arXiv 2022, arXiv:2206.14007. [Google Scholar]
- Zakariazadeh, A. Smart Meter Data Classification Using Optimized Random Forest Algorithm. ISA Trans. 2022, 126, 361–369. [Google Scholar] [CrossRef] [PubMed]
- Yildiz, B.; Bilbao, J.I.; Dore, J.; Sproul, A.B. Recent Advances in the Analysis of Residential Electricity Consumption and Applications of Smart Meter Data. Appl. Energy 2017, 208, 402–427. [Google Scholar] [CrossRef]
- Fekri, M.N.; Patel, H.; Grolinger, K.; Sharma, V. Deep Learning for Load Forecasting with Smart Meter Data: Online Adaptive Recurrent Neural Network. Appl. Energy 2021, 282, 116177. [Google Scholar] [CrossRef]
- Kiguchi, Y.; Weeks, M.; Arakawa, R. Predicting Winners and Losers under Time-of-Use Tariffs Using Smart Meter Data. Energy 2021, 236, 121438. [Google Scholar] [CrossRef]
- Tang, W.; Wang, H.; Lee, X.-L.; Yang, H.-T. Machine Learning Approach to Uncovering Residential Energy Consumption Patterns Based on Socioeconomic and Smart Meter Data. Energy 2022, 240, 122500. [Google Scholar] [CrossRef]
- Avancini, D.B.; Rodrigues, J.J.P.C.; Martins, S.G.B.; Rabêlo, R.A.L.; Al-Muhtadi, J.; Solic, P. Energy Meters Evolution in Smart Grids: A Review. J. Clean. Prod. 2019, 217, 702–715. [Google Scholar] [CrossRef]
- Al Khafaf, N.; Rezaei, A.A.; Moradi Amani, A.; Jalili, M.; McGrath, B.; Meegahapola, L.; Vahidnia, A. Impact of Battery Storage on Residential Energy Consumption: An Australian Case Study Based on Smart Meter Data. Renew. Energy 2022, 182, 390–400. [Google Scholar] [CrossRef]
- Sharma, K.; Mohan Saini, L. Performance Analysis of Smart Metering for Smart Grid: An Overview. Renew. Sustain. Energy Rev. 2015, 49, 720–735. [Google Scholar] [CrossRef]
- Ahmad, T. Non-Technical Loss Analysis and Prevention Using Smart Meters. Renew. Sustain. Energy Rev. 2017, 72, 573–589. [Google Scholar] [CrossRef]
- Wen, L.; Zhou, K.; Yang, S.; Li, L. Compression of Smart Meter Big Data: A Survey. Renew. Sustain. Energy Rev. 2018, 91, 59–69. [Google Scholar] [CrossRef]
- van de Kaa, G.; Fens, T.; Rezaei, J.; Kaynak, D.; Hatun, Z.; Tsilimeni-Archangelidi, A. Realizing Smart Meter Connectivity: Analyzing the Competing Technologies Power Line Communication, Mobile Telephony, and Radio Frequency Using the Best Worst Method. Renew. Sustain. Energy Rev. 2019, 103, 320–327. [Google Scholar] [CrossRef]
- Carmichael, R.; Gross, R.; Hanna, R.; Rhodes, A.; Green, T. The Demand Response Technology Cluster: Accelerating UK Residential Consumer Engagement with Time-of-Use Tariffs, Electric Vehicles and Smart Meters via Digital Comparison Tools. Renew. Sustain. Energy Rev. 2021, 139, 110701. [Google Scholar] [CrossRef]
- Yao, H.; Wang, X.; Wu, L.; Jiang, D.; Luo, T.; Liang, D. Prediction Method for Smart Meter Life Based On Big Data. Procedia Eng. 2018, 211, 1111–1114. [Google Scholar] [CrossRef]
- Breitenbach, J.; Gross, J.; Wengert, M.; Anurathan, J.; Bitsch, R.; Kosar, Z.; Tuelue, E.; Buettner, R. A Systematic Literature Review of Deep Learning Approaches in Smart Meter Data Analytics. In Proceedings of the 2022 IEEE 46th Annual Computers, Software, and Applications Conference (COMPSAC), Los Alamitos, CA, USA, 27 June 2022–1 July 2022; pp. 1337–1342. [Google Scholar]
- Al-Waisi, Z.; Agyeman, M.O. On the Challenges and Opportunities of Smart Meters in Smart Homes and Smart Grids. In Proceedings of the 2nd International Symposium on Computer Science and Intelligent Control; ACM, Stockholm, Sweden, 21–23 September 2018; pp. 1–6. [Google Scholar]
- Varsier, N.; Schwoerer, J. Capacity Limits of LoRaWAN Technology for Smart Metering Applications. In Proceedings of the 2017 IEEE International Conference on Communications (ICC), Paris, France, 21–25 May 2017; pp. 1–6. [Google Scholar]
- Ghorbanian, M.; Dolatabadi, S.H.; Masjedi, M.; Siano, P. Communication in Smart Grids: A Comprehensive Review on the Existing and Future Communication and Information Infrastructures. IEEE Syst. J. 2019, 13, 4001–4014. [Google Scholar] [CrossRef]
- Tightiz, L.; Yang, H. A Comprehensive Review on IoT Protocols’ Features in Smart Grid Communication. Energies 2020, 13, 2762. [Google Scholar] [CrossRef]
- Molokomme, D.N.; Chabalala, C.S.; Bokoro, P.N. A Review of Cognitive Radio Smart Grid Communication Infrastructure Systems. Energies 2020, 13, 3245. [Google Scholar] [CrossRef]
- Wei, L.; Rondon, L.P.; Moghadasi, A.; Sarwat, A.I. Review of Cyber-Physical Attacks and Counter Defense Mechanisms for Advanced Metering Infrastructure in Smart Grid. In Proceedings of the 2018 IEEE/PES Transmission and Distribution Conference and Exposition (T&D), Denver, CO, USA, 16–19 April 2018; pp. 1–9. [Google Scholar]
- Nimbargi, S.; Mhaisne, S.; Nangare, S.; Sinha, M. Review on AMI Technology for Smart Meter. In Proceedings of the 2016 IEEE International Conference on Advances in Electronics, Communication and Computer Technology (ICAECCT), Pune, India, 2–3 December 2016; pp. 21–27. [Google Scholar]
- Barai, G.R.; Krishnan, S.; Venkatesh, B. Smart Metering and Functionalities of Smart Meters in Smart Grid—A Review. In Proceedings of the 2015 IEEE Electrical Power and Energy Conference (EPEC), London, ON, Canada, 26–28 October 2015; pp. 138–145. [Google Scholar]
- Tureczek, A.; Nielsen, P. Structured Literature Review of Electricity Consumption Classification Using Smart Meter Data. Energies 2017, 10, 584. [Google Scholar] [CrossRef] [Green Version]
- Völker, B.; Reinhardt, A.; Faustine, A.; Pereira, L. Watt’s up at Home? Smart Meter Data Analytics from a Consumer-Centric Perspective. Energies 2021, 14, 719. [Google Scholar] [CrossRef]
- Adams, J.N.; Bélafi, Z.D.; Horváth, M.; Kocsis, J.B.; Csoknyai, T. How Smart Meter Data Analysis Can Support Understanding the Impact of Occupant Behavior on Building Energy Performance: A Comprehensive Review. Energies 2021, 14, 2502. [Google Scholar] [CrossRef]
- Zivic, N.S.; Ur-Rehman, O.; Ruland, C. Evolution of Smart Metering Systems. In Proceedings of the 2015 23rd Telecommunications Forum Telfor (TELFOR), Belgrade, Serbia, 24–26 November 2015; pp. 635–638. [Google Scholar]
- Mustapa, M.; Niamat, M.Y.; Deb Nath, A.P.; Alam, M. Hardware-Oriented Authentication for Advanced Metering Infrastructure. IEEE Trans. Smart Grid 2018, 9, 1261–1270. [Google Scholar] [CrossRef]
- Ghosal, A.; Conti, M. Key Management Systems for Smart Grid Advanced Metering Infrastructure: A Survey. IEEE Commun. Surv. Tutorials 2019, 21, 2831–2848. [Google Scholar] [CrossRef] [Green Version]
- Diahovchenko, I.; Kolcun, M.; Čonka, Z.; Savkiv, V.; Mykhailyshyn, R. Progress and Challenges in Smart Grids: Distributed Generation, Smart Metering, Energy Storage and Smart Loads. Iran. J. Sci. Technol. Trans. Electr. Eng. 2020, 44, 1319–1333. [Google Scholar] [CrossRef]
- Ashok, K.; Reno, M.J.; Blakely, L.; Divan, D. Systematic Study of Data Requirements and AMI Capabilities for Smart Meter Analytics. In Proceedings of the 2019 IEEE 7th International Conference on Smart Energy Grid Engineering (SEGE), Oshawa, ON, Canada, 12–14 August 2019; pp. 53–58. [Google Scholar]
- Lumbreras, M.; Garay-Martinez, R.; Arregi, B.; Martin-Escudero, K.; Diarce, G.; Raud, M.; Hagu, I. Data Driven Model for Heat Load Prediction in Buildings Connected to District Heating by Using Smart Heat Meters. Energy 2022, 239, 122318. [Google Scholar] [CrossRef]
- Razmjoo, A.; Mirjalili, S.; Aliehyaei, M.; Østergaard, P.A.; Ahmadi, A.; Majidi Nezhad, M. Development of Smart Energy Systems for Communities: Technologies, Policies and Applications. Energy 2022, 248, 123540. [Google Scholar] [CrossRef]
- Zhu, H.; Goh, H.H.; Zhang, D.; Ahmad, T.; Liu, H.; Wang, S.; Li, S.; Liu, T.; Dai, H.; Wu, T. Key Technologies for Smart Energy Systems: Recent Developments, Challenges, and Research Opportunities in the Context of Carbon Neutrality. J. Clean. Prod. 2022, 331, 129809. [Google Scholar] [CrossRef]
- Hainoun, A.; Neumann, H.-M.; Morishita-Steffen, N.; Mougeot, B.; Vignali, É.; Mandel, F.; Hörmann, F.; Stortecky, S.; Walter, K.; Kaltenhauser-Barth, M.; et al. Smarter Together: Monitoring and Evaluation of Integrated Building Solutions for Low-Energy Districts of Lighthouse Cities Lyon, Munich, and Vienna. Energies 2022, 15, 6907. [Google Scholar] [CrossRef]
- Du, G.; Liu, Z.; Li, L.; Liu, Y.; Ma, Y.; Meng, L. Fluid Characteristics of Rotary Wing Heat Meter With Single-Channel. J. Hydrodyn. Ser. B 2008, 20, 101–107. [Google Scholar] [CrossRef]
- Weide, C.P. Heat consumption measurement by means of impeller-type heat meters. Waermetechnik 1987, 32, 464–468. [Google Scholar]
- Liu, Y.; Du, G.; Liu, Z.; Wang, Y. The Influence of Different Design Parameters and Working Conditions on Characteristics of Heat Meters. J. Hydrodyn. Ser. B 2009, 21, 394–400. [Google Scholar] [CrossRef]
- Delsing, J. New Ultrasonic Flow Meter. Modification of the Sing-around Method for Use in Heat Meters; Department of Electrical Measurement, Lund University: Lund, Sweden, 1985. [Google Scholar]
- Michnikowski, P.; Deska, A. Concept of a System for Increasing the Measuring Range of Heat Meters. Flow Meas. Instrum. 2018, 64, 173–179. [Google Scholar] [CrossRef]
- Tuck, E.O. A Theory for the Design of Thin Heat Flux Meters. J. Eng. Math 1972, 6, 355–368. [Google Scholar] [CrossRef]
- Philip, J.R. The Theory of Heat Flux Meters. J. Geophys. Res. 1961, 66, 571–579. [Google Scholar] [CrossRef]
- Du, G.; Liu, L.; Li, L.I.; Liu, Z.; Liu, Y.; Liang, M. The Influence of Installation Conditions of Heat Meters on Interior Fluid Field and Flux Mearsurement Accuracy. J. Hydrodyn. Ser. B 2006, 18, 455–460. [Google Scholar] [CrossRef]
- Adunka, F. Deliberations on Testing Temperature Sensors for Heat Meters. Fuel Energy Abstr. 1996, 4, 310. [Google Scholar]
- Childs, P.R.N.; Greenwood, J.R.; Long, C.A. Heat Flux Measurement Techniques. Proc. Inst. Mech. Eng. Part C J. Mech. Eng. Sci. 1999, 213, 655–677. [Google Scholar] [CrossRef]
- Diller, T.E. Advances in Heat Flux Measurements. In Advances in Heat Transfer; Hartnett, J.P., Irvine, T.F., Eds.; Elsevier: Amsterdam, The Netherlands, 1993; Volume 23, pp. 279–368. [Google Scholar]
- Ye, X.; Zhang, X.; Diao, W. A Networked Heat Meter System for Measuring Domestic Heat Supply. In Proceedings of the 2005 IEEE International Conference on Industrial Technology, Hong Kong, China, 14–17 December 2005; pp. 225–230. [Google Scholar]
- Moczar, G.; Csubak, T.; Varady, P. Distributed Measurement System for Heat Metering and Control. IEEE Trans. Instrum. Meas. 2002, 51, 691–694. [Google Scholar] [CrossRef]
- Meng, L.; Bin, F. The Research of Optimal Design of Heat Exchanger in Heat Exchanger Heat Meter. In Proceedings of the Proceedings of 2011 International Conference on Modelling, Identification and Control, Shanghai, China, 26–29 June 2011; pp. 347–350. [Google Scholar]
- Kusui, S.; Nagai, T. An Electronic Integrating Heat Meter. IEEE Trans. Instrum. Meas. 1990, 39, 785–789. [Google Scholar] [CrossRef]
- Zaitseva, E.A.; Dutchak, V.V.; Tarsis, A.D. Increasing the Measuring Accuracy of Electronic Heat Meters. Meas Tech. 1991, 34, 56–58. [Google Scholar] [CrossRef]
- Shao, G.; Hou, J.; Zou, B.; Wang, Z. Research and Development of Non-Magnetic Heat Meters Based on ZigBee and GPRS. In Proceedings of the 2009 9th International Conference on Electronic Measurement & Instruments, Beijing, China, 16–19 August 2009; pp. 1-645–1-649. [Google Scholar]
- Ziouche, K.; Bel-Hadj, I.; Bougrioua, Z. Heat Fluxmeter in Silicon Technology with Low Thermal Resistance. In Proceedings of the CT’22, 18th European Thermoelectric Conference, Barcelona, Spain, 13 September 2022. [Google Scholar]
- Hager, N.E. Thin Foil Heat Meter. Rev. Sci. Instrum. 1965, 36, 1564–1570. [Google Scholar] [CrossRef]
- EN 1434-1:1997-Heat Meters-Part 1: General Requirements. Available online: https://standards.iteh.ai/catalog/standards/cen/e9f21fc1-c438-4f78-ad80-7359a5ea5d01/en-1434-1-1997 (accessed on 13 November 2022).
- EN 1434-2:1997-Heat Meters-Part 2: Constructional Requirements. Available online: https://standards.iteh.ai/catalog/standards/cen/f7968513-3e37-4247-8262-bf4679db9aff/en-1434-2-1997 (accessed on 13 November 2022).
- Wagner, W.; Kruse, A. Properties of Water and Steam: The Industrial Standard IAPWS-IF97 for the Thermodynamic Properties and Supplementary Equations for Other Properties: Tables Based on These Equations; Springer: Berlin/Heidelberg, Germany; New York, NY, USA, 1998; ISBN 978-3-540-64339-5. [Google Scholar]
- International Office of Legal Metrology, Heat Meters Part 2: Type Approval Tests and Initial Verification Tests. 2002. Available online: https://www.oiml.org/en/files/pdf_r/r075-2-e02.pdf (accessed on 13 February 2023).
- Miller, R. Flow Measurement Engineering Handbook, 3rd ed.; McGraw Hill: New York, NY, USA, 1996; ISBN 978-0-07-042366-4. [Google Scholar]
- Cascetta, F.; Vigo, P. The Future Domestic Gas Meter: Review of Current Developments. Measurement 1994, 13, 129–145. [Google Scholar] [CrossRef]
- Sun, Q.; Li, H.; Ma, Z.; Wang, C.; Campillo, J.; Zhang, Q.; Wallin, F.; Guo, J. A Comprehensive Review of Smart Energy Meters in Intelligent Energy Networks. IEEE Internet Things J. 2016, 3, 464–479. [Google Scholar] [CrossRef]
- Kalsi, H.S.; Markland, E.; Samuel, N.P.; Tofield, G.M. Factors Affecting Choice of Fluidic Flowmeters. In Proceedings of the 2nd International Symposium on Fluid–Control, Measurement, Mechanics–and Flow Visualisation, Sheffield, UK, 5–9 September 1988; pp. 1–5. [Google Scholar]
- Shakouchi, T. A New Fluidic Oscillator, Flowmeter, Without Control Port and Feedback Loop. J. Dyn. Syst. Meas. Control 1989, 111, 535–539. [Google Scholar] [CrossRef]
- Honda, S.; Yamasaki, H. A New Hydrodynamic Oscillator Type Flowmeter. In Fluid Control and Measurement, (Tokyo, Japan: SEP. 2-6, 1985); Harada, M., Ed.; Pergamon Press: Oxford, UK, 1986. [Google Scholar]
- Tsuchiya, K.; Ogata, S.; Ueta, M. Karman Vortex Flow Meter. Bull. JSME 1970, 13, 573–582. [Google Scholar] [CrossRef] [Green Version]
- Watanabe, K.; Sato, H. Vortex Whistle as a Flow Meter. In Proceedings of the 10th Anniversary. IMTC/94. Advanced Technologies in I & M. 1994 IEEE Instrumentation and Measurement Technolgy Conference (Cat. No.94CH3424-9), Hamamatsu, Japan, 10–12 May 1994; Volume 3, pp. 1225–1228. [Google Scholar]
- Forster, M.; Rampin, P. Ultrasonic Flowmeter. J. Acoust. Soc. Am. 1980, 67, 1412. [Google Scholar] [CrossRef]
- Murugan, A.; Omoniyi, O.; Richardson, E.; Workamp, M.; Baldan, A. Vision for a European Metrology Network for Energy Gases. Environ. Res. Infrastruct. Sustain. 2022, 2, 012003. [Google Scholar] [CrossRef]
- O’Banion, T. Coriolis: The Direct Approach to Mass Flow Measurement. Chem. Eng. Prog. 2013, 109, 41–46. [Google Scholar]
- Reizner, J. Coriolis-the Almost Perfect Flowmeter. Comput. Control Eng. 2003, 14, 28–33. [Google Scholar] [CrossRef]
- Anklin, M.; Drahm, W.; Rieder, A. Coriolis Mass Flowmeters: Overview of the Current State of the Art and Latest Research. Flow Meas. Instrum. 2006, 17, 317–323. [Google Scholar] [CrossRef]
- Cascetta, F. Short History of the Flowmetering. ISA Trans. 1995, 34, 229–243. [Google Scholar] [CrossRef]
- Gavra, L.; Pupsa, P.; Crainic, M.S.; Popa, G. Residential Smart Gas Meters. In Proceedings of the 2012 10th International Symposium on Electronics and Telecommunications, Timisoara, Romania, 15–16 November 2012; pp. 37–40. [Google Scholar]
- Crainic, M.S. AMR Gas Meters System by Radio-a New Trends in Natural Gas Metering Technology in Romania. In Proceedings of the Symposium of Electronics and Telecommunications ETC, Kaunas, Lithuania, 4–5 May 2006; pp. 21–23. [Google Scholar]
- von Jena, A.; Mágori, V.; Russwurm, W. Ultrasound Gas-Flow Meter for Household Application. Sens. Actuators A Phys. 1993, 37, 135–140. [Google Scholar] [CrossRef]
- Tewolde, M.; Fritch, J.C.; Longtin, J.P. Design of a Low-Cost, High-Resolution Retrofit Module for Residential Natural Gas Meters. Appl. Therm. Eng. 2015, 75, 357–365. [Google Scholar] [CrossRef]
- Kono, S.; Nagai, N.; Yuasa, K.; Fujimoto, T.; Suzuki, M.; Fujii, Y.; Hiroyama, T. Development of Intelligent Domestic Ultrasonic Gas Meters. In Proceedings of the 23rd World Gas Conference, Amsterdam, The Netherlands, 5–9 June 2006. [Google Scholar]
- Wang, N. Gas and Water Metering Application with MC9S08GW64. In Freescale Semiconductor Inc Application Note AN; Freescale Semiconductor, Inc.: Austin, TX, USA, 2011; Volume 4262. [Google Scholar]
- Wang, Z.; Hu, C.; Zheng, D.; Chen, X. Ultralow-Power Sensing Framework for Internet of Things: A Smart Gas Meter as a Case. IEEE Internet Things J. 2022, 9, 7533–7544. [Google Scholar] [CrossRef]
- Khan, M.F.; Zoha, A.; Ali, R.L. Design and Implementation of Smart Billing and Automated Meter Reading System for Utility Gas. In Proceedings of the 2007 International Conference on Information and Emerging Technologies, Islamabad, Pakistan, 12–13 November 2007; pp. 1–6. [Google Scholar]
- Neda, T.; Nakamura, K.; Takumi, T. A Polysilicon Flow Sensor for Gas Flow Meters. Sens. Actuators A Phys. 1996, 54, 626–631. [Google Scholar] [CrossRef]
- Yoon, E.; Wise, K.D. An Integrated Mass Flow Sensor with On-Chip CMOS Interface Circuitry. IEEE Trans. Electron. Devices 1992, 39, 1376–1386. [Google Scholar] [CrossRef]
- Ripoll-Vercellone, E.; Gasulla, M.; Reverter, F. Electronic Reading of a Mechanical Gas Meter Based on Dual Magnetic Sensing. Meas. Sci. Technol. 2021, 32, 097001. [Google Scholar] [CrossRef]
- Drenthen, J.G.; de Boer, G. The Manufacturing of Ultrasonic Gas Flow Meters. Flow Meas. Instrum. 2001, 12, 89–99. [Google Scholar] [CrossRef]
- Tewolde, M.; Longtin, J.P. High-Resolution Meter Reading System for Gas Utility Meter. In Proceedings of the 2010 IEEE SENSORS, Waikoloa, HI, USA, 1–4 November 2010; pp. 849–852. [Google Scholar]
- Wright, P.H. The Coanda Meter-a Fluidic Digital Gas Flowmeter. J. Phys. E Sci. Instrum. 1980, 13, 433. [Google Scholar] [CrossRef]
- Long, F.; Zhang, J.; Xie, C.; Yuan, Z. Application of the Pockels Effect to High Voltage Measurement. In Proceedings of the 2007 8th International Conference on Electronic Measurement and Instruments, Xi’an, China, 16–18 August 2007; pp. 4–495. [Google Scholar]
- Zhang, Y.; Xiao, X.; Yan, X. Review of Research on Measurement Technologies of DC High Voltage. In Proceedings of the 2015 7th International Conference on Information Technology and Electrical Engineering (ICITEE), Chiang Mai, Thailand, 29–30 October 2015; pp. 179–183. [Google Scholar]
- Malewski, R. Digital Techniques in High-Voltage Measurements. IEEE Trans. Power Appar. Syst. 1982, PAS–101, 4508–4517. [Google Scholar] [CrossRef]
- Cox, M.D.; Williams, T.B. Induction VArhour and Solid-State VArhour Meters Performances on Nonlinear Loads. IEEE Trans. Power Deliv. 1990, 5, 1678–1686. [Google Scholar] [CrossRef]
- Sotirov, S.S.; Tokmakov, D.M.; Mileva, N.S.; Stoyanova-Petrova, S.V.; Kafadarova, N.M. Design and Development of an Electrostatic Voltmeter Based on Surface Potential Sensor. In Proceedings of the 2018 IEEE XXVII International Scientific Conference Electronics-ET, Sozopol, Bulgaria, 13–15 September 2018; pp. 1–4. [Google Scholar]
- Webster, J.G. The Measurement, Instrumentation and Sensors Handbook; CRC Press: Boca Raton, FL, USA, 1998; ISBN 978-0-8493-8347-2. [Google Scholar]
- Arora, J.; Gagandeep; Rawat, S.S.S.; Srinivasan, K.; Puri, V. Design and Development of Digital Voltmeter Using Different Techniques. In Proceedings of the 2014 International Conference on Green Computing Communication and Electrical Engineering (ICGCCEE), Coimbatore, India, 6–8 March 2014; pp. 1–5. [Google Scholar]
- Ziegler, S.; Woodward, R.; Iu, H.; Borle, L. Current Sensing Techniques: A Review. Sens. J. IEEE 2009, 9, 354–376. [Google Scholar] [CrossRef]
- Braudaway, D.W. Behavior of Resistors and Shunts: With Today’s High-Precision Measurement Capability and a Century of Materials Experience, What Can Go Wrong? IEEE Trans. Instrum. Meas. 1999, 48, 889–893. [Google Scholar] [CrossRef]
- Lago, B.; Eatock, R. Coaxial Shunt. Proc. Inst. Electr. Eng. 1967, 114, 1317–1324. [Google Scholar] [CrossRef]
- Costa, F.; Poulichet, P.; Mazaleyrat, F.; Labouré, E. The Current Sensors in Power Electronics, a Review. EPE J. 2001, 11, 7–18. [Google Scholar] [CrossRef]
- Okamura, S.; Okabe, T. A New Device for Measurements of Pulses or High-Frequency Currents. IEEE Trans. Instrum. Meas. 1974, 23, 52–55. [Google Scholar] [CrossRef]
- Dallago, E.; Passoni, M.; Sassone, G. Lossless Current Sensing in Low-Voltage High-Current DC/DC Modular Supplies. IEEE Trans. Ind. Electron. 2000, 47, 1249–1252. [Google Scholar]
- Ziegler, S.; Woodward, R.C.; Iu, H.H.-C.; Borle, L.J. Investigation Into Static and Dynamic Performance of the Copper Trace Current Sense Method. IEEE Sens. J. 2009, 9, 782–792. [Google Scholar] [CrossRef]
- Spaziani, L. Using Copper PCB Etch for Low Value Resistance. In Unitrode Design Note DN-71; Citeseer: Princeton, NJ, USA, 1997; pp. 1–3. [Google Scholar]
- Ray, W.F.; Hewson, C.R. High Performance Rogowski Current Transducers. In Proceedings of the Conference Record of the 2000 IEEE Industry Applications Conference. Thirty-Fifth IAS Annual Meeting and World Conference on Industrial Applications of Electrical Energy (Cat. No.00CH37129), Rome, Italy, 8–12 October 2000; Volume 5, pp. 3083–3090. [Google Scholar]
- Waters, C. Accurate, Isolated Measurements, Pearson Electronics. 1986. Available online: https://pearsonelectronics.com/pdf/PCIM%20Article%2086.pdf (accessed on 13 February 2023).
- das Guerra, F.C.F.; Mota, W.S. Current Transformer Model. IEEE Trans. Power Deliv. 2007, 22, 187–194. [Google Scholar] [CrossRef]
- IEEE Std C57.13-2016 (Revision of IEEE Std C57.13-2008); IEEE Standard Requirements for Instrument Transformers. IEEE: Piscataway, NJ, USA, 2016; pp. 1–96. [CrossRef]
- Ward, D.A.; Exon, J.L.T. Using Rogowski Coils for Transient Current Measurements. Eng. Sci. Educ. J. 1993, 2, 105–113. [Google Scholar] [CrossRef]
- Radun, A. An Alternative Low-Cost Current-Sensing Scheme for High-Current Power Electronics Circuits. IEEE Trans. Ind. Electron. 1995, 42, 78–84. [Google Scholar] [CrossRef]
- Dupraz, J.P.; Fanget, A.; Grieshaber, W.; Montillet, G. Rogowski Coil: Exceptional Current Measurement Tool For Almost Any Application. In Proceedings of the 2007 IEEE Power Engineering Society General Meeting, Tampa, FL, USA, 24–28 June 2007; pp. 1–8. [Google Scholar]
- Samimi, M.H.; Mahari, A.; Farahnakian, M.A.; Mohseni, H. The Rogowski Coil Principles and Applications: A Review. IEEE Sens. J. 2015, 15, 651–658. [Google Scholar] [CrossRef]
- Ripka, P. Electric Current Sensors: A Review. Meas. Sci. Technol. 2010, 21, 112001. [Google Scholar] [CrossRef] [Green Version]
- McLyman, W.T. Reviewing Current Transformers and Current Transducers. In Proceedings of the 2007 Electrical Insulation Conference and Electrical Manufacturing Expo, Indianapolis, Indiana, 23–26 October 2007; pp. 360–365. [Google Scholar]
- Williams, K.L. Fundamentals of Current Transformers. In Proceedings of the Proceedings:Electrical Electronics Insulation Conference and Electrical Manufacturing & Coil Winding Conference, Rosemont, IL, USA, 18–21 September 1995; pp. 23–25. [Google Scholar]
- Solovev, D.B.; Gorkavyy, M.A. Current Transformers: Transfer Functions, Frequency Response, and Static Measurement Error. In Proceedings of the 2019 International Science and Technology Conference “EastConf”, Vladivostok, Russia, 1–2 March 2019; pp. 1–7. [Google Scholar]
- Lenz, J.E. A Review of Magnetic Sensors. Proc. IEEE 1990, 78, 973–989. [Google Scholar] [CrossRef]
- Isolated Current, Voltage Transducers-LEM|DigiKey. Available online: https://www.digikey.com/en/pdf/l/lem-usa/lem-engineering-applications-manual (accessed on 22 November 2022).
- Weiss, R.; Itzke, A.; Reitenspieß, J.; Hoffmann, I.; Weigel, R. A Novel Closed Loop Current Sensor Based on a Circular Array of Magnetic Field Sensors. IEEE Sens. J. 2019, 19, 2517–2524. [Google Scholar] [CrossRef]
- Hall Effect Current Sensing: Open-Loop and Closed-Loop Configurations-Technical Articles. Available online: https://www.allaboutcircuits.com/technical-articles/hall-effect-current-sensing-open-loop-and-closed-loop-configurations/ (accessed on 22 November 2022).
- Dalessandro, L.; Karrer, N.; Kolar, J.W. High-Performance Planar Isolated Current Sensor for Power Electronics Applications. IEEE Trans. Power Electron. 2007, 22, 1682–1692. [Google Scholar] [CrossRef]
- Dalessandro, L.; Karrer, N.; Ciappa, M.; Castellazzi, A.; Fichtner, W. Online and Offline Isolated Current Monitoring of Parallel Switched High-Voltage Multi-Chip IGBT Modules. In Proceedings of the 2008 IEEE Power Electronics Specialists Conference, Rhodes, Greece, 15–19 June 2008. [Google Scholar]
- F.W.Bell Technologies. An Introduction to The Hall Effect. Available online: https://www.lyr-ing.com/DocumentosLyR/HallEffSensors/FWBell_HallCatalog.pdf (accessed on 13 February 2023).
- Popovic, R.S.; Randjelovic, Z.; Manic, D. Integrated Hall-Effect Magnetic Sensors. Sens. Actuators A Phys. 2001, 91, 46–50. [Google Scholar] [CrossRef]
- Ripka, P. Advances in Fluxgate Sensors. Sens. Actuators A Phys. 2003, 106, 8–14. [Google Scholar] [CrossRef]
- Lenz, J.; Edelstein, A. Magnetic Sensors and Their Applications. Sens. J. IEEE 2006, 6, 631–649. [Google Scholar] [CrossRef]
- Primdahl, F. The Fluxgate Mechanism, Part I: The Gating Curves of Parallel and Orthogonal Fluxgates. IEEE Trans. Magn. 1970, 6, 376–383. [Google Scholar] [CrossRef]
- The Flux Gate Working Principle and Theory; Danisense: Taastrup, Denmark, 2021.
- Freitas, P.P.; Ferreira, R.; Cardoso, S.; Cardoso, F. Magnetoresistive Sensors. J. Phys. Condens. Matter 2007, 19, 165221. [Google Scholar] [CrossRef]
- Freitas, P.P.; Cardoso, S.; Ferreira, R.; Martins, V.C.; Guedes, A.; Cardoso, F.A.; Loureiro, J.; Macedo, R.; Chaves, R.C.; Amaral, J. Optimization and Integration of Magnetoresistive Sensors. Spin 2011, 01, 71–91. [Google Scholar] [CrossRef]
- Laimer, G.; Kolar, J.W. Design and Experimental Analysis of a DC to 1 MHz Closed Loop Magnetoresistive Current Sensor. In Proceedings of the Twentieth Annual IEEE Applied Power Electronics Conference and Exposition, 2005. APEC 2005, Hilton Austin, TX, USA, 6–10 March 2005; Volume 2, pp. 1288–1292. [Google Scholar]
- Ennen, I.; Kappe, D.; Rempel, T.; Glenske, C.; Hütten, A. Giant Magnetoresistance: Basic Concepts, Microstructure, Magnetic Interactions and Applications. Sensors 2016, 16, 904. [Google Scholar] [CrossRef] [Green Version]
- Zheng, C.; Zhu, K.; Cardoso de Freitas, S.; Chang, J.-Y.; Davies, J.E.; Eames, P.; Freitas, P.P.; Kazakova, O.; Kim, C.; Leung, C.-W.; et al. Magnetoresistive Sensor Development Roadmap (Non-Recording Applications). IEEE Trans. Magn. 2019, 55, 1–30. [Google Scholar] [CrossRef] [Green Version]
- Jogschies, L.; Klaas, D.; Kruppe, R.; Rittinger, J.; Taptimthong, P.; Wienecke, A.; Rissing, L.; Wurz, M.C. Recent Developments of Magnetoresistive Sensors for Industrial Applications. Sensors 2015, 15, 28665–28689. [Google Scholar] [CrossRef] [Green Version]
- Rogers, A.J.; Xu, J.; Yao, J. Vibration Immunity for Optical-Fiber Current Measurement. J. Light. Technol. 1995, 13, 1371–1377. [Google Scholar] [CrossRef]
- Rogers, A.J. Optical Fiber Current Measurement. In Optical Fiber Sensor Technology; Grattan, K.T.V., Meggitt, B.T., Eds.; Optical and Quantum Electronics Series; Springer: Dordrecht, The Netherlands, 1995; pp. 421–439. ISBN 978-94-011-1210-9. [Google Scholar]
- Bohnert, K.; Frank, A.; Yang, L.; Gu, X.; Müller, G.M. Polarimetric Fiber-Optic Current Sensor With Integrated-Optic Polarization Splitter. J. Light. Technol. JLT 2019, 37, 3672–3678. [Google Scholar] [CrossRef]
- Starostin, N.I.; Ryabko, M.V.; Chamorovskii, Y.K.; Gubin, V.P.; Sazonov, A.I.; Morshnev, S.K.; Korotkov, N.M. Interferometric Fiber-Optic Electric Current Sensor for Industrial Application. Key Eng. Mater. 2010, 437, 314–318. [Google Scholar] [CrossRef]
- Optical Current Sensor Technology|SpringerLink. Available online: https://0-link-springer-com.brum.beds.ac.uk/chapter/10.1007/978-1-4757-6077-4_7 (accessed on 27 November 2022).
- Evaluating Fast Algorithms for Convolutional Neural Networks on FPGAs|IEEE Conference Publication|IEEE Xplore. Available online: https://0-ieeexplore-ieee-org.brum.beds.ac.uk/document/7966660 (accessed on 11 December 2022).
- A High-Throughput and Power-Efficient FPGA Implementation of YOLO CNN for Object Detection|IEEE Transactions on Very Large Scale Integration (VLSI) Systems. Available online: https://0-dl-acm-org.brum.beds.ac.uk/doi/abs/10.1109/TVLSI.2019.2905242 (accessed on 11 December 2022).
- Li, S.; Wu, C.; Li, H.; Li, B.; Wang, Y.; Qiu, Q. FPGA Acceleration of Recurrent Neural Network Based Language Model. In Proceedings of the 2015 IEEE 23rd Annual International Symposium on Field-Programmable Custom Computing Machines, Vancouver, BC, Canada, 2–6 May 2015; pp. 111–118. [Google Scholar]
- Han, S.; Kang, J.; Mao, H.; Hu, Y.; Li, X.; Li, Y.; Xie, D.; Luo, H.; Yao, S.; Wang, Y.; et al. ESE: Efficient Speech Recognition Engine with Sparse LSTM on FPGA. In Proceedings of the 2017 ACM/SIGDA International Symposium on Field-Programmable Gate Arrays, Monterey, CA, USA, 22–24 February 2017. [Google Scholar]
- Hagiwara, K.; Hayashi, T.; Kawasaki, S.; Arakawa, F.; Endo, O.; Nomura, H.; Tsukamoto, A.; Nguyen, D.; Nguyen, B.; Tran, A.; et al. A Two-Stage-Pipeline CPU of SH-2 Architecture Implemented on FPGA and SoC for IoT, Edge AI and Robotic Applications. In Proceedings of the 2018 IEEE Symposium in Low-Power and High-Speed Chips (COOL CHIPS), Yokohama, Japan, 18–20 April 2018; pp. 1–3. [Google Scholar]
- Crosstool-NG. Available online: https://crosstool-ng.github.io/ (accessed on 11 December 2022).
- Yocto Project–It’s Not an Embedded Linux Distribution–It Creates a Custom One for You. Available online: https://www.yoctoproject.org/ (accessed on 11 December 2022).
- TensorFlow Lite|ML for Mobile and Edge Devices. Available online: https://www.tensorflow.org/lite (accessed on 11 December 2022).
- PyTorch. Available online: https://www.pytorch.org (accessed on 11 December 2022).
- Neural Networks API|Android NDK. Available online: https://developer.android.com/ndk/guides/neuralnetworks (accessed on 11 December 2022).
- Core ML Tools Overview. Available online: https://coremltools.readme.io/docs (accessed on 11 December 2022).
- Qualcomm Neural Processing SDK for AI. Available online: https://developer.qualcomm.com/software/qualcomm-neural-processing-sdk (accessed on 11 December 2022).
- HiAI-HiAI IDE-HUAWEI Developer. Available online: https://developer.huawei.com/consumer/en/hiai/ (accessed on 11 December 2022).
- MicroTensor. Available online: https://utensor.github.io/website/ (accessed on 11 December 2022).
- DeepC. 2022. Available online: https://github.com/ai-techsystems/deepC (accessed on 13 February 2022).
- Rotem, N.; Fix, J.; Abdulrasool, S.; Catron, G.; Deng, S.; Dzhabarov, R.; Gibson, N.; Hegeman, J.; Lele, M.; Levenstein, R.; et al. Glow: Graph Lowering Compiler Techniques for Neural Networks. arXiv 2019, arXiv:1805.00907. [Google Scholar]
- OpenVINO. Wikipedia; PediaPress: Mainz, Germany, 2022. [Google Scholar]
- Kendryte/Nncase; GitHub: San Francisco, CA, USA, 2022.
- X-CUBE-AI-AI Expansion Pack for STM32CubeMX-STMicroelectronics. Available online: https://www.st.com/en/embedded-software/x-cube-ai.html (accessed on 11 December 2022).
- ONNC. Available online: https://onnc.ai (accessed on 11 December 2022).
- Apache TVM. Available online: https://tvm.apache.org/ (accessed on 11 December 2022).
- EIQ® ML Software Development Environment|NXP Semiconductors. Available online: https://www.nxp.com/design/software/development-software/eiq-ml-development-environment:EIQ (accessed on 11 December 2022).
- ONNX|Home. Available online: https://onnx.ai/ (accessed on 11 December 2022).
- OneAPI Programming Model. Available online: https://simplecore.intel.com/oneapi-io/ (accessed on 11 December 2022).
- Stiller, B.; Schiller, E.; Schmitt, C. An Overview of Network Communication Technologies for IoT. In Handbook of Internet-of-Things; Researchgate: Berlin, Germany, 2021. [Google Scholar]
- Al-Sarawi, S.; Anbar, M.; Alieyan, K.; Alzubaidi, M. Internet of Things (IoT) Communication Protocols: Review. In Proceedings of the 2017 8th International Conference on Information Technology (ICIT), Amman, Jordan, 17–18 May 2017; pp. 685–690. [Google Scholar]
- Dizdarević, J.; Carpio, F.; Jukan, A.; Masip-Bruin, X. A Survey of Communication Protocols for Internet of Things and Related Challenges of Fog and Cloud Computing Integration. ACM Comput. Surv. 2019, 51, 116:1–116:29. [Google Scholar] [CrossRef]
- Molina-Markham, A.; Shenoy, P.; Fu, K.; Cecchet, E.; Irwin, D. Private Memoirs of a Smart Meter. In Proceedings of the 2nd ACM Workshop on Embedded Sensing Systems for Energy-Efficiency in Building-BuildSys’10, Zurich, Switzerland, 2 November 2010; ACM Press: New York, NY, USA, 2010; p. 61. [Google Scholar]
- TED-The-Energy-Detective.Com-The Energy Detective Home Energy Monitoring. Available online: https://www.theenergydetective.com/ (accessed on 12 December 2022).
- Govinda, K. Design of Smart Meter Using Atmel 89S52 Microcontroller. Procedia Technol. 2015, 21, 376–380. [Google Scholar] [CrossRef] [Green Version]
- Son, Y.; Pulkkinen, T.; Moon, K.; Kim, C. Home Energy Management System Based on Power Line Communication. IEEE Trans. Consum. Electron. 2010, 56, 1380–1386. [Google Scholar] [CrossRef]
- Koay, B.S.; Cheah, S.S.; Sng, Y.H.; Chong, P.H.J.; Shum, P.; Tong, Y.C.; Wang, X.Y.; Zuo, Y.X.; Kuek, H.W. Design and Implementation of Bluetooth Energy Meter. In Proceedings of the Fourth International Conference on Information, Communications and Signal Processing, 2003 and the Fourth Pacific Rim Conference on Multimedia, Singapore, 15–18 December 2003; Volume 3, pp. 1474–1477. [Google Scholar]
- Lee, P.K.; Lai, L.L. A Practical Approach of Smart Metering in Remote Monitoring of Renewable Energy Applications. In Proceedings of the 2009 IEEE Power & Energy Society General Meeting, Calgary, AB, Canada, 26–30 July 2009; pp. 1–4. [Google Scholar]
- Cho, H.S.; Yamazaki, T.; Hahn, M. Determining Location of Appliances from Multi-Hop Tree Structures of Power Strip Type Smart Meters. IEEE Trans. Consum. Electron. 2009, 55, 2314–2322. [Google Scholar] [CrossRef]
- Browne, T.J.; Vittal, V.; Heydt, G.T.; Messina, A.R. A Comparative Assessment of Two Techniques for Modal Identification From Power System Measurements. IEEE Trans. Power Syst. 2008, 23, 1408–1415. [Google Scholar] [CrossRef]
- Hauer, J.; Trudnowski, D.; Rogers, G.; Mittelstadt, B.; Litzenberger, W.; Johnson, J. Keeping an Eye on Power System Dynamics. IEEE Comput. Appl. Power 1997, 10, 50–54. [Google Scholar] [CrossRef]
- Serra, H.; Correia, J.; Gano, A.J.; de Campos, A.M.; Teixeira, I. Domestic Power Consumption Measurement and Automatic Home Appliance Detection. In Proceedings of the IEEE International Workshop on Intelligent Signal Processing, Faro, Portugal, 1–3 September 2005; pp. 128–132. [Google Scholar]
- Rosenthal, A.L.; Mani, J.; Kachare, M. Low Cost AC Power Monitor for Residential PV Support. In Proceedings of the Conference Record of the Twenty-Ninth IEEE Photovoltaic Specialists Conference, New Orleans, LA, USA, 19–24 May 2002; pp. 1473–1475. [Google Scholar]
- Wan, N. Exceeding 60 Year Life Expectancy from an Electronic Energy Meter. In Proceedings of the Metering Asia Pacific Conference, Wilmington, MA, USA, 20–22 February 2001. [Google Scholar]
- Kabalcı, E.; Kabalcı, Y.; Siano, P. Design and Implementation of a Smart Metering Infrastructure for Low Voltage Microgrids. Int. J. Electr. Power Energy Syst. 2022, 134, 107375. [Google Scholar] [CrossRef]
- Kabalci, E.; Kabalci, Y. A Wireless Metering and Monitoring System for Solar String Inverters. Int. J. Electr. Power Energy Syst. 2018, 96, 282–295. [Google Scholar] [CrossRef]
- Le, P.T.; Tsai, H.-L.; Lam, T.H. A Wireless Visualization Monitoring, Evaluation System for Commercial Photovoltaic Modules Solely in MATLAB/Simulink Environment. Sol. Energy 2016, 140, 1–11. [Google Scholar] [CrossRef]
- Short, T.A. Advanced Metering for Phase Identification, Transformer Identification, and Secondary Modeling. IEEE Trans. Smart Grid 2013, 4, 651–658. [Google Scholar] [CrossRef]
- Arya, V.; Seetharam, D.; Kalyanaraman, S.; Dontas, K.; Pavlovski, C.; Hoy, S.; Kalagnanam, J.R. Phase Identification in Smart Grids. In Proceedings of the 2011 IEEE International Conference on Smart Grid Communications (SmartGridComm), Brussels, Belgium, 17–20 October 2011; pp. 25–30. [Google Scholar]
- Maitra, S. Embedded Energy Meter- A New Concept To Measure The Energy Consumed By A Consumer And To Pay The Bill. In Proceedings of the 2008 Joint International Conference on Power System Technology and IEEE Power India Conference, New Delhi, India, 12–15 October 2008; pp. 1–8. [Google Scholar]
- Kamat, V.N. Enabling an Electrical Revolution Using Smart Apparent Energy Meters & Tariffs. In Proceedings of the 2011 Annual IEEE India Conference, London, UK, 6–8 July 2011; pp. 1–4. [Google Scholar]
- Arif, A.; Al-Hussain, M.; Al-Mutairi, N.; Al-Ammar, E.; Khan, Y.; Malik, N. Experimental Study and Design of Smart Energy Meter for the Smart Grid. In Proceedings of the 2013 International Renewable and Sustainable Energy Conference (IRSEC), Ouarzazate, Morocco, 7–9 March 2013; pp. 515–520. [Google Scholar]
- Tan, H.G.R.; Lee, C.H.; Mok, V.H. Automatic Power Meter Reading System Using GSM Network. In Proceedings of the 2007 International Power Engineering Conference (IPEC 2007), Singapore, 3–6 December 2007; pp. 465–469. [Google Scholar]
- Azasoo, J.Q.; Boateng, K.O. Smart Metering: A GSM Approach in Ghana. In Proceedings of the 2012 IEEE 4th International Conference on Adaptive Science & Technology (ICAST), Seoul, South Korea, 21–24 August 2012; pp. 158–163. [Google Scholar]
- Wasi-ur-Rahman, M.; Rahman, M.T.; Khan, T.H.; Kabir, S.M.L. Design of an Intelligent SMS Based Remote Metering System. In Proceedings of the 2009 International Conference on Information and Automation, Zhuhai/Macau, China, 22–24 June 2009; pp. 1040–1043. [Google Scholar]
- Wenzheng, Z. Design and Implementation on Wireless Power Meter System Based on GSM Network. In Proceedings of the 2010 International Conference on Computer, Mechatronics, Control and Electronic Engineering, Changchun, China, 24–26 August 2010; Volume 2, pp. 76–79. [Google Scholar]
- Primicanta, A.H.; Nayan, M.Y.; Awan, M. ZigBee-GSM Based Automatic Meter Reading System. In Proceedings of the 2010 International Conference on Intelligent and Advanced Systems, Kuala Lumpur, Malaysia, 15–17 June 2010; pp. 1–5. [Google Scholar]
- Luan, S.-W.; Teng, J.-H.; Chan, S.-Y.; Hwang, L.-C. Development of a Smart Power Meter for AMI Based on ZigBee Communication. In Proceedings of the 2009 International Conference on Power Electronics and Drive Systems (PEDS), Taipei, Taiwan, 2–5 November 2009; pp. 661–665. [Google Scholar]
- Chen, S.; Yang, Z. A Low Cost Single Phase PLC Watt-Hour Meter Based on SoC. In Proceedings of the 2012 2nd International Conference on Consumer Electronics, Communications and Networks (CECNet), Yichang, China, 21–23 April 2012; pp. 1523–1526. [Google Scholar]
- Lee, S.-W.; Wu, C.-S.; Chiou, M.-S.; Wu, K.-T. Design of an Automatic Meter Reading System [Electricity Metering]. In Proceedings of the 22nd International Conference on Industrial Electronics, Control, and Instrumentation Proceedings of the 1996 IEEE IECON, Taipei, Taiwan, 9 August 1996; Volume 1, pp. 631–636. [Google Scholar]
- Wu, C.-H.; Chang, S.-C.; Huang, Y.-W. Design of a Wireless ARM-Based Automatic Meter Reading and Control System. In Proceedings of the IEEE Power Engineering Society General Meeting, Denver, CO, USA, 6–10 June 2004; 2004; Volume 1, pp. 957–962. [Google Scholar]
- Kaicheng, L.; Jianfeng, L.; Congyuan, Y.; Ming, Z. Remote Power Management and Meter-Reading System Based on ARM Microprocessor. In Proceedings of the 2008 Conference on Precision Electromagnetic Measurements Digest, Broomfield, CO, USA, 8–13 June 2008; pp. 216–217. [Google Scholar]
- Klemenjak, C.; Egarter, D.; Elmenreich, W. YoMo: The Arduino-Based Smart Metering Board. Comput. Sci. Res. Dev. 2016, 31, 97–103. [Google Scholar] [CrossRef] [Green Version]
- Metering, A.S.; Visalatchi, S.; Sandeep, K.K. Smart Energy Metering and Power Theft Control Using Arduino & GSM. In Proceedings of the 2017 2nd International Conference for Convergence in Technology (I2CT), Mumbai, India, 7–9 April 2017; pp. 858–961. [Google Scholar]
- Gunawan, T.S.; Anuar, M.H.; Kartiwi, M.; Janin, Z. Development of Power Factor Meter Using Arduino. In Proceedings of the 2018 IEEE 5th International Conference on Smart Instrumentation, Measurement and Application (ICSIMA), Songkhla, Thailand, 28–30 November 2018; pp. 1–4. [Google Scholar]
- Yoeseph, N.M.; Safi’ie, M.A.; Purnomo, F.A. Smart Energy Meter Based on Arduino and Internet of Things. IOP Conf. Ser. Mater. Sci. Eng. 2019, 578, 012085. [Google Scholar] [CrossRef]
- Hlaing, W.; Thepphaeng, S.; Nontaboot, V.; Tangsunantham, N.; Sangsuwan, T.; Pira, C. Implementation of WiFi-Based Single Phase Smart Meter for Internet of Things (IoT). In Proceedings of the 2017 International Electrical Engineering Congress (iEECON), Pattaya, Thailand, 8–10 March 2017; pp. 1–4. [Google Scholar]
- De Santis, D.; Giampetruzzi, D.A.; Abbatantuono, G.; La Scala, M. Smart Metering for Low Voltage Electrical Distribution System Using Arduino Due. In Proceedings of the 2016 IEEE Workshop on Environmental, Energy, and Structural Monitoring Systems (EESMS), Bari, Italy, 13–14 June 2016; pp. 1–6. [Google Scholar]
- Stusek, M.; Pokorny, J.; Masek, P.; Hajny, J.; Hosek, J. A Non-Invasive Electricity Measurement within the Smart Grid Landscape: Arduino-Based Visualization Platform for IoT. In Proceedings of the 2017 9th International Congress on Ultra Modern Telecommunications and Control Systems and Workshops (ICUMT), Munich, Germany, 6–8 November 2017; pp. 423–429. [Google Scholar]
- Sayed, S.; Hussain, T.; Gastli, A.; Benammar, M. Design and Realization of an Open-Source and Modular Smart Meter. Energy Sci. Eng. 2019, 7, 1405–1422. [Google Scholar] [CrossRef] [Green Version]
- Pawar, J.P.; Amirthaganesh, S.; ArunKumar, S.; Kumar, S. Real Time Energy Measurement Using Smart Meter. In Proceedings of the 2016 Online International Conference on Green Engineering and Technologies (IC-GET), Coimbatore, India, 19 November 2016; pp. 1–5. [Google Scholar]
- Olivares-Rojas, J.C.; Reyes-Archundia, E.; Gutiérrez-Gnecchi, J.A.; Molina-Moreno, I.; Téllez-Anguiano, A.C.; Cerda-Jacobo, J. Smart Metering System Data Analytics Platform Using Multicore Edge Computing. Int. J. Reconfigurable Embed. Syst. 2021, 10, 11. [Google Scholar] [CrossRef]
- Mudaliar, M.D.; Sivakumar, N. IoT Based Real Time Energy Monitoring System Using Raspberry Pi. Internet Things 2020, 12, 100292. [Google Scholar] [CrossRef]
- Rodrigues Junior, W.L.; Borges, F.A.S.; da Veloso, A.F.S.; de Rabêlo, R.A.L.; Rodrigues, J.J.P.C. Low Voltage Smart Meter for Monitoring of Power Quality Disturbances Applied in Smart Grid. Measurement 2019, 147, 106890. [Google Scholar] [CrossRef]
- Pawar, P.; TarunKumar, M.; Vittal, K.P. An IoT Based Intelligent Smart Energy Management System with Accurate Forecasting and Load Strategy for Renewable Generation. Measurement 2020, 152, 107187. [Google Scholar] [CrossRef]
- Molina-Markham, A.; Danezis, G.; Fu, K.; Shenoy, P.; Irwin, D. Designing Privacy-Preserving Smart Meters with Low-Cost Microcontrollers. In Proceedings of the Financial Cryptography and Data Security: 16th International Conference, FC 2012, Kralendijk, Bonaire, 27 Februray–2 March 2012; Keromytis, A.D., Ed.; Springer: Berlin/Heidelberg, Germany, 2012; pp. 239–253. [Google Scholar]
- Abbasinezhad-Mood, D.; Nikooghadam, M. An Ultra-Lightweight and Secure Scheme for Communications of Smart Meters and Neighborhood Gateways by Utilization of an ARM Cortex-M Microcontroller. IEEE Trans. Smart Grid 2018, 9, 6194–6205. [Google Scholar] [CrossRef]
- Abbasinezhad-Mood, D.; Nikooghadam, M. Design of an Enhanced Message Authentication Scheme for Smart Grid and Its Performance Analysis on an ARM Cortex-M3 Microcontroller. J. Inf. Secur. Appl. 2018, 40, 9–19. [Google Scholar] [CrossRef]
- Patel, H.K.; Mody, T.; Goyal, A. Arduino Based Smart Energy Meter Using GSM. In Proceedings of the 2019 4th International Conference on Internet of Things: Smart Innovation and Usages (IoT-SIU), Ghaziabad, India, 18–19 April 2019; pp. 1–6. [Google Scholar]
- Yaemprayoon, S.; Boonplian, V.; Srinonchat, J. Developing an Innovation Smart Meter Based on CS5490. In Proceedings of the 2016 13th International Conference on Electrical Engineering/Electronics, Computer, Telecommunications and Information Technology (ECTI-CON), Chiang Mai, Thailand, 28 June 2016–1 July 2016; pp. 1–4. [Google Scholar]
- Aurilio, G.; Gallo, D.; Landi, C.; Luiso, M.; Graditi, G. A Low Cost Smart Meter Network for a Smart Utility. In Proceedings of the 2014 IEEE International Instrumentation and Measurement Technology Conference (I2MTC) Proceedings, Montevideo, Uruguay, 12–15 May 2014; pp. 380–385. [Google Scholar]
- Caruso, M.; Miceli, R.; Romano, P.; Schettino, G.; Spataro, C.; Viola, F. A Low-Cost, Real-Time Monitoring System for PV Plants Based on ATmega 328P-PU Microcontroller. In Proceedings of the 2015 IEEE International Telecommunications Energy Conference (INTELEC), Osaka, Japan, 18–22 October 2015; pp. 1–5. [Google Scholar]
- Ranjith, T.; Sivraj, P. Futuristic Smart Energy Meter-Design Based on Embedded Perspective. In Proceedings of the 2018 Second International Conference on Intelligent Computing and Control Systems (ICICCS), Madurai, India, 14–15 June 2018; pp. 1379–1384. [Google Scholar]
- Viciana, E.; Arrabal-Campos, F.M.; Alcayde, A.; Baños, R.; Montoya, F.G. All-in-One Three-Phase Smart Meter and Power Quality Analyzer with Extended IoT Capabilities. Measurement 2023, 206, 112309. [Google Scholar] [CrossRef]
- Viciana, E.; Alcayde, A.; Montoya, F.G.; Baños, R.; Arrabal-Campos, F.M.; Manzano-Agugliaro, F. An Open Hardware Design for Internet of Things Power Quality and Energy Saving Solutions. Sensors 2019, 19, 627. [Google Scholar] [CrossRef] [Green Version]
- Zakaret, C.; Peladarinos, N.; Cheimaras, V.; Tserepas, E.; Papageorgas, P.; Aillerie, M.; Piromalis, D.; Agavanakis, K. Blockchain and Secure Element, a Hybrid Approach for Secure Energy Smart Meter Gateways. Sensors 2022, 22, 9664. [Google Scholar] [CrossRef]
- Yan, W.; Zhu, H.; Che, G.; Hong, M.; Gao, M.; Lin, H. Modular Multi-User Smart Metering System. In Proceedings of the 2022 41st Chinese Control Conference (CCC), Hefei, China, 25–27 July 2022; pp. 5788–5793. [Google Scholar]
- Muhammad, N.; David, R. Hierarchical Smart Meter Data Hub Initiative for Enabling IoT Based Smart Grid in Indonesia. AIP Conf. Proc. 2022, 2453, 020051. [Google Scholar]
- DEUSSOM, E.; Magoudaya, D.; Cyrille, F.; Sone, M. Design of an NB-IoT Smart Metering Solution: Coverage and Capacity Planning: Case of Yaoundé and Douala. Int. J. Comput. Appl. 2022, 184, 20–30. [Google Scholar] [CrossRef]
- Li, Y.; Liu, J.; Wei, Z.; Yang, B.; Zhang, J.; Yang, Y.; Liu, Z.; Sun, T. IoT Based New Power Consumption Measurement and Perception System and Its Applications. In Proceedings of the International Conference on Internet of Things and Machine Learning (IoTML 2021), Montreal, QC, Canada, 22 April 2022; Volume 12174, pp. 20–25. [Google Scholar]
- Sebastian, P.K.; Deepa, K. Internet of Things Based Smart Energy Meter with Fault Detection Feature and Theft Detection. In Proceedings of the 2022 International Conference on Electronics and Renewable Systems (ICEARS), Tuticorin, India, 16–18 March 2022; pp. 494–500. [Google Scholar]
- Laayati, O.; El Hadraoui, H.; Bouzi, M.; El-Alaoui, A.; Kousta, A.; Chebak, A. Smart Energy Management System: Blockchain-Based Smart Meters in Microgrids. In Proceedings of the 2022 4th Global Power, Energy and Communication Conference (GPECOM), Cappadocia, Turkey, 14–17 June 2022; pp. 580–585. [Google Scholar]
- Bansal, D.; Gupta, K.; Sharen Ganesh, M.C.; Goyal, J.; Tharani, K.; Sharma, S. Smart Energy Meter Based on Hall Effect Current Sensing Techniques with IoT Modules. J. Inf. Optim. Sci. 2022, 43, 225–231. [Google Scholar] [CrossRef]
- Yu, C.-N.; Mirowski, P.; Ho, T.K. A Sparse Coding Approach to Household Electricity Demand Forecasting in Smart Grids. IEEE Trans. Smart Grid 2016, 8, 738–748. [Google Scholar] [CrossRef]
- Mocanu, E.; Nguyen, P.H.; Gibescu, M.; Kling, W.L. Deep Learning for Estimating Building Energy Consumption. Sustain. Energy Grids Netw. 2016, 6, 91–99. [Google Scholar] [CrossRef]
- Hsiao, Y.-H. Household Electricity Demand Forecast Based on Context Information and User Daily Schedule Analysis from Meter Data. IEEE Trans. Ind. Inform. 2014, 11, 33–43. [Google Scholar] [CrossRef]
- Dewangan, F.; Abdelaziz, A.Y.; Biswal, M. Load Forecasting Models in Smart Grid Using Smart Meter Information: A Review. Energies 2023, 16, 1404. [Google Scholar] [CrossRef]
- Edwards, R.E.; New, J.; Parker, L.E. Predicting Future Hourly Residential Electrical Consumption: A Machine Learning Case Study. Energy Build. 2012, 49, 591–603. [Google Scholar] [CrossRef]
- Sevlian, R.; Rajagopal, R. Short Term Electricity Load Forecasting on Varying Levels of Aggregation. arXiv 2014, arXiv:1404.0058. [Google Scholar]
- Tarmanini, C.; Sarma, N.; Gezegin, C.; Ozgonenel, O. Short Term Load Forecasting Based on ARIMA and ANN Approaches. Energy Rep. 2023, 9, 550–557. [Google Scholar] [CrossRef]
- Chitsaz, H.; Shaker, H.; Zareipour, H.; Wood, D.; Amjady, N. Short-Term Electricity Load Forecasting of Buildings in Microgrids. Energy Build. 2015, 99, 50–60. [Google Scholar] [CrossRef]
- Da Silva, P.G.; Ilić, D.; Karnouskos, S. The Impact of Smart Grid Prosumer Grouping on Forecasting Accuracy and Its Benefits for Local Electricity Market Trading. IEEE Trans. Smart Grid 2013, 5, 402–410. [Google Scholar] [CrossRef]
- Depuru, S.S.S.R.; Wang, L.; Devabhaktuni, V.; Green, R.C. High Performance Computing for Detection of Electricity Theft. Int. J. Electr. Power Energy Syst. 2013, 47, 21–30. [Google Scholar] [CrossRef]
- Jindal, A.; Dua, A.; Kaur, K.; Singh, M.; Kumar, N.; Mishra, S. Decision Tree and SVM-Based Data Analytics for Theft Detection in Smart Grid. IEEE Trans. Ind. Inform. 2016, 12, 1005–1016. [Google Scholar] [CrossRef]
- Júnior, L.A.P.; Ramos, C.C.O.; Rodrigues, D.; Pereira, D.R.; de Souza, A.N.; da Costa, K.A.P.; Papa, J.P. Unsupervised Non-Technical Losses Identification through Optimum-Path Forest. Electr. Power Syst. Res. 2016, 140, 413–423. [Google Scholar] [CrossRef] [Green Version]
- Nizar, A.H.; Dong, Z.Y.; Wang, Y. Power Utility Nontechnical Loss Analysis with Extreme Learning Machine Method. IEEE Trans. Power Syst. 2008, 23, 946–955. [Google Scholar] [CrossRef]
- Botev, V.; Almgren, M.; Gulisano, V.; Landsiedel, O.; Papatriantafilou, M.; van Rooij, J. Detecting Non-Technical Energy Losses through Structural Periodic Patterns in AMI Data. In Proceedings of the 2016 IEEE International Conference on Big Data (Big Data), Washington, DC, USA, 5–8 December 2016; pp. 3121–3130. [Google Scholar]
- de Souza, M.A.; Pereira, J.L.R.; de Alves, G.O.; de Oliveira, B.C.; Melo, I.D.; Garcia, P.A.N. Detection and Identification of Energy Theft in Advanced Metering Infrastructures. Electr. Power Syst. Res. 2020, 182, 106258. [Google Scholar] [CrossRef]
- Jain, A.; Verma, M.K. A Communication-Assisted Scheme in Radial Distribution Systems Using Phasor Measurement Units. IETE Tech. Rev. 2020, 37, 489–503. [Google Scholar] [CrossRef]
- Peppanen, J.; Zhang, X.; Grijalva, S.; Reno, M.J. Handling Bad or Missing Smart Meter Data through Advanced Data Imputation. In Proceedings of the 2016 IEEE Power & Energy Society Innovative Smart Grid Technologies Conference (ISGT), Minneapolis, MN, USA, 6–9 September 2016; pp. 1–5. [Google Scholar]
- Li, X.; Bowers, C.P.; Schnier, T. Classification of Energy Consumption in Buildings with Outlier Detection. IEEE Trans. Ind. Electron. 2009, 57, 3639–3644. [Google Scholar] [CrossRef]
- Luo, J.; Hong, T.; Yue, M. Real-Time Anomaly Detection for Very Short-Term Load Forecasting. J. Mod. Power Syst. Clean Energy 2018, 6, 235–243. [Google Scholar] [CrossRef] [Green Version]
- Huang, H.; Yan, Q.; Zhao, Y.; Lu, W.; Liu, Z.; Li, Z. False Data Separation for Data Security in Smart Grids. Knowl. Inf. Syst. 2017, 52, 815–834. [Google Scholar] [CrossRef]
- Yuan, Y.; Jia, K. A Distributed Anomaly Detection Method of Operation Energy Consumption Using Smart Meter Data. In Proceedings of the 2015 International Conference on Intelligent Information Hiding and Multimedia Signal Processing (IIH-MSP), Adelaide, Australia, 23–25 September 2015; pp. 310–313. [Google Scholar]
- Wan Yen, S.; Morris, S.; Ezra, M.A.G.; Jun Huat, T. Effect of Smart Meter Data Collection Frequency in an Early Detection of Shorter-Duration Voltage Anomalies in Smart Grids. Int. J. Electr. Power Energy Syst. 2019, 109, 1–8. [Google Scholar] [CrossRef]
- Andrysiak, T.; Saganowski, Ł.; Kiedrowski, P. Anomaly Detection in Smart Metering Infrastructure with the Use of Time Series Analysis. J. Sens. 2017, 2017, e8782131. [Google Scholar] [CrossRef] [Green Version]
- Yu, X.; Yang, X.; Tan, Q.; Shan, C.; Lv, Z. An Edge Computing Based Anomaly Detection Method in IoT Industrial Sustainability. Appl. Soft Comput. 2022, 128, 109486. [Google Scholar] [CrossRef]
- Shafiq, M.; Tian, Z.; Bashir, A.K.; Du, X.; Guizani, M. IoT Malicious Traffic Identification Using Wrapper-Based Feature Selection Mechanisms. Comput. Secur. 2020, 94, 101863. [Google Scholar] [CrossRef]
- Vercamer, D.; Steurtewagen, B.; Van den Poel, D.; Vermeulen, F. Predicting Consumer Load Profiles Using Commercial and Open Data. IEEE Trans. Power Syst. 2015, 31, 3693–3701. [Google Scholar] [CrossRef]
- Kavousian, A.; Rajagopal, R.; Fischer, M. Determinants of Residential Electricity Consumption: Using Smart Meter Data to Examine the Effect of Climate, Building Characteristics, Appliance Stock, and Occupants’ Behavior. Energy 2013, 55, 184–194. [Google Scholar] [CrossRef]
- Granell, R.; Axon, C.J.; Wallom, D.C. Clustering Disaggregated Load Profiles Using a Dirichlet Process Mixture Model. Energy Convers. Manag. 2015, 92, 507–516. [Google Scholar] [CrossRef] [Green Version]
- Chalmers, C.; Hurst, W.; Mackay, M.; Fergus, P. Smart Meter Profiling for Health Applications. In Proceedings of the 2015 International Joint Conference on Neural Networks (IJCNN), Killarney, Ireland, 12–17 July 2015; pp. 1–7. [Google Scholar]
- Clement, J.; Ploennigs, J.; Kabitzsch, K. Smart Meter: Detect and Individualize ADLs. In Proceedings of the Ambient Assisted Living: 5. AAL-Kongress 2012, Berlin, Germany, 24–25 January 2012; Wichert, R., Eberhardt, B., Eds.; Advanced Technologies and Societal Change. Springer: Berlin/Heidelberg, Germany, 2012; pp. 107–122, ISBN 978-3-642-27491-6. [Google Scholar]
- Clement, J.; Ploennigs, J.; Kabitzsch, K. Detecting Activities of Daily Living with Smart Meters. In Proceedings of the Ambient Assisted Living; Wichert, R., Klausing, H., Eds.; Springer: Berlin/Heidelberg, Germany, 2014; pp. 143–160. [Google Scholar]
- Liao, J.; Stankovic, L.; Stankovic, V. Detecting Household Activity Patterns from Smart Meter Data. In Proceedings of the 2014 International Conference on Intelligent Environments, Shanghai, China, 30 June–4 July 2014; pp. 71–78. [Google Scholar]
- Wilson, C.; Lina, S.; Stankovic, V.; Liao, J.; Coleman, M.; Hauxwell-Baldwin, R.; Kane, T.; Firth, S.; Hassan, T. Identifying the Time Profile of Everyday Activities in the Home Using Smart Meter Data. In Proceedings of the ECEEE Summer Study on Buildings; UEA Digital Repository: Norwich, UK, 2015; Volume 2, pp. 933–945. [Google Scholar]
- Chakraborty, S.; Das, S. Application of Smart Meters in High Impedance Fault Detection on Distribution Systems. IEEE Trans. Smart Grid 2019, 10, 3465–3473. [Google Scholar] [CrossRef]
- Vieira, F.L.; Filho, J.M.C.; Silveira, P.M.; Guerrero, C.A.V.; Leite, M.P. High Impedance Fault Detection and Location in Distribution Networks Using Smart Meters. In Proceedings of the 2018 18th International Conference on Harmonics and Quality of Power (ICHQP), Ljubljana, Slovenia, 13–16 May 2018; pp. 1–6. [Google Scholar]
- Shahid, N.; Aleem, S.A.; Naqvi, I.H.; Zaffar, N. Support Vector Machine Based Fault Detection & Classification in Smart Grids. In Proceedings of the 2012 IEEE Globecom Workshops, Anaheim, CA, USA, 3–7 December 2012; pp. 1526–1531. [Google Scholar]
- Koziy, K.; Gou, B.; Aslakson, J. A Low-Cost Power-Quality Meter With Series Arc-Fault Detection Capability for Smart Grid. IEEE Trans. Power Deliv. 2013, 28, 1584–1591. [Google Scholar] [CrossRef]
- Karthick, T.; Chandrasekaran, K. Design of IoT Based Smart Compact Energy Meter for Monitoring and Controlling the Usage of Energy and Power Quality Issues with Demand Side Management for a Commercial Building. Sustain. Energy Grids Netw. 2021, 26, 100454. [Google Scholar] [CrossRef]
- Hu, N.; Tian, Z.; Du, X.; Guizani, N.; Zhu, Z. Deep-Green: A Dispersed Energy-Efficiency Computing Paradigm for Green Industrial IoT. IEEE Trans. Green Commun. Netw. 2021, 5, 750–764. [Google Scholar] [CrossRef]
Figure 1.
Smart energy concept. Generation, distribution, and consumption scenarios are boxed. IoT is used to sense and control the different components of the system. ICT and AI are used to control the overall system to meet grand challenges (free icon art is used for illustration).
Figure 1.
Smart energy concept. Generation, distribution, and consumption scenarios are boxed. IoT is used to sense and control the different components of the system. ICT and AI are used to control the overall system to meet grand challenges (free icon art is used for illustration).

Figure 2.
Functionality and nature of smart meter: (a) smart meter as combination of sensing, hardware, and software components; (b) functionality of smart meter according to the location in IoT stack; (c) functionality of smart meter according to the location in the grid.
Figure 2.
Functionality and nature of smart meter: (a) smart meter as combination of sensing, hardware, and software components; (b) functionality of smart meter according to the location in IoT stack; (c) functionality of smart meter according to the location in the grid.

Figure 3.
Smart meter as a physical node consists of sensing technique, computation platform, and communication technology. Computation platform consists of hardware, such as single board computers, microcontrollers, and system on chip and software such as API tools. Communication technology consists of data communication and middleware protocols.

Figure 4.
Usage cube for different IoT technologies for smart meters.


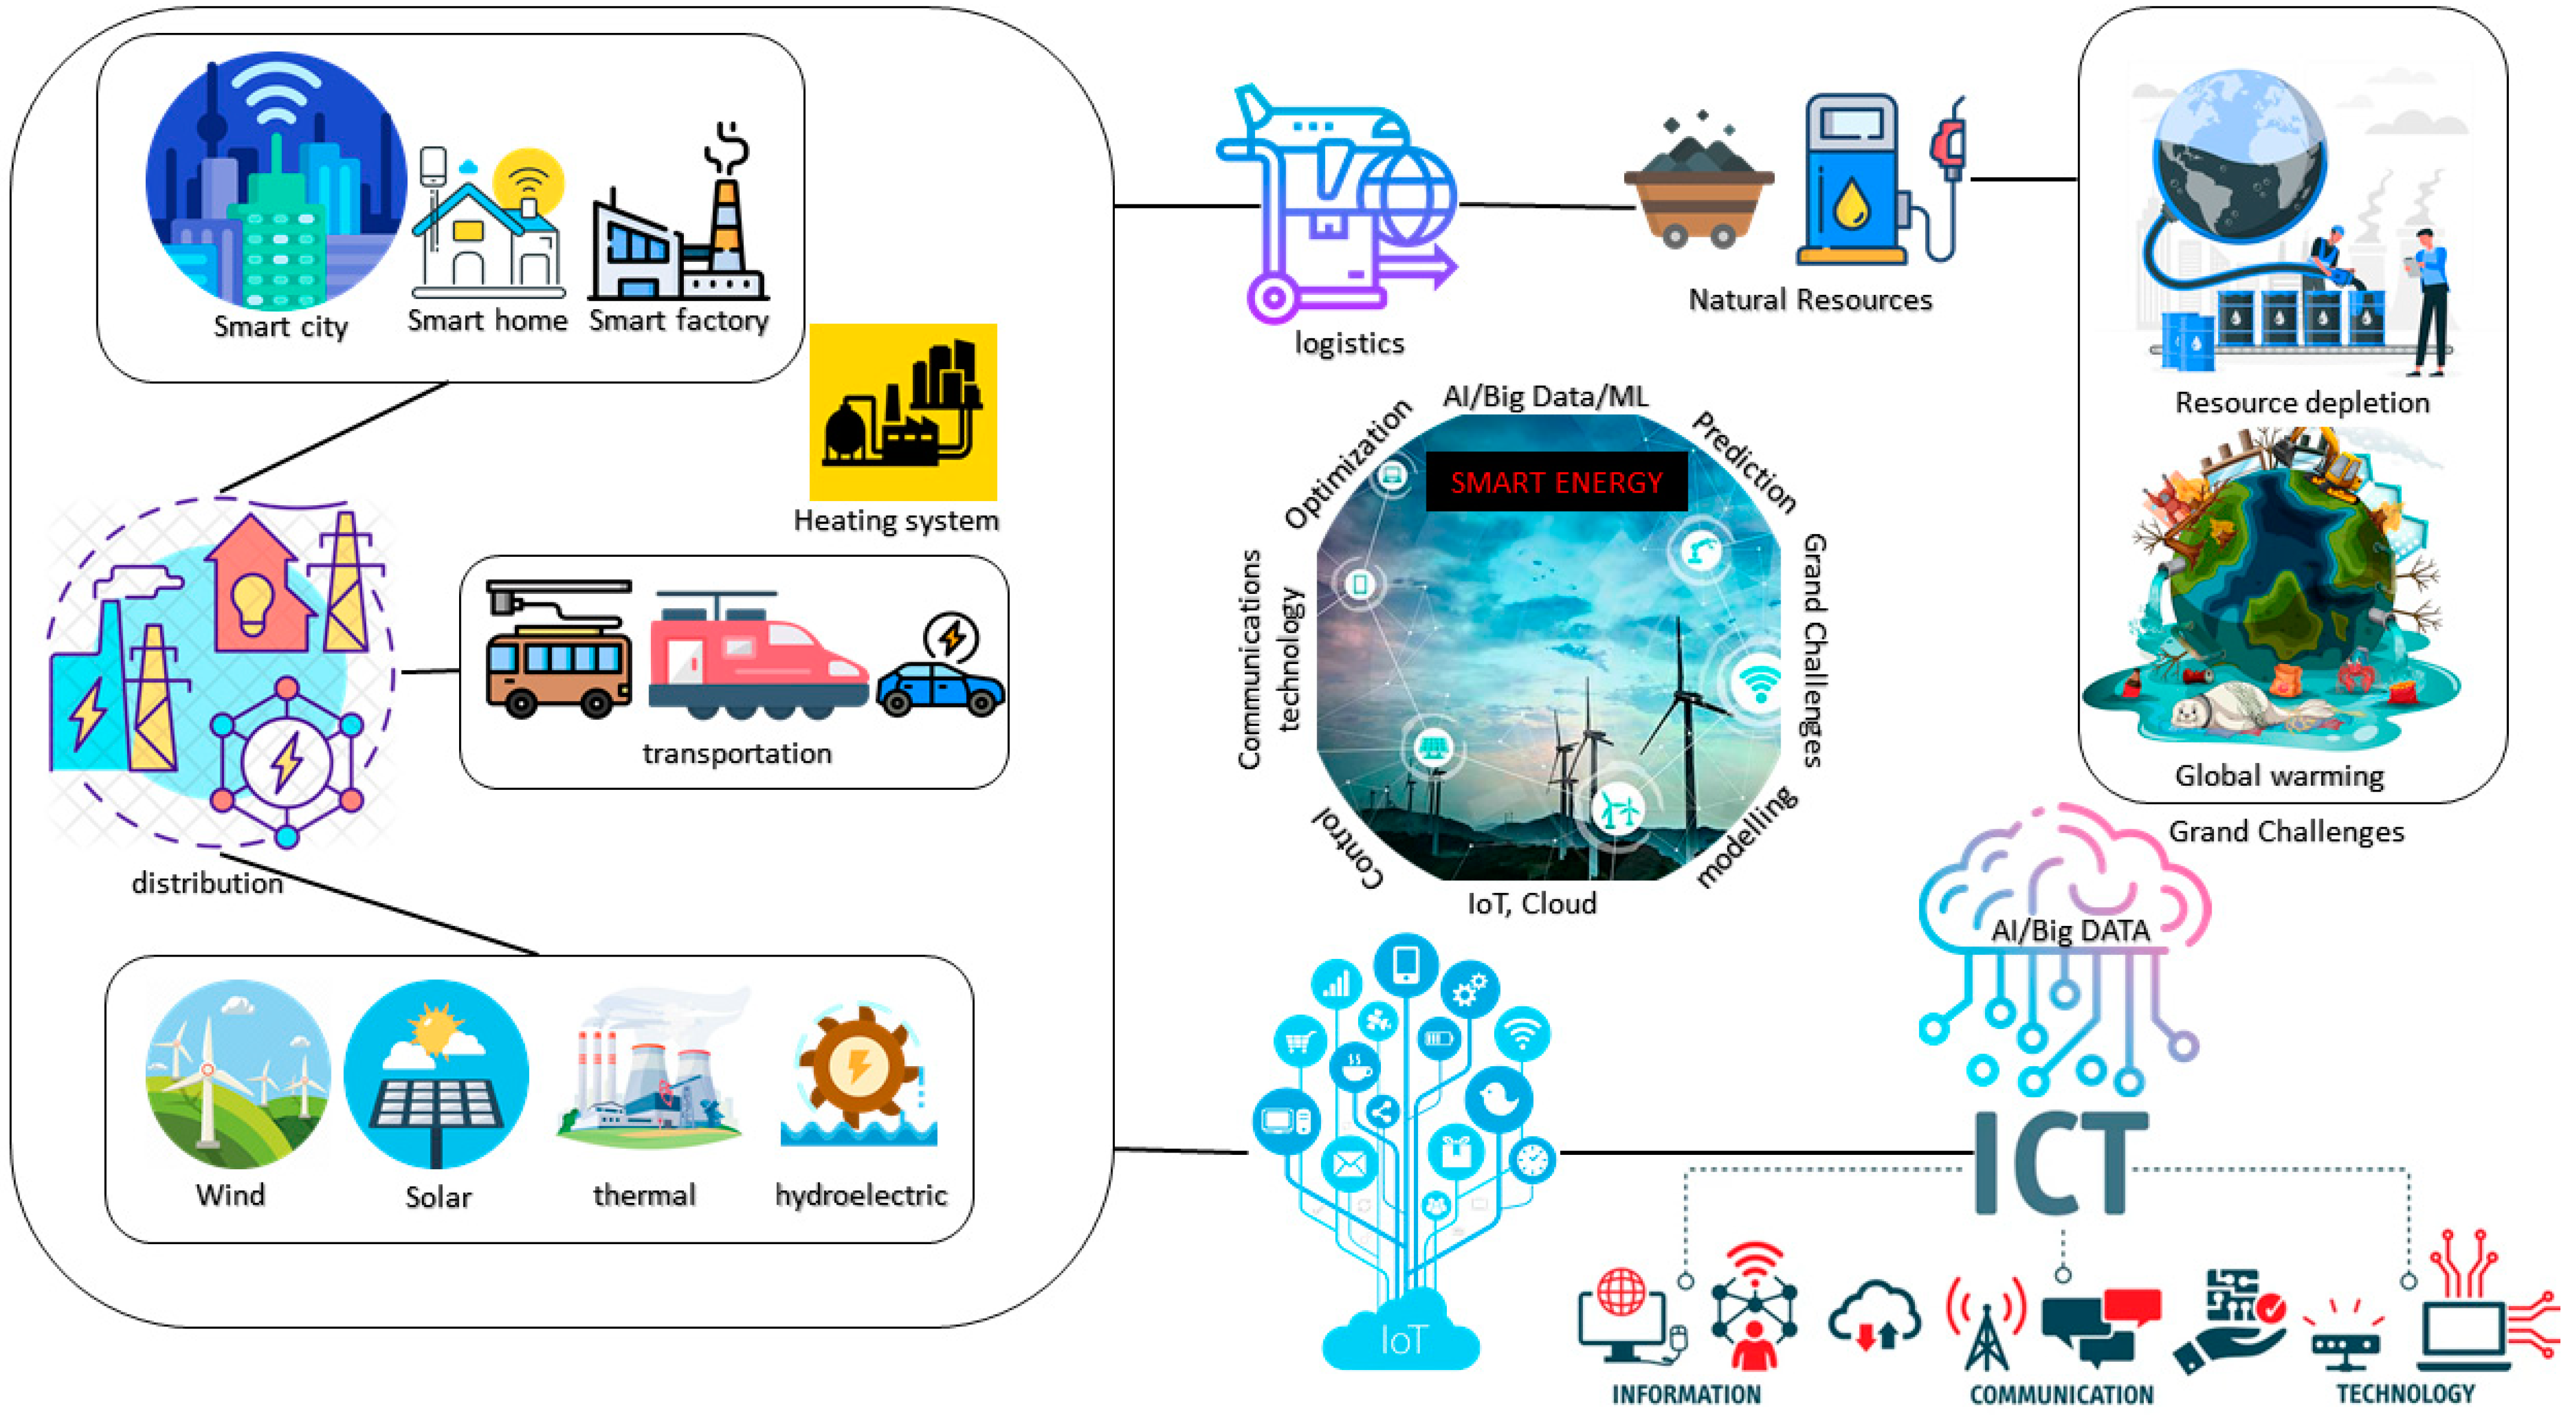
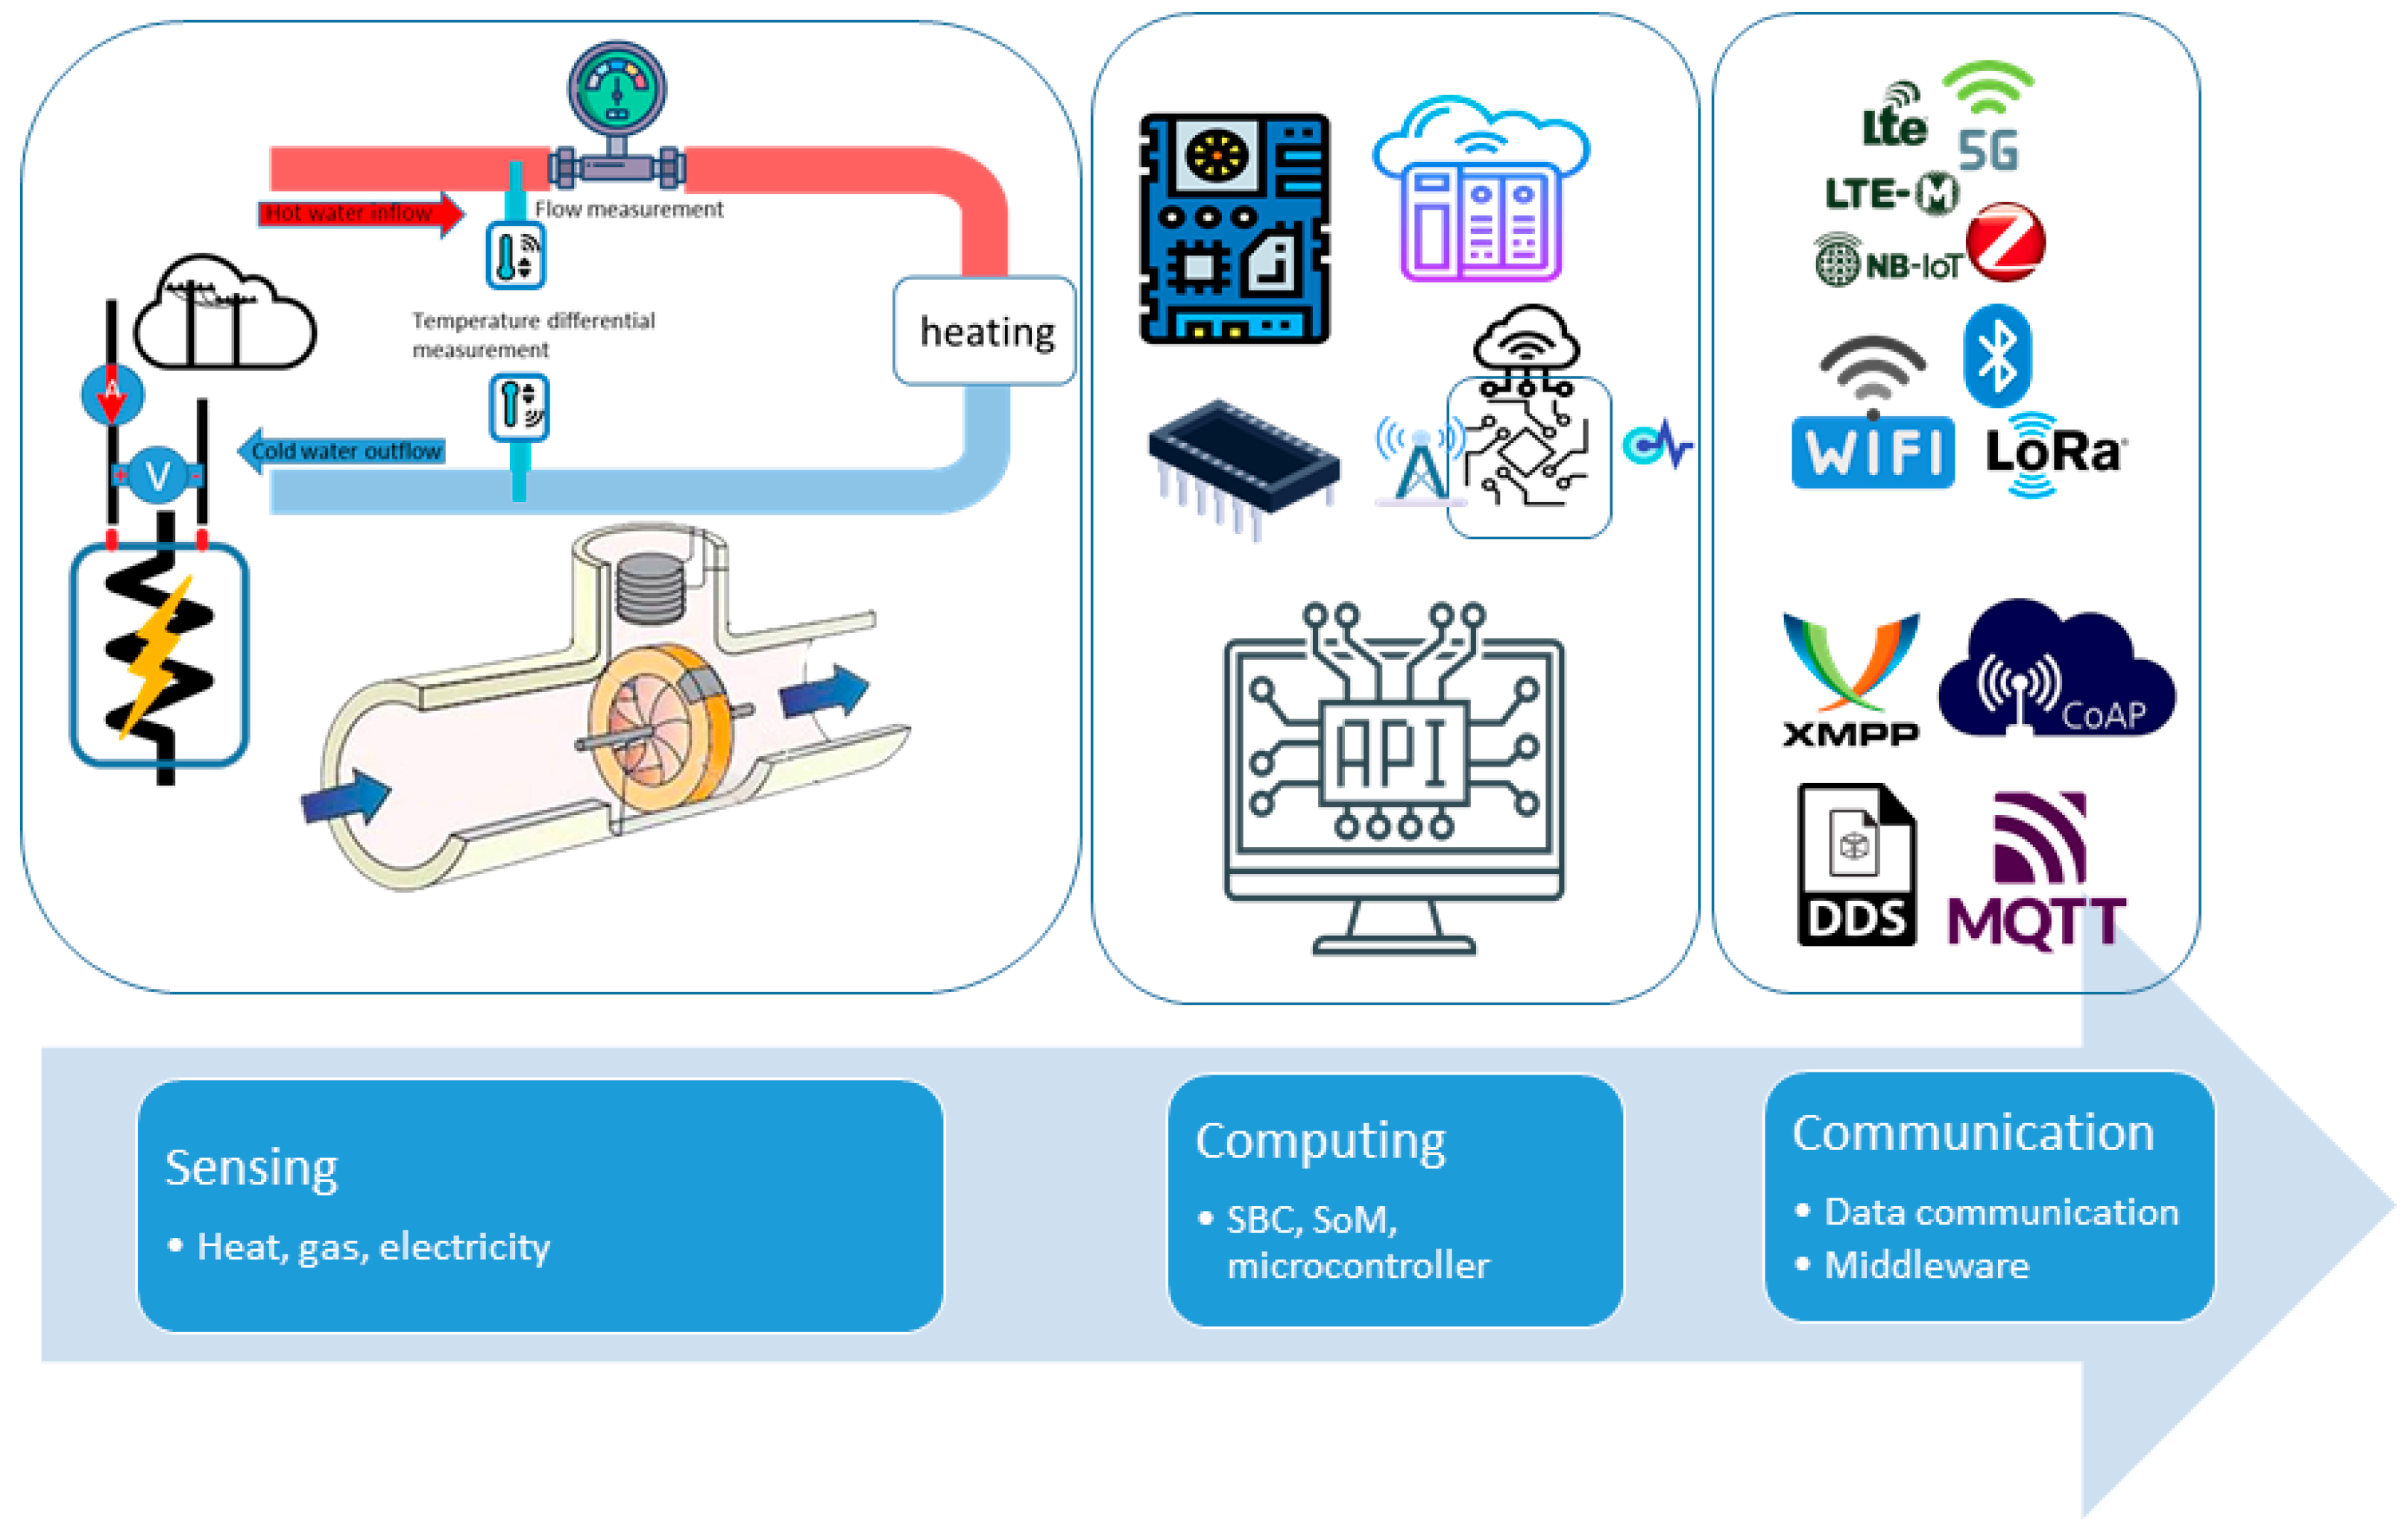
Table 1.
Overview of different reviews and applications of smart meter.
| Reference | Comments |
|---|---|
| [13] | Optimized random forest algorithm implementation for data analytics in smart meters |
| [14] | An extensive review of different techniques implemented on smart meter data for home and battery management system |
| [15] | Implementation of deep learning on smart meter data to gain insights into load forecasting |
| [16] | A statistical model that determines the characteristics of households who would benefit or suffer from a time-of-use tariff. |
| [17] | Finding energy consumption patterns using smart meter data through machine learning |
| [18] | Discusses the evolution of energy meters from the past |
| [19] | A case study explaining the impact of battery storage on energy consumption using smart meter data |
| [20] | Discussion of smart meter hardware, communications, and security in terms of its contribution to the smart grid |
| [21] | Explanation of different types of non-technical losses that exist in the grid and how smart meters can help in removing them |
| [22] | Focuses on compression techniques of big data available from smart meters |
| [23] | Explains different types of smart meter communication technologies to realize smart metering connectivity |
| [24] | Use case discussion as to how residents of UK are responding to smart energy via digital comparison tools |
| [25] | Discussed three reliability prediction methods to analyze smart meter data to predict life of the meter |
| [26] | Fosters the understanding and adaption of modern deep learning methods to solve the challenges regarding energy supply |
| [27] | Discussion of challenges and opportunities of smart meters in smart grids and homes |
| [28] | LoRaWAN technology explored in detail in terms of capacity limits |
| [29] | Comprehensive review on the existing and future communication infrastructures |
| [30] | Features of IoT protocols reviewed comprehensively for smart meters and smart grids in general |
| [31] | Investigates emerging tech such as cognitive radio networks in 5G for reliable communication in smart grids |
| [32] | Review of security issues and their solutions regarding cyber–physical systems of AMI |
| [33] | Review of AMI technology for smart meters discussing different varieties of control, facilities, and features |
| [34] | Discussion on various elements of smart metering, current state of the technologies, AMI, and meter data flow with respect to smart grid |
| [35] | Thorough review of smart meter data classification of electricity consumption |
| [36] | Data analytics review paper analyzed from customer-centric perspective by discussing their technological foundations and impact |
| [37] | Review of how lives of people are affected by the use of smart meters, highlighting 13 socio-psychological variables |
| [38] | Extensive review of evolution of smart metering |
| [39] | Review and explanation of hardware-oriented security scheme implementation on smart meters |
| [40] | Survey highlights the key security issues of AMIs and focuses on how key management techniques can be utilized for safeguarding AMI |
| [41] | Focus upon distributed generation, microgrids, smart meter deployment, energy storage technologies, and the role of smart loads in primary frequency response provision |
| [42] | Review of different data-based algorithms, including grid delay and delay tolerance, to improve distribution system models |
Table 2.
Review of different types of heat meters.
| Meter Class | Meter Type | Principle | Advantages/Disadvantages |
|---|---|---|---|
| Dynamic Meters | Turbine | Rotation speed proportional to mass flow | Advantages: cheap, easy to design Disadvantages: nonlinear behavior, sensitive to impurities, small dynamic range |
| Impeller | Displacement proportional to mass flow | Advantages: can measure large flows Disadvantages: wear and tear, startup threshold | |
| Static Meters | Magnetic Induction | Voltage proportional to velocity of flow through the magnetic field | Advantages: less obstruction, accurate Disadvantages: nonlinear behavior, costly |
| Ultrasonic | Difference in time flow of ultrasonic pulses propagating in and against the flow direction | Advantages: can measure large flows Disadvantages: nonlinear behavior, less accurate, complex |
Table 3.
Different types of gas meters.
| Meter Type | Working Principle | Advantages/Disadvantages |
|---|---|---|
| Diaphragm/bellows | Displacement of the diaphragm/bellow | Advantages: cheap, easy to design, widely adopted, tested for legal meteorology Disadvantages: for small flows, sensitive to impurities, small dynamic range |
| Rotary | Rotation speed | Advantages: accurate, can measure large flows, can withstand high pressures Disadvantages: maintenance, wear and tear, expensive |
| Turbine | Rotation speed | Advantages: accurate, can measure large flows, can withstand high pressures Disadvantages: maintenance, wear and tear, expensive |
| Orifice | Pressure differential across the orifice | Advantages: no moving parts, easy to service Disadvantages: small flows only, complex measurement |
| Ultrasonic | Difference in time of flight of ultrasonic signal along and against the flow | Advantages: accurate, works best for dry gases, wide dynamic range Disadvantages: complex measurement, low value output |
| Coriolis | Oscillations of tubes measure the mass flow or density | Advantages: most accurate, can measure large flows, wide dynamic range Disadvantages: needs additional elements |
Table 4.
Different types of voltmeters and their working principles.
| Meter Type | Working Principle | Advantages/Disadvantages |
|---|---|---|
| Induction [101] | Alternating fluxes across the disk induces emf which, in turn, induces motion of disc by interaction with magnetic fields | Advantages: High torque/weight ratio, inexpensive, good damping, good dynamic range, reasonably accurate Disadvantages: power consumption, measures AC only, nonlinearity, requires compensation for accurate measurements |
| Electrostatic [102] | Deflecting torque due to electrical field | Advantages: High-voltage measurements, lower power consumption, measures both AC and DC voltages Disadvantages: large size, expensive, nonlinear, requires large forces for small output |
| Rectifier [103] | Diode rectification for AC-to-DC conversion | Advantages: reasonably accurate, low-cost, lower power consumption, uniform scale Disadvantages: calibration, measurements depend upon waveform shape, can introduce harmonics |
| Digital [104] | Pulse train-based comparator conversion to binary output | Advantages: portable, lesser readout errors, easy to interface, low power, reasonably accurate Disadvantages: complexity for greater accuracy, conversion speed, nonlinearities in conversion |
Table 5.
Current sensing techniques review.
| Meter Type | Working Principle | Advantages/Disadvantages |
|---|---|---|
| Shunt resistor | Voltage drop parallel to the measured nodes | Advantages: inexpensive, good dynamic range, reasonably accurate Disadvantages: power loss, overcurrent can permanently damage, no isolation for high voltages |
| Current transformer | Current through conductor generates magnetic field which induces back emf across the transformer terminals | Advantages: High-voltage measurements, lower power consumption, stable measurements, isolation Disadvantages: large size, relatively expensive, nonlinear, can measure AC only |
| Rogowski coil | Same as current transformer but is air-wound instead of core-wound | Advantages: reasonably accurate, low-cost, lower power consumption, uniform scale Disadvantages: poor sensitivity, greater output isolation is required, an integrator is required |
| Hall effect | Voltage difference transverse to current in magnetic field perpendicular to that current | Advantages: large dynamic range, small size, can be integrated on PCB, measures AC/DC, isolated Disadvantages: large thermal drift, overcurrent induces magnetic offset, overheating for large frequency signals |
| Fluxgate | Rate of change in flux linkage generated by opposing magnetic fields picked up by sensing coils | Advantages: high accuracy, low thermal drift Disadvantages: complicated design, noise, small dynamic range |
| AMR (anisotropic magneto-resistance) | Resistance to flow of current in the conductor placed in magnetic field due to relative direction of current to magnetic field | Advantages: large dynamic range, small size, can be integrated on PCB, measures AC/DC, isolated Disadvantages: large thermal drift, overcurrent induces magnetic offset, overheating for large frequency signals |
| Fiber optic | Change in characteristics of light due to change in magnetic field | Advantages: most accurate, very low thermal drift, very high dynamic range Disadvantages: most expensive, most complicated, bending stress. |
Table 6.
Smart grid measurements.
| Type | Measurement | Usage |
|---|---|---|
| Phase Measurement Unit | Phase and magnitude, synchro-phasor, relative phase angle difference, phasor differential | Complex power flow, tripping and inter-area oscillations, frequency change, phase unbalance |
| Power Quality meter | Voltage harmonics, crest factor, total harmonic distortion, phase harmonic index, inter-harmonics, notching, etc. | Topology identification, grid state estimation, energy efficiency |
| Digital Fault Recorders | Waveform snapshot in case of fault | Fault location and fault type, energy leakage |
| Waveform measurement units | Relative waveform difference | Event detection and classification |
Table 7.
Computation platforms for IoT systems.
| Hardware Type | Offering/Architecture | Characteristics |
|---|---|---|
| Microcontrollers | MIPS | 8–32-bit RISC cores, clock speed 4 MHz to 80 MHz, memory 256 bytes to 512 kB, SRAM 16 bytes to 128 KB, IO pins 4 to 85, A/D converter up to 10 bits 1MSPS, interfaces: I2C, SPI, UART, CAN, USB, Ethernet (based on PIC series) |
| 8051 | Mostly 8-bit CISC cores, clock speed 4 MHz to 40 MHz, program memory up to 128 Kbytes, SRAM up to 256 bytes, some designs offer up to 1Kbyte separate RAM, IO pins from 2 to 32, AD converters vary with different offerings, but mostly 8-bit converters are available, I2C, SPI and UART interfaces are most common. | |
| 68HC11 | 8-bit Harvard architecture, 4 MHz clock speed, up to 768 bytes of RAM, 2 Kbytes of EEPROM, 8-bit A/D converter, SPI, SCI interfaces, up to 40 IO pins | |
| AVR | 8-bit and 32-bit RISC based AVR cores, 1.6 to 24 MHz, up to 256 Kbyte flash RAM, 64 to 16 Kbytes SRAM, 61–512 bytes EEPROM, up to 12-bit ADC, I2C, SPI, UART, CAN, USB, Ethernet | |
| RISC-V | 32-bit RISC-V based architectures, 160 MHz clock speed,16 KB to 400 KB of SRAM, 22 IO pins, Wi-Fi, Bluetooth 5(LE), SPI, UART, I2C, I2S (based on ESP32-C3 implementation) | |
| ARM | 32-bit ARM based microcontrollers, 32 MHz to 550 MHz clock speed, 128 KB to 2 MB flash storage, 20 KB to 1.4 MB RAM, up to 512 bytes EEPROM, up to 100 IO, 12-bit ADC, SPI, I2C, UART, USART, USB 2, Bluetooth (low energy), ZigBee, LoRaWAN (based on STM32 discovery platform) | |
| FPGA | Virtex | 91,000–136,900 slices, 582,720–876,160 logic cells, 6938–13,275 Kbits distributed RAM, 795–1410 RAM blocks of 36 Kbit each, 650–850 single-ended or 312–408 differential inputs, 1260–2520 DSP48E1 slices, PCI express (Gen2/Gen3), 36–72 gigabit transceivers (based on Virtex-7 series) |
| Kintex | 10,250–74,650 slices, 65,600–477,760 logic cells, 838–6788 Kbits distributed RAM, 4860–34,380 Kbit RAM, 300–500 single ended or 144–192 differential inputs, 240–1920 DSP48 slices, PCI express (Gen2)), 8–32 gigabit transceivers (based on Kintex-7 series) | |
| Artix | 12,800–215,360 slices, 2000–33,650 logic cells, 171–2888 Kbits distributed RAM, 720–13,140 Kbit RAM, 150–500 single-ended or 72–240 differential inputs, 40–740 DSP slices, PCI express (Gen2)), 2–16 gigabit transceivers (based on Artix-7 series) | |
| Spartan | 6000–102,400 slices, 938–16,000 logic cells, 70–1100 Kbits distributed RAM, 5–120 RAM blocks of 36 Kbit each, 100–400 single-ended or 48–192 differential inputs, 10–160 DSP slices, PCI express (Gen2)), 2–16 gigabit transceivers (based on Spartan-7 series) | |
| Cyclone | 85,000–220,000 logic elements, 31,000–80,330 adaptive logic elements, 5820–11,740 Kbit memory, 84–192 variable precision DSP blocks, 168–384 multipliers, 192–284 I/O pin, PCIe (Gen2) 1 block (4 elements), 6–12 gigabit transceivers (based on cyclone 10) | |
| Max | 2000–50,000 logic elements, 108–1638 Kbit block memory,12–736 Kbits user flash memory, 84–192 variable precision DSP blocks, 16–144 multipliers, external memory interface (based on MAX 10) | |
| FPGA SoC | Zynq 7000 | Dual-Core ARM Cortex-A9 up to 1 GHz, NEON SMD instructions available, 512 KB L1 cache, 256 KB L2 cache, external RAM and static memory support, UART, CAN, I2C, 128 pin flexible GPIO, AXI interface for processor and programmable logic interfacing, 23 K to 444 K logic cells, 14,400–277,400 look-up tables, 28,800–554,800 flip-flops, 50–875 RAM blocks of 36 Kbits each, 66–2020 DSP slices, 4–8 Gen2 PCIe |
| Zynq ultrascale+ | Dual/Quad-Core ARM Cortex-A53 up to 1.5 GHz, Dual-Core Cortex-R5 real-time processor, Mali 400 GPU, NEON SMD instructions available, 32 KB/core L1 cache, 1024 KB L2 cache, external RAM and static memory support, USB, PCIe Gen2, SATA, gigabit Ethernet, UART, SPI, CAN, I2C, 128 pin flexible GPIO, AXI interface for processor and programmable logic interfacing, 81 K to 600 K logic cells, 37 K–274 K look-up tables, 74 K–548 K flip-flops, 3.8–32.1 Mb block RAM, 1 to 8.8 Mb distributed RAM, 216–2520 DSP slices, 4–8 Gen2 PCIe | |
| Arria | Dual-Core ARM Cortex-A9 up to 1.5 GHz, NEON SMD instructions available, 32 KB L1 separate data/instruction cache, 1024 KB L2 cache, external RAM and static memory support, UART, I2C, 48 GPIO, 288–624 pin user IO, 160 K to 1150 K logic cells,210 K–1506 K system logic elements, 61,510 K-427,200 K adaptive logic modules, 9–53 Mb M20K memory, 312–3036 multipliers (based upon Arria 10 product line) | |
| Stratix | Quad-Core ARM Cortex-A53 up to 1.5 GHz, NEON SMD instructions available, 32 KB L1 separate data/instruction cache, 512 KB L2 cache, external RAM and static memory support, UART, I2C, 48 GPIO, 374–2304 pin user IO, 378 K to 10,200 K logic cells, 128,160–3,466,080 adaptive logic modules, 30–253 Mb M20K memory, 1296–6912 multipliers | |
| Agilex | Quad-Core ARM Cortex-A53 up to 1.5 GHz, NEON SMD instructions available, 32 KB L1 separate data/instruction cache, 512 KB L2 cache, external RAM and static memory support, UART, I2C, 48 GPIO, 192–382 differential RX/TX pairs, 573,480 to 2,692,760 logic cells, 194,400–912,800 adaptive logic modules, 56–259 Mb M20K memory, 3280–17,056 multipliers, 1640–8528 DSP blocks | |
| Single Board Computers | Raspberry Pi 4 | Quad-core Cortex-A72 CPU, up to 4 GB RAM, 40 pin GPIO, Wi-Fi, gigabit Ethernet, USB (2.0 and 3.0), HDMI, BLE, micro SD card, HDMI, camera and DSI display ports, composite audio video port. |
| Beagle Bone AI | Sitara AM5729 processor (dual-core ARM main processor, dual-core ARM coprocessor, 4 vision engines, 2 DSP processors, hardware acceleration for video, Ethernet, ICSS, Profibus and Profinet interfaces), 72 GPIO pins, 1 GB RAM, USB, UART, SPI, I2C, CAN, A/D, microHDMI, Ethernet, Bluetooth | |
| Coral Dev Board | NXP i.MX 8M SoC (quad-core Cortex A-53 for main processing, Cortex M4-F for small functions), GPU GC7000 lite, TPU coprocessor, up to 4 GB RAM, 8 GB Flash, Wi-Fi, USB, gigabit Ethernet, HDMI, GPIO | |
| Jetson Nano | 4–12 core CPU, 4–32 GB of RAM, up to 5 different neural processing units. | |
| Apollo3 Blue | 32-bit ARM cortex-M4F 48 MHz processor, 1 MB flash, 348 KB SRAM, BLE5, camera connector, 4 GPIO | |
| Syntiant | Cortex M0+ 48 MHz, NDP101 neural processor, 256 KB flash, 32 KB RAM, 5 digital GPIO, UART, I2C, micro SD | |
| STM32L4 | Cortex M4, 128 KB SRAM, 1 MB flash memory, 64 Mbit SPI flash memory, programmable RF module, Wi-Fi, NFC | |
| Arduino | ATmega-based boards, up to 8 MHz clock speed, 32 KB flash memory, 0.5 KB–8 KB RAM, GPIO, I2C, UART and through extensions, Wi-Fi, BLE, NFC, LoRa and Sigfox, etc., connectivity | |
| System on Chip/System on Module | STCOMET | ARM Cortex M4 processor, 3 channel A/D converter, power line communication protocols, up to 1 MB flash memory and 256 Bytes RAM, DSP processor |
| Zeus | ARM Cortex M3 at 120 MHz for application processing, 32 bit MAXQ30 with DSP support for metering calculations, up to 128 kB RAM, up to 1024 kB ROM, high dynamic range fast 24-bit ADCs, I2C, UART, SPI, no PLC module | |
| Jetson | Edge SoM for AI processing, up to 8 cores, GPU and neural processing unit, up to 64 GB RAM, typically 4 GB | |
| Myriad X | Edge SoC, 16 core CPU at 700 MHz, neural compute engine, 2.5 MB RAM |
Table 8.
Protocols for IoT and smart meters. Air interface protocols are defined by bandwidth, band, modulation and some medium access, whereas data communication protocols are defined by how they distribute data (architecture) and the support of different communication functionalities such as transport protocol, etc.
| Protocol | Details |
|---|---|
| Protocols for Air Interface/Communication | |
| 802.11/Wi-Fi and variants | Band: 2.4/5/60, 700/800/900 MHz and 800–1000 GHz (light). Channel Width: 20, 40, 60, 80, 160 MHz, 8 GHz @ 60 GHz, 1–16 MHz @700/800/900 MHz. Modulation: OFDM, MIMO-OFDMA, DSSS-FHSSS, single carrier OFDM, O-OFDM. Range: 10–70 m. Data rate: 1.7–450 MBPS, for 60 GHz data rate could reach up to 20 GBPS. Scope: Local area |
| 802.15.4. PAN for resource-constrained devices | Band: 868/915/2450 MHz. Channel Width: 868–898.6, 902–928, 2400–2483.5 MHz. No. of Channels: 1, 10, and 16. Modulation: DSSS with BPSK, AAK, O-QPSK, and CSSS with DQPSK. Chip Rate: 300, 400, 600, 1000, 1600, 2000 Kchips/s. Data rate: 20, 40, 100, 250, 1000, 2000 kbps. Scope: Home area |
| ZigBee | PHY/MAC layer: 802.15.4 Maximum Transmission Unit (packet size): 127. Foot Print: 9 kB. Networking protocol: custom. Transport protocol: object-based with exposed interfaces. Application development: fixed profile applications with data exchange interface. No. of Devices: 1024. Scope: Home area |
| 6LoWPAN | PHY/MAC layer: 802.15.4 Maximum Transmission Unit (packet size): 127. Foot Print: 264 kB. Networking protocol: custom adaptation to support TCP/UDP. Transport protocol: TCP/UDP. Application development: Legacy UDP/TCP socket programming. No. of Devices: 264. Scope: Home area |
| BLIP | PHY/MAC layer: 802.15.4 Maximum Transmission Unit (packet size): 127. Networking protocol: IP on top of 6LoPWAN. Transport protocol: TCP/IP and UDP. Application development: Legacy TCP/IP socket programming. No. of Devices: 264. Scope: Home area |
| Thread | IPv6 on top of 6LoWPAN. Open source implementation. Allows IPv6-based development and networking using 802.15.4 Scope: Home area |
| Matter | IP-based implementation over ZigBee. Allows IP addressable devices and development stack for ZigBee networks and bridges gap between PAN and internet Scope: Home area to internet |
| Z-Wave | Band: 800–900 MHz. Modulation: FSK with Manchester encoding, GFSK and DSSS-OQPSK. Range: 50–200 m. Data rate: up to 100 kbit/s. Scope: Home area Notes: Z-Wave is a mesh topology-based PAN that is used in home area networks for smart home and similar applications. |
| RFID | Used for identification. Uses various frequency bands such as 120–150 KHz 13.56 MHz, 433 MHz, 865–868 MHz, 902–928 MHz, 2450–5800 MHz, 3.1–10 GHz, and 24.125 GHz. Identification range is typically from 10 cm to 2 m. Active tags can enhance range from 10 to 200 m. Different frequencies use different signaling techniques. One tag is read at one time only. Bulk reading uses sequential processing. Scope: Personal area |
| NFC | Inductive coupling-based communication at up to 4 cm. Band operation of 13.56 MHz, 106–24 kbps, passive mode uses inductive coupling, and field modulation is used. Active coupling uses ASK with Manchester encoding. Communication is standardized. Scope: Personal area |
| Bluetooth LE | Band: 2.4 GHz worldwide. Modulation: GFSK with frequency hopping. Range: 100 m. Data rate: 1–3 Mbps. Application development: fixed profile applications with data exchange interface Notes: BLE is an independent protocol from Bluetooth. BLE is mesh network for PAN applications. |
| Sigfox | Band: 1925 KHz ultra-narrow band (UNB) Channel Width: 100–600 Hz uplink, 1.5 KHz downlink. Modulation: BPSK. Range: 10–50 km. Data rate: up to 600 bps. Scope: Wide area Notes: one-hop star topology where each end node connects to a Sigfox base station which is connected via internet to Sigfox support system which separates business and data operations. Very lightweight and efficient. Used for M2M communications. |
| LoRa | Band: 863–870/873 MHz (Europe), 915–928 MHz (South America, Asia), 902–928 MHz (North America), 2.4 GHz worldwide. Modulation: proprietary chirp spread spectrum. Range: 4.8–16 km. Data rate: 0.3–27 kbit/s. Scope: Wide area Notes: LoRa is proprietary physical layer protocol. LoRaWAN is defined on top of LoRA which defines medium access control for one-hop star topology similar to Sigfox. |
| DASH7 | Band: 433, 868, and 915 MHz. Channel Width: 25 or 200 KHz. Modulation: proprietary chirp spread spectrum. Range: up to 5 km. Data rate: 167 kbit/s. Scope: Wide area and local area Notes: DASH7 is a lightweight node-to-node, star or, tree topology network that connects end nodes to sub-stations which are connected to the internet. It has a small open source protocol stack available as well. |
| Cellular | 4G and 5G systems. Up to 10 Gbps, latency 10 ms down to less than 1 ms, 350 kmph to 500 kmph, connection density from 1000 to 1 Million per square kilometer. Code division and beam division multiple access, IP based network, built for network function virtualization and software-defined networks which allow extreme agility and configurability, open source vendor agnostic implementations. Scope: Wide area |
| NB-IoT | Band: Cellular bands 3G LTE. Channel Width: 180 KHz. Modulation: proprietary chirp spread spectrum. Range: WAN cellular-based protocol. Data rate: D/L 26 kbps,127 kbit/s. U/L 66 kbps, 159 kbps. Scope: Wide area Notes: NB-IoT is defined by 3GPP and is a cellular network for IoT. It uses the architecture of LTE, consisting of a radio access network (RAN) and core network. RAN connects user equipment to base stations which are connected via a mobile core network to each other and to the internet. The mobility through various base stations is supported. |
| Protocols for data communication | |
| Data communication protocols are middleware layers that enable data pipelines to application interfaces. Network details are transparent to applications which see through all the infrastructure and receive the data from end nodes as if directly accessing those nodes. | |
| MQTT | RESTful: No. Transport Protocol: TCP. Architecture: publish/subscribe. QoS: yes. XML support: No. Encoding: Binary. Latency: low. Bandwidth: higher. Message size: lightweight, Energy consumption: lower. Connectivity: one-to-one, one-to-many, many-to-many |
| HTTP | RESTful: Yes. Transport Protocol: TCP. Architecture: request/response. QoS: limited. XML support: yes. Encoding: text. Latency: largest. Bandwidth: higher. Message size: highest, Energy consumption: highest. Connectivity: one-to-one |
| DDS | RESTful: No. Transport Protocol: UDP. Architecture: broker-less publish/subscribe. QoS: elaborate mechanism consisting of 23 QoS profiles. XML support: No. Encoding: binary. Latency: low. Bandwidth: low. Connectivity: one-to-one, one-to-many, many-to-many, peer-to-peer. |
| XMPP | RESTful: No. Transport Protocol: TCP. Architecture: Client/server request/response and publish/subscribe. QoS: none. XML support: yes. Encoding: text. Latency: low. Bandwidth: low. Message size: lightweight. Energy consumption: higher. Connectivity: one-to-one |
| AMQP | RESTful: No. Transport Protocol: TCP/SCTP. Architecture: Client/server and client/broker, request/response and publish/subscribe. QoS: yes. XML support: No. Encoding: binary. Latency: lower. Bandwidth: high. Message size: lightweight, Energy consumption: slightly higher. Connectivity: point-to-point |
| CoAP | RESTful: Yes. Transport Protocol: UDP. Architecture: request/response or publish/subscribe. QoS: yes. XML support: No. Encoding: binary. Latency: lowest. Bandwidth: lowest. Message size: lightweight, Energy consumption: least. Connectivity: one-to-one, many-to-many |
Table 9.
Review of different implementations from the perspective of hardware, software, and communications.
Table 9.
Review of different implementations from the perspective of hardware, software, and communications.
| Reference | Hardware | Communication/Data | Location | Comments |
|---|---|---|---|---|
| [177] | 8051 | Cellular (GSM) | Home | Enables energy meter to transmit data via GSM using messaging |
| [218] | RISC (MSP430) | Home | Privacy preserving | |
| [219,220] | ARM (Cortex-M) | Home–neighbor hood | Secure communications | |
| [221] | SBC (Arduino) | Cellular (GSM) | Home | |
| [222] | MIPS (PIC32) | Home | DSP processor interface for advanced signal processing | |
| [223] | STM32 | Power line communication | Network | A network design for the smart grid |
| [224] | ATmega32 | PV modules | Photovoltaic module monitoring | |
| [225] | Arm (Cortex M3) | Bluetooth | Home | Modular smart meter with programmable functionality |
| [226,227] | STM32 | Modular/HTTP | Edge | Implements PQ measurements. Provides web interface |
| [228] | Raspberry Pi | LoRa and Blockchain | Edge-Fog | A secure gateway to collect smart meter data |
| [229] | STM 32 | NB-IoT | Home | Multiuser meter with sub-meter design for independent metering, storage, and communication |
| [230] | - | LPWAN/PLC REST, MQTT | Edge/fog/cloud | API design for smart meter data collection |
| [231] | NB-IoT, MQTT | Edge/fog/cloud | NB-IoT-based smart metering infrastructure | |
| [232] | - | Wi-Fi, Cellular, MQTT | Edge/cloud | Smart meter data collection, AMI, non-intrusive load monitoring |
| [233] | SoC (ESP32) | Wi-Fi, Blynk TCL | Edge | Theft detection |
| [234] | ATmega32 | Cellular | Home/edge | Security, energy management |
| [235] | SoC (ESP8266) | Cellular | Home | Uses Hall effect sensor |
Table 10.
Applications of smart meter data with description of different component technologies employed.
Table 10.
Applications of smart meter data with description of different component technologies employed.
| Application | References | Sensing | Smart Grid Measurement | Communication Protocols |
|---|---|---|---|---|
| Load Forecasting | [236,237,238,239,240,241,242,243,244] | Voltage, current, and power | Aggregation at various levels such as locality, substation and transmission | Cellular for aggregation of data and local networks such as Bluetooth for home area data collection |
| Theft detection | [245,246,247,248,249,250,251] | Complex power | Phasor measurement, synchro-phasors, RAPD | NB-IoT, 4G, 5G, and Wi-Fi |
| Anomaly detection | [252,253,254,255,256,257,258,259,260] | Complex power, voltage, current, phase | Phasor measurement, synchro-phasors, waveform analysis, RAPD | Cellular and Wi-Fi |
| Consumer profiling | [261,262,263,264] | Waveform analysis | Waveform analysis | Cellular, Wi-Fi, ZigBee, LoRA |
| Activity detection | [265,266,267,268] | Power, voltage, current, waveform | Waveform analysis | Cellular, LoRa, Bluetooth, Wi-Fi |
| Fault detection | [269,270,271,272,273] | Power, voltage, current, waveform | Waveform, power quality, differential phasors | Cellular, NB-IoT, Wi-Fi |
Disclaimer/Publisher’s Note: The statements, opinions and data contained in all publications are solely those of the individual author(s) and contributor(s) and not of MDPI and/or the editor(s). MDPI and/or the editor(s) disclaim responsibility for any injury to people or property resulting from any ideas, methods, instructions or products referred to in the content. |
© 2023 by the authors. Licensee MDPI, Basel, Switzerland. This article is an open access article distributed under the terms and conditions of the Creative Commons Attribution (CC BY) license (https://creativecommons.org/licenses/by/4.0/).
Share and Cite
MDPI and ACS Style
Rind, Y.M.; Raza, M.H.; Zubair, M.; Mehmood, M.Q.; Massoud, Y. Smart Energy Meters for Smart Grids, an Internet of Things Perspective. Energies 2023, 16, 1974. https://0-doi-org.brum.beds.ac.uk/10.3390/en16041974
AMA Style
Rind YM, Raza MH, Zubair M, Mehmood MQ, Massoud Y. Smart Energy Meters for Smart Grids, an Internet of Things Perspective. Energies. 2023; 16(4):1974. https://0-doi-org.brum.beds.ac.uk/10.3390/en16041974
Chicago/Turabian StyleRind, Yousaf Murtaza, Muhammad Haseeb Raza, Muhammad Zubair, Muhammad Qasim Mehmood, and Yehia Massoud. 2023. "Smart Energy Meters for Smart Grids, an Internet of Things Perspective" Energies 16, no. 4: 1974. https://0-doi-org.brum.beds.ac.uk/10.3390/en16041974
Note that from the first issue of 2016, this journal uses article numbers instead of page numbers. See further details here.