
Speed of Sound Measurements of Biogas from a Landfill Biomethanation Process
 , , , and
Abstract
:1. Introduction
2. Materials and Methods
2.1. Materials
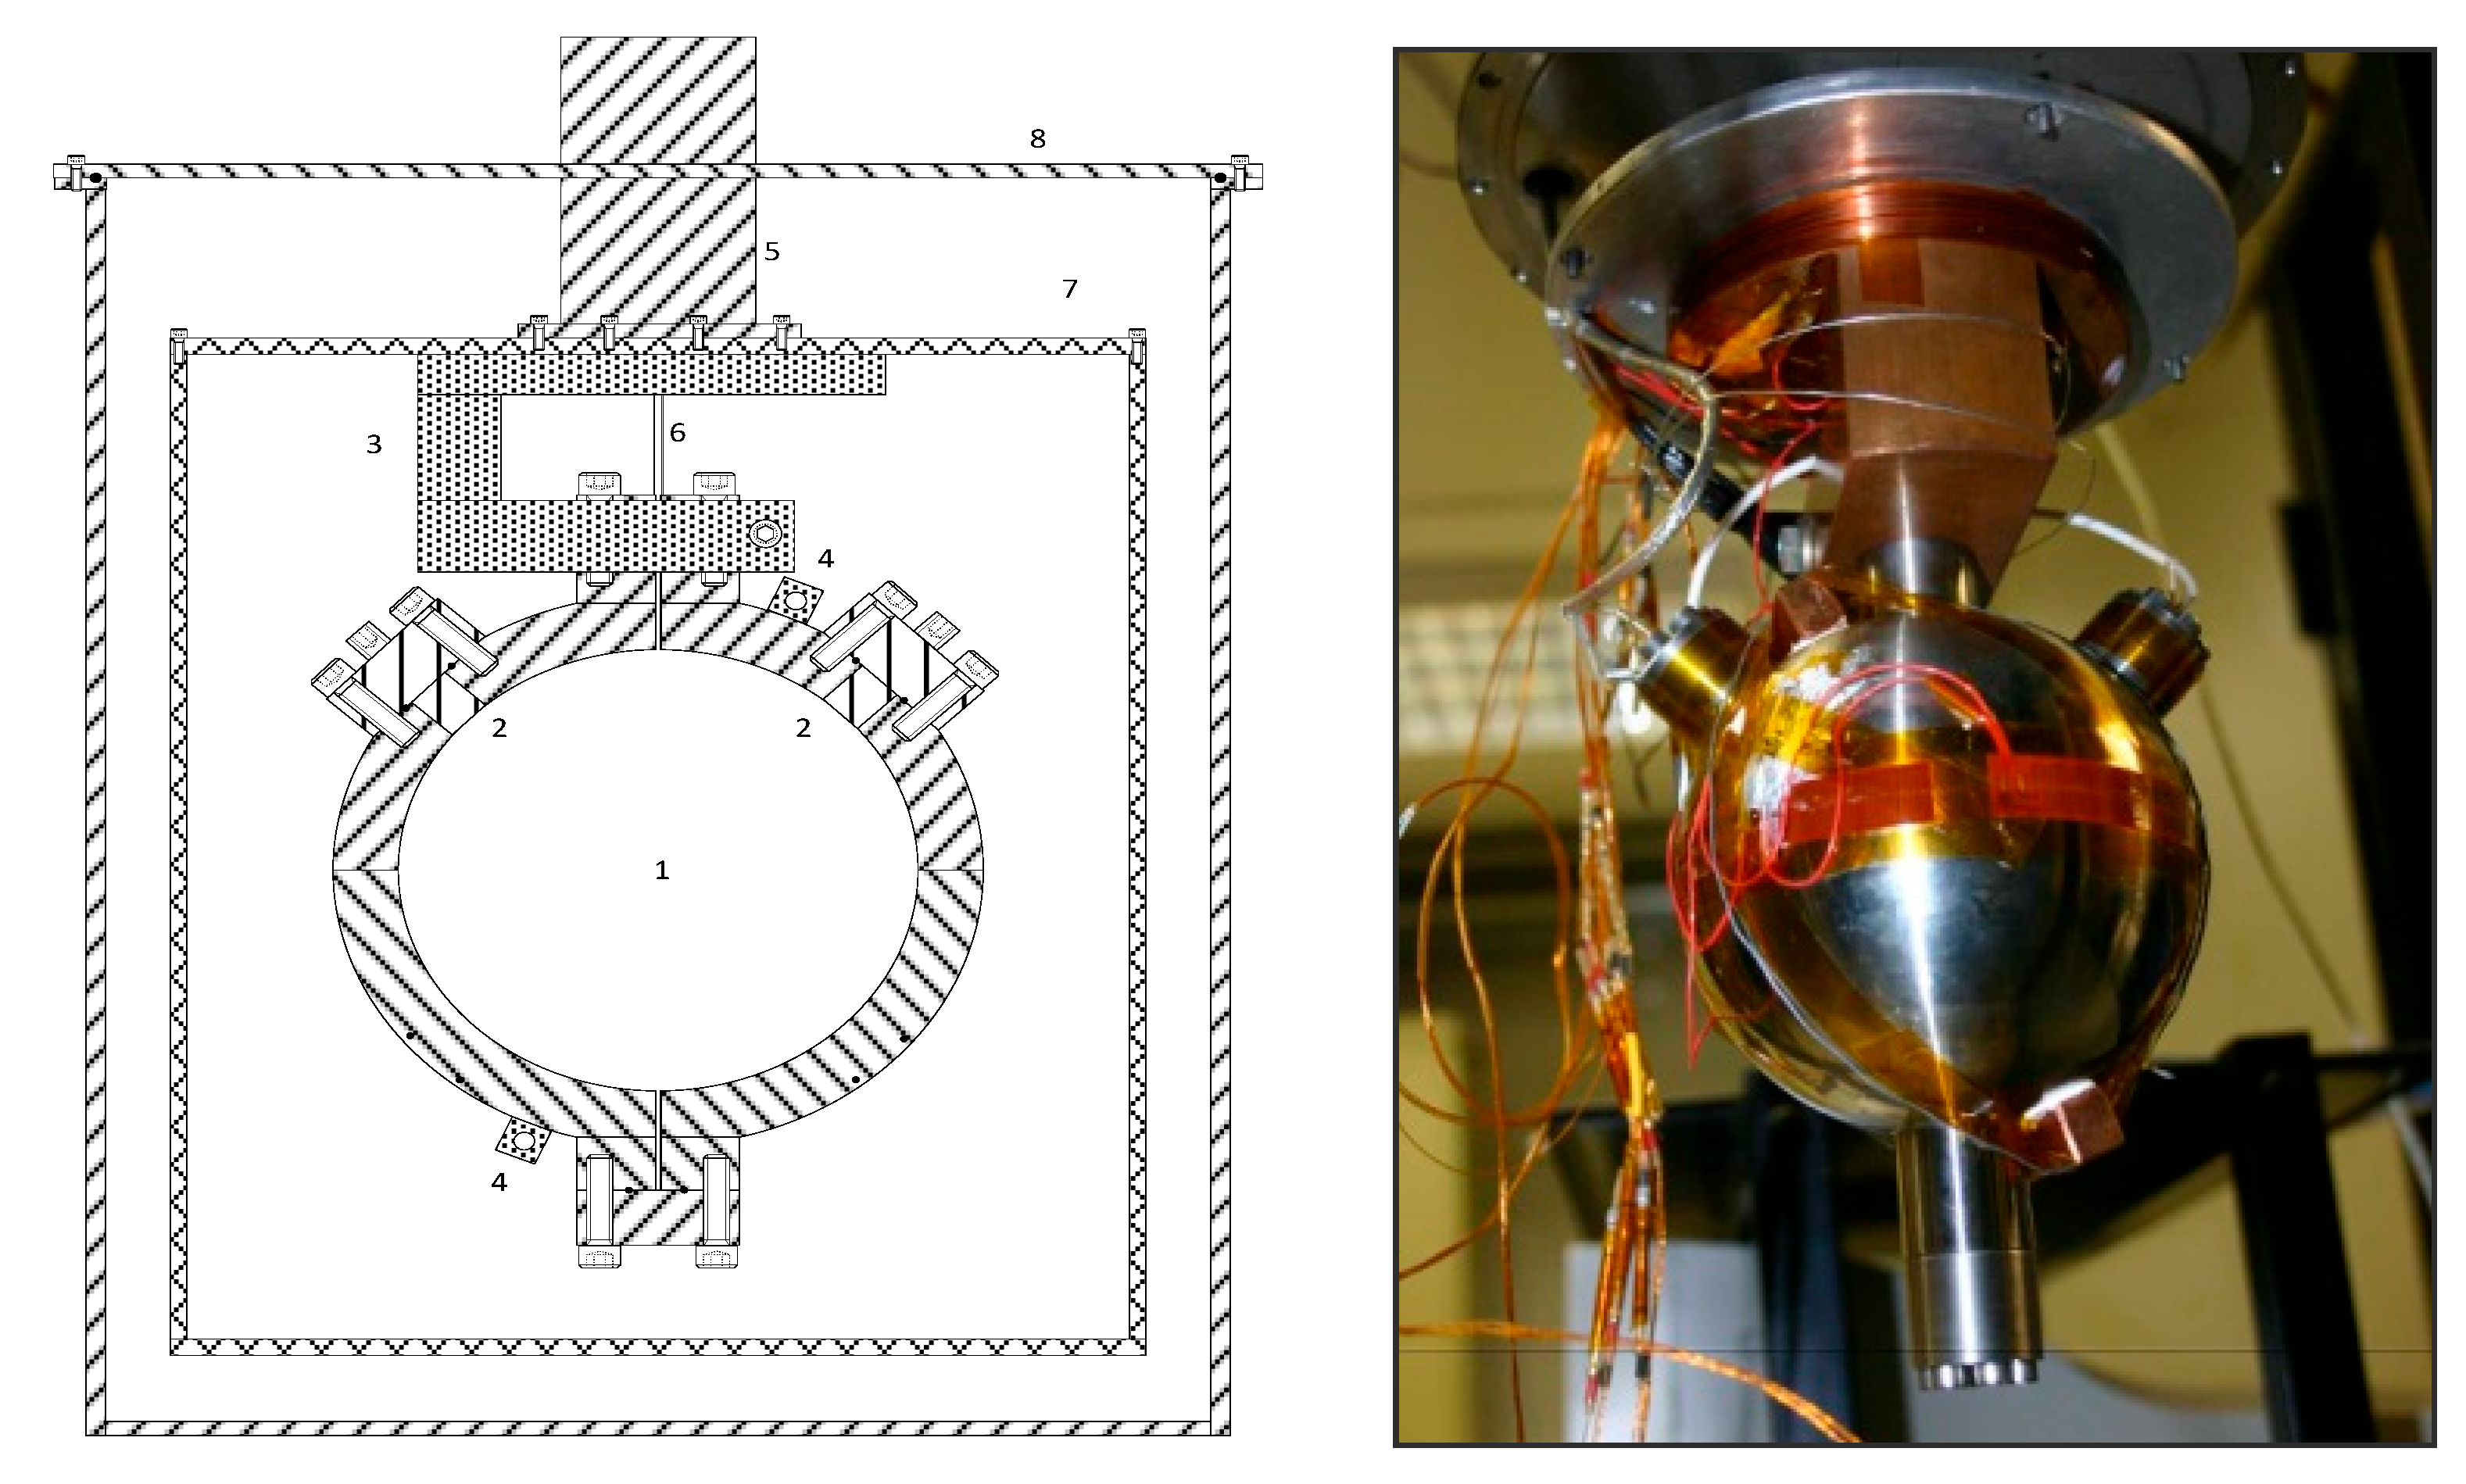
2.2. Equipment
2.3. Speed of Sound Calculation
3. Results
4. Discussion
5. Conclusions
Author Contributions
Funding
Data Availability Statement
Acknowledgments
Conflicts of Interest
References
- Scarlat, N.; Dallemand, J.F.; Fahl, F. Biogas: Developments and perspectives in Europe. Renew. Energy 2018, 129, 457–472. [Google Scholar] [CrossRef]
- Muñoz, R.; Meier, L.; Diaz, I.; Jeison, D. A review on the state-of-the-art of physical/chemical and biological technologies for biogas upgrading. Rev. Environ. Sci. Biotechnol. 2015, 14, 727–759. [Google Scholar] [CrossRef] [Green Version]
- Awe, O.W.; Zhao, Y.; Nzihou, A.; Minh, D.P.; Lyczko, N. A Review of Biogas Utilisation, Purification and Upgrading Technologies. Waste Biomass Valor. 2017, 8, 267–283. [Google Scholar] [CrossRef] [Green Version]
- Trusler, J.P.M. Physical Acoustics and Metrology of Fluids; Adam Hilger: Bristol, UK, 1991. [Google Scholar]
- Prikhod’koa, I.V.; Samarova, A.A.; Toikka, A.M. On Application of PC–SAFT Model for Estimating the Speed of Sound in Synthetic and Natural Oil-and-Gas Mixtures. Russian J. Appl. Chem. 2019, 92, 262–266. [Google Scholar] [CrossRef]
- Farzaneh-Gord, M.; Mohseni-Gharyehsafa, B.; Arabkoohsar, A.; Ahmadi, M.H.; Sheremet, M.A. Precise prediction of biogas thermodynamic properties by using ANN algorithm. Ren. Energy 2020, 147, 179–191. [Google Scholar] [CrossRef]
- Rahmouni, C.; Tazerout, M.; Le Corre, O. A method to determine biogas composition for combustion control. In Proceedings of the SAE Technical Papers 2002 International Spring Fuels and Lubricants Meeting and Exhibition, Reno, NV, USA, 6–9 May 2002. [Google Scholar] [CrossRef]
- Ewing, M.B.; Goodwin, A.R.H. Speeds of sound in a natural gas of specified composition at the temperature 255 K and pressures in the range 64 kPa to 6.1 MPa. J. Chem. Thermodyn. 1993, 25, 1503–1511. [Google Scholar] [CrossRef]
- Labes, P.; Daridon, J.L.; Lagourette, B.; Saint-Guirons, H. Measurement and prediction of ultrasonic speed under high pressure in natural gases. Int. J. Thermophys. 1994, 15, 803–819. [Google Scholar] [CrossRef]
- Younglove, B.A.; Frederick, N.V.; McCarty, R.D. Speed of Sound Data and Related Models for Mixtures of Natural Gas Constituents; National Institute of Standards and Technology (NIST): Boulder, CO, USA, 1993. [Google Scholar] [CrossRef]
- Costa-Gomes, M.F.; Trusler, J.P.M. The speed of sound in two methane-rich gas mixtures at temperatures between 250 K and 350 K and at pressures up to 20 MPa. J. Chem. Thermodyn. 1998, 30, 1121–1129. [Google Scholar] [CrossRef]
- Ahmadi, P.; Chapoy, A.; Tohidi, B. Density, speed of sound and derived thermodynamic properties of a synthetic natural gas. J. Nat. Gas Sci. Tech. 2017, 40, 249–266. [Google Scholar] [CrossRef]
- Lozano-Martín, D.; Segovia, J.J.; Martín, M.C.; Fernández-Vicente, T.; del Campo, D. Speeds of sound for a biogas mixture CH4 + N2 + CO2 + CO from p = (1–12) MPa at T = (273, 300 and 325) K measured with a spherical resonator. J. Chem. Thermodyn. 2016, 102, 348–356. [Google Scholar] [CrossRef]
- AGA Report No. 8 Part 1 Thermodynamic Properties of Natural Gas and Related Gases; American Gas Association: Washington, DC, USA, 2017.
- Kunz, O.; Klimeck, R.; Wagner, W.; Jaeschke, M. The GERG-2004 Wide-Range Equation of State for Natural Gases and Other Mixtures; GERG TM15; Fortschr. Ber. VDI, Reihe 6, Nr. 557; VDI Verlag: Düsseldorf, Germany, 2007. [Google Scholar]
- Kunz, O.; Wagner, W. The GERG-2008 wide-range equation of state for natural gases and other mixtures: An expansion of GERG-2004. J. Chem. Eng. Data 2012, 57, 3032–3091. [Google Scholar] [CrossRef]
- Ewing, M.B.; Trusler, J.P.M. Speed of sound in CF4 between 175 and 300 K measured with a spherical resonator. J. Chem. Phys. 1989, 90, 1106–1115. [Google Scholar] [CrossRef]
- Pérez-Sanz, F.J.; Segovia, J.J.; Martín, M.C.; del Campo, D.; Villamañán, M.A. Speeds of sound in (0.95 N2 + 0.05 CO and 0.9 N2 + 0.1 CO) gas mixtures at T = (273 and 325) K and pressure up to 10 MPa. J. Chem. Thermodyn. 2014, 79, 224–229. [Google Scholar] [CrossRef]
- Tegeler, C.S.R.; Wagner, W. A new equation of state for argon covering the fluid region for temperatures from the melting line to 700K at pressures up to 1000 MPa. J. Phys. Chem. Ref. Data 1999, 28, 779–850. [Google Scholar] [CrossRef] [Green Version]
- Lemmon, E.W.; Bell, I.H.; Huber, M.L.; McLinden, M.O. NIST Standard Reference Database 23: Reference Fluid Thermodynamic and Transport Properties-REFPROP; Version 10.0; National Institute of Standards and Technology Standard Reference Data Programs; National Institute of Standards and Technology (NIST): Boulder, CO, USA, 2018. [Google Scholar]
- Joint Committee for Guides in Metrology. Evaluation of Measurement Data—Supplement 1 to the “Guide to the Expression of Uncertainty in Measurement”—Propagation of Distributions Using a Monte Carlo Method; JCGM 101:2008; BIMP: Sèvres, France, 2008. [Google Scholar]


| Raw Biogas | Washed Biogas | Biomethane | ||||
|---|---|---|---|---|---|---|
| Compound | xi | U(xi) | xi | U(xi) | xi | U(xi) |
| Methane | 0.60145 | 0.00047 | 0.72874 | 0.00032 | 0.96494 | 0.00020 |
| Carbon Dioxide | 0.39198 | 0.00071 | 0.26403 | 0.00085 | 0.01856 | 0.00017 |
| Carbon Monoxide | 0.000010 | 0.000006 | 0.000010 | 0.000006 | 0.000010 | 0.000006 |
| Oxygen | 0.000010 | 0.000006 | 0.00404 | 0.00023 | 0.00300 | 0.00011 |
| Nitrogen | 0.002011 | 0.000058 | 0.002021 | 0.000058 | 0.01348 | 0.00026 |
| Hydrogen | 0.000010 | 0.000006 | 0.000010 | 0.000006 | 0.000010 | 0.000006 |
| Pentane | 0.00021 | 0.00012 | 0.00021 | 0.00012 | - | - |
| Isopentane | 0.00021 | 0.00012 | 0.00021 | 0.00012 | - | - |
| Hexane | 0.00019 | 0.00011 | 0.00019 | 0.00011 | - | - |
| Hydrogen Sulfide | 0.001227 | 0.000042 | 0.000530 | 0.000008 | - | - |
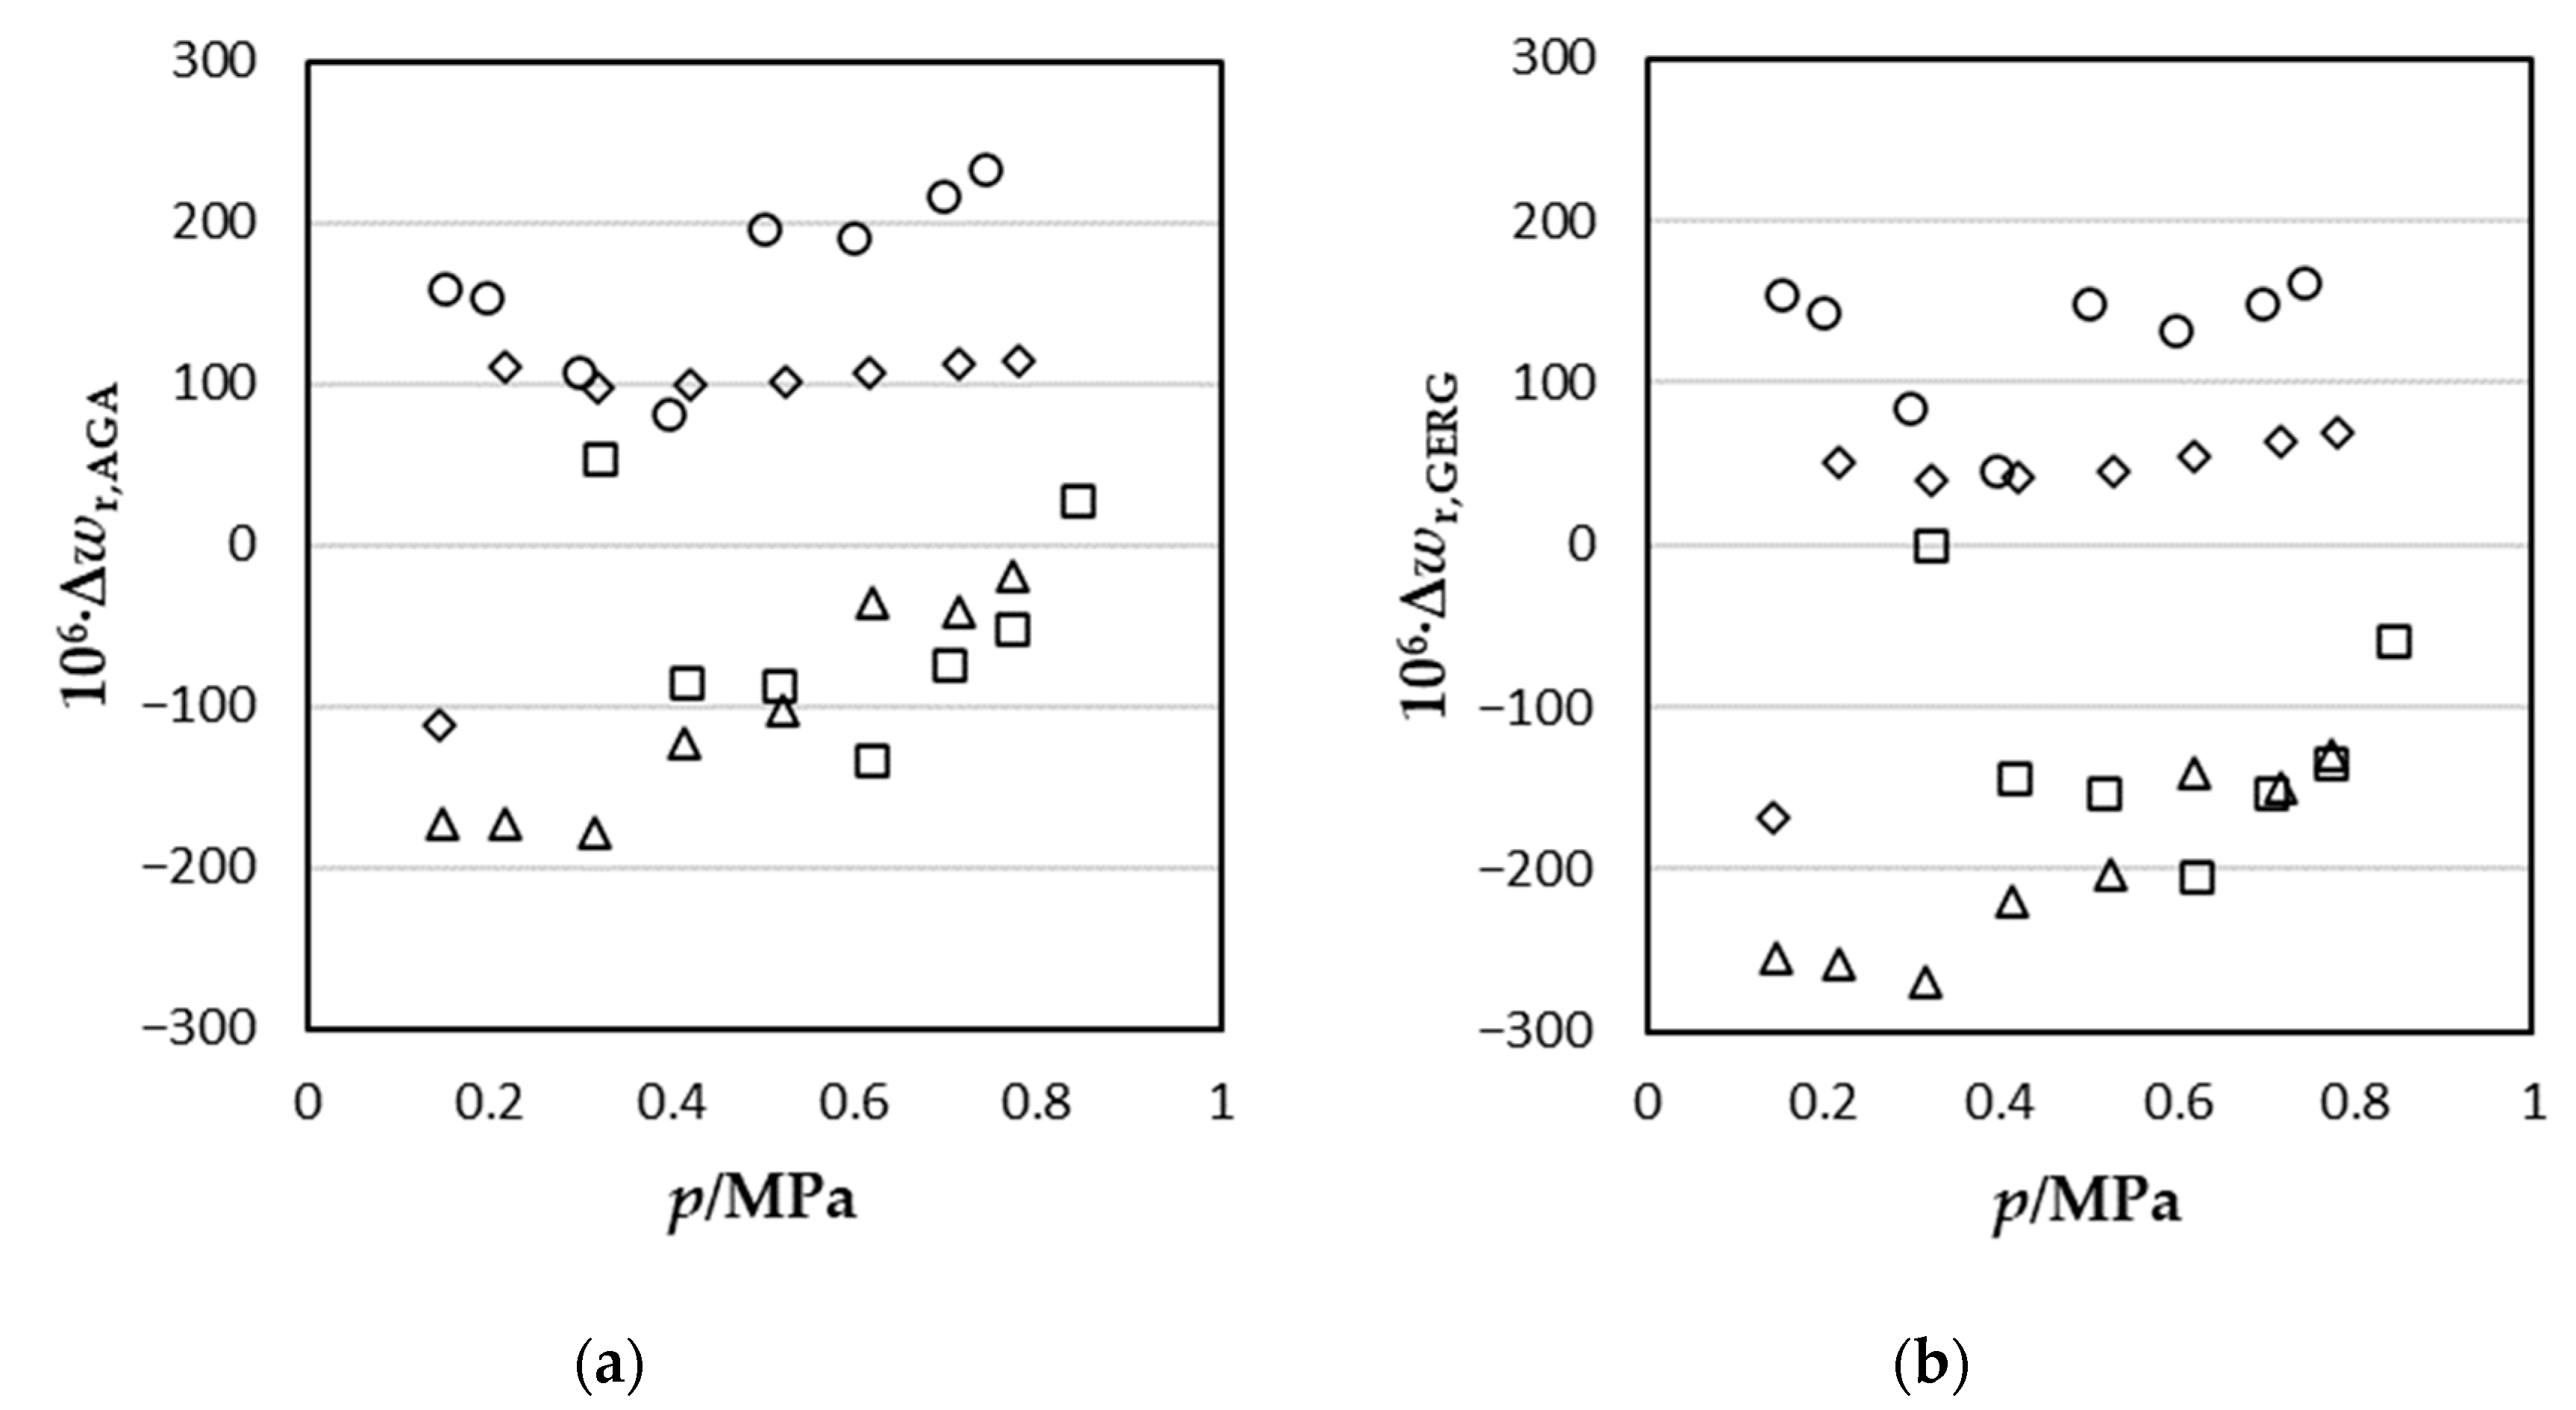
| p/MPa | wexp/m·s−1 | 106·Ur(wexp) | 106·Δwr,AGA | 106·Δwr,GERG |
|---|---|---|---|---|
| Raw Biogas at T = 300.00 K | ||||
| 0.74302 | 342.108 | 735 | 234 | 161 |
| 0.69614 | 342.318 | 728 | 217 | 149 |
| 0.59837 | 342.756 | 734 | 190 | 132 |
| 0.50091 | 343.182 | 729 | 197 | 149 |
| 0.39619 | 343.684 | 724 | 81 | 46 |
| 0.29868 | 344.107 | 724 | 108 | 84 |
| 0.19898 | 344.533 | 724 | 154 | 144 |
| 0.15288 | 344.737 | 730 | 159 | 155 |
| Washed Biogas at T = 273.00 K | ||||
| 0.78036 | 350.855 | 924 | 115 | 69 |
| 0.71455 | 351.216 | 917 | 113 | 64 |
| 0.61725 | 351.753 | 919 | 107 | 55 |
| 0.52538 | 352.260 | 946 | 101 | 46 |
| 0.42046 | 352.840 | 915 | 99 | 42 |
| 0.31978 | 353.397 | 912 | 98 | 40 |
| 0.21686 | 353.963 | 910 | 111 | 52 |
| 0.14440 | 354.444 | 912 | −111 | −169 |
| Washed Biogas at T = 325.00 K | ||||
| 0.77172 | 382.184 | 939 | −19 | −129 |
| 0.71425 | 382.346 | 938 | −41 | −149 |
| 0.61857 | 382.603 | 937 | −36 | −141 |
| 0.52221 | 382.890 | 943 | −102 | −204 |
| 0.41324 | 383.197 | 937 | −122 | −219 |
| 0.31511 | 383.490 | 935 | −178 | −269 |
| 0.21595 | 383.765 | 931 | −172 | −258 |
| 0.14771 | 383.957 | 947 | −172 | −254 |
| Biomethane at T = 325.00 K | ||||
| 0.84447 | 454.778 | 479 | −59 | 28 |
| 0.77356 | 454.943 | 477 | −135 | −52 |
| 0.70564 | 455.077 | 471 | −153 | −75 |
| 0.62046 | 455.260 | 471 | −205 | −133 |
| 0.51741 | 455.434 | 472 | −154 | −88 |
| 0.41480 | 455.629 | 471 | −145 | −86 |
| 0.32008 | 455.750 | 517 | 0.4 | 53 |
| Xexp | Ur(Xexp)/% | ΔXr,AGA/% | ΔXr,GERG/% | |
|---|---|---|---|---|
| Raw Biogas at T = 300.00 K | ||||
| 1.2958 | 0.13 | −0.04 | −0.03 | |
| /J·mol−1·K−1 | 28.11 | 0.58 | 0.17 | 0.14 |
| /J·mol−1·K−1 | 36.42 | 0.59 | 0.13 | 0.11 |
| βa/m3·mol−1 | −641.7·× 10−7 | 0.78 | −0.64 | −1.8 |
| Washed Biogas at T = 273.00 K | ||||
| 1.2958 | 0.13 | −0.04 | −0.03 | |
| /J·mol−1·K−1 | 28.11 | 0.58 | 0.17 | 0.14 |
| /J·mol−1·K−1 | 36.42 | 0.59 | 0.13 | 0.11 |
| βa/m3·mol−1 | −641.7·× 10−7 | 0.78 | −0.64 | −1.8 |
| Washed Biogas at T = 325.00 K | ||||
| 1.2883 | 0.18 | 0.04 | 0.05 | |
| /J·mol−1·K−1 | 28.84 | 0.79 | −0.19 | −0.21 |
| /J·mol−1·K−1 | 37.16 | 0.81 | −0.15 | −0.17 |
| βa/m3·mol−1 | −399.9·× 10−7 | 1.4 | −0.45 | −1.4 |
| Biomethane at T = 325.00 K | ||||
| 1.29282 | 0.076 | −0.01 | −0.01 | |
| /J·mol−1·K−1 | 28.395 | 0.33 | 0.10 | 0.03 |
| /J·mol−1·K−1 | 36.709 | 0.34 | 0.09 | 0.03 |
| βa/m3·mol−1 | −224.7·× 10−7 | 3.9 | −9.0 | −7.7 |
| Deviation from AGA/Parts in 106 | Deviation from GERG/Parts in 106 | |||||||
|---|---|---|---|---|---|---|---|---|
| AAD | Bias | RMS | MaxD | AAD | Bias | RMS | MaxD | |
| Raw Biogas at T = 300 K | 167 | 167 | 175 | 234 | 128 | 128 | 133 | 161 |
| Washed Biogas at T = 273 K | 107 | 79 | 107 | 115 | 67 | 25 | 78 | 169 |
| Washed Biogas at T = 325 K | 105 | −105 | 122 | 178 | 203 | −203 | 210 | 269 |
| Biomethane at T = 325 K | 122 | −122 | 137 | 205 | 74 | −51 | 80 | 133 |
Disclaimer/Publisher’s Note: The statements, opinions and data contained in all publications are solely those of the individual author(s) and contributor(s) and not of MDPI and/or the editor(s). MDPI and/or the editor(s) disclaim responsibility for any injury to people or property resulting from any ideas, methods, instructions or products referred to in the content. |
© 2023 by the authors. Licensee MDPI, Basel, Switzerland. This article is an open access article distributed under the terms and conditions of the Creative Commons Attribution (CC BY) license (https://creativecommons.org/licenses/by/4.0/).
Share and Cite
Segovia, J.J.; Moreau, A.; Paredes, X.; Fernández-Vicente, T.E.; Vega-Maza, D.; Martín, M.C. Speed of Sound Measurements of Biogas from a Landfill Biomethanation Process. Energies 2023, 16, 2068. https://0-doi-org.brum.beds.ac.uk/10.3390/en16042068
Segovia JJ, Moreau A, Paredes X, Fernández-Vicente TE, Vega-Maza D, Martín MC. Speed of Sound Measurements of Biogas from a Landfill Biomethanation Process. Energies. 2023; 16(4):2068. https://0-doi-org.brum.beds.ac.uk/10.3390/en16042068
Chicago/Turabian StyleSegovia, José Juan, Alejandro Moreau, Xavier Paredes, Teresa E. Fernández-Vicente, David Vega-Maza, and María Carmen Martín. 2023. "Speed of Sound Measurements of Biogas from a Landfill Biomethanation Process" Energies 16, no. 4: 2068. https://0-doi-org.brum.beds.ac.uk/10.3390/en16042068