
Multi-Objective-Based Charging and Discharging Coordination of Plug-in Electric Vehicle Integrating Capacitor and OLTC
 , , , , , ,
Abstract
:1. Introduction
- (i)
- Multi-objective PEV charging and discharging coordination is developed minimizing power loss, voltage deviation and the total cost of the distribution system.
- (ii)
- According to the departure time, we propose a strategy that provides PEV charging with lower cost.
- (iii)
- Integrating capacitor and OLTC operation with charging and discharging coordination of PEVs to ensure charging for all PEV users in the distribution network.
2. Problem Formulation
2.1. Objective Function
2.2. System Constraints
3. Methodology
3.1. Optimization Framework
- All the fireflies are regarded as the same gender and attract each other.
- The attractiveness between two fireflies is proportional to the brightness where brightness varies according to the distance between two fireflies. The objective function is used to calculate the brightness. Brighter fireflies are attracted by the bright fireflies.
- The fireflies will move randomly if any firefly with more brightness is not available. In the search space, the distance of two fireflies, ith and jth, can be calculated from the vector operation executed in Cartesian framework that can be expressed by
3.2. Analytic Hierarchy Process
4. Computational Procedure of the Proposed Method
4.1. Computational Procedure of PEV Charging and Discharging Coordination Using BFA
- Step 1: All the required data, both distribution network and PEV, are taken as input. Optimization parameters are also set.
- Step 2: Fixed the timeslot at t = 1 and create the initial population of fireflies in binary form for arrival of every PEV. Each firefly expresses the status of PEV chargers where “1” denotes that PEV connected to the system and “0” indicates that the charging or discharging of the corresponding PEV did not start or has already completed.
- Step 3: In every iteration, the power loss of the network and voltage level of every node is determined by executing backward forward load flow. The fitness function (Equation (1)) is evaluated.
- Step 4: According to the light intensity (fitness), the populations are ranked. Among them, the best value is determined.
- Step 5: Updating all the fireflies and rank the movement by considering the constraints using (12) to (17).
- Step 6: Repeat step 3 to step 5 until the maximum number of iterations is achieved.
- Step 7: Determine the best combination, and the charging–discharging decision of each PEV is sent to a residential charging station by using a smart bidirectional communication system.
- Step 8: The timeslot is updated, and disconnect the fully charged PEV/PEV discharged to a minimum level of SOC. In addition, consider those PEVs which did not connect in the previous timeslot and newly arrived PEVs at the present timeslot.
4.2. Computational Procedure of Capacitor Switching and OLTC Adjustment with BFA
- Step 1: Input the network data, size and position of the capacitor in the network. Furthermore, the charger position with respective voltage is also taken.
- Step 2: Generate the initial population of the fireflies where each firefly describes the status of the capacitor. Each firefly as “1” expressed that a capacitor is in operation, and each firefly as “0” indicated that the capacitor is turned off.
- Step 3: Calculate the objective functions and fitness function.
- Step 4: According to the light intensity (fitness), the best value is determined and saved.
- Step 5: Update all the fireflies (change the switching combination) and rank the movement by considering the constraints using Equations (12)–(17).
- Step 6: The steps are repeated from step 3 until the maximum iteration.
- Step 7: Find out the best combination of the capacitor switching, and according to the voltage attained, the tap changer position is adjusted in accordance with 0.00625 voltage changes for each tap position.
5. Test System Modeling
5.1. System Architecture
5.2. PEV Modeling
6. Result and Discussion
6.1. Case Studies
6.2. Case 1: Uncoordinated Charging
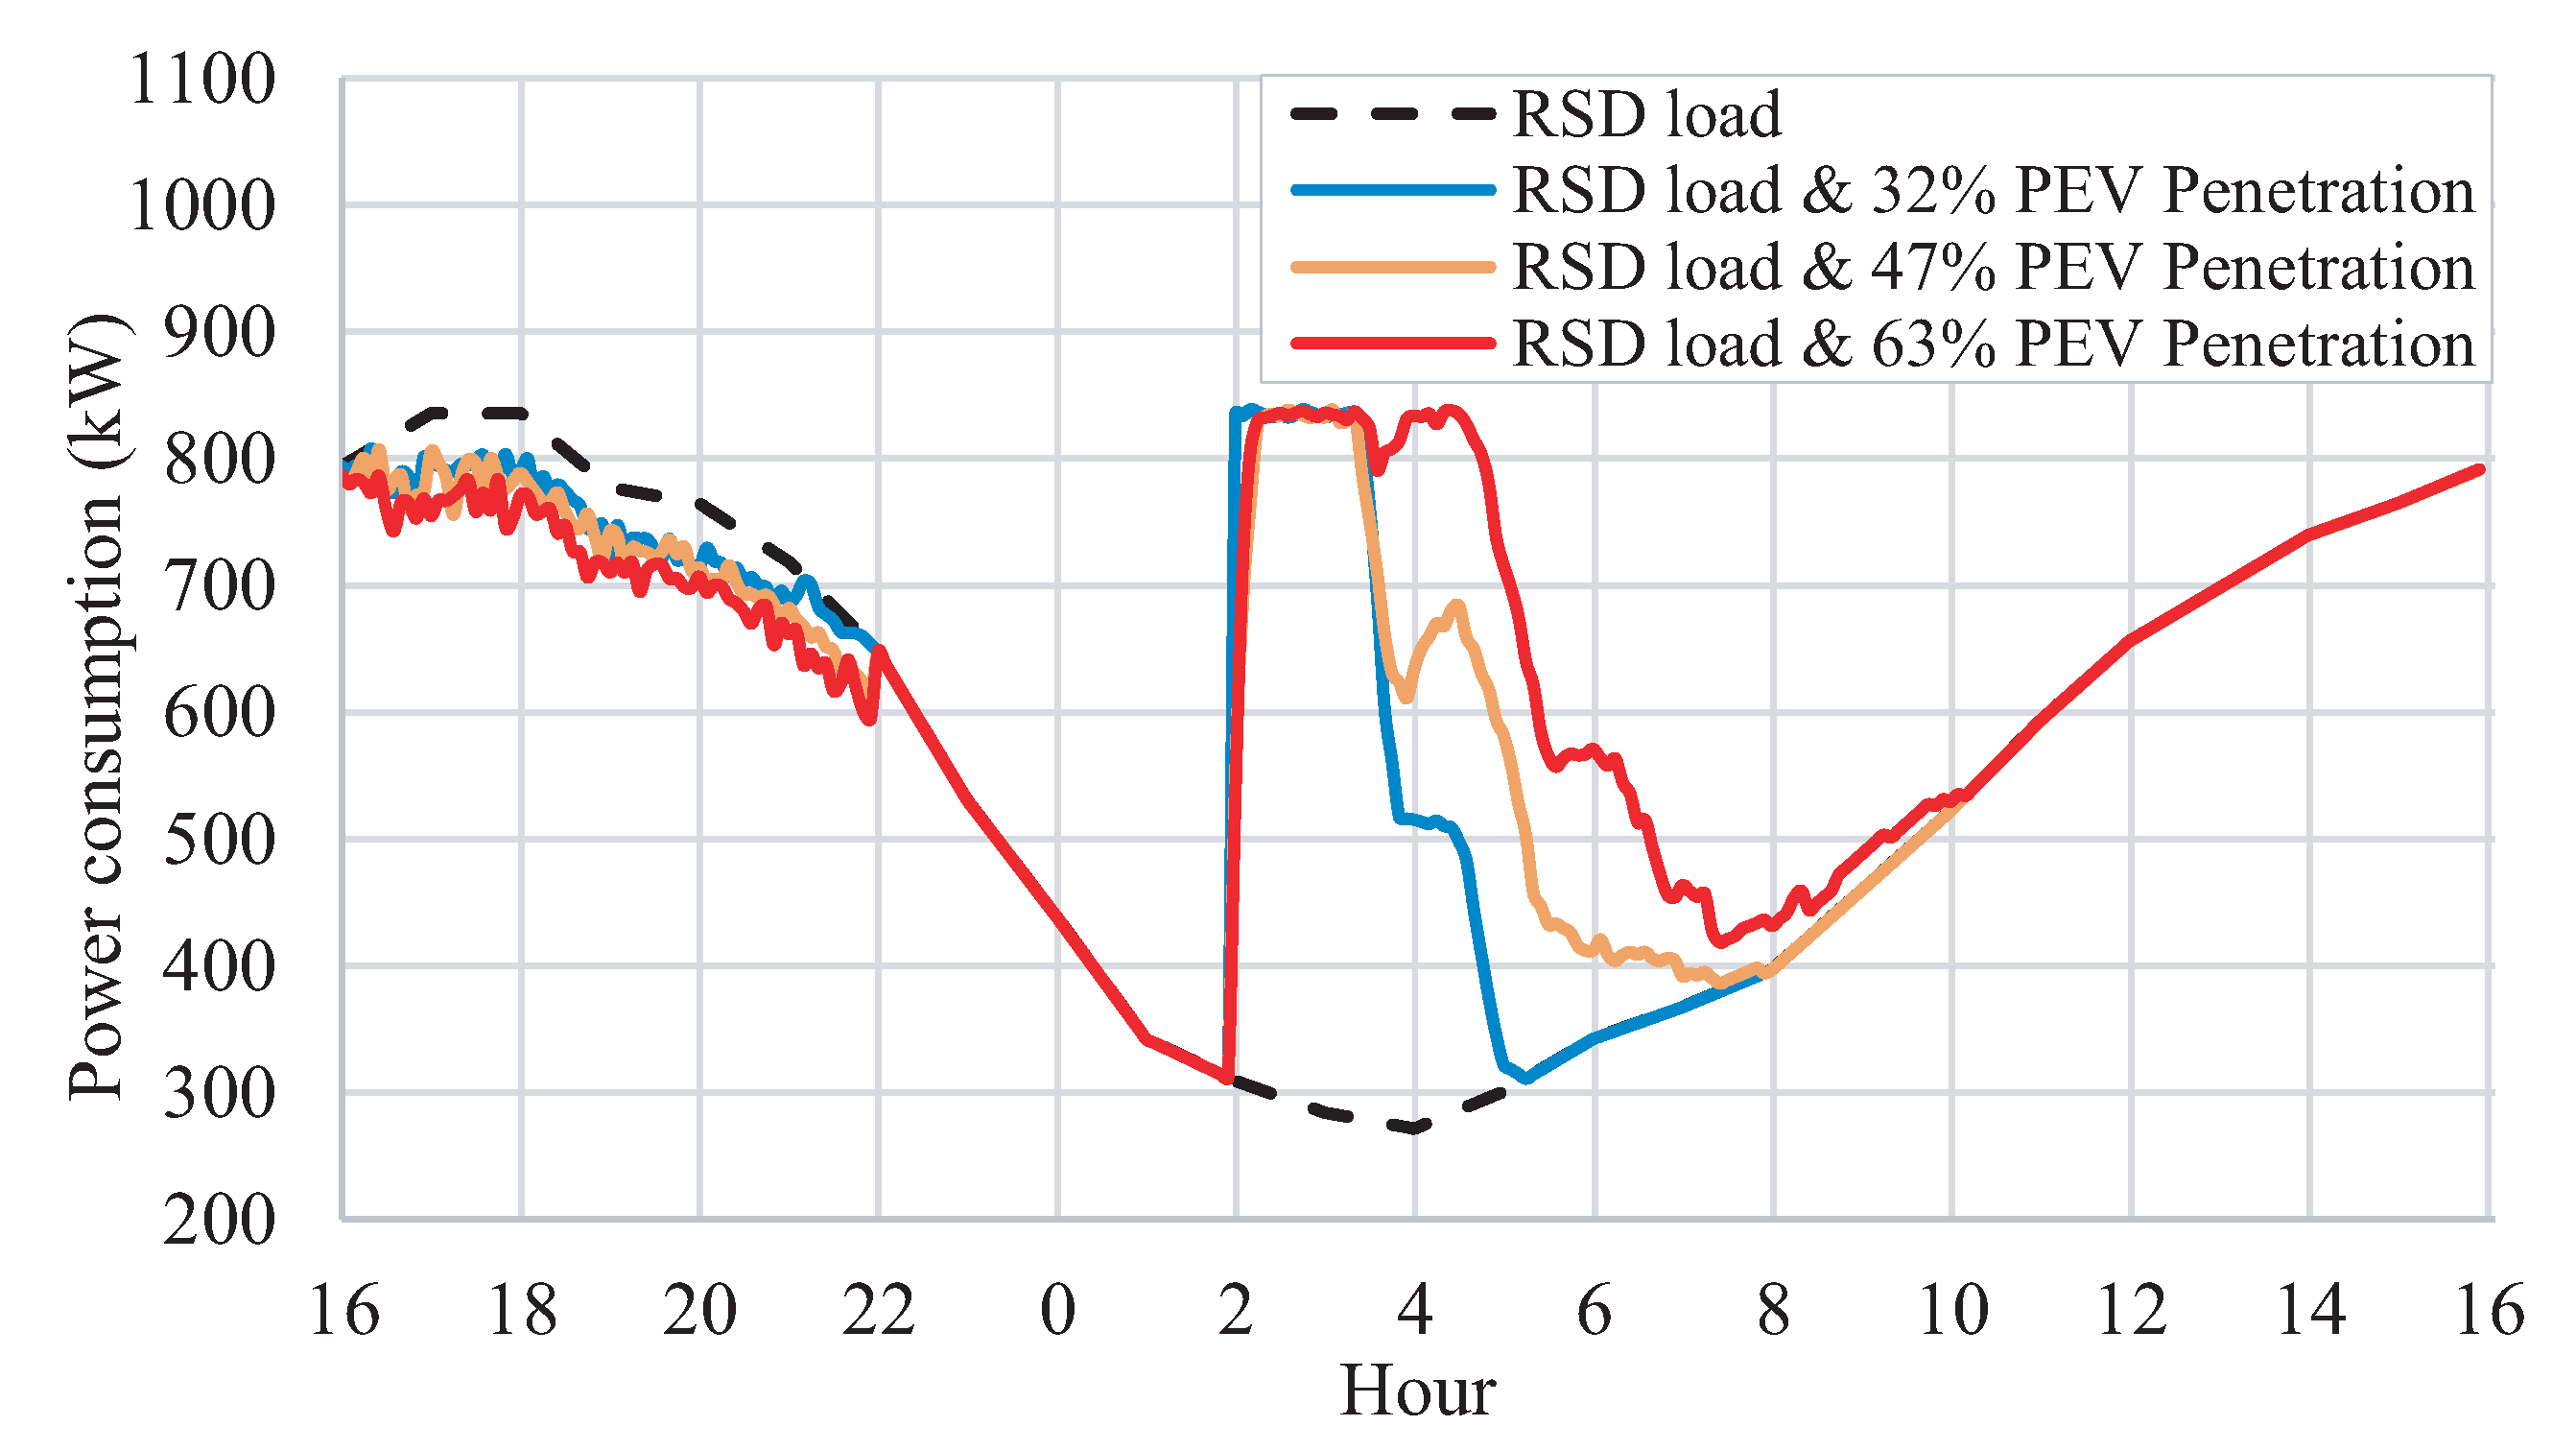
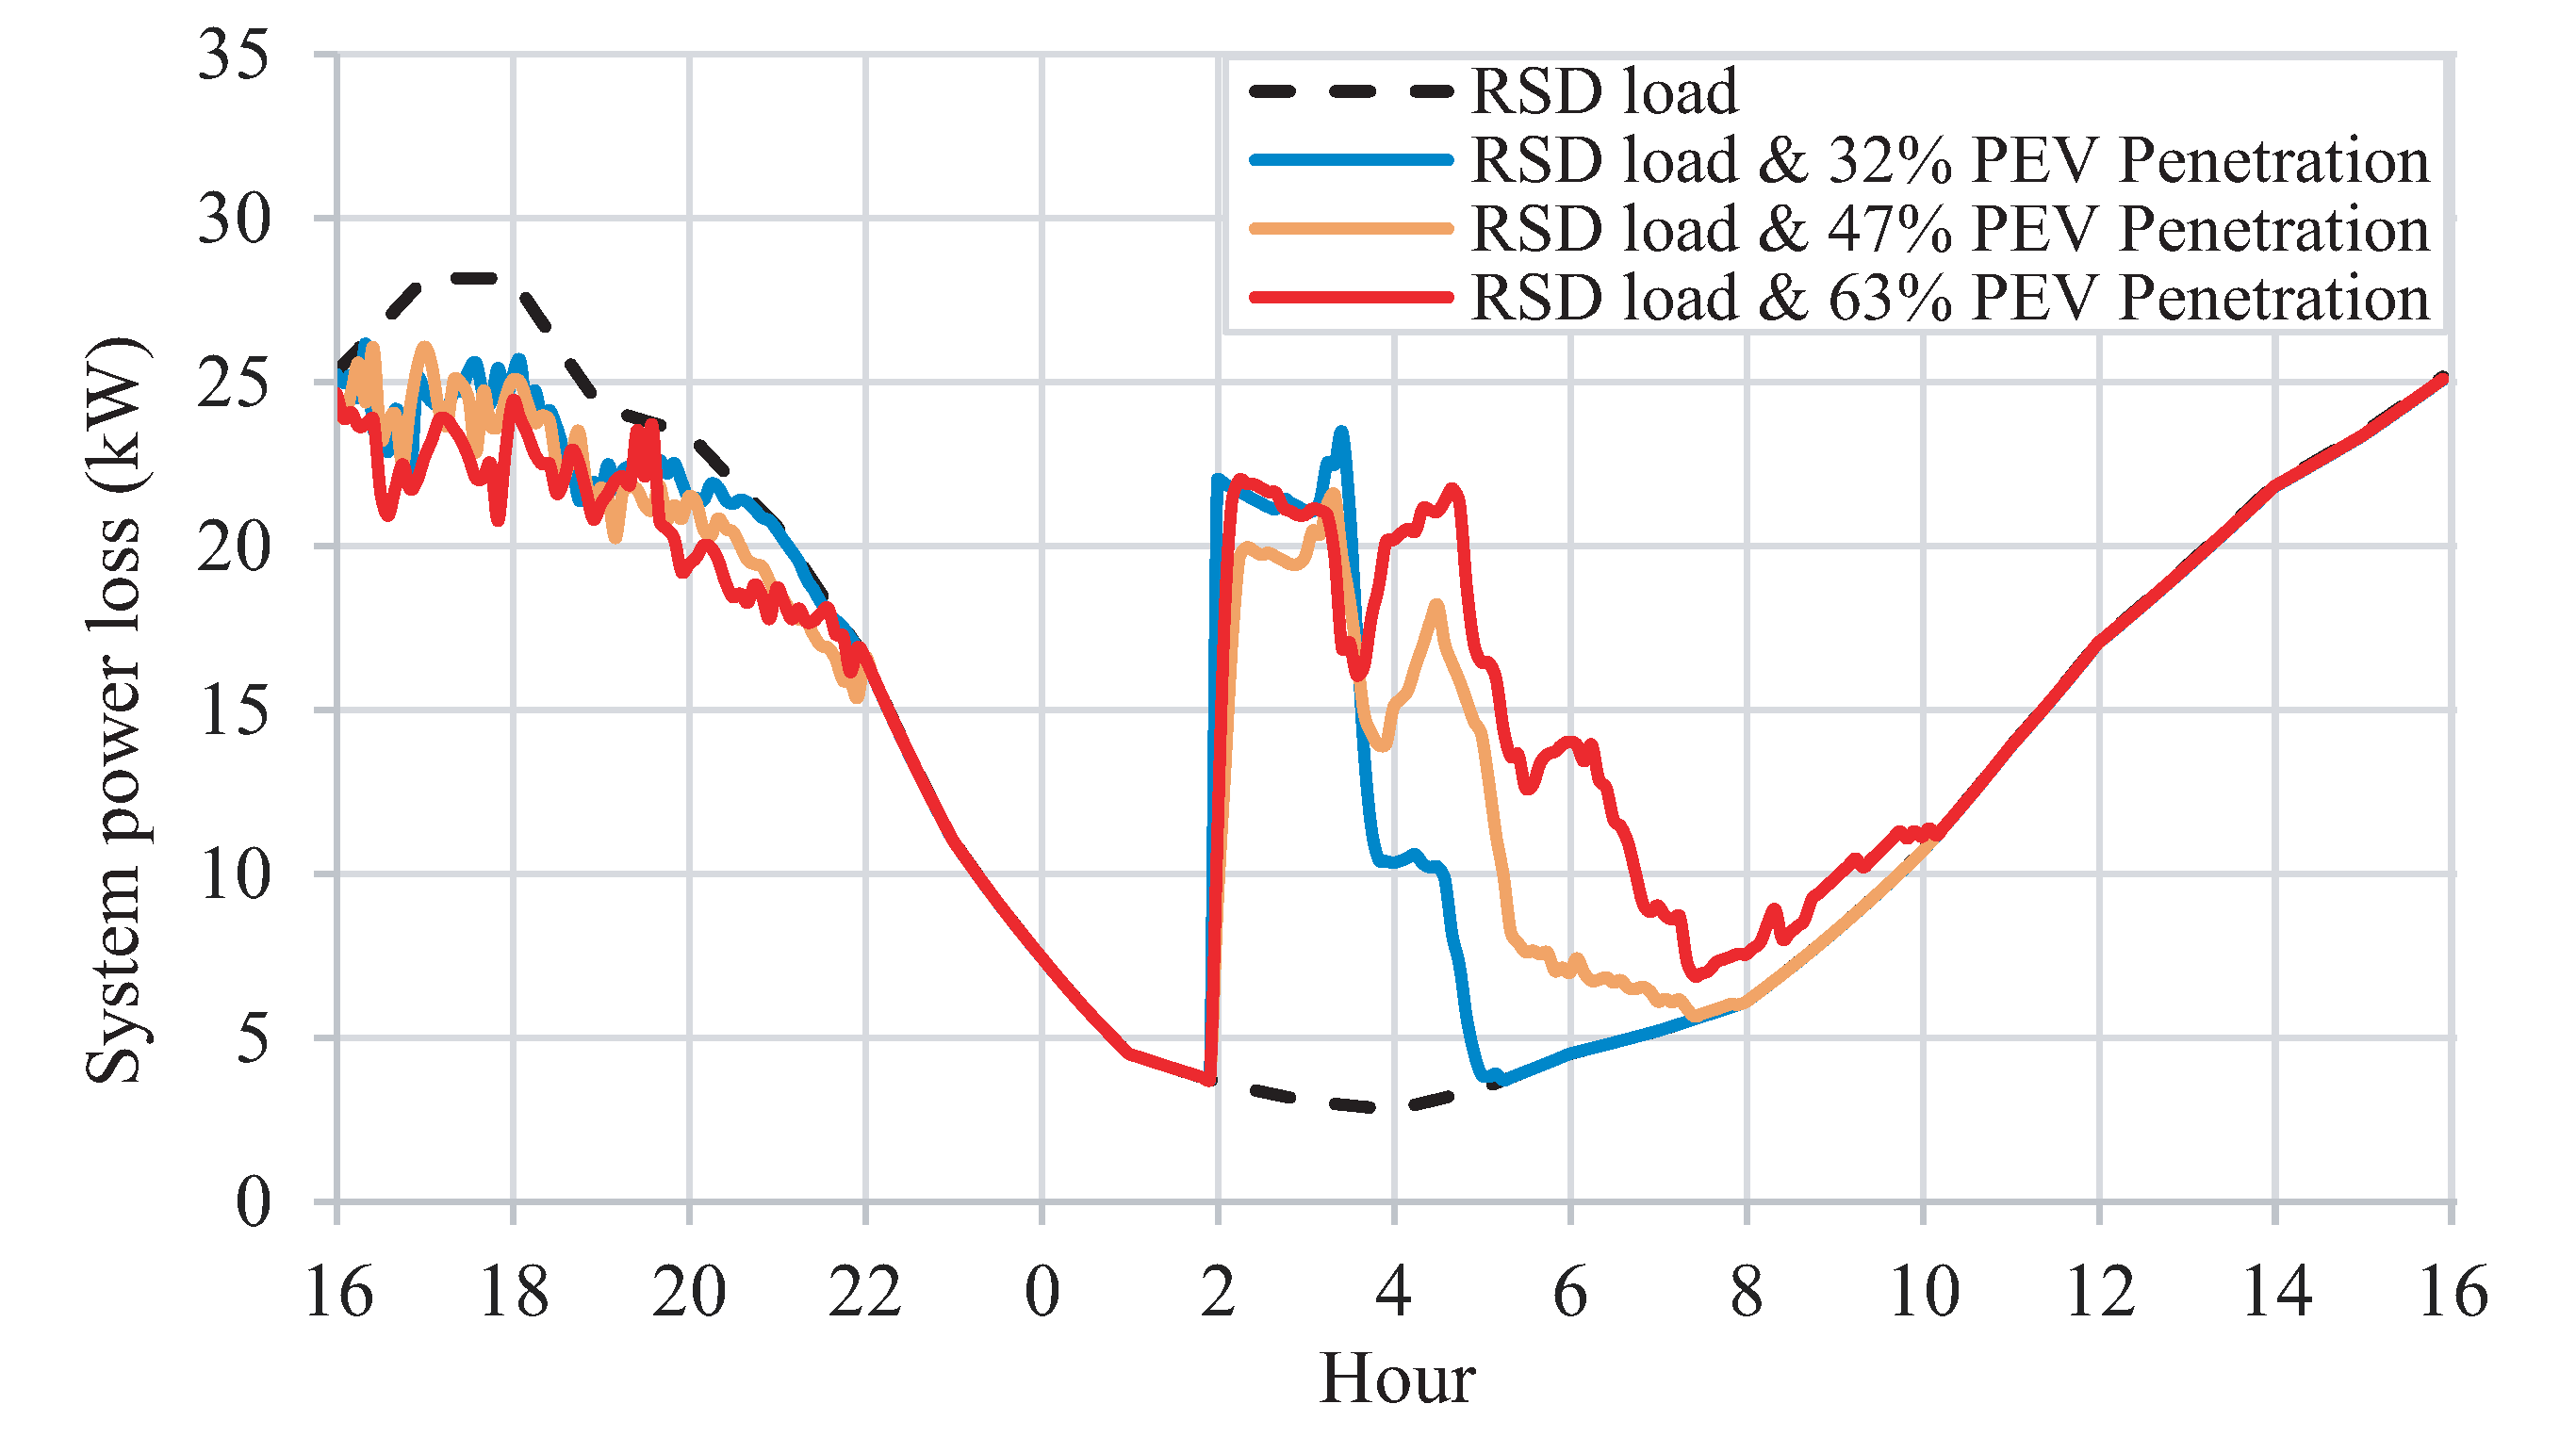
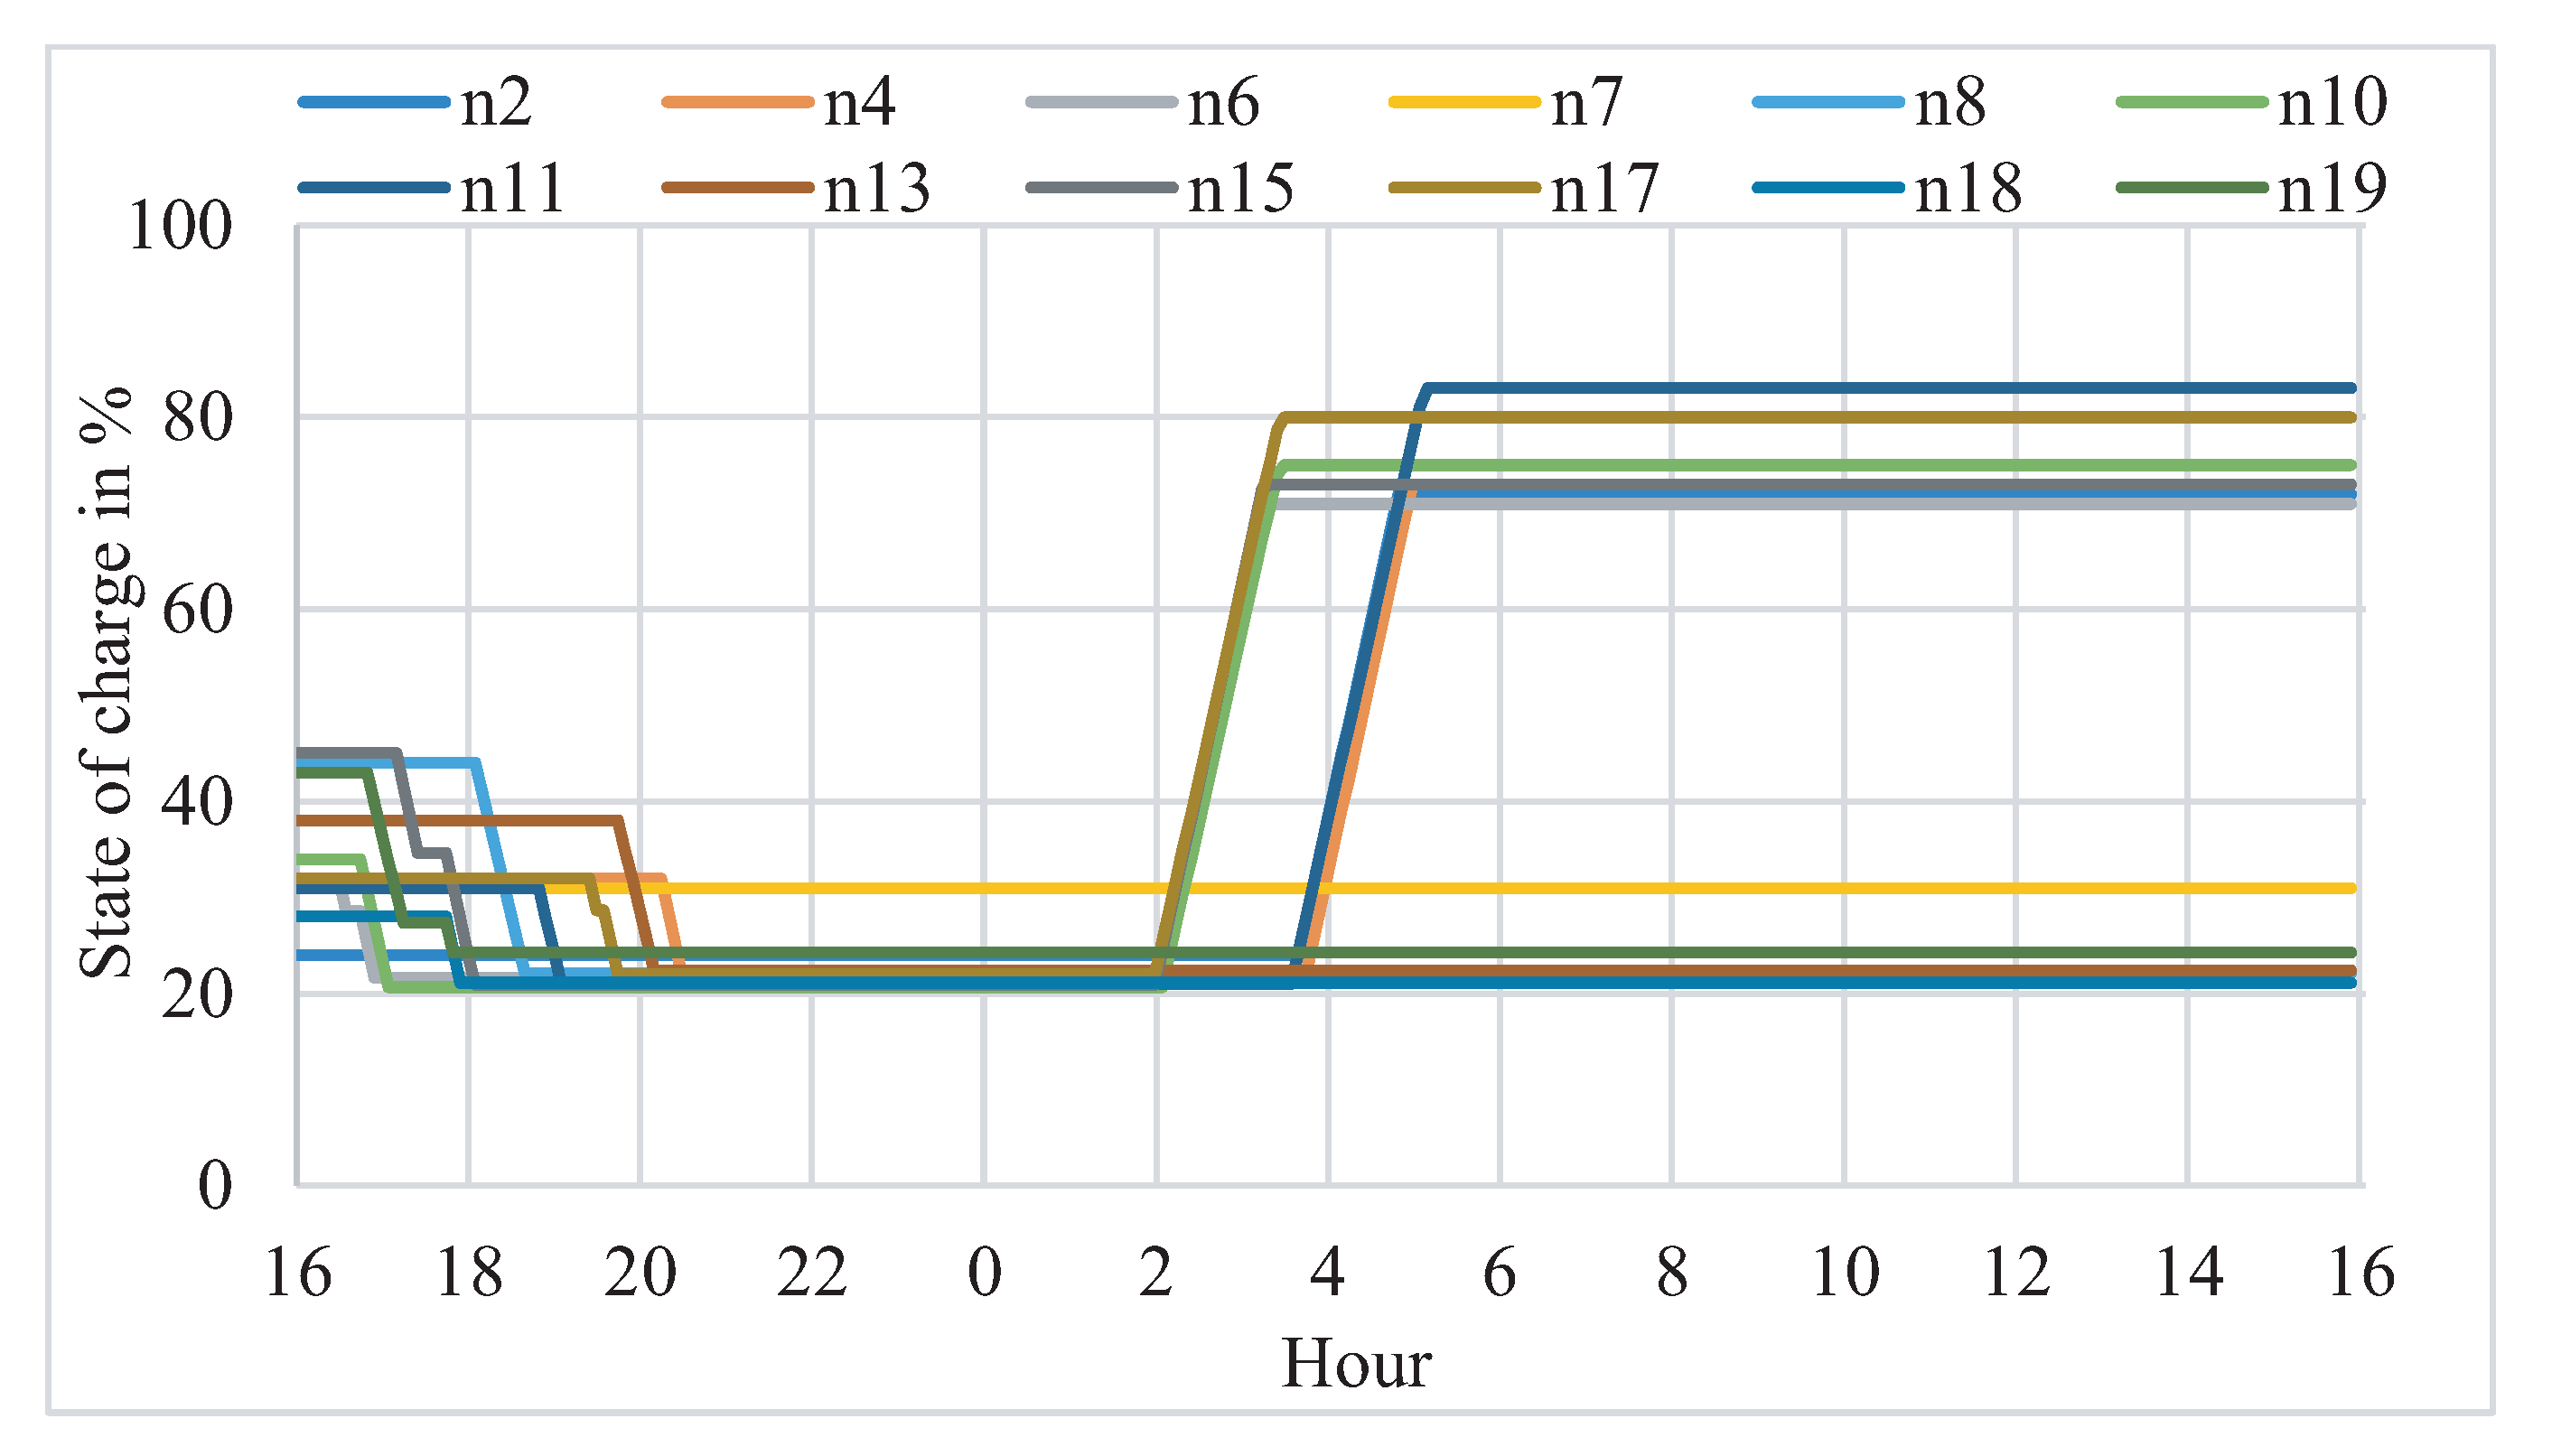
6.3. Case 2: Coordinated Charging and Discharging
6.4. Case 3: Coordinated Charging and Discharging with Capacitor and OLTC
6.5. Discussion and Comparison Studies
7. Conclusions
Author Contributions
Funding
Data Availability Statement
Conflicts of Interest
Abbreviations
| AHP | Analytic hierarchy process |
| BFA | Binary firefly algorithm |
| CR | Consistency ratio |
| OLTC | On-load tap changer |
| PEV | Plug-in electric vehicle |
| SOC | State of charge |
| V2G | Vehicle-to-grid |
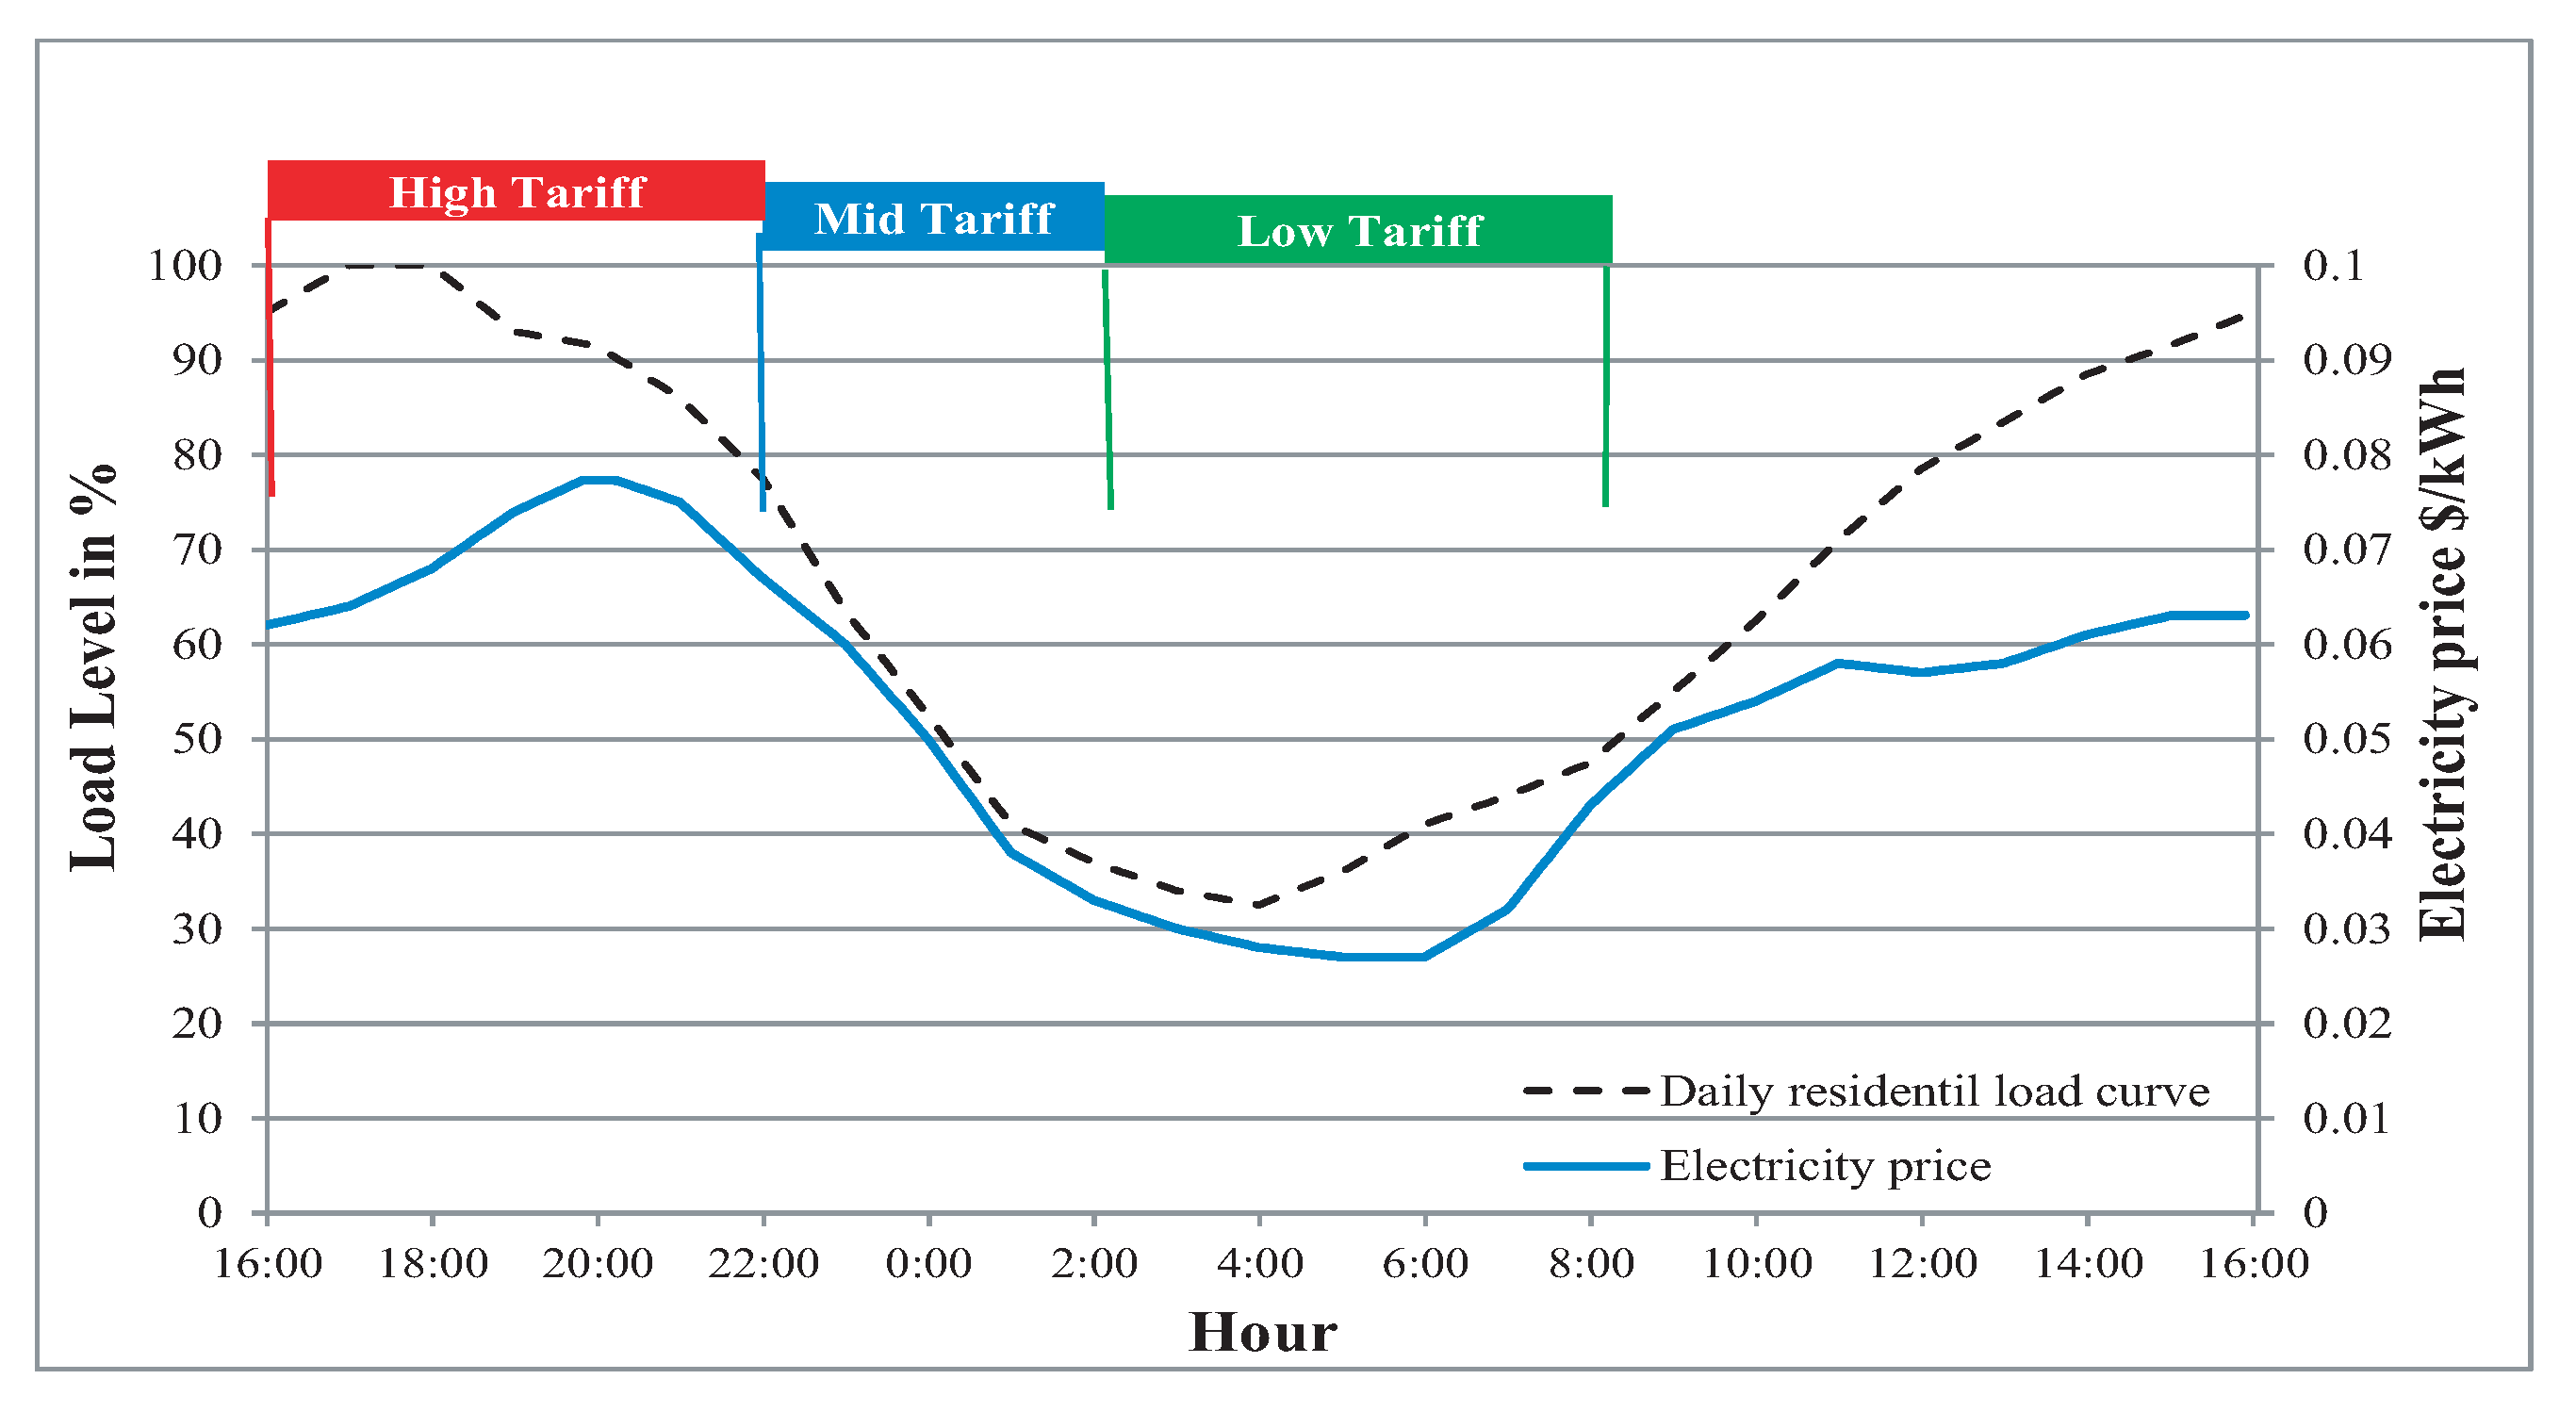
| TOU | Time-of-use |
References
- Das, H.S.; Rahman, M.M.; Li, S.; Tan, C.W. Electric vehicles standards, charging infrastructure, and impact on grid integration: A technological review. Ren. and Sust. Energy Rev. 2020, 120, 109618. [Google Scholar] [CrossRef]
- Kongjeen, Y.; Bhumkittipich, K. Impact of plug-in electric vehicles integrated into power distribution system based on voltage-dependent power flow analysis. Energies 2018, 11, 1571. [Google Scholar] [CrossRef] [Green Version]
- Quirós-Tortós, J.; Ochoa, L.F.; Alnaser, S.W.; Butler, T. Control of EV charging points for thermal and voltage management of LV networks. IEEE Trans. Power Syst. 2015, 31, 3028–3039. [Google Scholar] [CrossRef]
- Rahman, M.T.; Abd Rahim, N.B.; Othman, M.; Mokhlis, H. Plug-in electric vehicle charging coordination considering distribution protection system. In Proceedings of the IEEE PES Asia-Pacific Power and Energy Engineering Conference (APPEEC), Kota Kinabalu, Malaysia, 7–10 October 2018; pp. 51–55. [Google Scholar] [CrossRef]
- Rahman, M.T.; Othman, M.; Mokhlis, H.; Muhammad, M.A.; Bouchekara, H.R. Optimal fixed charge–rate coordination of plug-in electric vehicle incorporating capacitor and OLTC switching to minimize power loss and voltage deviation. IEEJ Trans. Electr. Electron. Eng. 2018, 13, 963–970. [Google Scholar] [CrossRef]
- Suyono, H.; Rahman, M.T.; Mokhlis, H.; Othman, M.; Illias, H.A.; Mohamad, H. Optimal scheduling of plug-in electric vehicle charging including time-of-use tariff to minimize cost and system stress. Energies 2019, 12, 1500. [Google Scholar] [CrossRef] [Green Version]
- Sufyan, M.; Rahim, N.A.; Muhammad, M.A.; Tan, C.K.; Raihan, S.R.S.; Bakar, A.H.A. Charge coordination and battery lifecycle analysis of electric vehicles with V2G implementation. Electr. Power Syst. Res. 2020, 184, 106307. [Google Scholar] [CrossRef]
- Boonraksa, T.; Marungsri, B. Optimal fast charging station location for public electric transportation in smart power distribution network. In Proceedings of the International Electrical Engineering Congress (iEECON), Krabi, Thailand, 7–9 March 2018; pp. 1–4. [Google Scholar] [CrossRef]
- Rahman, I.; Mohamad-Saleh, J. Plug-in electric vehicle charging optimization using bio-inspired computational intelligence methods. In Sustainable Interdependent Networks; Springer: Cham, Switzerland, 2018; pp. 135–147. [Google Scholar] [CrossRef]
- Morshed, M.J.; Hmida, J.B.; Fekih, A. A probabilistic multi-objective approach for power flow optimization in hybrid wind-PV-PEV systems. Appl. Energy 2018, 211, 1136–1149. [Google Scholar] [CrossRef]
- Mehta, R.; Srinivasan, D.; Khambadkone, A.M.; Yang, J.; Trivedi, A. Smart charging strategies for optimal integration of plug-in electric vehicles within existing distribution system infrastructure. IEEE Trans. Smart Grid 2016, 9, 299–312. [Google Scholar] [CrossRef]
- Mehta, R.; Srinivasan, D.; Trivedi, A.; Yang, J. Hybrid planning method based on cost-benefit analysis for smart charging of plug-in electric vehicles in distribution systems. IEEE Trans. Smart Grid 2017, 10, 523–534. [Google Scholar] [CrossRef]
- Hajforoosh, S.; Masoum, M.A.; Islam, S.M. Real-time charging coordination of plug-in electric vehicles based on hybrid fuzzy discrete particle swarm optimization. Electr. Power Syst. Res. 2015, 128, 19–29. [Google Scholar] [CrossRef]
- Masoum, A.S.; Deilami, S.; Moses, P.S.; Masoum, M.A.; Abu-Siada, A. Smart load management of plug-in electric vehicles in distribution and residential networks with charging stations for peak shaving and loss minimisation considering voltage regulation. IET Gener. Transm. Distrib. 2011, 5, 877–888. [Google Scholar] [CrossRef]
- Deilami, S.; Masoum, A.S.; Moses, P.S.; Masoum, M.A. Real-time coordination of plug-in electric vehicle charging in smart grids to minimize power losses and improve voltage profile. IEEE Trans. Smart Grid 2011, 2, 456–467. [Google Scholar] [CrossRef]
- Masoum, A.S.; Deilami, S.; Abu-Siada, A.; Masoum, M.A. Fuzzy approach for online coordination of plug-in electric vehicle charging in smart grid. IEEE Trans. Sustain. Energy 2014, 6, 1112–1121. [Google Scholar] [CrossRef] [Green Version]
- Usman, M.; Tareen, W.U.; Amin, A.; Ali, H.; Bari, I.; Sajid, M.; Seyedmahmoudian, M.; Stojcevski, A.; Mahmood, A.; Mekhilef, S. A coordinated charging scheduling of electric vehicles considering optimal charging time for network power loss minimization. Energies 2021, 14, 5336. [Google Scholar] [CrossRef]
- Cao, C.; Wu, Z.; Chen, B. Electric vehicle–Grid integration with voltage regulation in radial distribution networks. Energies 2020, 13, 1802. [Google Scholar] [CrossRef] [Green Version]
- Liu, M.; Phanivong, P.K.; Shi, Y.; Callaway, D.S. Decentralized charging control of electric vehicles in residential distribution networks. IEEE Trans. Control. Syst. Technol. 2017, 27, 266–281. [Google Scholar] [CrossRef] [Green Version]
- Nimalsiri, N.I.; Ratnam, E.L.; Mediwaththe, C.P.; Smith, D.B.; Halgamuge, S.K. Coordinated charging and discharging control of electric vehicles to manage supply voltages in distribution networks: Assessing the customer benefit. Appl. Energy 2021, 291, 116857. [Google Scholar] [CrossRef]
- Hajforoosh, S.; Masoum, M.A.; Islam, S.M. Online optimal variable charge-rate coordination of plug-in electric vehicles to maximize customer satisfaction and improve grid performance. Electr. Power Syst. Res. 2016, 141, 407–420. [Google Scholar] [CrossRef] [Green Version]
- Abou El-Ela, A.A.; El-Sehiemy, R.A.; Kinawy, A.M.; Mouwafi, M.T. Optimal capacitor placement in distribution systems for power loss reduction and voltage profile improvement. IET Gener. Transm. Distrib. 2016, 10, 1209–1221. [Google Scholar] [CrossRef]
- Arias, N.B.; Franco, J.F.; Lavorato, M.; Romero, R. Metaheuristic optimization algorithms for the optimal coordination of plug-in electric vehicle charging in distribution systems with distributed generation. Electr. Power Syst. Res. 2017, 142, 351–361. [Google Scholar] [CrossRef] [Green Version]
- Valsera-Naranjo, E.; Martinez-Vicente, D.; Sumper, A.; Villafafila-Robles, R.; Sudria-Andreu, A. Deterministic and probabilistic assessment of the impact of the electrical vehicles on the power grid. In Proceedings of the 2011 IEEE Power and Energy Society General Meeting, Detroit, MI, USA, 24–28 July 2011; pp. 1–8. [Google Scholar] [CrossRef] [Green Version]
- Antúnez, C.S.; Franco, J.F.; Rider, M.J.; Romero, R. A new methodology for the optimal charging coordination of electric vehicles considering vehicle-to-grid technology. IEEE Trans. Sustain. Energy 2016, 7, 596–607. [Google Scholar] [CrossRef] [Green Version]
- Aghajan-Eshkevari, S.; Azad, S.; Nazari-Heris, M.; Ameli, M.T.; Asadi, S. Charging and discharging of electric vehicles in power systems: An updated and detailed review of methods, control structures, objectives, and optimization methodologies. Sustainability 2022, 14, 2137. [Google Scholar] [CrossRef]
- Honarmand, M.; Zakariazadeh, A.; Jadid, S. Integrated scheduling of renewable generation and electric vehicles parking lot in a smart microgrid. Energy Convers. Manag. 2014, 86, 745–755. [Google Scholar] [CrossRef]
- Jian, L.; Zheng, Y.; Xiao, X.; Chan, C.C. Optimal scheduling for vehicle-to-grid operation with stochastic connection of plug-in electric vehicles to smart grid. Appl. Energy 2015, 146, 150–161. [Google Scholar] [CrossRef]
- Fu, H.; Han, Y.; Wang, J.; Zhao, Q. A novel optimization of plug-in electric vehicles charging and discharging behaviors in electrical distribution grid. J. Electr. Comput. Eng. 2018, 2018, 5091084. [Google Scholar] [CrossRef]
- Reddy, K.R.; Meikandasivam, S.; Vijayakumar, D. A novel strategy for maximization of plug-In electric vehicle’s storage utilization for grid support with consideration of customer flexibility. Electr. Power Syst. Res. 2019, 170, 158–175. [Google Scholar] [CrossRef]
- Nimalsiri, N.I.; Ratnam, E.L.; Smith, D.B.; Mediwaththe, C.P.; Halgamuge, S.K. Coordinated charge and discharge scheduling of electric vehicles for load curve shaping. IEEE Trans. Intell. Transp. Syst. 2021, 13, 7653–7665. [Google Scholar] [CrossRef]
- Jozi, F.; Mazlumi, K.; Hosseini, H. December. Charging and discharging coordination of electric vehicles in a parking lot considering the limitation of power exchange with the distribution system. In Proceedings of the IEEE 4th International Conference on Knowledge-Based Engineering and Innovation (KBEI), Tehran, Iran, 22 December 2017; pp. 0937–0941. [Google Scholar] [CrossRef]
- Yang, X. S Nature-Ispired Metaheuristic Algorithms; Luniver Press: Beckington, UK, 2008; pp. 242–246. [Google Scholar]
- Palit, S.; Sinha, S.N.; Molla, M.A.; Khanra, A.; Kule, M. A cryptanalytic attack on the knapsack cryptosystem using binary firefly algorithm. In Proceedings of the 2nd International Conference on Computer and Communication Technology, Allahabad, India, 15–17 September 2011; pp. 428–432. [Google Scholar] [CrossRef]
- Saaty, T.L. Decision making for leaders. IEEE Trans. Syst. Man Cybern. 1985, 3, 450–452. [Google Scholar] [CrossRef]
- Ali, T.; Nahian, A.J.; Ma, H. A hybrid multi-criteria decision-making approach to solve renewable energy technology selection problem for Rohingya refugees in Bangladesh. J. Clean. Prod. 2020, 273, 122967. [Google Scholar] [CrossRef]
- Kim, D.M.; Kim, J.O. Design of emergency demand response program using analytic hierarchy process. IEEE Trans. Smart Grid 2012, 3, 635–644. [Google Scholar] [CrossRef]
- Mu, E.; Pereyra-Rojas, M. Understanding the analytic hierarchy process. In Practical Decision Making; Springer: Cham, Switzerland, 2017; pp. 7–22. [Google Scholar] [CrossRef]


| Case | PEV | Increase | V | Total | Increase in | PEV Charge |
|---|---|---|---|---|---|---|
| Study | in Power | Cost | Total Cost | Complete Ratio | ||
| (%) | (%) | (%) | ($) | (%) | ||
| No PEV | - | - | 7.36 | 786.20 | - | - |
| 32 | 39.41 | 11.69 | 942.32 | 19.85 | 22/22 | |
| Case 1 | 47 | 61.84 | 35.19 | 1018.13 | 29.50 | 22/22 |
| 63 | 85.18 | 34.90 | 1081.18 | 37.52 | 22/22 | |
| 32 | 8.34 | 7.29 | 867.25 | 10.31 | 22/22 | |
| Case 2 | 47 | 10.44 | 9.83 | 891.47 | 13.39 | 10/22 |
| 63 | 15.88 | 9.93 | 935.42 | 15.88 | 6/22 | |
| 32 | 8.42 | 6.08 | 866.15 | 10.17 | 22/22 | |
| Case 3 | 47 | 14.37 | 6.63 | 898.94 | 14.34 | 22/22 |
| 63 | 19.92 | 7.03 | 943.75 | 20.04 | 22/22 |
| Ref | Research | PEV | Objective | Applied | Maximum | Weakest | Customer |
|---|---|---|---|---|---|---|---|
| Objective | Coordination | Function | Method | Power | Node | Satisfaction | |
| Type | Type | Loss | Voltage | Analysis | |||
| Minimizing power | Charging | ||||||
| [5] | loss and voltage | coordination | Single | Binary PSO | 29 kW | 0.925 pu | Yes |
| deviation | |||||||
| Minimize cost, | Fuzzy discrete | ||||||
| [13] | loss and maximize | Charging | Single | particle swarm | 32 kW | 0.9 pu | No |
| power delivery for | coordination | optimization | |||||
| PEV charging | |||||||
| Minimizing | Charging | Binary | |||||
| [17] | power | coordination | Single | evolutionary | 33 kW | 0.9 pu | No |
| loss | programming | ||||||
| Maximize | Charging | Coordinated | |||||
| [21] | customer | coordination | Single | aggregated | 31 kW | 0.9 pu | Yes |
| satisfaction | PSO | ||||||
| Minimizing power | Binary firefly | ||||||
| loss, operational | Charging and | algorithm and | |||||
| Proposed | cost and voltage | discharging | Multi- | analytic | 28 kW | 0.93 pu | Yes |
| method | deviation of the | coordination | objective | hierarchy | |||
| system | method |
Disclaimer/Publisher’s Note: The statements, opinions and data contained in all publications are solely those of the individual author(s) and contributor(s) and not of MDPI and/or the editor(s). MDPI and/or the editor(s) disclaim responsibility for any injury to people or property resulting from any ideas, methods, instructions or products referred to in the content. |
© 2023 by the authors. Licensee MDPI, Basel, Switzerland. This article is an open access article distributed under the terms and conditions of the Creative Commons Attribution (CC BY) license (https://creativecommons.org/licenses/by/4.0/).
Share and Cite
Islam, J.B.F.; Rahman, M.T.; Ahmad, S.; Ahmed, T.; Shafiullah, G.M.; Mokhlis, H.; Othman, M.; Izam, T.F.T.M.N.; Mohamad, H.; Arif, M.T. Multi-Objective-Based Charging and Discharging Coordination of Plug-in Electric Vehicle Integrating Capacitor and OLTC. Energies 2023, 16, 2172. https://0-doi-org.brum.beds.ac.uk/10.3390/en16052172
Islam JBF, Rahman MT, Ahmad S, Ahmed T, Shafiullah GM, Mokhlis H, Othman M, Izam TFTMN, Mohamad H, Arif MT. Multi-Objective-Based Charging and Discharging Coordination of Plug-in Electric Vehicle Integrating Capacitor and OLTC. Energies. 2023; 16(5):2172. https://0-doi-org.brum.beds.ac.uk/10.3390/en16052172
Chicago/Turabian StyleIslam, Junaid Bin Fakhrul, Mir Toufikur Rahman, Shameem Ahmad, Tofael Ahmed, G. M. Shafiullah, Hazlie Mokhlis, Mohamadariff Othman, Tengku Faiz Tengku Mohmed Noor Izam, Hasmaini Mohamad, and Mohammad Taufiqul Arif. 2023. "Multi-Objective-Based Charging and Discharging Coordination of Plug-in Electric Vehicle Integrating Capacitor and OLTC" Energies 16, no. 5: 2172. https://0-doi-org.brum.beds.ac.uk/10.3390/en16052172