Article

Influence of Oxygen/Steam Addition on the Quality of Producer Gas during Direct (Air) Gasification of Residual Forest Biomass

by
Helena G. M. F. Gomes
,
Manuel A. A. Matos
and
Luís A. C. Tarelho
*
Department of Environment and Planning, CESAM—Centre for Environmental and Marine Studies, University of Aveiro, Campus Universitário de Santiago, 3810-193 Aveiro, Portugal
*
Author to whom correspondence should be addressed.
Submission received: 31 January 2023 / Revised: 24 February 2023 / Accepted: 28 February 2023 / Published: 3 March 2023
(This article belongs to the Special Issue Energy Production from Biomass Valorization)

Abstract

:
Biomass gasification is a relevant option to produce a gaseous fuel, it faces, however, several barriers regarding its quality for energetic applications. Therefore, in this study, air-steam and O2-enriched air mixtures were used as gasification agents during the gasification of residual biomass from eucalyptus to improve the producer gas quality. The steam addition promoted an increase in CO2 and H2 concentrations, whilst decreasing the CO and CH4 concentrations. The steam addition had no evident impact on the lower heating value of the dry producer gas and a positive effect on gas yield and the H2:CO molar ratio, attaining the later values up to 1.6 molH2∙mol−1CO. The increase in O2 concentration in the gasification agent (φ) promoted an increase in all combustible species and CO2 concentrations. The lower heating value of the dry producer gas underwent an increase of 57%, reaching a value of 7.5 MJ∙Nm−3dry gas, when the φ increased from 20 to 40 %vol.O2, dry GA. The gas yield had a significant decrease (33%) with φ increase. This work showed that the addition of steam or O2 during air gasification of residual biomass improved producer gas quality, overcoming some of the barriers found in conventional air gasification technology.

1. Introduction

Our 21st-century society faces several challenges related to climate change and energy use. In 2015, all United Nations members approved and adopted the 2030 Agenda for Sustainable Development towards the improvement of life quality and promotion of the planet’s sustainability, defining various goals to be achieved by 2030 [1]. Later, and within the bioeconomy framework, the European Commission developed the European Green Deal, providing a set of objectives for 2050, targeting several subjects concerning energy use and climate change. Both frameworks state the importance of using cleaner and renewable energy and the urgency of reducing greenhouse gas emissions [2]. However, in 2021, energy-related CO2 emissions reached 36.3 Gton, the highest annual value measured so far [3]. Moreover, although the amount of energy supplied by renewable resources increased by approximately 14%, between 2010 and 2019 [4], the share of renewables in the total energy consumption was only 17.7% in 2019 [5].
Therefore, different choices must be taken towards an environmentally sustainable planet. In this regard, the gasification of lignocellulosic biomass residues appears as a relevant option, providing a renewable green fuel gas with numerous applications and promoting energy independence whilst boosting the use of a non-intermittent endogenous renewable resource, and being highly available and widely distributed around the world [6,7,8]. Furthermore, this process favors the reduction in global CO2 emissions and has a low environmental impact [9].
The gasification process is often described as a high-temperature (usually above 700 °C) conversion of a carbonaceous matrix into a fuel gas—producer gas—mainly composed of carbon monoxide, carbon dioxide, hydrogen, water, methane, and other light hydrocarbons, under a controlled amount of an oxidant or so-called gasification agent [10,11]. During the process, several reactions can occur (Table 1) and their direction and rate are highly dependent on the process conditions and biomass composition [12,13].
The method of introducing oxygen into the process has a major impact on the producer gas composition, heating value, and efficiency parameters [14]. The oxygen can be introduced using different gasification agents [16]. Owing to its availability and low price, air is the most common gasification agent, promoting the partial combustion of the fuel, thus providing the required energy to maintain the process in an autothermal regime [17]. However, although this technology is considered a promising solution for a green and clean energy transition, the process still faces several challenges, hindering its full implementation at the industrial level and commercial breakthrough [18]. Amongst different barriers, some technical issues can be identified regarding direct (air) biomass gasification, including [19]:
  • Reduced lower heating value of dry producer gas (LHVG), ~5 MJ∙Nm−3dry gas, due to the dilution of N2.
  • Low H2 concentration [~8 %vol.dry gas], the only carbon-free fuel gas in the producer gas.
  • Reduced H2:CO molar ratio [0.3 and 0.8 molH2∙mol−1CO] [19]—an important parameter for advanced applications, including Fischer-Tropsch synthesis for liquid fuels production ((0.6 or 2.0 molH2∙mol−1CO), depending on the catalyst applied), dimethyl ether (DME) synthesis (1 molH2∙mol−1CO), bioethanol synthesis (between 1 and 2 molH2∙mol−1CO) and methanol synthesis (2 mol molH2∙mol−1CO) and biomethane production (3 molH2∙mol−1CO) [7,20,21,22].
To overcome these barriers, other gasification agents can be applied, namely steam water, hereinafter referred to as “steam”, and pure oxygen (O2). Steam leads to a H2-rich producer gas, with H2 concentrations between 40 and 60 %vol.dry gas, with a high H2:CO molar ratio, up to 8 molH2∙mol−1CO, and an LHVG ranging from 9 to 15 MJ∙Nm−3dry gas [23,24,25,26], overcoming all the aforementioned constraints in air gasification. However, steam is less reactive than air or O2, and most reactions involving steam are endothermic and slower when compared to oxidation reactions [14]. Therefore, to meet the energy needs of this process, an external source of heat is mandatory, increasing its overall costs [14].
The use of pure O2 is considered an interesting alternative to air as a gasification agent, increasing the LHVG (ranging between 10 and 15 MJ∙Nm−3dry gas), and the H2 concentration, up to 40 %vol.dry gas [27], whilst allowing an autothermal regime. However, pure O2 generation is an expensive process [27], and the use of this gasification agent requires a higher control of the process due to the increment of the solid fuel reactivity with increasing O2 concentration [28]. Moreover, an increase in O2 concentration will promote the increment of the oxidation reaction rate, according to the law of mass action [29]. This may lead to operating difficulties associated with an increase in the heat released and temperature.
To find a balance between the strengths and weaknesses of these gasification agents when applied alone, mixtures of air-steam or air-O2, hereinafter referred to as “O2-enriched air” can be used as a suitable alternative approach. Moreover, if these agents (pure O2 and steam) are by-products from other processes (e.g., O2 from water electrolysis for H2 production) or industries (e.g., steam from the pulp and paper industry), the overall costs of the process can be reduced.
Gasification using a mixture of air and steam as a gasification agent has been investigated in several studies and its effect on the producer gas quality has been evaluated [9,30,31,32]. Tian et al. [30] carried out several experiments of air-steam biomass gasification in a bubbling fluidized bed reactor and observed an increase in both H2 and CO2 concentrations on the producer gas composition, accompanied by a decrease in the CO and CH4 concentrations when the steam-to-biomass mass ratio (SBR) increased from 0.6 to 1.0 kgsteam∙kg−1biomass. However, Lv et al. [31] studied the impact of SBR on the producer gas quality during air-steam gasification of pine sawdust in a fluidized bed reactor and found that an increase from 0 to 1.35 kgsteam∙kg−1biomass in the SBR led to a decrease in the H2 and CO concentrations and an increase in the CO2 and CH4 concentrations. The authors also observed that an increment in the SBR from 1.35 to 2.70 kgsteam∙kg−1biomass led to a gradual decrease in the CO and CH4 concentrations, whereas CO2 and H2 concentrations showed a moderately increasing trend [31]. The LHVG decreased when the SBR increased from 1.35 to 2.70 kgsteam∙kg−1biomass, having the gas yield and carbon conversion followed the same path [31]. The authors concluded that these results were caused by the decrease in the reactor temperature with the steam addition, lowering the producer gas quality [31]. Campoy et al. [9] performed experiments of air-steam gasification of wood pellets in a bubbling fluidized bed reactor and observed that both H2 and CO2 concentrations increased with the increment of SBR from 0 to 0.45 kgsteam∙kg−1biomass, whilst the CO and CH4 concentrations decreased. Moreover, the authors also noticed an increase in the H2:CO molar ratio in the increment of SBR, whereas the cold gas efficiency, LHVG, and carbon conversion were unaffected [9]. Tian et al. [32] performed several experiments of air-steam biomass gasification using coal-bottom ash and observed that an increment in the SBR from 0.34 to 1.02 kgsteam∙kg−1biomass had a positive impact on the H2:CO molar ratio, followed by a marginal effect on the LHVG.
Some studies were found regarding the addition of O2 during air biomass gasification [15,33,34,35]. Wang et al. [33] studied the O2-enriched air gasification of biomass in a two-staged pilot-scale gasifier and observed an increment of all combustible species and CO2 concentrations on the producer gas with the increment of O2 in the gasification agent. Moreover, the authors also noticed that the gas yield decreased with the increase in the O2 in the gasification agent, whereas the carbon conversion and LHVG followed an opposite direction [33]. The authors concluded that these results were caused by the decrease in the nitrogen concentration in the gasification agent and the temperature increase in the reactor from the O2 addition. Mastellone et al. [34] performed O2-enriched air gasification of mixtures of coal, plastics, and wood in a fluidized bed gasifier and observed that, for the same temperature, the CO concentration (inert free) increased, whereas the CO2 concentration (inert free) decreased with the increment of O2 concentration in the gasification agent. The authors also observed an increase in the LHVG and the cold gas efficiency, followed by a decrease in the gas yield [34]. Liu et al. [35] analyzed the effect of O2 concentration in the gasification agent during the O2-enriched air gasification of biomass in a fluidized bed reactor. The authors observed that the increment of O2 concentration had a positive effect on the producer gas composition, increasing the volumetric fraction of all combustible species and CO2 [35]. Moreover, this parameter also had a positive impact on the LHVG, carbon conversion, and cold gas efficiency, with the gas yield being the only parameter negatively affected by the O2 addition [35]. Liu et al. [15] studied the influence of the O2 concentration in the gasification agent during biomass gasification. When the O2 concentration increased from 21 %vol. (air) to close to 30 %vol., the authors observed an increment in H2, CO, CO2, and CH4 concentrations, accompanied by an increase in the LHVG, gas yield, carbon conversion, and cold gas efficiency [15]. However, even though the CO, CO2, and CH4 concentrations continued to increase with the O2 concentration increase from 30 %vol. to, approximately, 45 %vol., the H2 concentration firstly remained constant and then decreased [15]. For these conditions, the gas yield decreased and the carbon conversion remained constant, whilst the LHVG and cold gas efficiency increased [15].
Despite the growing interest in air-steam and O2-enriched air biomass gasification process, information regarding the effect of steam or O2 air on the producer gas quality during air gasification of lignocellulosic residues is still scarce. Moreover, there are still some gaps in the literature that prevent a thorough knowledge of the influence of the addition of steam/O2, without the side effects of other parameters (e.g., temperature, equivalence ratio). Temperature plays a major role during biomass gasification and the addition of steam or O2 will affect this parameter, changing the reactions kinetics of the process, gas composition, and the overall producer gas quality.
Therefore, this work intends to deliver new information on the effect of steam or O2 addition on the producer gas characteristics, during air gasification of residual forest biomass from eucalyptus, whilst maintaining other process parameters constant (e.g., temperature and equivalence ratio), in order to evaluate their true influence on: (a) average producer gas composition and gas compounds yield; (b) LHVG; (c) performance parameters, namely specific dry gas production, cold gas efficiency, and carbon conversion efficiency; and (d) H2:CO and CO:CO2 molar ratios.
The results attained may add knowledge in the field of biomass gasification, and help this technology reach technical feasibility and full implementation.

2. Materials and Methods

2.1. Feedstock Characterization

Residual forest biomass (RFB) from Eucalyptus globulus (a lignocellulosic residue) is a waste stream from the pulp and paper industry, with more than 75,000 tons generated in 2020, in Portugal [36]. Bearing that in mind, a mixture of RFB from eucalyptus (E. globulus) was used in the gasification experiments carried out in this work. The feedstock included biomass from two different activities: forestry operations, including tree logging (branches, bark, and foliage); and industrial operations, namely woodchip production for pulp production (sawdust). Once prepared, the mixture was air-dried to ensure the thermochemical needs of the process and pelletized to increase the physical characteristics in terms of feedstock uniformity. Finally, the pellets were crushed and sieved between 2 and 4 mm to fulfill the requirements of the feeding system.
Table 2 shows the residual biomass characterization. The proximate analysis was performed following the CEN/TS standards for the determination of moisture content, ash content, and volatile matter content, whilst the Fixed Carbon content was calculated by difference. The ultimate analysis was performed by an external laboratory using a CHNS Elemental analyzer (Fisons Instruments, model EA1108). The LHVB calculation was made considering the higher heating value of dry biomass (HHVB) estimation, following the empirical correlation developed by Channiwala and Parikh [37], based on the ultimate analysis of the fuel, as shown by Equations (1) and (2).
HHV B = 0 . 3491 w CB   + 1 . 1783 w HB + 0 . 1005 w SB   0 . 1034 w OB   0 . 0151 w NB   0 . 0211 w ashB
LHV B = HHV B   h H 2 O ,   298 K   ×   ( w H 2 OB + w HB   × M H 2 O M H 2 )  

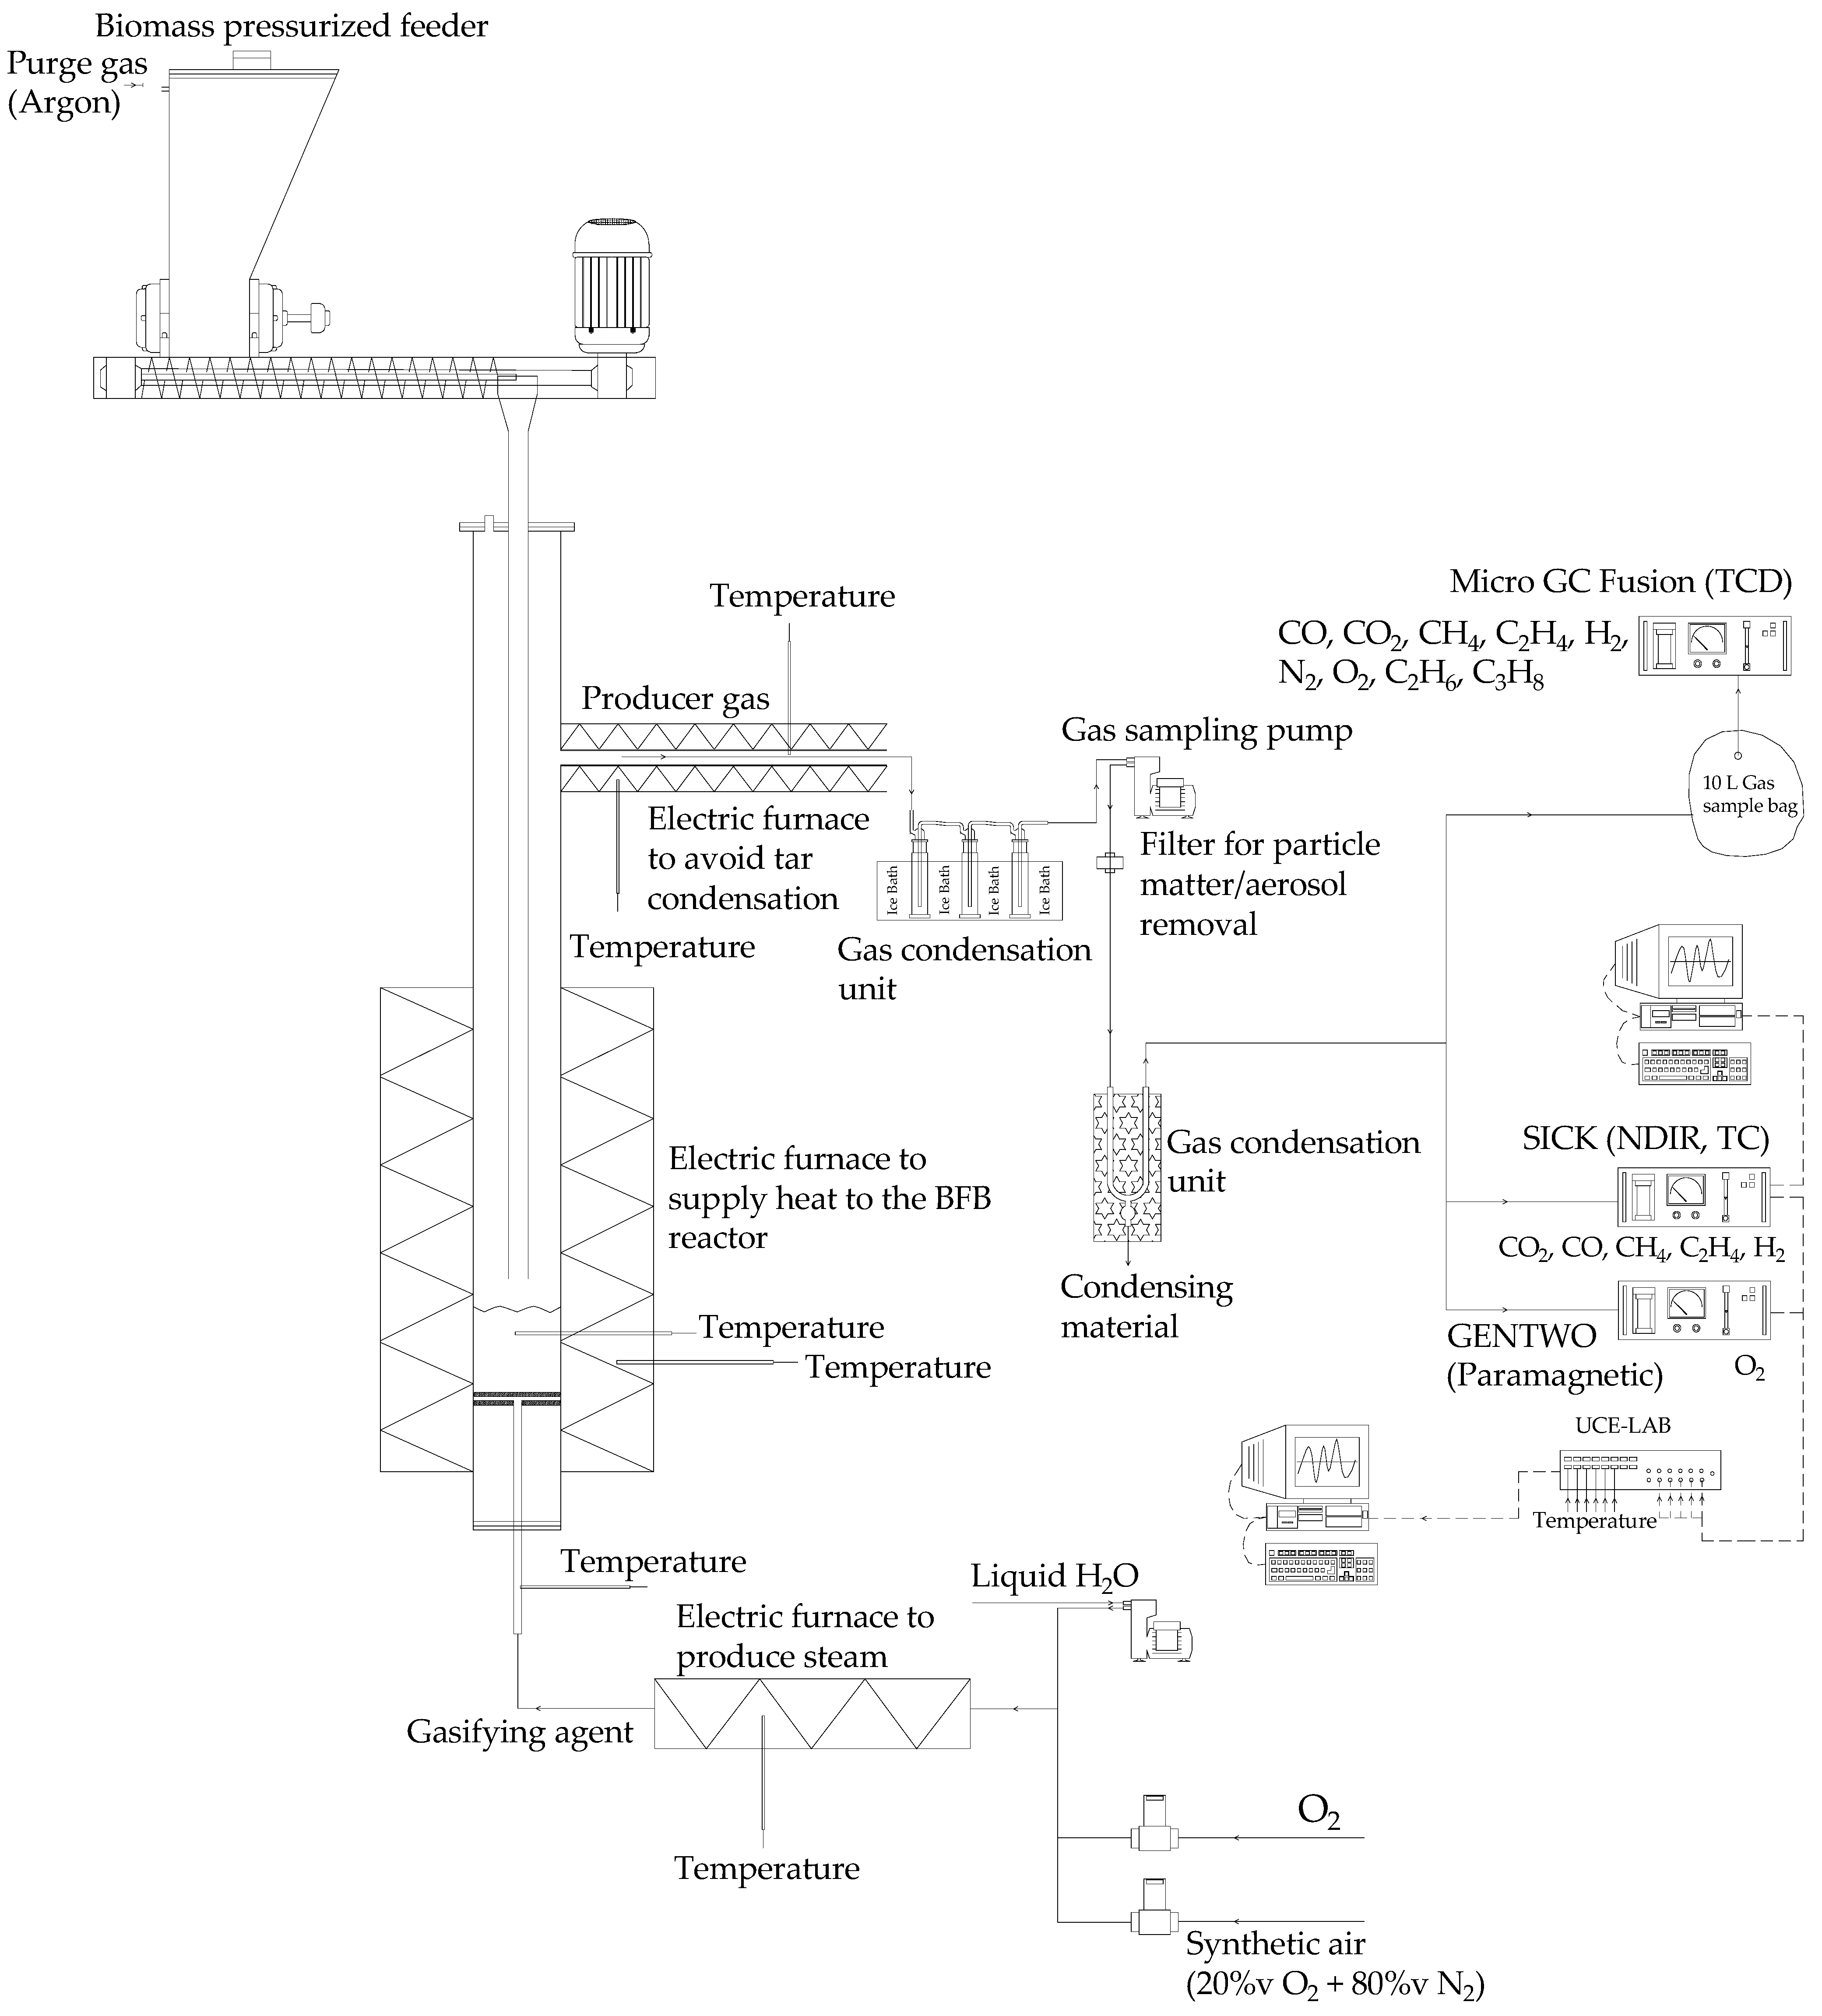
2.2. Experimental Infrastructure

The gasification experiments were carried out in a bench-scale bubbling fluidized bed (BFB) gasifier (3 kWth) (Figure 1), previously described in other works [19,22,38,39]. The experimental facility is composed of a refractory steel (Sandvik 253MA) reactor with an internal diameter of 49 mm and a 340 mm high reaction chamber. The heat was supplied to the system by means of a 4.2 kWe electric furnace, ensuring sufficient thermal energy to maintain the set bed temperature, measured by a k-type thermocouple placed in the bed and adjusted by a proportional–integral–derivative (PID) controller.
The bed material was quartz sand (150 g, particle size between 180–250 μm). The flow rate of dry synthetic air—20 %vol O2 in N2, hereinafter referred to as “air”—and O2 were adjusted with two mass-flow controllers—Bronkhorst, Prestige model—measuring in a range of 0 to 10 NL∙min−1 and 0 to 1 NL∙min−1, respectively. The steam flow rate was produced and controlled by pumping liquid water, with a high-performance liquid chromatography HPLC pump (Jasco, PV-980 model, 0–10 mL∙min−1) to an electrically heated chamber—plenum, operating at 320 °C and atmospheric pressure. The gasification/fluidization agent was injected into the reactor through the plenum, before passing through the distribution plate.
Apart from the reactive system, the experimental infrastructure includes a stainless-steel biomass feeding unit (AISI 316) composed of a storage silo, a screw feeder, and a vertical discharge tube. The closed and purged (Ar) silo has an agitation device to promote the downward movement of the fuel particles towards the screw feeder. The vertical discharge tube was responsible for transporting the fuel from the screw feeder to the bed surface.
The producer gas leaves the reactor through an electrically heated stainless-steel pipeline (>400 °C) to the exhaustion to prevent tar and water vapor condensation.

2.3. Gas Sampling and Analysis

A sample of raw producer gas from the heated exhaustion was cooled to a set of impingers immersed in liquid water in thermal equilibrium with ice—0 °C, 101,325 Pa—to remove condensable compounds (water and tar) at ambient conditions. Afterwards, the gas passed through a quartz filter (Outer diameter—47 mm) to remove particulate matter and aerosol. As a precautionary measure, the gas passed through a U-tube immersed in liquid water in thermal equilibrium with ice (0 °C, 101,325 Pa), placed after the quartz filter, to ensure the removal of all tar compounds and water.
The dry and clean gas was collected into a sampling bag (FlexFoil bag) and analyzed in a gas chromatography analyzer with a thermal conductivity detector (μGC-TCD), for the determination of CO, H2 CO2, CH4, C2H4, C2H6, C3H8, and N2 concentration. The μGC-TCD operated with a double column (module A and module B). Using Argon as a carrier gas, module A operated at 70 °C and 241,317 Pa, giving information regarding the concentration of H2, O2, N2, CH4, and CO. Module B used Helium as a carrier gas to determine the concentration of CO2 and light hydrocarbons (C2H4, C2H6, and C3H8) at 50 °C and 206,843 Pa.

2.4. Experimental Procedure and Data Analysis

The main operating conditions of the gasification experiments carried out in this work are described in Table 3. The equivalence ratio (ER) is the ratio between the amount of O2 supplied to the system and the stoichiometric O2 required for the complete combustion of the biomass. The stoichiometric needs were calculated based on the ultimate analysis of the fuel and moisture content (Table 2). The ER was 0.25, falling within the optimal operating range often referred to in the literature [40,41], and the reactor was operated at 800 °C (atmospheric pressure), both attaining an appropriate balance between producer gas quality, process stability, and efficiency parameters, as suggested in previous works for bubbling fluidized bed systems [19,38,41].
The steam-to-biomass mass ratio (SBR) is given by dividing the steam mass flow added to the gasifier by the air-dried biomass mass flow fed to the gasifier. The SBR varied between 0.0 and 0.6 kgsteam∙kg−1biomass, ranging within the values referred to in the literature [9,30,31,32]. The φ is defined as the O2 concentration in the dry gasification agent (GA). The φ varied between 20 %vol.O2,dry GA (air), and 40 %vol.O2,dry GA, falling within the range found in the literature [15,33,34,35].
Experiment #1 is the reference condition (air gasification, without any added steam or oxygen, see Table 3). On the one hand, experiments #2 to #4 refer to the steam addition, having the Gv,liquid H2O increased to meet the SBR increment. On the other hand, experiments #5 to #7 refer to the O2 addition. In those experiments, the air flow rate suffered a decrease, whereas the O2 flow rate increased to comply with the increment of φ (see Table 3). In addition, the biomass flow rate in those experiments also increased to ensure the same ER in all experiments (ER = 0.25).
Prior to each experiment (see Table 3), the system was completely cleaned, and a new batch of sand was loaded into the bed. The impact of SBR and φ was analyzed after the system reached steady-state conditions, in terms of temperature and gas composition, with the latter monitored in real time using an online analyzer—SICK, Figure 1. Once the system reached steady-state conditions, three sampling bags were used to collect the dry and clean producer gas for 45 min (15 min per bag), which were thereafter analyzed in the μGC-TCD (see Section 2.3).
The influence of steam or O2 addition during air gasification of RFB from eucalyptus was assessed based on the producer gas composition, LHVG, and three efficiency parameters determined based on the experimental data: specific dry gas production (Ygas), cold gas efficiency (CGE) and carbon conversion efficiency (CCE). The LHVG was determined considering the concentration of the combustible species measured the producer gas and their respective LHV (at standard conditions, 273.15 K and 101,325 Pa) [42]. Ygas was calculated using Equation (3), giving the ratio between the volumetric flow rate of dry and clean producer gas and the mass flow rate of dry biomass [43]. The dry gas volumetric flow rate was determined based on a nitrogen mass balance. CGE was the ratio between the chemical energy in the producer gas and the chemical energy in the biomass fed to the process (Equation (4)) [43]. The CCE is the ratio between the carbon present in the gaseous compounds measured the producer gas and the carbon present in the feedstock fed (Equation (5)) [43]. Moreover, the H2:CO and CO:CO2 molar ratios were also determined and analyzed. The H2:CO molar ratio is a relevant parameter concerning the producer gas application for biofuels and chemicals synthesis [43] and CO:CO2 molar ratio is an indicator of the process efficiency, analyzing the rate of the gasification/combustion reactions [44].
Y gas = G v , gas G m , dry   biomass
CGE = Y gas × LHV G LHV B
CCE = Y gas × P N R × T N × M C × ε C , i × y i w CB

3. Results and Discussion

Table 4 shows the main results of this work, concerning the producer gas composition, yield of the gaseous compounds in the producer gas (excluding N2), LHVG, Ygas, CGE, CCE, and H2:CO, H2:CO2, and CO:CO2 molar ratios. The following sections present the analysis of the results obtained regarding the influence of steam and O2 addition during air gasification of residual forest biomass from eucalyptus on the parameters previously described in Section 2.4.

3.1. Effect of Steam Addition during Air Gasification of Biomass

This section presents the analysis of the results obtained regarding the influence of steam injection during the air gasification of RFB from eucalyptus on producer gas quality.

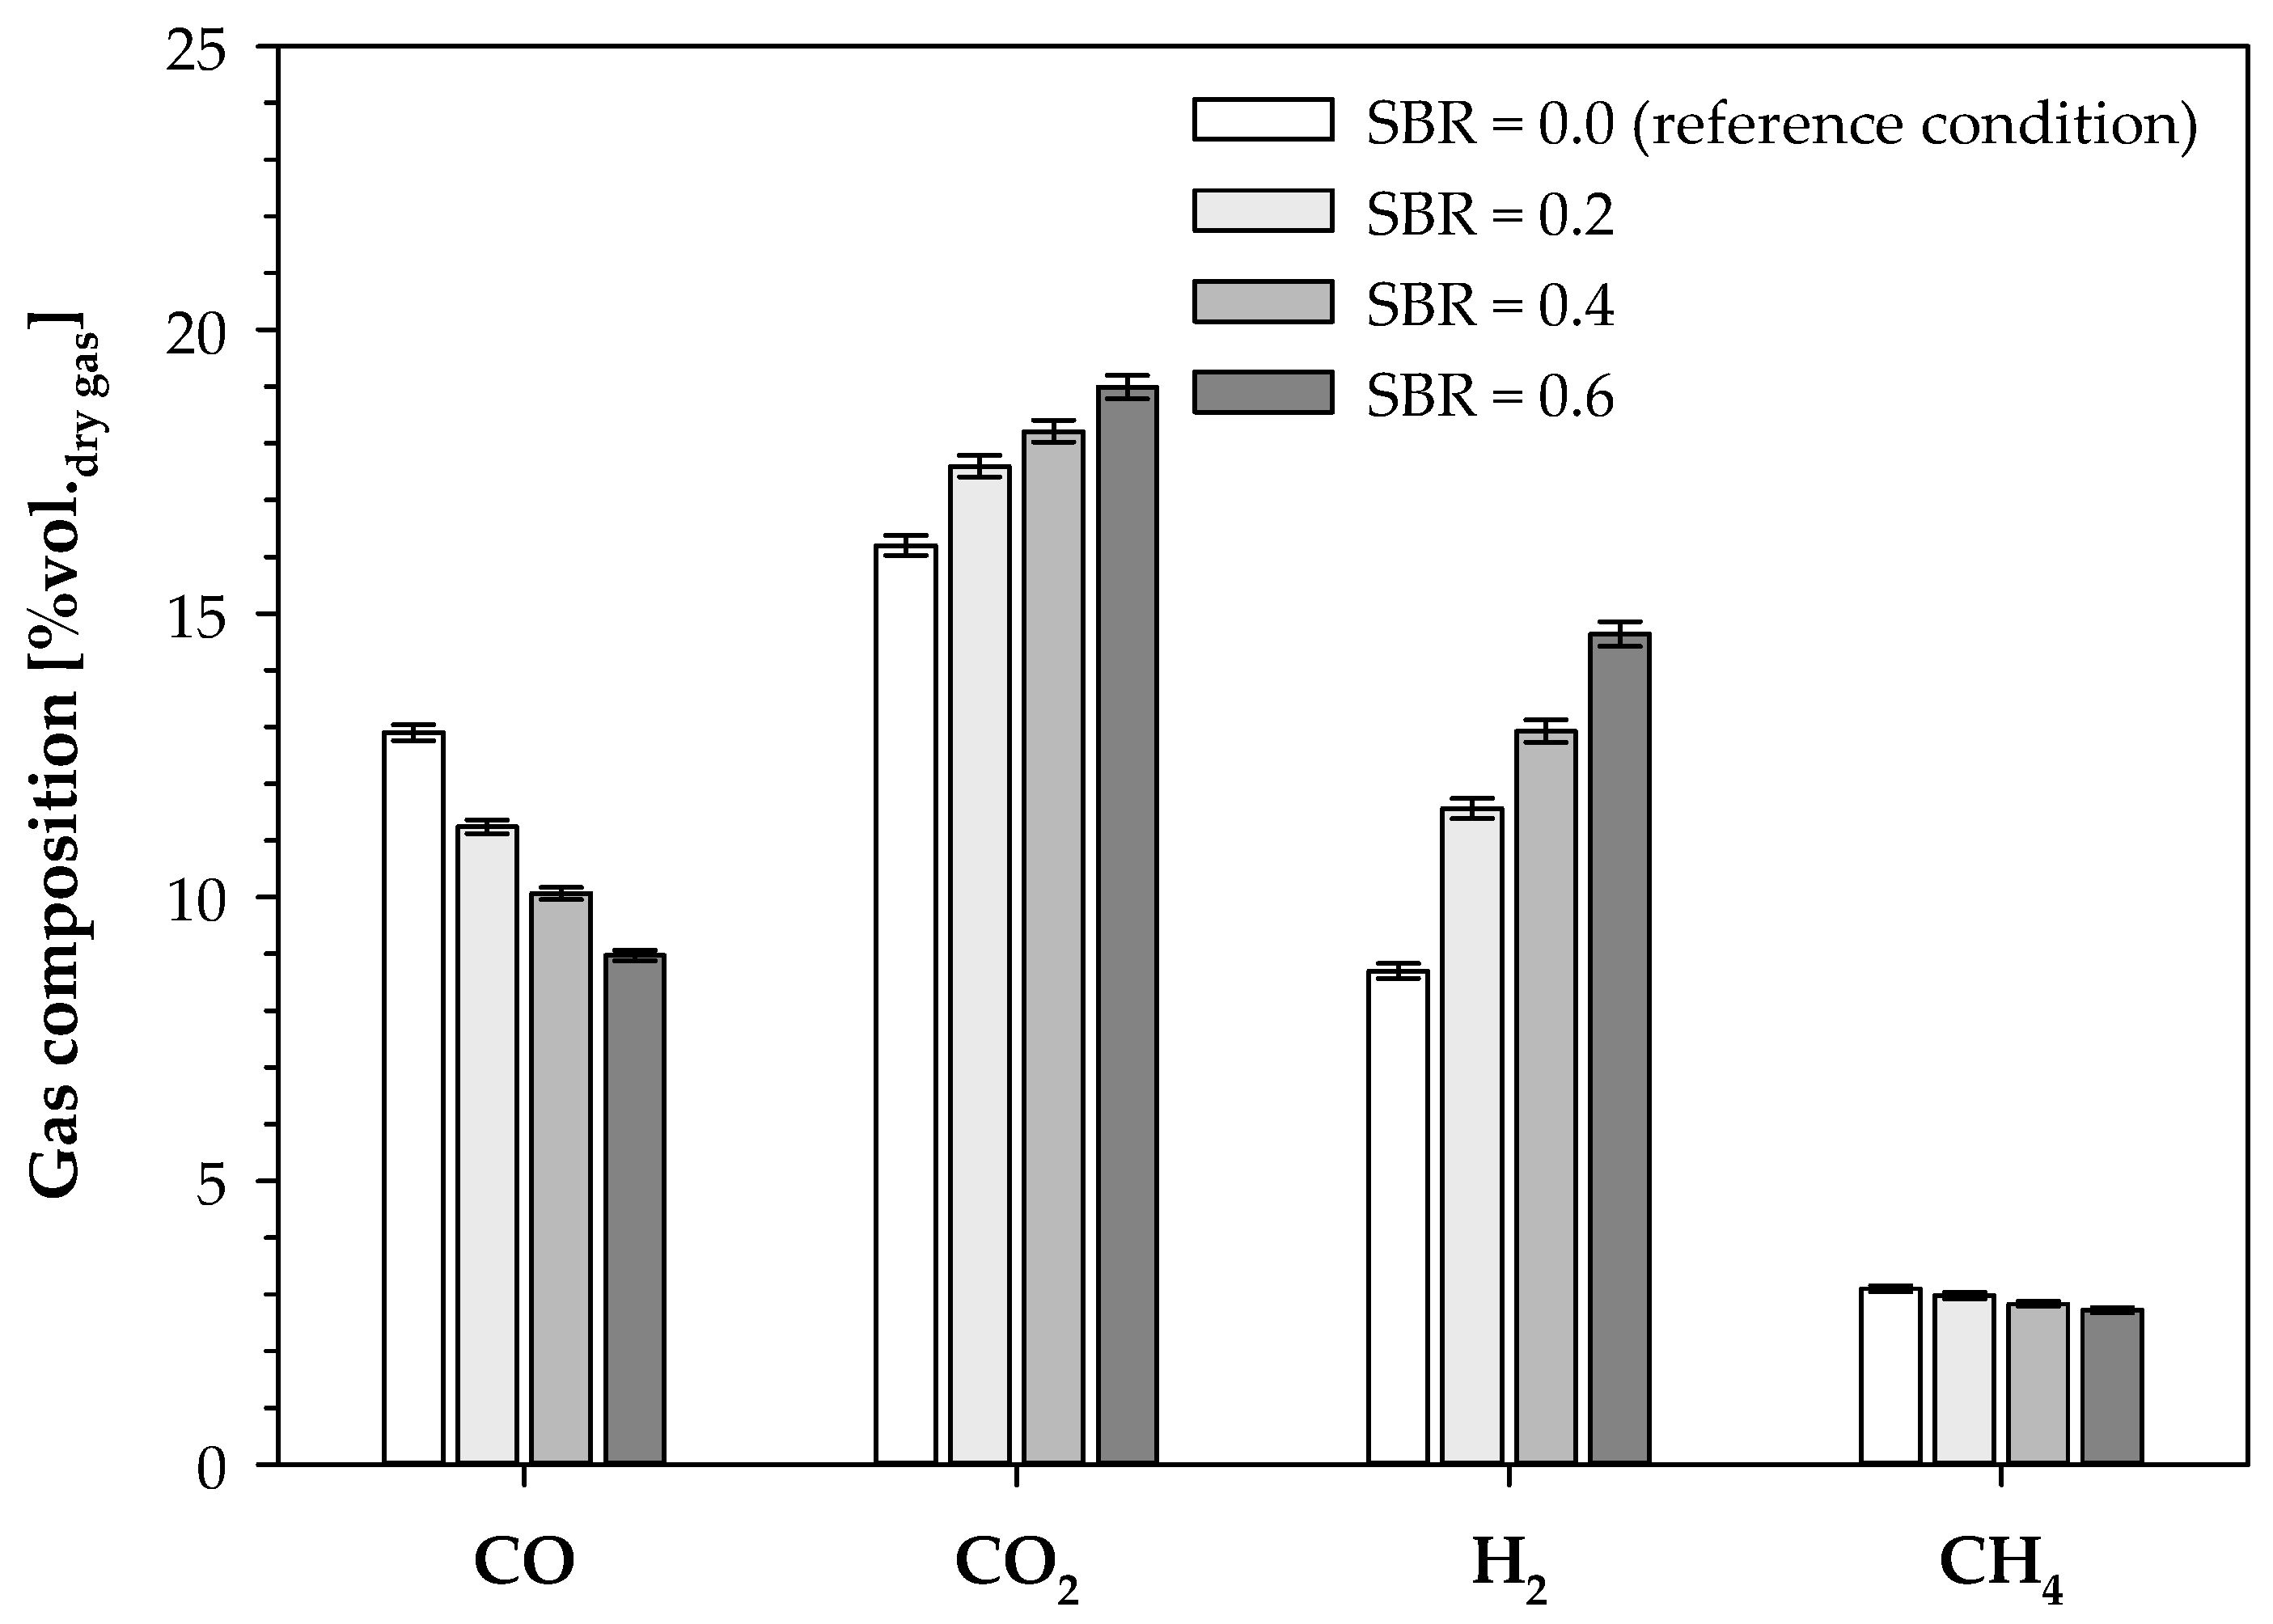
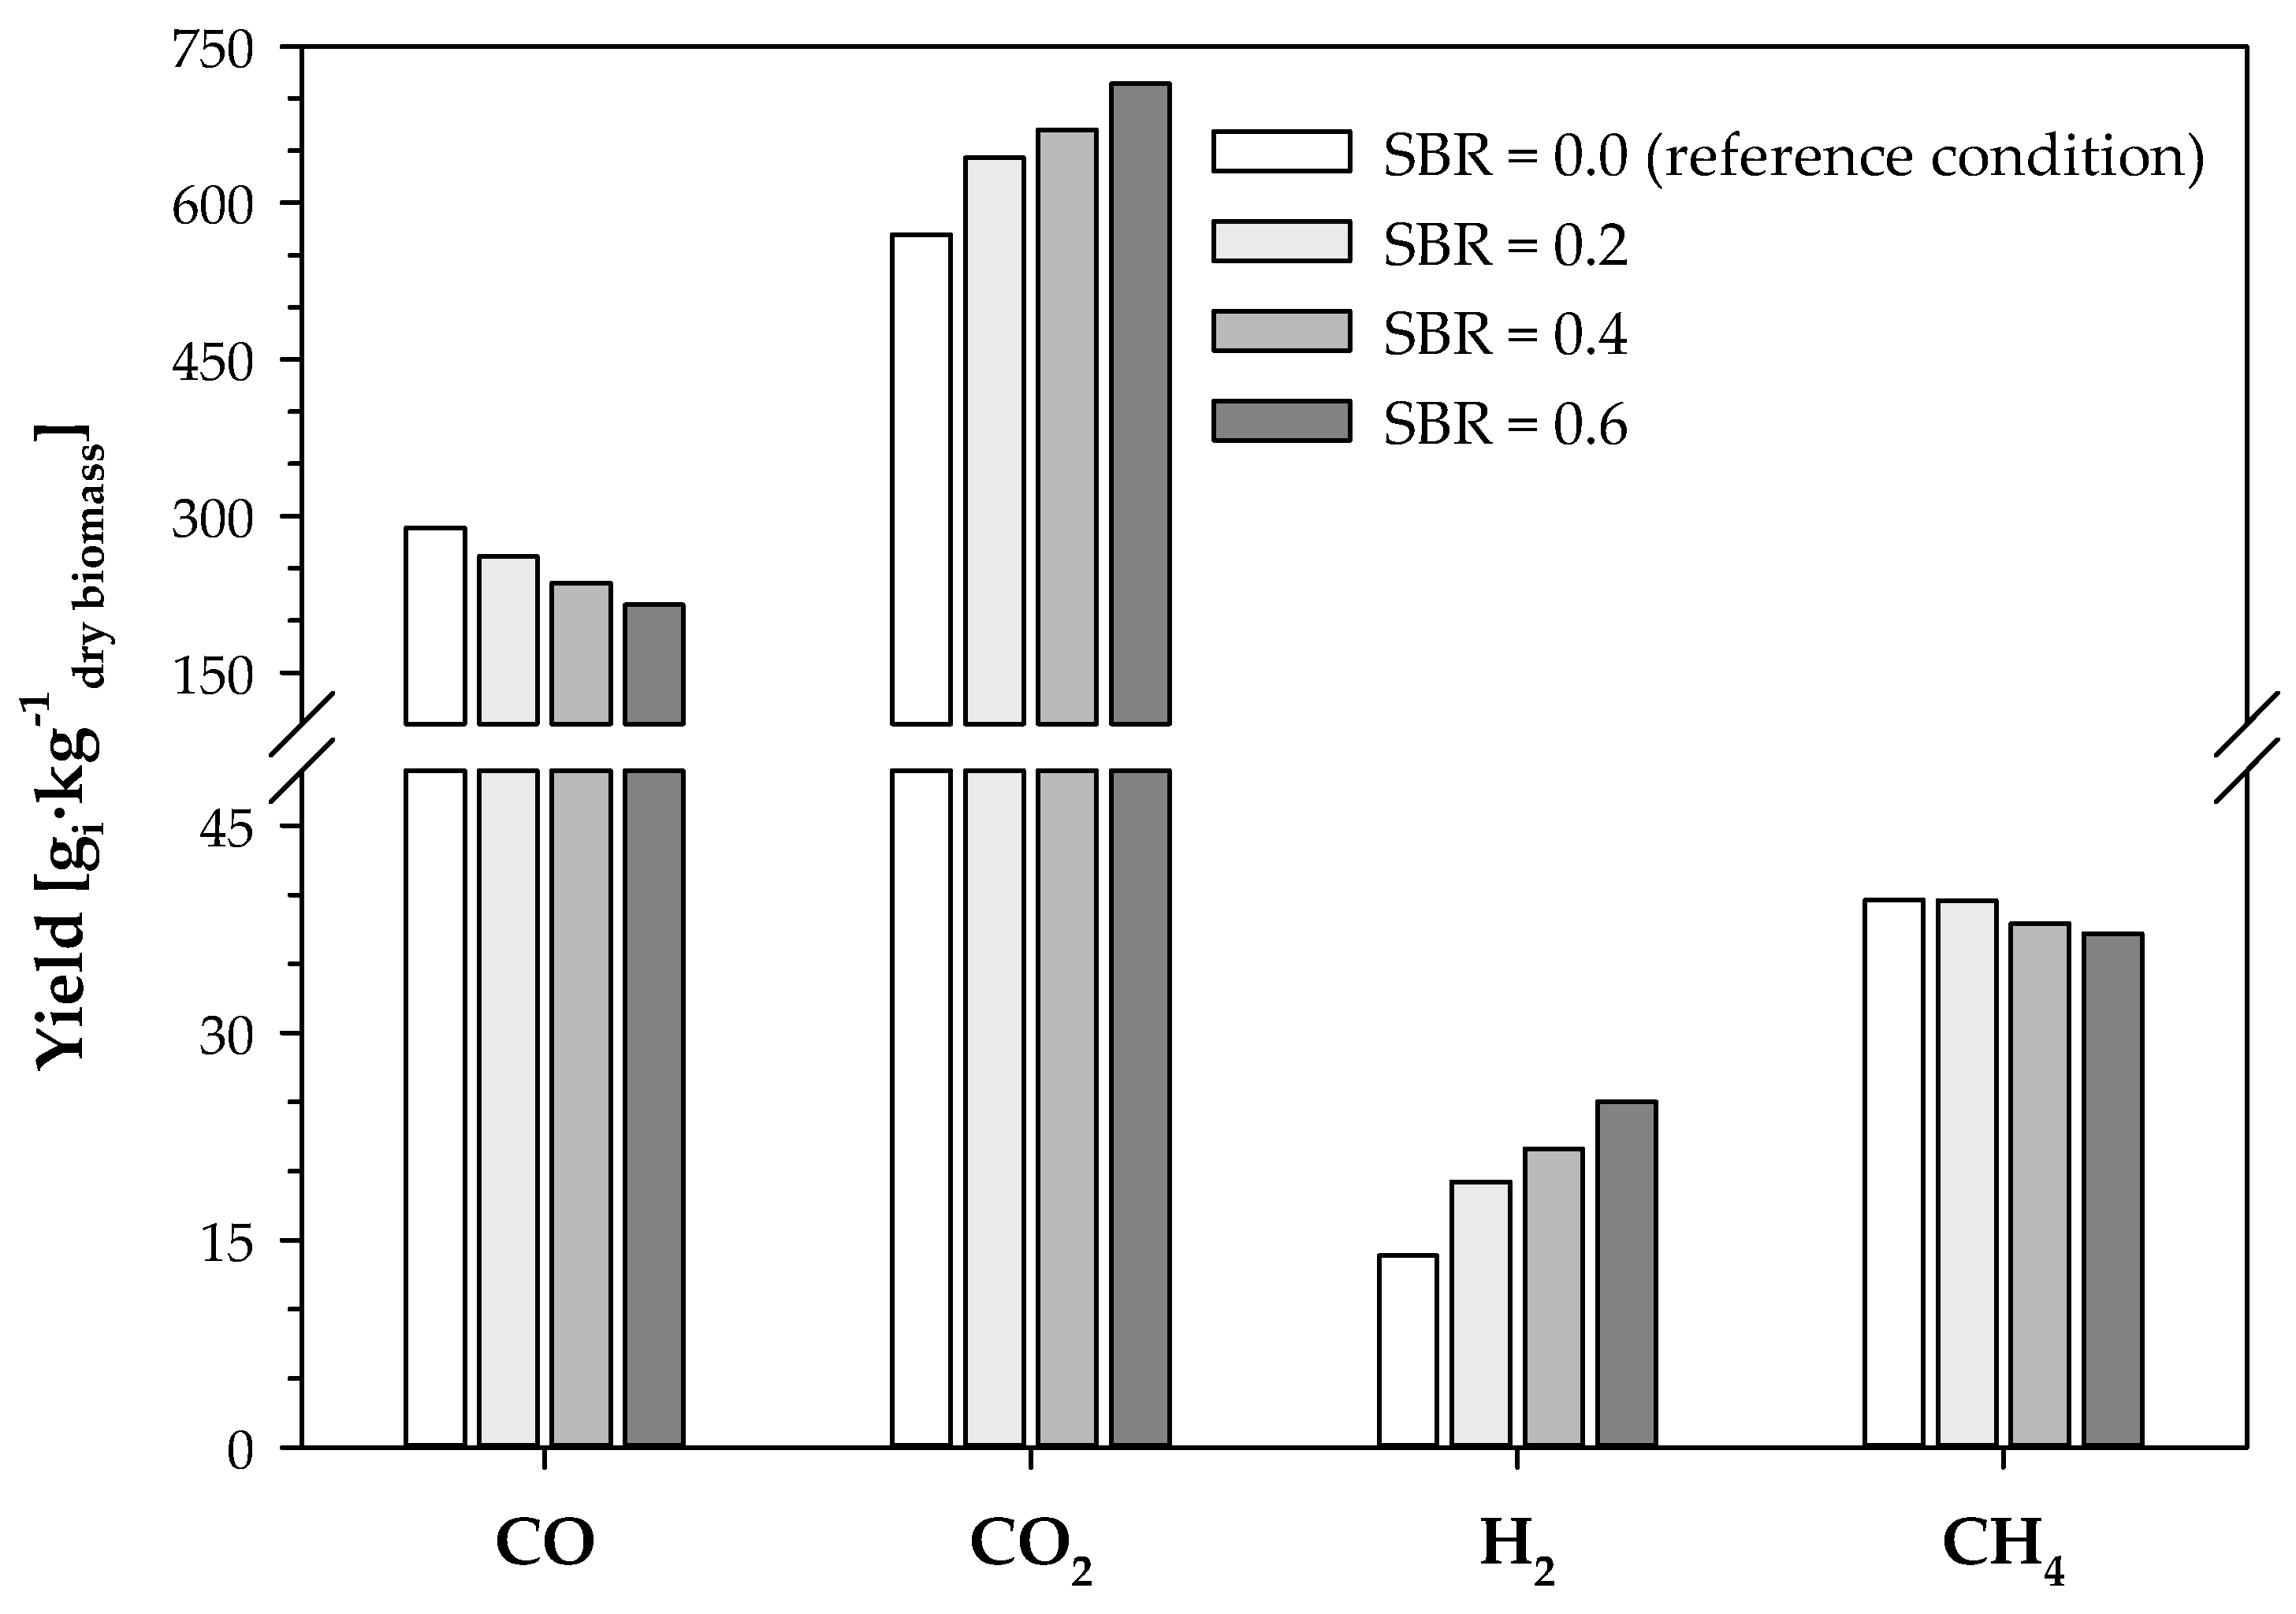
3.1.1. Producer Gas Composition

Figure 2 shows the influence of SBR on the producer gas composition (CO, CO2, H2, and CH4 concentration), during the air gasification of RFB from eucalyptus. The concentration of CO decreased from 12.9 %vol.dry gas, when no steam was injected (SBR = 0.0, reference condition), to 9.0 %vol.dry gas, when the SBR was 0.6 kgsteam∙kg−1biomass. The CO2 concentration followed an opposite trend to the one observed for CO concentration, increasing from 16.2 %vol.dry gas, when no steam was injected, to 19.0 %vol.dry gas, with an addition of 0.6 kgsteam∙kg−1biomass. Analogous to CO2 concentration, H2 concentration ranged between 8.7 and 14.6 %vol.dry gas, with the highest value found for an SBR of 0.6 kgsteam∙kg−1biomass. The CH4 concentration decreased with the increment of SBR, with the lowest concentration value (2.72 %vol.dry gas) observed for an SBR of 0.6 kgsteam∙kg−1biomass. Light hydrocarbons (C2H4, C2H6, and C3H8) concentration did not follow a clear trend with the increase in steam in the process (Table 4); the concentration of these compounds was not presented in Figure 2 due to their vestigial presence.
The presence of steam had a major impact on producer gas composition, with H2 and CO2 concentrations increasing with the increment of SBR, whilst the CO and CH4 concentrations decreased. The injection of 0.6 kgsteam∙kg−1biomass led to an increase in the H2 and CO2 concentrations of, approximately, 68% and 17%, respectively, when compared to the reference condition. In contrast, CO and CH4 concentrations decreased, by approximately, 30 and 12%, for the same conditions. For the maximum SBR tested, the H2 concentration in the producer gas was 14.6 %vol.dry gas, decidedly higher than the one found in the literature for air biomass gasification (~8 %vol.dry gas—see Section 1). Campoy et al. [9] and Tian et al. [30], in their studies of biomass gasification using mixtures of air and steam, also observed an increase in H2 and CO2 concentrations and a decrease in the CO and CH4 concentrations, with the increment of SBR. The results obtained in this work are indicative of a possible increased relevance of the water gas-shift reaction (R9), favoring the formation of H2 and CO2, whilst consuming CO. The decrement in the CH4 concentration with the SBR increase suggests a higher occurrence of methane-steam reforming reactions (R10) and (R11). Moreover, the H2:CO2 molar ratio increased from 0.54 to 0.77 molH2∙mol−1CO2 when the SBR increased from 0.0 to 0.6 kgsteam∙kg−1biomass (Table 4). This result indicates a possible higher occurrence of dry (CO2) reactions (R13) and (R14) with the increment of steam addition, favoring the consumption of CO2, whilst producing H2, having the latter a higher relative increase in comparison with CO2 concentration increase.
Figure 3 presents the effect of SBR addition during the air gasification of RFB from eucalyptus on the CO, CO2, H2, and CH4 yield. The CO yield varied between 215 and 289 gCO∙kg−1dry biomass, with the lowest value found for an SBR of 0.6 kgsteam∙kg−1biomass. The CO2 yield increased with the increment of steam addition in the system, ranging from 570 to 714 gCO2∙kg−1dry biomass, with the highest value observed for an SBR of 0.6 kgsteam∙kg−1biomass. Steam addition had a positive effect on the H2 yield, increasing from 14 to 25 gH2∙kg−1dry biomass, when the SBR increased from 0.0 to 0.6 kgsteam∙kg−1biomass. The CH4 yield suffered a minor decrease with the increment of steam addition, from 40 to 37 gCH4∙kg−1dry biomass.
The addition of 0.6 kgsteam∙kg−1biomass led to an increase of, approximately, 80% and 25%, in the H2 and CO2 yield, respectively, whereas the CO and CH4 yield decreased, by approximately, 26% and 6%, respectively, when compared to the reference condition (Figure 3). These results are in agreement with those obtained in Campoy et al. [9], where the H2 and CO2 yield increased with the increment in SBR, whilst the CO and CH4 yield decreased for the same conditions. As stated about the gas species concentration behavior (Figure 2), these gas species yields are indicative of a higher occurrence of the water–gas shift reaction (R9) and reforming reactions (R10)–(R14), privileging H2 formation.

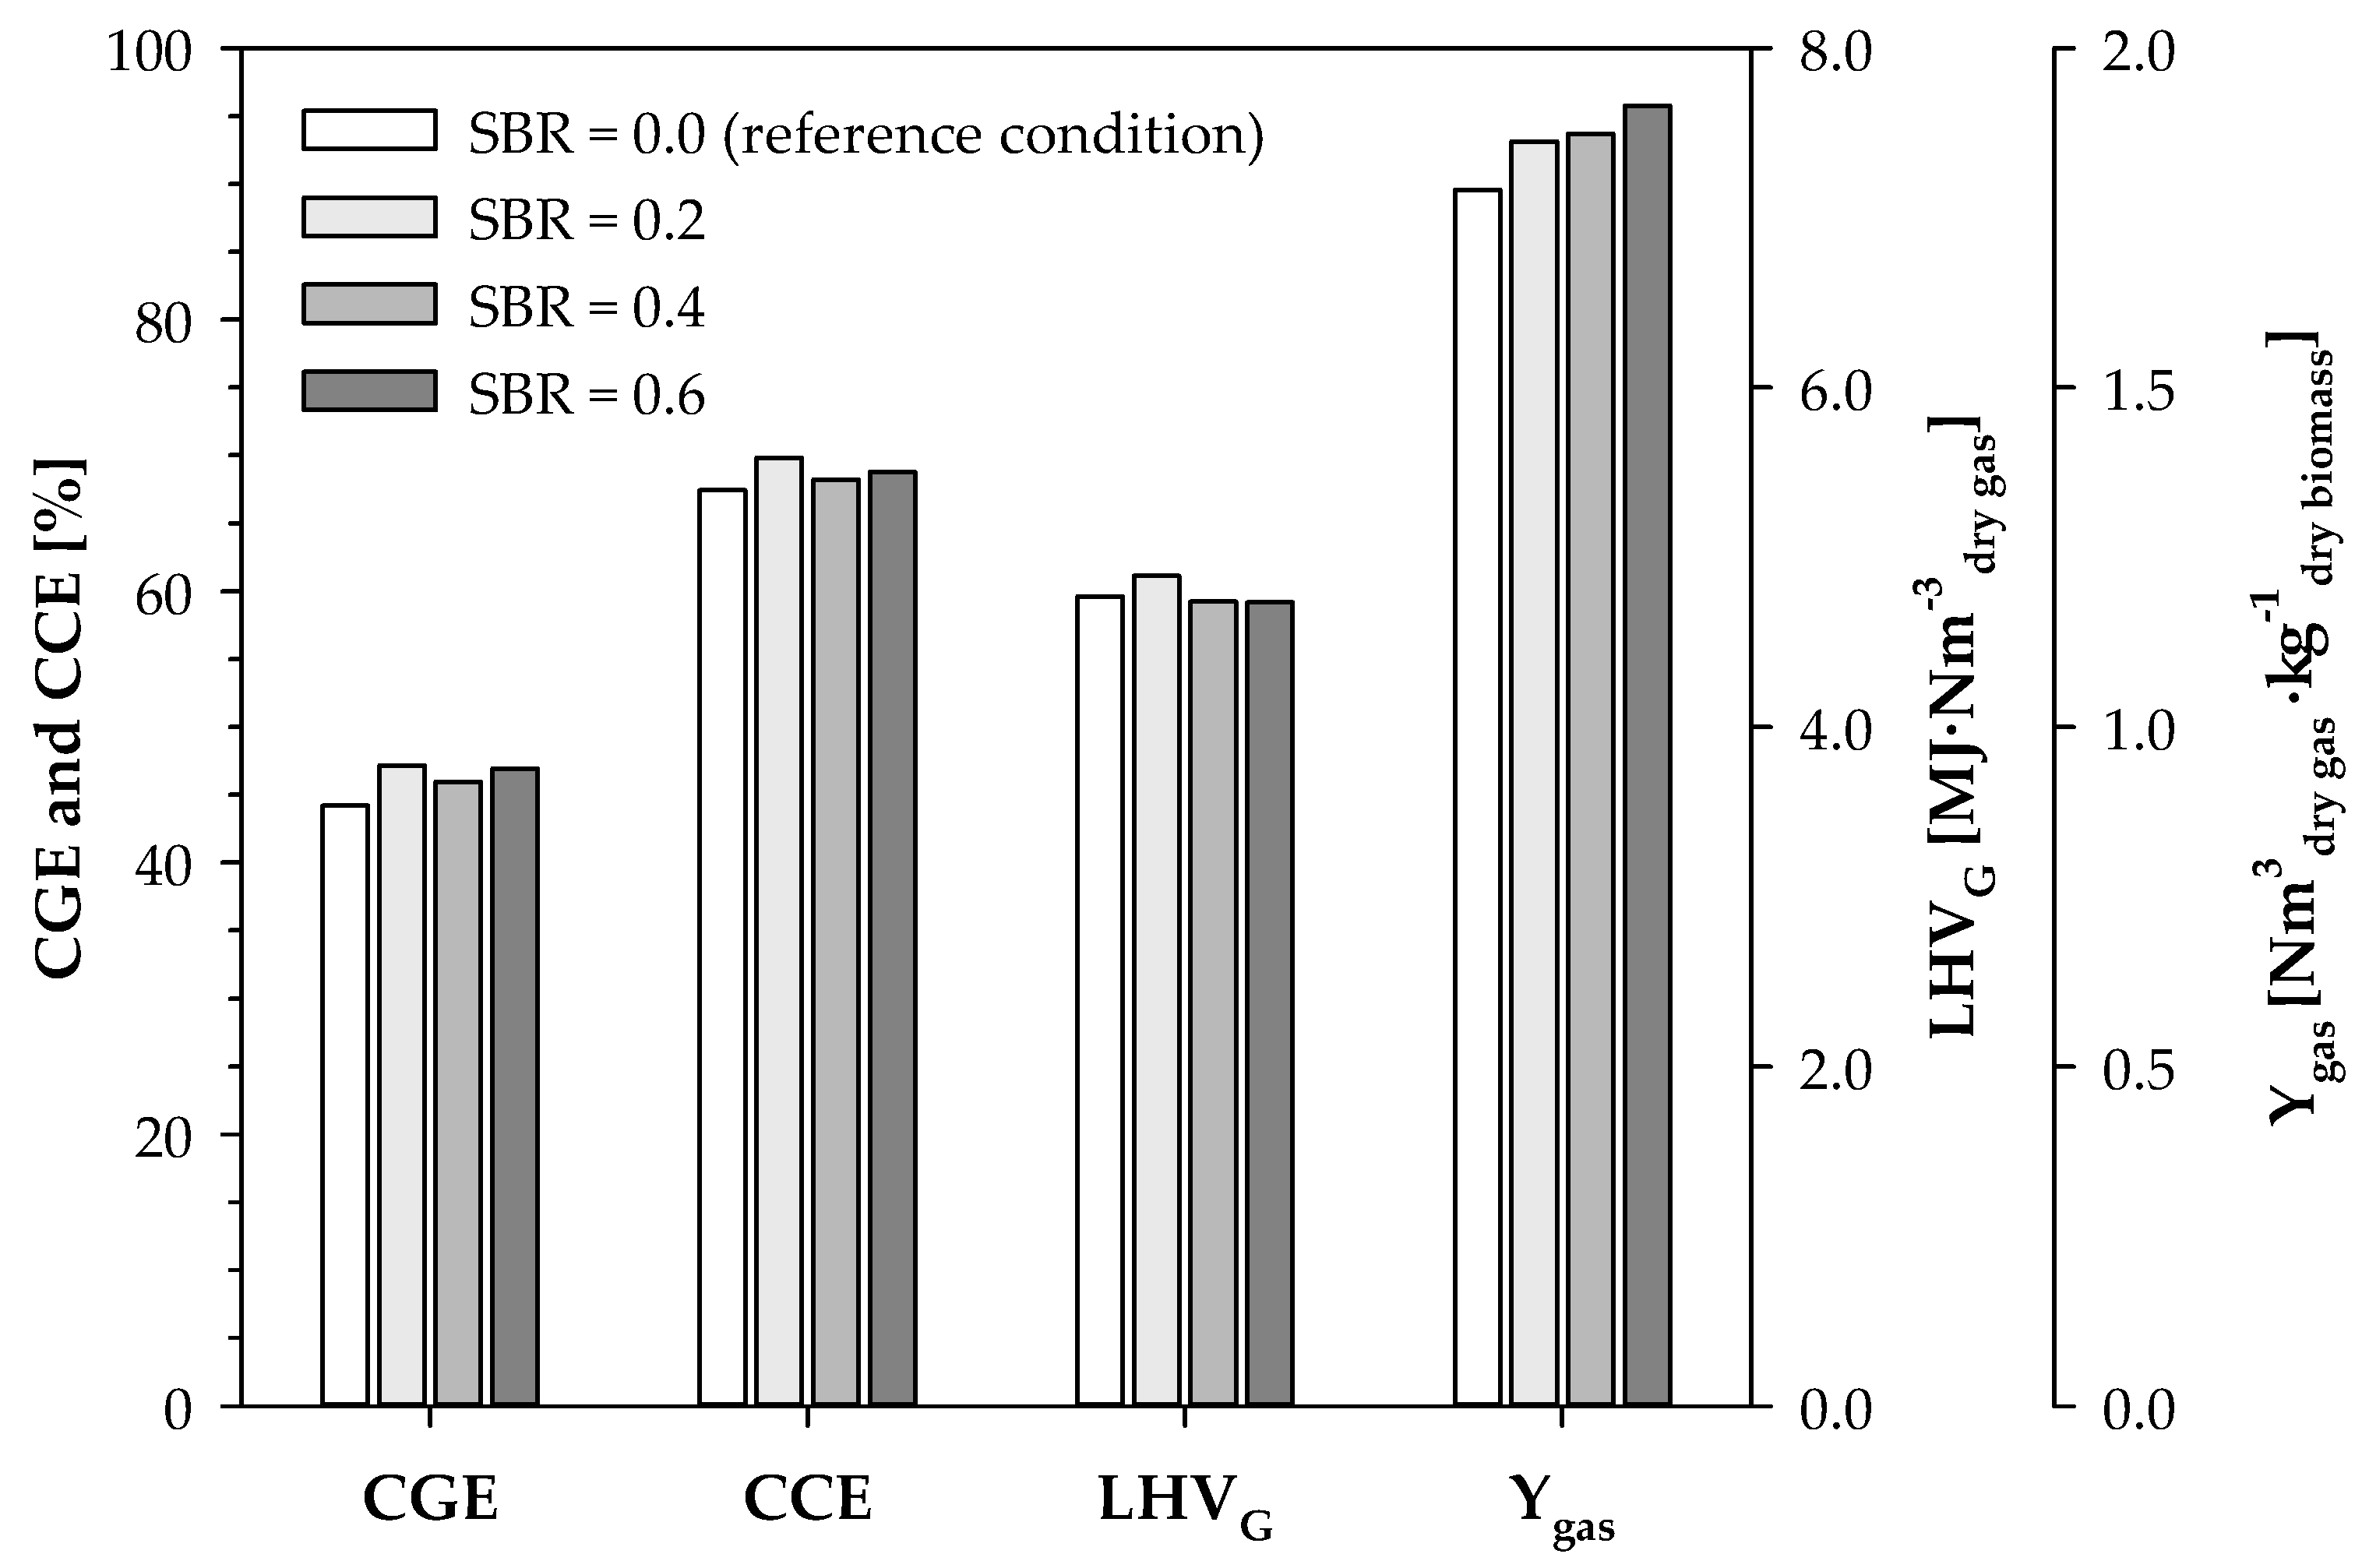
3.1.2. LHVG and Efficiency Parameters

Figure 4 shows the influence of SBR increment on the LHVG and efficiency parameters during air gasification of RFB from eucalyptus. LHVG fell between 4.7 and 4.9 MJ∙Nm−3dry gas, whilst the CGE and CCE ranged from 44% and 67% to 47% and 70%, respectively. The Ygas underwent an increase with the increment in SBR, from 1.79 to 1.92 Nm3dry gas∙kg−1dry biomass.
The SBR increase had no evident impact on the LHVG, following the trend presented in Campoy et al. [9]. This can be justified by a trade-off between the increment in the H2 concentration and the decrease in the CO concentration, both combustible species with a major impact on the LHVG, followed by the increment of CO2 concentration, resulting in almost no change in the LHVG.
Similarly to that observed in Campoy et al. [9], even though steam addition had a clear impact on the yield of the different gas species (mainly H2, CO, and CO2Figure 3), the CCE had only a minor increase, meaning that the increment of SBR did not clearly promote heterogenous reactions nor enhanced the char conversion to gaseous species. This may be explained by the fact that steam is less reactive with char than O2 (in the air) [14]. Therefore, since the ER was kept constant and the biomass mass flow rate did not change, the amount of O2 (in the air) was the same throughout the experiments, possibly overcoming the steam potential for heterogenous reactions, and leaving, perhaps, the steam to be mainly involved in gas-phase reactions.
Moreover, although the increment of SBR had a minor impact on the CGE and CCE, the presence of steam slightly improved the CGE and the CCE, when compared to the reference condition (air gasification). The CGE and CCE are highly dependent on the Ygas (Equations (4) and (5)), and this parameter increased with the presence of steam, probably caused by a higher occurrence of reforming reactions (R10)–(R14), thus increasing the overall gas yield. As a result, an increase in the Ygas might have a positive effect on the CGE and CCE.

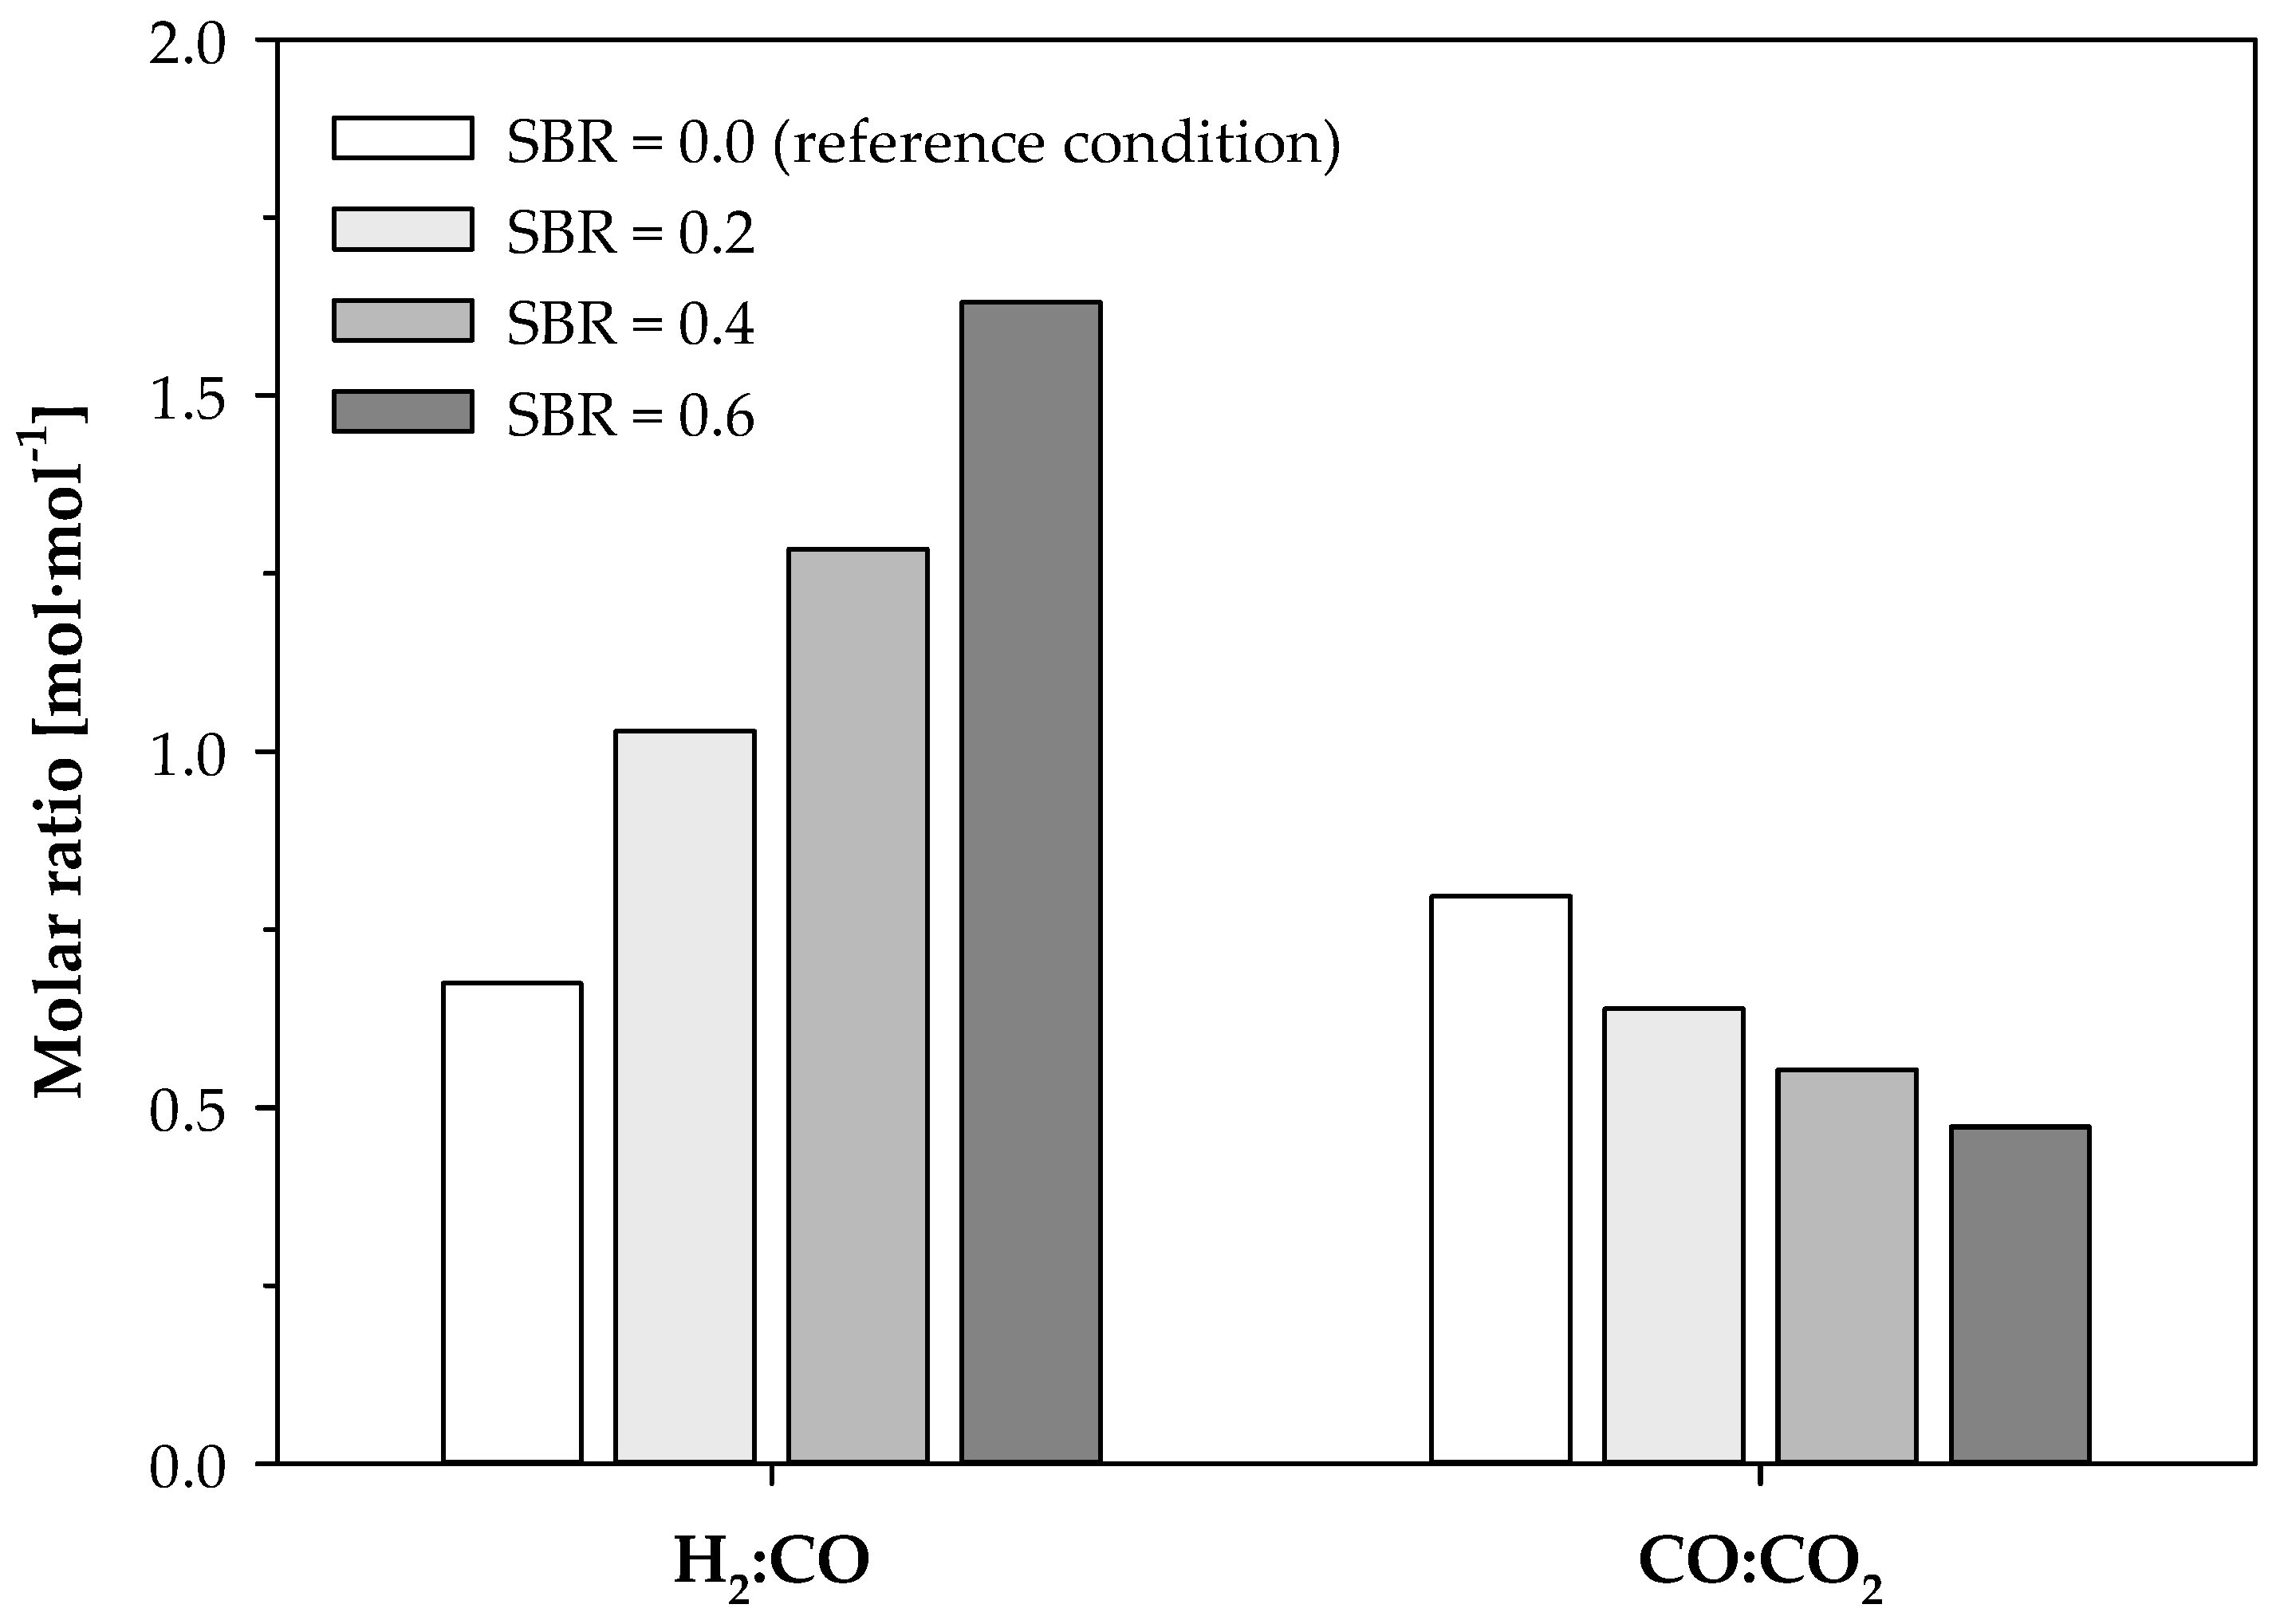
3.1.3. H2:CO and CO:CO2 Molar Ratios

Figure 5 presents the impact of SBR increase, during air gasification of RFB from eucalyptus, on H2:CO and CO:CO2 molar ratios. The H2:CO molar ratio varied between 0.67 and 1.63 molH2∙mol−1CO, with the highest value found for SBR equal to 0.6 kgsteam∙kg−1biomass. Contrariwise, the CO:CO2 decreased with the increment of SBR, ranging from 0.47 to 0.80 molCO∙mol−1CO2.
The addition of 0.6 kgsteam∙kg−1biomass led to an increase of, approximately, 142% in the H2:CO molar ratio, and a decrease of, approximately, 41% in the CO:CO2 molar ratio, when compared to the reference condition, following the trend observed in Campoy et al. [9]. The increment in the H2:CO molar ratio with the SBR increase was probably caused by the increasing relevance of reforming reactions ((R10)–(R14)), favoring the production of H2, and the enhancement of water gas-shift reaction (R9), consuming CO whilst producing H2. The decrease in CO:CO2 molar ratio can be justified by the increased relevance of the water gas-shift reaction (R9).
With 0.6 kgsteam∙kg−1biomass, a producer gas with a H2:CO molar ratio of 1.63 molH2∙mol−1CO was generated, remarkedly higher than the H2:CO molar ratio range for air biomass gasification (between 0.6 and 0.8 molH2∙mol−1COSection 1), fulfilling the established limits of H2:CO molar ratio for several advanced applications, including [7,20,21]:
  • Production of liquid fuels through Fischer-Tropsch synthesis (0.6 or 2.0 molH2∙mol−1CO, depending on the applied catalyst);
  • DME synthesis (1 molH2∙mol−1CO);
  • Bioethanol synthesis (between 1 and 2 molH2∙mol−1CO).

3.2. Effect of O2 Addition during Air Gasification of Biomass

This section describes the results obtained regarding the influence of O2 addition during air gasification of RFB from eucalyptus on producer gas quality.

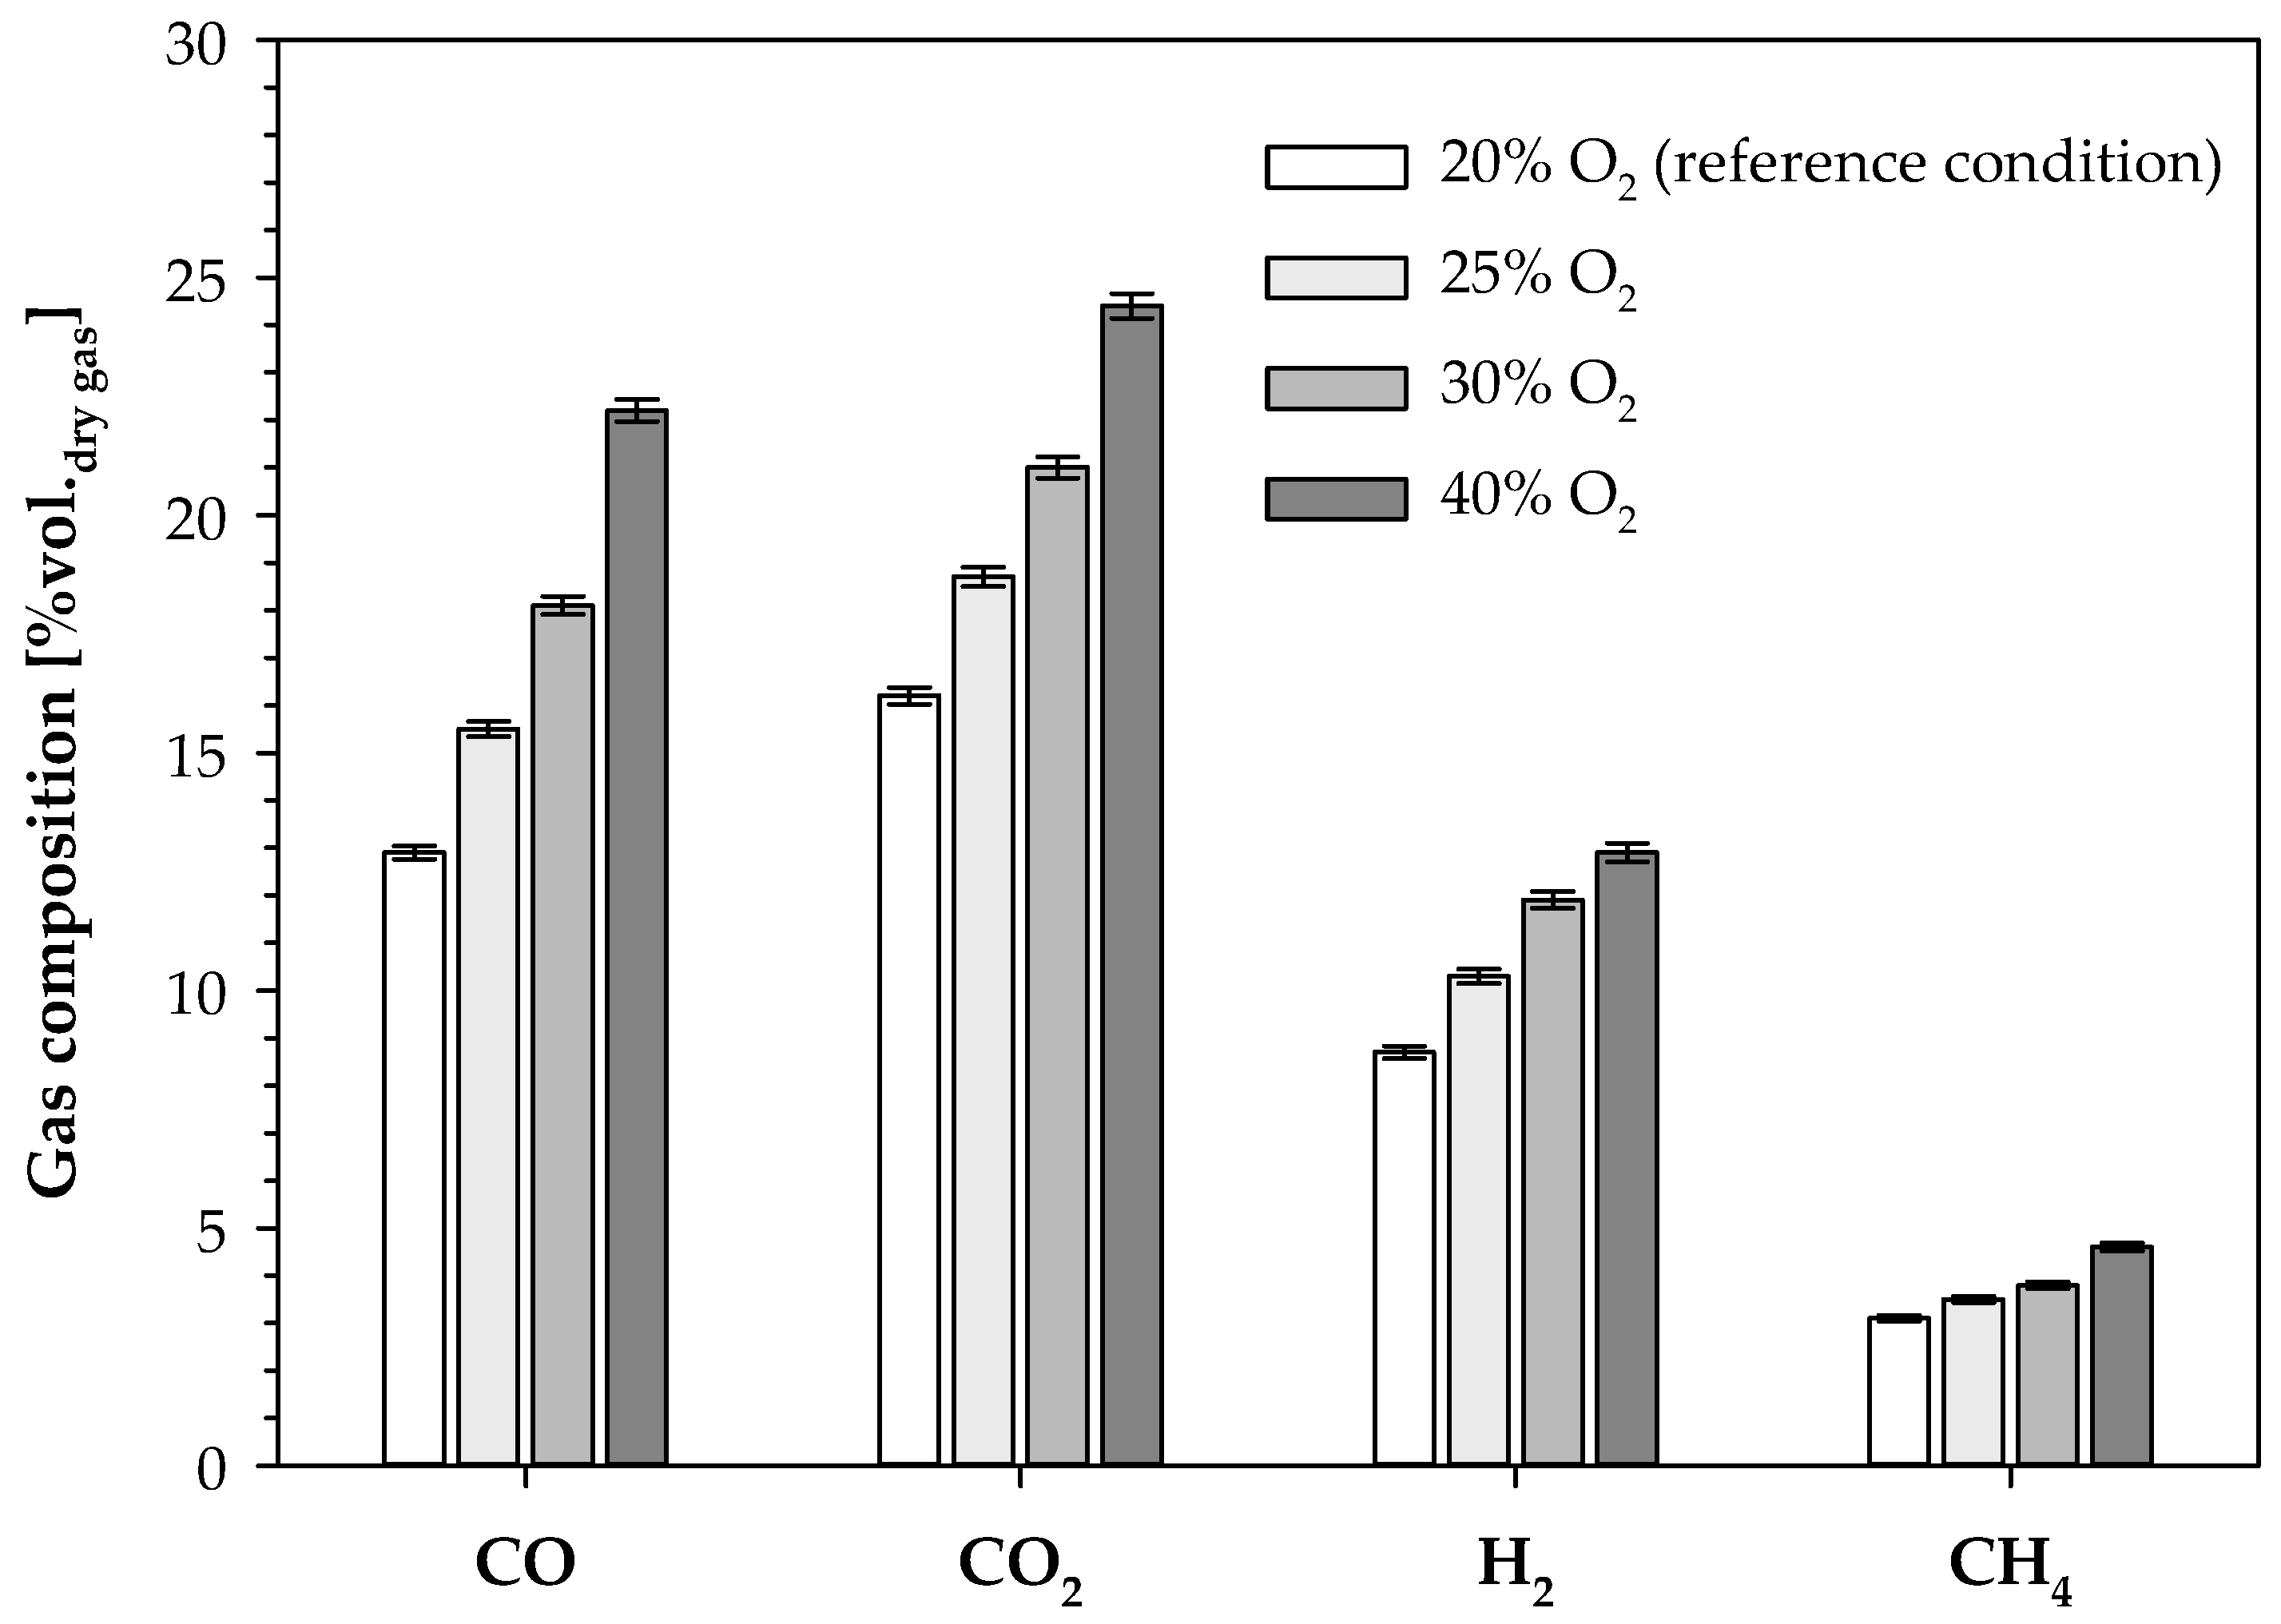
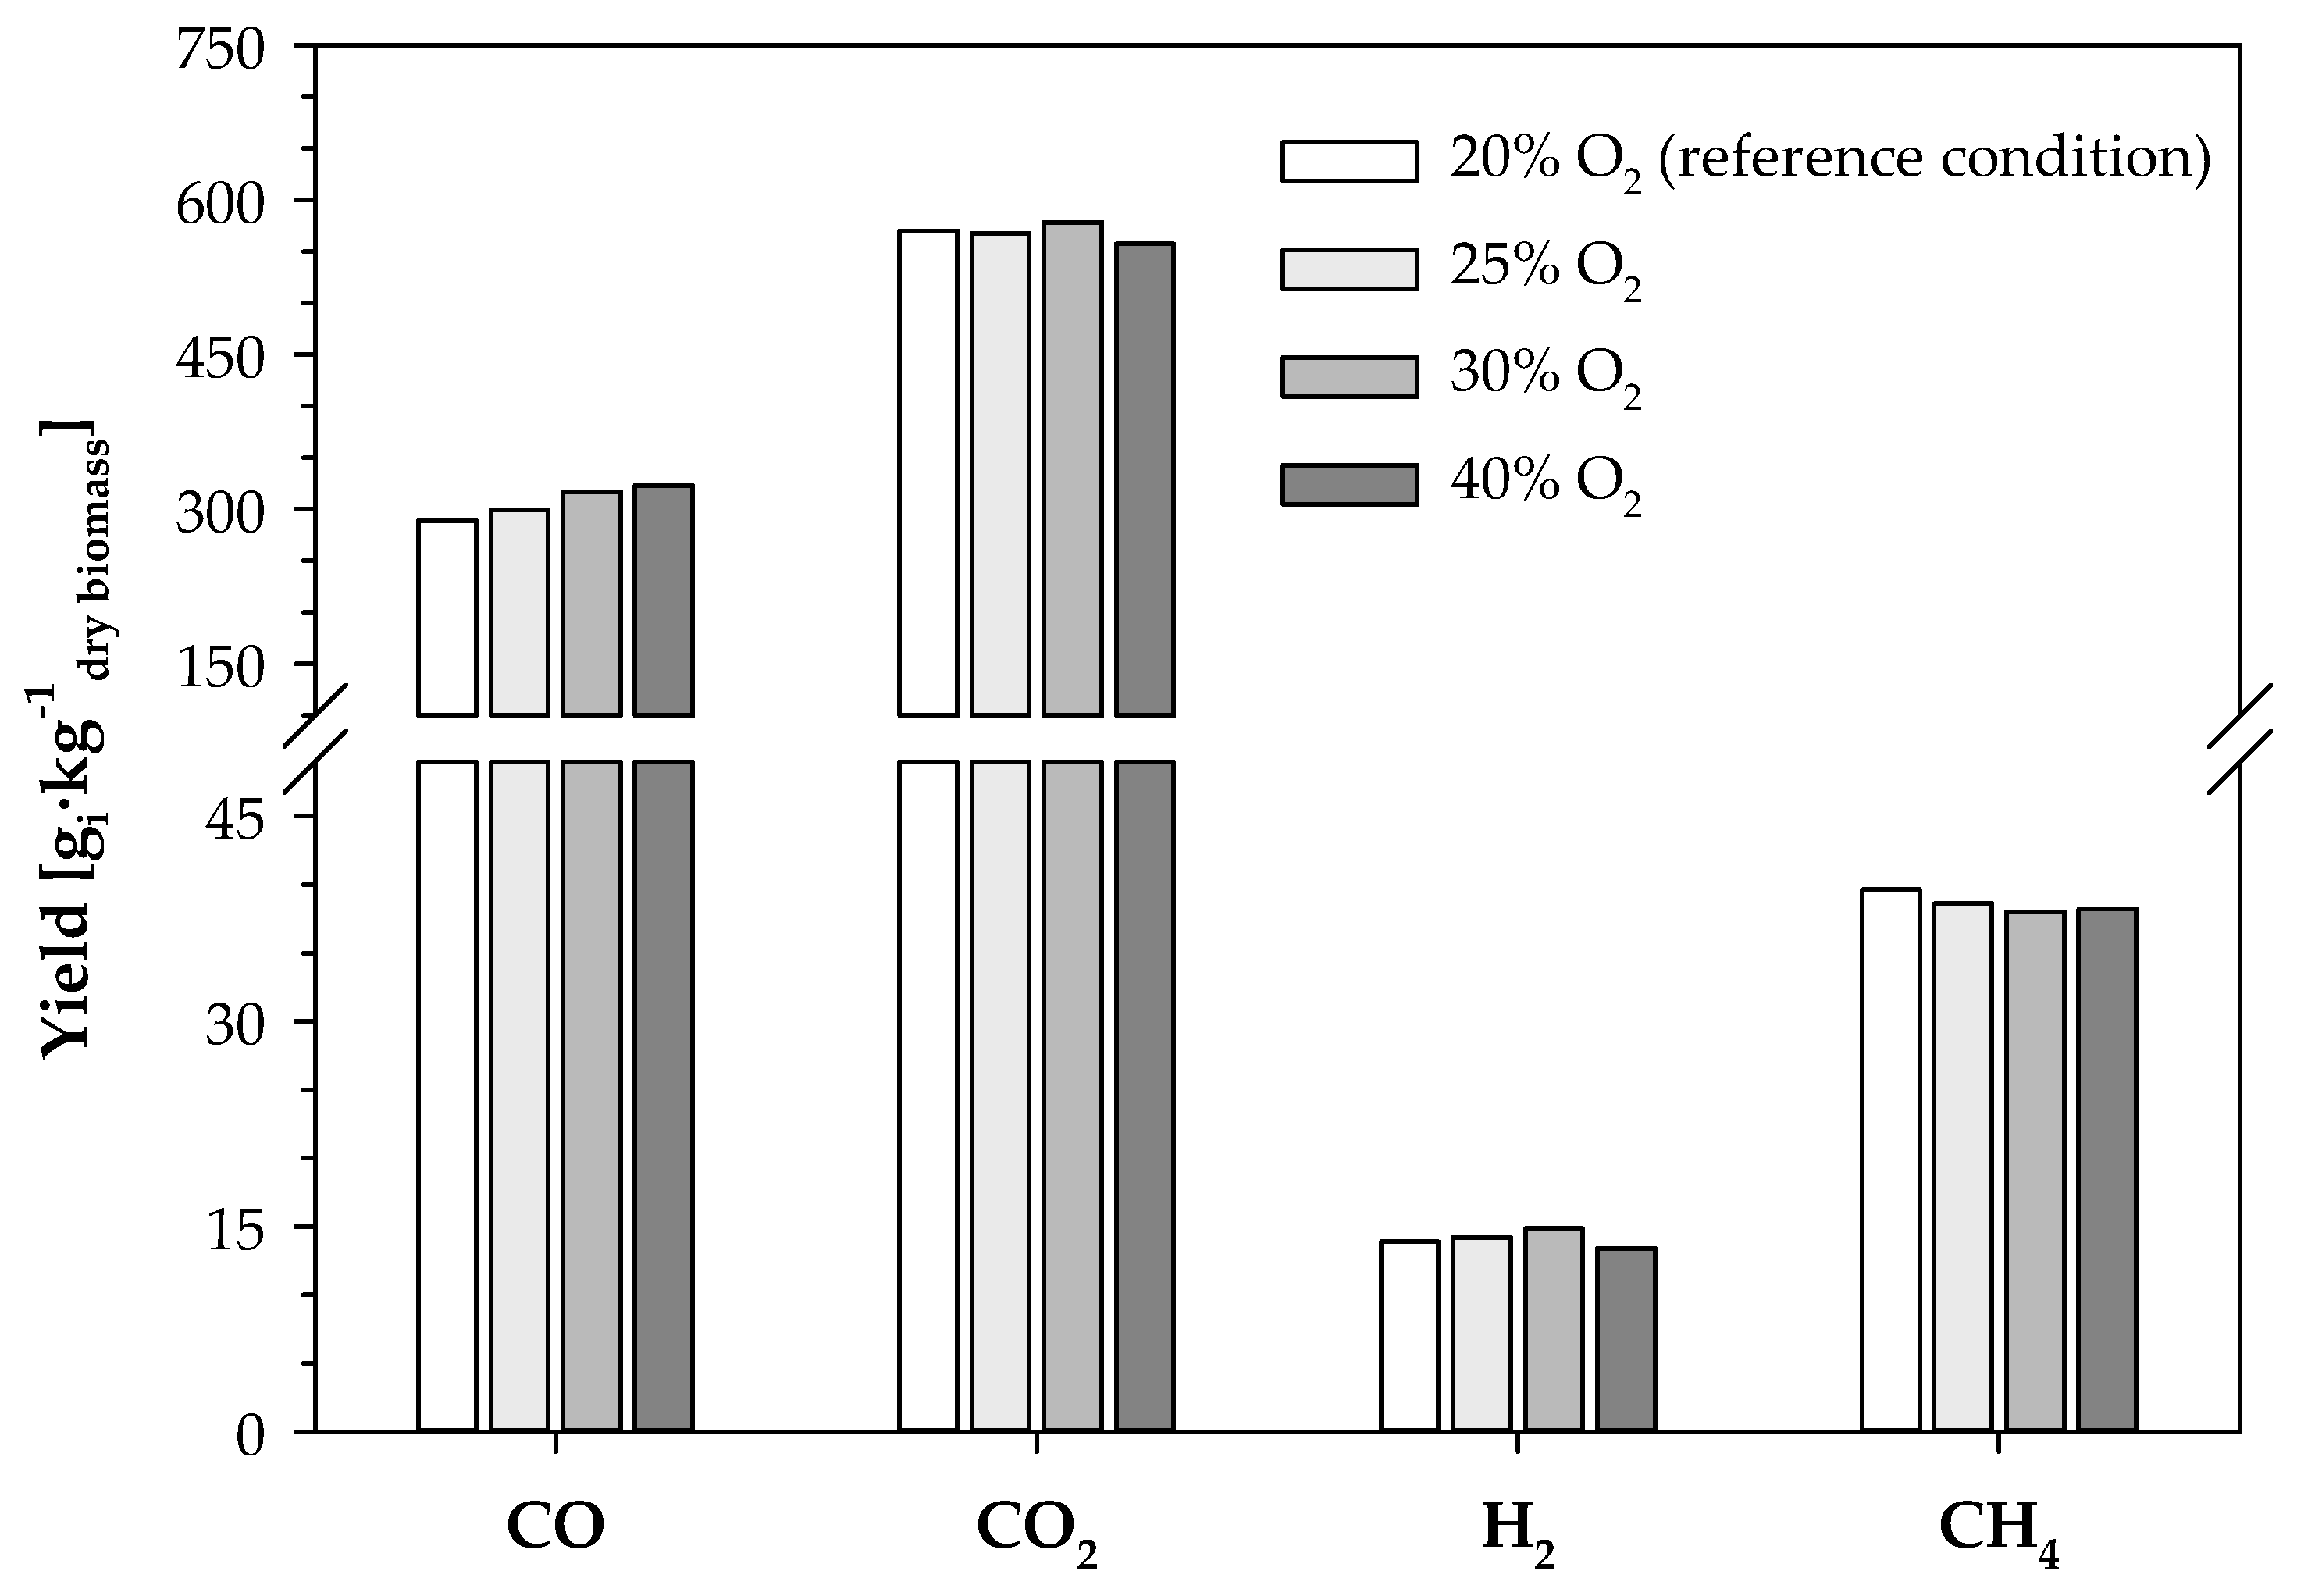
3.2.1. Producer Gas Composition

Figure 6 shows the impact of O2 concentration on the gasification agent on the producer gas composition (CO, CO2, H2, and CH4 concentration), during air gasification of RFB from eucalyptus. Apart from N2 concentration, all gaseous compounds concentration increased with the increment of O2 concentration (φ ranging from 20 to 40 %vol.O2,dry GA) in the gasification agent. The CO concentration increased from 12.9 to 22.2 %vol.dry gas, and the CO2 concentration increased between 16.2 and 24.4 %vol.dry gas. The H2 concentration increased from 8.7 to 12.9 %vol.dry gas, and the concentration of CH4 increased from 3.1 to 4.6 %vol.dry gas. Light hydrocarbons (C2H4, C2H6, and C3H8) concentration also increased with the increment of φ (Table 4); these compounds’ concentrations are not shown in Figure 6 due to low concentration values.
The increase in φ had a major impact on the producer gas composition, following the trend presented in Wang et al. [33] and Liu et al. [35]. Compared to the reference condition, the increment of φ to 40 %vol.O2, dry GA led to an increase in the H2 and CO concentrations of, approximately, 48% and 72%, respectively. Moreover, the concentration of CO2 and CH4 increased by approximately 50% and 48%, respectively, for the same conditions. The increase in φ had a corresponding decrease in the N2 concentration in the gasification agent, thus leading to a reduction in this species in the producer gas composition, resulting in an inevitable increase in the concentration of all combustible species and CO2. Moreover, the results also showed a higher impact of φ increase on the CO concentration, in comparison to the other gaseous compounds. This may be justified by a higher occurrence of the Boudouard reaction (R5), where the CO2 reacts with the solid carbon in the char, producing CO [33]. The promotion of the Boudouard reaction (R5) was probably caused by a higher inventory of char on the bed. In fact, to meet the O2 concentration increment in the gasification agent, whilst keeping the ER constant, the biomass feeding rate increased, thus increasing the amount of char available in the bed for heterogeneous reactions.
Figure 7 presents the behavior of CO, CO2, H2, and CH4 yield with the increment of O2 concentration in the gasification agent, during air gasification of RFB from eucalyptus. The CO yield varied between 287 and 323 gCO∙kg−1dry biomass, whilst the CO2 yield ranged from 567 to 578 gCO2∙kg−1dry biomass. The H2 and CH4 yields did not suffer major changes with the increase of O2 concentration in the gasification agent, varying between 13 gH2∙kg−1dry biomass and 15 gH2∙kg−1dry biomass, and 38 gCH4∙kg−1dry biomass and 40 gCH4∙kg−1dry biomass, respectively.
The yield of the different gas species provides information regarding the effect of O2 concentration in the gasification agent on the conversion of biomass into those gas species. One can observe that an increment in φ led to a slight increase in the CO yield and to a minor decrease in the CH4 yield. However, H2 and CO2 concentrations did not show a clear trend, undergoing an increase when the φ increased from 20 to 30 %vol.O2, dry GA, followed by a decrease for the highest φ tested, although no major changes were observed. These results are not in agreement with the results presented by Wang et al. [33]. One might say that an increase in the yield of all combustible species and CO2 should be expected when the O2 concentration in the gasification agent increased. That increase could be expected because the local temperature at the surface of the reacting particles and its boundary layer would potentially increase with the increment of O2 concentration in the gasification agent, due to the heat released from enhanced exothermic reactions. Thus, the increase in the temperature would favor endothermic reactions, including water–gas (R2), Boudouard (R5), reforming ((R10)–(R14)) and tar cracking reactions, promoting tar destruction, and char conversion, thus increasing H2, CO, CH4 and light hydrocarbons yield [35]. Nevertheless, the bulk bed temperature was controlled at 800 °C for all experiments (Table 3) to obtain deeper knowledge about the effect of O2 concentration in the gasification agent on the producer gas characteristics, without being misunderstood by side effects from other parameters, i.e., ER, Tbed, with a strong impact on reactions rate and producer gas composition. Therefore, the increase in CO yield may be related to a higher relevance of the Boudouard reaction (R5) with the increment of φ.
Moreover, Mastellone et al. [34] during their study observed that, whilst maintaining the temperature constant, the concentration of CO and CO2 (inert free) followed opposite trends, where the former increased and the latter decreased with the increment of O2 concentration in the gasification agent. Those results are also not in alignment with the results obtained in this work. One possible explanation may lie in the fuel composition. The fuel used in their study was a mixture of coal, plastics, and biomass, resulting in a material with a higher content of carbon (above 59 %m/mdb) [34] when compared to the residual forest biomass used in this work (see Table 2). Hence, the reaction mechanisms may have taken different paths, showing, perhaps, a more pronounced relevance of the Boudouard reaction (R5) when compared to this work. In addition, although the temperature of the process remained constant, local temperature increases (so-called hot spots) that cannot be monitored by the thermocouple placed in the bed may have occurred due to the reduced thermal action of nitrogen [34], prompting oxidation reactions, which, together with the higher relevance of the Boudouard reaction (R5), may explain the marginal change in the CO2 yield.
In short, the results obtained may be explained as resulting from a trade-off between oxidation and reducing reactions, prevailing Boudouard reaction (R5), thus increasing the CO yield.

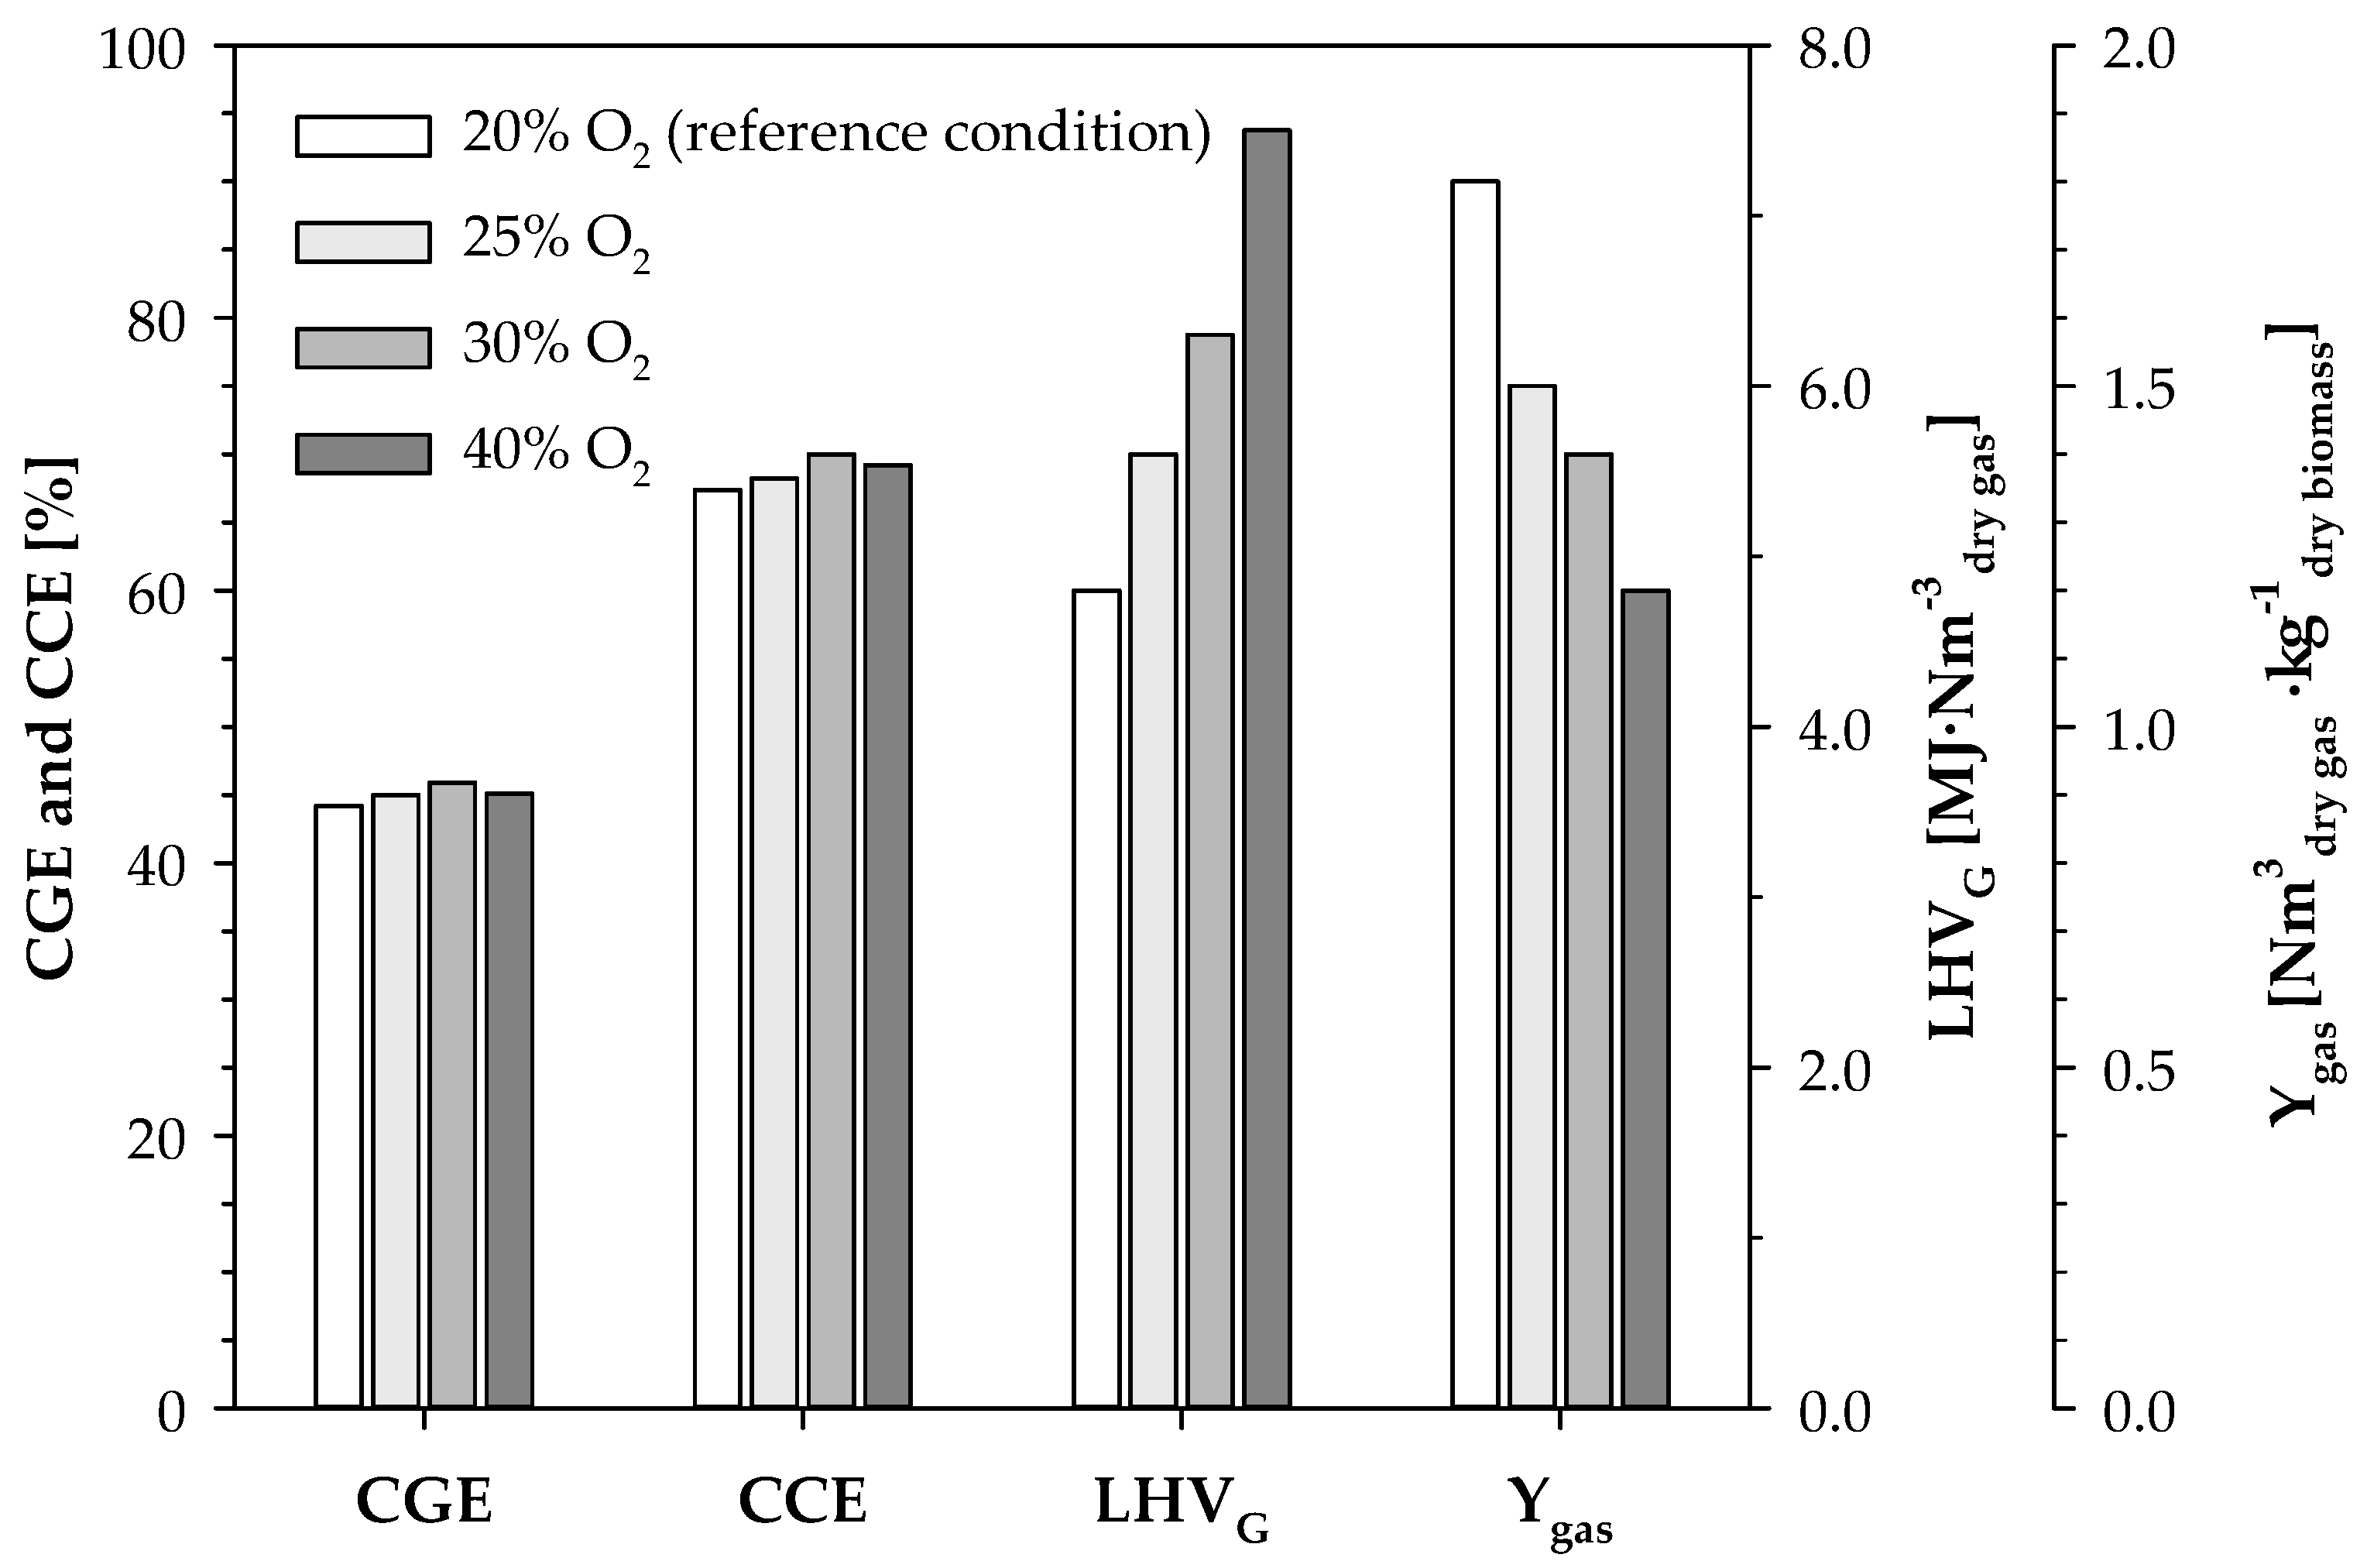
3.2.2. LHVG and Efficiency Parameters

Figure 8 shows the influence of the φ increase in gasification agent on the LHVG and efficiency parameters during air gasification of RFB from eucalyptus. LHVG fell between 4.7 and 7.5 MJ∙Nm−3dry gas, with the highest value found when the φ was 40 %vol. O2, dry GA. The CGE and CCE ranged from 44 and 67% to 46 and 70%, respectively. The Ygas underwent a significant decrease from 1.8 to 1.2 Nm3dry gas∙kg−1dry biomass, when the φ increased from 20 to 40 %vol.O2, dry GA.
The Ygas suffered a decrease of, approximately, 33% with the increment of φ from 20 to 40 %vol.O2, dry GA. This was probably caused by the reduction in N2 concentration in the gasification agent, and the respective decrease in the gas flow rate, thus reducing the N2 concentration in the producer gas and decreasing the overall gas production. However, even though the amount of producer gas decreased with the increase in O2 concentration, its quality in terms of LHVG increased. Each increment in the O2 concentration in the gasification agent led to an increase in the LHVG. In short, less producer gas production, but a higher quality producer gas. Comparing the reference condition to the maximum φ tested, the LHVG underwent an increase of, approximately, 57%, reaching a value of 7.5 MJ∙Nm−3dry gas, considerably higher than the average LHVG for air biomass gasification (see Section 1), meaning that the increment of φ enhanced the producer gas quality for energetic applications. The improvement in the LHVG was mainly associated with the reduction in N2 concentration on the producer gas (caused by the decrease of N2 concentration in the gasification agent), leading to an increase in all combustible species concentration. Moreover, the possible promotion of the Boubouard reaction (R5) with increased production of CO concentration had a positive impact on the LHVG.
The increment in O2 concentration in the gasification agent had a marginal effect on the CGE and CCE. However, it could be said that a higher impact of φ increase was expected in these parameters due to the increment of LHVG and combustible species and CO2 concentration. Since the CGE and CCE are highly influenced by the Ygas, and this parameter significantly decreased with φ, the resulting values of these efficiency parameters can be regarded as a trade-off between the improvement of producer gas quality and gas yield. Moreover, as the temperature was kept constant, the reduction in N2 concentration in the gasification agent was, possibly, the main reason for the improvement of LHVG and combustible species and CO2 concentration, masking the different gas species’ yield. As a result, no evident impact was found on the CGE and CCE.

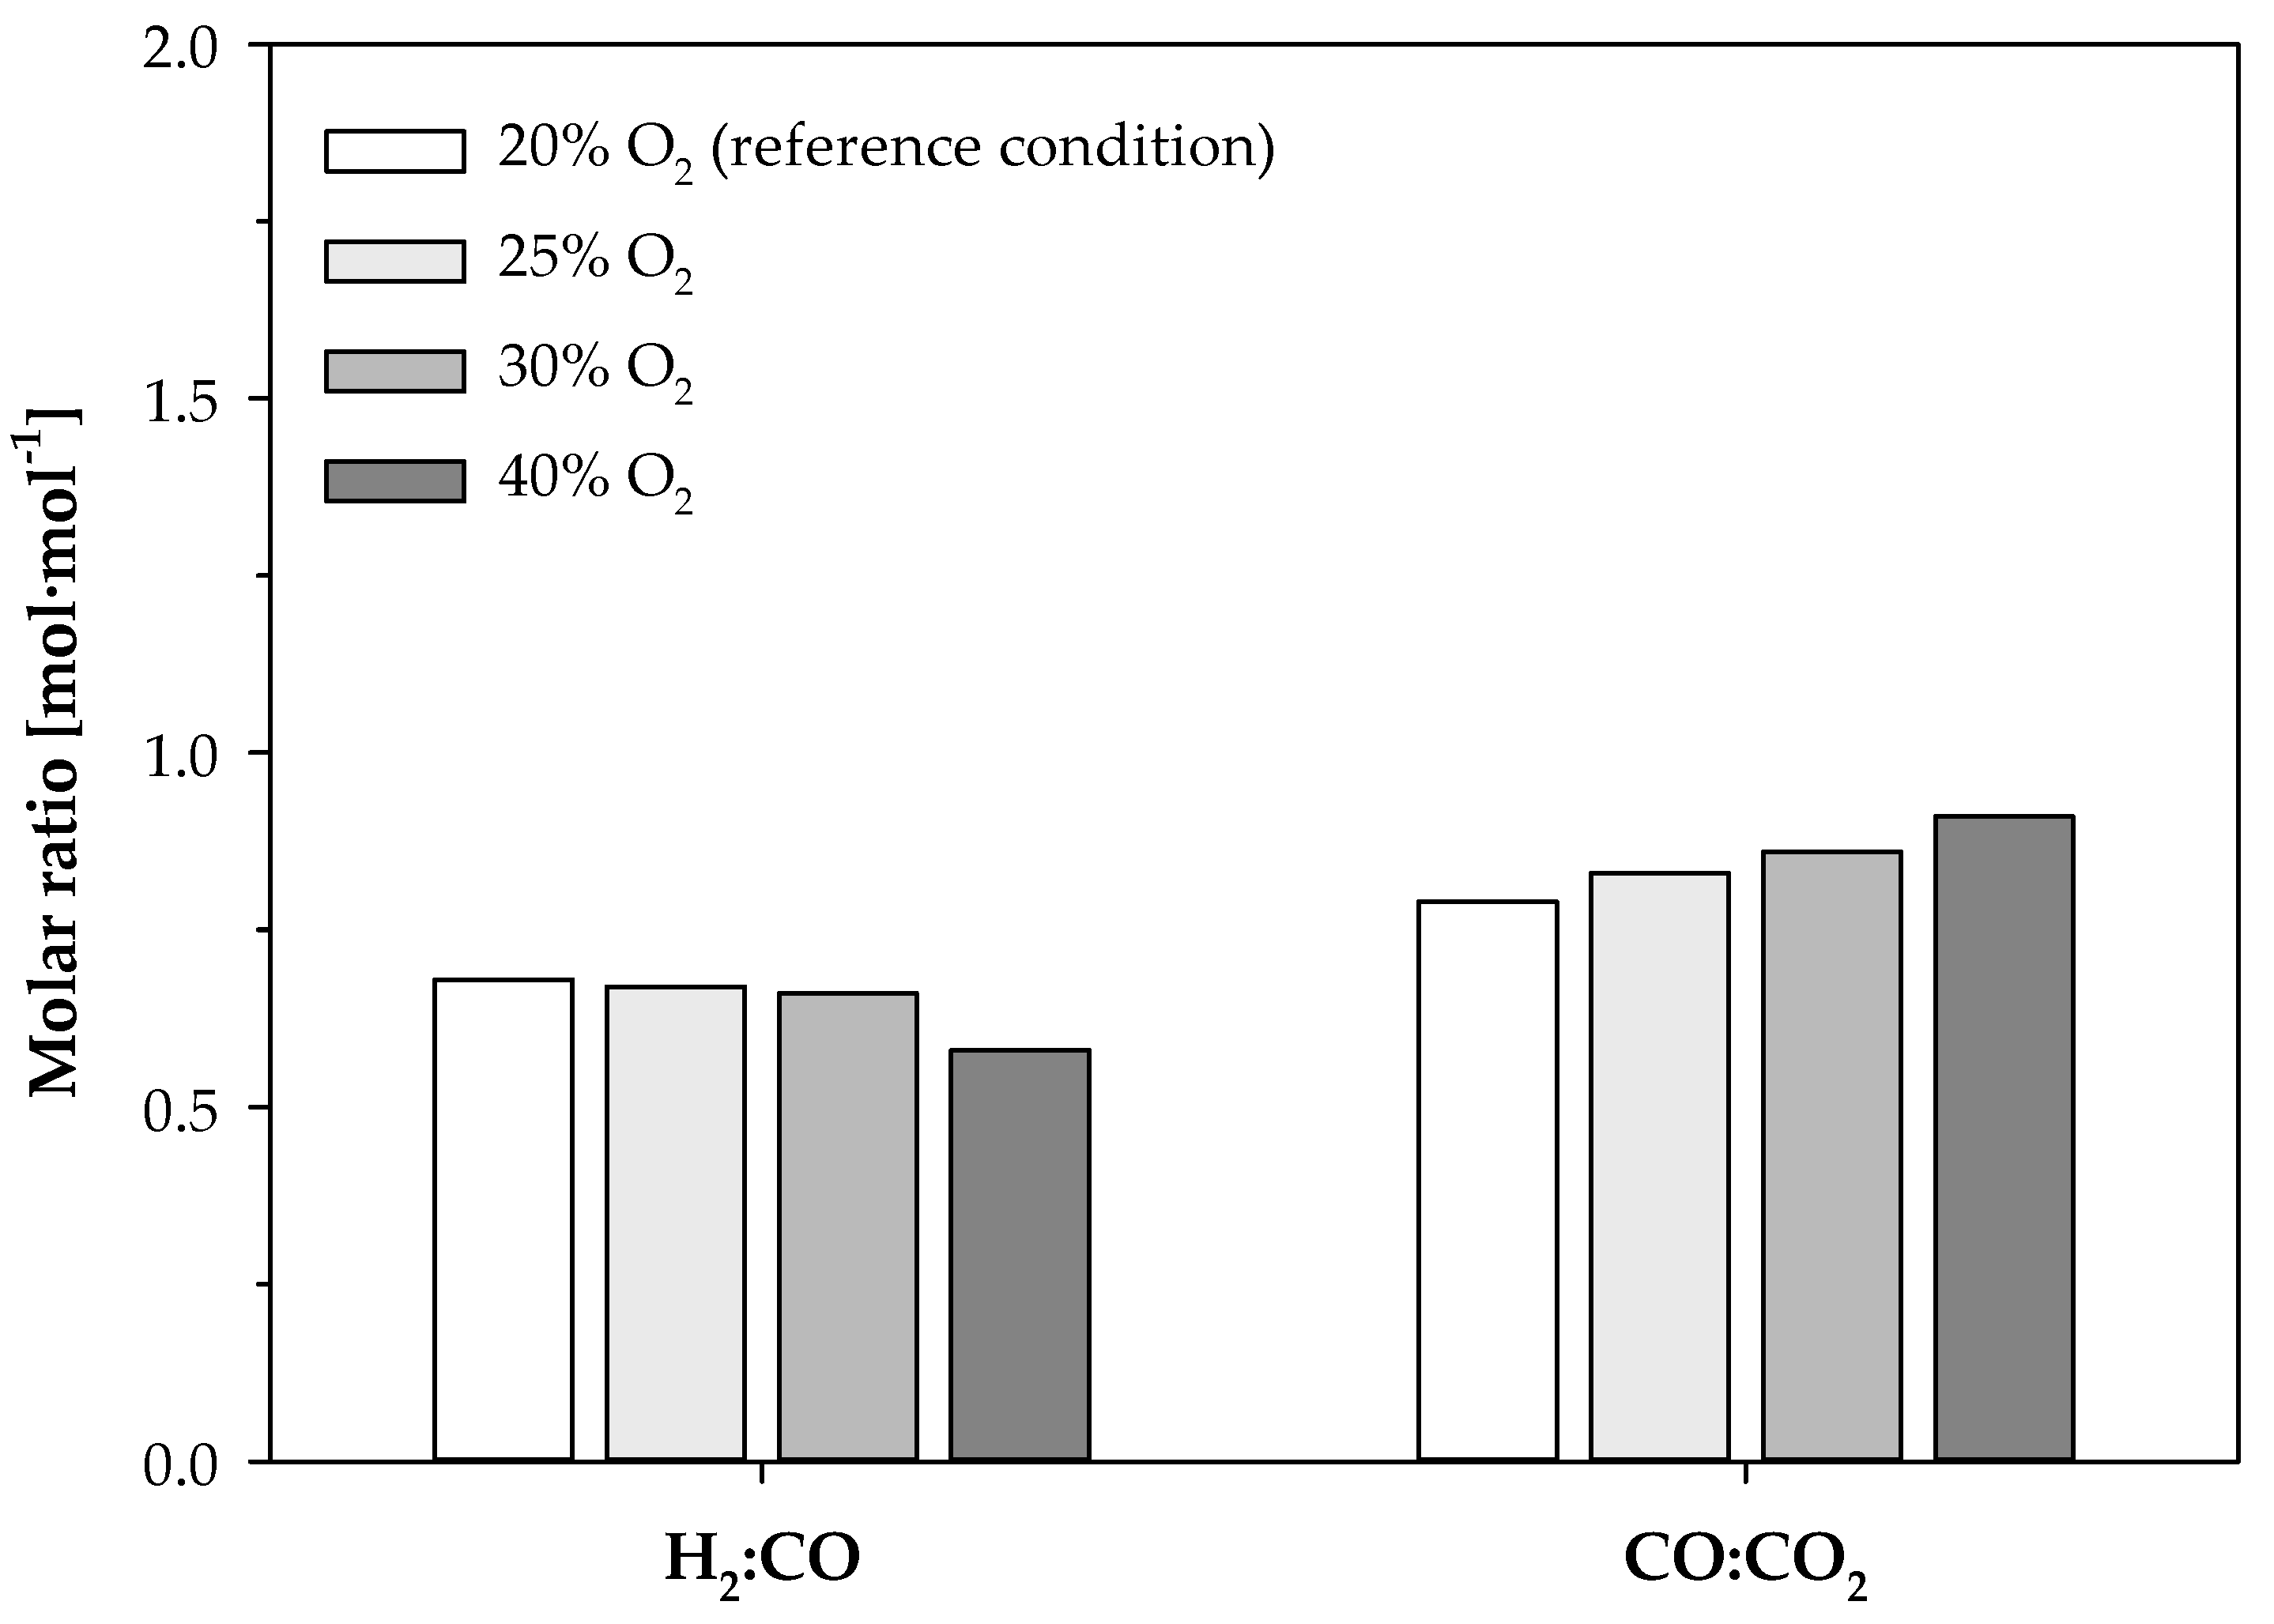
3.2.3. H2:CO and CO:CO2 Molar Ratios

Figure 9 presents the influence of O2 concentration in the gasification agent, during air gasification of RFB from eucalyptus, on H2:CO and CO:CO2 molar ratios. The H2:CO molar ratio varied between 0.58 and 0.67 molH2∙mol−1CO, with the lowest value found when the φ was 40 %vol.O2, dry GA. Contrariwise, the CO:CO2 increased with the increment of φ, ranging from 0.80 to 0.91 molCO∙mol−1CO2.
The injection of 40 %vol.O2, dry GA led to a decrease of, approximately, 15% in the H2:CO molar ratio, and an increase of 15% in the CO:CO2 molar ratio. These results are indicative of the promotion of kinetic mechanisms favoring CO formation, following the analysis performed in Section 3.2.1. This outcome can be explained by the possible promotion of the Boudouard reaction (R5), consuming CO2 and producing CO, thus improving the CO:CO2 molar ratio and decreasing the H2:CO molar ratio. Nevertheless, other reactive mechanisms involving other species as tars cannot be disregarded. This should be the subject of further studies to understand the role of O2-enriched air as a gasification agent during residual biomass gasification on that matter.

4. Conclusions

In this work, the gasification of RFB from eucalyptus, using air-steam or O2-enriched air as gasification agents in an externally heated 3 kWth bench-scale BFB, was successfully performed and analyzed. The main objective was to evaluate the effect of steam/O2 addition on the producer gas quality, whilst maintaining the ER and Tbed constant.
Regarding the effect of steam addition, this parameter had a major impact on the producer gas composition, increasing the concentration of CO2 and H2, and decreasing the CO and CH4 concentrations, probably caused by the promotion of the water gas-shift reaction. Moreover, the increment in steam had a positive effect on the gas yield and the H2:CO molar ratio, with the latter attaining values up to 1.6 molH2∙mol−1CO, thus fulfilling the established limits of this parameter for several advanced applications. SBR had a slightly positive impact on the CGE and CCE, and no evident impact on the LHVG.
The effect of the O2 concentration increase in the gasification agent was very notorious on the producer gas composition, leading to an increase in all combustible species and CO2 concentrations. The results suggest that this increment was mainly caused by the reduction in N2 concentration in the gasification agent, decreasing the N2 concentration on the producer gas. Moreover, the yield of the main compounds in the producer gas (excluding N2) was fairly constant throughout the experiments, apart from the CO yield, which increased with φ, suggesting the possible promotion of the Boudouard reaction (R5). Comparing the reference condition to the maximum φ tested (40%), LHVG underwent an increase of, approximately, 57%, reaching a value of 7.5 MJ·Nm−3dry gas, meaning that the increment in φ improved the producer gas quality for energetic applications. In addition, the Ygas suffered a significant decrease with the φ increase, caused by the reduction in dilution by N2, meaning that less gas was produced, but with higher quality. The φ had a minor positive impact on the CGE and CCE.
As such, this work successfully showed that the addition of steam or O2 during the air gasification of RFB from eucalyptus improved the producer gas quality in terms of H2 concentration, H2:CO molar ratio, and LHVG, showing the potential of these primary measures (modification of gasification agent composition) on improving producer gas quality, and thus overcoming, to some extent, the barriers found for the conventional air gasification technology. The results shown in this work clarified some effects (at the macroscopic level) of adding steam or increasing O2 concentration in the gasification agent, on the producer gas quality, thus being relevant to support the scale-up of the process. Moreover, the results also highlighted the need to further develop detailed experiments to understand the reactive mechanisms underlying those effects.

Author Contributions

Conceptualization, H.G.M.F.G. and L.A.C.T.; methodology, H.G.M.F.G., M.A.A.M. and L.A.C.T.; formal analysis, H.G.M.F.G. and L.A.C.T.; investigation, H.G.M.F.G., M.A.A.M. and L.A.C.T.; resources, M.A.A.M. and L.A.C.T.; data curation, H.G.M.F.G.; writing—original draft preparation, H.G.M.F.G.; writing—review and editing, H.G.M.F.G., M.A.A.M. and L.A.C.T.; visualization, H.G.M.F.G. and L.A.C.T.; supervision, M.A.A.M. and L.A.C.T.; project administration, L.A.C.T.; funding acquisition, L.A.C.T. All authors have read and agreed to the published version of the manuscript.

Funding

This research was funded by Project Inpactus—Innovative products and technologies from eucalyptus, Project N. º 21874 funded by Portugal 2020 through the European Regional Development Fund (ERDF) in the frame of COMPETE 2020 nº246/axis II/2017, and FCT/MCTES for the financial support to CESAM (UIDP/50017/2020 + UIDB/50017/2020 + LA/P/0094/2020), through national funds. Helena G. M. F. Gomes also acknowledge the Portuguese Foundation for Science and Technology for providing financial support to the PhD scholarship granted to Helena Gomes (ref. 2020.09864.BD).

Data Availability Statement

Data available on request because of project policies.

Conflicts of Interest

The authors declare no conflict of interest.

Nomenclature and Abbreviations

Latin Symbols
BFBBubbling fluidized bed
CCECarbon Conversion Efficiency[%]
CGECold Gas Efficiency[%]
CO:CO2Carbon monoxide to carbon dioxide molar ratio[molCO∙mol−1CO2]
EREquivalence ratio[-]
GAGasification agent
GCGas chromatography
Gm, dry biomassDry biomass mass flow rate[kgdry biomass∙s−1]
Gv, gasDry gas volumetric flow rate[Nm3dry gas∙s−1]
hH2O,298KWater enthalpy of vaporization at 298 K [2.442 MJ∙kg−1H2O]
HHVBHigher heating value of the dry biomass[MJ∙kg−1dry biomass]
HPLCHigh-performance liquid chromatography
H2:COHydrogen to carbon monoxide molar ratio[molH2∙mol−1CO]
H2:CO2Hydrogen to carbon dioxide molar ratio[molH2∙mol−1CO2]
Index iGaseous Carbon compound CO2, CO, CH4, C2H4, C2H6, C3H8
LHVBLower heating value of the dry biomass[MJ∙kg−1dry biomass]
LHVGLower heating value of the dry producer gas[MJ∙Nm−3dry gas]
MCMolar mass of carbon[12 kgC∙kmol−1C]
MH2Molar mass of hydrogen[2 kgH2∙kmol−1H2]
MH2OMolar mass of water[18 kgH2O∙kmol−1H2O]
NDIRNondispersive infrared
NLRefers to L at normal pressure (101,325 Pa) and temperature (273 K)
Nm3Refers to m3 at normal pressure (101,325 Pa) and temperature (273 K)
PIDProportional-Integral-Derivative
PNPressure at standard conditions[101,325 Pa]
RIdeal Gas constant[8314 J∙kmol−1·K−1]
RFBResidual forest biomass
SBRSteam-to-biomass mass ratio[kgsteam∙kg−1biomass]
TCThermal conductivity
TCDThermal conductivity detector
TNTemperature at standard conditions[273.15 K]
washBMass fraction of ash in the biomass[kgash∙kg−1dry biomass]
wCBMass fraction of carbon in the biomass[kgC∙kg−1dry biomass]
wHBMass fraction of hydrogen in the biomass[kgH∙kg−1dry biomass]
wH2OBMass fraction of water in the biomass[kgH2O∙kg−1dry biomass]
wNBMass fraction of nitrogen in the biomass[kgN∙kg−1dry biomass]
wOBMass fraction of oxygen in the biomass[kgO∙kg−1dry biomass]
wSBMass fraction of sulphur in the biomass[kgS∙kg−1dry biomass]
YgasSpecific dry gas production or gas yield[Nm3dry gas∙kg−1dry biomass]
yiMolar fraction of a gaseous carbon compound measured in the dry producer gas[moli∙mol−1dry gas]
Greek Symbols
Δ H 298 K 0 Standard enthalpy of a reaction at 298 K, 1 bar[kJ∙mol−1]
ɛC,iMolar fraction of carbon in gaseous compounds containing carbon (ɛC,CO2 = 1, ɛC,CO = 1, ɛC,CH4 = 1, ɛC,C2H4 = 2, ɛC,C2H6 = 2, ɛC,C3H8 = 3)[molC∙mol−1i]
φO2 concentration in the dry gasification agent[%vol.O2, dry GA]

References

  1. United Nations The 17 Goals. Available online: https://sdgs.un.org/goals (accessed on 15 November 2022).
  2. European Commission. The European Green Deal; European Commission: Brussels, Belgium, 2019. [Google Scholar]
  3. International Energy Agency. International Energy Agency Global Energy Review: CO2 Emissions in 2021; International Energy Agency: Paris, France, 2021. [Google Scholar]
  4. International Energy Agency (IEA). Total Energy Supply (TES) by Source. Available online: https://www.iea.org/data-and-statistics/data-browser?country=WORLD&fuel=Energyconsumption&indicator=CO2Industry (accessed on 19 April 2022).
  5. International Energy Agency. Renewable Share in Final Consumption (SDG 7.2). Available online: https://www.iea.org/data-and-statistics/data-tools/energy-statistics-data-browser?country=WORLD&fuel=SustainableDevelopmentGoals&indicator=SDG72 (accessed on 16 November 2022).
  6. Pio, D.T.; Tarelho, L.A.C.; Pinto, P.C.R. Gasification-Based Biorefinery Integration in the Pulp and Paper Industry: A Critical Review. Renew. Sustain. Energy Rev. 2020, 133, 110210. [Google Scholar] [CrossRef]
  7. Sikarwar, V.S.; Zhao, M.; Fennell, P.S.; Shah, N.; Anthony, E.J. Progress in Biofuel Production from Gasification. Prog. Energy Combust. Sci. 2017, 61, 189–248. [Google Scholar] [CrossRef]
  8. Havilah, P.R.; Sharma, A.K.; Govindasamy, G.; Matsakas, L.; Patel, A. Biomass Gasification in Downdraft Gasifiers: A Technical Review on Production, Up-Gradation and Application of Synthesis Gas. Energies 2022, 15, 3938. [Google Scholar] [CrossRef]
  9. Campoy, M.; Gómez-Barea, A.; Vidal, F.B.; Ollero, P. Air-Steam Gasification of Biomass in a Fluidised Bed: Process Optimisation by Enriched Air. Fuel Process. Technol. 2009, 90, 677–685. [Google Scholar] [CrossRef]
  10. Heidenreich, S.; Müller, M.; Foscolo, P.U. Advanced Biomass Gasification: New Concepts for Efficiency Increase and Product Flexibility; Elsevier: London, UK, 2016; ISBN 9780128042960. [Google Scholar]
  11. Molino, A.; Chianese, S.; Musmarra, D. Biomass Gasification Technology: The State of the Art Overview. J. Energy Chem. 2016, 25, 10–25. [Google Scholar] [CrossRef]
  12. Sansaniwal, S.K.; Pal, K.; Rosen, M.A.; Tyagi, S.K. Recent Advances in the Development of Biomass Gasification Technology: A Comprehensive Review. Renew. Sustain. Energy Rev. 2017, 72, 363–384. [Google Scholar] [CrossRef]
  13. Sansaniwal, S.K.; Rosen, M.A.; Tyagi, S.K. Global Challenges in the Sustainable Development of Biomass Gasification: An Overview. Renew. Sustain. Energy Rev. 2017, 80, 23–43. [Google Scholar] [CrossRef]
  14. Hernández, J.J.; Aranda, G.; Barba, J.; Mendoza, J.M. Effect of Steam Content in the Air—Steam Flow on Biomass Entrained Fl Ow Gasi Fi Cation. Fuel Process. Technol. 2012, 99, 43–55. [Google Scholar] [CrossRef]
  15. Liu, C.; Huang, Y.; Niu, M.; Pei, H.; Liu, L.; Wang, Y.; Dong, L.; Xu, L. Influences of Equivalence Ratio, Oxygen Concentration and Fluidization Velocity on the Characteristics of Oxygen-Enriched Gasification Products from Biomass in a Pilot-Scale Fluidized Bed. Int. J. Hydrogen Energy 2018, 43, 14214–14225. [Google Scholar] [CrossRef]
  16. Heidenreich, S.; Foscolo, P.U. New Concepts in Biomass Gasification. Prog. Energy Combust. Sci. 2015, 46, 72–95. [Google Scholar] [CrossRef]
  17. Bain, R.L.; Broer, K. Gasification. In Thermochemical Processing of Biomass: Conversion into Fuels, Chemicals and Power; Brown, R.C., Ed.; John Wiley & Sons, Ltd.: Hoboken, NJ, USA, 2011; pp. 47–77. ISBN 9780470721117. [Google Scholar]
  18. Pio, D.T.; Tarelho, L.A.C.; Pinto, R.G.; Matos, M.A.A.; Frade, J.R.; Yaremchenko, A.; Mishra, G.S.; Pinto, P.C.R. Low-Cost Catalysts for in-Situ Improvement of Producer Gas Quality during Direct Gasification of Biomass. Energy 2018, 165, 442–454. [Google Scholar] [CrossRef]
  19. Pio, D.T.; Gomes, H.G.M.F.; Tarelho, L.A.C.; Vilas-Boas, A.C.M.; Matos, M.A.A.; Lemos, F.M.S. Superheated Steam Injection as Primary Measure to Improve Producer Gas Quality from Biomass Air Gasification in an Autothermal Pilot-Scale Gasifier. Renew. Energy 2022, 181, 1223–1236. [Google Scholar] [CrossRef]
  20. Ciferno, J.; Marano, J. Benchmarking Biomass Gasification Technologies for Fuels, Chemicals and Hydrogen Production; U.S. Department of Energy National Energy Technology Laboratory: Pittsburgh, PA, USA, 2002.
  21. Wang, Z.; He, T.; Li, J.; Wu, J.; Qin, J.; Liu, G.; Han, D.; Zi, Z.; Li, Z.; Wu, J. Design and Operation of a Pilot Plant for Biomass to Liquid Fuels by Integrating Gasification, DME Synthesis and DME to Gasoline. Fuel 2016, 186, 587–596. [Google Scholar] [CrossRef]
  22. Ruivo, L.; Gomes, H.; Cruz, N.; Yaremchenko, A.; Tarelho, A.C.; Frade, J. Siderite/Concrete Catalysts for H2 -Enriched Gas Production from Biomass Steam Gasification. Energy Convers. Manag. 2022, 255, 115280. [Google Scholar] [CrossRef]
  23. Turn, S.; Kinoshita, C.; Zhang, Z.; Ishimura, D.; Zhou, J. An Experimental Investigation of Hydrogen Production from Biomass Gasification. Int. J. Hydrogen Energy 1998, 23, 641–648. [Google Scholar] [CrossRef]
  24. Udomsirichakorn, J.; Basu, P.; Salam, P.A.; Acharya, B. Effect of CaO on Tar Reforming to Hydrogen-Enriched Gas with in-Process CO2 Capture in a Bubbling Fluidized Bed Biomass Steam Gasifier. Int. J. Hydrogen Energy 2013, 38, 14495–14504. [Google Scholar] [CrossRef]
  25. Fremaux, S.; Beheshti, S.M.; Ghassemi, H.; Shahsavan-Markadeh, R. An Experimental Study on Hydrogen-Rich Gas Production via Steam Gasification of Biomass in a Research-Scale Fluidized Bed. Energy Convers. Manag. 2015, 91, 427–432. [Google Scholar] [CrossRef]
  26. Mayerhofer, M.; Mitsakis, P.; Meng, X.; De Jong, W.; Spliethoff, H.; Gaderer, M. Influence of Pressure, Temperature and Steam on Tar and Gas in Allothermal Fluidized Bed Gasification. Fuel 2012, 99, 204–209. [Google Scholar] [CrossRef]
  27. Parthasarathy, P.; Narayanan, K.S. Hydrogen Production from Steam Gasification of Biomass: Influence of Process Parameters on Hydrogen Yield—A Review. Renew. Energy 2014, 66, 570–579. [Google Scholar] [CrossRef]
  28. NASA (National Aeronautics and Space Administration). Safety Standard for Oxygen and Oxygen Systems Guidelines for Oxygen System Design, Materials Selection, Operations, Storage, and Transportation; National Aeronautics and Space Administration: Washington, DC, USA, 1996.
  29. Winterbone, D.E. Advanced Thermodynamics for Engineers a Member of the Hodder Headline Group, 1st ed.; Arnold: London, UK, 1997; ISBN 9780340676998. [Google Scholar]
  30. Tian, Y.; Zhou, X.; Lin, S.; Ji, X.; Bai, J.; Xu, M. Syngas Production from Air-Steam Gasification of Biomass with Natural Catalysts. Sci. Total Environ. 2018, 645, 518–523. [Google Scholar] [CrossRef]
  31. Lv, P.M.; Xiong, Z.H.; Chang, J.; Wu, C.Z.; Chen, Y.; Zhu, J.X. An Experimental Study on Biomass Air-Steam Gasification in a Fluidized Bed. Bioresour. Technol. 2004, 95, 95–101. [Google Scholar] [CrossRef] [PubMed]
  32. Tian, Y.; Zhou, X.; Yang, Y.; Nie, L. Experimental Analysis of Air-Steam Gasification of Biomass with Coal-Bottom Ash. J. Energy Inst. 2020, 93, 25–30. [Google Scholar] [CrossRef]
  33. Wang, Z.; He, T.; Qin, J.; Wu, J.; Li, J.; Zi, Z.; Liu, G.; Wu, J.; Sun, L. Gasification of Biomass with Oxygen-Enriched Air in a Pilot Scale Two-Stage Gasifier. Fuel 2015, 150, 386–393. [Google Scholar] [CrossRef]
  34. Mastellone, M.L.; Zaccariello, L.; Santoro, D.; Arena, U. The O2-Enriched Air Gasification of Coal, Plastics and Wood in a Fluidized Bed Reactor. Waste Manag. 2012, 32, 733–742. [Google Scholar] [CrossRef] [PubMed]
  35. Liu, L.; Huang, Y.; Cao, J.; Liu, C.; Dong, L.; Xu, L.; Zha, J. Experimental Study of Biomass Gasification with Oxygen-Enriched Air in Fluidized Bed Gasifier. Sci. Total Environ. 2018, 626, 423–433. [Google Scholar] [CrossRef]
  36. CELPA Boletim Estatístico 2020. Available online: https://www.biond.pt/publicacoes/boletim-estatistico-2020/ (accessed on 15 November 2022).
  37. Channiwala, S.A.; Parikh, P.P. A Unified Correlation for Estimating HHV of Solid, Liquid and Gaseous Fuels. Fuel 2002, 81, 1051–1063. [Google Scholar] [CrossRef]
  38. Pio, D.T.; Gomes, H.G.M.; Ruivo, L.C.M.; Matos, M.A.; Monteiro, J.F.; Frade, J.R.; Tarelho, L.A.C. Concrete as Low-Cost Catalyst to Improve Gas Quality during Biomass Gasi Fi Cation in a Pilot-Scale Gasi Fi Er. Energy 2021, 233, 120931. [Google Scholar] [CrossRef]
  39. Ruivo, L.C.M.; Gomes, H.G.M.F.; Lopes, D.V.; Yaremchenko, A.A.; Vilas-boas, C.; Tarelho, L.A.C.; Frade, J.R. Catalytic O2-Steam Gasification of Biomass over Fe2-XMn XO3 Oxides Supported on Ceramic Foam Filters. Fuel 2022, 324, 124566. [Google Scholar] [CrossRef]
  40. Basu, P. Biomass Gasification and Pyrolysis: Practical Design and Theory; Elsevier: Amsterdam, The Netherlands, 2010. [Google Scholar]
  41. Pio, D.T.; Tarelho, L.A.C.; Matos, M.A.A. Characteristics of the Gas Produced during Biomass Direct Gasification in an Autothermal Pilot-Scale Bubbling Fluidized Bed Reactor. Energy 2017, 120, 915–928. [Google Scholar] [CrossRef]
  42. Waldheim, L.; Nilsson, T. Heating Value of Gases from Biomass Gasification; International Energy Agency Bioenergy Agreement: Nyköping, Sweden, 2001. [Google Scholar]
  43. Pio, D.T.; Gomes, H.G.M.F.; Tarelho, L.A.C.; Ruivo, L.C.M.; Matos, M.A.A.; Pinto, R.G.; Frade, J.R.; Lemos, F.M.S. Ilmenite as Low-Cost Catalyst for Producer Gas Quality Improvement from a Biomass Pilot-Scale Gasifier. Energy Rep. 2020, 6, 325–330. [Google Scholar] [CrossRef]
  44. Pio, D.T.; Tarelho, L.A.C. Empirical and Chemical Equilibrium Modelling for Prediction of Biomass Gasification Products in Bubbling Fluidized Beds. Energy 2020, 202, 117654. [Google Scholar] [CrossRef]
Figure 1. Schematic layout of the bench-scale 3 kWth externally heated BFB gasifier. Dashed line—Electric circuit, Continuous line—Pneumatic circuit, GENTWO—Paramagnetic online gas analyzer for O2, UCE-LAB—Electronic command unit, Micro GC Fusion—Gas chromatograph with Thermal Conductivity Detector (TCD), SICK online analyzer with nondispersive infrared (NDIR) sensor and thermal conductivity (TC) sensor (adapted from [19]).
Energies 16 02427 g001
Figure 2. Effect of steam injection on the producer gas most abundant components concentration (N2 concentration excluded) during air gasification of RFB from eucalyptus (φ = 20 %vol.O2, dry GATable 3 and Table 4).
Energies 16 02427 g002
Figure 3. Effect of steam addition on the CO, CO2, H2, and CH4 yield during air gasification of RFB from eucalyptus (φ = 20 %vol.O2, dry GATable 3 and Table 4).
Energies 16 02427 g003
Figure 4. Effect of steam addition on the LHVG and performance parameters during air gasification of RFB from eucalyptus (φ = 20 %vol.O2, dry GATable 3 and Table 4).
Energies 16 02427 g004
Figure 5. Effect of steam addition on the H2:CO and CO:CO2 molar ratios during air gasification of RFB from eucalyptus (φ = 20 %vol.O2, dry GATable 3 and Table 4).
Energies 16 02427 g005
Figure 6. Effect of O2 concentration (φ) in the gasification agent, on the producer gas most abundant components concentration (N2 concentration excluded) during air gasification of RFB from eucalyptus (SBR = 0.0 kgsteam∙kg−1biomassTable 3 and Table 4).
Energies 16 02427 g006
Figure 7. Effect of O2 concentration (φ) in gasification agent on the CO, CO2, H2, and CH4 yield during air gasification of RFB from eucalyptus (SBR = 0.0 kgsteam∙kg−1biomassTable 3 and Table 4).
Energies 16 02427 g007
Figure 8. Effect of O2 concentration (φ) in gasification agent on the LHVG and performance parameters during air gasification of RFB from eucalyptus (SBR = 0.0 kgsteam∙kg−1biomassTable 3 and Table 4).
Energies 16 02427 g008
Figure 9. Effect of O2 concentration (φ) in gasification agent on the H2:CO and CO:CO2 molar ratios during air gasification of RFB from eucalyptus (SBR = 0.0 kgsteam∙kg−1biomassTable 3 and Table 4).
Energies 16 02427 g009
Table 1. Main biomass gasification reactions [10,14,15].
Reaction Δ H 298 K 0 [kJ·mol−1] Equation
Heterogenous reactions
Devolatilization Biomass + heat   Permament   gas + Tar + Char endothermic(R1)
Water gas C ( s ) + H 2 O H 2 + CO 131(R2)
Char-steam C ( s ) + 2 H 2 O     CO 2 + 2 H 2 90(R3)
C ( s ) +   H 2 O     ½ CH 4 + ½ CO 2 8(R4)
Boudouard C ( s ) + CO 2 2 CO 173(R5)
Methanation C ( s ) + 2 H 2 CH 4 −75(R6)
Partial oxidation C ( s ) + ½ O 2 CO −111(R7)
Complete oxidation C ( s ) + O 2 CO 2 −394(R8)
Homogenous reactions
Water gas-shift CO + H 2 O H 2 + CO 2 −41(R9)
Steam reforming CH 4 +   H 2 O     CO + 3 H 2 206(R10)
CH 4 + 2 H 2 O     CO 2 + 4 H 2 165(R11)
C n H m +   nH 2 O     nCO + ( n + m 2 ) H 2 endothermic(R12)
Dry (CO2) reforming CH 4 +   CO 2     2 CO + 2 H 2 247(R13)
C n H m +   nCO 2     2 nCO + ( m 2 ) H 2 endothermic(R14)
CO oxidation CO + ½ O 2 CO 2 −283(R15)
H2 oxidation H 2 + ½ O 2 H 2 O −242(R16)
Table 2. Chemical characterization of the RFB from eucalyptus.
Eucalyptus
Proximate analysis [%m/m.db]
Moisture (a)7.7
Ash3.3
Volatile matter79.0
Fixed Carbon17.7
Ultimate analysis [%m/m.db]
C50.9
H6.1
N0.9
O38.8
Ash3.3
LHVB [MJ∙kg−1dry biomass]19.3
(a) air-dried (as received). db—dry basis.
Table 3. Operating conditions of the experiments performed in this work.
Experiment#1#2#3#4#5#6#7
Gm, biomass [kg biomass∙h−1] a0.2040.2040.2040.2040.2550.3060.407
Gv,air [NLair∙min−1] b4.004.004.004.003.753.503.00
SBR [kgsteam∙kg−1biomass] a0.00.20.40.60.00.00.0
Gv,liquid H2O [mL H2O∙min−1]0.000.681.362.040.000.000.00
φ [%vol.O2, dry GA] c20202020253040
Gv,O2 [NLO2∙min−1]0.0000.0000.0000.0000.2500.5001.000
a—air-dried biomass (moisture content: 7.7 %m/m, Table 2). b—dry synthetic air (20 %vol. of O2 in N2). c—GA—gasification agent. NL—Litre at standard temperature and pressure (273 K and 101,325 Pa).
Table 4. Summary of results obtained in this work.
Experiment#1#2#3#4#5#6#7
ER [-]0.250.250.250.250.250.250.25
SBR [kgsteam∙kg−1biomass]0.00.20.40.60.00.00.0
φ [%vol.O2, dry GA]20202020253040
Average producer gas composition [%vol.dry gas]
CO12.90 ± 0.1411.24 ± 0.1210.07 ± 0.118.97 ± 0.0915.51 ± 0.1618.11 ± 0.1822.22 ± 0.23
CO216.21 ± 0.1717.60 ± 0.1818.21 ± 0.1918.99 ± 0.2018.71 ± 0.1921.02 ± 0.2024.41 ± 0.20
H28.72 ± 0.1311.56 ± 0.1912.93 ± 0.1914.64 ± 0.2210.32 ± 0.1611.93 ± 0.1812.91 ± 0.19
CH43.12 ± 0.062.98 ± 0.052.83 ± 0.052.72 ± 0.053.51 ± 0.073.81 ± 0.074.62 ± 0.09
C2H41.32 ± 0.051.35 ± 0.031.22 ± 0.021.23 ± 0.031.43 ± 0.031.52 ± 0.041.82 ± 0.03
C2H60.20 ± 0.050.19 ± 0.020.19 ± 0.010.18 ± 0.020.33 ± 0.010.32 ± 0.020.32 ± 0.01
C3H80.20 ± 0.010.25 ± 0.030.23 ± 0.020.21 ± 0.040.31 ± 0.030.33 ± 0.020.42 ± 0.05
N257.42 ± 1.1055.21 ± 1.1154.85 ± 1.0553.67 ± 1.0650.02 ± 1.0143.04 ± 1.0833.52 ± 1.09
Yield [gi∙kg−1dry biomass]
CO 288.60261.50235.64214.72299.27316.90322.85
CO2569.53643.18669.91714.01567.36577.77557.62
H213.9019.2121.6225.0114.2014.8813.40
CH439.6339.6137.9137.1838.6238.0238.23
C2H429.0831.3328.5129.5327.0326.2626.18
C2H64.794.854.664.546.215.634.67
C3H87.039.028.348.029.108.259.14
Performance parameters
LHVG [MJ∙Nm−3dry gas]4.774.894.744.735.606.307.50
Ygas [Nm3dry gas∙kg−1dry biomass]1.791.861.871.921.501.401.20
CGE [%]44.2047.1645.9646.9445.0045.9045.10
CCE [%]67.4469.8068.2068.7968.2070.0069.20
H2:CO [molH2∙mol−1CO]0.671.031.281.630.670.660.58
H2:CO2 [molH2∙mol−1CO2]0.540.660.710.770.550.570.53
CO:CO2 [molCO∙mol−1CO2]0.800.640.550.470.830.860.91
Disclaimer/Publisher’s Note: The statements, opinions and data contained in all publications are solely those of the individual author(s) and contributor(s) and not of MDPI and/or the editor(s). MDPI and/or the editor(s) disclaim responsibility for any injury to people or property resulting from any ideas, methods, instructions or products referred to in the content.

