

Two-Stage Optimal Scheduling of Highway Self-Consistent Energy System in Western China

1
School of Control and Computer Engineering, North China Electric Power University, Beijing 102206, China
2
China Institute of Energy and Transportation Integrated Development, North China Electric Power University, Beijing 102206, China
3
College of Transportation Science and Engineering, Beihang University, Beijing 100191, China
4
Power China Guizhou Electric Power Engineering Co., Ltd., Guiyang 550081, China
*
Author to whom correspondence should be addressed.
Energies 2023, 16(5), 2435; https://0-doi-org.brum.beds.ac.uk/10.3390/en16052435
Submission received: 17 January 2023
/
Revised: 27 February 2023
/
Accepted: 1 March 2023
/
Published: 3 March 2023
(This article belongs to the Special Issue Research on Operation Optimization of Energy Systems)
Abstract
:Under the background of “carbon peaking and carbon neutrality goals” in China, the Highway Self-Consistent Energy System (HSCES) with renewable energy as the main body has become a key research object. To study the operational status of the HSCES in a specific region and realize the economically optimal operation of the HSCES, an HSCES model in a low-load, abundant-renewable-energy and no-grid scenario is established, and a two-stage optimal scheduling method for the HSCES is proposed. Moreover, in the day-ahead stage, uncertainty optimization scenarios are generated by Latin hypercube sampling, and a definition of the self-consistent coefficient is proposed, which is used as one of the constraints to establish a day-ahead economic optimal scheduling model. Through the case comparison analysis, the validity of the day-ahead scheduling model is confirmed and the optimal day-ahead scheduling plan is attained. Furthermore, in the intra-day stage, an intra-day rolling optimization method is proposed, which can effectively track the day-ahead scheduling plan and reduce the impact of forecast errors and energy fluctuations by coordinating the unit output within the HSCES system. It is verified that the HSCES can operate economically and safely in Western China, and self-consistently, without grid support.
1. Introduction
Under the guidance of the “carbon peaking and carbon neutrality goals” [1], the deep integration of transportation and energy has become an important research direction. Some scholars have conducted research on the application of renewable energy in transportation systems [2,3,4]. In [2], the current status of integrated applications in the field of solar power transportation is reviewed and its development prospects are analyzed. In [3], a spatiotemporal model is developed to assess PV power potential on highways in China. In [4], a comprehensive review of solar pavement research is undertaken and the feasibility of the technology is discussed. Although the above-mentioned research provides some guidance for assessing the potential of renewable energy applications in transportation, the information interaction between renewable energy and transportation loads that has not been considered makes it difficult to determine whether the road transport system can be self-sufficient after using renewable energy along the road. Therefore, it is necessary to construct a new Highway Self-Consistent Energy System (HSCES). The HSCES is mainly divided into two operating modes: islanded operation and grid-connected operation. The islanded operation HSCES is mainly applied to areas with low traffic loads, abundant renewable energy resources and no power grid, such as in Western China. In order to study the development mode and operation status of an islanded operation HSCES, it is necessary to model the components of the HSCES and develop an optimal scheduling scheme to explore whether the HSCES can operate safely and stably, which is crucial to promote the deep integration of renewable energy and road transportation and provide a reference for the future development of green intelligent transportation.
The islanded operation HSCES can be regarded as an island microgrid system. There has been much research on the optimal scheduling of islanded microgrids [5,6,7,8,9,10,11,12,13,14,15,16]. In [5], a microgrid optimal scheduling method based on information gap decision theory and network reconfiguration in grid-connected and siloed mode is proposed. In [7], a new islanded microgrid day-ahead scheduling model is proposed, which adopts a data-driven method. In [8], the optimized design of an islanded microgrid under four dispatch controls is assessed. In [10], islanded microgrid optimal scheduling methods with different load distribution strategies are evaluated. In [11], two optimized islanded microgrid systems are designed and multiple load scheduling strategies are compared to find the optimal strategy. In [12], an improved three-stage scheduling method is proposed to realize real-time scheduling of islanded microgrids. In [16], a reconfigurable microgrid scheduling optimization strategy considering the islanding capacity constraint is proposed. The above-mentioned studies have made certain achievements in the model, strategy and solution method of optimal scheduling of islanded microgrids, which can provide theoretical reference significance for the HSCES.
Due to the uncertainty of energy influence and forecast errors, it is necessary to make optimal decisions under uncertainty to ensure the stable operation of HSCES [17]. At present, uncertain optimal scheduling mainly adopts two methods: stochastic optimization and robust optimization [18]. Stochastic optimization can fit uncertain data through discrete distribution models and transform uncertain problems into deterministic problems through scenario generation [19,20,21]. In addition, robust optimization is used to build the uncertainty set and optimize in the worst case in the set [22,23,24].
Based on the uncertainty optimization research, in order to further reduce the influence of energy fluctuations, improve the optimization control accuracy and further improve the stability of system operation, the multi-time scale optimal scheduling strategy is widely used [18,25,26,27,28,29,30]. In [18], a two-time scale scheduling strategy that considers multiple uncertainties and disaster recovery is proposed. In [25], a multi-time scale optimal scheduling model for the regionally integrated energy system is proposed, which considers demand response. In [26], robust optimization and model predictive control methods are used to solve a multi-time scale optimal scheduling problem. In [27], a multi-time scale optimal scheduling framework combining stochastic and robust optimization methods is designed. In [28], a multi-time scale dynamic robust optimization method for a specific microgrid is presented. In [29], to realize the flexible scheduling of the integrated energy system, a new multi-time scale optimal scheduling method is promoted. In [30], a multi-time scale coordinated optimal scheduling model considering frequency overrun intervals and demand response is introduced.
The multi-time scale optimization models, strategies and methods mentioned in the above studies have been verified as effective, which provides a theoretical research basis for HSCES two-stage optimal scheduling.
Since HSCES has special spatial and temporal distribution characteristics and operational features, the current study can only provide a limited reference value for the optimal scheduling of HSCES. At present, there is a shortage of research on the HSCES model and there is almost no research on the specific optimal scheduling strategy for the HSCES. As a result, it is crucial to fill the existing research gap by studying whether the HSCES can achieve economic and stable operation under specific conditions. Therefore, based on the existing research, a two-stage optimal scheduling model of the HSCES is proposed in this paper. In the day-ahead stage, Latin hypercube sampling is used for uncertainty optimization, a definition of the self-consistent coefficient is proposed, self-consistent rate constraints are added for day-ahead economic stochastic optimal scheduling, and the validity of the proposed model is verified through case comparison analysis. In the intra-day stage, a rolling optimization model is proposed, and the effectiveness and advantages of intra-day rolling optimization are verified through case analysis. The two-stage optimal scheduling study is used to explore whether the HSCES can operate self-consistently in Western China. The main contributions of this study are summarized as follows:
- A novel highway self-consistent energy system is proposed. It has been verified that the system can operate stably in areas with low-traffic loads, abundant renewable energy resources and no power grid, such as Western China.
- A two-stage optimal scheduling strategy is proposed, which includes day-ahead stochastic optimization and intra-day rolling optimization. Latin hypercube sampling, which can reduce the impact of uncertainty, is proposed for the generation of typical scenarios. Furthermore, the intra-day rolling optimization is applied to improve the scheduling accuracy. The advantages of the day-ahead and intra-day optimal strategies introduced in this paper are verified through case analysis.
- A definition of the self-consistent coefficient is proposed firstly, which plays a crucial role in day-ahead optimal scheduling. Through a comparable analysis, the necessity for self-consistency of a critical constraint in HSCES day-ahead scheduling is affirmed.
2. HSCES Model
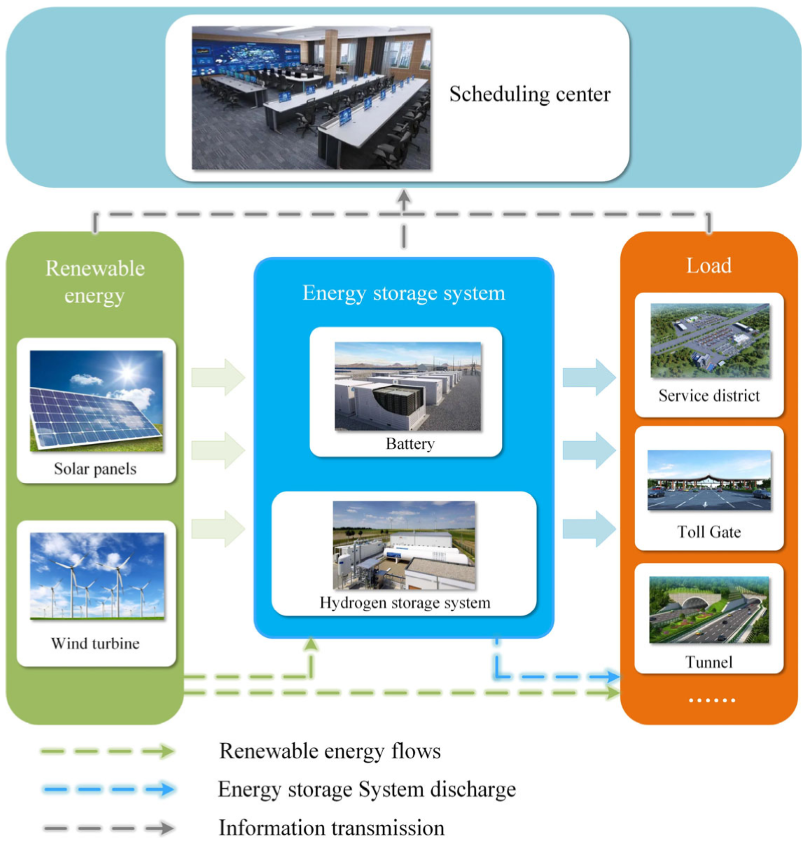
The HSCES is composed of a distributed power generation system, energy storage system, highway infrastructure and dispatching center. The HSCES structure is shown in Figure 1. The distributed power generation system includes a photovoltaic and wind power system. This system harnesses the abundant renewable energy in Western China through the distributed solar panels and wind turbines along the highway and supplies sufficient power for the HSCES. Service districts, toll gates, tunnels and other highway infrastructure are the main energy consumers in the HSCES. On the energy storage side, the battery and hydrogen system are chosen for energy management. Due to the special spatial distribution characteristics of the highway, it is necessary to consider the impact of geographic location changes on the generation side. Moreover, since the HSCES does not use a diesel generator for backup power generation, the requirement for system self-sufficiency ought to be very strict. Detailed models of the HSCES are introduced below.
2.1. Distributed Energy Model
2.1.1. Photovoltaic Power Generation
The output of a photovoltaic power generation system has certain fluctuation and regularity, which is mainly affected by the location, solar radiation intensity, ambient temperature and other factors, which can be expressed as [21]:
where is the rated power of the photovoltaic array. is the hourly mean value of surface solar radiation intensity at time t in the photovoltaic area, , m and d are the latitude, month and day. is the standard light intensity and is the power temperature coefficient of the photovoltaic array. T is the actual temperature of the photovoltaic array. is the reference temperature of the photovoltaic array.
2.1.2. Wind Power Generation
The wind turbine output is mainly influenced by the power output curve of the unit, the height of the fan hub and the wind speed of the hub height, which can be expressed as [31]:
where is the output power of the wind turbine and S is the actual wind speed of the wind turbine at the wheel height. is the cut-in wind speed, is the cut-out wind speed and is the rated wind speed of the wind turbine. is the rated power.
2.2. Battery Model
To ensure the safe and stable operation of the HSCES, the battery plays an important role in the whole system. In order to protect the battery and avoid excessive discharge, a certain margin will be left during discharge, so that the battery can work in a stable state for a long time. When the remaining power of the battery reaches 10% of the rated capacity, the battery will stop discharging.
The charging and discharging model of the battery is as follows [30]:
where and are the state of charge. and are the battery charging and discharging efficiencies. and are the battery charge and discharge power. is the battery’s rated capacity.
2.3. Hydrogen Energy System Model
The hydrogen energy system consists of electrolytic cells, hydrogen storage tanks, and hydrogen fuel cells. Excess renewable energy can be used to generate high-purity hydrogen in the electrolytic cell, which is stored in the hydrogen storage tank. When the supply of renewable energy is insufficient, hydrogen fuel cells can provide backup power. Adding the hydrogen energy system can further reduce the abandonment rate of renewable energy and provide energy reserves for the HSCES, which is of great significance to improve the robustness, security and stability of the system.
2.3.1. Electrolytic Cell Model
The electrolytic cell can use electricity to produce high-purity hydrogen by electrolyzing water. The simplified model of the electrolytic cell model can be expressed as [32]:
where is the volume of hydrogen produced by the electrolytic cell, is the electrolytic efficiency and is the input power of the electrolytic cell.
2.3.2. Hydrogen Storage Tank
The hydrogen storage tank model can be expressed as [33]:
where and are the capacity of hydrogen storage tank at time t and t − 1. and are the hydrogen storage and hydrogen release efficiency. and are the hydrogen storage and hydrogen release power at time t.
2.3.3. Hydrogen Fuel Cell
The hydrogen fuel cells consume hydrogen to generate electricity, which can be expressed as [34]:
where is the output power for the fuel cell. is the energy conversion efficiency. is the volume of hydrogen consumed. is the molar mass of hydrogen. is a conversion constant.
3. Two-Stage Optimal Scheduling Model of the HSCES
To improve the economy and stability of the HSCES in actual operation, cope with the renewable energy and load fluctuations in different time scales, coordinate the output of each unit of the system and reduce the impact of the randomness and fluctuation, this paper constructs a two-stage HSCES optimal scheduling model that includes day-ahead long-time scheduling and intra-day short-time scheduling.
3.1. Day-Ahead Long-Time Scale Scheduling
In the day-ahead stage, according to the characteristics of the HSCES, the concept of the self-consistent rate is put forward. Taking the lowest system operation cost as the objective function, an economic optimal scheduling model is built based on the traditional optimal scheduling model, which takes the self-consistent rate constraint into account.
Due to the randomness and volatility of wind and photovoltaic systems, it is difficult to accurately predict the output of the photovoltaic array and wind turbines. In order to reduce the uncertain impact of wind and photovoltaic systems, this paper adopts a stochastic optimization method based on scenario sampling.
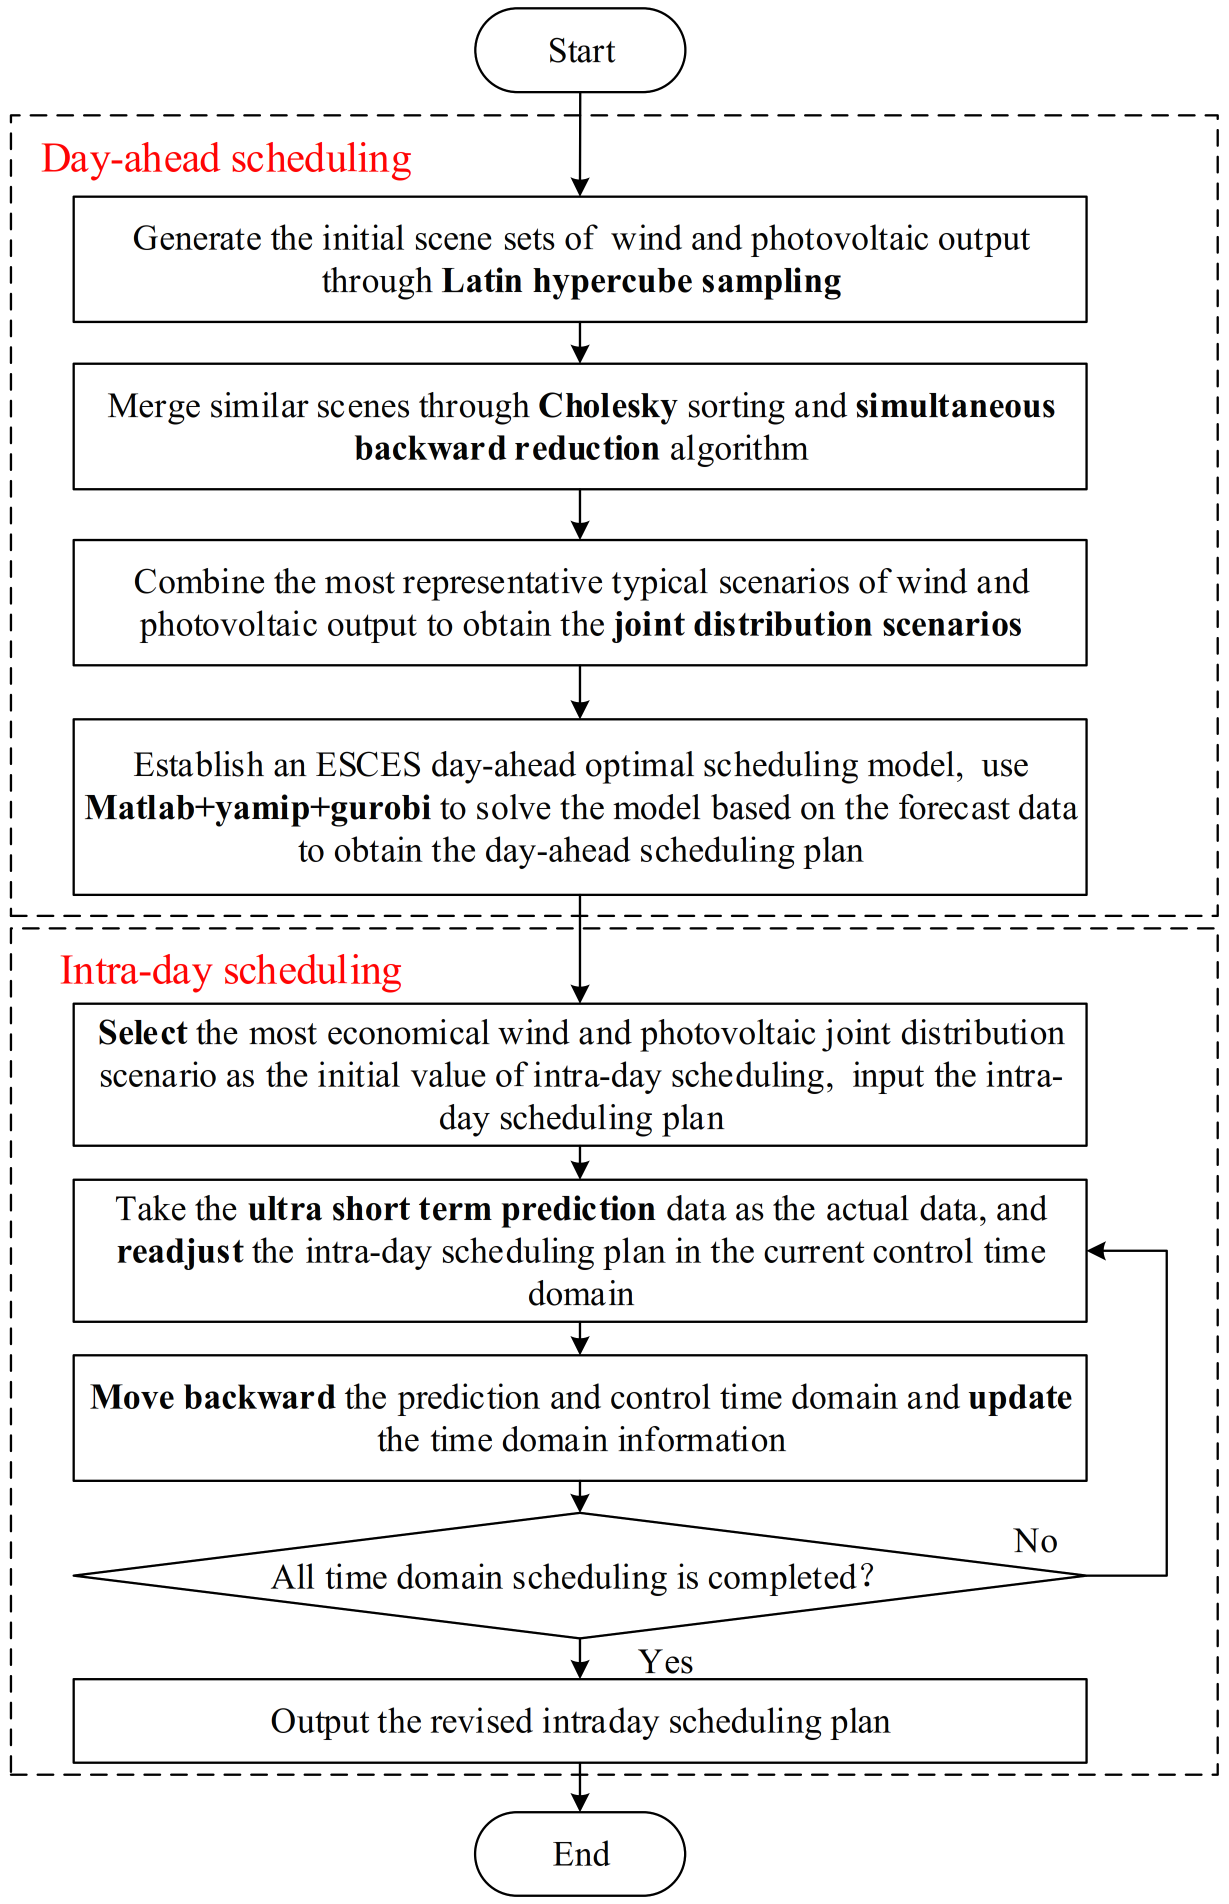
First, the scene sets of wind power and photovoltaic power are obtained through Latin hypercube sampling. Similar scenes are then merged through Cholesky sorting and a simultaneous backward reduction algorithm. Finally, the most representative typical scenes are obtained. Refer to [35] for relevant algorithm steps.
3.1.1. Objective Function
The lowest overall operating cost is considered as the HSCES day-ahead optimal scheduling objective function, which can be expressed as:
where is the total cost of system operation. , , and are the operation and maintenance costs of the wind turbines, photovoltaic units, batteries and hydrogen, respectively. , , , can be expressed as follows:
where , , , and are the cost coefficients of wind turbines, photovoltaic units, batteries, electrolytic cell and hydrogen fuel cell output per unit power. , , and are the charging and discharging power of the wind turbines, photovoltaic units and batteries at time t. and are the power of the electrolytic cell and hydrogen fuel cell at time t. The i is the unit number.
3.1.2. Constraints
- (1)
- Power Balance Constraints
To meet the system load demand, power demand and supply are balanced in real time:
where , , , are the supply side power for energy at time t, is the load at time t, is the input power of the electrolytic cell at time t, is the charging power of the battery at time t and / are the state variables of battery charging and discharging at time t.
- (2)
- Wind and Photovoltaic Power Generation Constraints
The output of wind turbines and photovoltaic units comply with the following limits:
where and are the output of wind turbines and photovoltaic units at time t and / and / are the upper/lower limits of the output of wind turbines and photovoltaic units.
- (3)
- Battery Constraints
Relevant parameters of the battery comply with the following limits:
where / are the state variables of battery charging and discharging at time t, which is set for preventing the simultaneous charging and discharging of the battery. and are the charging and discharging power of the battery at time t. and are the upper and lower limits of charging power. and are the upper and lower limits of discharge power. and are the lower upper and lower limits of the battery’s state of charge. and are the initial state and end state of the battery charge.
- (4)
- Hydrogen Energy System Constraints
Relevant parameters of the hydrogen energy system comply with the following limits:
where / are the state variables of the hydrogen fuel cell/electrolytic cell at time t, which is set for preventing the electrolytic cell and fuel cell from operating simultaneously. , and are the output power of the hydrogen fuel cell, input power of the electrolytic cell and capacity of the hydrogen storage tank at time t. /, / and / are the upper/lower limits of the output power of the hydrogen fuel cell, the input power of the electrolytic cell and the capacity of the hydrogen storage tank.
- (5)
- Self-Consistent Rate Constraints
The system can only rely on wind power generation and energy storage to maintain the operation of the system at night because of the power generation characteristics of photovoltaic panels. In addition, objective factors, such as the upper limit of energy storage capacity, energy conversion efficiency and the volatility of renewable energy power generation, may cause an energy supply emergency and put the system into an unstable situation. To avoid this situation, we constrain the self-consistency rate of the system. We use the following formula to calculate the self-consistent coefficient , which can represent the self-consistency rate of the system:
where is the sum of wind turbine and photovoltaic unit output at time t. is the load at time t. and are the system state variables, which can be expressed as:
The is the energy conversion coefficient, which is determined by the operating state of the system. It can be expressed as:
where and are the energy conversion efficiency of the hydrogen energy storage system and the battery.
The larger the , the higher the self-consistency rate of the system. An excessively high self-consistent rate will cause a waste of wind and photovoltaic resources; however, when the self-consistent rate is excessively low, it will increase the security risks in the system and drive a further demand on the standby energy of the system, which will increase the cost. Therefore, we apply the following constraints:
3.2. Intra-Day Short-Time Scheduling
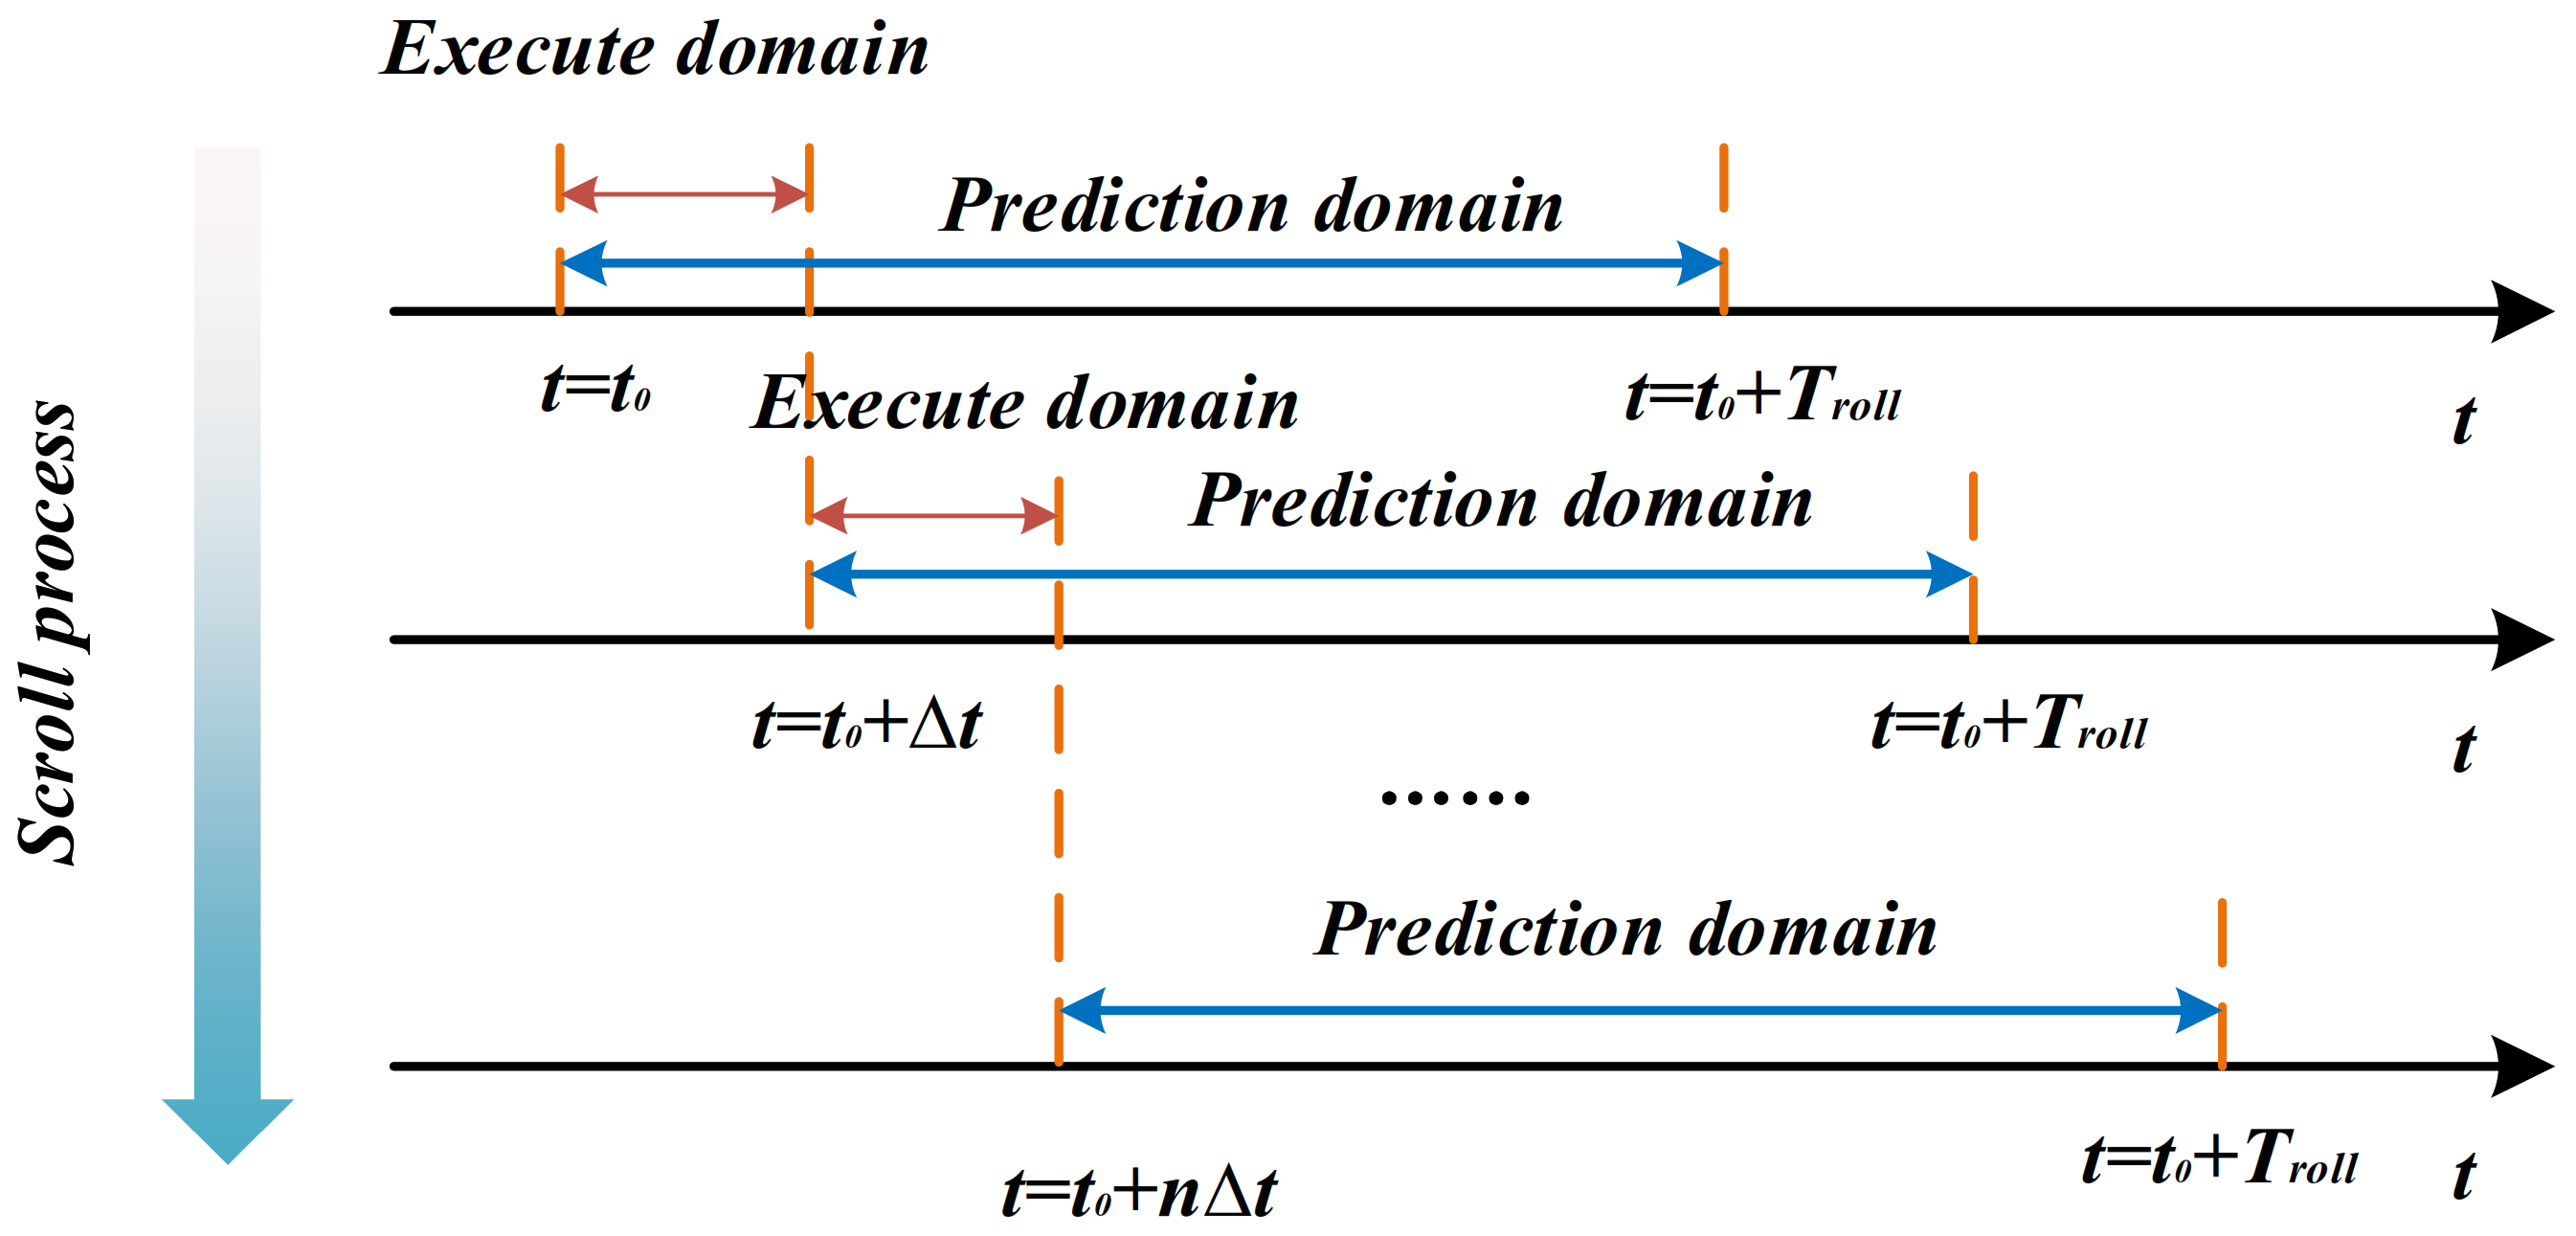
Due to the uncertainty of renewable energy and the fluctuation of load, the day-ahead scheduling may have a large forecast error. To reduce the impact of day-ahead wind and photovoltaic output forecast errors and load fluctuations, and to improve operational control accuracy, an intra-day rolling optimal scheduling model is proposed. In the intra-day stage, the short-term forecast data will be updated in the prediction time domain and transmitted to the control time domain as real data. Then the prediction time domain and control time domain continue to move backward. The system scheduling plan will be dynamically updated according to the current actual state of the system until all-time domain scheduling is completed [27,28,29]. The rolling optimization process is shown in Figure 2.
3.2.1. Objective Function
The objective function of the intra-day scheduling only considers the scheduling plan in the scheduling time domain and adds the penalty cost of equipment startup and shutdown. It can be expressed as:
where is the total cost of system operation in the intra-day stage. is the initial scheduling time. is the scheduling cycle. is the penalty cost, which is caused by the deviation between the day-ahead forecast data and the actual data. can be expressed as follows:
where is the penalty cost coefficient. and are the real-time power of battery charging and discharging at time t. and are the real-time power of the electrolytic cell and hydrogen fuel cell at time t.
3.2.2. Constraints
In the intra-day stage, the corrected system shall meet the power balance constraints:
In addition, in each scheduling time domain, the system still needs to meet all constraints of the day-ahead stage.
4. Two-Time Scale Scheduling Solving Process
The whole solving process is shown in Figure 3.
5. Case Analysis
To verify the effectiveness of the model and algorithm, this paper selects a typical highway section in Western China and a typical day in summer for case analysis. It takes the average solar radiation intensity, average temperature, average wind speed, load aggregation scenarios and other relevant data of this section as the initial data. The relevant data are all from local measurements and the literature [36].
This paper uses MATLAB for modeling and simulation, and the Yalmip toolbox and Gurobi solver in MATLAB for the optimal scheduling model. It is assumed in this paper that the total duration of day-ahead scheduling is 24 h, the time interval is 1 h, the intra-day scheduling time interval is 15 min and the control time domain is 1 h.
5.1. Scenario Simulation
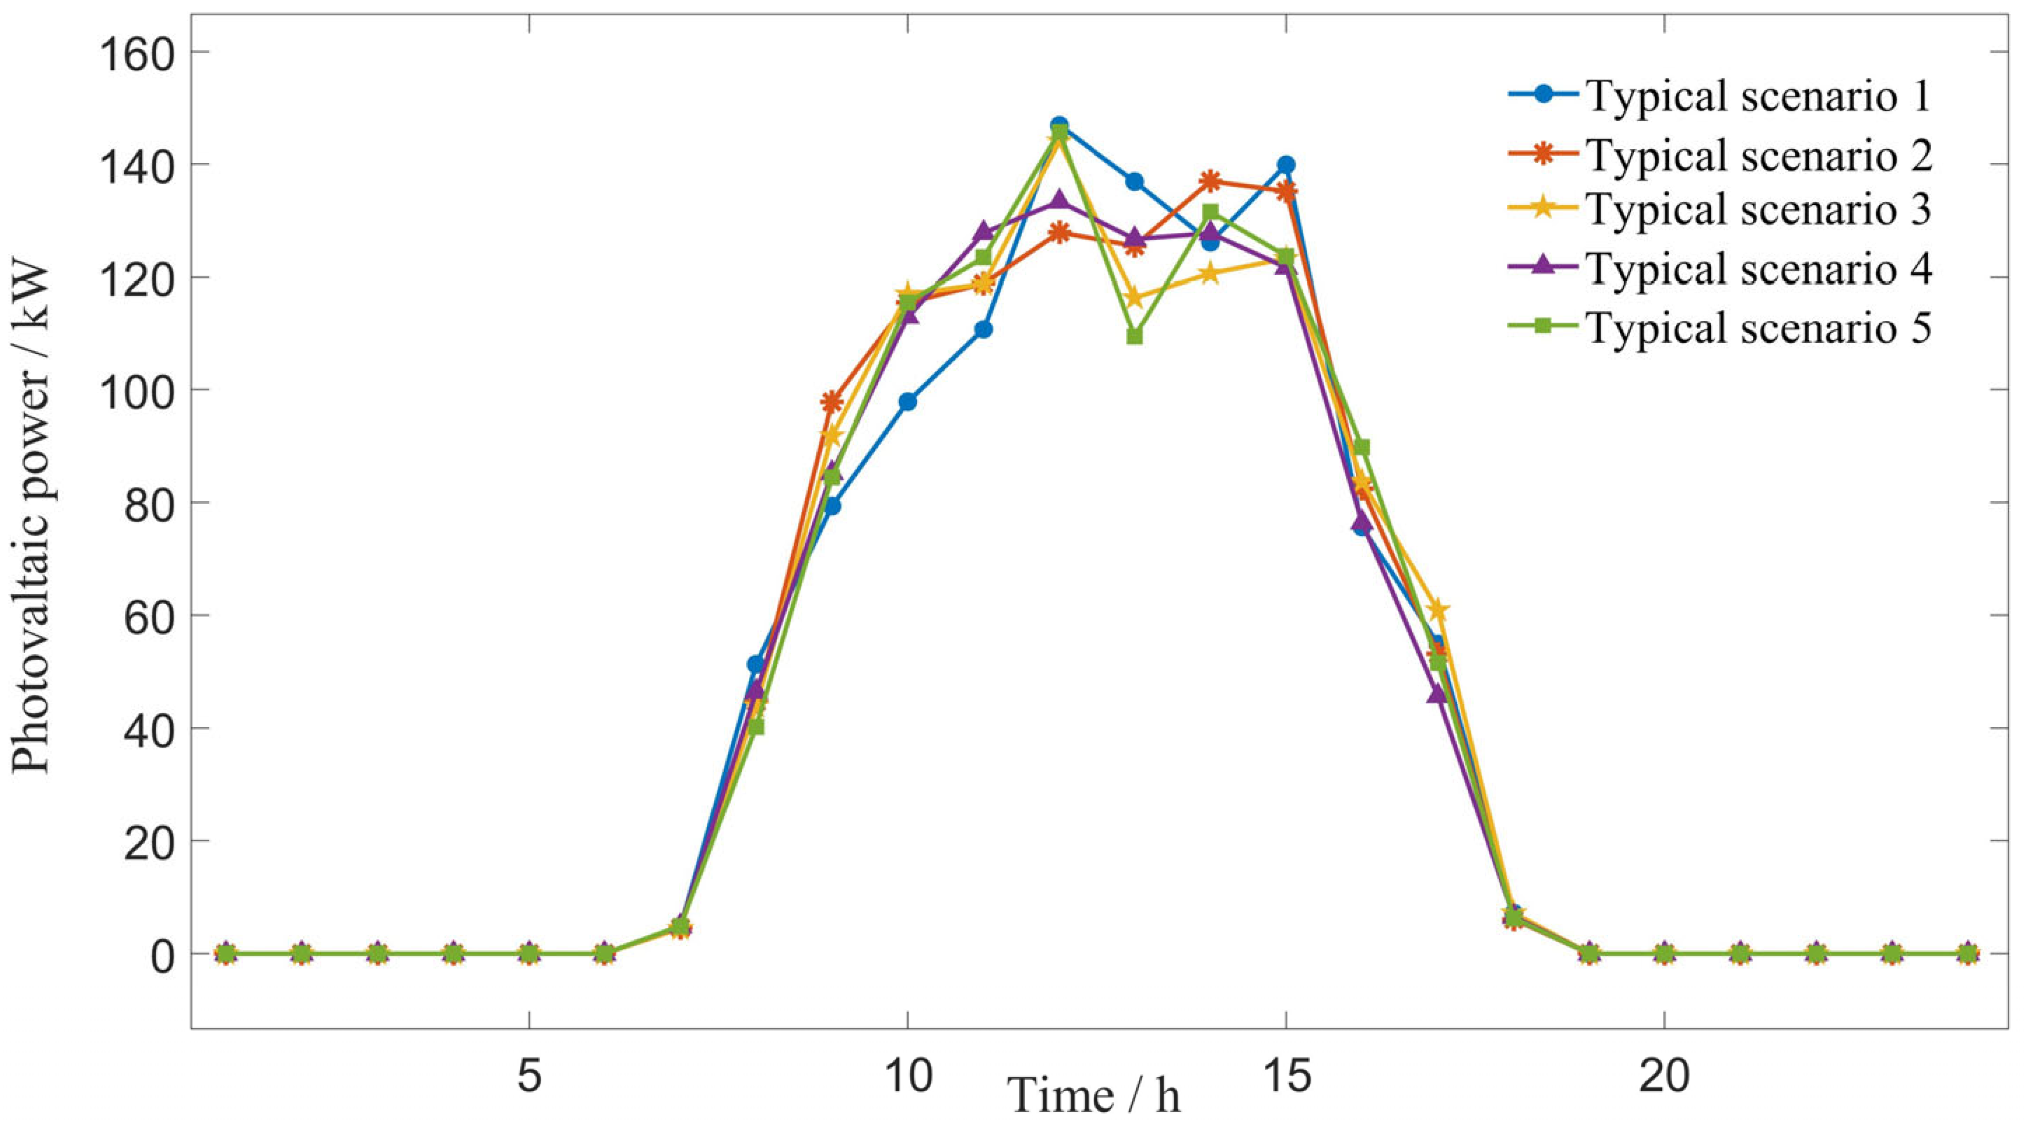
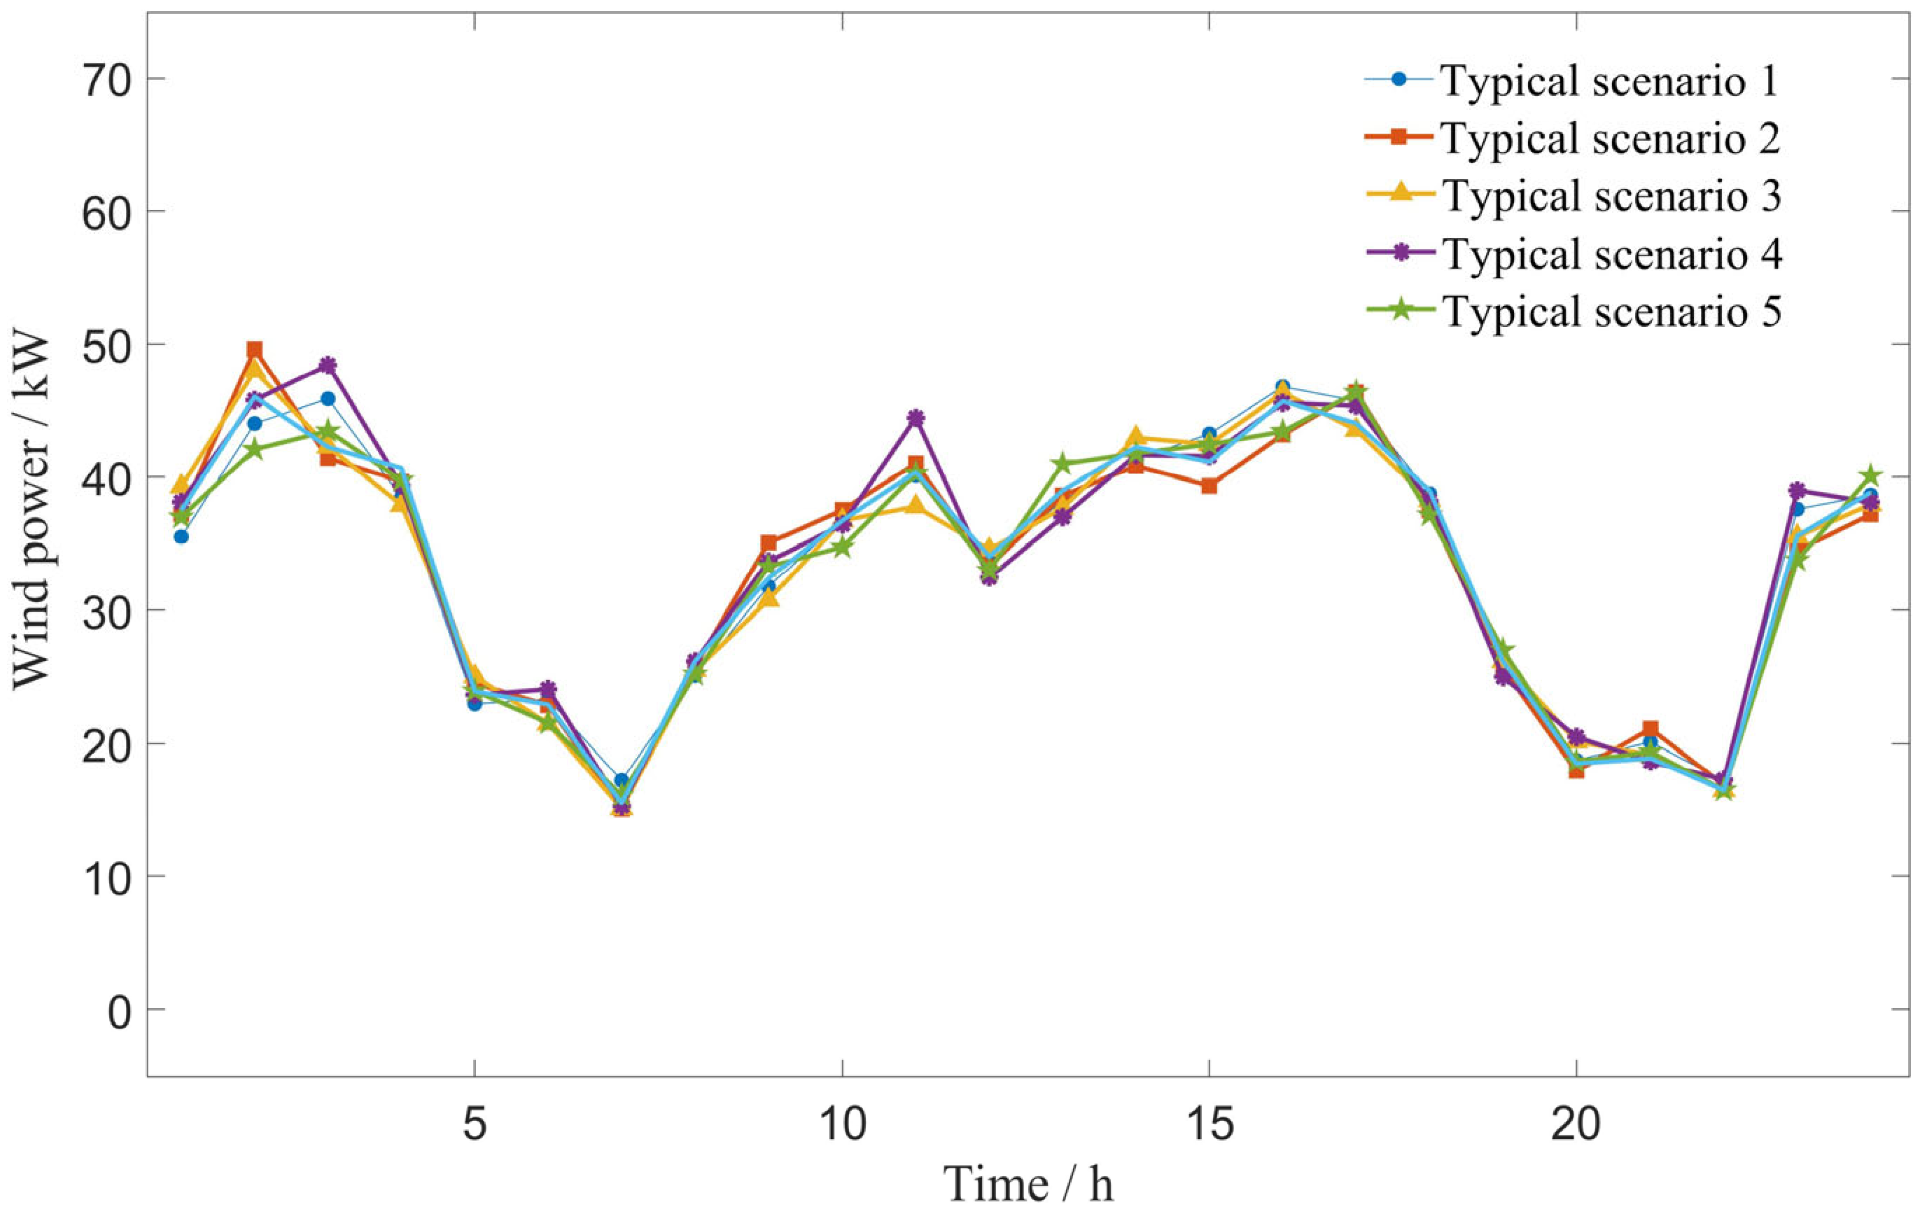
In this paper, 1000 initial scenarios are generated by the Latin hypercube sampling method based on the data of a typical summer day, in which the relative errors of wind and photovoltaic systems are set to 15% and 20%, respectively. Furthermore, to obtain typical scenarios, the wind and photovoltaic output scenarios are reduced to five typical scenarios through Cholesky sorting and a simultaneous backward reduction algorithm. The typical scenarios of wind and photovoltaic systems are pictured in Figure 4 and Figure 5.
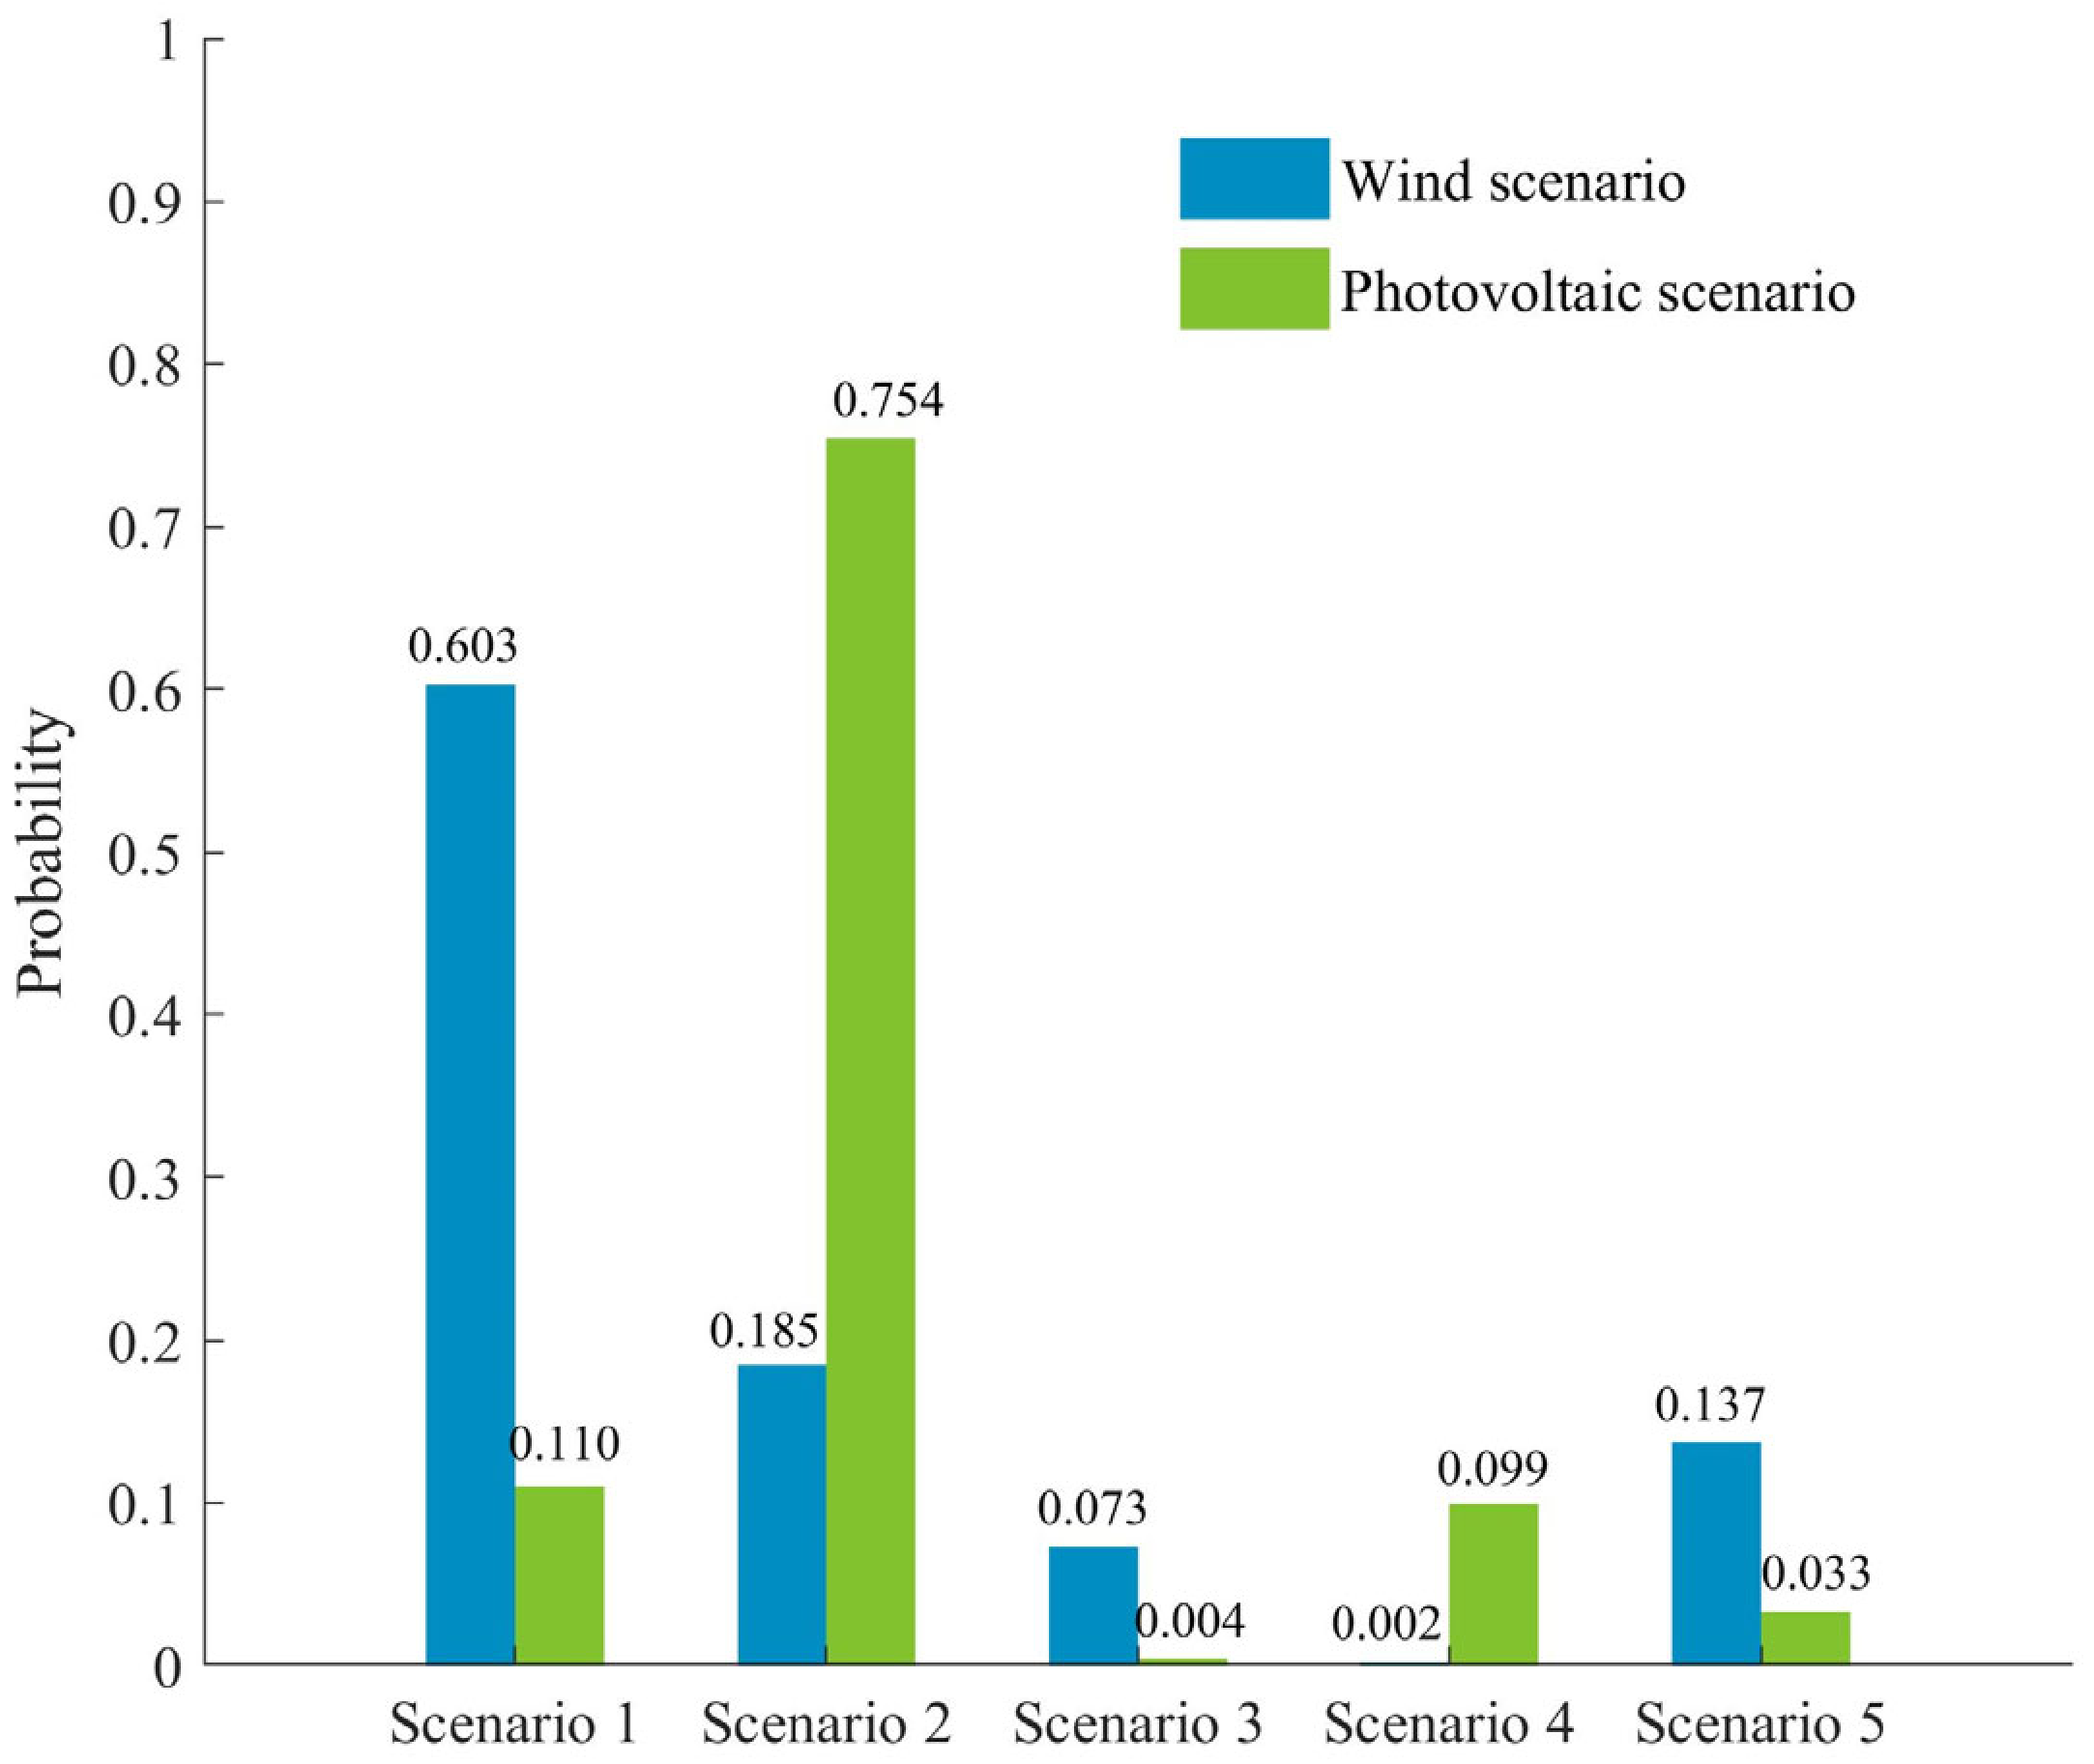
The probabilities of each typical scenario are presented in Figure 6. In the typical scenario sets of wind and photovoltaic output, both Scenario 1 and Scenario 2 have the highest probability of wind and photovoltaic output scenarios.
Therefore, Scenario 1 of wind output and Scenario 2 of photovoltaic output are selected for this paper. Figure 7 represents a joint distribution scenario of these two scenarios after combining with the historical 24 h average load data of the highway. Based on the joint distribution scenario, we can conduct the day-ahead stochastic optimal scheduling.
5.2. Parameters
The other relevant parameters of the HSCES model are shown in Table 1.
5.3. Result Analysis and Discussion
5.3.1. Day-Ahead Optimal Scheduling Result Analysis
To verify the effectiveness of the proposed day-ahead optimal scheduling strategy for the HSCES, the following test scheme is established:
Case 1: The self-consistent rate constraint of the system is not considered. On the energy storage side, only the battery is used for energy management.
Case 2: The self-consistent rate constraint of the system is not considered. On the energy storage side, the battery and hydrogen energy storage system jointly participate in energy management.
Case 3: The self-consistent rate constraint of the system is considered. On the energy storage side, the battery and hydrogen energy storage system jointly participate in energy management.
Total cost, penalty power and resource abandonment are three indicators that we used for comparison and verification. Penalty power is the lacking power when the system is short of power supply. Resource abandonment is the renewable energy that cannot be consumed due to the capacity limitation of the energy storage system. Total cost consists of the operating cost, the power shortage penalty cost and the resource abandonment penalty cost, which can be expressed as:
where is the system operating cost, is the penalty power, is the amount of resource abandonment, is the power shortage penalty coefficient and is the resource abandonment penalty coefficient. Since power shortage is more unacceptable than resource waste, the values of and are set as 5.0 and 1.0.
The results of the three cases are shown in Table 2.
In Case 1, energy management is performed by the battery only. The system cannot fully utilize renewable energy because of the limits of the battery capacity, and the shortage of power supply in the system also prevents the system from a safe and stable operation.
In Case 2, owing to the addition of the hydrogen storage system, which can cooperate with the battery for energy storage and distribution, the system can fully utilize renewable energy and operate normally in Case 2. However, there is still a small amount of renewable energy abandonment in Case 2.
In Case 3, after considering the self-consistent rate constraint, the HSCES system can fully utilize renewable energy and has a lower total cost of ownership.
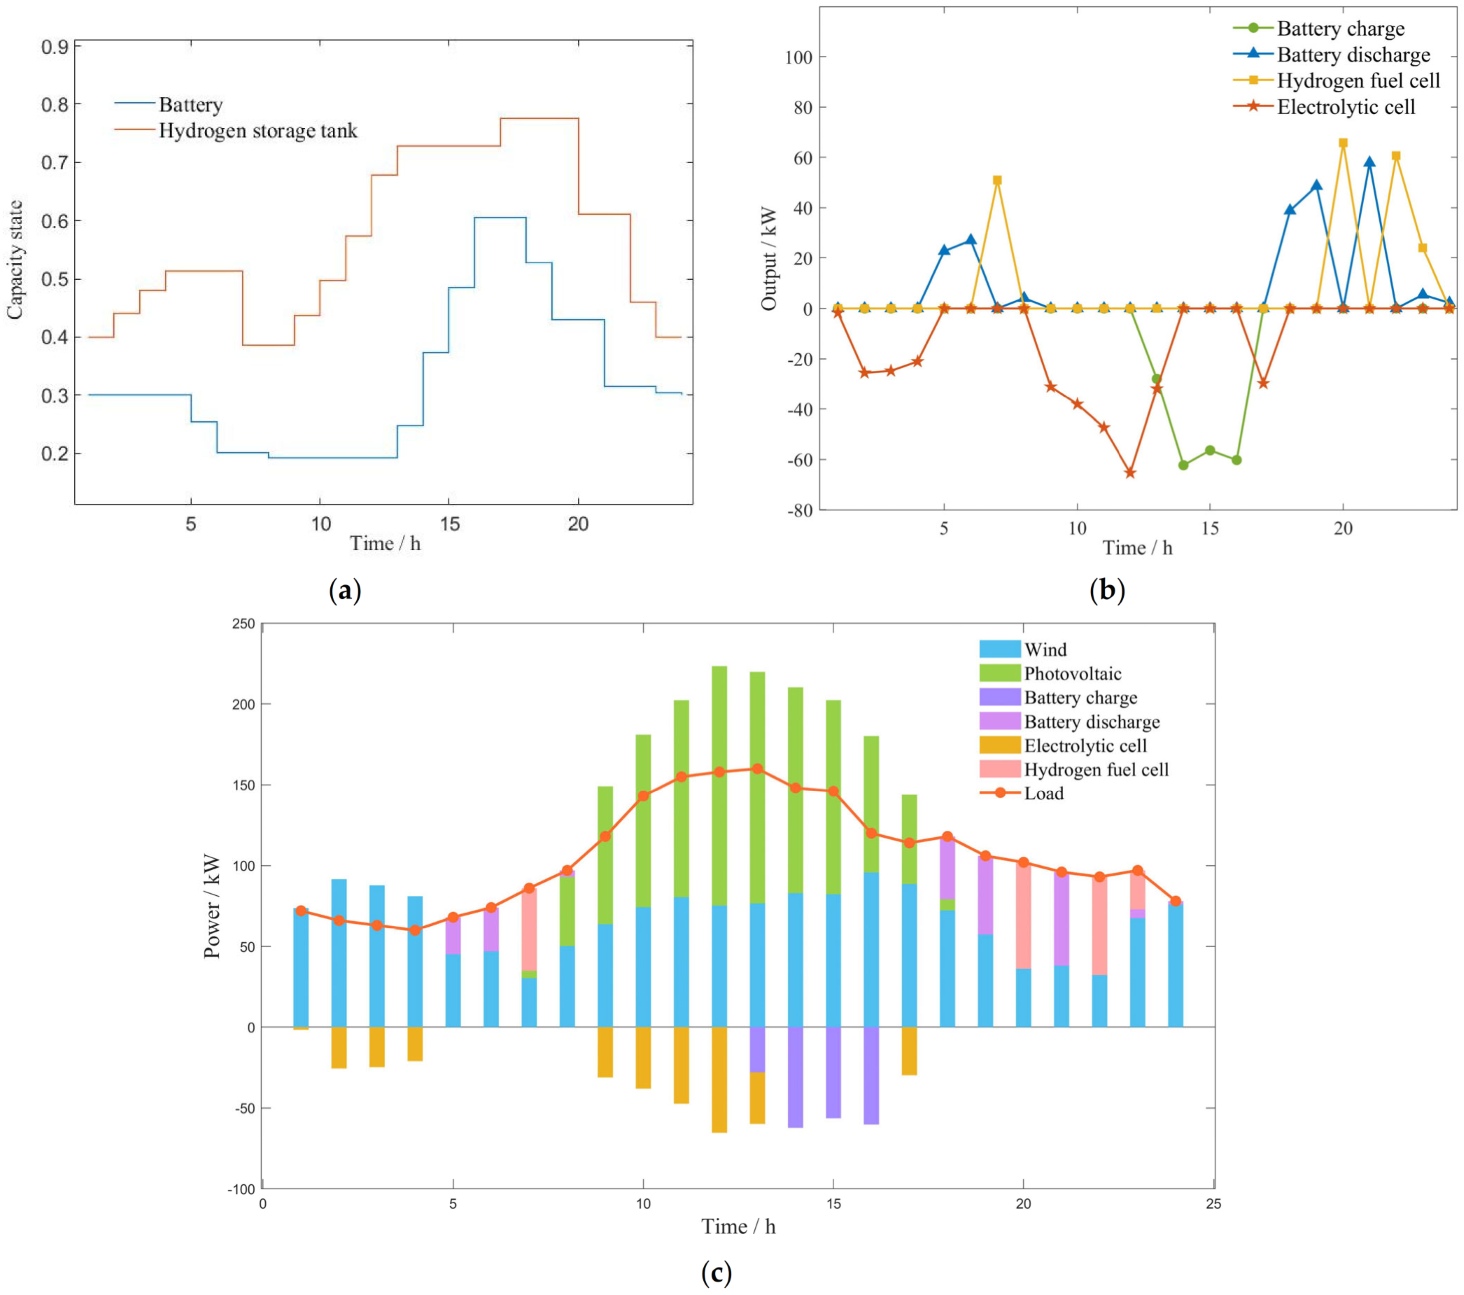
As a result, the HSCES system can operate stably and economically under the optimal day-ahead scheduling scheme proposed in this paper. The day-ahead optimal scheduling results under this scenario are shown in Figure 8.
As shown in Figure 8, at 01:00–04:00, the HSCES system is maintained by wind power only, and the excess wind power is used to produce hydrogen from the electrolytic cell. At 5:00–07:00, wind power alone cannot meet the load demand of the system, and photovoltaic power generation is low at this time; thus, the batteries and hydrogen fuel cells are needed to work together to make up for the lack of renewable energy. From 9:00 to 17:00, the output of photovoltaic and wind power generation is greater than the load demand of the system, and the battery and electrolytic cell jointly consume the excess renewable energy. From 18:00 to 24:00, due to the low light intensity and the volatility of the wind turbine generator, the wind turbines, photovoltaic units, batteries and hydrogen fuel cells are required to work at the same time to maintain the system’s operation. At 24:00, the hydrogen storage tank and battery charge states return to their initial values in preparation for the next scheduling.
5.3.2. Intra-Day Optimal Scheduling Result Analysis
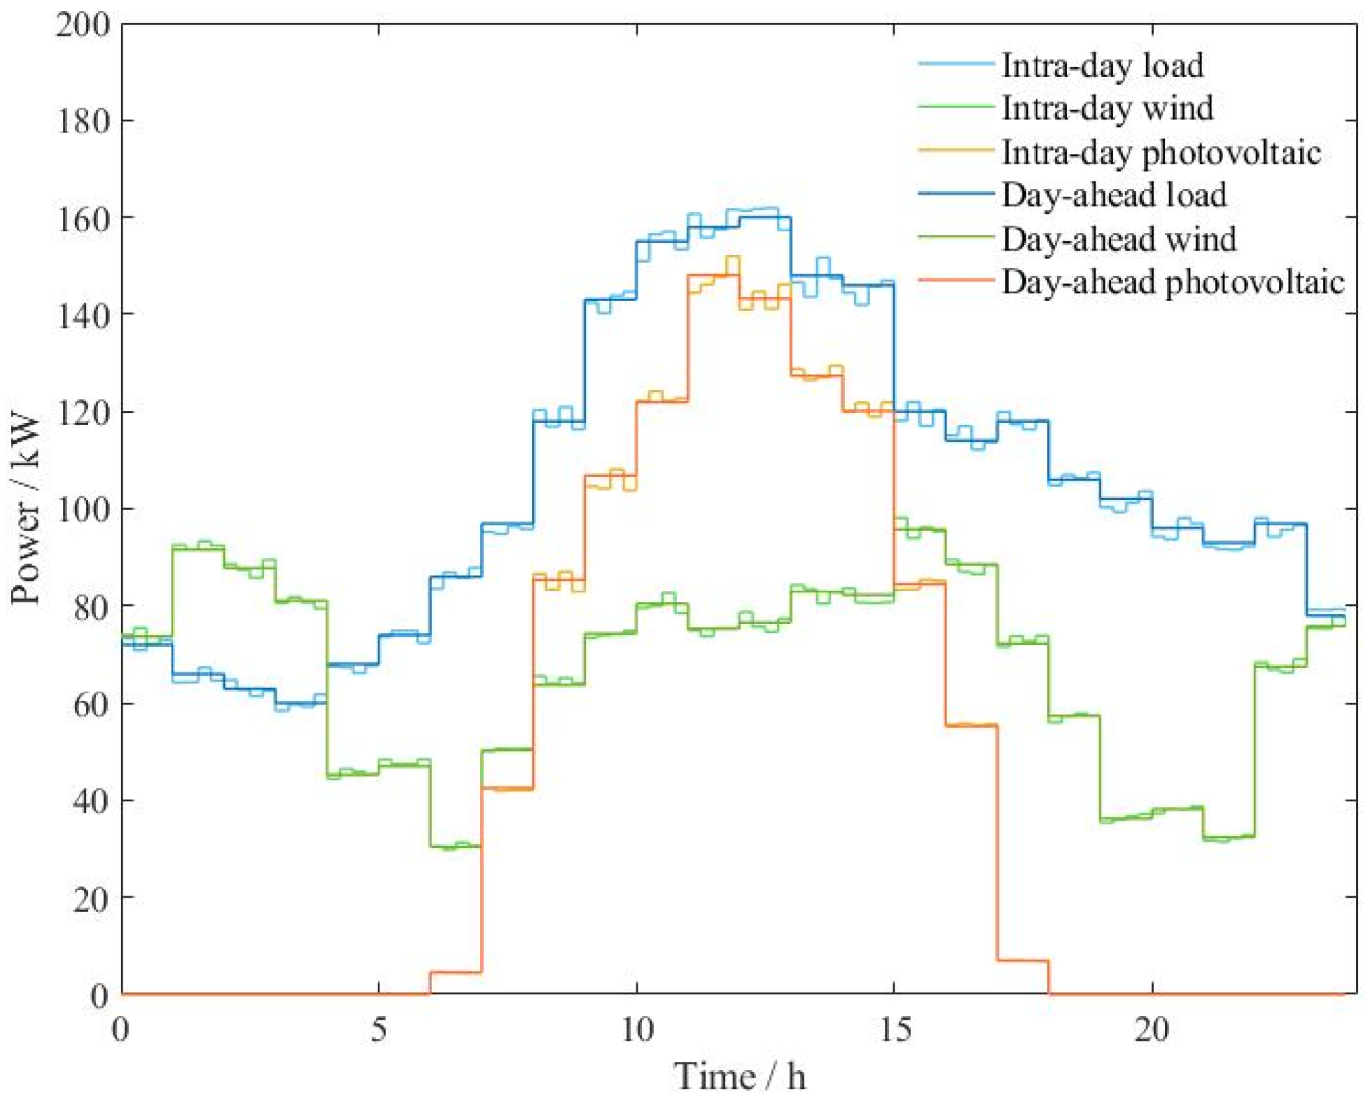
The short-term forecasting is necessary for intra-day rolling scheduling because it can simulate the errors of predicted data and real data. In this paper, a 5% normally distributed error and 1% random error are added to the day-ahead forecast result to obtain the intra-day short-term forecast result, which is shown in Figure 9.
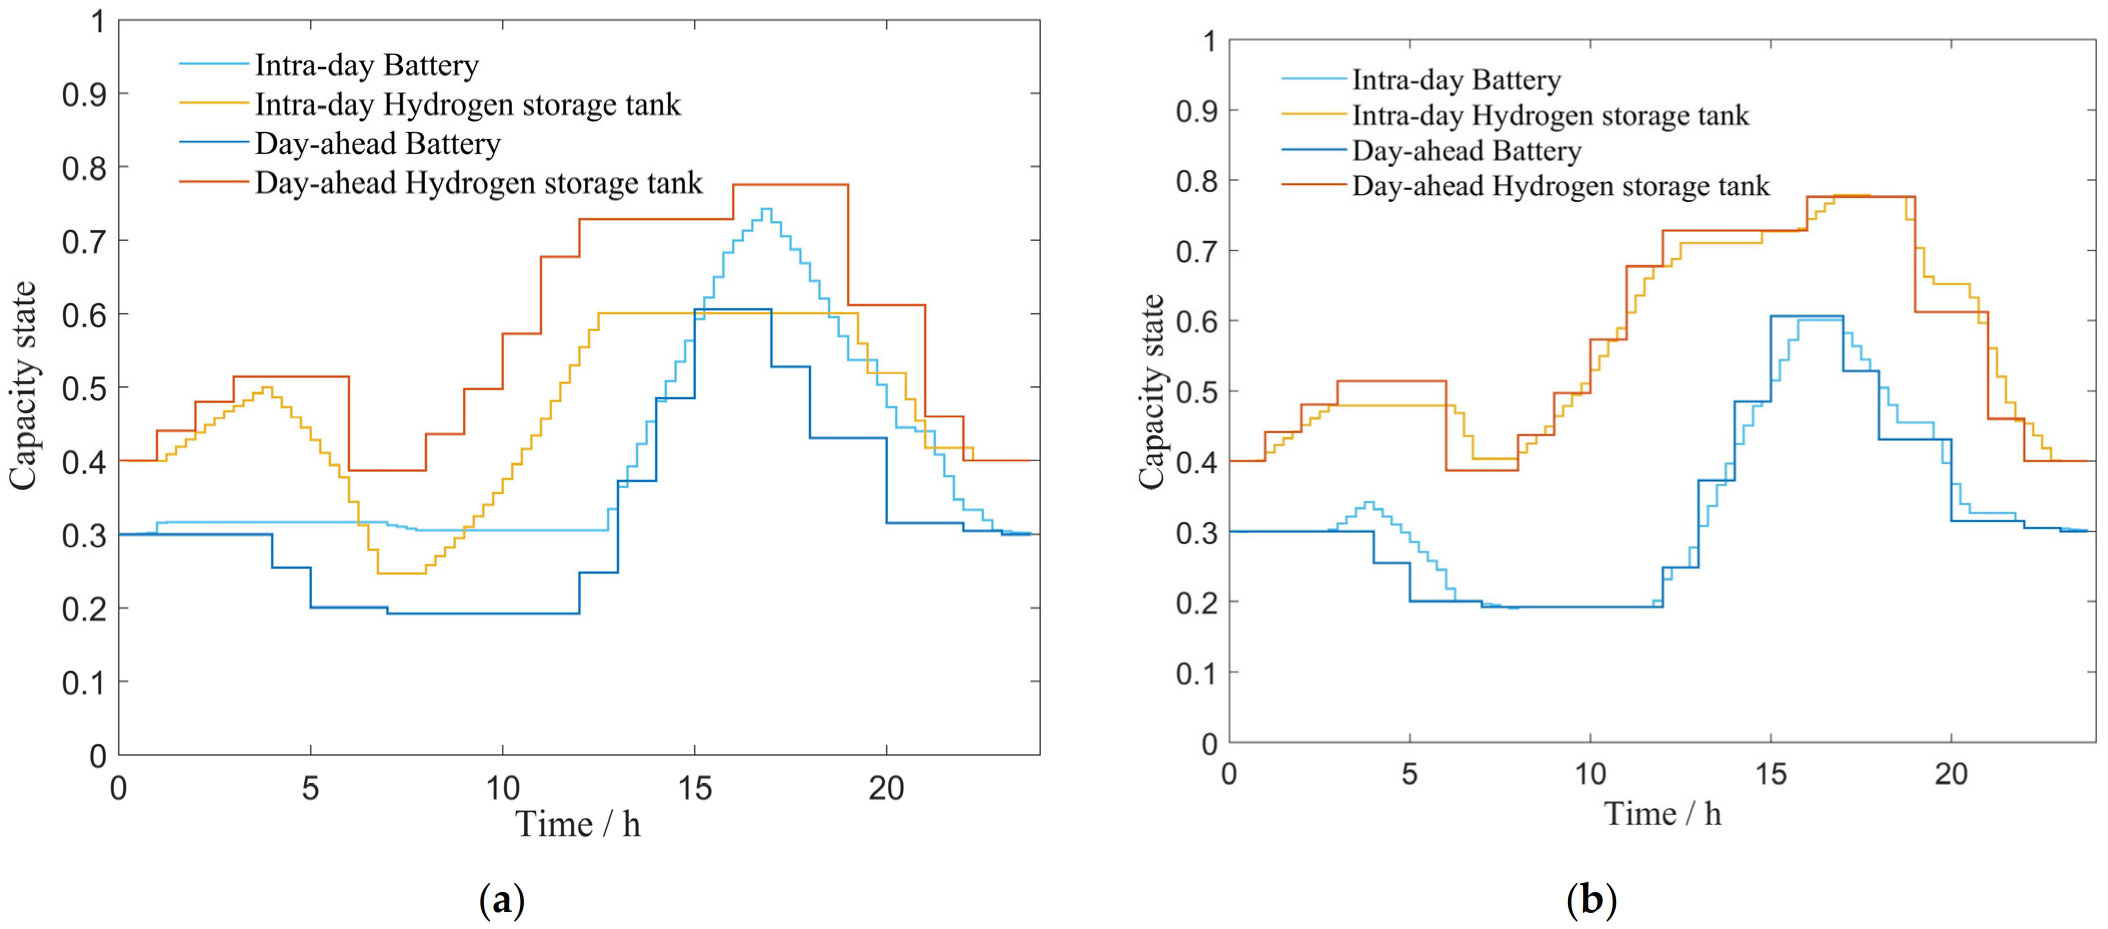
To verify the validity of the proposed intra-day rolling optimization model, two scenarios, without and with rolling optimization, are compared. Figure 10 pictures the capacity states of the energy storage system under the two scenarios areas.
As shown in Figure 10, although the trend of the capacity state of the battery and hydrogen storage system in the intra-day stage is similar to that of the day-ahead stage, the system output has a large deviation from the day-ahead stage without rolling optimization. This indicates that, under the scenario without intra-day rolling optimization, the HSCES is relatively weak in coping with the forecast errors of intra-day renewable energy and load. Under the rolling optimization scenario, the deviations of battery and hydrogen storage system output in the intra-day stage are greatly reduced, and the system is able to reduce the impact of the forecast error by coordinating the battery and hydrogen storage system output in real time, which greatly improves the system’s operational accuracy.
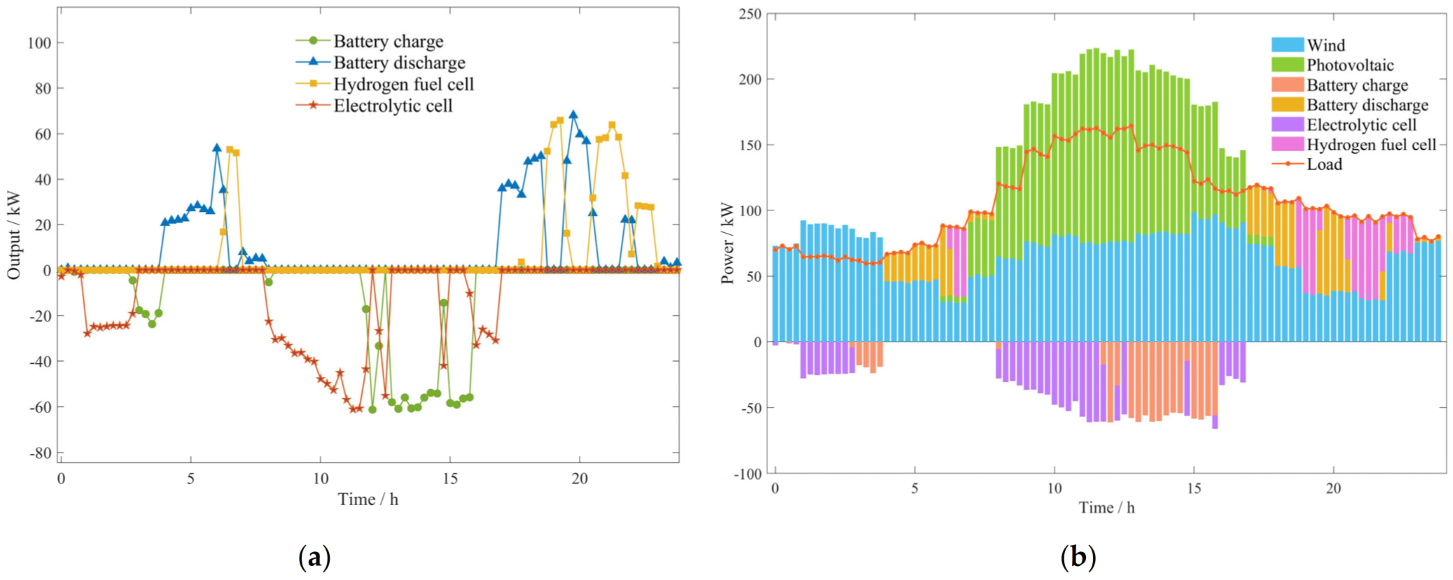
As a result, the HSCES intra-day rolling optimization model can effectively improve the ability to cope with forecast errors in the operational accuracy of the system. The intra-day rolling optimization results are shown in Figure 11.
By comparing Figure 8b and Figure 11a, which are the results of day-ahead optimal scheduling and intra-day optimal scheduling, we can see that intra-day rolling optimal scheduling can track and correct the day-ahead scheduling plan in real time and reduce the impact of renewable energy and load fluctuations on the system by coordinating the output of the battery and hydrogen storage systems. As shown in Figure 10, The HSCES is able to operate self-consistently and stably under the strategy proposed in this paper, which is of great importance to ensure the system is always in optimal operation and to improve the accuracy of optimal scheduling.
6. Conclusions
Based on the new HSCES under the background of “carbon peaking and carbon neutrality goals”, a two-stage optimal scheduling model HSCES is proposed in this paper. In the day-ahead stage, Latin hypercube sampling is used to generate scenarios for uncertainty optimization, a definition of self-consistent rate is proposed and the self-consistent rate constraint is added for day-ahead economic optimization scheduling. Through the case comparison analysis, we can conclude that the system has a lower overall total cost and higher renewable energy utilization after considering the self-consistent rate constraints. In the intra-day stage, a rolling optimization model is constructed. The empirical case studies demonstrate that the use of rolling optimization can improve the ability of the system to handle real-time fluctuations of renewable energy and load, as well as its operational accuracy. Through the analysis of the two-stage HSCES optimal scheduling results, it can be concluded that the HSCES can operate economically and stably in Western China by coordinating the power output of the battery and hydrogen storage system; moreover, the necessity of the self-consistent coefficient in the HSCES is also affirmed. In addition, the two-stage optimal scheduling strategy proposed in this paper can make the HSCES operate more economically and stably. Furthermore, the HSCES model, the two-stage optimal scheduling model and the related parameter settings proposed in this paper provide certain reference values for practical engineering applications.
At present, there are still several deficiencies in this paper: This paper only makes relevant modeling and analysis for the scenario of “no grid + low load + abundant renewable energy resources”, such as in Western China. However, there are many different scenarios, such as “grid connection + high load + poor renewable energy resources”, etc. Subsequent research is needed to establish a more comprehensive analysis of the system suitable for each scenario according to its characteristics.
Author Contributions
Conceptualization, Y.Y. and R.S.; methodology, Y.Y. and R.S.; software, Y.Y. and Y.G.; validation, Y.Y. and D.W.; formal analysis, Y.Y.; investigation, Y.G.; resources, R.S. and X.M.; data curation, D.W.; writing—original draft preparation, Y.Y. and R.S.; writing—review and editing, R.S. and X.M.; visualization, Y.Y. and Y.G.; supervision, R.S.; project administration, R.S.; funding acquisition, R.S. All authors have read and agreed to the published version of the manuscript.
Funding
This research was funded in part by the National Key R & D Plan Foundation of China (Grant No. 2021YFB2601300).
Data Availability Statement
Not applicable.
Conflicts of Interest
The authors declare no conflict of interest.
Nomenclature
| Rated power of the photovoltaic array | Molar mass of hydrogen | ||
| Surface solar radiation intensity mean value | Conversion constant | ||
| Standard light intensity | Total cost of system operation | ||
| Power temperature coefficient | Wind turbine cost | ||
| T | Actual temperature | Photovoltaic unit cost | |
| Reference temperature | Battery cost | ||
| Wind turbine output power | Hydrogen system cost | ||
| S | Wind turbine actual wind speed | Wind turbine cost coefficient | |
| Cut-in wind speed | Photovoltaic unit cost coefficient | ||
| Cut-out wind speed | Battery cost coefficient | ||
| Rated wind speed | Electrolytic cell cost coefficient | ||
| Rated power | Hydrogen fuel cell coefficient | ||
| Charge state at time t | Wind turbine power at time t | ||
| Charge state at time t − 1 | Photovoltaic unit power at time t | ||
| Battery charging efficiency | Battery charge power at time t | ||
| Battery discharging efficiency | Battery discharge power at time t | ||
| Battery charge power | Electrolytic cell power at time t | ||
| Battery discharge power | Fuel cell power at time t | ||
| Battery rated capacity | Load at time t | ||
| Hydrogen volume | Battery charging state variable at time t | ||
| Electrolytic efficiency | Battery discharging state variable at time t | ||
| Electrolytic cell input power | Hydrogen fuel cell state variable at time t | ||
| Hydrogen storage tank capacity at time t | Electrolytic cell state variable at time t | ||
| Hydrogen storage tank capacity at time t − 1 | Self-consistent coefficient | ||
| Hydrogen storage efficiency | Energy conversion coefficient | ||
| Hydrogen release efficiency | Hydrogen energy conversion efficiency | ||
| Hydrogen storage power at time t | Battery energy conversion efficiency | ||
| Hydrogen release power at time t | Penalty cost | ||
| Fuel cell output power | Resource abandonment amount | ||
| Energy conversion efficiency | Power shortage penalty coefficient | ||
| Hydrogen consumed volume | Resource abandonment penalty coefficient |
References
- Liu, Z.; Deng, Z.; He, G.; Wang, H.; Zhang, X.; Lin, J.; Qi, Y.; Liang, X. Challenges and opportunities for carbon neutrality in China. Nat. Rev. Earth Environ. 2022, 3, 141–155. [Google Scholar] [CrossRef]
- Jia, L.; Ma, J.; Cheng, P.; Liu, Y. A perspective on solar energy-powered road and rail transportation in China. CSEE J. Power Energy Syst. 2020, 6, 760–771. [Google Scholar]
- Zhang, K.; Chen, M.; Yang, Y. Quantifying the photovoltaic potential of highways in China. Appl. Energy 2022, 324, 119600. [Google Scholar] [CrossRef]
- Zhou, B.; Pei, J.; Nasir, D.M.; Zhang, J. A review on solar pavement and photovoltaic/thermal (PV/T) system. Transp. Res. Part D Transp. Environ. 2021, 93, 102753. [Google Scholar] [CrossRef]
- Rezaeeian, S.; Bayat, N.; Rabiee, A.; Nikkhah, S.; Soroudi, A. Optimal Scheduling of Reconfigurable Microgrids in Both Grid-Connected and Isolated Modes Considering the Uncertainty of DERs. Energies 2022, 15, 5369. [Google Scholar] [CrossRef]
- Kim, R.-K.; Glick, M.B.; Olson, K.R.; Kim, Y.-S. MILP-PSO Combined Optimization Algorithm for an Islanded Microgrid Scheduling with Detailed Battery ESS Efficiency Model and Policy Considerations. Energies 2020, 13, 1898. [Google Scholar] [CrossRef] [Green Version]
- Hou, H.; Wang, Q.; Xiao, Z.; Xue, M.; Wu, Y.; Deng, X.; Xie, C. Data-driven economic dispatch for islanded micro-grid considering uncertainty and demand response. Int. J. Elec. Power 2022, 136, 107623. [Google Scholar] [CrossRef]
- Yang, K.; Li, C.; Jing, X.; Zhu, Z.; Wang, Y.; Ma, H.; Zhang, Y. Energy dispatch optimization of islanded multi-microgrids based on symbiotic organisms search and improved multi-agent consensus algorithm. Energy 2022, 239, 122105. [Google Scholar] [CrossRef]
- Lyu, Z.; Yang, X.; Zhang, Y.; Zhao, J. Bi-Level Optimal Strategy of Islanded Multi-Microgrid Systems Based on Optimal Power Flow and Consensus Algorithm. Energies 2020, 13, 1537. [Google Scholar] [CrossRef] [Green Version]
- Ishraque, M.F.; Shezan, S.A.; Ali, M.M.; Rashid, M.M. Optimization of load dispatch strategies for an islanded microgrid connected with renewable energy sources. Appl. Energy 2021, 292, 116879. [Google Scholar] [CrossRef]
- Shezan, S.A.; Ishraque, M.F.; Muyeen, S.M.; Abu-Siada, A.; Saidur, R.; Ali, M.M.; Rashid, M.M. Selection of the best dispatch strategy considering techno-economic and system stability analysis with optimal sizing. Energy. Strateg. Rev. 2022, 43, 100923. [Google Scholar] [CrossRef]
- Li, B.; Wang, H.; Wang, X.; Negnevitsky, M.; Li, C. Tri-stage optimal scheduling for an islanded microgrid based on a quantum adaptive sparrow search algorithm. Energy Convers. Manag. 2022, 261, 115639. [Google Scholar] [CrossRef]
- Liu, Z.; Liu, S.; Li, Q.; Zhang, Y.; Deng, W.; Zhou, L. Optimal Day-ahead Scheduling of Islanded Microgrid Considering Risk-based Reserve Decision. J. Mod. Power Syst. Clean Energy 2021, 9, 1149–1160. [Google Scholar] [CrossRef]
- Javadi, M.; Gong, Y.; Chung, C.Y. Frequency Stability Constrained Microgrid Scheduling Considering Seamless Islanding. IEEE Trans. Power Syst. 2022, 37, 306–316. [Google Scholar] [CrossRef]
- Vahedipour-Dahraie, M.; Rashidizadeh-Kermani, H.; Anvari-Moghaddam, A.; Siano, P. Flexible stochastic scheduling of microgrids with islanding operations complemented by optimal offering strategies. CSEE. J. Power Energy Syst. 2020, 6, 867–877. [Google Scholar]
- Hemmati, M.; Mohammadi-Ivatloo, B.; Abapour, M.; Anvari-Moghaddam, A. Optimal Chance-Constrained Scheduling of Reconfigurable Microgrids Considering Islanding Operation Constraints. IEEE Syst. J 2020, 14, 5340–5349. [Google Scholar] [CrossRef]
- Yang, D.; Zhang, C.; Jiang, C.; Liu, X.; Shen, Y. Interval method based optimal scheduling of regional multi-microgrids with uncertainties of renewable energy. IEEE Access 2021, 9, 53292–53305. [Google Scholar] [CrossRef]
- Cui, H.; Xia, W.; Yang, S. Two-time-scale dispatch strategy for networked micro-grids considering uncertainties and demand response. Int. J. Electr. Power Energy Syst. 2023, 145, 108620. [Google Scholar] [CrossRef]
- Li, J.; Zhou, J.; Chen, B. Review of wind power scenario generation methods for optimal operation of renewable energy systems. Appl. Energy 2020, 280, 115992. [Google Scholar] [CrossRef]
- Imeni, M.L.; Ghazizadeh, M.S.; Lasemi, M.A.; Yang, Z. Optimal Scheduling of a Hydrogen-Based Energy Hub Considering a Stochastic Multi-Attribute Decision-Making Approach. Energies 2023, 16, 631. [Google Scholar] [CrossRef]
- Goh, H.H.; Shi, S.; Liang, X.; Zhang, D.; Dai, W.; Liu, H.; Wong, S.Y.; Kurniawan, T.A.; Goh, K.C.; Cham, C.L. Optimal energy scheduling of grid-connected microgrids with demand side response considering uncertainty. Appl. Energy 2022, 327, 120094. [Google Scholar]
- AlDavood, M.S.; Mehbodniya, A.; Webber, J.L.; Ensaf, M.; Azimian, M. Robust Optimization-Based Optimal Operation of Islanded Microgrid Considering Demand Response. Sustainability 2022, 14, 14194. [Google Scholar] [CrossRef]
- Hosseini, S.M.; Carli, R.; Dotoli, M. Robust Optimal Energy Management of a Residential Microgrid Under Uncertainties on Demand and Renewable Power Generation. IEEE Trans. Autom. Sci. Eng. 2021, 18, 618–637. [Google Scholar] [CrossRef]
- Carli, R.; Cavone, G.; Pippia, T.; De Schutter, B.; Dotoli, M. Robust Optimal Control for Demand Side Management of Multi-Carrier Microgrids. IEEE Trans. Autom. Sci. Eng. 2022, 19, 1338–1351. [Google Scholar] [CrossRef]
- Yang, H.; Li, M.; Jiang, Z.; Zhang, P. Multi-time scale optimal scheduling of regional integrated energy systems considering integrated demand response. IEEE Access 2020, 8, 5080–5090. [Google Scholar] [CrossRef]
- Zhang, J.; Qin, D.; Ye, Y.; He, Y.; Fu, X.; Yang, J.; Shi, G.; Zhang, H. Multi-Time Scale Economic Scheduling Method Based on Day-Ahead Robust Optimization and Intraday MPC Rolling Optimization for Microgrid. IEEE Access 2021, 9, 140315–140324. [Google Scholar] [CrossRef]
- Ji, Y.; Xu, Q.; Zhao, J.; Yang, Y.; Sun, L. Day-ahead and intra-day optimization for energy and reserve scheduling under wind uncertainty and generation outages. Electr. Power Syst. Res. 2021, 195, 107133. [Google Scholar] [CrossRef]
- Cheng, Z.; Jia, D.; Li, Z.; Si, J.; Xu, S. Multi-time scale dynamic robust optimal scheduling of CCHP microgrid based on rolling optimization. Int. J. Electr. Power Energy Syst. 2022, 139, 107957. [Google Scholar] [CrossRef]
- Hu, K.; Wang, B.; Cao, S.; Li, W.; Wang, L. A novel model predictive control strategy for multi-time scale optimal scheduling of integrated energy system. Energy Rep. 2022, 8, 7420–7433. [Google Scholar] [CrossRef]
- Yang, M.; Cui, Y.; Huang, D.; Su, X.; Wu, G. Multi-time-scale coordinated optimal scheduling of integrated energy system considering frequency out-of-limit interval. Int. J. Electr. Power Energy Syst. 2022, 141, 108268. [Google Scholar] [CrossRef]
- Chen, J.; Wang, F.; Stelson, K.A. A mathematical approach to minimizing the cost of energy for large utility wind turbines. Appl. Energy 2018, 228, 1413–1422. [Google Scholar] [CrossRef]
- Li, B.; Miao, H.; Li, J. Multiple hydrogen-based hybrid storage systems operation for microgrids: A combined TOPSIS and model predictive control methodology. Appl. Energy 2020, 283, 116303. [Google Scholar] [CrossRef]
- Li, X.; Wang, X.; Qi, Z. Optimal scheduling of micro-grid for comprehensive hydrogen-electricity supply. Distrib. Util. 2022, 39, 40–46. [Google Scholar]
- Wang, Z.; Hu, J.; Liu, B. Stochastic optimal dispatching strategy of electricity-hydrogen-gas-heat integrated energy system based on improved spectral clustering method. Int. J. Electr. Power Energy Syst. 2021, 126, 106495. [Google Scholar] [CrossRef]
- Chen, H.; Gao, L.; Zhang, Y.; Zhao, C. Optimal scheduling strategy of a regional integrated energy system considering renewable energy uncertainty and heat network transmission characteristics. Energy Rep. 2022, 8, 7691–7703. [Google Scholar] [CrossRef]
- Jia, L.; Shi, R.; Ji, L. Research Report on Integrated Development Strategy of Rail and Road Transportation and Energy—Road; Strategic Consulting Report of Chinese Academy of Engineering: Beijing, China, 2022. [Google Scholar]
Figure 1.
Highway Self-Consistent Energy System structure.

Figure 2.
Rolling optimization process.

Figure 3.
Two-time scale scheduling solving process.

Figure 4.
PV typical scenarios.

Figure 5.
Wind typical scenarios.

Figure 6.
Typical scenario probabilities.

Figure 7.
Joint distribution scenario.

Figure 8.
(a) Day−ahead optimal scheduling system capacity status; (b) Day−ahead battery and hydrogen energy storage system output; (c) Day−ahead optimal scheduling result.
Figure 8.
(a) Day−ahead optimal scheduling system capacity status; (b) Day−ahead battery and hydrogen energy storage system output; (c) Day−ahead optimal scheduling result.

Figure 9.
Intra-day short-term forecast result.

Figure 10.
(a) Without rolling optimization scenario system capacity status; (b) With rolling optimization scenario system capacity status.
Figure 10.
(a) Without rolling optimization scenario system capacity status; (b) With rolling optimization scenario system capacity status.

Figure 11.
(a) Intra−day battery and hydrogen energy storage system output; (b) Intra−day optimized scheduling result.
Figure 11.
(a) Intra−day battery and hydrogen energy storage system output; (b) Intra−day optimized scheduling result.


Table 1.
System parameters.
| Parameters | Values | Parameters | Values |
|---|---|---|---|
| 1000 W/m2 | 0.5 ¥/(kW h) | ||
| −0.35%/C | 0.5 ¥/(kW h) | ||
| 25 °C | , | 200 kW | |
| , | 90% | , | 0 kW |
| , | 90% | 10% | |
| 80% | 90% | ||
| 80% | , | 0 kW | |
| 0.15 ¥/(kW h) | , | 100 kW | |
| 0.26 ¥/(kW h) | 0.8 | ||
| 0.5 ¥/(kW h) | 0.9 | ||
| 500 kW | |||
| 500 kW |
Table 2.
Results of costs in different cases.
| CASE | Total Cost/(¥) | Penalty Power/ (kW h) | Resource Abandonment/(kW h) |
|---|---|---|---|
| Case 1 | 1048.5084 | 4.2800 | 94.1994 |
| Case 2 | 984.9163 | 0 | 6.6983 |
| Case 3 | 962.2917 | 0 | 0 |
Disclaimer/Publisher’s Note: The statements, opinions and data contained in all publications are solely those of the individual author(s) and contributor(s) and not of MDPI and/or the editor(s). MDPI and/or the editor(s) disclaim responsibility for any injury to people or property resulting from any ideas, methods, instructions or products referred to in the content. |
© 2023 by the authors. Licensee MDPI, Basel, Switzerland. This article is an open access article distributed under the terms and conditions of the Creative Commons Attribution (CC BY) license (https://creativecommons.org/licenses/by/4.0/).
Share and Cite
MDPI and ACS Style
Ye, Y.; Shi, R.; Gao, Y.; Ma, X.; Wang, D. Two-Stage Optimal Scheduling of Highway Self-Consistent Energy System in Western China. Energies 2023, 16, 2435. https://0-doi-org.brum.beds.ac.uk/10.3390/en16052435
AMA Style
Ye Y, Shi R, Gao Y, Ma X, Wang D. Two-Stage Optimal Scheduling of Highway Self-Consistent Energy System in Western China. Energies. 2023; 16(5):2435. https://0-doi-org.brum.beds.ac.uk/10.3390/en16052435
Chicago/Turabian StyleYe, Yujiang, Ruifeng Shi, Yuqin Gao, Xiaolei Ma, and Di Wang. 2023. "Two-Stage Optimal Scheduling of Highway Self-Consistent Energy System in Western China" Energies 16, no. 5: 2435. https://0-doi-org.brum.beds.ac.uk/10.3390/en16052435
Note that from the first issue of 2016, this journal uses article numbers instead of page numbers. See further details here.