
Impact of Electricity Price Expectation in the Planning Period on the Evolution of Generation Expansion Planning in the Market Environment


School of Control and Computer Engineering, North China Electric Power University, Beijing 102206, China
*
Author to whom correspondence should be addressed.
Energies 2023, 16(8), 3328; https://0-doi-org.brum.beds.ac.uk/10.3390/en16083328
Submission received: 16 March 2023
/
Revised: 4 April 2023
/
Accepted: 6 April 2023
/
Published: 8 April 2023
(This article belongs to the Special Issue Research on Operation Optimization of Energy Systems)
Abstract
:With the continuous promotion of China’s electricity market reform, the introduction of competition in the power generation market provides a new research direction for the generation expansion planning (GEP) problem, which is of great significance in the promotion of the optimization of the power energy structure. In the context of marketization, the electricity price expectation during the planning period is a key factor of GEP for independent power generation groups. There is some literature showing that the electricity price expectation in the planning period can be estimated according to certain laws of market supply and demand, while it seems to us that a future Pay as Bid (PAB) mechanism is better to determine the electricity price expectation. In this paper, to explore the impact of these two different electricity price formation mechanisms on the evolution of the generation market, a multi-agent framework is first established to describe the interaction process among the generation market agents; then, a GEP model for independent power generation groups is developed in the market competition environment, and four representative scenarios are finally designed for detailed comparative studies. Based on these case studies, the conclusion can be summarized as: (1) the PAB bidding mechanism has a lower electricity price and higher market installed capacity almost all the time during the whole planning period for all four scenarios; (2) it is more important that PAB can reduce the impact of parameter uncertainty in the laws of market supply and demand, which can obtain more reliable and reasonable results regarding the long-term evolution of the generation market.
1. Introduction
In today’s industrial world, the sustainable development of the national economy and society cannot be separated from the support of energy. Electric power is the most widely used secondary energy in modern society and plays a very important role in energy development. In the power industry, the long-term optimization of the power supply structure at the power generation side is an important measure to achieve long-term sustainable development and the low-carbon transformation of electric energy. The GEP problem is one of the most important and complex issues in power systems. Additionally, a reasonable power planning scheme is not only conducive to the safe, reliable, and stable operation of power systems in the future but also will bring great benefits to power generation groups and thus promote economic development. The electric power industry has been a typical natural monopoly industry, with a long-standing monopolistic business model of vertically integrated power generation, transmission, distribution, and sale, and GEP is a single optimization problem in this mode. With the deepening of power system reform, power expansion planning has become a game problem involving multiple parties, and new research ideas and challenges have been brought to GEP. The authors of [1] reviewed the research directions and modeling solutions of the GEP problem under the monopolistic and liberalized structures of the electric power industry. The authors of [2] reviewed the current state of research on solving the internalization of externalities in the GEP externalities problem and the main methods used by them.
The problem of GEP in the traditional structure of the power industry is finding an optimal generation unit investment scheme to minimize the comprehensive cost under the condition of meeting the power operation requirements based on the predicted load demand in a certain period [1]. After long-term development, a large number of modeling and solving methods have emerged for traditional power planning problems, including mixed integer programming [3,4], dynamic programming [5], meta-heuristic algorithms [6,7,8], etc. Meanwhile, reliability [7,8,9], environmental protection policies, and other factors are also considered when solving the power planning problem. In addition, the traditional GEP problem is also combined with other long-term planning problems [10,11,12], such as generation and transmission planning problems [3,4,13].
After the reform of the electric power system in China, power generation groups have been separated, and competition has been introduced in the power-generation-side market. At this time, GEP is no longer a single optimization problem but a multi-party game problem involving power generation groups. Therefore, the traditional model of GEP and its solution method are no longer applicable to the GEP problem under market competition. Aiming toward power expansion planning in the electricity marketization environment, researchers at home and abroad have carried out a lot of research in this area and formed a large number of theoretical models and methods, such as game theory [14,15], multi-agent modeling technology, and system dynamics methods. A Cournot model of GEP for unit investment strategy was established to maximize the benefits of power generation companies in [16,17,18], and the impact of the competitive behavior of power generation companies on the planning results and market price was analyzed. The authors of [19] combined generation and transmission planning, which was divided into two stages: investment planning and operation scheduling. The traditional and evolutionary game methods were used to solve the investment and operation planning problems to eliminate traditional centralized planning. The authors of [20] combined a multi-objective function and multi-period framework into game theory and established an optimization model based on economic and reliability objective function, which was used to solve the GEP problem in the unregulated market, and they adopted a two-level optimization method to solve it.
In the market environment, electricity price is one of the important factors that determine the income of power generation groups. The authors of [21,22] studied the impact of changes in market demand and electricity prices on GEP results based on the supply–demand relationship. In [23], a stochastic dynamic model considering uncertainty factors was established in a highly competitive power system, and the uncertainty of market demand and electricity price was taken into account by the real options method. The authors of [24] proposed a novel framework for the generation expansion planning of restructured power systems under uncertainty in a multi-period horizon, which included generation investment from a price maker perspective. The authors of [25] proposed a generation incentive mechanism for obtaining the best investment in the price cap market. The authors of [26] studied the impact of short-term pricing methods on flexible generation investment in the electricity market. In addition, the market price clearing mechanism [27,28] is also commonly used as an electricity price settlement method for power generation companies in the competitive bidding process.
The electricity market is a dynamic environment with competitive, complex, and nonlinear characteristics. Market participants are both independent and closely connected. To more accurately simulate and study the interaction between market entities, market dynamic regulation, and the impact of uncertain factors on power planning, multi-agent modeling technology [29,30] has been applied to the modeling and simulation of the electricity market by some scholars. In [31], the demand-side dynamics and interaction with the market were incorporated into the GEP model; the authors established a two-sided multi-agent interaction model of supply and demand, solved it using game theory and a PSO algorithm, and compared it with the traditional optimization model and game theory model of GEP. In [32], a generation expansion planning method was proposed based on multi-agent modeling technology in the multi-power market environment.
In the above literature, research has been conducted on the generation expansion planning problem from multiple perspectives, mainly including the study of GEP as a traditional single optimization problem or a game problem of competition between multiple power generation groups. In addition, GEP has also been analyzed more in-depth in combination with economic benefits, energy policy, and so on in some literature, which provides a wealth of theoretical bases and research directions for the GEP problem in the market competition environment. This article views the GEP problem in a competitive market environment as a game problem involving multiple power generation groups participating in the competition, and electricity prices are an important factor affecting the investment decisions of power generation groups in the market game environment. At present, there is relatively little research on the determination form of electricity prices and the long-term evolution process in the power generation market in GEP problems. Additionally, the existing literature mostly determines market electricity prices based on supply and demand relationships, and very few introduce market bidding mechanisms into GEP to determine future electricity price expectations in the power generation market. However, with the development of electricity marketization, the market bidding mechanism will inevitably affect the GEP of power generation groups in a competitive environment. Therefore, this paper proposes a method of using the PAB bidding mechanism to determine electricity price expectations in the power generation market in the GEP problem. Additionally, the evolution law of the power generation market is studied under the market bidding mechanism and compared with the electricity price formation method of the supply and demand adjustment mechanism.
In this paper, from the perspective of the generation-side market, a multi-agent model of the generation market is built to simulate the game behavior of multiple power generation groups and the evolution process of the power generation market under the supply and demand adjustment mechanism and PAB bidding mechanism. Additionally, this article considers four different demand scenarios to compare the evolution of the power generation market under the PAB bidding mechanism and supply and demand adjustment mechanism from multiple perspectives. The main contents and conclusions of this study are summarized as follows:
- A multi-agent model, which can simulate the interactive behavior of the generation market agents, is proposed to realize the long-term evolution of the power generation market and solve the GEP problem in the market competition environment;
- The PAB bidding mechanism is introduced into the solution process of GEP, and the feasibility of using the PAB bidding mechanism to determine the settlement price in the GEP problem is verified;
- Through the comparative analysis of the PAB bidding mechanism and supply and demand adjustment mechanism under different load demands, it is concluded that the PAB bidding mechanism can reduce the uncertainty of system parameters and obtain a more reliable long-term evolution result for the power generation market, and it can promote the stable development of the power generation market.
2. Materials and Methods
2.1. Generation-Side Market Electricity Price Formation Mechanism
In the electricity market environment, market electricity price has a very important impact on the investment strategy and profit of power generation groups. The formulation method of market electricity price is the key issue of GEP on the power generation side. This paper mainly studies two types of electricity price formation mechanisms: one is that the electricity price is affected by market supply and demand fluctuations, and the other is market bidding mechanisms that show the electricity price is determined through market competition. Currently, there are two mainstream bidding mechanisms in the electricity market, including the market clearing price (MCP) mechanism and the PAB mechanism. Compared to the MCP bidding mechanism, the PAB bidding mechanism can effectively stimulate price competition among power generation groups. Therefore, the PAB bidding mechanism is mainly selected for comparison with the supply and demand adjustment mechanism in the simulation study of this paper.
2.1.1. Supply and Demand Adjustment Mechanism
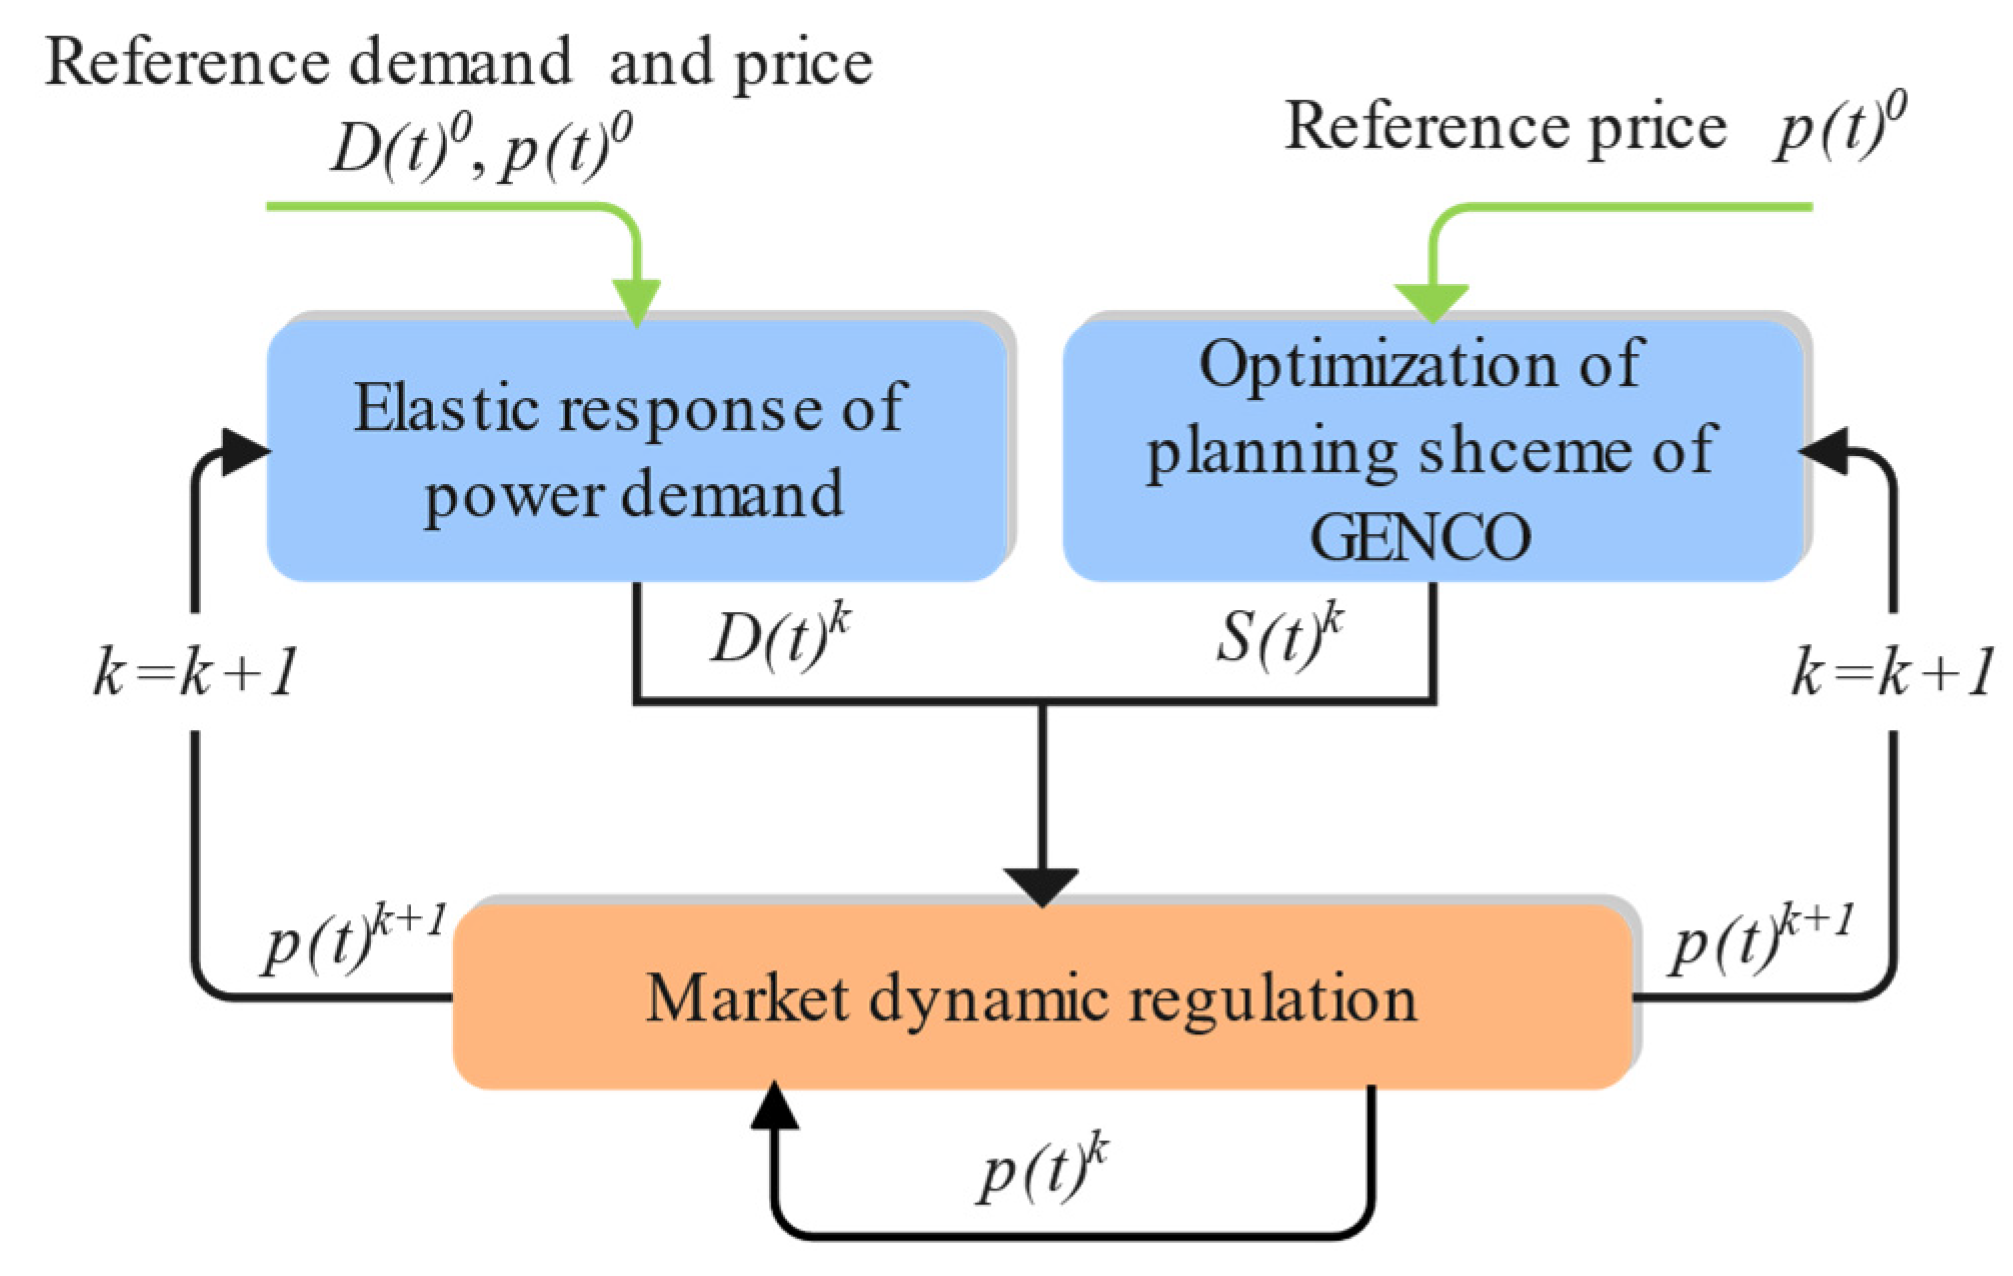
The adjustment mechanism of supply and demand is a method of modeling and simulating the long-term evolution of the power market based on system dynamics [33]. In the case of uncertainty in the long-term demand load forecast of the power market, the market electricity price is regulated by the relative relationship between supply and demand, resulting in fluctuations in electricity prices. Additionally, the change in electricity price in turn affects the market demand and the power investment decisions of power generation groups. The interaction of market electricity price, demand, and market supply forms a long-term evolutionary model of electricity price and demand. Therefore, the electricity price evolution and demand evolution process are included in the supply and demand adjustment mechanism, and Figure 1 shows the dynamic adjustment process of the market considering the supply and demand relationship. As shown in Figure 1, the market calculates the electricity price of the next iteration based on the electricity price information, supply information, and demand information of the previous iteration. The adjusted electricity price will be used as the input information of the demand evolution models, and the demand side will adjust the actual market demand, which will cause changes in the total market demand. Additionally, each power generation group on the supply side will also optimize its planning strategies based on the adjusted market electricity price information, resulting in changes in the total market supply. The new demand and supply information will be sent to the market again to adjust the next market electricity price. Through continuous periodic iterations, a closed-loop dynamic market adjustment process is formed, until the market supply and demand reach a balance.
- The dynamic process of market electricity price evolution
The evolution process of market electricity price is shown in Figure 1. The electricity price for each adjustment is calculated by Equations (1) and (2) [21]. Among them, the change value of electricity price depends on the attenuation factor, the deviation between demand and supply, and the last round of market electricity price. Then, the final electricity price for each adjustment is calculated by the change value of the electricity price and the last round of market electricity price. The market demand layer adjusts the demand accordingly and affects the planning strategy of power generation groups.
where is the fluctuation value of electricity price at the kth supply and demand adjustment in year t, is the electricity price after supply and demand adjustment, denotes the price decay factor, and denote the market demand and supply, respectively, and denotes the demand capacity margin in year t.
- 2.
- The dynamic process of market demand evolution
The evolution process of market demand is shown in Figure 1. The actual market demand is calculated according to Equations (3)–(5) [31]. The demand value of each market adjustment is calculated according to Equation (3). The demand value depends on the reference demand calculated by Equation (4), the market electricity price sent by the electricity price evolution process, the reference electricity price in year t, and the elasticity of demand to price. The adjusted demand is the actual market demand, which will be sent to the electricity price evolution model, and the market adjusts the market electricity price through it.
where is the actual demand after th adjustments of the previous year’s reference demand, denotes the growth rate of load demand in year t relative to the previous year, consistent with the growth rate of reference demand in each year, and is the elasticity index of demand to price; when , demand is rigid, and demand is not affected by the market electricity price of electricity changes. With the increase in the price elasticity of market demand, demand is more sensitive to price and thus shows great changes. This paper sets different price elasticity indices in different scenarios for a more realistic simulation of the market environment.
2.1.2. PAB Bidding Mechanism
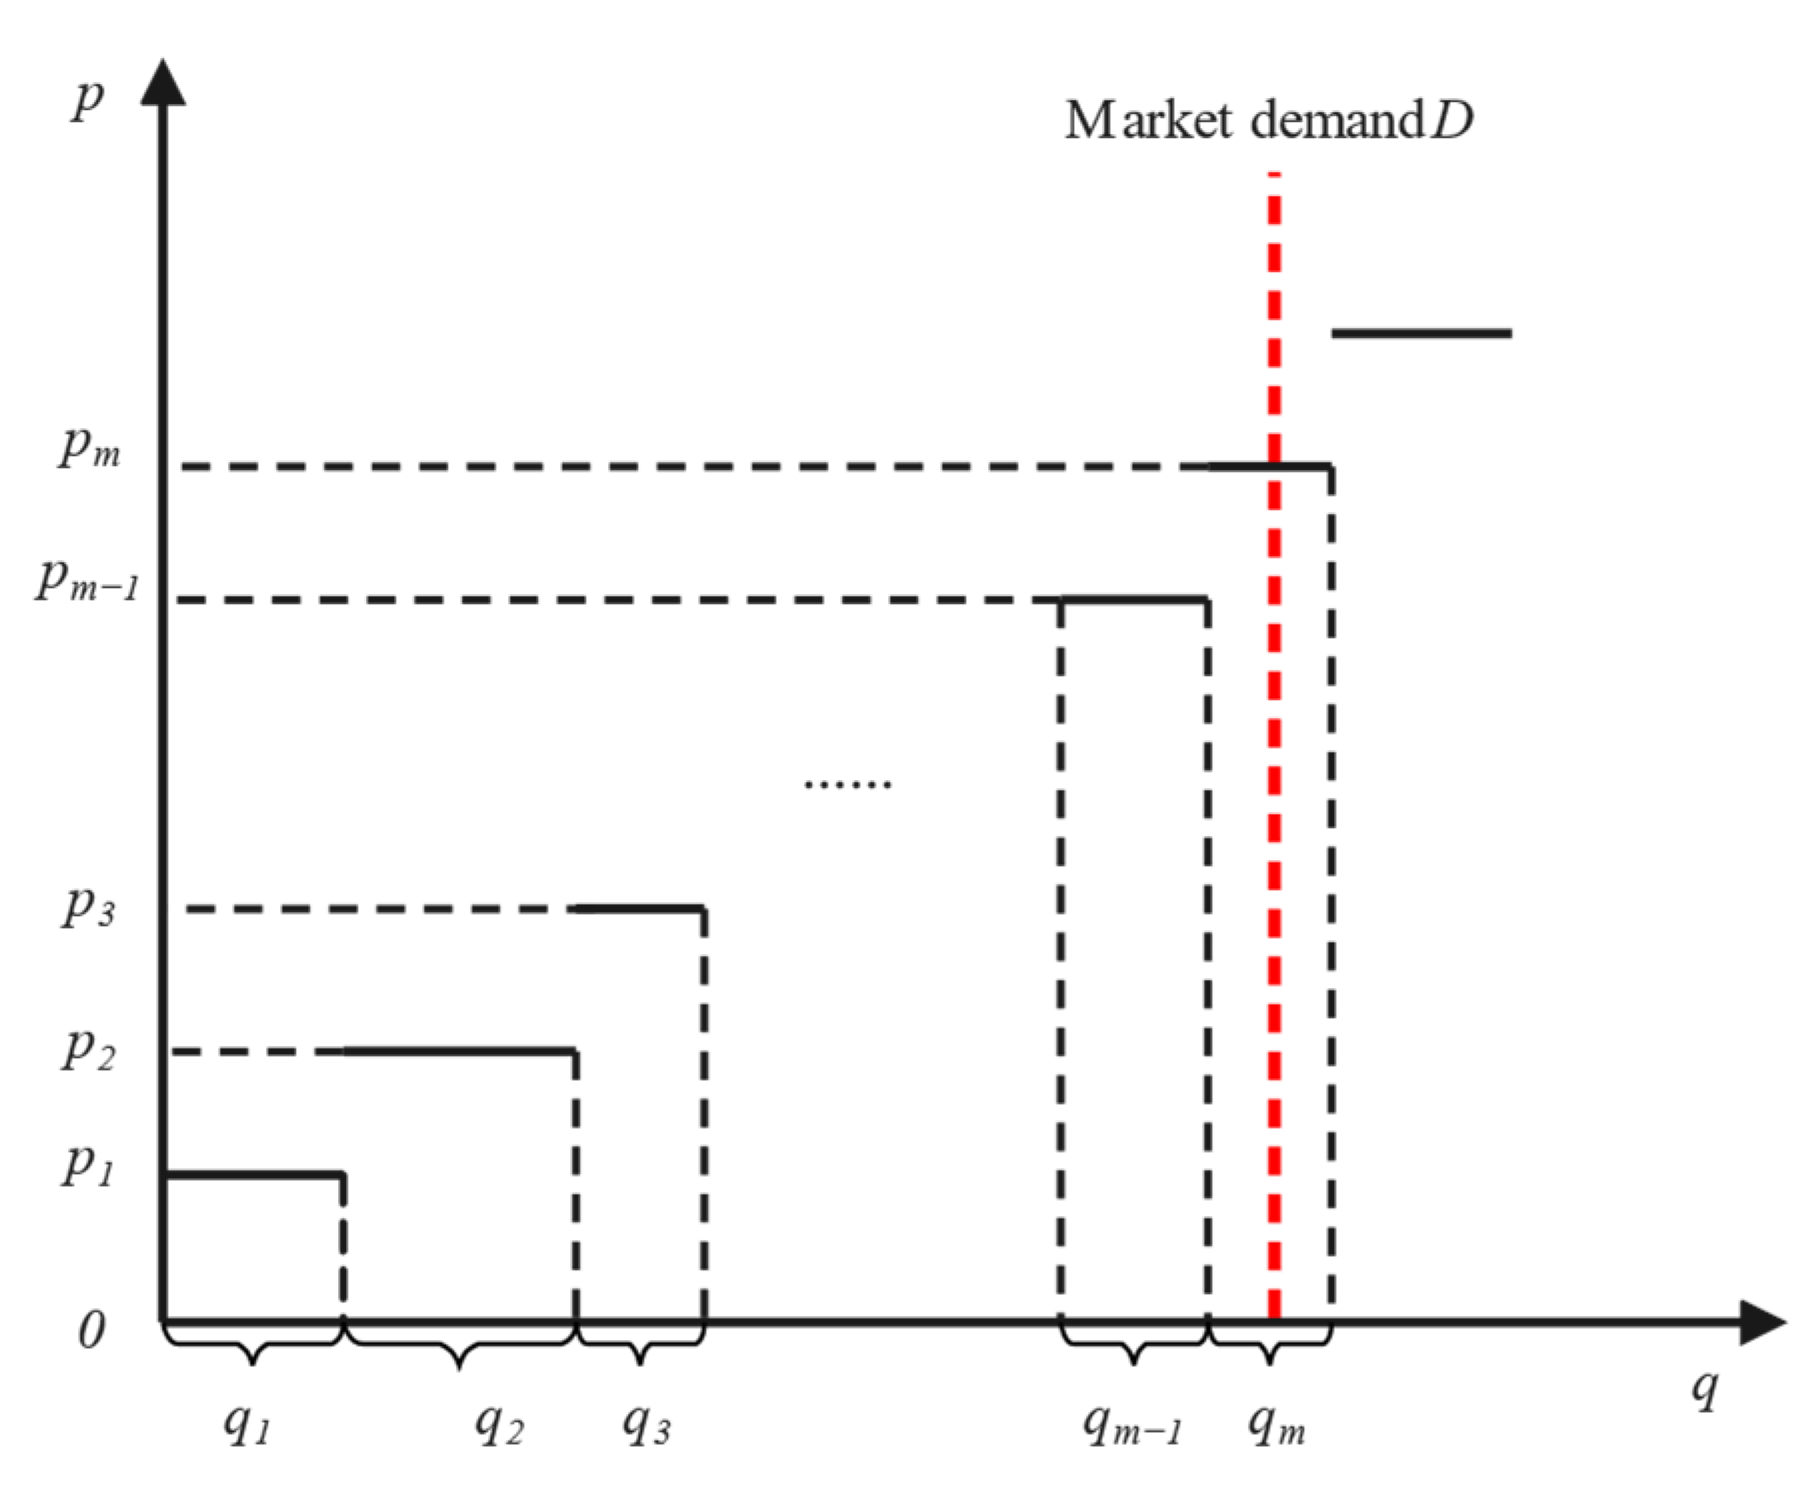
PAB is a bidding mechanism that is paid according to power generation groups’ bidding prices [34]. The power generation and price are submitted to the power trading center by all power generation groups participating in the market transaction. The power trading center ranks these power generation groups according to the declared electricity prices of all power generation groups from low to high. Then, the declared power generation of the power generation group is accumulated in order until the accumulated electricity generation is balanced with the market power demand. Additionally, the reported electricity price of the last power generation group that is accumulated is called the marginal electricity price. Power generation groups that report electricity prices that are lower than the marginal electricity price are considered successful bidding, and they use their own declared electricity prices to conduct electricity trading, rather than using a uniform market-clearing price.
As Figure 2 shows, the red dotted line is the market load demand value curve , and the left side is the volume curve and price curve of the accumulated power generation groups. A part of the power generation volume of the power generation group m is accumulated, and its reported electricity price is the marginal price, which is defined as in this paper. Power generation groups whose prices are less than or equal to the marginal price have successfully bid and qualified for online electricity trading. The power generation volume of power generation groups on the right side of the curve has not been accumulated, the reported electricity prices of these power generation groups are higher than the , and these power generation groups failed in bidding. The calculation methods of the trading power generation volume and the profit of these successful bidding power generation groups in the power market bidding are shown in Equations (6)–(8).
According to the bidding process of the PAB bidding mechanism, it is possible to calculate the actual transaction power generation that each power generation group can obtain. Using power generation group m as an example, the actual transaction generation obtained by power generation group m in the th bidding process is calculated as follows [35]:
where denotes the actual transaction power generation volume obtained by power generation group m in the th bid, denotes the total market demand, denotes the reported electricity by power generation group m, and are the reported electricity price of the power generation group m and marginal price in the th bid, respectively, and represents the number of power generation groups that the reported electricity prices are equal to the reported electricity price of power generation group m, including power generation group m.
Equation (7) shows the transaction price of power generation group m during the tth PAB bidding process. When the reported price of power generation group m is lower than , the transaction price of power generation group m is the price reported by itself. If the reported electricity price is higher than the , the power generation group cannot trade in the market, and the transaction price is 0, which means the bidding fails. The expressed as follows [36]:
Based on the actual transaction power generation volume traded and the settlement electricity price of the above power generation group m in the th bidding process, its revenue under the PAB bidding mechanism is as follows [36]:
where denotes the net revenue of power generation group m after the th bid and denotes the total cost.
2.2. Multi-Agent Model for Generation-Side Market
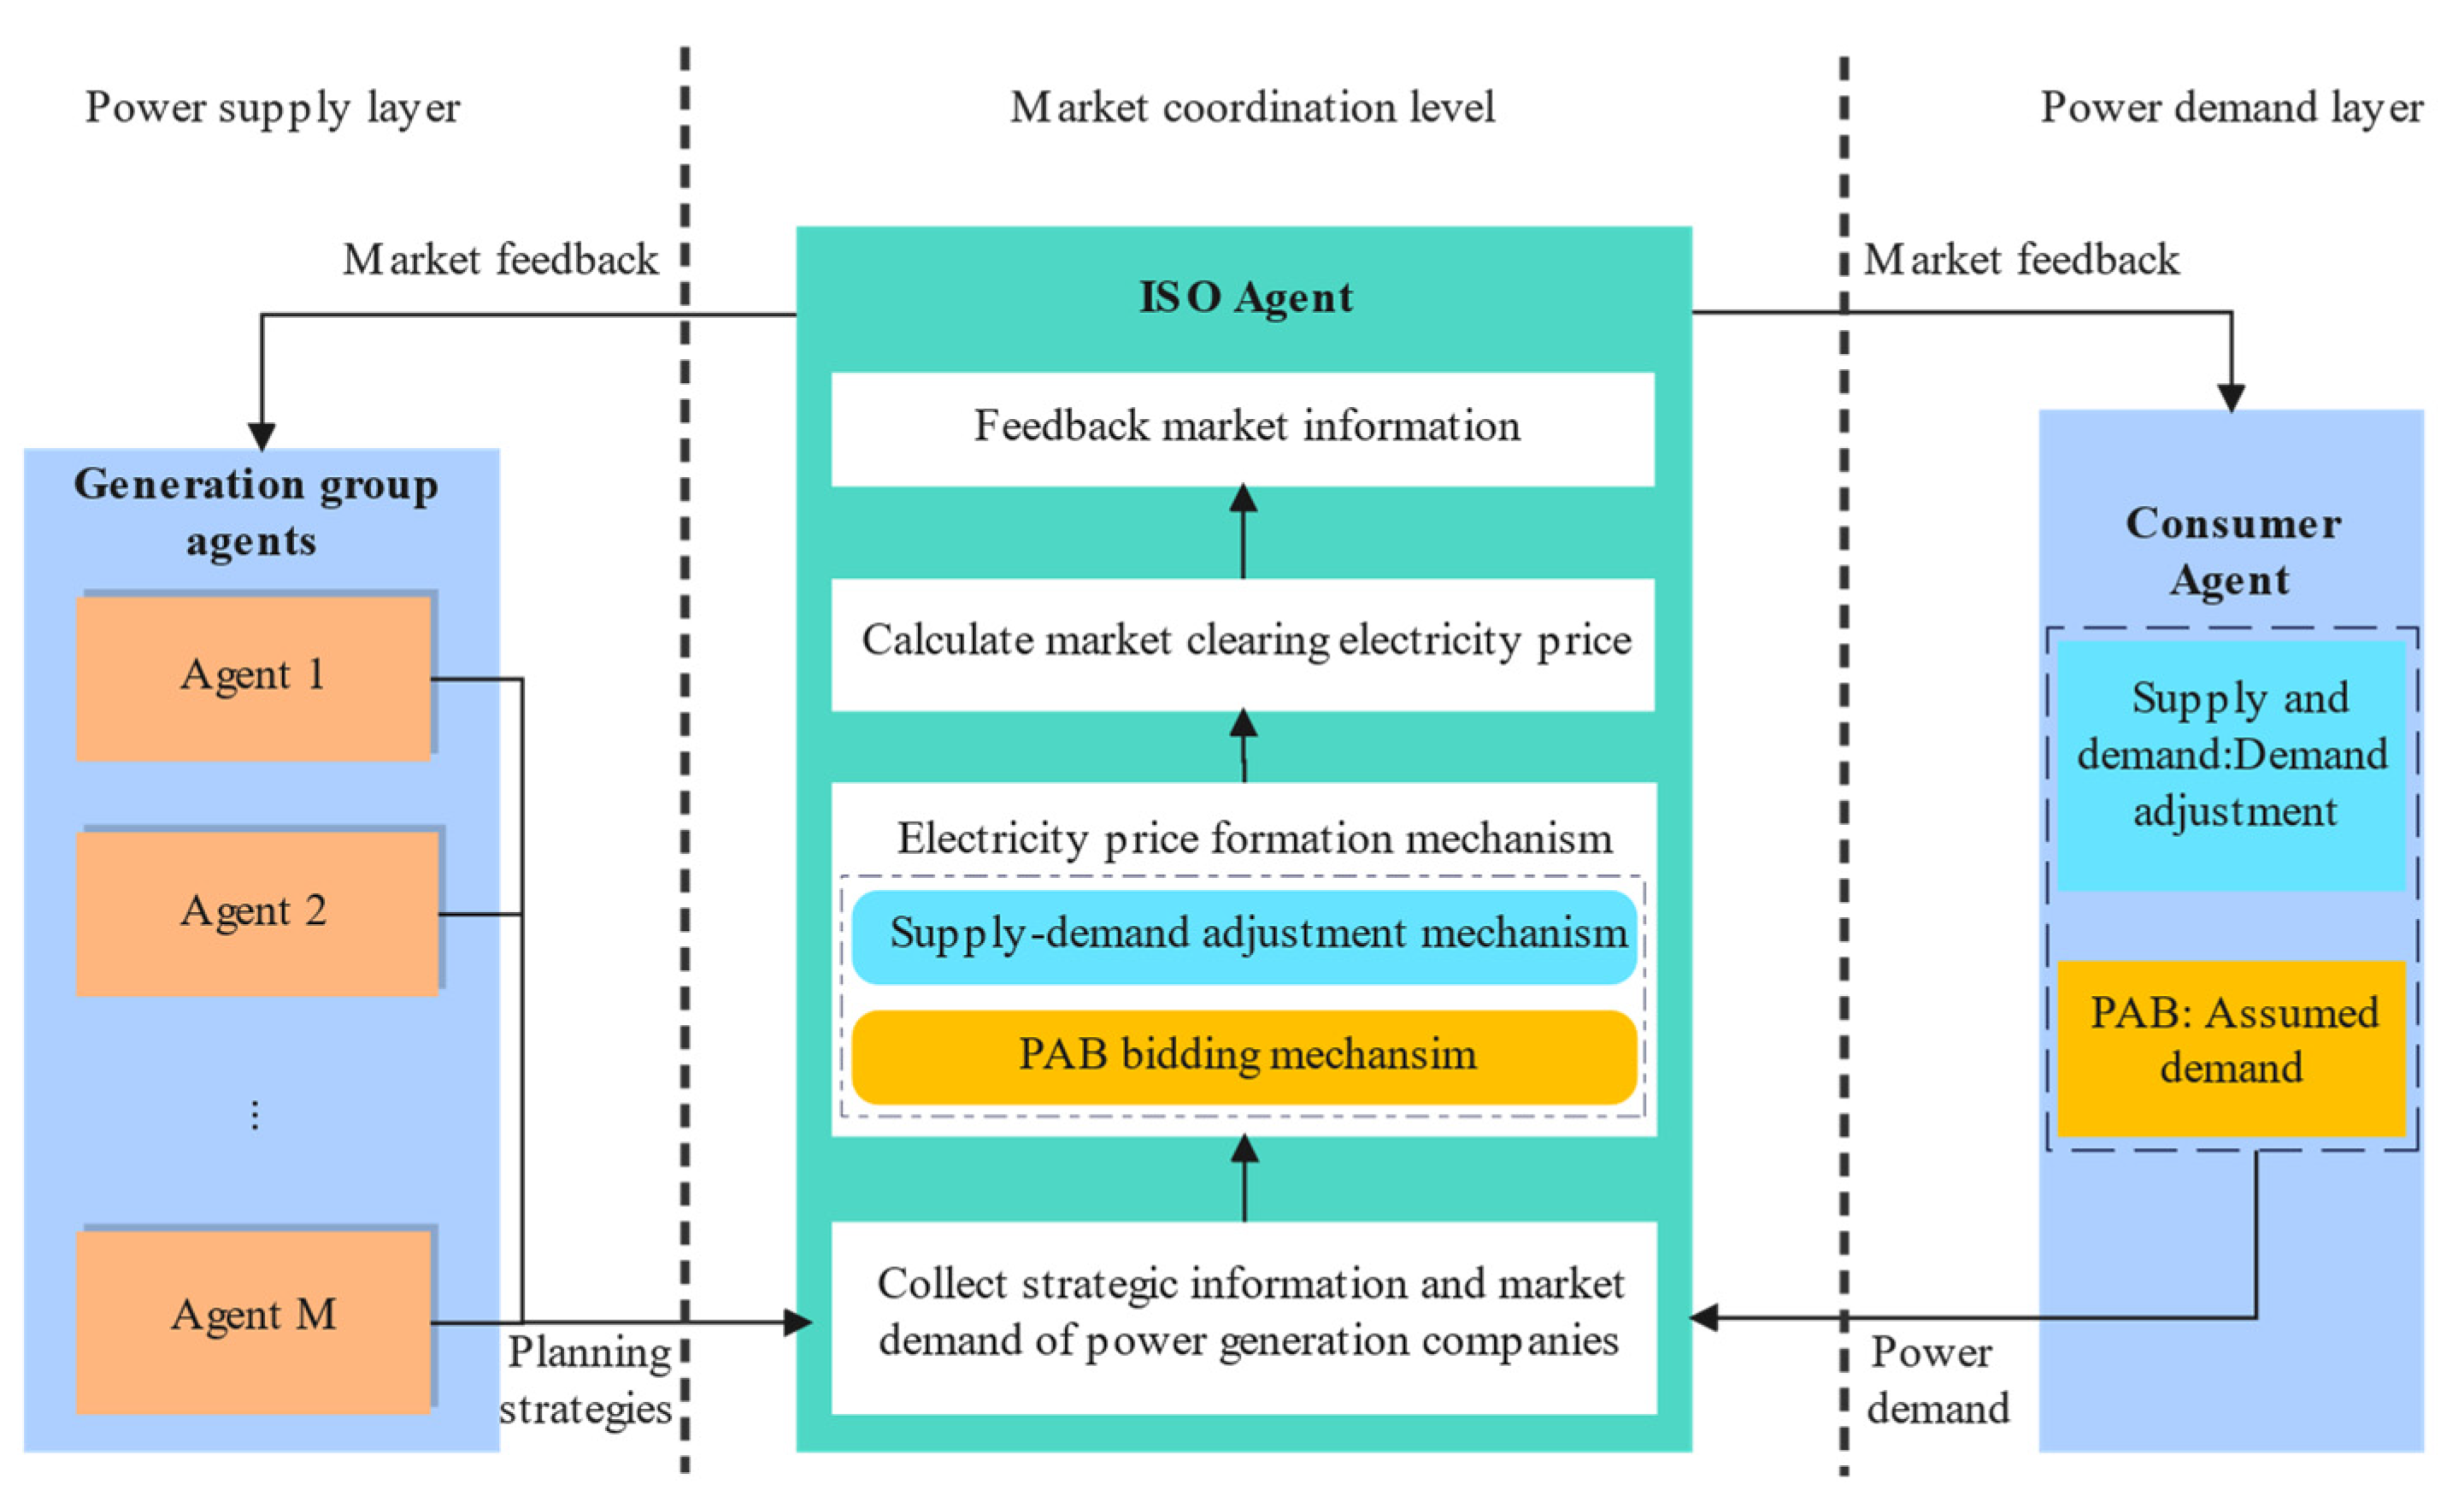
In this paper, the generation-side market is regarded as a complex adaptive system composed of market entities such as power generation groups, independent system operators (ISO), and power consumers. Based on the multi-agent modeling method, each market entity is abstracted as an agent. Additionally, a three-layer multi-agent model framework for the power-generation-side market is constructed based on the relationships between various entities in the power generation market, which are used to simulate the interaction behavior between market entities in a competitive market environment. As shown in Figure 3, the three-layer multi-agent framework includes a power supply layer, a market coordination layer, and a power demand layer. The power supply layer is mainly composed of multiple mutually independent power generation group agents. Additionally, each power generation group agent can communicate with the coordination layer agent and independently optimize its planning strategies based on the feedback information from the coordination layer agent. ISO as an agent at the coordination level, can process the data uploaded by supply layer agents and demand layer agents according to different market rules, calculate the market electricity price, and feed it back to the supply layer and demand layer agents. This paper regards the PAB bidding mechanism and the supply and demand adjustment mechanism as market rules encapsulated into ISO agents. The power demand layer is composed of different consumer agents, which can obtain market electricity price information and respond according to different market rules and send power demand data to ISO agents.
Under the market competition environment, each power generation group agent needs to continuously optimize and update planning strategies due to the dynamic changes in the market information and market demand to obtain more profits under market equilibrium conditions. The demand information of consumer agents will also change according to different market rules. According to the principles of the PAB mechanism, a reference demand is required during the planning period to serve as a market reference value for consumer agents to dynamically adjust demand and for the ISO agent to conduct PAB bidding. Under the supply and demand adjustment mechanism, the consumer agent dynamically adjusts the reference demand according to Equation (3). Under the PAB bidding mechanism, demand information is a necessary market parameter during the bidding process, and it is the reference information for the ISO agent to calculate the electricity price and the actual transaction electricity quantity of each power generation group. However, according to the principle of the PAB mechanism, there is no demand adjustment mechanism. Therefore, in this paper, when simulating GEP under the PAB bidding mechanism, it is assumed that the demand information under the PAB mechanism is the same as the reference demand of the supply and demand adjustment mechanism, which will not be dynamically adjusted.
Based on the three-layer multi-agent model framework, we can derive the interactive iterative process between power generation group agents, ISO agents, and consumer agents for power generation group power planning as follows:
- Step 1: In the first round of interaction, all power generation groups randomly generate planning strategies according to constraints and upload planning strategies to ISO agents.
- Step 2: The ISO agent processes the data of all power generation group agents according to different market rules and the collected market demand and feeds back the processing results to the generation group agents and demand-side agents.
- Step 3: According to the information published by ISO, the agents of the power generation group calculate revenue from the previous round and independently optimize planning strategies. Under the supply and demand adjustment mechanism, the demand layer agent also adjusts the demand according to the information of ISO.
- Step 4: The benefits of this power generation group agent’s optimal strategy are compared with the benefits of the previous round, and then, it is decided whether its own strategy should be updated.
- Step 5: The agent of the power generation group reports the updated strategy to ISO again. At the same time, the consumer agent also uploads the adjusted demand information to the ISO.
- Step 6: Return to Step 2 and cycle until the planning strategy and market of all power generation groups reach an equilibrium state.
In this paper, the three-layer multi-agent model is used to simulate the relationships and interactive behaviors among various market entities during the planning period and to study the long-term evolution process of the power generation market under different electricity price formation mechanisms when the generation groups make planning strategies.
2.3. Optimization Model of Power Generation Group Decision
In the electricity market environment, a power generation group, according to its own conditions and market environment, formulates a power investment strategy that maximizes its profit under the condition of ensuring the stable and safe operation of the power system and meeting a series of constraints.
2.3.1. Utility Function
This paper takes the maximum net profit of the power generation group in the planning period as the objective function and synthesizes the electricity sales income, investment cost, and operation cost. The objective function of the power generation group can be summarized from reference [18].
Taking power generation group m as an example, its objective function is expressed as:
where m is the number of power generation groups, is the net profit of power generation group m during the planning period, is the total revenue from electricity sales, and is the total cost in the planning period.
The total cost is mainly composed of investment cost and operation cost , which can be expressed as:
- 3.
- Revenue of power generation group m
During the planning horizon, the main revenue of the power generation group comes from electricity sales, as shown in Equation (11):
where T is the planning horizon, N is the set of generation unit types, is the market electricity price of electricity in year t, CNY/MW h, is the actual power generation of the th type of generator unit of power generation group m in year t, MWh, is the generator unit type number, and is the discount rate, which is 0.05 in this paper.
In Equation (11), the market electricity price of power generation group m in the tth year decision-making process is determined through the supply and demand adjustment mechanism and the PAB bidding mechanism. In the supply and demand adjustment mechanism, the market electricity price is iteratively adjusted by the market supply and demand relative relationship through Equation (2), and all power generation groups adopt the same market electricity price to optimal strategies. In the PAB bidding mechanism, the market electricity price needs to be obtained through competition among power generation groups, and in the decision-making process of power generation group m is equal to , as shown in Equation (7). Both the electricity price formation mechanisms are influenced by information on the decisions of all generation groups when determining market electricity prices.
- 4.
- Investment cost of power generation group m
Equation (12) is the investment cost of the power generation group during the planning horizon, expressed as:
where is the static investment cost of the th type of generator unit, billion CNY/unit, and is the number of new th type of generator units added by the power generation group m in year t.
- 5.
- The operation cost of power generation group m
The operation cost of power generation group m during the planning horizon can be expressed as:
where is the unit operating cost of the th type of generator unit of the power generation group m in year t, which includes the fuel cost of generating unit and the generation O&M cost, CNY/MWh.
2.3.2. Constraint Condition
- 6.
- Power constraint;
The total annual installed capacity of all power generation groups in the region during the planning horizon shall be greater than the maximum demand load of the region for that year [15]:
where is the installed capacity of the th type of generator unit of the power generation group m in year t, and is the maximum demand load of the region in year t.
- 7.
- Generator set output constraint;
The actual operating load of the th type of generator unit in year t cannot be lower than the lower operating load limit of the unit and higher than the upper operating limit [37]:
where and are the upper and lower limits of the operating output of the th type of generator unit in year t, respectively.
- 8.
- Add the upper limit of the number of units of the nth type
The number of new installations of the th type of generator unit of power generation group m cannot exceed the maximum number of new additions allowed for that year t [38]:
where is the upper limit of the number of new units installed for the nth type of generator unit in year t of power generation group m.
- 9.
- An upper bound of the total installed capacity of a power generation group
The sum of the number of new installations per year for all unit types of the power generation group cannot be greater than the maximum total number of new installations allowed for that year [16]:
where is the upper limit of the total number of new installations allowed by power generation group m in year t.
- 10.
- Power generation qualification constraints
The type of units added each year by the power generation group must be permitted units with generation qualifications:
where is the nth type of unit in year t of the power company, and is the set of units qualified for power generation in year t of power generation group m.
2.4. Data Description
Based on the three-layer multi-agent model and the generation-side generation expansion planning game model established, the generation expansion planning of a certain region in China in the next 15 years is discussed in this paper. This paper assumes that there are five groups in the power generation market in the region, which are, respectively, represented as A, B, C, D, and E. Among them, group A is a large power generation group with the largest initial installed capacity, groups B and C are two medium-sized power generation groups of the same size, and groups D and E are small power generation groups. Each power generation group has the qualification to invest in coal, hydropower, wind power, gas, and photovoltaic units, and groups A, B, and C have nuclear power production licenses. However, groups D and E cannot invest in nuclear power units without nuclear power production licenses. Scaling down based on the type and scale of power generation units installed in China at the end of 2021 [39], the type and quantity of existing units and optional unit parameters and type of each power generation group are set as shown in Table 1 and Table 2, respectively.
In this paper, the planning period T is set to 15 years. Under the supply–demand relationship, the initial market tariff is set at 500 CNY/MWh, the price change decay factor is 0.90, and the base price elasticity index is . Under the PAB bidding mechanism, a range of electricity price parameters is required in the bidding process of each power generation group to ensure that the declared electricity price of the power generation group will not exceed the upper and lower limits each year, and the range of electricity price is set as [200, 800]. In this paper, we set the initial load for the starting year of planning to 23,500 MW. To study the impact of different electricity price formation mechanisms on the power generation market under the condition of demand fluctuation, we set different demand growth rates to compare and analyze the evolution result of the power generation market in the planning horizon in this paper. Assumptions of the annual growth rate of the reference demand at different stages in the planning period are shown in Table 3.
At the same time, due to the uncertainty of demand elasticity parameters in the supply and demand adjustment mechanism, the elasticity indexes of three levels are set in this paper as low elasticity , basic elasticity, and high elasticity , to explore the evolution of market electricity prices under different price elasticity levels. The market demand set under the PAB bidding mechanism is rigid, that is, the market demand is not affected by the electricity price and is the set reference demand in the planning horizon.
3. Results
In view of the evolution of the generation-side market in the GEP problem, this paper mainly analyzes the evolution of market electricity price, the evolution of market installed capacity, and the total profits of power generation groups. Additionally, the differences between the PAB bidding mechanism and the supply and demand adjustment mechanism are compared in different market load demand scenarios.
3.1. Comparative Analysis of Market Electricity Price Evolution Results
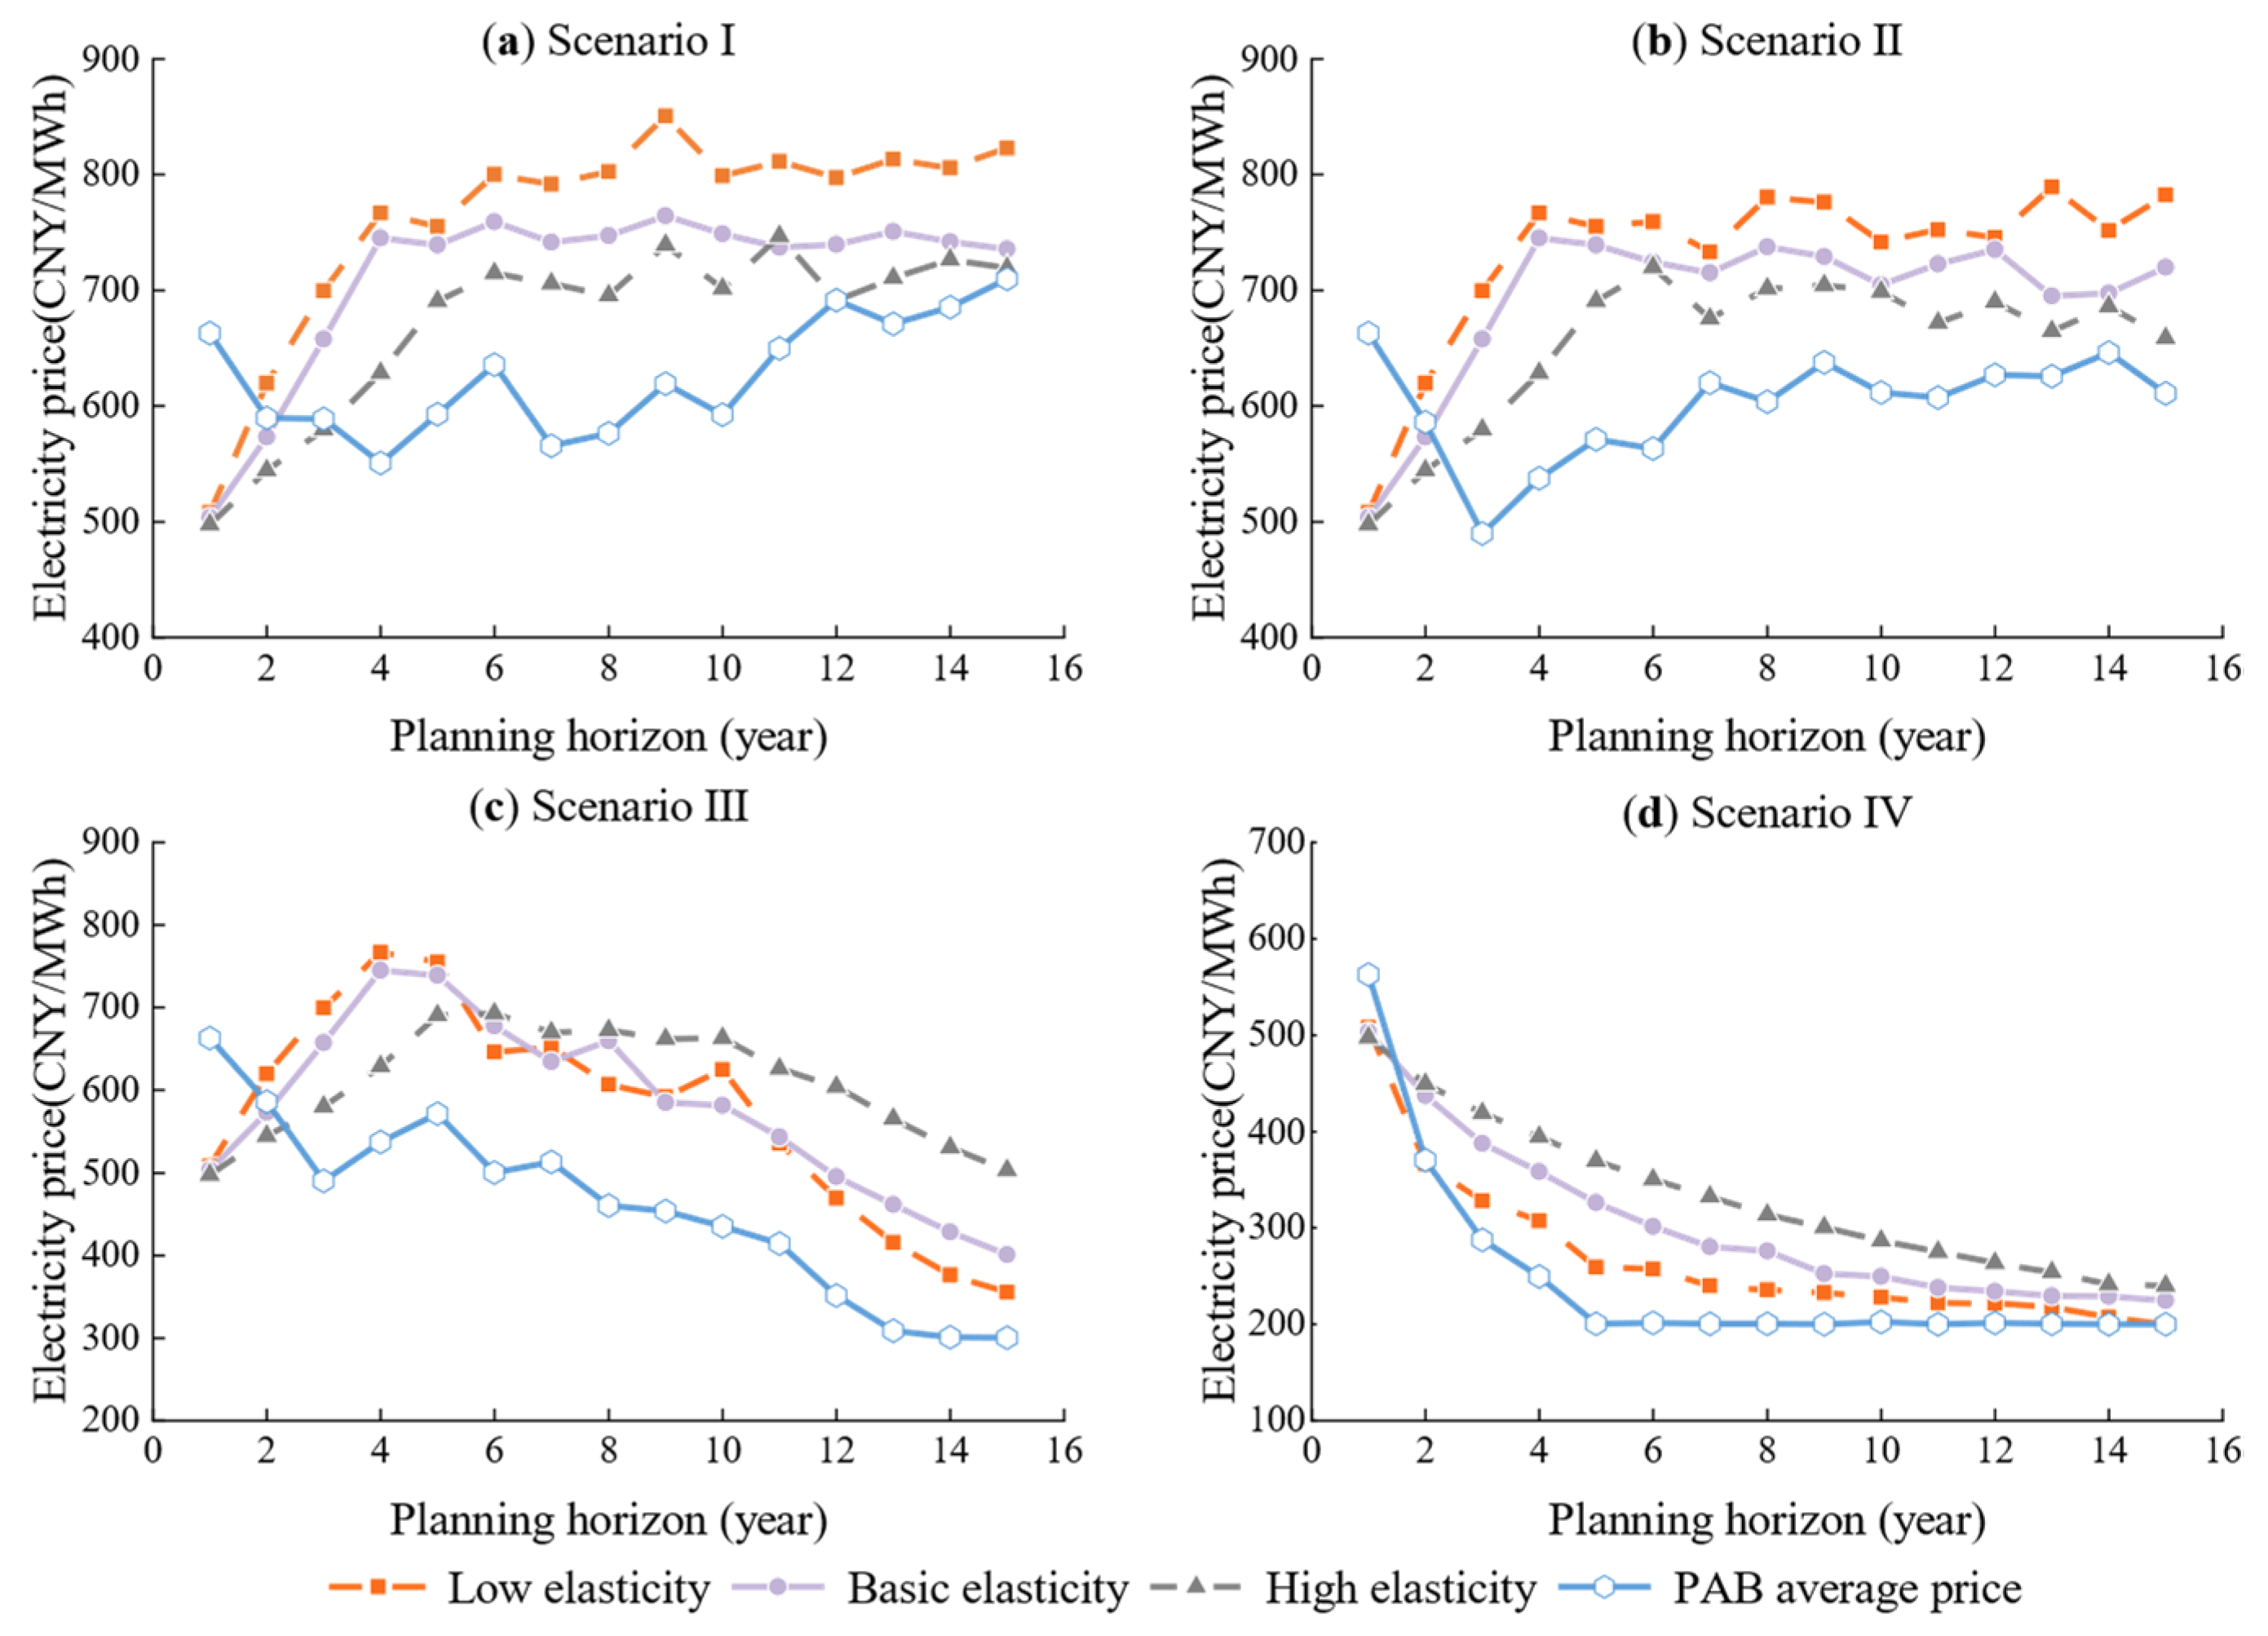
To compare the impact of the PAB bidding mechanism and supply and demand adjustment mechanism on the evolution of market electricity price in different market demand scenarios, simulations are conducted in the above four scenarios, and the comparison results are as follows. The market electricity price under the PAB bidding mechanism is expressed by the average electricity price of all successful bidding power generation groups in this paper.
3.1.1. Scenario I and Scenario II
In Figure 4a,b, the market electricity price evolution results of the PAB bidding mechanism and the supply and demand adjustment mechanism in Scenario I and Scenario II are shown. Under the supply and demand adjustment mechanism, in Scenario I, the market electricity price shows an upward trend with the increase in demand in the first 4 or first 6 years of the planning, and the higher the elasticity, the slower the rising speed and lowering price. In the following planning years, the market supply and demand are relatively balanced under the condition of market dynamic adjustment. The market electricity price under the conditions of medium and high elasticity has no significant upward trend, the price change is relatively stable. However, the market electricity price with low elasticity has a slow upward trend with the growth of demand, because the actual demand of the market is less affected by the price elasticity. When the market demand growth rate is positive, the higher the elasticity, the smaller the change in the growth rate of the actual market demand, and the actual demand is lower. Therefore, in the whole planning period, the market electricity price under the condition of high elasticity generally is lower than the electricity price under the condition of medium elasticity, while the electricity price under the condition of low elasticity is always highest. Scenario II is similar to Scenario I in the trend of market electricity price change. The difference is that in Scenario II, due to the reduction in demand growth rate in the 6th to 15th year, the market electricity price under the corresponding elastic conditions is slightly lower than in Scenario I.
In Scenario I and Scenario II, due to the actual competitive relationship between various power generation groups under the PAB bidding mechanism, when the total installed capacity of the market is higher than the market demand, the competition between power generation groups is relatively fierce, resulting in the decrease in the PAB average electricity price in the first four years or first three years of planning. Subsequently, as demand gradually increases, the market supply and demand gap gradually decreases, resulting in an overall rebound in the average price of PAB. The difference is that in Scenario II, due to the reduction in demand growth rate, the fluctuation range of PAB average electricity price after the seventh year is smaller and the change is relatively flat. Compared with the supply and demand adjustment mechanism, the PAB average electricity price is lower for almost the entire planning period, because power generation groups obtain the transaction power volume through competition.
3.1.2. Scenario III
The change in the market electricity price in the first five years under the supply and demand adjustment mechanism and PAB bidding mechanism in Scenario III is similar to that in Scenario II, and there is no more analysis, as shown in Figure 4c. Under the supply and demand adjustment mechanism, the market’s assumed demand will remain unchanged within the 6th to 10th year in Scenario III. However, due to the existence of price elasticity, the actual demand is lower, leading to a decrease in the electricity price from the 6th year. Additionally, the market electricity price under the condition of high elasticity decreases slightly, while the market electricity price under the conditions of medium and low elasticity decreases significantly, making the electricity price under the condition of high elasticity higher, which is different from Scenario I and Scenario II. The market demand begins to decline after the 10th year, resulting in the continued decline in electricity prices, and the decline rate increases. With time, the market electricity price under the condition of low elasticity is gradually lower than the market electricity price under the condition of medium elasticity, and the price gap also gradually increases.
Under the PAB bidding mechanism, with the demand no longer growing after the 5th year, the gap between supply and demand becomes larger, and the competition among power generation groups becomes more intense, resulting in a declining trend in the PAB average electricity price from the 5th year onward. Similarly, in Scenario IV, the PAB average price is still lower than the electricity price of the supply and demand adjustment mechanism.
3.1.3. Scenario IV
Figure 4d shows the evolution of the market electricity price under the PAB bidding mechanism and supply and demand adjustment mechanism in Scenario IV. As the market demand declines, while the initial installed capacity of the market is higher than the reference demand, the PAB average price and the market electricity price of the supply and demand adjustment mechanism decline from the second year. Under the supply and demand adjustment mechanism, different from Scenario I and Scenario II, due to the price elasticity, the actual demand is higher than the reference demand when the electricity price drops, and the higher the elasticity, the smaller the actual demand decline rate. Thus, the electricity price under the condition of high elasticity drops slowly, which is higher than the electricity price under the conditions of medium and low elasticity, but finally, the electricity price tends to be stable, close to 200 RMB/MWh.
Due to the market demand being rigid under the PAB mechanism, the PAB average electricity price decreases faster than that of the electricity price under the supply and demand adjustment and approaches the marginal cost after the fifth year. The PAB average electricity price is also lower than the electricity price of the supply and demand adjustment mechanism in the whole planning period. However, at the end of the planning period, the PAB average electricity price and the electricity price of the supply and demand adjustment mechanism are closer.
Through the comparative analysis of the evolution results of market electricity prices in the above four scenarios, there is significant uncertainty in the evolution of market electricity prices under the supply and demand adjustment mechanism due to price elasticity. When the market demand growth rate is positive, the market electricity price under the condition of high elasticity is lower than the market electricity price under the condition of low elasticity; however, when the market demand growth is zero or negative, the electricity price under the condition of high elasticity is higher than the electricity price with low elasticity. In contrast, the PAB bidding mechanism has no parameter influence, and the evolution result of electricity price is entirely formed from competition among power generation groups, which makes the PAB tariff evolution result more reasonable. Additionally, the PAB average electricity price is lower than the market electricity price of the supply and demand adjustment mechanism for almost the entire planning period in all scenarios. The evolution result of the average electricity price under the PAB bidding mechanism also reflects the normal change in supply and demand. There is a significant difference in electricity price evolution between the two electricity price formation mechanisms.
3.2. Evolution of the Total Installed Capacity of the Market
The different market electricity prices will differently affect the investment of the market and the total installed capacity in the market. The following is an analysis of the evolution of the total installed capacity of the market in the planning period under the PAB bidding mechanism and supply–demand adjustment mechanism.
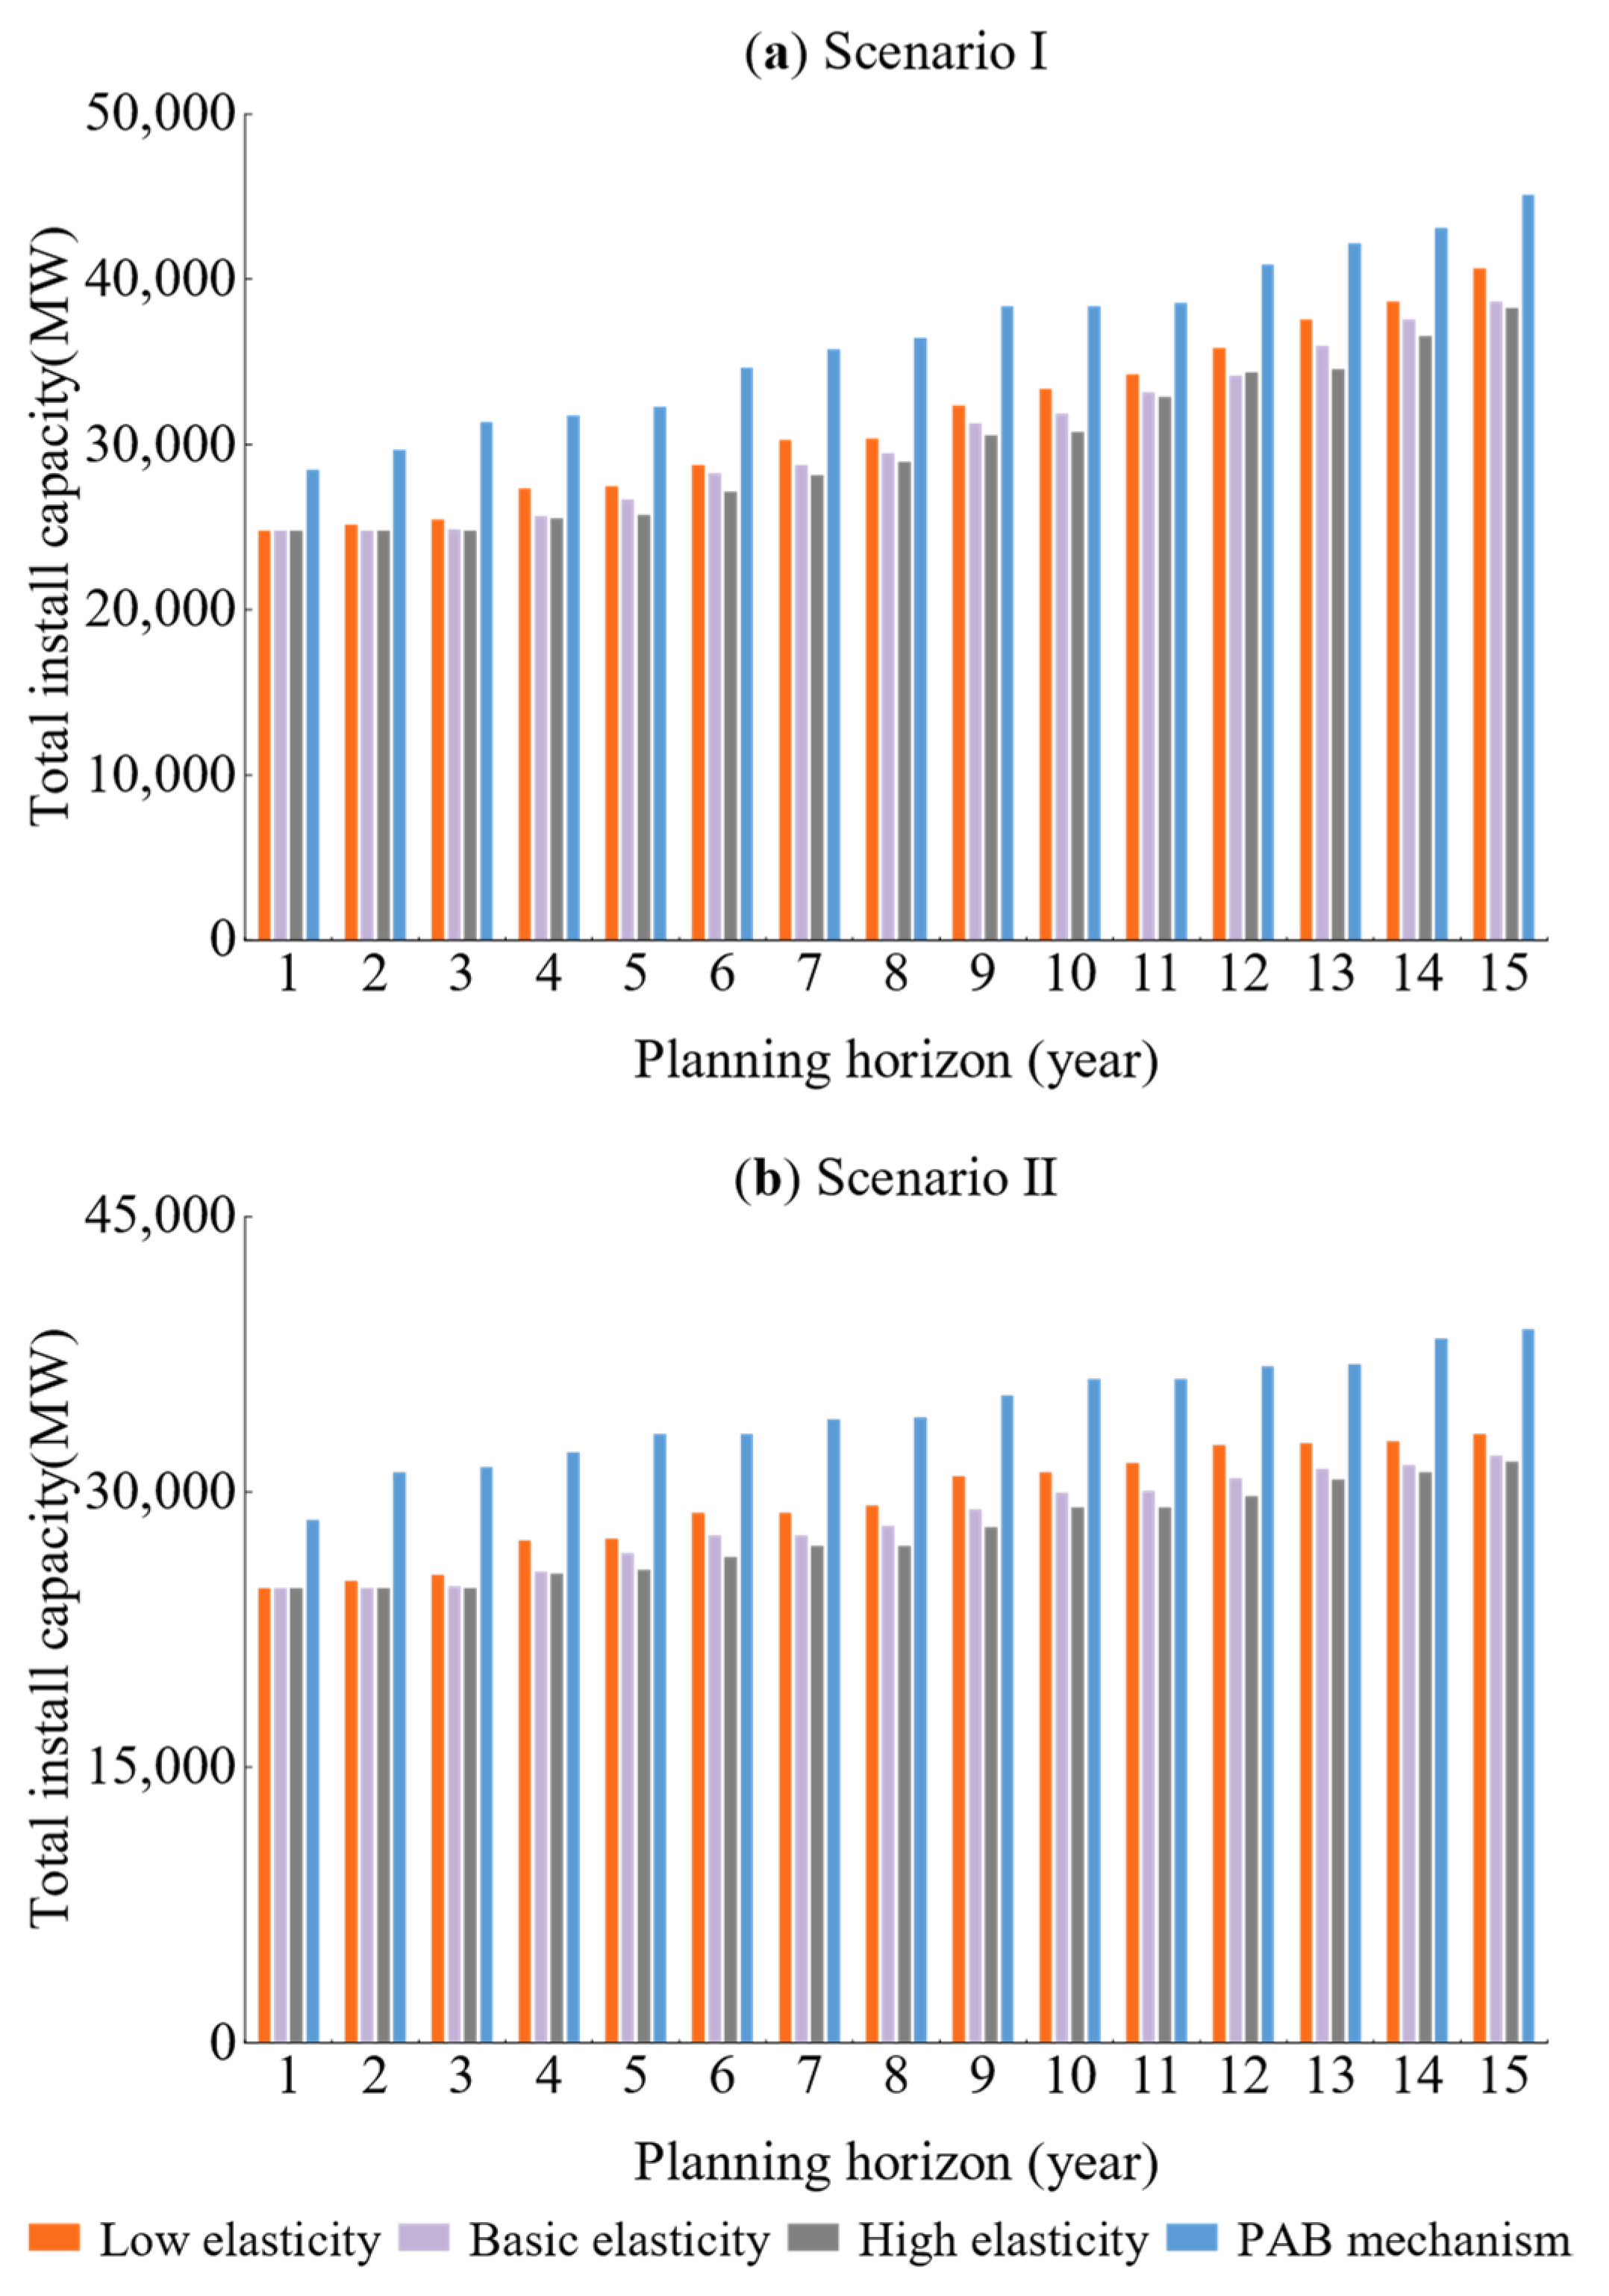
3.2.1. Scenario I and Scenario II
Figure 5a,b show the evolution of the total installed capacity of the market during the planning period under the hypothetical demand of Scenario I and Scenario II.
Under the supply and demand adjustment mechanism, the market total installed capacity under different price elasticity levels rises with the increase in market demand in Scenario I, and it shows great differences. Among them, the total installed capacity in the market under the condition of low elasticity is the highest in the whole planning period, while it is lower under the conditions of medium and high elasticity. The reason for this is that the demand under the condition of low elasticity is less sensitive to price, and the change is relatively small compared with the reference demand, which makes the actual demand of the market higher than the actual demand under the conditions of medium and high elasticity, and the installed capacity increases more. Additionally, this is the result of mutual coordination between the supply layer and the demand layer. From the perspective of installed capacity growth rate, the installed capacity in each year under the condition of low elasticity changes significantly, with an average installed capacity growth rate of about 3.38%. However, the installed capacity under the conditions of medium and high elasticity changes relatively slowly, with average installed capacity growth rates of 3.0% and 2.96%, respectively, which are lower than the installed capacity growth rate under the condition of low elasticity. The evolution law of installed capacity under different elasticities in Scenario II is similar to that in Scenario I. However, the change in installed capacity in each year in Scenario II is relatively slow due to the decrease in demand growth rate, and the average installed capacity growth rate is lower. The average installed capacity growth rate under different elasticity levels is shown in Table 4, which decreases with the increase in elasticity in Scenario I and II.
The market total installed capacity in Scenario I and Scenario II under the PAB bidding mechanism changes significantly in each year, with the average growth rate of installed capacity of 4.14% and 3.1%, as shown in Table 4. Because the market demand under the PAB mechanism is rigid, the investment decisions of power generation groups are not subject to the interaction between supply and demand and market regulation. Therefore, in the PAB mechanism, power generation groups are “responsible for their profits and losses” and will invest as long as they can obtain good returns, making the total installed capacity of the market far higher than the total installed capacity of the market under the supply and demand adjustment mechanism. Additionally, the average growth rate of the market total installed capacity under PAB is also higher than the average growth rate under the supply and demand adjustment mechanism. The difference between the annual installed capacity under the PAB bidding mechanism and that under the high elasticity of supply and demand adjustment mechanism is the largest.
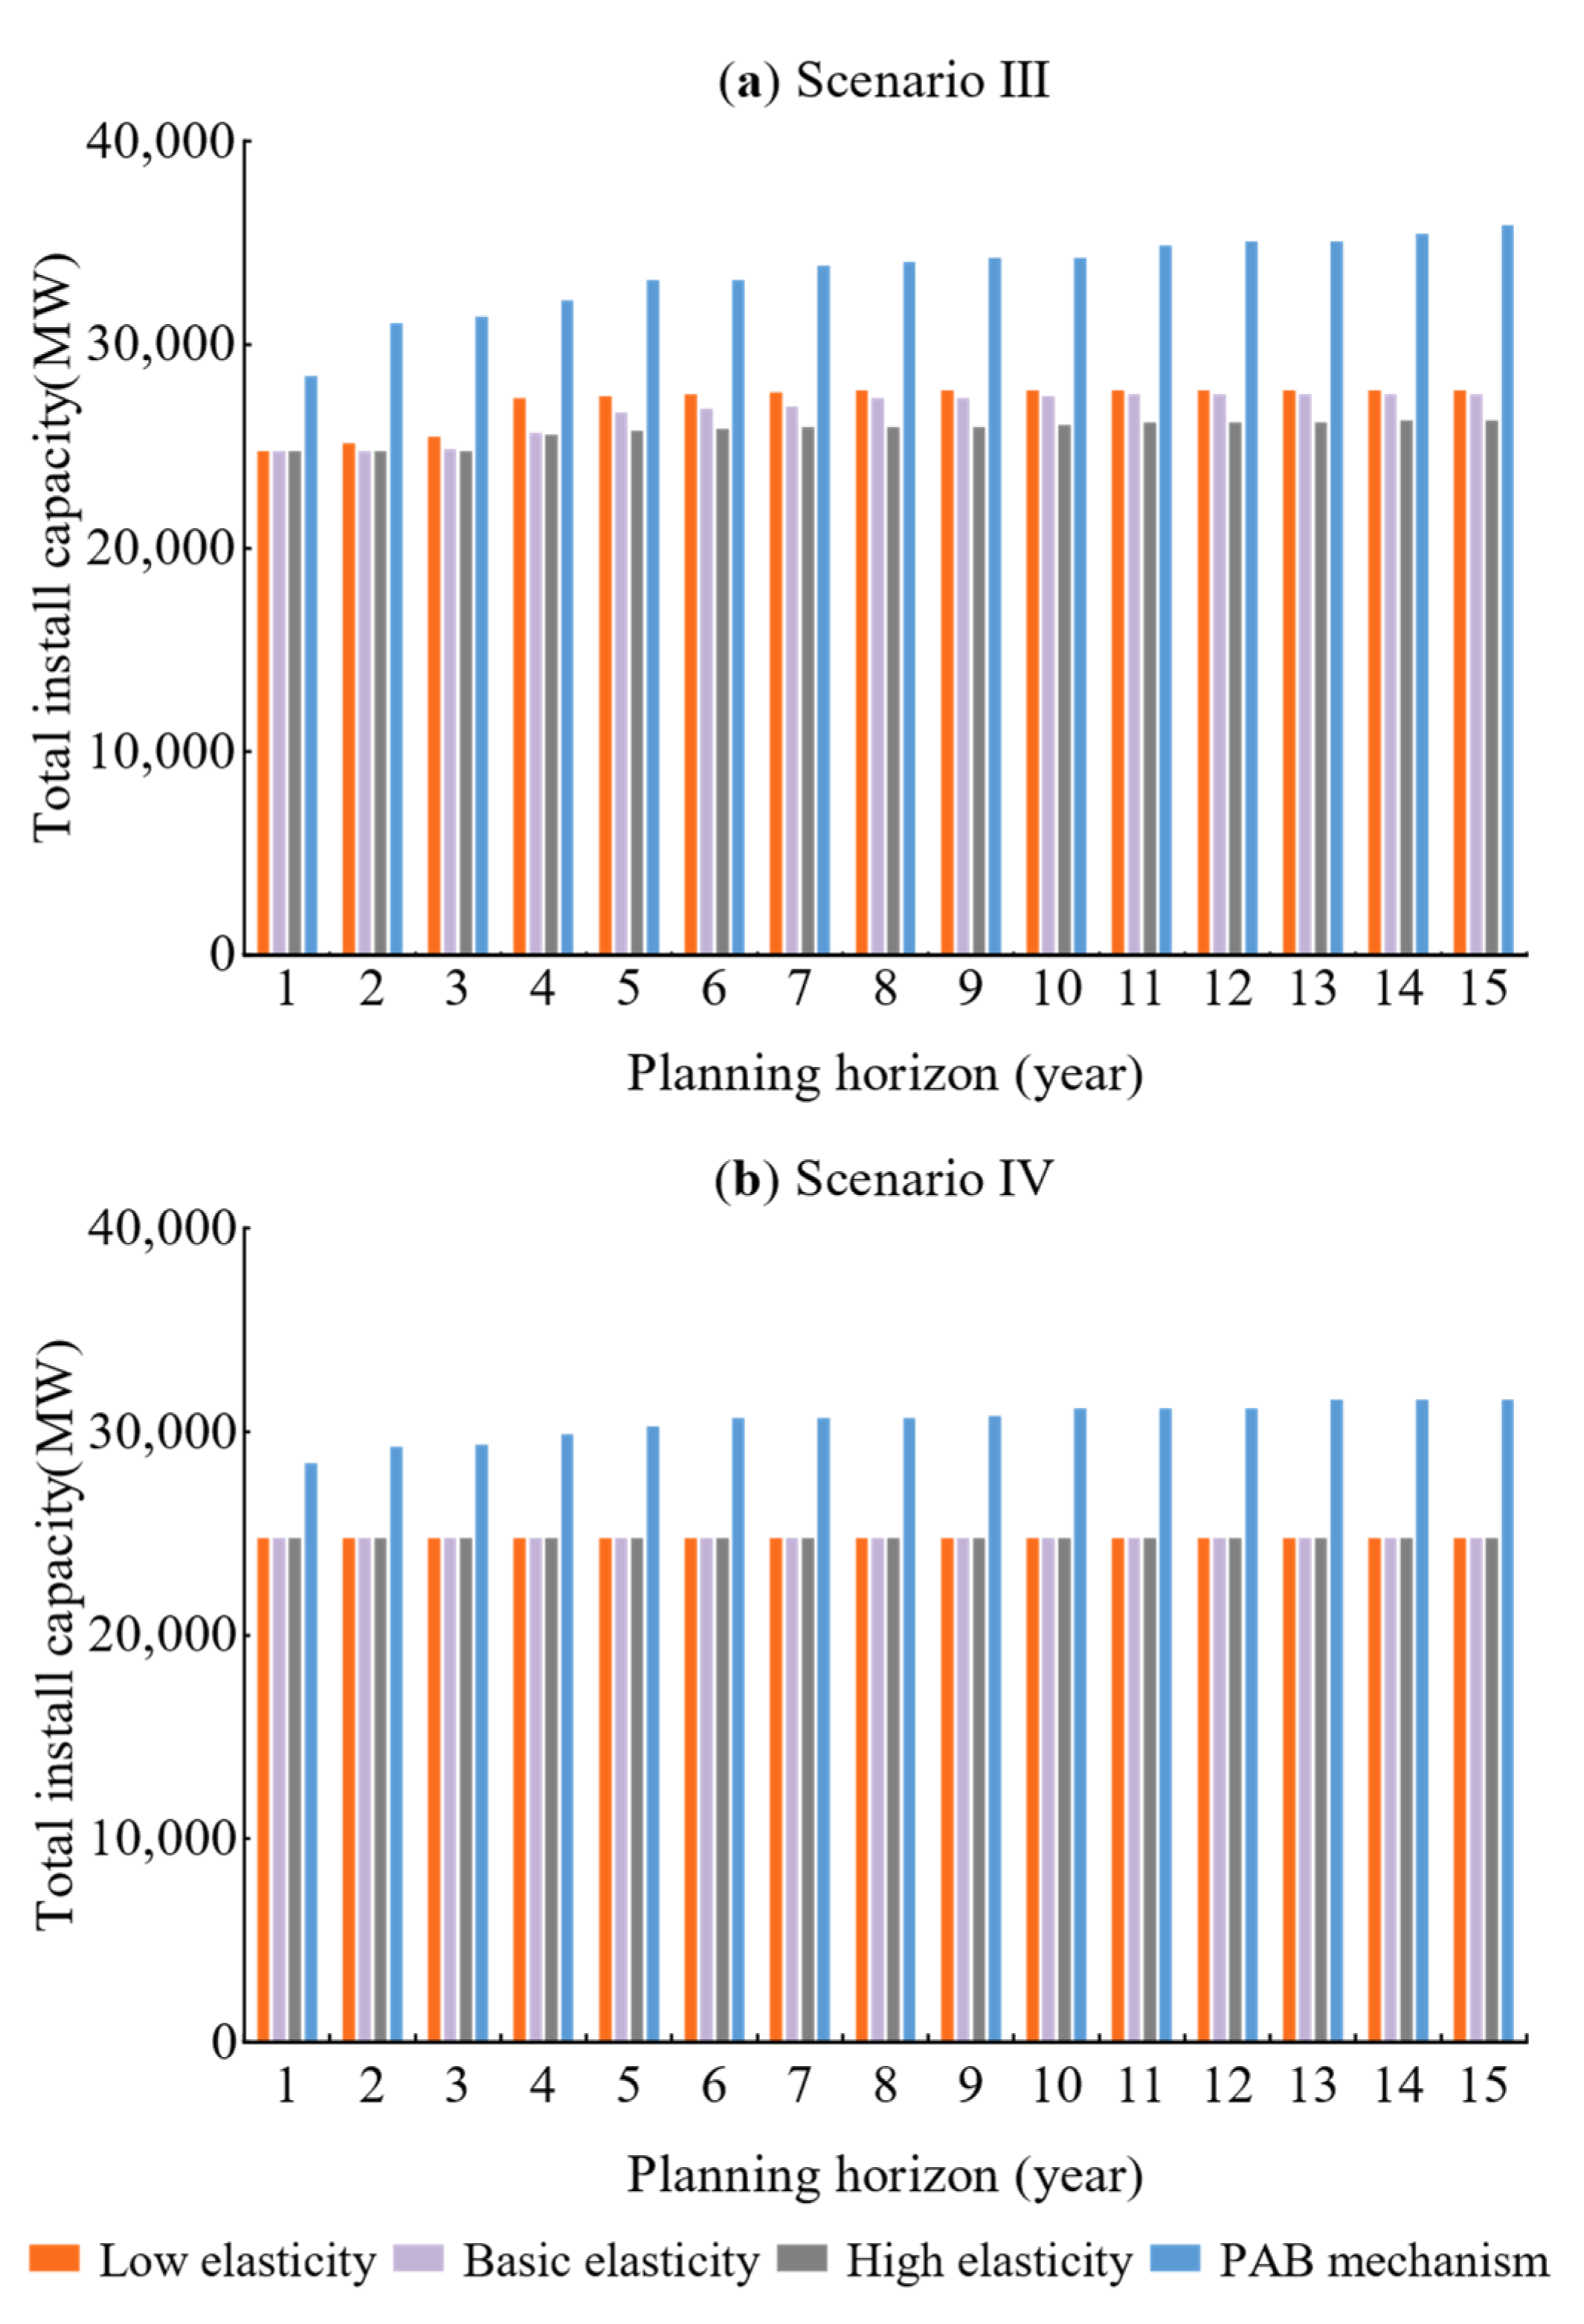
3.2.2. Scenario III
The market total installed capacity with different price elasticity of the supply and demand adjustment mechanism and PAB under Scenario III is shown in Figure 6a.
Under the supply and demand adjustment mechanism, the low demand in the first five years results in a relatively high increase in market installed capacity only in the third year. However, in the 6th to 10th year, since the market demand will not increase any more, the market total installed capacity only slightly increases. Additionally, after the 10th year, as demand decreases, the market no longer adds new units in the final few years of planning. The average installed growth rate under different elasticities in Scenario III is shown in Table 4, and the average growth rate of low elasticity is twice that of high elasticity. The evolution of the market’s total installed capacity indicates that the supply–demand adjustment mechanism can effectively regulate the balance of supply and demand in the market.
In Scenario III, the growth rate of market total installed capacity under the PAB bidding mechanism is further reduced compared to Scenarios I and II, with an average growth rate of 2.02%, as shown in Table 4. However, the market total installed capacity still increases after the 5th year, as shown in Figure 6a, and it is still much higher than the installed capacity under the supply and demand adjustment mechanism, and there is a greater difference in the gap of total installed capacity under the two electricity price formation mechanisms.
3.2.3. Scenario IV
In Scenario IV, since the demand is assumed to decline from the second year and the initial market installed capacity is higher than the demand, under the supply and demand adjustment mechanism, the market total installed capacity does not change regardless of the price elasticity, and no new capacity is added to the market, as shown in Figure 6b. However, under the PAB bidding mechanism, even if the market demand falls, the market total installed capacity still rises when the price of electricity falls more sharply. However, less new installed capacity is added compared to Scenario III, and the average installed capacity growth rate is only 1.6%. The evolution result of the market total installed capacity under PAB reflects the “responsible for their own profits and losses“ characteristic of the power generation group in free competition.
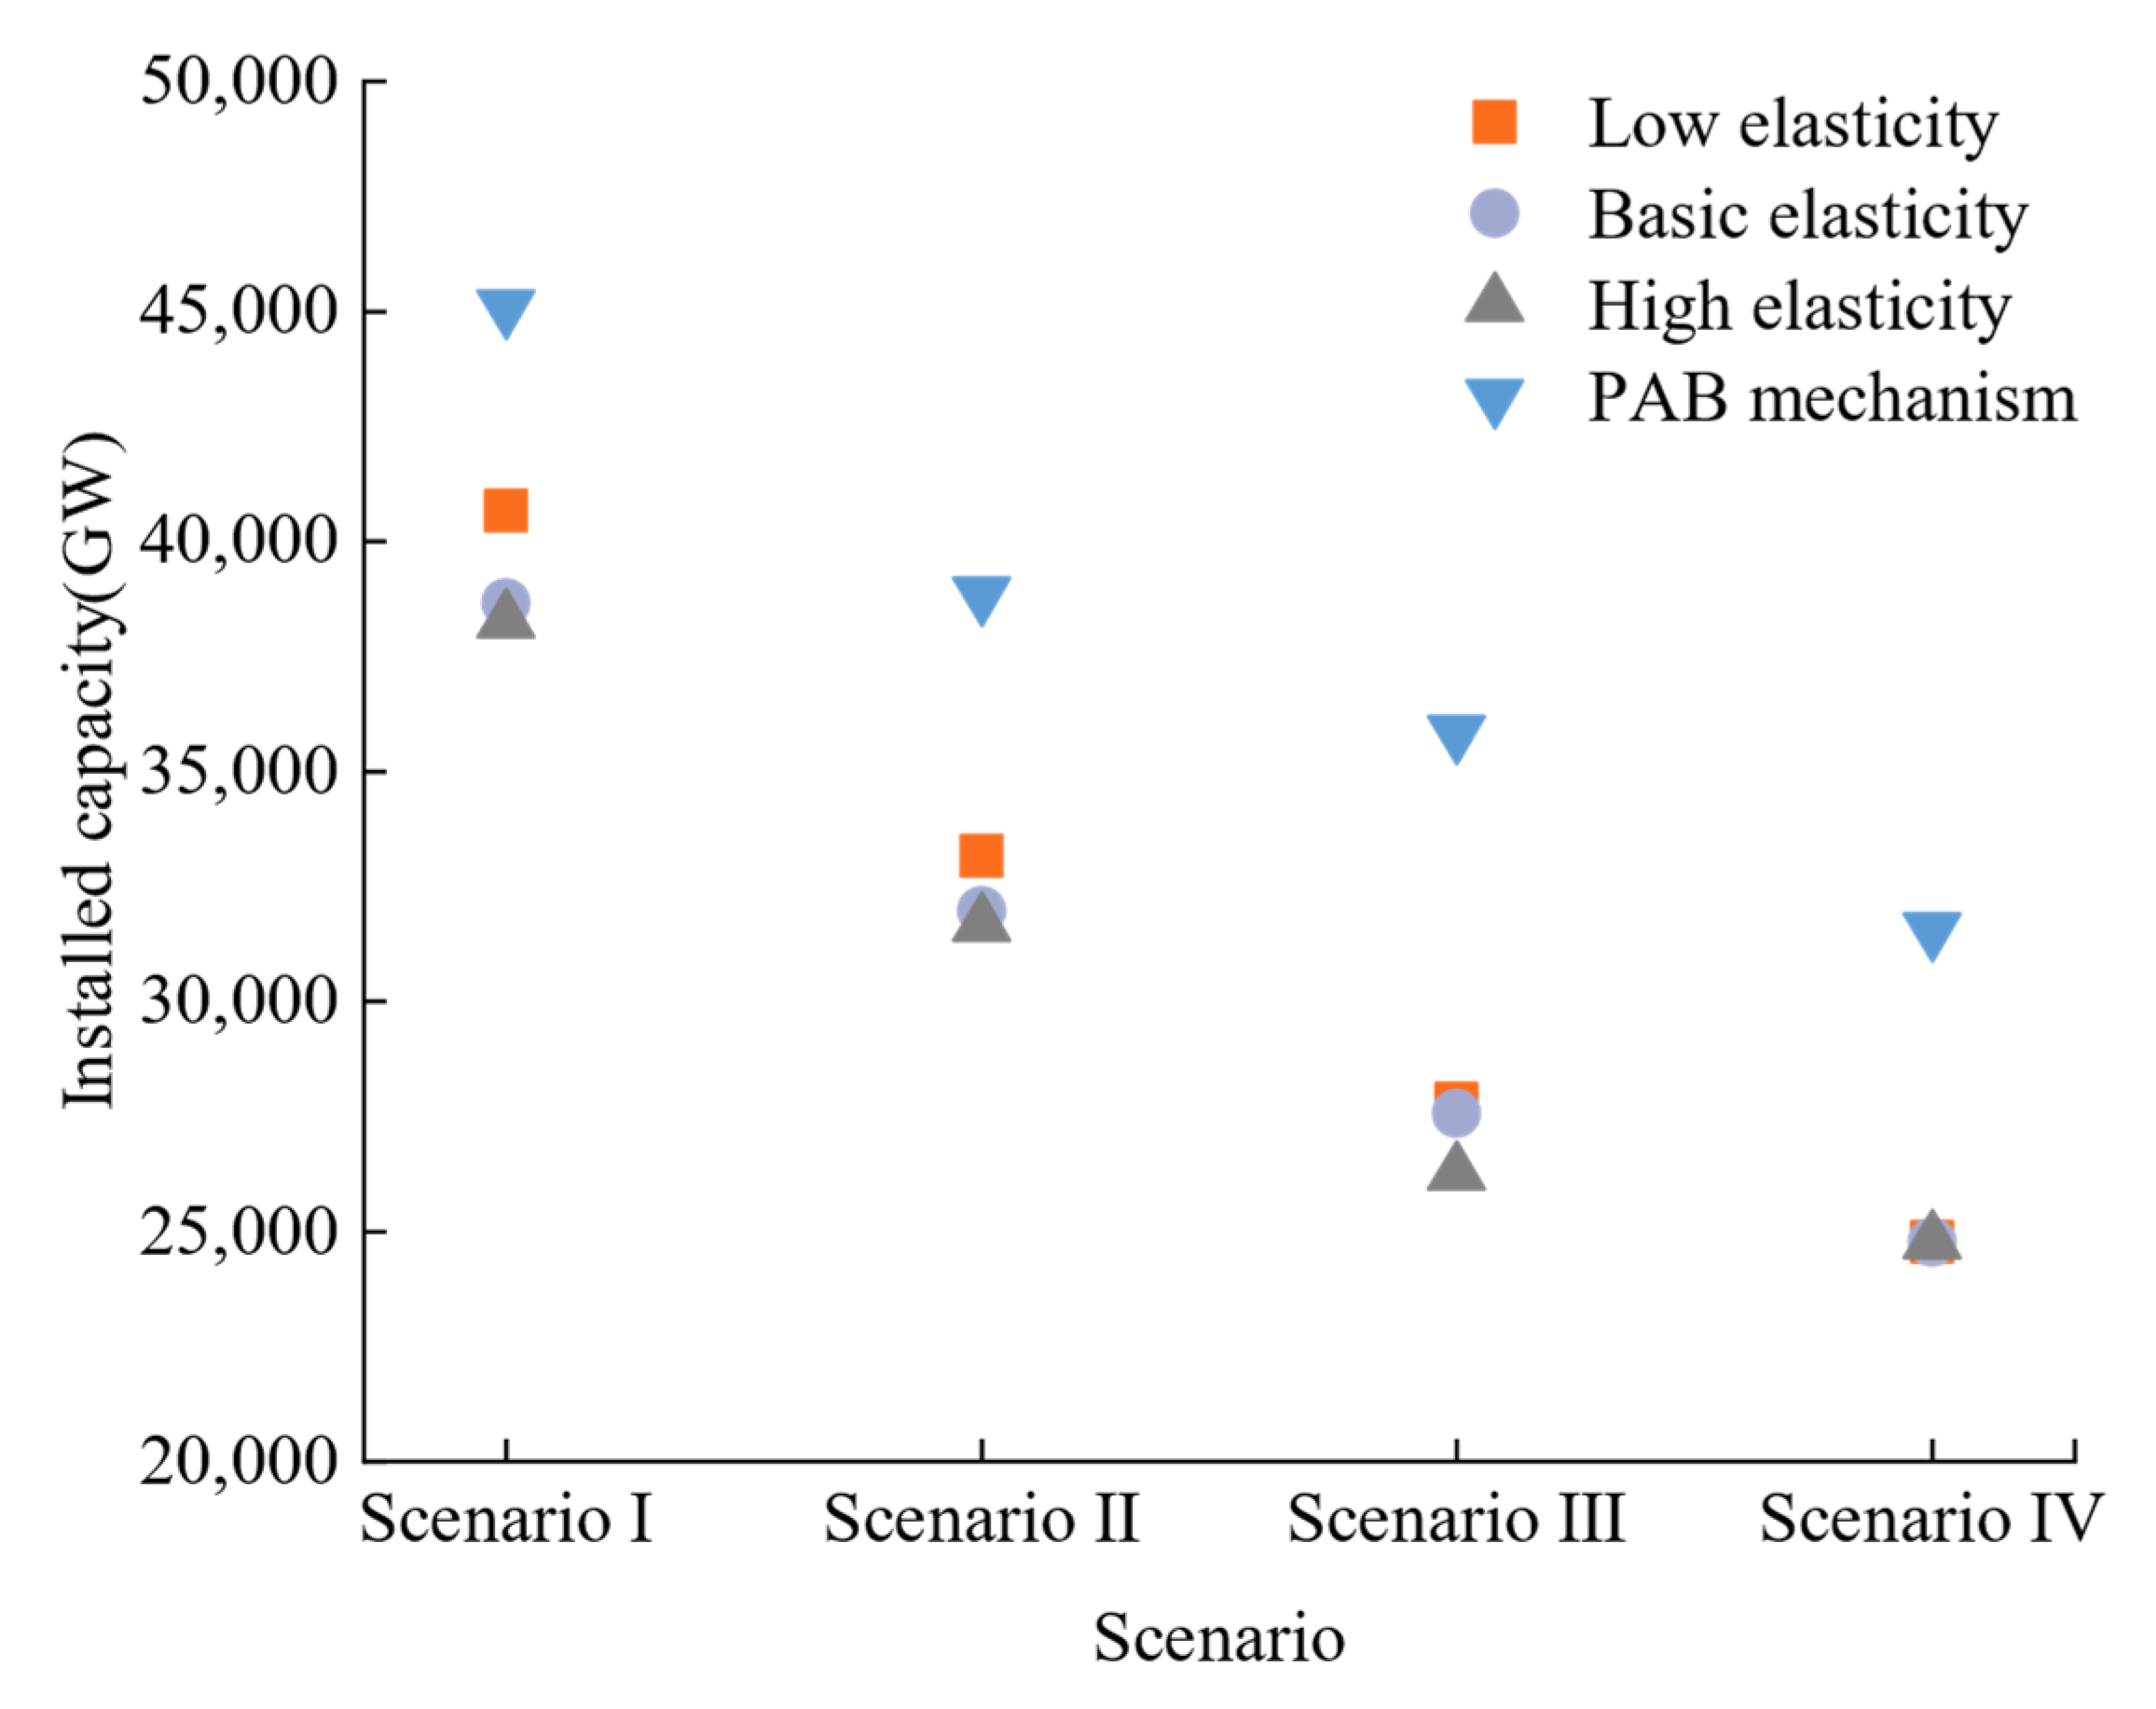
According to the above analysis, the market total installed capacity after the completion of planning under the PAB bidding mechanism and the supply and demand adjustment mechanism shows large differences from each other in different scenarios, as shown in Figure 7. The market installed capacity under the supply and demand adjustment mechanism is relatively low and decreases with the increase in price elasticity when the demand is positive. Additionally, when the market demand is comparatively reduced, the installed capacity under the condition of high price elasticity is closer to the total installed capacity under the condition of medium price elasticity in Scenario I and Scenario II. However, the installed capacity of the market will not increase regardless of the elasticity if the market demand always grows negatively. The market final installed capacity under the PAB bidding mechanism is higher than the supply and demand adjustment mechanism in all four scenarios, and the market is more active in terms of power investment and has some foresight on the evolution of installed capacity in the future market.
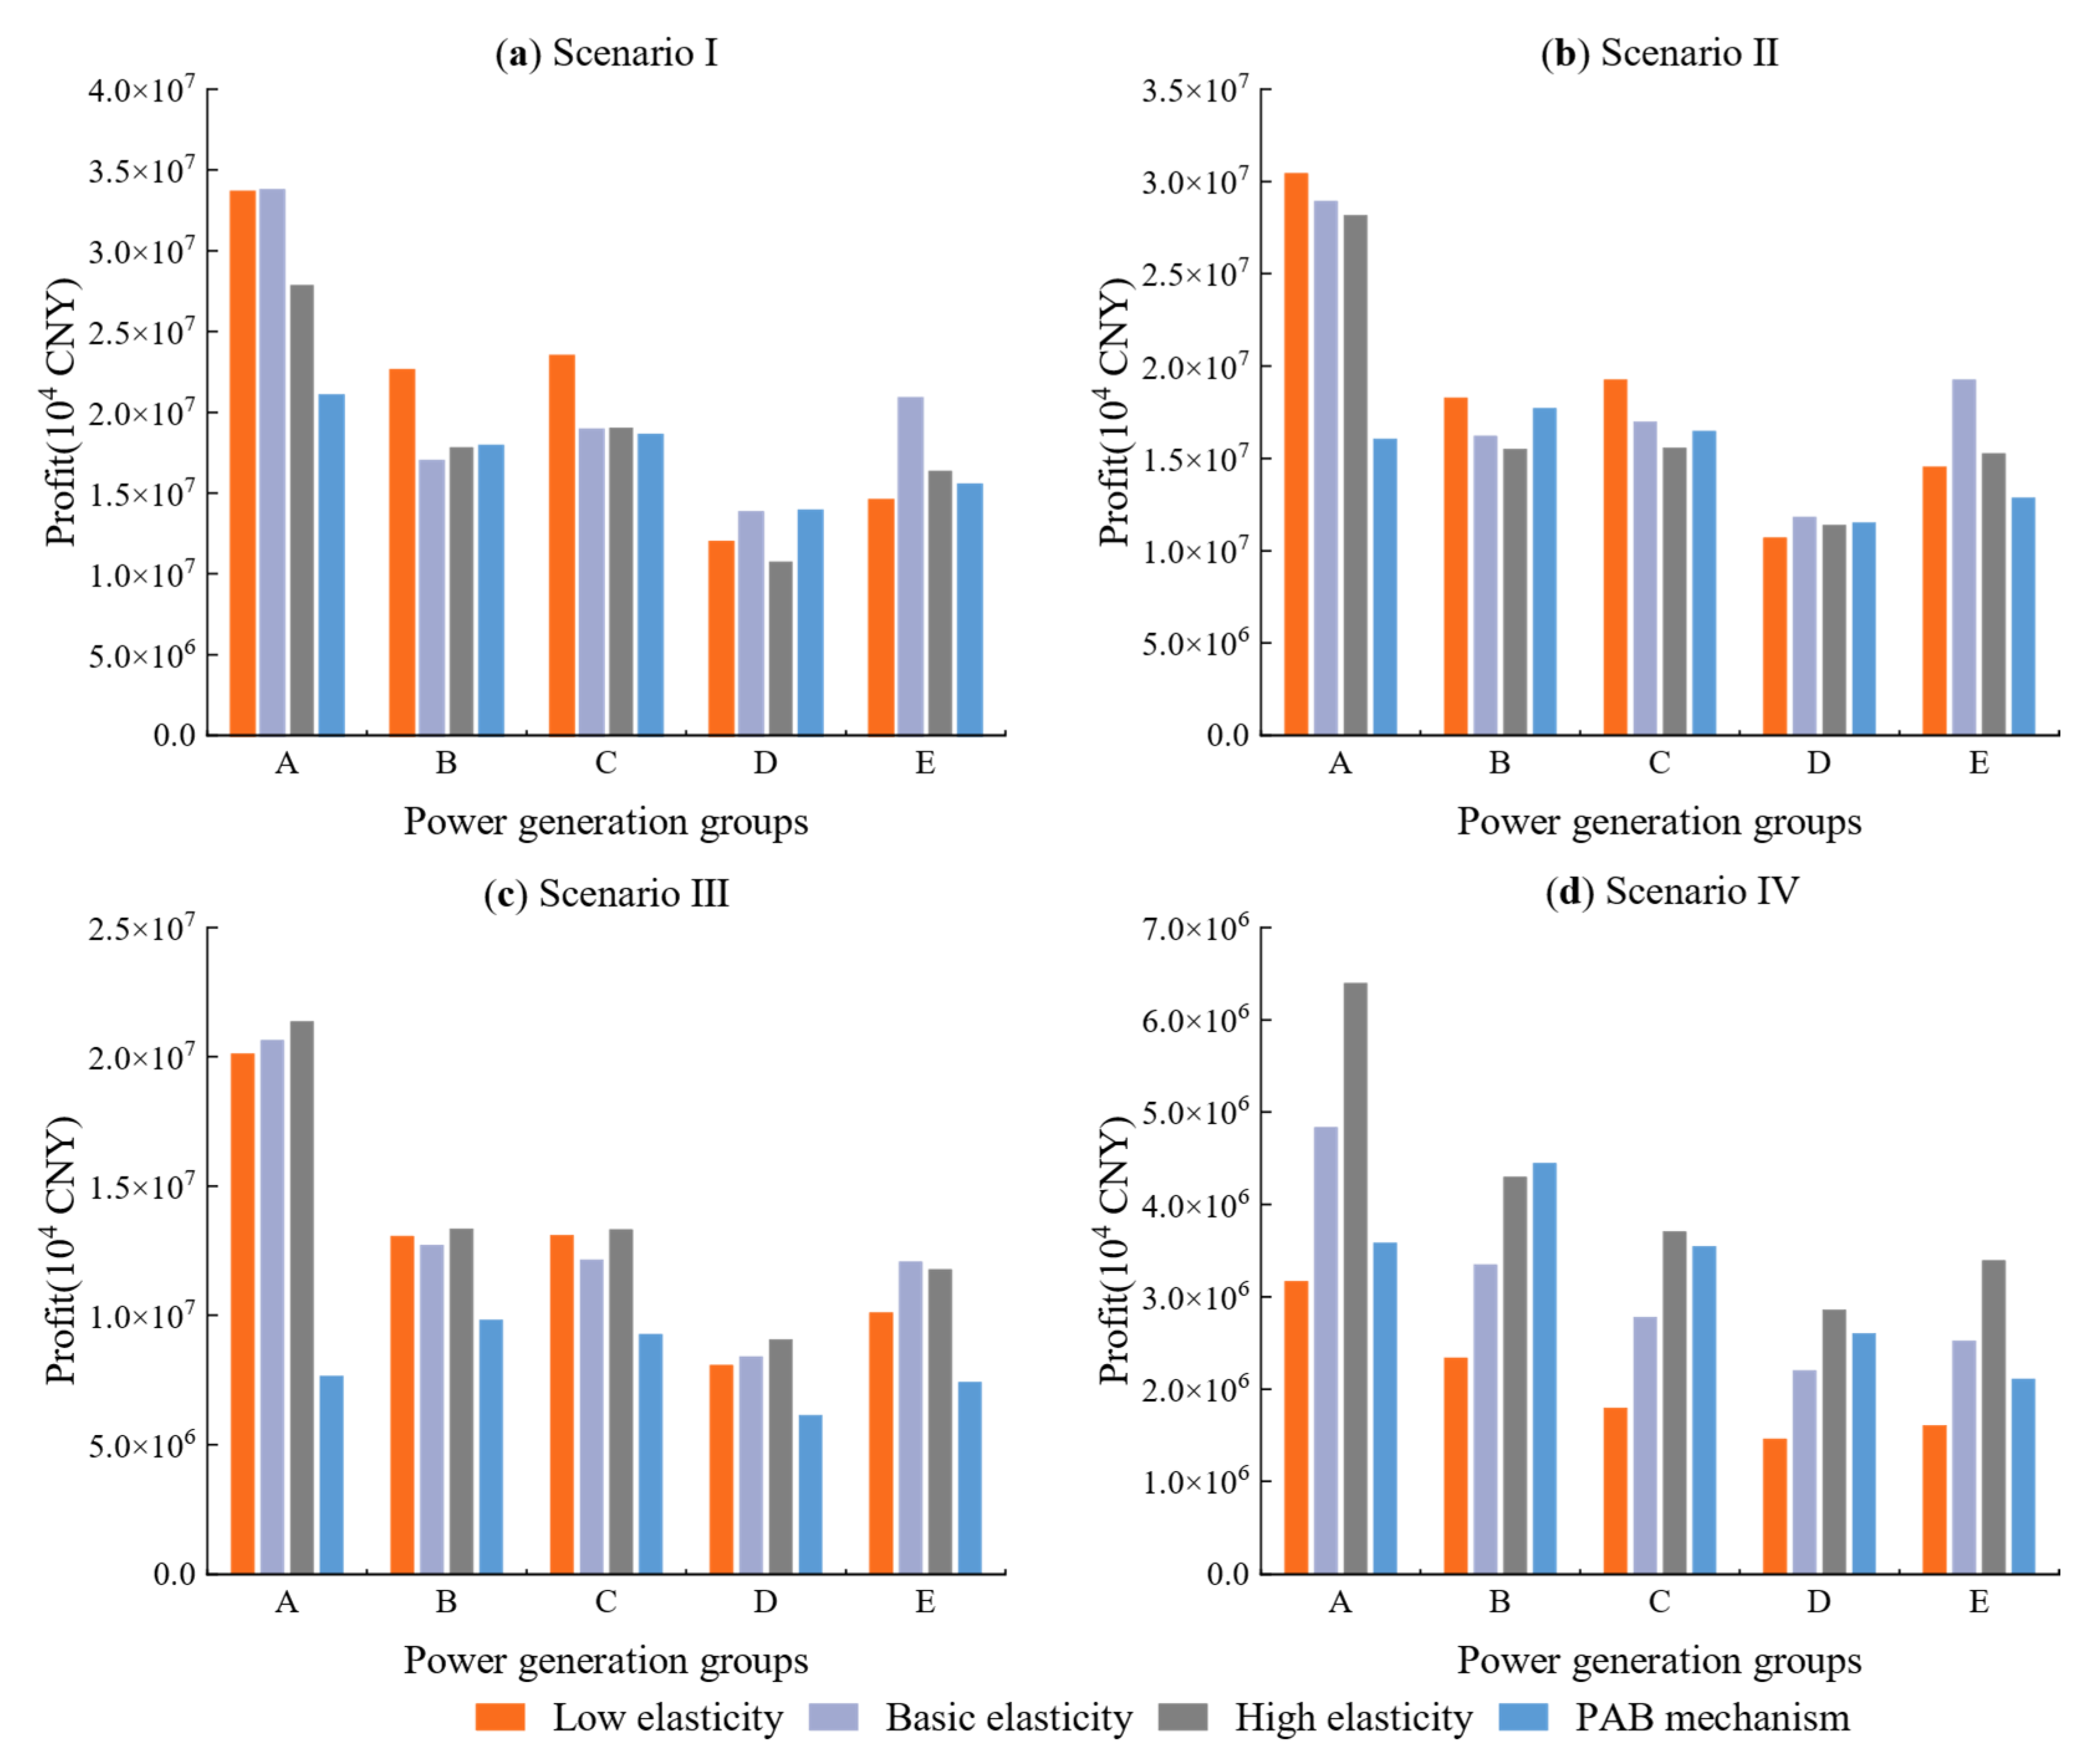
3.3. Comparative Analysis of the Profits of Power Generation Groups
Different electricity price formation mechanisms make the market electricity price and the total installed capacity of the market different, which will affect the profit of market power generation groups. The total profit in the planning period of each power generation group under different electricity price formation mechanisms for four scenarios is shown in Figure 8.
Under the supply–demand adjustment mechanism, the total profit of power generation group A is higher than the other four power generation groups during the planning period, regardless of the changes in market demand and price elasticity. There are two reasons here. First, there is no real competition among the power generation groups under the supply–demand adjustment mechanism, and power generation group A has the most initial installed capacity among the five power generation groups. Thus, group A can provide more supply power volume and occupy a larger share of power generation, its revenue from electricity sales is higher than the other power generation groups, and investment pressure is relatively low. The second is that under the condition of meeting the market demand, other power generation groups can provide relatively low supply capacity, and most of the revenue is used to add new units, which has high investment cost pressure. In Scenario 4, even though each power generation group has not put new units into operation during the planning period, the demand is decreasing as a whole, resulting in power generation groups with less initial installed capacity having lower power generation volumes and lower incomes. The impact of different elasticity levels on the profit of each power generation enterprise is different. In Scenario I, Scenario II, and Scenario III, the profit gap between different elasticity levels of power generation groups is relatively small. However, in Scenario IV, the profit gap between different elasticity levels of power generation groups is large and increases with the increase in elasticity.
Additionally, under the PAB mechanism, there is a real competitive relationship between each power generation group. The share of the power generation of the power generation group is obtained through competition, which is the supply power volume that the market allows the power generation group to provide. If the electricity price quoted by power generation group A is higher than the marginal electricity price, power generation group A failed in bidding and is not qualified to trade electricity online in that year, which is no income from electricity sales. Meanwhile, if the electricity price quoted by power generation group A is exactly equal to the marginal price, the bidding is deemed to be successful, but not all the reported electricity quantities are allowed to be traded. Only when the sum of the reported electricity quantities of the power generation groups whose reported electricity price is lower than the marginal price does not meet the market demand will the excess demand be provided by power generation group A. Additionally, power generation group A has a part of the electricity quantities that are eligible for online trading and can obtain some revenue. The above case may also occur for other power generation groups in the competitive process each year. Therefore, in the four scenarios, the total profit of power generation group A during the planning period is not always higher than that of other power generation groups. Additionally, it can be seen that the total profit gap between the five power generation groups is smaller than that of the supply and demand adjustment mechanism.
To sum up, under the supply and demand adjustment mechanism, large power generation groups tend to occupy a large share of power generation in the market, which is not conducive to the balanced development of each power generation group. At the same time, there is a risk that the supply power generation volume in the market will be monopolized, resulting in a situation in which one large power generation group is dominant. Under the PAB mechanism, all power generation groups compete fairly, and large power generation groups do not necessarily occupy a very large share of power generation. Therefore, the PAB mechanism is more conducive to the development of small- and medium-sized power generation groups and the promotion of healthy competition in the power generation market and does not easily lead to a monopoly phenomenon in the electricity market.
4. Conclusions
In this paper, against the background of continuously deepening electricity marketization reform, a three-layer multi-agent model framework for the power generation market is constructed using multi-agent modeling methods to describe the interaction process among the generation market entities in the market competition environment. The PAB bidding mechanism is introduced as a method to determine the market electricity price in the decision-making process of power generation groups. Additionally, the impact of the supply and demand adjustment mechanism and the PAB bidding mechanism on the long-term evolution of the power generation market is analyzed through four different load demand scenarios. Through case comparison analyses, under the supply and demand adjustment mechanism, different price elasticity parameters can lead to significant differences in the market electricity price evolution, which have different impacts on the total installed capacity of the market and the profit of power generation groups. Additionally, a more desirable power generation market evolution result may not be provided under the supply and demand adjustment mechanism due to the price elasticity parameter being uncertain. Compared to the supply and demand adjustment mechanism, the PAB bidding mechanism can effectively avoid the impact of unreasonable market parameter settings, and the result of the power generation market evolution is more scientific and reasonable. Under the PAB bidding mechanism, the electricity price evolution result is completely determined by market competition. The PAB average electricity price is lower than the price under the supply and demand adjustment mechanism for almost the entire planning period, but the total installed capacity of the market is higher, and the power investment in the market is more active. Additionally, from the comparative analysis of the profits of the power generation group, it is found that the PAB bidding mechanism can effectively stimulate competition among power generation groups and is more conducive to promoting balanced development among power generation groups of different sizes, which does not easily to form an industry monopoly. It can be seen that a method of using the PAB bidding mechanism to determine market electricity prices in the GEP problem in this paper can make the long-term evolution process of the power generation market more reliable and more consistent with the characteristics of power market liberalization. Additionally, the method is more conducive to facilitating the long-term stable development of the power-generation-side market and can provide certain reference significance for implementing reasonable market competition rules in the power market. At present, there are still some deficiencies in this article. This article only conducts a comparative analysis of the PAB bidding mechanism and the supply and demand adjustment mechanism, without studying the MCP bidding mechanism. We know that the MCP bidding mechanism is very similar to the PAB bidding mechanism. Unlike the PAB bidding mechanism, the power generation groups that successfully bid use the uniform market-clearing price as the transaction price under the MCP bidding mechanism, that is, the transaction price of all generation groups is the same. The introduction of the MCP bidding mechanism to determine the market price under the long-term evolution of the power generation market should yield different and interesting results compared to PAB and the supply and demand adjustment mechanism, which require subsequent in-depth studies.
Author Contributions
Conceptualization, X.H.; methodology, X.H.; software, K.L.; validation, K.L.; formal analysis, K.L.; investigation, K.L.; writing—original draft preparation, K.L.; writing—review and editing, K.L.; visualization, K.L.; supervision, X.H.; project administration, X.H.; funding acquisition, X.H. All authors have read and agreed to the published version of the manuscript.
Funding
This research was funded in part by the National Key R & D Plan Foundation of China, grant number 2021YFB2601300.
Data Availability Statement
Not applicable.
Conflicts of Interest
The authors declare no conflict of interest.
References
- Sadeghi, H.; Rashidinejad, M.; Abdollahi, A. A comprehensive sequential review study through the generation expansion planning. Renew. Sustain. Energy Rev. 2017, 67, 1369–1394. [Google Scholar] [CrossRef]
- Costa, C.R.d.S.; Ferreira, P. A Review on the Internalization of Externalities in Electricity Generation Expansion Planning. Energies 2023, 16, 1840. [Google Scholar] [CrossRef]
- Khodaei, A.; Shahidehpour, M. Microgrid-Based Co-optimization of generation and transmission planning in power systems. IEEE Trans. Power Syst. 2013, 28, 1582–1590. [Google Scholar] [CrossRef]
- You, S.; Hadley, S.W.; Shankar, M.; Liu, Y. Co-optimizing generation and transmission expansion with wind power in large-scale power grids—Implementation in the US Eastern Interconnection. Electr. Power Syst. Res. 2016, 133, 209–218. [Google Scholar] [CrossRef] [Green Version]
- David, A.K.; Zhao, R.-D. Integrating expert system with dynamic programming in generation expansion planning. IEEE Trans. Power Syst. 1989, 4, 1095–1101. [Google Scholar] [CrossRef]
- Murugan, P.; Kannan, S.; Baskar, S. Application of NSGA-II algorithm to single-objective transmission constrained generation expansion planning. IEEE Trans. Power Syst. 2009, 24, 1790–1797. [Google Scholar] [CrossRef]
- Murugan, P.; Kannan, S.; Baskar, S. NSGA-II algorithm for multi-objective generation expansion planning problem. Electr. Power Syst. Res. 2009, 79, 622–628. [Google Scholar] [CrossRef]
- Jadidoleslam, M.; Ebrahimi, A. Reliability constrained generation expansion planning by a modified shuffled frog leaping algorithm. Int. J. Electr. Power Energy Syst. 2015, 64, 743–751. [Google Scholar] [CrossRef]
- Diewvilai, R.; Audomvongseree, K. Optimal loss of load expectation for generation expansion planning considering fuel unavailability. Energies 2022, 15, 7854. [Google Scholar] [CrossRef]
- Seddighi, A.H.; Ahmadi-Javid, A. Integrated multiperiod power generation and transmission expansion planning with sustainability aspects in a stochastic environment. Energy 2015, 86, 9–18. [Google Scholar] [CrossRef]
- Sharan, I.; Balasubramanian, R. Integrated generation and transmission expansion planning including power and fuel transportation constraints. Energy Policy 2012, 43, 275–284. [Google Scholar] [CrossRef]
- Lemos-Cano, S.; McCalley, J. Co-optimized analysis and design of electric and natural gas infrastructures. Energies 2019, 12, 2012. [Google Scholar] [CrossRef] [Green Version]
- Li, C.; Conejo, A.J.; Liu, P.; Omell, B.P.; Siirola, J.D.; Grossmann, I.E. Mixed-integer linear programming models and algorithms for generation and transmission expansion planning of power systems. Eur. J. Oper. Res. 2022, 297, 1071–1082. [Google Scholar] [CrossRef]
- Budi, R.F.S.; Sarjiya; Hadi, S.P. Multi-level game theory model for partially deregulated generation expansion planning. Energy 2021, 237, 121565. [Google Scholar] [CrossRef]
- Haghighi, R.; Yektamoghadam, H.; Dehghani, M.; Nikoofard, A. Generation expansion planning using game theory approach to reduce carbon emission: A case study of Iran. Comput. Ind. Eng. 2021, 162, 107713. [Google Scholar] [CrossRef]
- Pereira, A.J.C.; Saraiva, J.T. A decision support system for generation expansion planning in competitive electricity markets. Electr. Power Syst. Res. 2010, 80, 778–787. [Google Scholar] [CrossRef] [Green Version]
- Moghddas-Tafreshi, S.M.; Shayanfar, H.A.; Lahijii, A.S.; Rabiee, A.; Aghaei, J. Generation expansion planning in Pool market: A hybrid modified game theory and particle swarm optimization. Energy Convers. Manag. 2011, 52, 1512–1519. [Google Scholar] [CrossRef]
- Hemmati, R.; Hooshmand, R.A.; Khodabakhshian, A. Reliability constrained generation expansion planning with consideration of wind farms uncertainties in deregulated electricity market. Energy Convers. Manag. 2013, 76, 517–526. [Google Scholar] [CrossRef]
- Navidi, M.; Moghaddas-Tafreshi, S.M.; Anvari-Moghaddam, A. A game theoretical approach for sub-transmission and generation expansion planning utilizing multi-regional energy systems. Int. J. Electr. Power Energy Syst. 2020, 118, 105758. [Google Scholar] [CrossRef]
- Sarjiya; Budi, R.F.S.; Hadi, S.P. Game theory for multi-objective and multi-period framework generation expansion planning in deregulated markets. Energy 2019, 174, 323–330. [Google Scholar] [CrossRef]
- Pereira, A.J.C.; Saraiva, J.T. A long-term generation expansion planning model using system dynamics—Case study using data from the Portuguese/Spanish generation system. Electr. Power Syst. Res. 2013, 97, 41–50. [Google Scholar] [CrossRef] [Green Version]
- Dong, G.C.; Thomas, V.M. An electricity generation planning model incorporating demand response. Energy Policy 2012, 42, 429–441. [Google Scholar]
- Botterud, A.; Korpas, M. A stochastic dynamic model for optimal timing of investments in new generation capacity in restructured power systems. Int. J. Electr. Power Energy Syst. 2007, 29, 163–174. [Google Scholar] [CrossRef]
- Valinejad, J.; Barforoushi, T. Generation expansion planning in electricity markets: A novel framework based on dynamic stochastic MPEC. Int. J. Electr. Power Energy Syst. 2015, 70, 108–117. [Google Scholar] [CrossRef]
- Tómasson, E.; Hesamzadeh, M.R.; Söder, L.; Biggar, D.R. An incentive mechanism for generation capacity investment in a price-capped wholesale power market. Electr. Power Syst. Res. 2020, 189, 106708. [Google Scholar] [CrossRef]
- Villalobos, C.; Negrete-Pincetic, M.; Figueroa, N.; Lorca, Á.; Olivares, D. The impact of short-term pricing on flexible generation investments in electricity markets. Energy Econ. 2021, 98, 105213. [Google Scholar] [CrossRef]
- Aliabadi, D.E.; Kaya, M.; Şahin, G. An agent-based simulation of power generation company behavior in electricity markets under different market-clearing mechanisms. Energy Policy 2017, 100, 191–205. [Google Scholar] [CrossRef]
- Motamedisedeh, O.; Ostadi, B.; Zagia, F.; Kashan, A.H. A novel optimization model for biding in the deregulated power market with pay as a bid settlement mechanism, based on the stochastic market clearing price. Electr. Power Syst. Res. 2022, 210, 108122. [Google Scholar] [CrossRef]
- Gnansounou, E.; Pierre, S.; Quintero, A.; Dong, J.; Lahlou, A. A multi-agent approach for planning activities in decentralized electricity markets. Knowl. -Based Syst. 2007, 20, 406–418. [Google Scholar] [CrossRef]
- Mason, K.; Qadrdan, M.; Jenkins, N. Investing in generation and storage capacity in a liberalised electricity market: An agent based approach. Appl. Energy 2021, 294, 116905. [Google Scholar] [CrossRef]
- Neshat, N.; Amin-Naseri, M.R. Cleaner power generation through market-driven generation expansion planning: An agent-based hybrid framework of game theory and Particle Swarm Optimization. J. Clean. Prod. 2015, 105, 206–217. [Google Scholar] [CrossRef]
- Mehrabadi, R.A.; Moghaddam, M.P.; Sheikh-El-Eslami, M.K. Regulatory-intervented sustainable generation expansion planning in multi-electricity markets. Sustain. Cities Soc. 2020, 52, 101794. [Google Scholar] [CrossRef]
- Pereira, A.J.C.; Saraiva, J.T. Generation expansion planning (GEP)—A long-term approach using system dynamics and genetic algorithms (GAs). Energy 2011, 36, 5180–5199. [Google Scholar] [CrossRef]
- Mohammadi, M.; Nafar, M.; Nasiraghdam, H.; Azadbakht, B. Micro-Grid Optimization as Grid-Connected in Pool-Based Power Market Under Pay-as-Bid and Uniform Pricing. Int. Rev. Electr. Eng. 2012, 7, 4236–4248. [Google Scholar]
- Zhen, L.; Yan, J.; Shi, Y.; Shi, Y.R.; Zhu, K.W.; Pu, G.Q. Multi-agent based experimental analysis on bidding mechanism in electricity auction markets. Int. J. Electr. Power Energy Syst. 2012, 43, 696–702. [Google Scholar]
- Wu, J.H.; Wang, J.D.; Kong, K.Y. Strategic bidding in a competitive electricity market: An intelligent method using multi-agent transfer learning based on reinforcement learning. Energy 2022, 256, 124657. [Google Scholar] [CrossRef]
- Pourmoosavi, M.A.; Amraee, T. Low carbon generation expansion planning with carbon capture technology and coal phase-out under renewable integration. Int. J. Electr. Power Energy Syst. 2021, 128, 106715. [Google Scholar] [CrossRef]
- Shayanfar, H.A.; Lahiji, A.S.; Aghaei, J.; Rabiee, A. Generation Expansion Planning in pool market: A hybrid modified game theory and improved genetic algorithm. Energy Convers. Manag. 2009, 50, 1149–1156. [Google Scholar] [CrossRef]
- National Energy Administration of China. National Electricity Industry Statistics for 2021. 2022. Available online: https://news.bjx.com.cn/html/20220304/1207999.shtml (accessed on 4 April 2023). (In Chinese).
Figure 1.
Market dynamic adjustment process considering supply and demand.

Figure 2.
Schematic diagram of PAB bidding mechanism.

Figure 3.
Generation-side market multi-agent model framework.

Figure 4.
Evolution results of electricity price under the PAB mechanism and supply–demand adjustment mechanism.
Figure 4.
Evolution results of electricity price under the PAB mechanism and supply–demand adjustment mechanism.

Figure 5.
Evolution results of installed capacity of PAB mechanism and supply–demand adjustment mechanism in Scenario I and Scenario II.
Figure 5.
Evolution results of installed capacity of PAB mechanism and supply–demand adjustment mechanism in Scenario I and Scenario II.

Figure 6.
Evolution results of installed capacity of PAB mechanism and supply–demand adjustment mechanism in Scenario III and Scenario IV.
Figure 6.
Evolution results of installed capacity of PAB mechanism and supply–demand adjustment mechanism in Scenario III and Scenario IV.

Figure 7.
The market total installed capacity after planning under the PAB bidding mechanism and supply and demand adjustment mechanism.
Figure 7.
The market total installed capacity after planning under the PAB bidding mechanism and supply and demand adjustment mechanism.

Figure 8.
Total profit of each group during the planning period under the supply and demand adjustment mechanism and PAB mechanism.
Figure 8.
Total profit of each group during the planning period under the supply and demand adjustment mechanism and PAB mechanism.


Table 1.
Type and quantity of initial units owned by five power generation groups.
| Groups No. | Coal#1 | Coal#2 | Hydro#1 | Hydro #2 | Gas#1 | Gas#2 | Wind#1 | Wind#2 | PV | Nuclear |
|---|---|---|---|---|---|---|---|---|---|---|
| A | 7 | 6 | 3 | 3 | 1 | 2 | 4 | 2 | 46 | 1 |
| B | 4 | 3 | 1 | 3 | 1 | 1 | 2 | 2 | 29 | 1 |
| C | 3 | 4 | 3 | 4 | 1 | 1 | 2 | 2 | 22 | 0 |
| D | 2 | 2 | 3 | 2 | 1 | 1 | 3 | 3 | 26 | 0 |
| E | 2 | 5 | 2 | 2 | 0 | 1 | 2 | 1 | 20 | 0 |
Table 2.
Existing and pending unit types and their parameters.
| Unit No. | Unit Type | Unit Size (MW) | Investment Cost (100 Million CNY/Set) | O&M Cost Including Fuel (CNY/MWh) | Annual Utilization Hours/h | Minimum Technical Output |
|---|---|---|---|---|---|---|
| 1 | Coal#1 | 200 | 8.9 | 245.6 | 6000 | 0.3 |
| 2 | Coal#2 | 400 | 10.2 | 225.5 | 6000 | 0.3 |
| 3 | Hydro#1 | 100 | 3.2 | 82.5 | 2500 | 0 |
| 4 | Hydro#2 | 200 | 5.9 | 75.5 | 2500 | 0 |
| 5 | Gas#1 | 100 | 4.5 | 566.6 | 5000 | 0.3 |
| 6 | Gas#2 | 300 | 10.3 | 509.5 | 5000 | 0.3 |
| 7 | Wind#1 | 100 | 2.5 | 110 | 3200 | 0.2 |
| 8 | Wind#2 | 200 | 4.8 | 100.5 | 3200 | 0.2 |
| 9 | PV | 20 | 3.8 | 85.5 | 3500 | 0 |
| 10 | Nuclear | 400 | 67.7 | 84 | 7100 | 0.4 |
Table 3.
Assumption of the annual growth rate of initial reference demand at different stages in the planning period in four scenarios (the reference demand for the first year is 23,500 MW).
Table 3.
Assumption of the annual growth rate of initial reference demand at different stages in the planning period in four scenarios (the reference demand for the first year is 23,500 MW).
| 1~5 Years | 6~10 Years | 11~15 Years | |
|---|---|---|---|
| Scenario I | 0.04 | 0.04 | 0.04 |
| Scenario II | 0.04 | 0.025 | 0.015 |
| Scenario III | 0.04 | 0 | −0.015 |
| Scenario IV | −0.02 | −0.02 | −0.02 |
Table 4.
The average growth rate of market installed capacity in the planning period under the PAB mechanism and the supply–demand adjustment mechanism considering different elasticity in different scenarios.
Table 4.
The average growth rate of market installed capacity in the planning period under the PAB mechanism and the supply–demand adjustment mechanism considering different elasticity in different scenarios.
| Low Elasticity | Basic Elasticity | High Elasticity | PAB Mechanism | |
|---|---|---|---|---|
| Scenario I | 0.0338 | 0.030 | 0.0296 | 0.0414 |
| Scenario II | 0.0200 | 0.0172 | 0.0166 | 0.031 |
| Scenario III | 0.0078 | 0.0072 | 0.0039 | 0.0202 |
| Scenario IV | 0 | 0 | 0 | 0.016 |
Disclaimer/Publisher’s Note: The statements, opinions and data contained in all publications are solely those of the individual author(s) and contributor(s) and not of MDPI and/or the editor(s). MDPI and/or the editor(s) disclaim responsibility for any injury to people or property resulting from any ideas, methods, instructions or products referred to in the content. |
© 2023 by the authors. Licensee MDPI, Basel, Switzerland. This article is an open access article distributed under the terms and conditions of the Creative Commons Attribution (CC BY) license (https://creativecommons.org/licenses/by/4.0/).
Share and Cite
MDPI and ACS Style
Huang, X.; Liu, K. Impact of Electricity Price Expectation in the Planning Period on the Evolution of Generation Expansion Planning in the Market Environment. Energies 2023, 16, 3328. https://0-doi-org.brum.beds.ac.uk/10.3390/en16083328
AMA Style
Huang X, Liu K. Impact of Electricity Price Expectation in the Planning Period on the Evolution of Generation Expansion Planning in the Market Environment. Energies. 2023; 16(8):3328. https://0-doi-org.brum.beds.ac.uk/10.3390/en16083328
Chicago/Turabian StyleHuang, Xian, and Kun Liu. 2023. "Impact of Electricity Price Expectation in the Planning Period on the Evolution of Generation Expansion Planning in the Market Environment" Energies 16, no. 8: 3328. https://0-doi-org.brum.beds.ac.uk/10.3390/en16083328
Note that from the first issue of 2016, this journal uses article numbers instead of page numbers. See further details here.