Article

Application of a Bidirectional DC/DC Converter to Control the Power Distribution in the Battery–Ultracapacitor System

by
Adrian Chmielewski
1,*,
Piotr Piórkowski
1,
Krzysztof Bogdziński
1 and
Jakub Możaryn
2
1
Institute of Vehicles and Construction Machinery Engineering, Warsaw University of Technology, Narbutta 84 Str., 02-524 Warsaw, Poland
2
Institute of Automatic Control and Robotics, Warsaw University of Technology, Sw. A. Boboli 8, 02-525 Warsaw, Poland
*
Author to whom correspondence should be addressed.
Submission received: 29 March 2023 / Revised: 18 April 2023 / Accepted: 23 April 2023 / Published: 26 April 2023

Abstract

:
The article presents the use of the Texas Instruments LM5170EVM-BIDIR bidirectional DC/DC converter to control power distribution in a hybrid energy storage system based on a battery–ultracapacitor system. The paper describes typical topologies of connecting a battery with an ultracapacitor. The results of tests for calibration and identification of converter parameters are presented. The main innovation of the solution presented in this paper is the appropriate selection of the nominal voltage of the ultracapacitor so that the converter can be operated only in the constant current mode, in a cascade connection, excluding the low-efficiency constant voltage mode. This article demonstrated that such control allows for high efficiency and reduction of losses in the DC/DC converter, which is necessary in the case of mobile solutions. The amount of losses was determined depending on the control voltage in the operation modes of the converter: in the Step Up mode by increasing the voltage from 12 V to 24 V, from 12 V to 36 V, and from 12 V to 48 V and in the Step Down mode by decreasing the voltage from 48 V to 12 V, from 36 V to 12 V, and from 24 V to 12 V. For a calibrated converter in a semi-active topology, bench tests were carried out in a cycle with pulsating load. The tests were carried out using LiFePO4 cells with a voltage of 12 V and Maxwell ultracapacitors with a package voltage of 48 V. Power distribution in the range of 10% to 90% was achieved using the myRIO platform, which controlled the operation of the DC/DC converter based on an external current profile.

1. Introduction

1.1. Literature Review

Currently, in order to counteract progressive climate change, the European Green Deal [1] was established, which assumes in 2050 to achieve net-zero greenhouse gas emissions through the development of, i.a., sustainable and intelligent mobility [1]. It is assumed that by 2030 there will be at least 30 million electric vehicles in the EU that will be charged at three million public ultra-fast charging points in the DC CHAdeMO 3.0 (ChaoJi) standard [2,3], 900 kW power value in accordance with IEC 61851-23:2014 [4]. It is worth emphasizing that in the EU region, the transport sector is responsible for nearly 25% of greenhouse gas emissions, of which 71% are road transport [5].
Another key element supporting the achievement of climate neutrality is the sustainable development of renewable energy sources (RES). EU countries have agreed on specific targets regarding total share of RES in final energy consumption mix in the coming years, achieving 32% by 2030 [6] or up to 45% [7]. These values include renewable energy used for heating and cooling, transport, and electricity production, among others.
It should be mentioned that the regulations oblige the EU member states to simultaneous development of facilities and techniques for electricity storage, mainly for the purposes of stabilization of the power system [7], development of prosumer systems [8], development of alternative fuel infrastructure for vehicles (in particular, those with electric drive [9]), and connection of RES with the main power grid [7].
Considering the above, particular attention should be paid to electricity storage facilities [10] with high volumetric energy (batteries [11]) and power density (ultracapacitors [12]).
Ultracapacitors and batteries are used in trucks [13] as well as vehicles with purely electric drives, i.e., components of the drive system of ChariotMotors battery electric buses [13] and ultracapacitor buses [14]. They are also key elements for Gemamex Motion Co. Bulgaria Sofia charging stations (power range up to 250 kW [13]).
In a certain group of devices and energy receivers, especially for means of transport, the load is strongly dynamic/pulsating and variable in time, which was pointed out in [10]. As a result, the peak power of the load is much higher than the average load [15]. In [12], it was shown that this is a key problem from the point of view of the selection of the energy source because, on the one hand, the source must provide temporarily high peak load power, and, on the other hand, it must provide the right amount of energy. The simplest solution, presented in [12], in this case is the use of a sufficiently large energy storage—a large storage capacity ensures both the appropriate peak power and sufficient energy reserve. Unfortunately, such a solution is large, expensive, and heavy, and in the case of mobile solutions, it is often impossible to use.
As described in [12,16], an alternative is the use of hybrid energy storage (HES). It usually consists of two components—a high power source, the so-called “high power”, which is an ultracapacitor, and energy sources, the so-called “high energy”, which is an electrochemical battery. In this way, the optimized hybrid energy source is much lighter than a large energy storage while performing the same tasks [17,18].
Another example of the need to use an HES based on a battery and an ultracapacitor may be starting an internal combustion engine in difficult conditions [19].
Examples of such conditions are low ambient temperature [20], long breaks in engine operation [12], pulsed load [19], significant battery load at standstill to power on-board electrical devices (including the dashboard [12]), and in the start/stop systems [21] of vehicles. In the case of the latter for the electrochemical battery technology [22], the high frequency of system operation—frequent engine starts and short battery charging periods—mean that the battery discharges faster in such dynamic conditions [23], and its usable capacity and lifetime decrease [12]. Moreover, the battery parameters significantly deteriorate [24], i.a., the internal resistance of the battery increases [25] (in particular the electrolyte resistance [26]), the open circuit voltage [27], and the voltage at the terminals decreases [28]. During the start-up of internal combustion engines in such conditions, the mechanical resistance associated with increased density of engine oil also increases significantly [12], while the power and energy availability are reduced, which translates into a higher battery load and reduces its service life [29] and state of health [30,31,32,33,34,35,36,37,38]. The other disadvantages of batteries include self-discharge [31] and difficulty in early detection of impending battery discharge (often the battery is completely discharged suddenly [39] without warning signs [40]). Elimination of the described battery disadvantages can be achieved by parallel connection of the battery and ultracapacitor [41]. The properties of ultracapacitors [42] and electrochemical batteries [43] are complementary. By connecting these components in parallel, a system that combines the benefits of both of these energy stores can be achieved. It should be emphasized that a set of parallel connected ultracapacitors and electrochemical batteries features high energy [44] at the same time, which is caused by the battery. Such a set also features high power [12], which is caused by the influence of ultracapacitors [44]. Thanks to the use of ultracapacitors, the available power range is also increased, including at low temperatures [40] and at low charge levels [39].
The use of a parallel connection of the battery and the ultracapacitor makes it possible to increase the availability of the stored energy [12], even in the case of a voltage drop of the hybrid system to a value indicating complete discharge of the battery, which corresponds to SoC = 0 [45]. It is worth emphasizing that the amount of energy stored at this voltage in the ultracapacitor still allows starting the internal combustion engine [12]. The presented situation may occur in the case of vehicles used infrequently, occasionally, or in cold climates [40]; in particular, official, special vehicles [46]; as well as vehicles with increased load [47] on the DC electrical system [48], such as city buses [13]. In Poland, city buses [13], usually at the end of the line [14], must remain stationary with the engine switched off [49] while there is still a significant energy load inside them through such receivers as information boards and LCD boards, interior lighting, passenger space heating, or air conditioning.
When the vehicle is not used for a long time, the self-discharge [12] occurring in both ultracapacitors and traction batteries plays an important role, according to the subject data, amounting to several percent per month for a battery [31] and up to 30% per month for an ultracapacitor [20,50], respectively. This is of particular importance within the drive system of an electric vehicle [51].
An example is the fifth-generation BMW drive system with bidirectional DC/DC converter [52], in which the 12 V low-voltage system is responsible for switching on the 400 V high-voltage system. In the event of self-discharge of the low-voltage system, in extreme cases, when the vehicle is not used for a long time, for a year or more, it is necessary to recharge the low-voltage side battery and high-voltage side battery pack from an external charger or from a PV module. It is worth mentioning that the self-discharge process [31] can be reduced by adding PV modules to the system [53,54,55].
The next example where there is a need to use batteries and supercapacitors to store electricity are the decks of innovative electric airplanes, presented in [56,57,58,59,60]. Additional storage devices such as supercapacitors and batteries have been widely sought in the innovative field of aircraft electrification in recent decades. In [56], a topology similar to that shown in Section 1.2, parallel active hybrid BES-UC connection was adopted to achieve a dual objective: to enforce a power-sharing policy between the aircraft’s main generator and the auxiliary battery and to preserve the condition of the aircraft’s mechanical parts of the generator by using a supercapacitor to absorb/provide power peaks in the main power grid. In addition, as shown in this work, the supercapacitor can also work as an energy storage system, supplying constant power to the grid. In reference [57], similar to the topology shown in scheme of the DC/DC converter test stand, with measurements in Step Down mode, the supercapacitor is connected to the power peak absorption/supply grid by a bidirectional DC/DC converter controlled by a SubOptimal second-order sliding-mode controller.
However, in the HES there is a new problem of proper power distribution [61] between the high-power source (ultracapacitor) and the high-energy source (electrochemical battery).
Power distribution is carried out by a suitably controlled DC/DC converter [62,63]. To protect the batteries against deep discharge [64], a bidirectional DC/DC converter [65] is required to raise the output voltage of the ultracapacitor to a level safe for the battery [66].
In typical applications, the high power source supplies power directly to the receiver, and its charge is then replenished over a longer period of time from the high energy source via the converter [67]. In this way, the high energy source is loaded with a lower current value, but for a longer time, which has a very positive effect on its durability [68], especially in the case of Li-ion batteries [69].
As was shown in [70,71], in an HES, the efficiency of not only the high energy and high power sources but also the component connecting both sources, i.e., the DC/DC converter, should be considered.
In several works [61,66,68,70,71,72,73], it was shown that the DC/DC converter cannot be too large and oversized, but, at the same time, its power should be sufficiently high to be able to effectively and relatively quickly balance the charge level of the high power source. Insufficient power of the DC/DC converter does not allow it to effectively recharge the high power source within the specified time limit. On the other hand, a converter with too much power is heavy, expensive, and requires additional cooling, which was pointed out in [70]. At the same time, excessive current from an oversized converter may adversely affect the durability of the high-energy source [44,70]. From this point of view, the selection of a DC/DC converter is not a trivial task and should be made on the basis of in-depth analyses of a specific application.
The primary objective of the research presented in this paper is to investigate the feasibility of using a bi-directional DC/DC converter to manage power distribution in a hybrid energy storage system that utilizes a battery–ultracapacitor setup for mobile applications. The proposed solution comprises two components: topology selection and calibration methodology. The topology selection aims to determine the optimal nominal voltage of the ultracapacitor to enable the converter to operate solely in the constant current mode and accommodate the current external profile (ECP). The semi-active cascade connection described in this solution eliminates the need for the low-efficiency constant voltage mode, resulting in greater efficiency and reduced losses in the DC/DC converter. Additionally, the study endeavors to identify the level of losses based on the control voltage in the converter’s operational modes and conduct bench tests with pulsating loads to achieve power distribution between 10% and 90%. The DC/DC converter’s operation should be regulated based on the ECP designated during the calibration phase.

1.2. Contribution of the Paper

In the conducted research presented in this article in Section 2, it was shown that the efficiency of the converter strongly depends on its load. The efficiency of the DC/DC converter is higher for power close to the nominal value. At the same time, the efficiency of the converter is very low for fractional power. Hence, the important conclusion is that the converter should work as much as possible with the highest power, i.e., in the constant current (CC) charging mode, which has been demonstrated in this article.
This article is structured as follows. Section 2 presents the procedure for calibrating the bidirectional DC/DC converter for later use in power distribution control in an HES based on a battery and an ultracapacitor. This section also presents power loss characteristics in different control modes. The configuration and description of the test stand with the DC/DC converter, which was placed between the ultracapacitor and the battery in the semi-active topology, is also presented (see Figure 1d). Section 3 presents the results of research on different values of power distribution in an HES based on a battery and an ultracapacitor in a semi-active topology with a DC/DC converter. Finally, Section 4 provides the synthetic view of the conclusions.

2. Materials and Methods

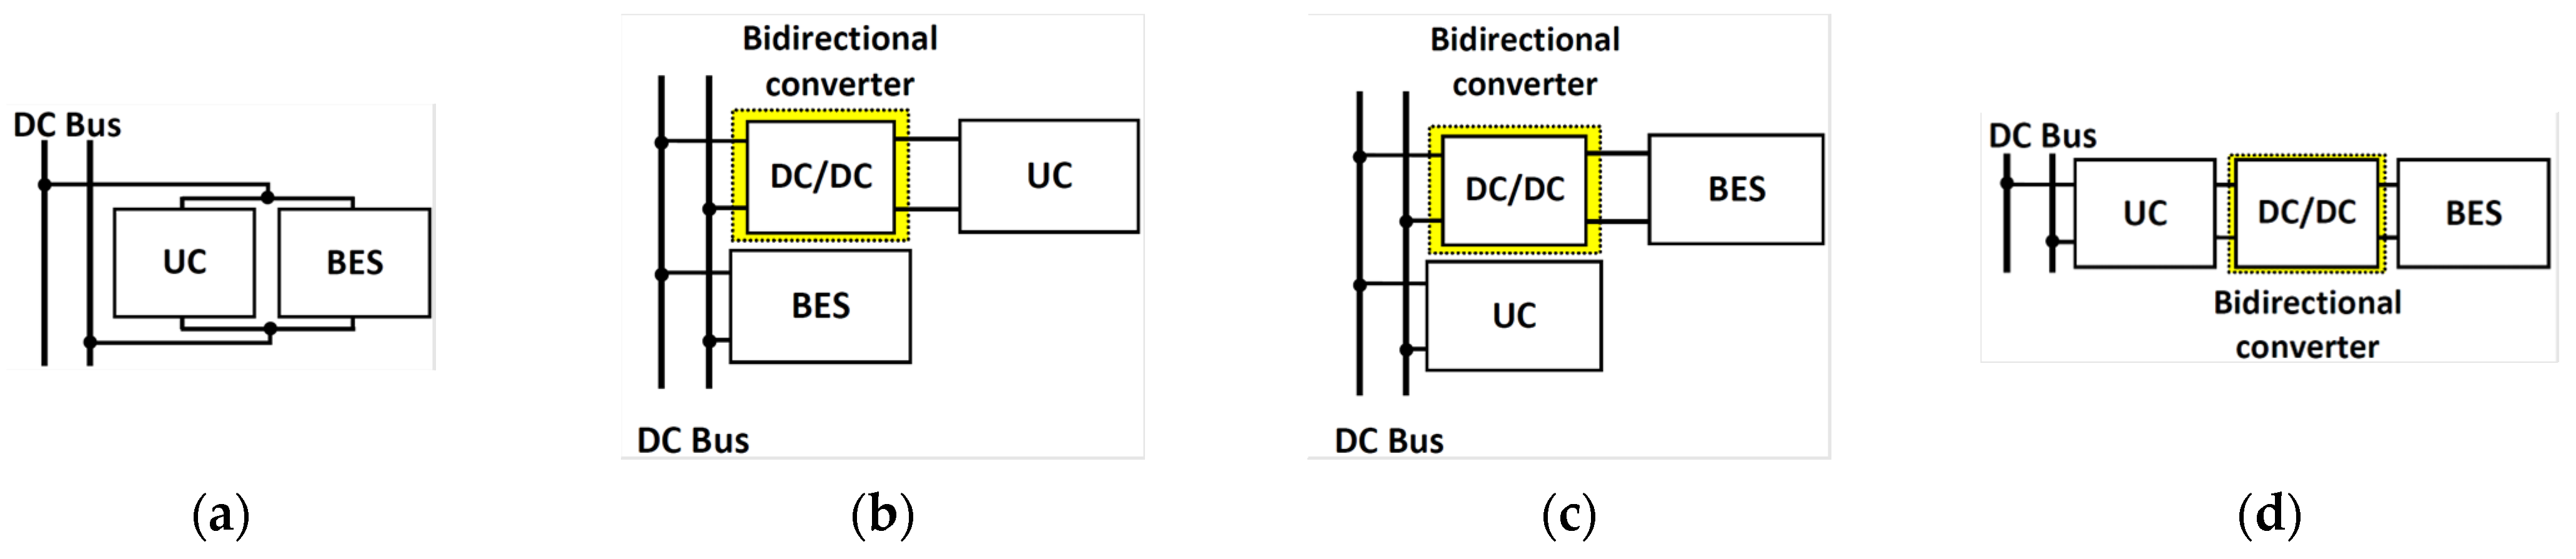
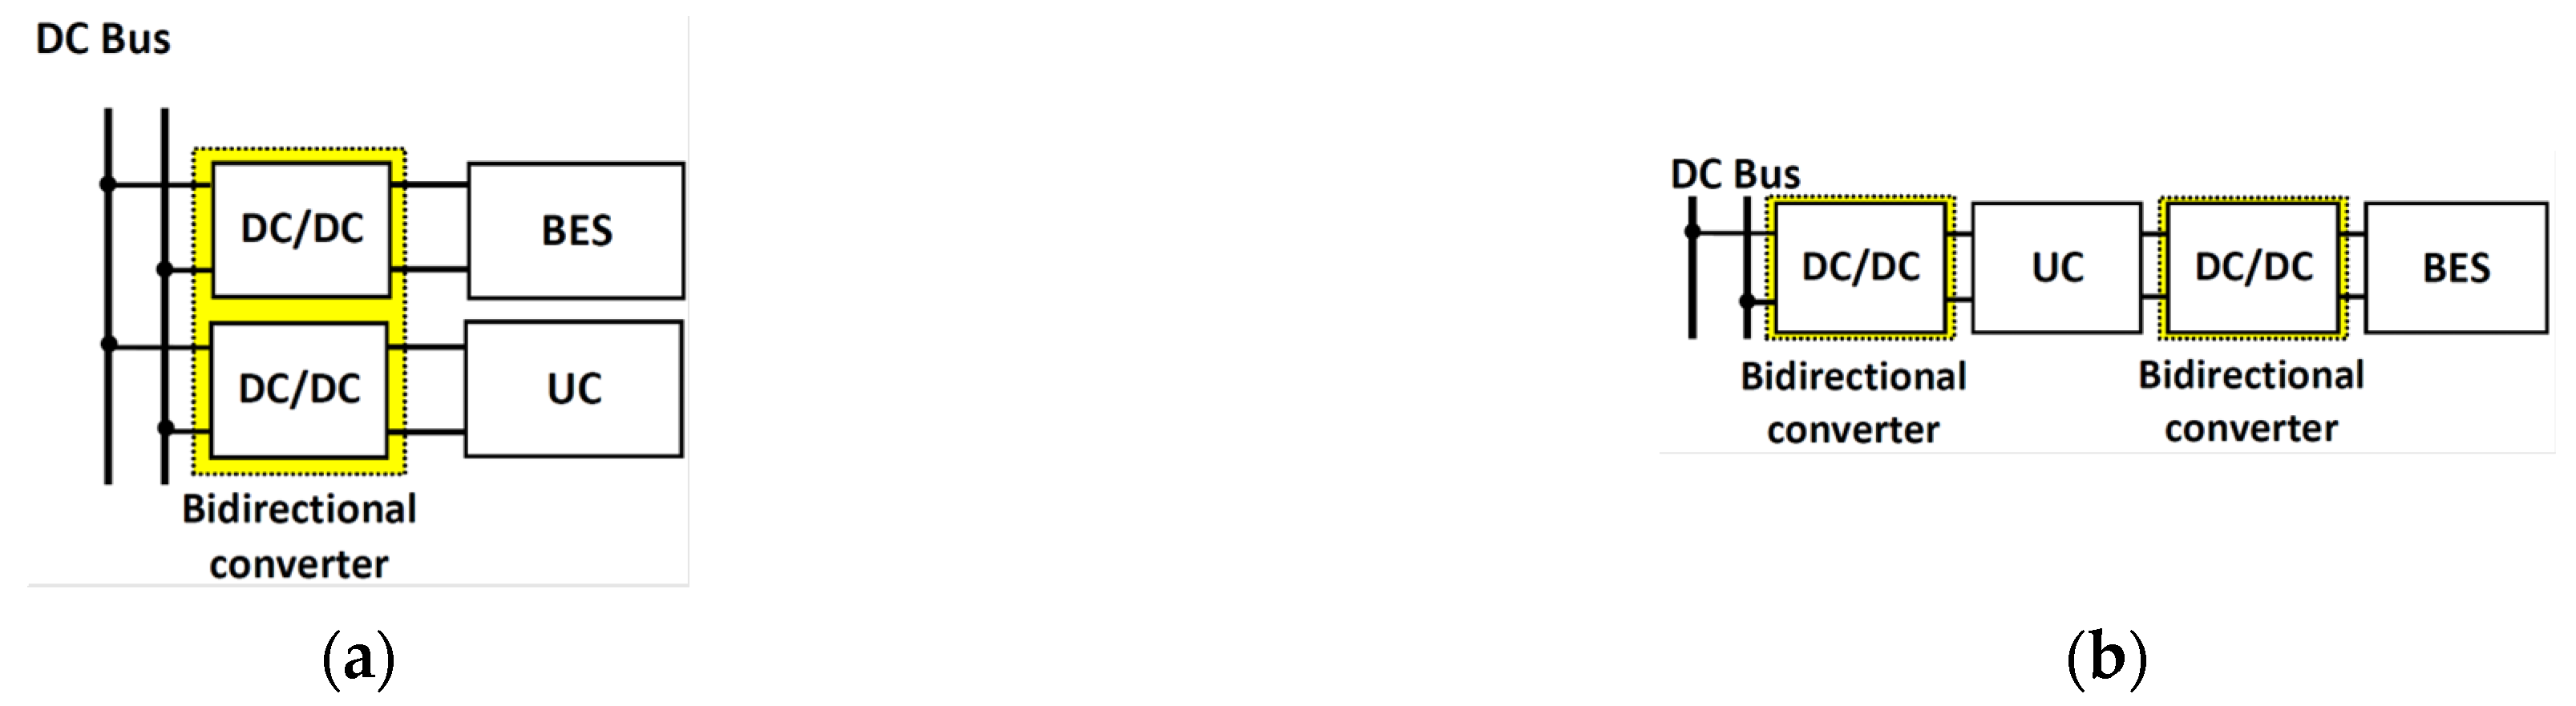
2.1. Battery and Ultracapacitor Connection Topologies

This subsection presents the battery–ultracapacitor connection topologies [18,74,75]. As indicated in scientific papers [18,44,48,51,66,70,71], the following connection topologies of both components are most common: passive, semi-active, and active. Such topologies are presented in Figure 1.
The easiest to implement is the parallel connection in the passive topology (Figure 1a), where the battery and the ultracapacitor are physically connected in parallel with each other [44]. In such a connection [75], there is no control of the power distribution between the battery and the ultracapacitor, and the voltage that is set at the terminals of the HES system is the resultant [18].
As presented in [44,48,61,64], the semi-active topology means that one energy storage is connected directly to the energy source/receiver, while the other energy storage can partially participate in the energy expenditure through an adjustable DC/DC converter.
Mostly, in the scientific literature [18,44,61], there are semi-active solutions with one converter located in front of the ultracapacitor (Figure 1b) or the battery (Figure 1c). When the converter is placed in front of the ultracapacitor (Figure 1b), the battery is directly connected to the DC bus. One of the main disadvantages of such a solution is greater voltage oscillation at the battery terminals due to higher current loads, which directly affects the life of the cells. During high current loads, electrodynamic forces appear on the cells, which affect the change of stresses inside the cell and faster degradation of the active material [76]. In the second case, when the battery is separated from the DC bus by the DC/DC converter (Figure 1c), it operates in optimal ranges (currents do not exceed the limit values [44]), while the uninsulated ultracapacitor takes over voltage and frequency fluctuations in the DC bus [64]. In order to eliminate voltage fluctuations, it is necessary to use ultracapacitors with higher capacitances in the system, which directly translates into higher system costs.
This paper presents a semi-active topology where a DC/DC converter is placed between an ultracapacitor connected directly to the DC line and a battery (see Figure 1d). The topology shown in Figure 1d was used to carry out the experimental studies in Section 3.
In this topology, the converter should work with the highest power as far as possible, i.e., in the constant current (CC) charging mode. Operation in the constant voltage (CV) charging mode by definition limits the value of the charging current and consequently reduces the efficiency of the converter and increases energy losses. Therefore, the CV mode should be limited and preferably not used at all. The conducted tests have shown that the condition for limiting losses and high efficiency of the converter operation is its operation only in the CC mode, bypassing the CV mode (see Section 2.2). A similar advantage for the semi-active topology was pointed out in [62,68,77], where the ultracapacitor is connected directly to the DC bus.
The consequence of using only the CC mode is the risk of undercharging the high power source, which was pointed out in [68]. The laboratory tests presented in this article show that this problem can be solved by appropriate selection of the nominal voltage of the high power source to the voltage in the DC bus line (see Figure 1d). In a situation where the nominal voltage of the high power source is sufficiently higher than the voltage in the DC bus line, then the high power source can be easily recharged with full power only in the CC mode, bypassing the CV mode. In this way, the DC/DC converter works with the highest efficiency all the time, which was pointed out in [68,77]. The topology shown in Figure 1d was used to carry out the experimental studies in Section 3.
Another approach is a parallel active connection topology via bidirectional DC/DC converters (Figure 2a). In such a system, it is possible to assign active power distribution using a specific control strategy, e.g., in the areas of the highest battery efficiency in the SoC range from 0.2 to 0.9 (possible power distribution from 0% to 100% between both components), as shown in the works [18,70,78]. Two DC/DC converters have been used in network applications. In this configuration, the converter can be programmed in such a way that the ultracapacitor reacts to short-term and high voltage spikes with high frequency [75] while regulating the voltage on the DC/DC bus [44]. The battery can provide energy for low frequencies with small voltage amplitudes for small values of current loads, e.g., up to several C, which is described in the works [65,70,75]. In the active cascade connection topology (Figure 2b), two DC/DC converters are used, which isolate the ultracapacitor and the battery from the DC bus.
The converter, which is located in front of the battery, is usually current controlled to ensure a smooth exchange of energy with the battery [44]. Such control allows for resignation from the complicated charging process (especially in the case of Li-ion batteries [34,35]), where various charging conditions should be taken into account in order to fully charge the cell. Normally, the charging process takes place in two phases: I—constant current CC, and II—constant voltage CV. In the CV charging phase application of the voltage equalizing is required, carried out through passive or active balancing, which is time-consuming. It is particularly important during intermittent operation when connected to renewable sources, e.g., wind farms or photovoltaic modules, which has been highlighted in the works [55,77,79]). The second converter, which isolates the ultracapacitor (UC) from the DC bus, is voltage controlled. Its purpose is to stabilize the voltage in the DC bus and absorb high frequencies in the network. As a result of the use of two converters, there are higher power losses in the system associated with multiple energy conversion, which was pointed out in [64,70].

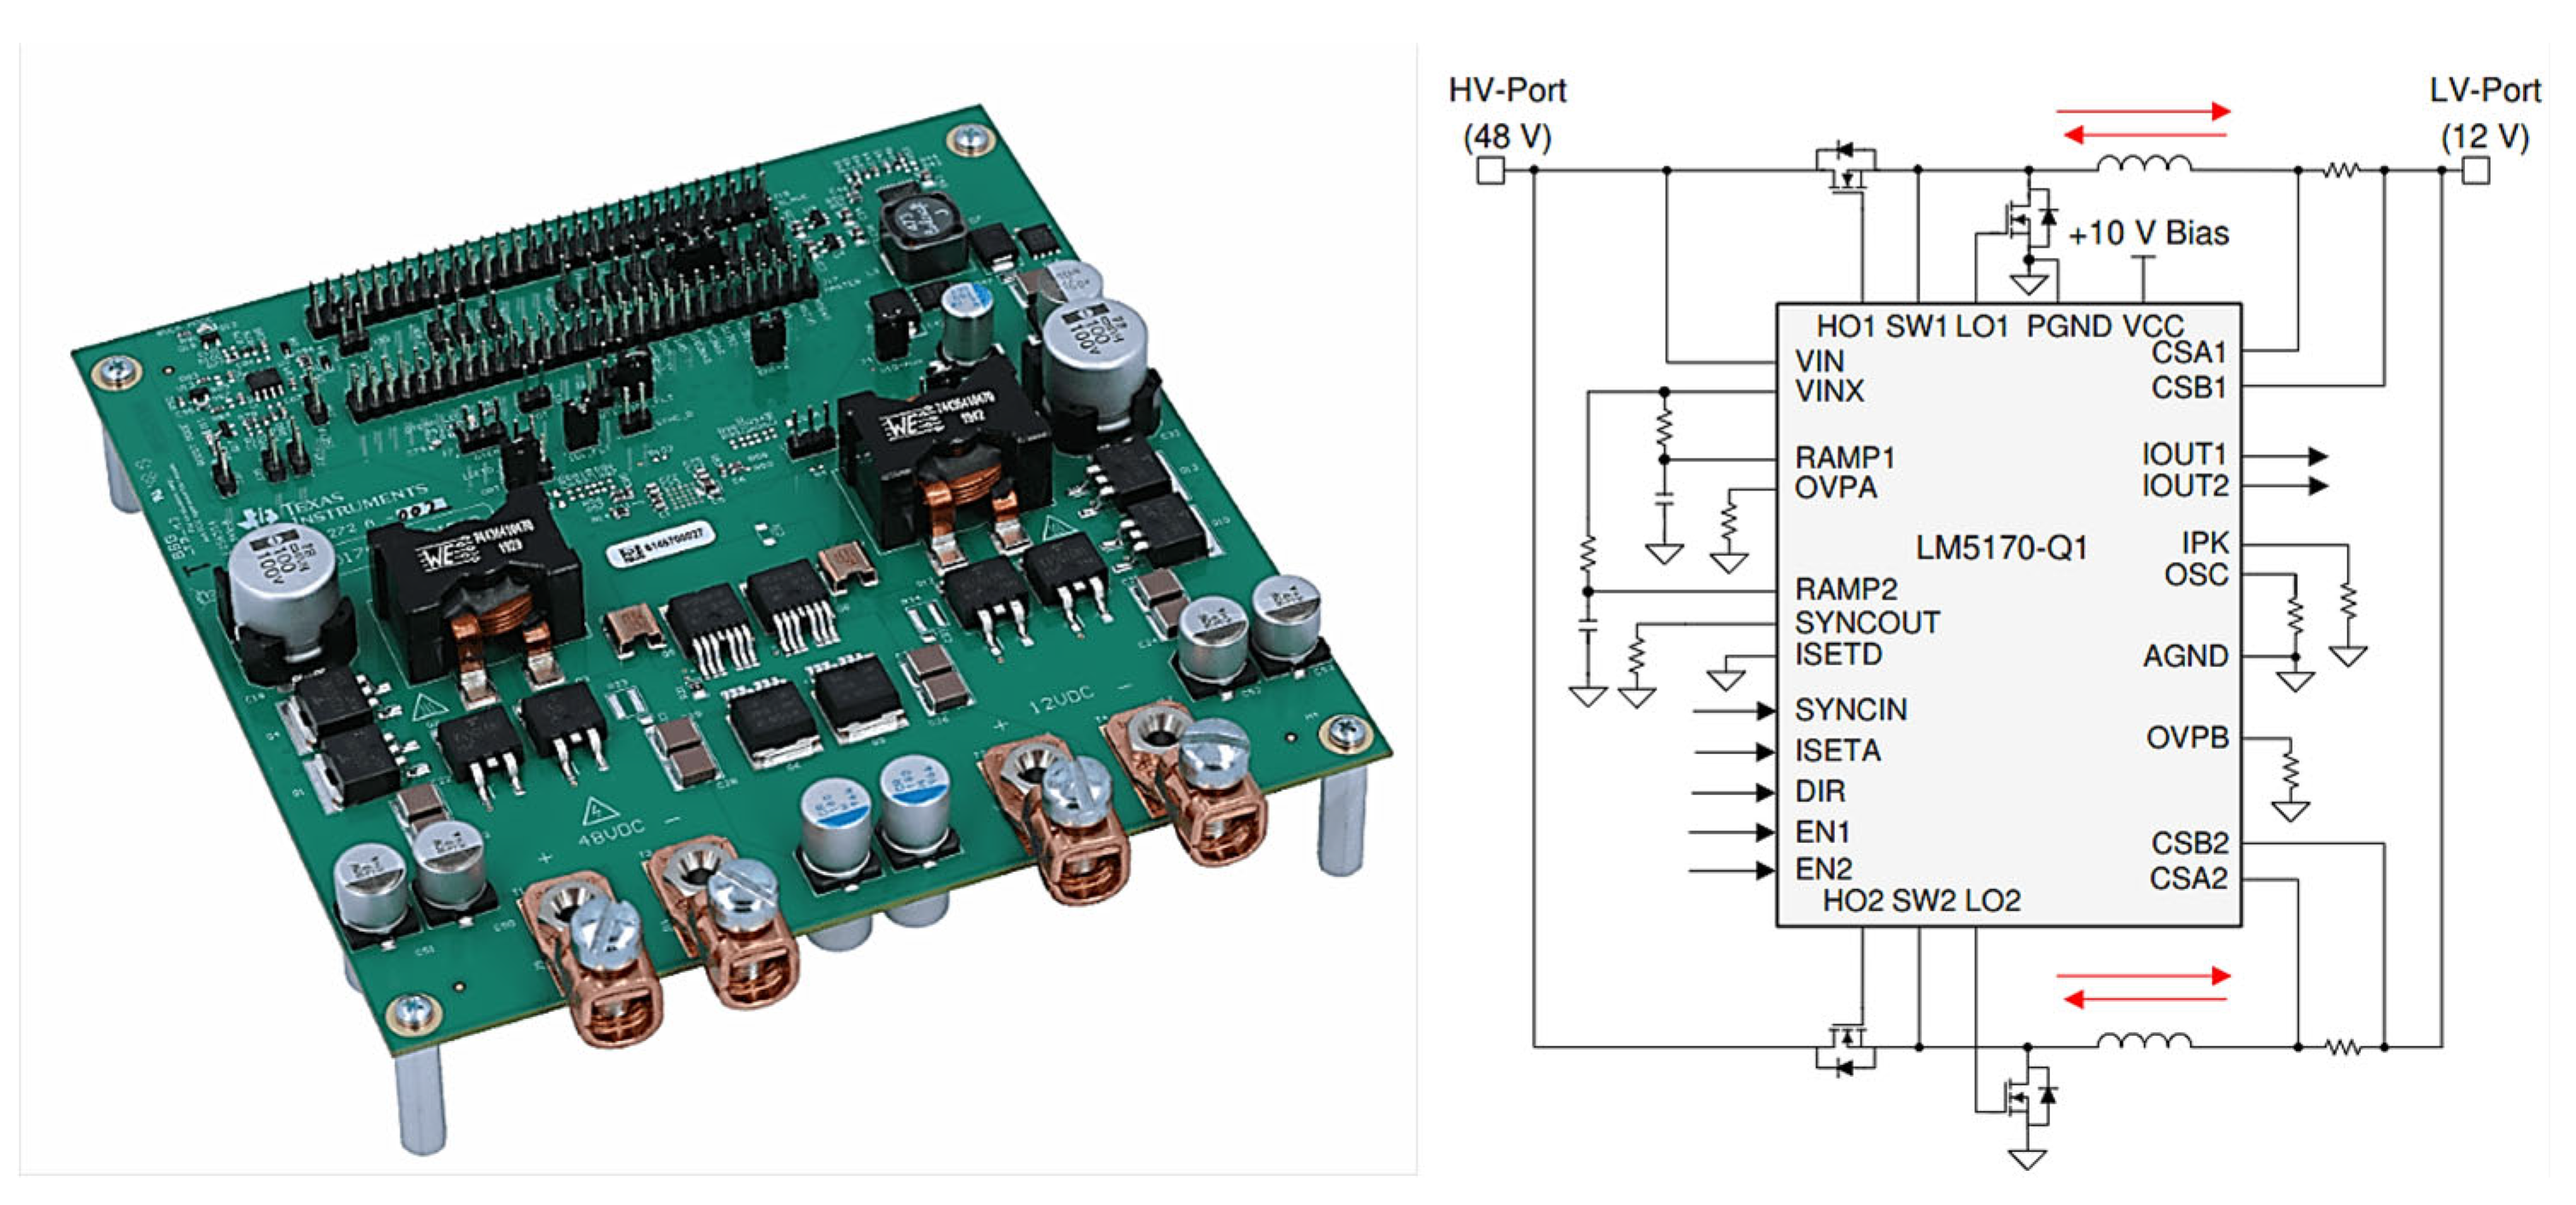
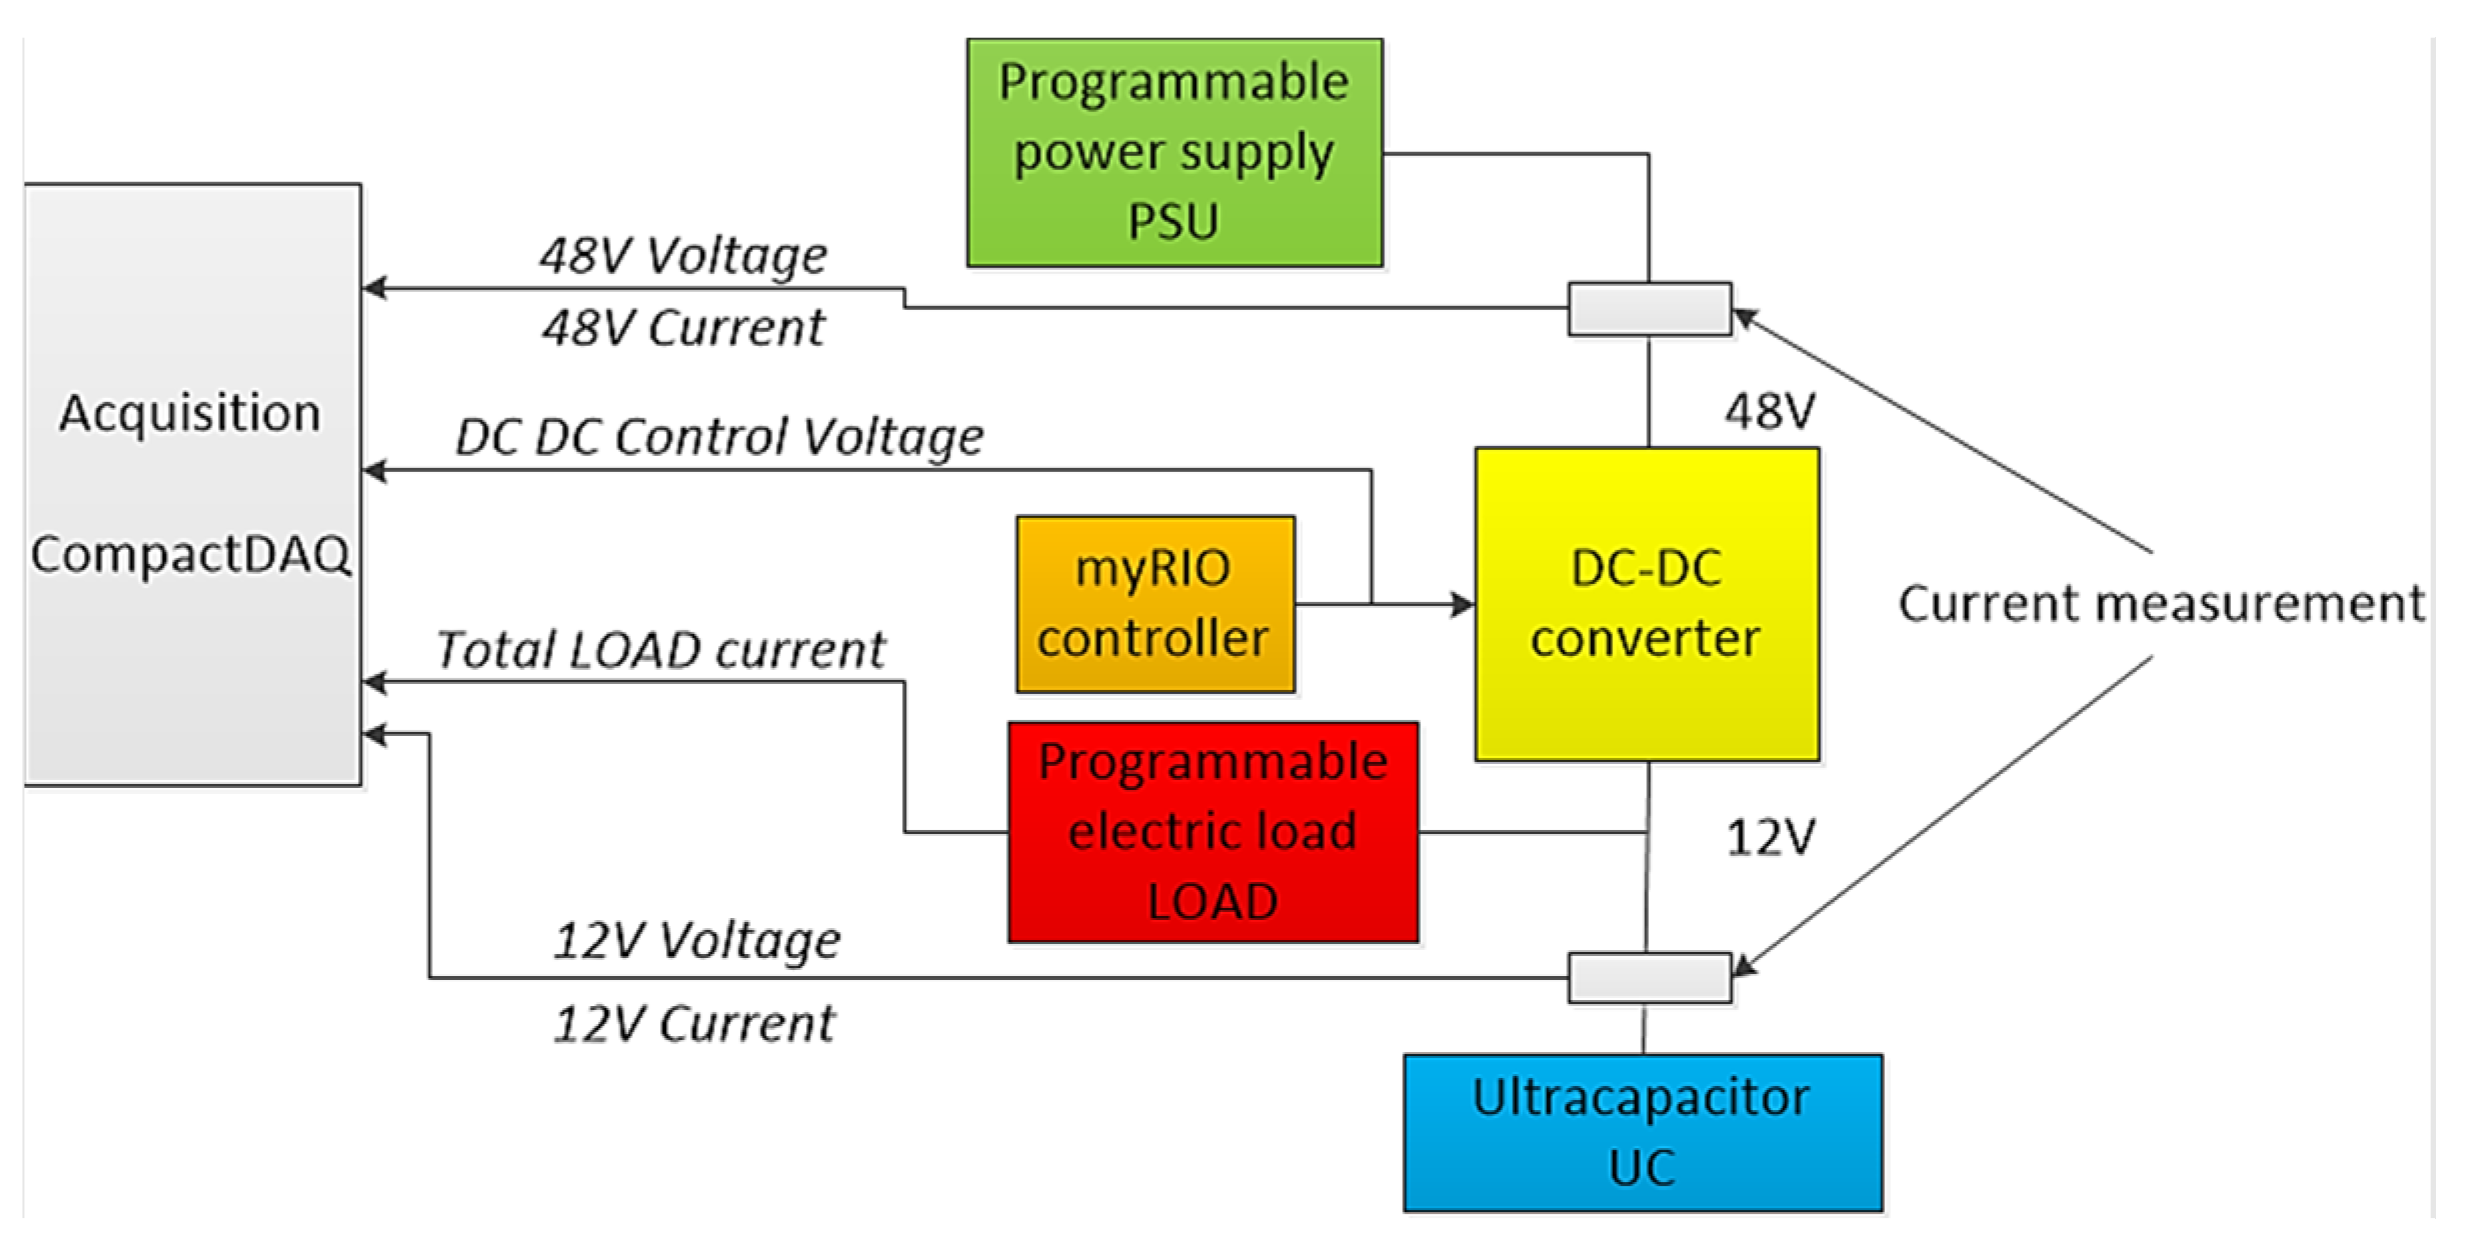
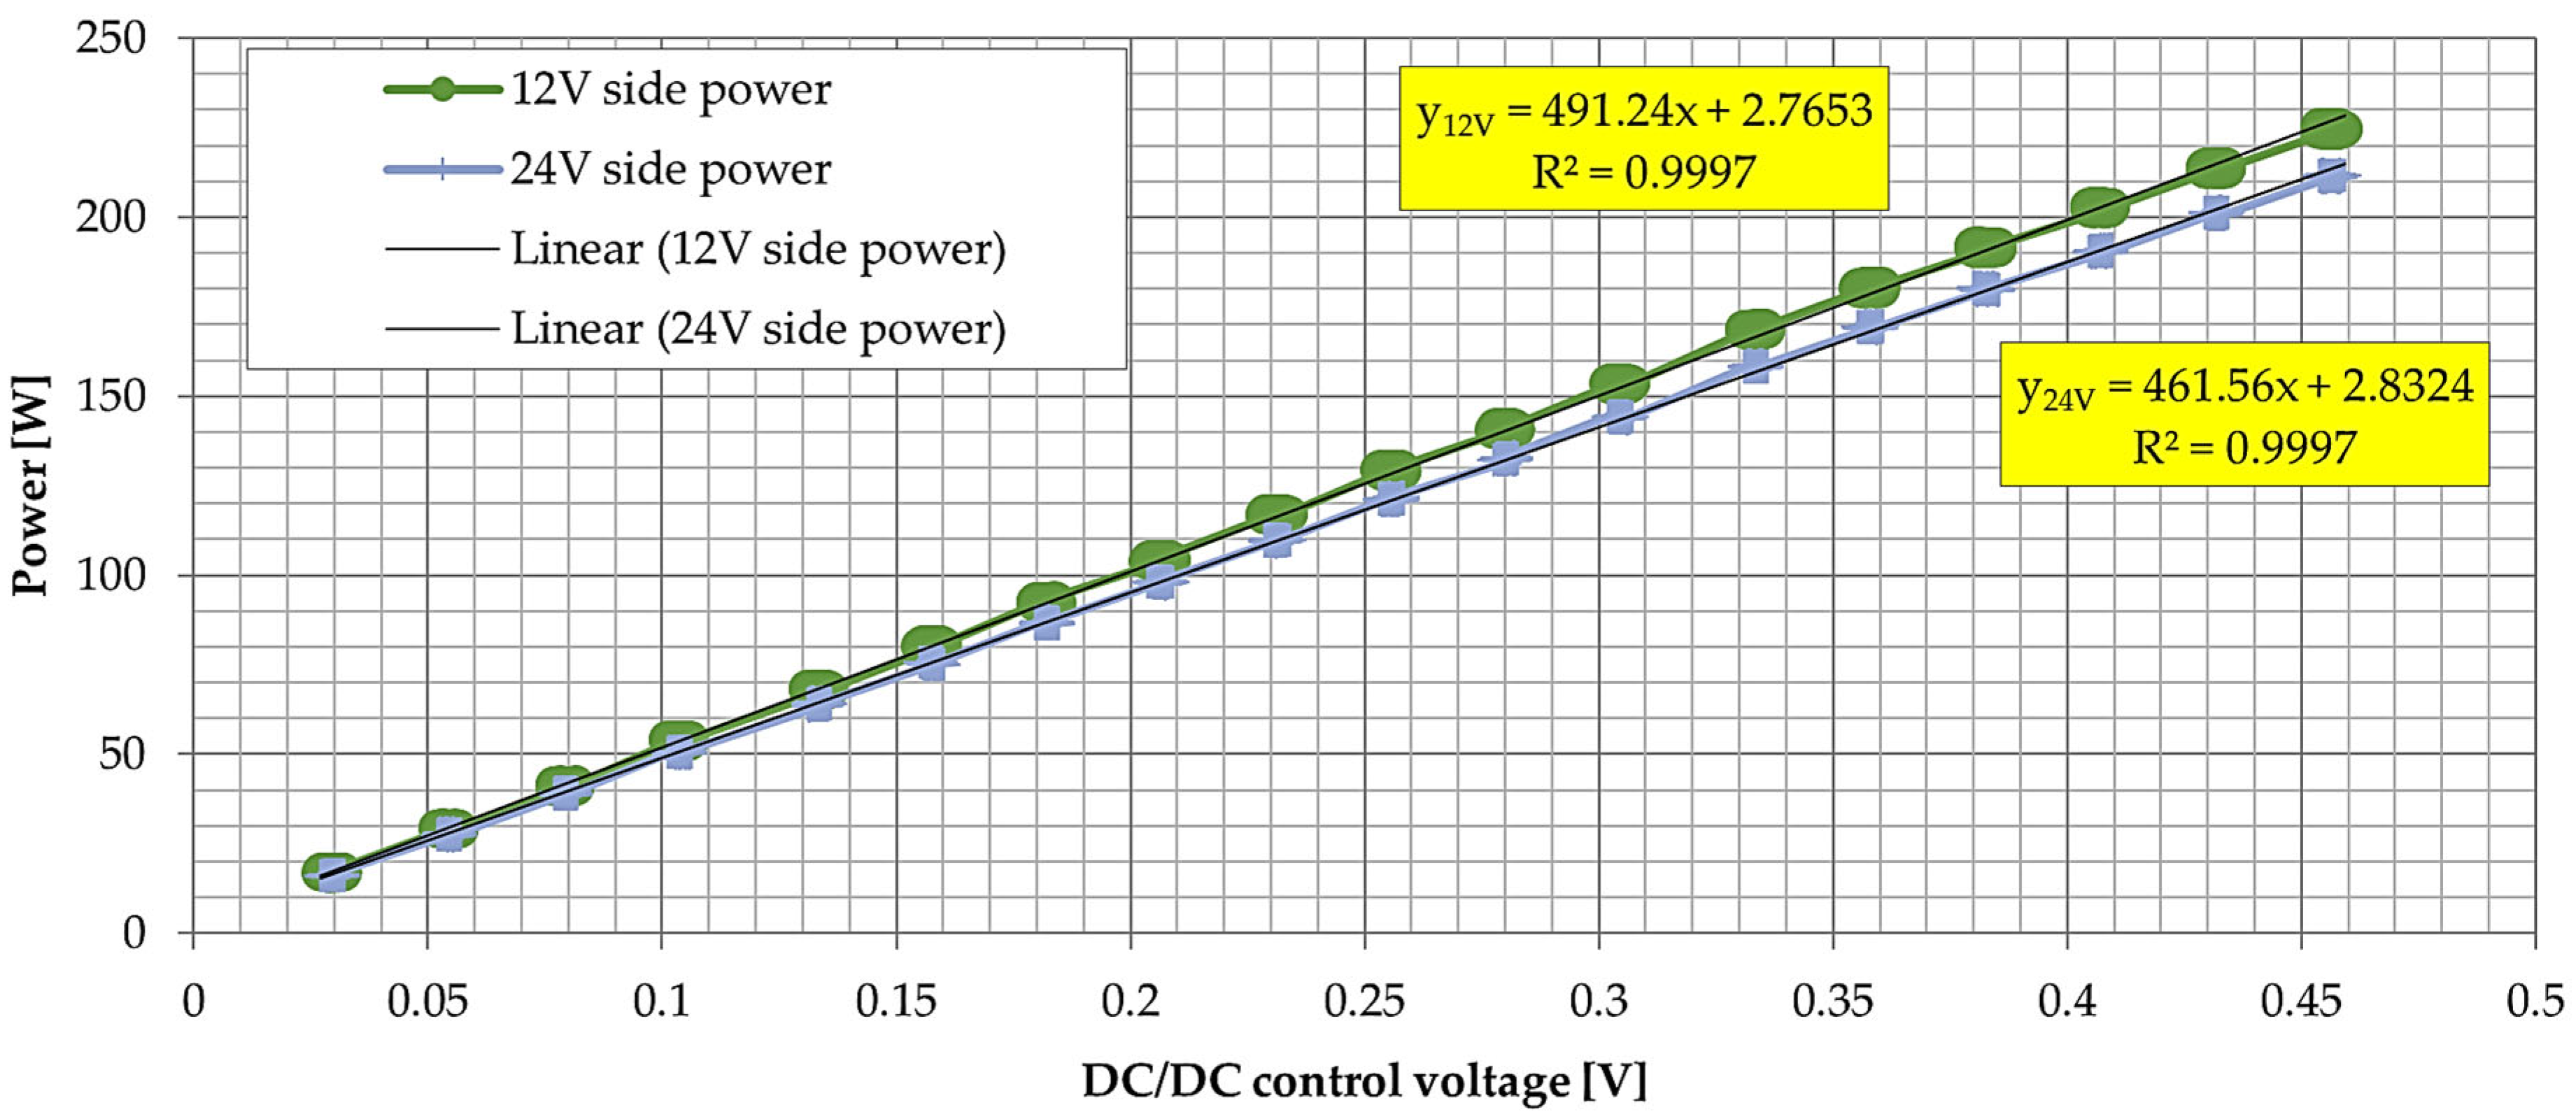
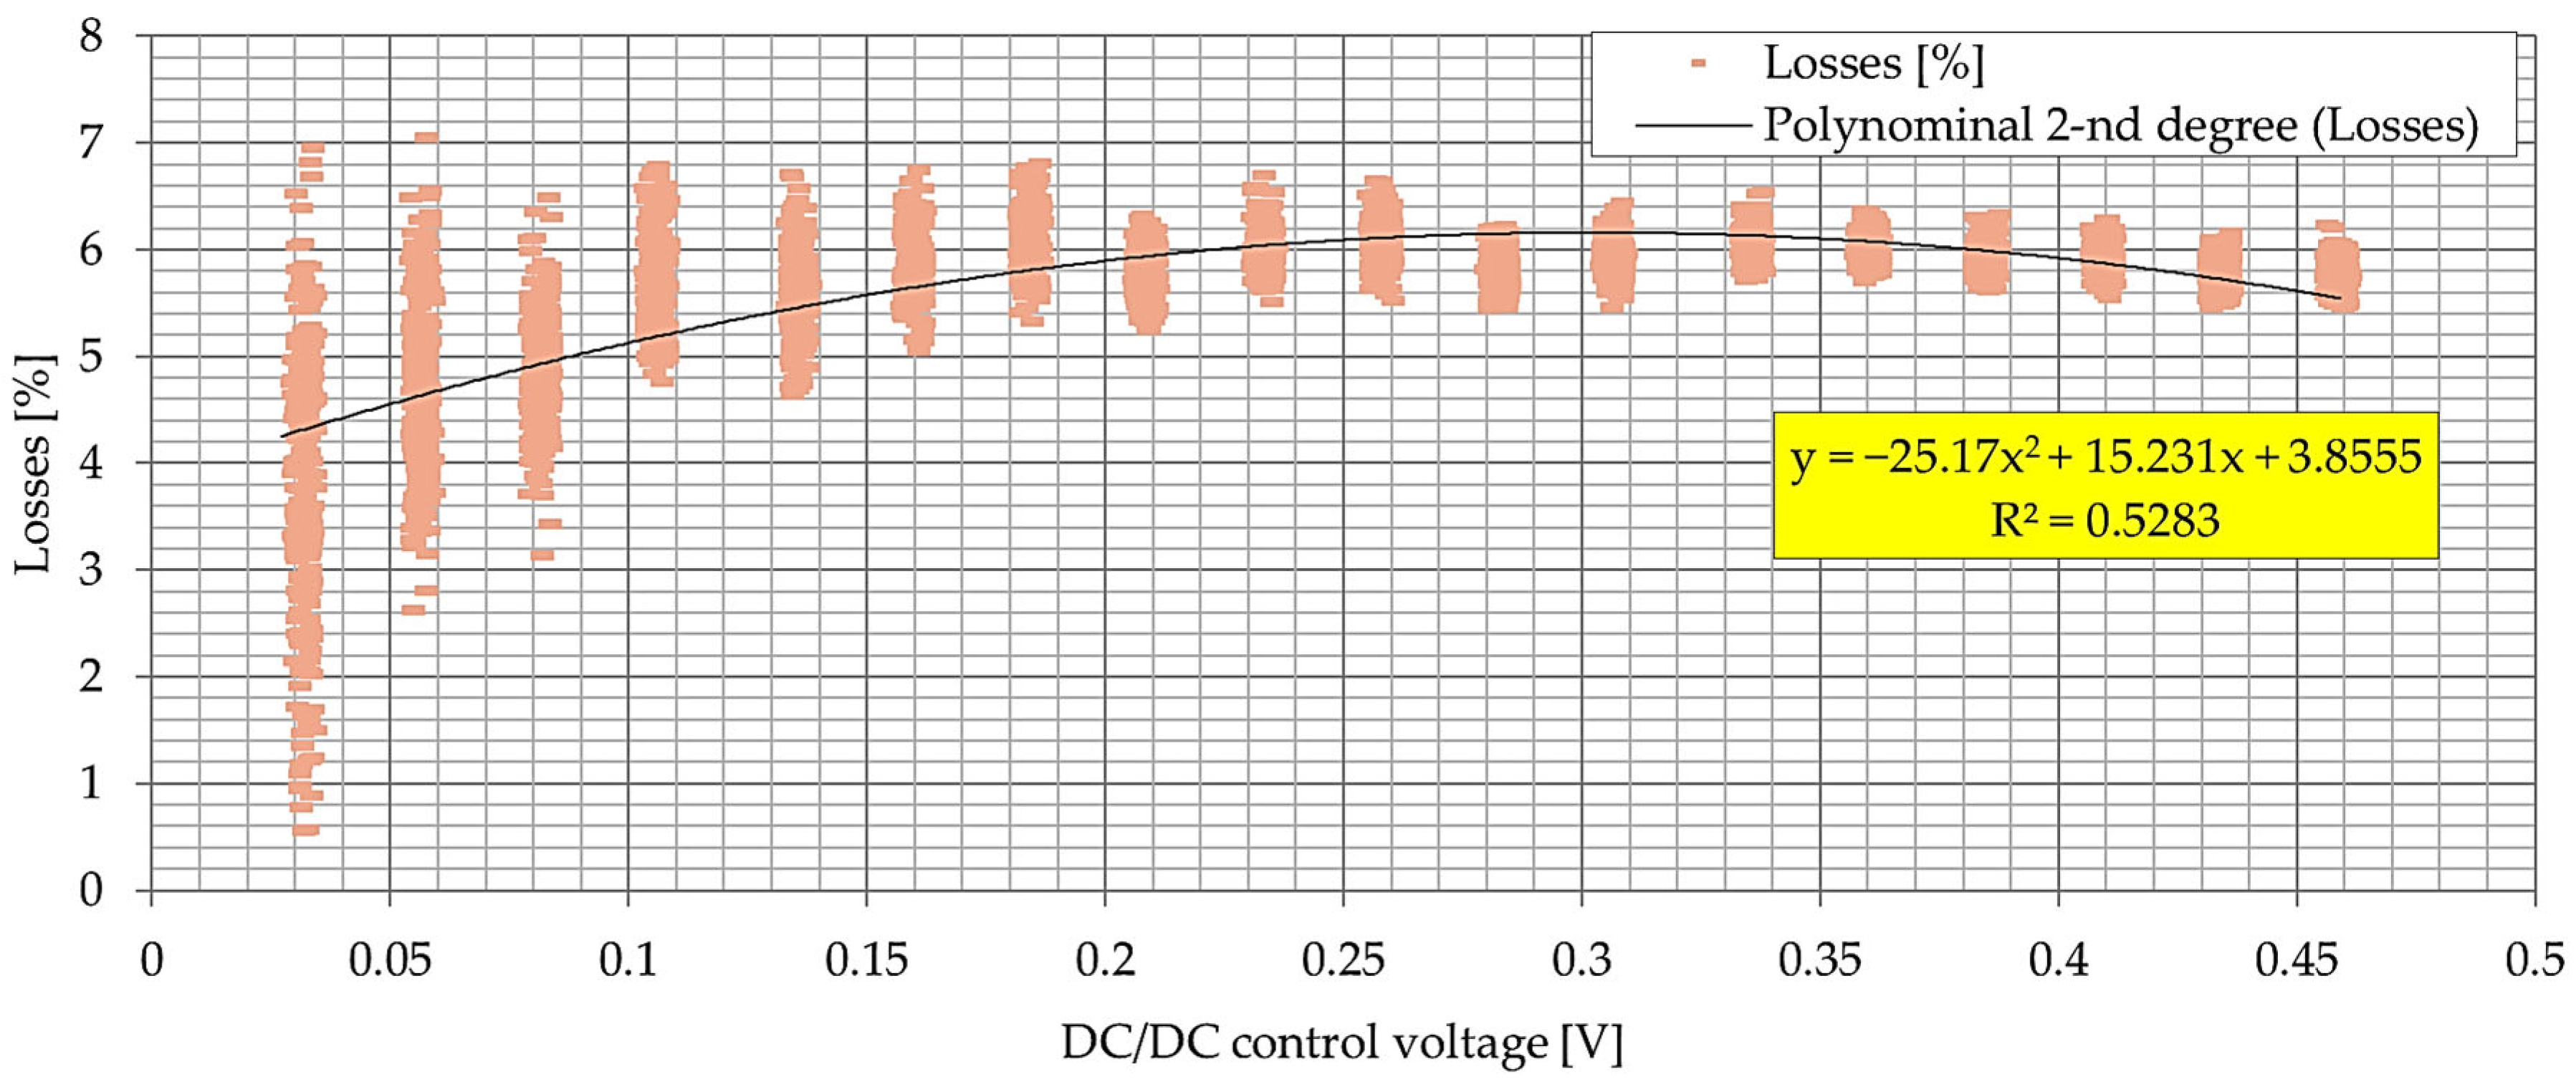
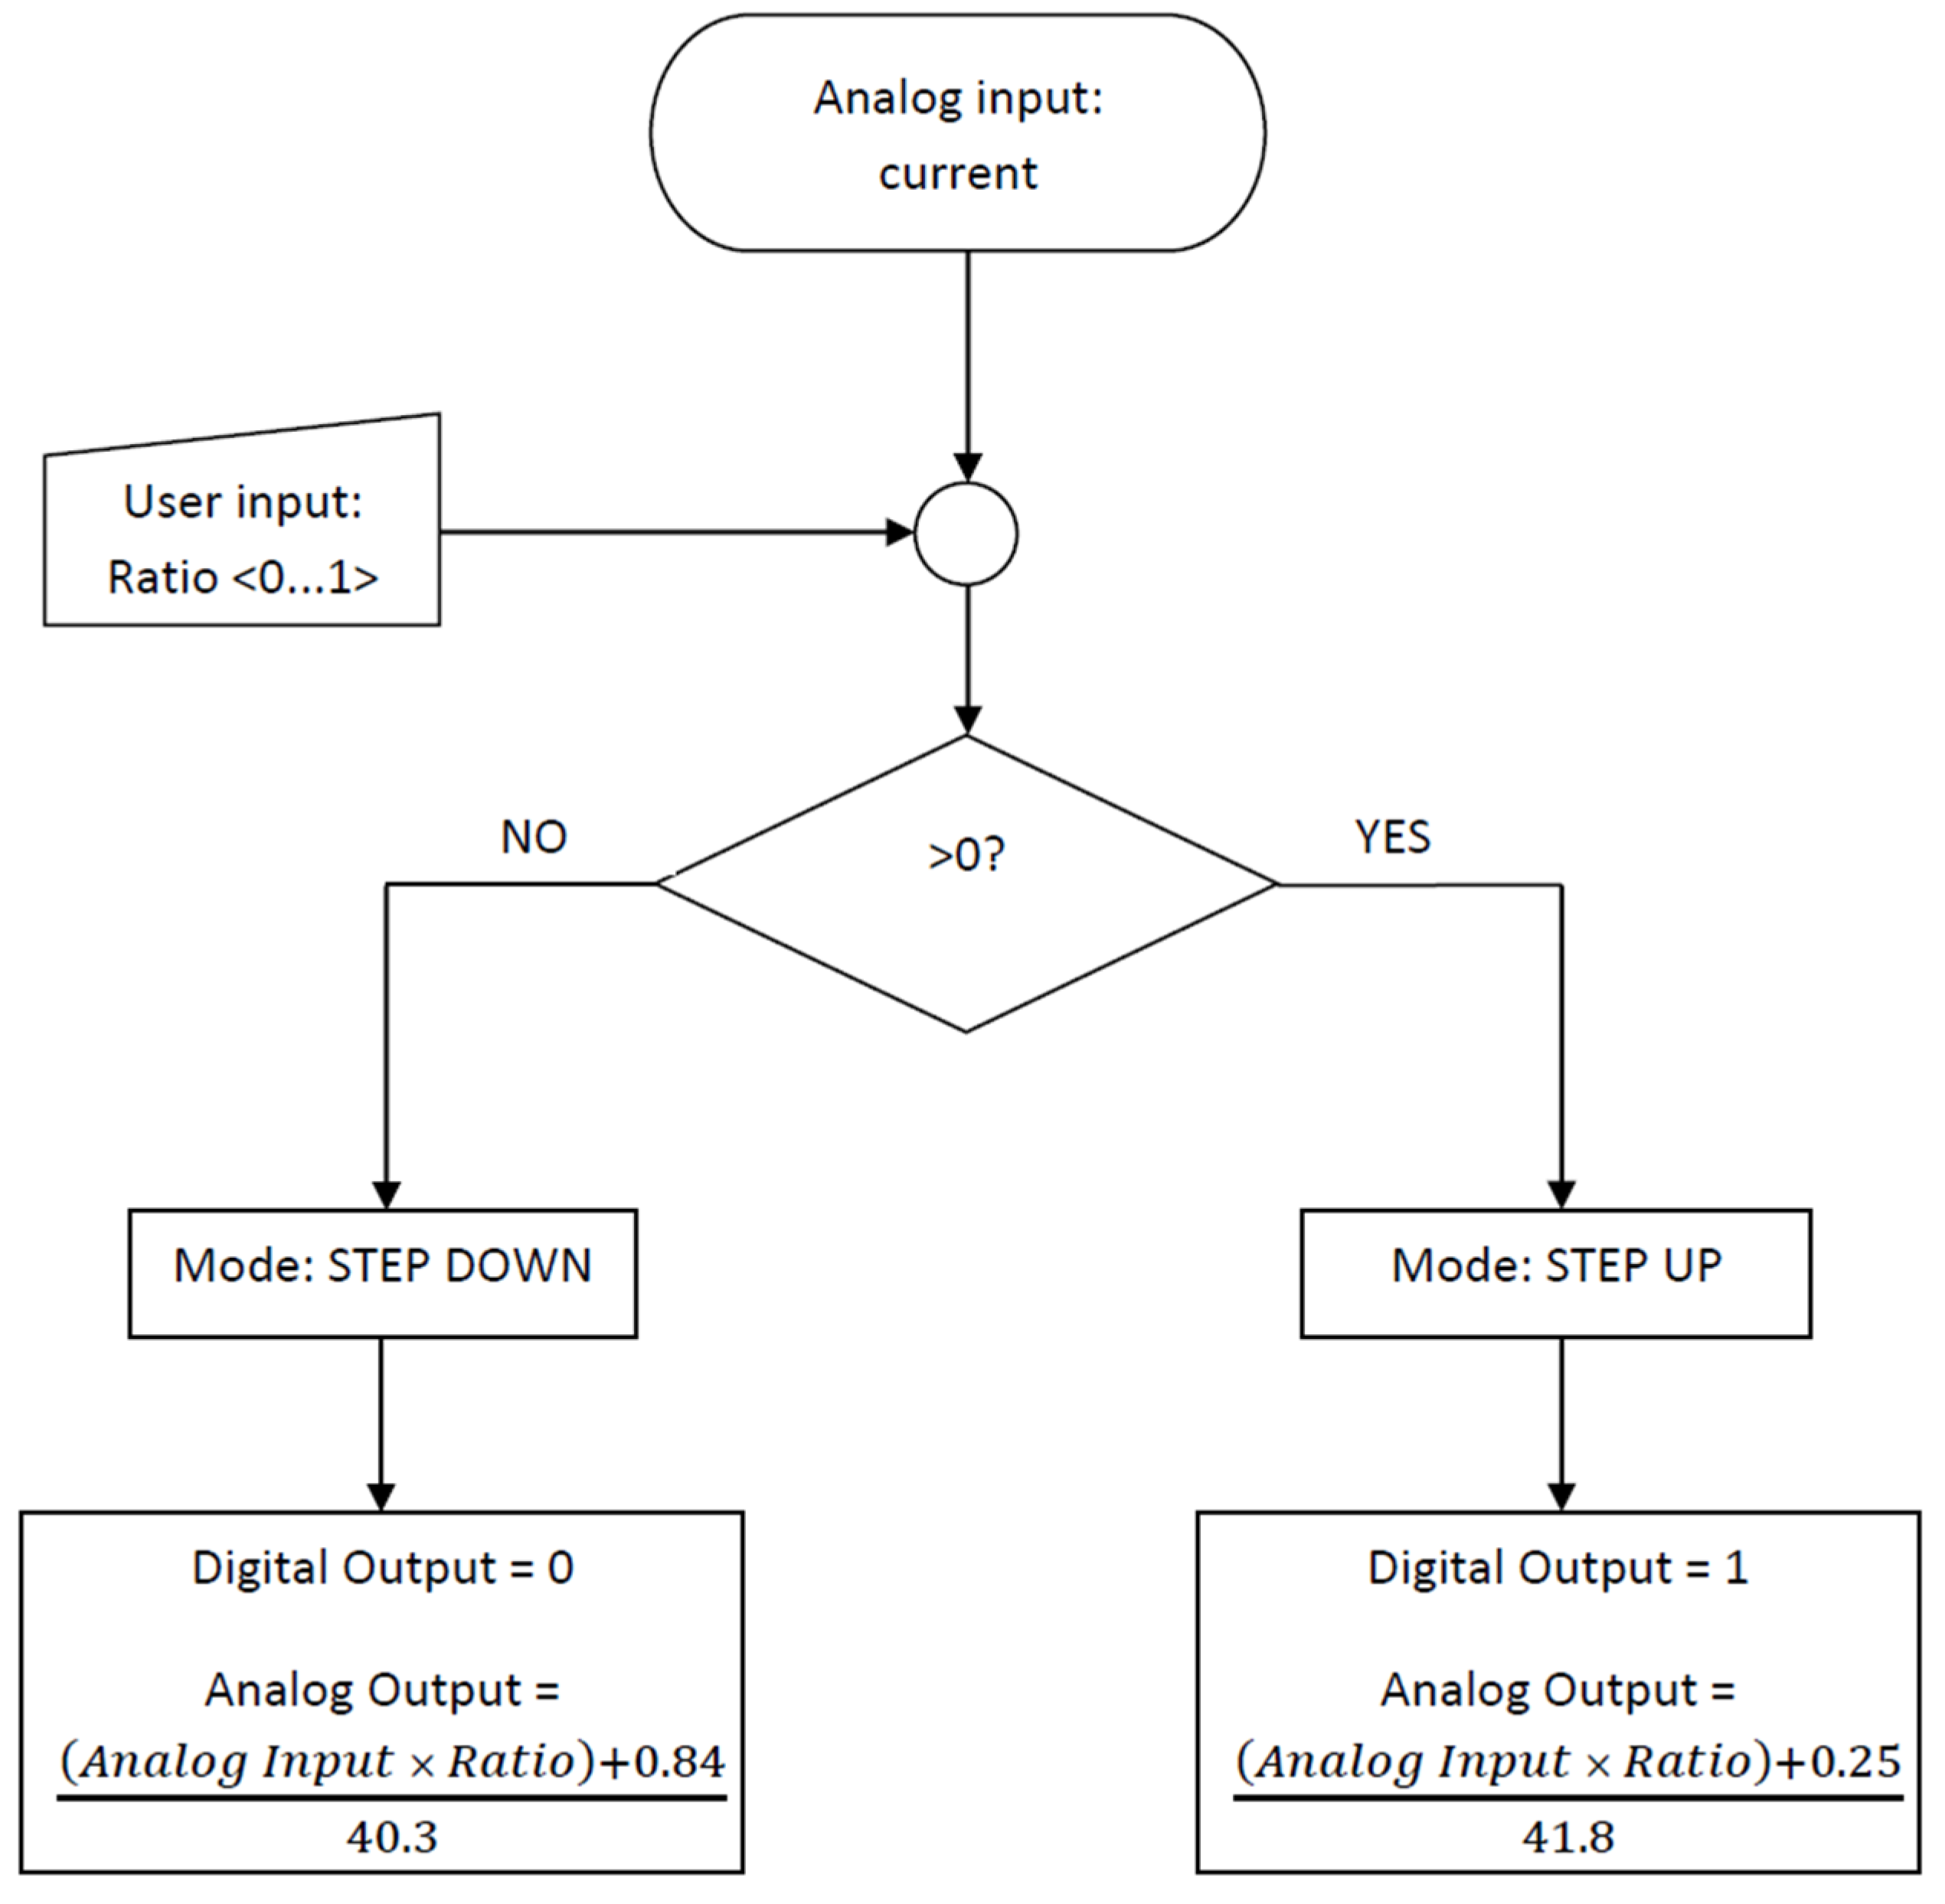
2.2. DC/DC Converter Calibration

The main purpose of the research was to select the control method and the nominal voltage of the ultracapacitor module so that the converter could operate in the CC mode with the highest efficiency. In papers [68,77,79,80,81], it was emphasized that the losses are affected not only by the current but also by the voltage difference at the input and output of the converter. When designing an HES with a DC/DC converter, these characteristics of power losses should be taken into account to decide when there are benefits from using the converter (despite the losses) and when it is more effective to cover the entire energy demand without the use of the converter, as shown in [70,77,80,81]. For this purpose, low-power prototype systems are built with the demonstrative use of DC/DC converters.
Table 1 shows the parameters of bidirectional DC/DC converters in low-power systems and prototype systems presented in [77,80,81,82,83,84,85,86,87,88,89,90] as well as the parameters of the Texas Instruments LM5170EVM-BIDIR DC/DC converter [91] analyzed in this article.
The power of the bidirectional DC/DC converters presented in Table 1 does not exceed 1 kW, while the efficiency is above 90% both in the Step Up and Step Down modes. Additionally, for the converter analyzed in this paper, the value of power losses does not exceed 10%, which has been analyzed in detail and shown in Section 2.2.1 and Section 2.2.2.
The aim of the measurements was to determine the operating characteristics and to define the rules and operating procedures for the Texas Instruments DC/DC converter module, model LM5170EVM-BIDIR (Figure 3). The calibrated converter was used on a dedicated laboratory stand which is described in detail in Section 2.2.1, Section 2.2.2, and Section 2.3.
Initial identification tests were carried out on a test stand enabling power supply, with load and measurement of current and voltage values on the high- and low-voltage side of the DC/DC converter. The test stand was equipped with:
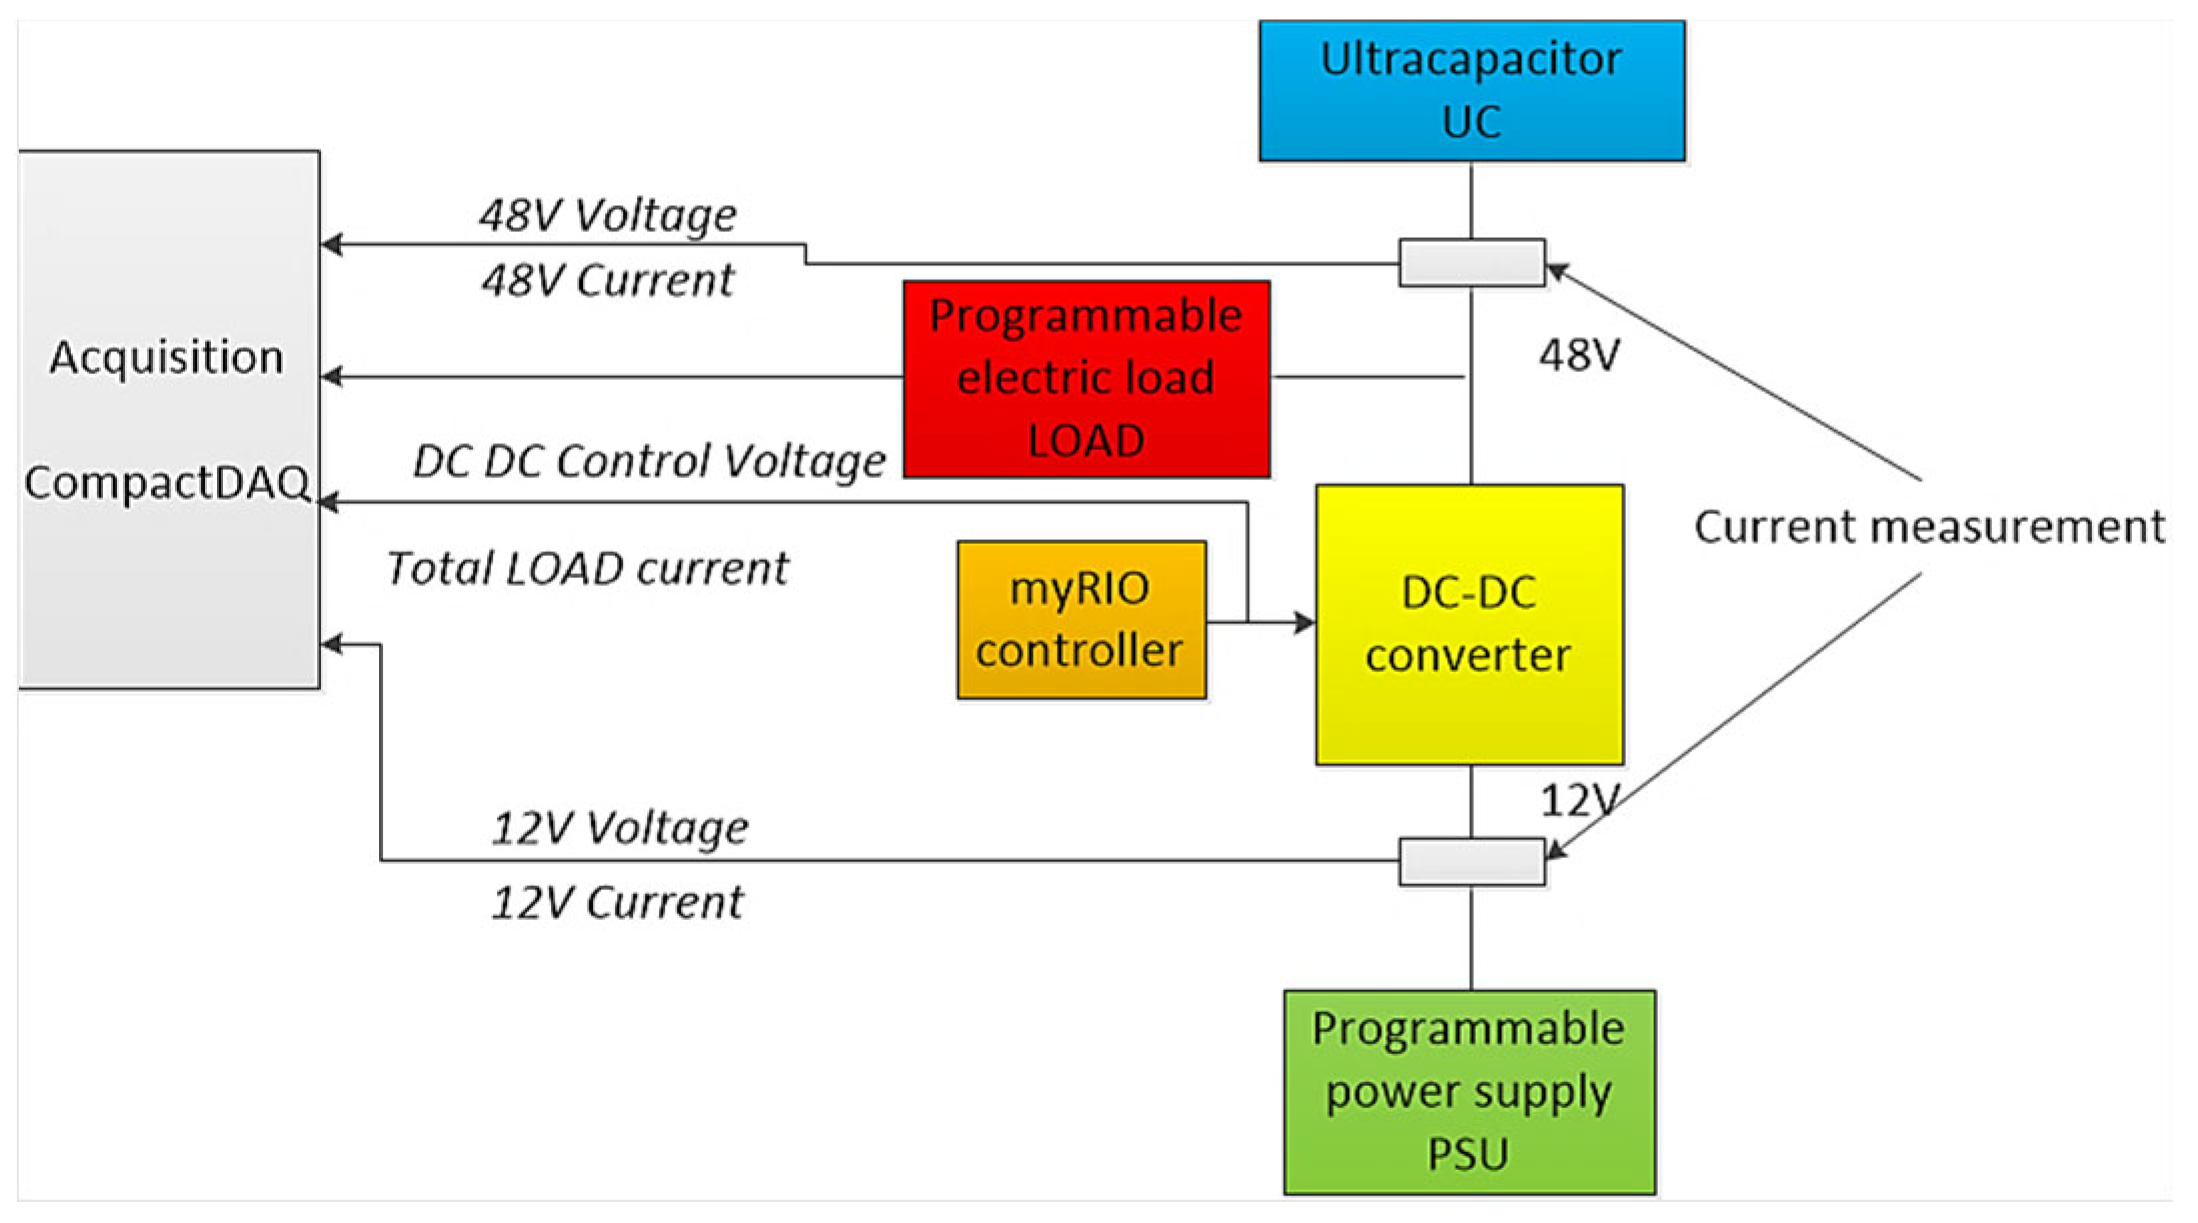
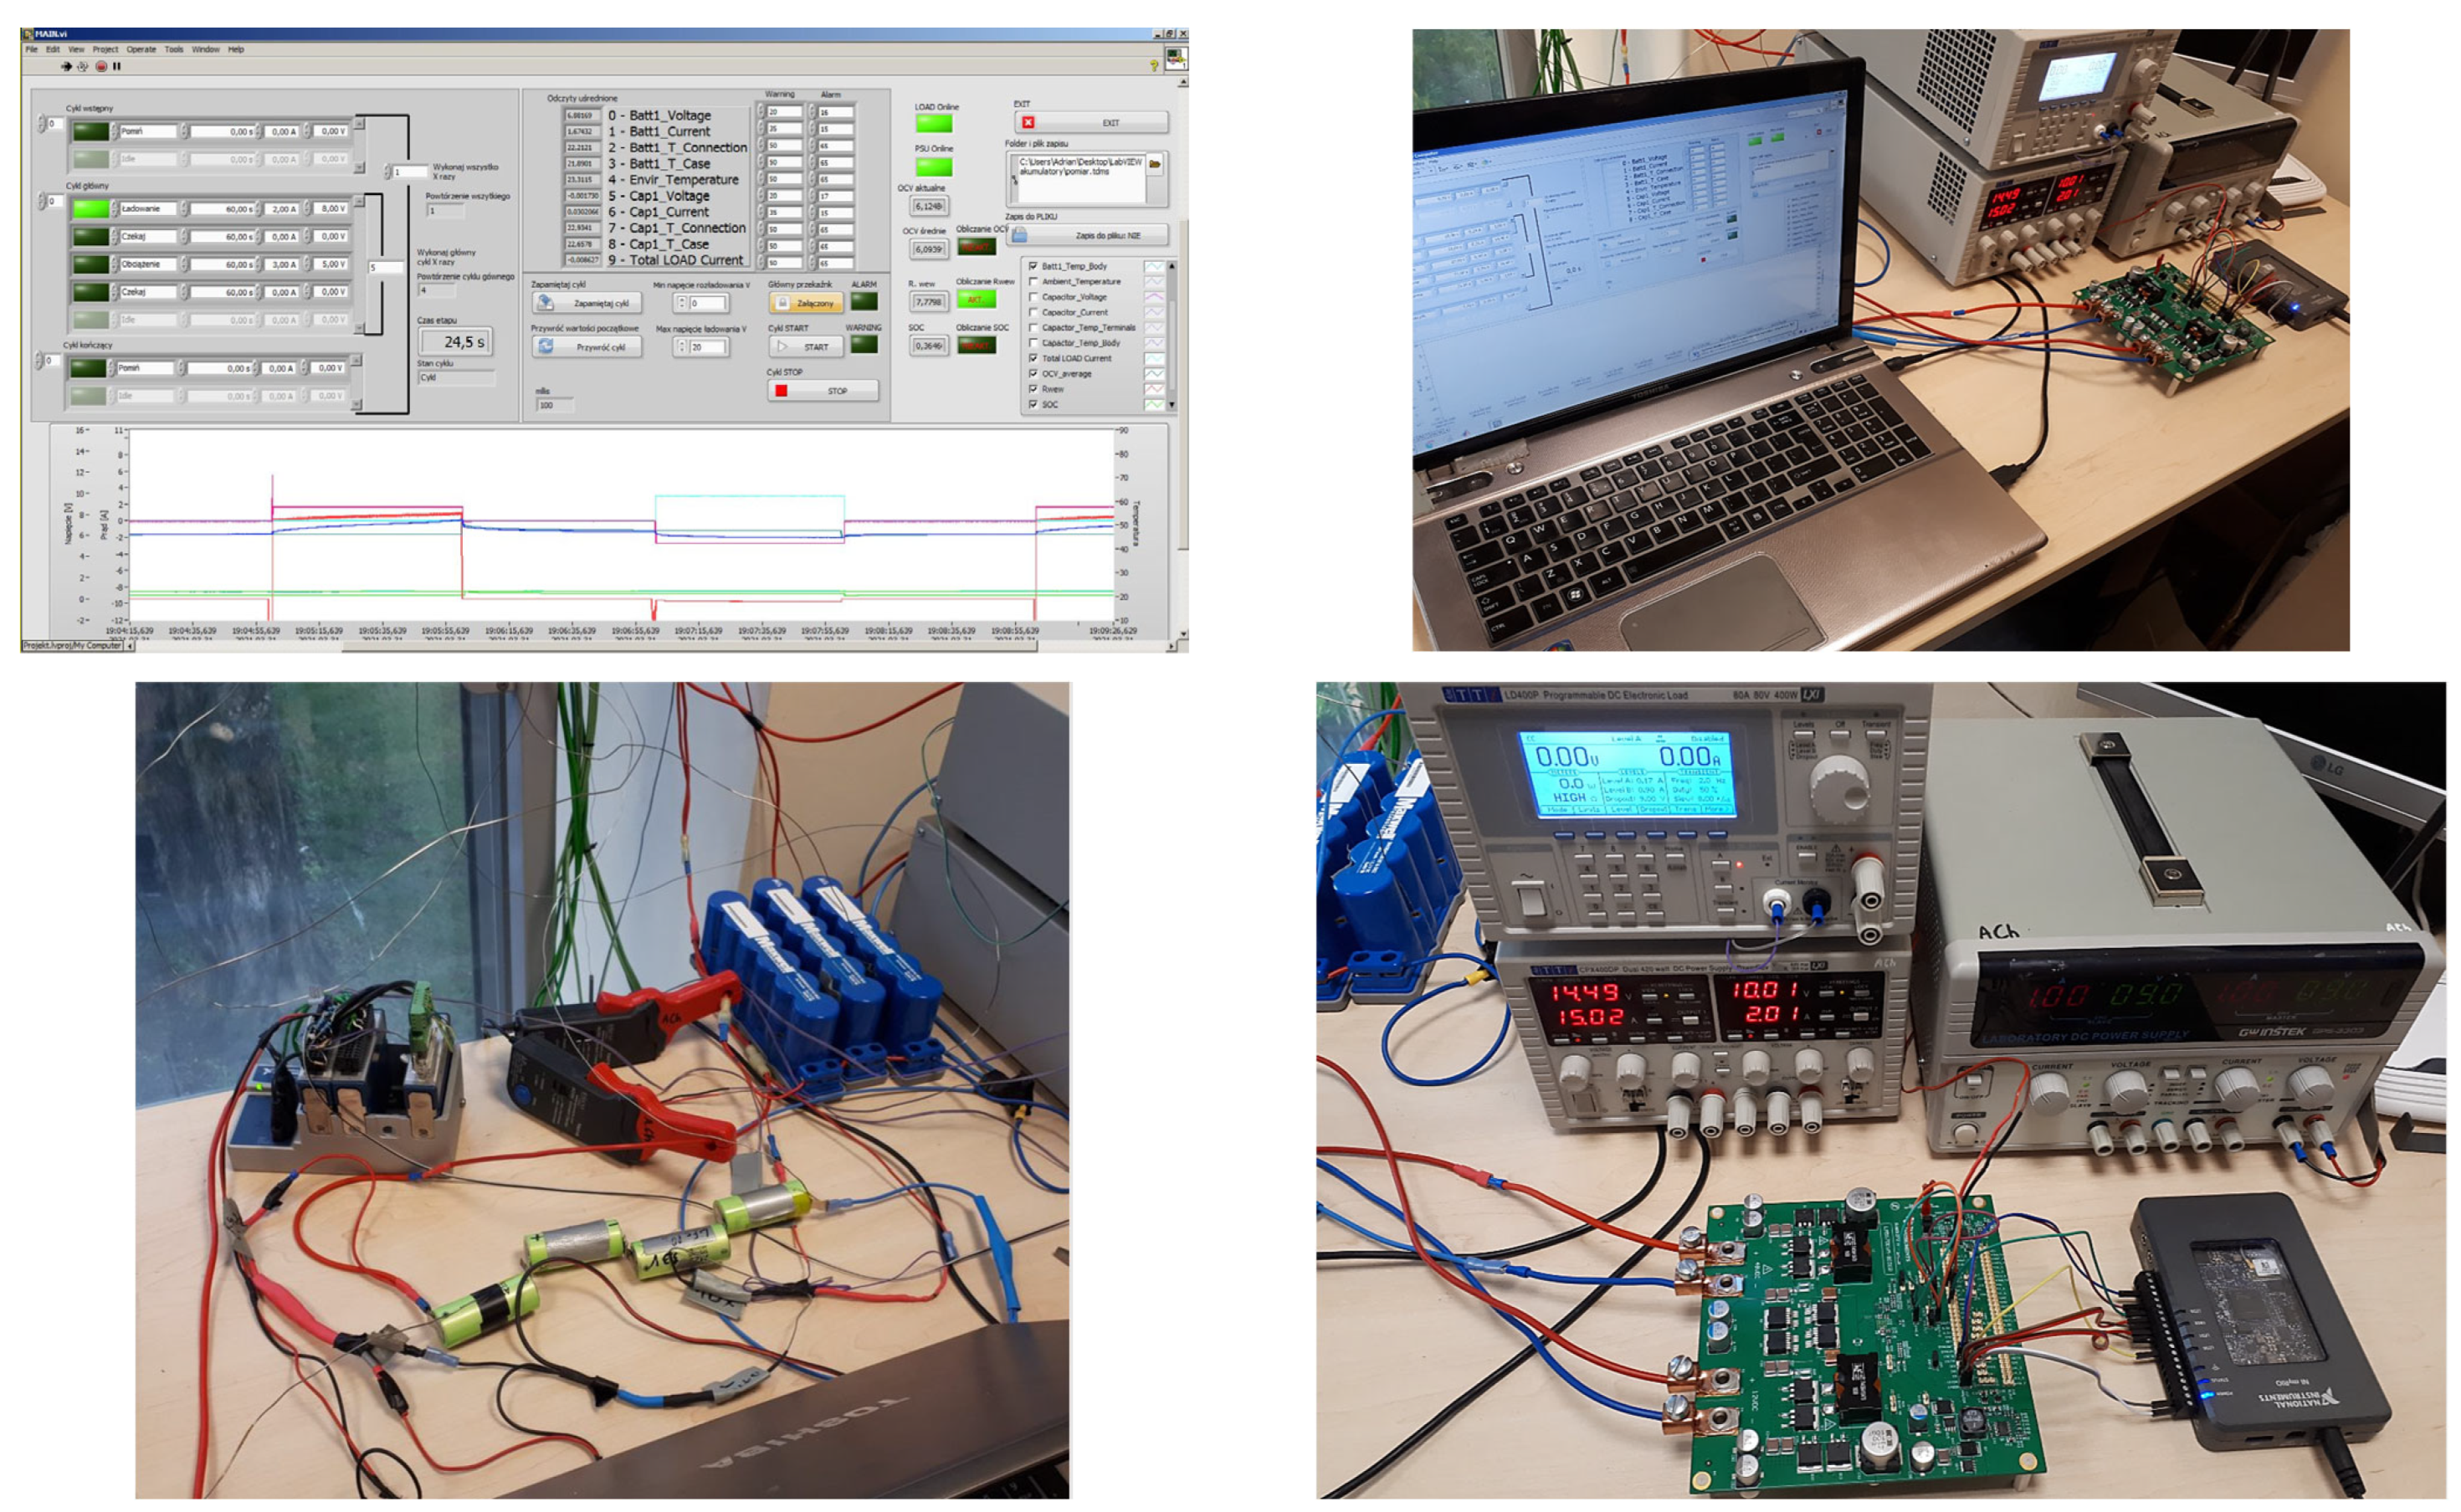
  • TTI CPX400DP programmable DC power supply (PSU);
  • TTI LD400P programmable DC load (LOAD);
  • National Instruments CompactDAQ 9174 recording device, equipped with an analog input card NI 9206 (cDAQ);
  • National Instruments myRIO controller to control the operation of the DC/DC converter;
  • Texas Instruments bidirectional DC/DC converter module, model LM5170EVM-BIDIR;
  • PICO TA018 current-voltage converters (current clamps).
Calibration of the DC/DC converter was necessary to determine the characteristics of its losses (different currents and different input and output voltages). As a consequence, the control of the converter operation was selected, reducing these losses. During the calibration of the converter, presented in Section 2.2.1 and Section 2.2.2, Maxwell ultracapacitors were used. The technical data of ultracapacitors and battery are presented in Table 2.
The acquired signals included voltage values on the low- and high-voltage sides of the DC/DC converter, current values on the low- and high-voltage sides of the DC/DC converter, current consumed by the programmable load, and the control voltage of the DC/DC converter. Waveforms generated directly from TDMS measurement files are described as follows:
  • 12 V Voltage—voltage on the DC/DC converter on the low-voltage side (nominal 12 V);
  • 12 V Current—current flowing through the DC/DC converter on the low-voltage side (nominal 12 V);
  • 48 V Voltage—voltage on the DC/DC converter on the high-voltage side (nominal 48 V);
  • 48 V Current—current flowing through the DC/DC converter on the high-voltage side (48 V nominal);
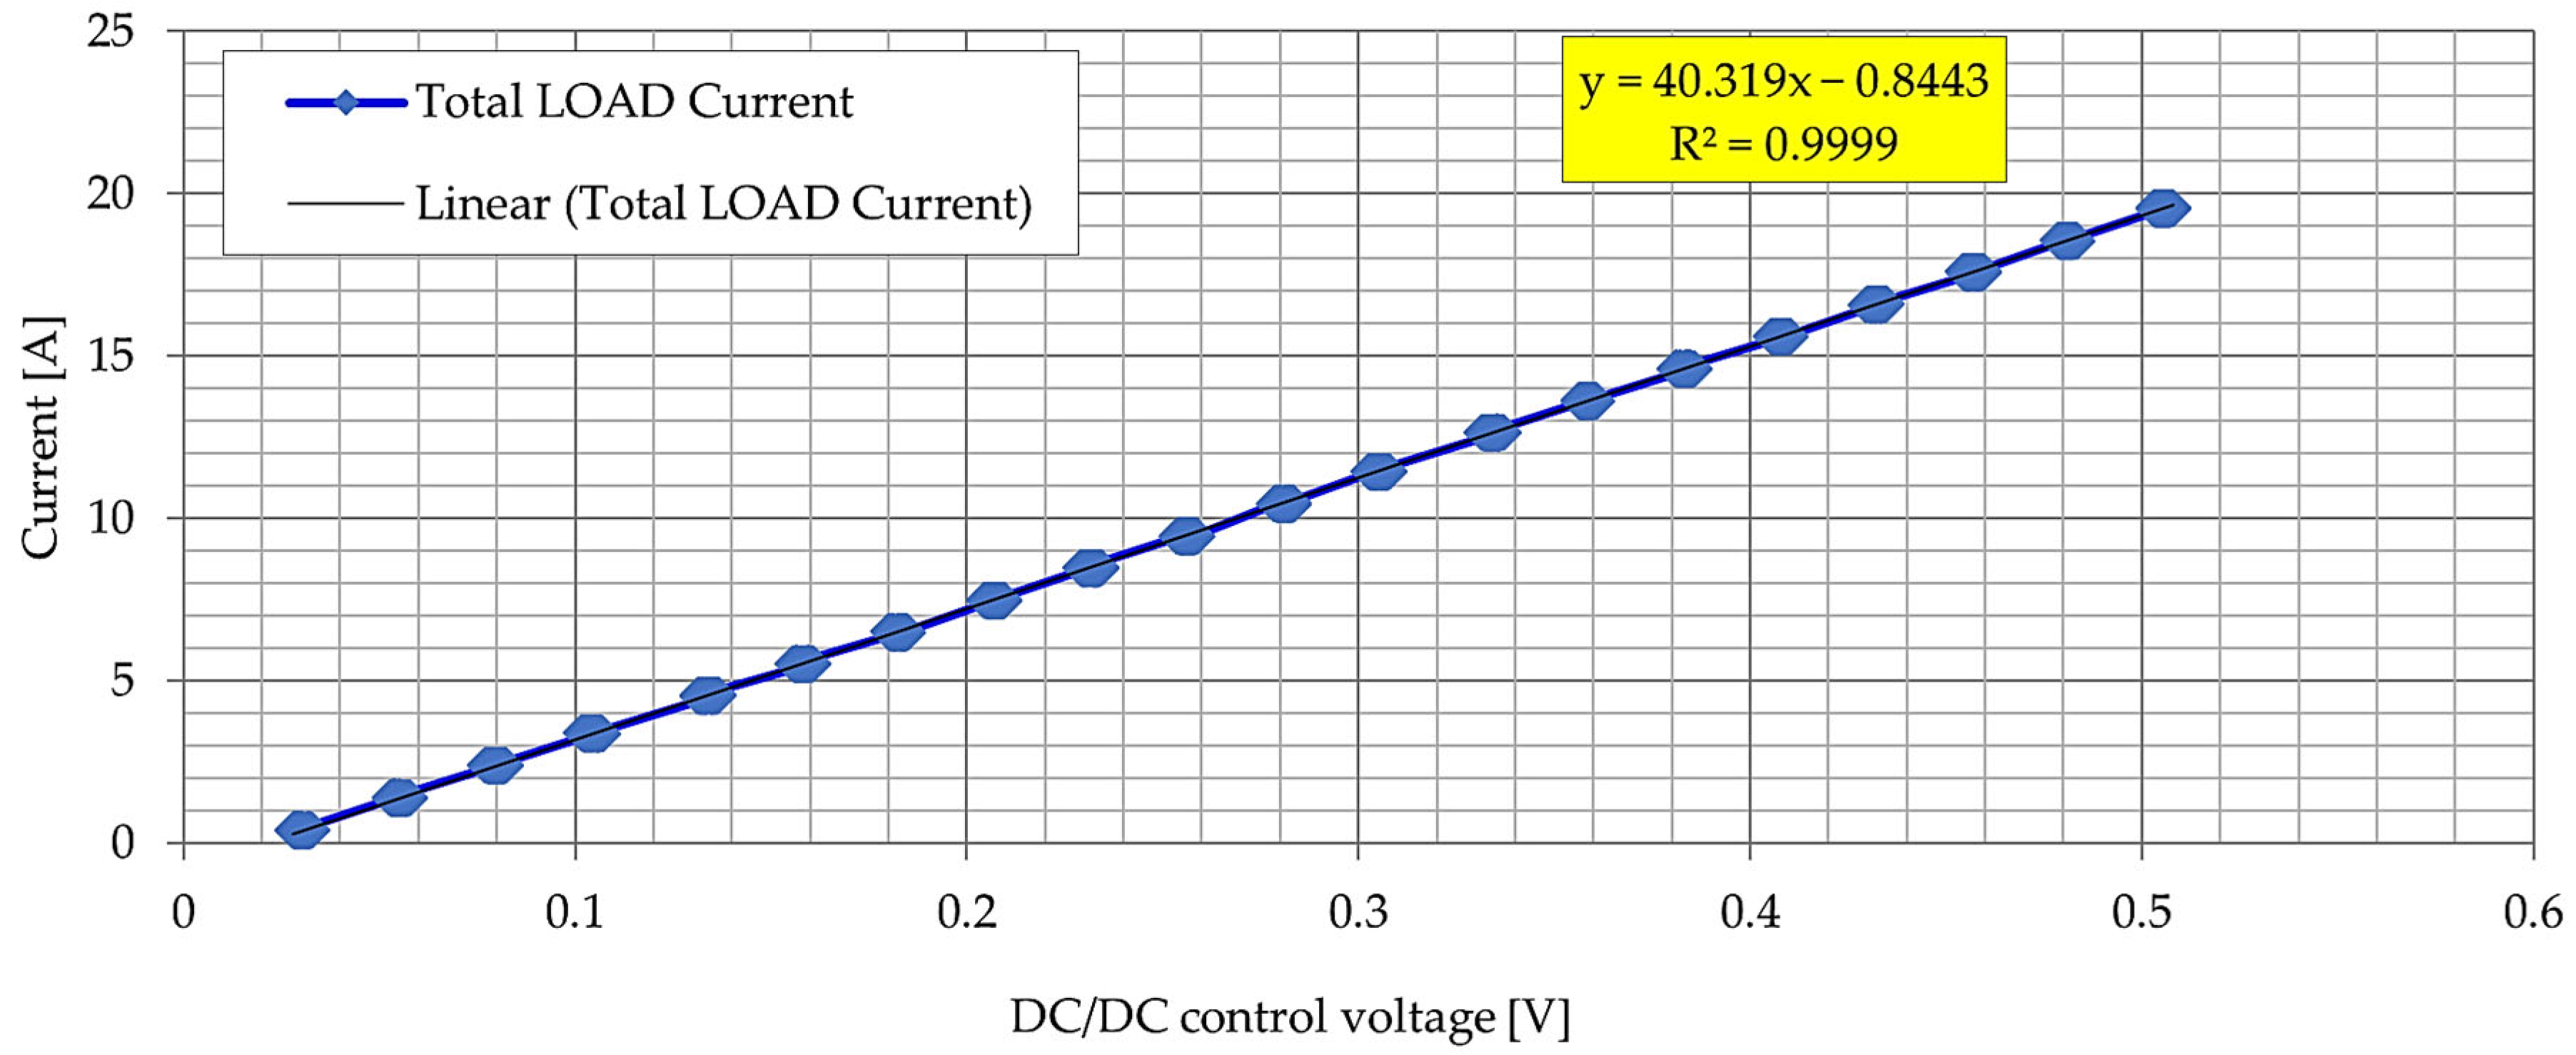
  • Total LOAD Current—value of the current consumed by the programmable load;
  • DC Control Voltage—control voltage of the DC/DC converter.
The calculated waveforms of current, power and losses as a function of the control voltage of the DC/DC converter have descriptions consistent with the nominal voltage values for a given measurement (48 V, 36 V, and 24 V).

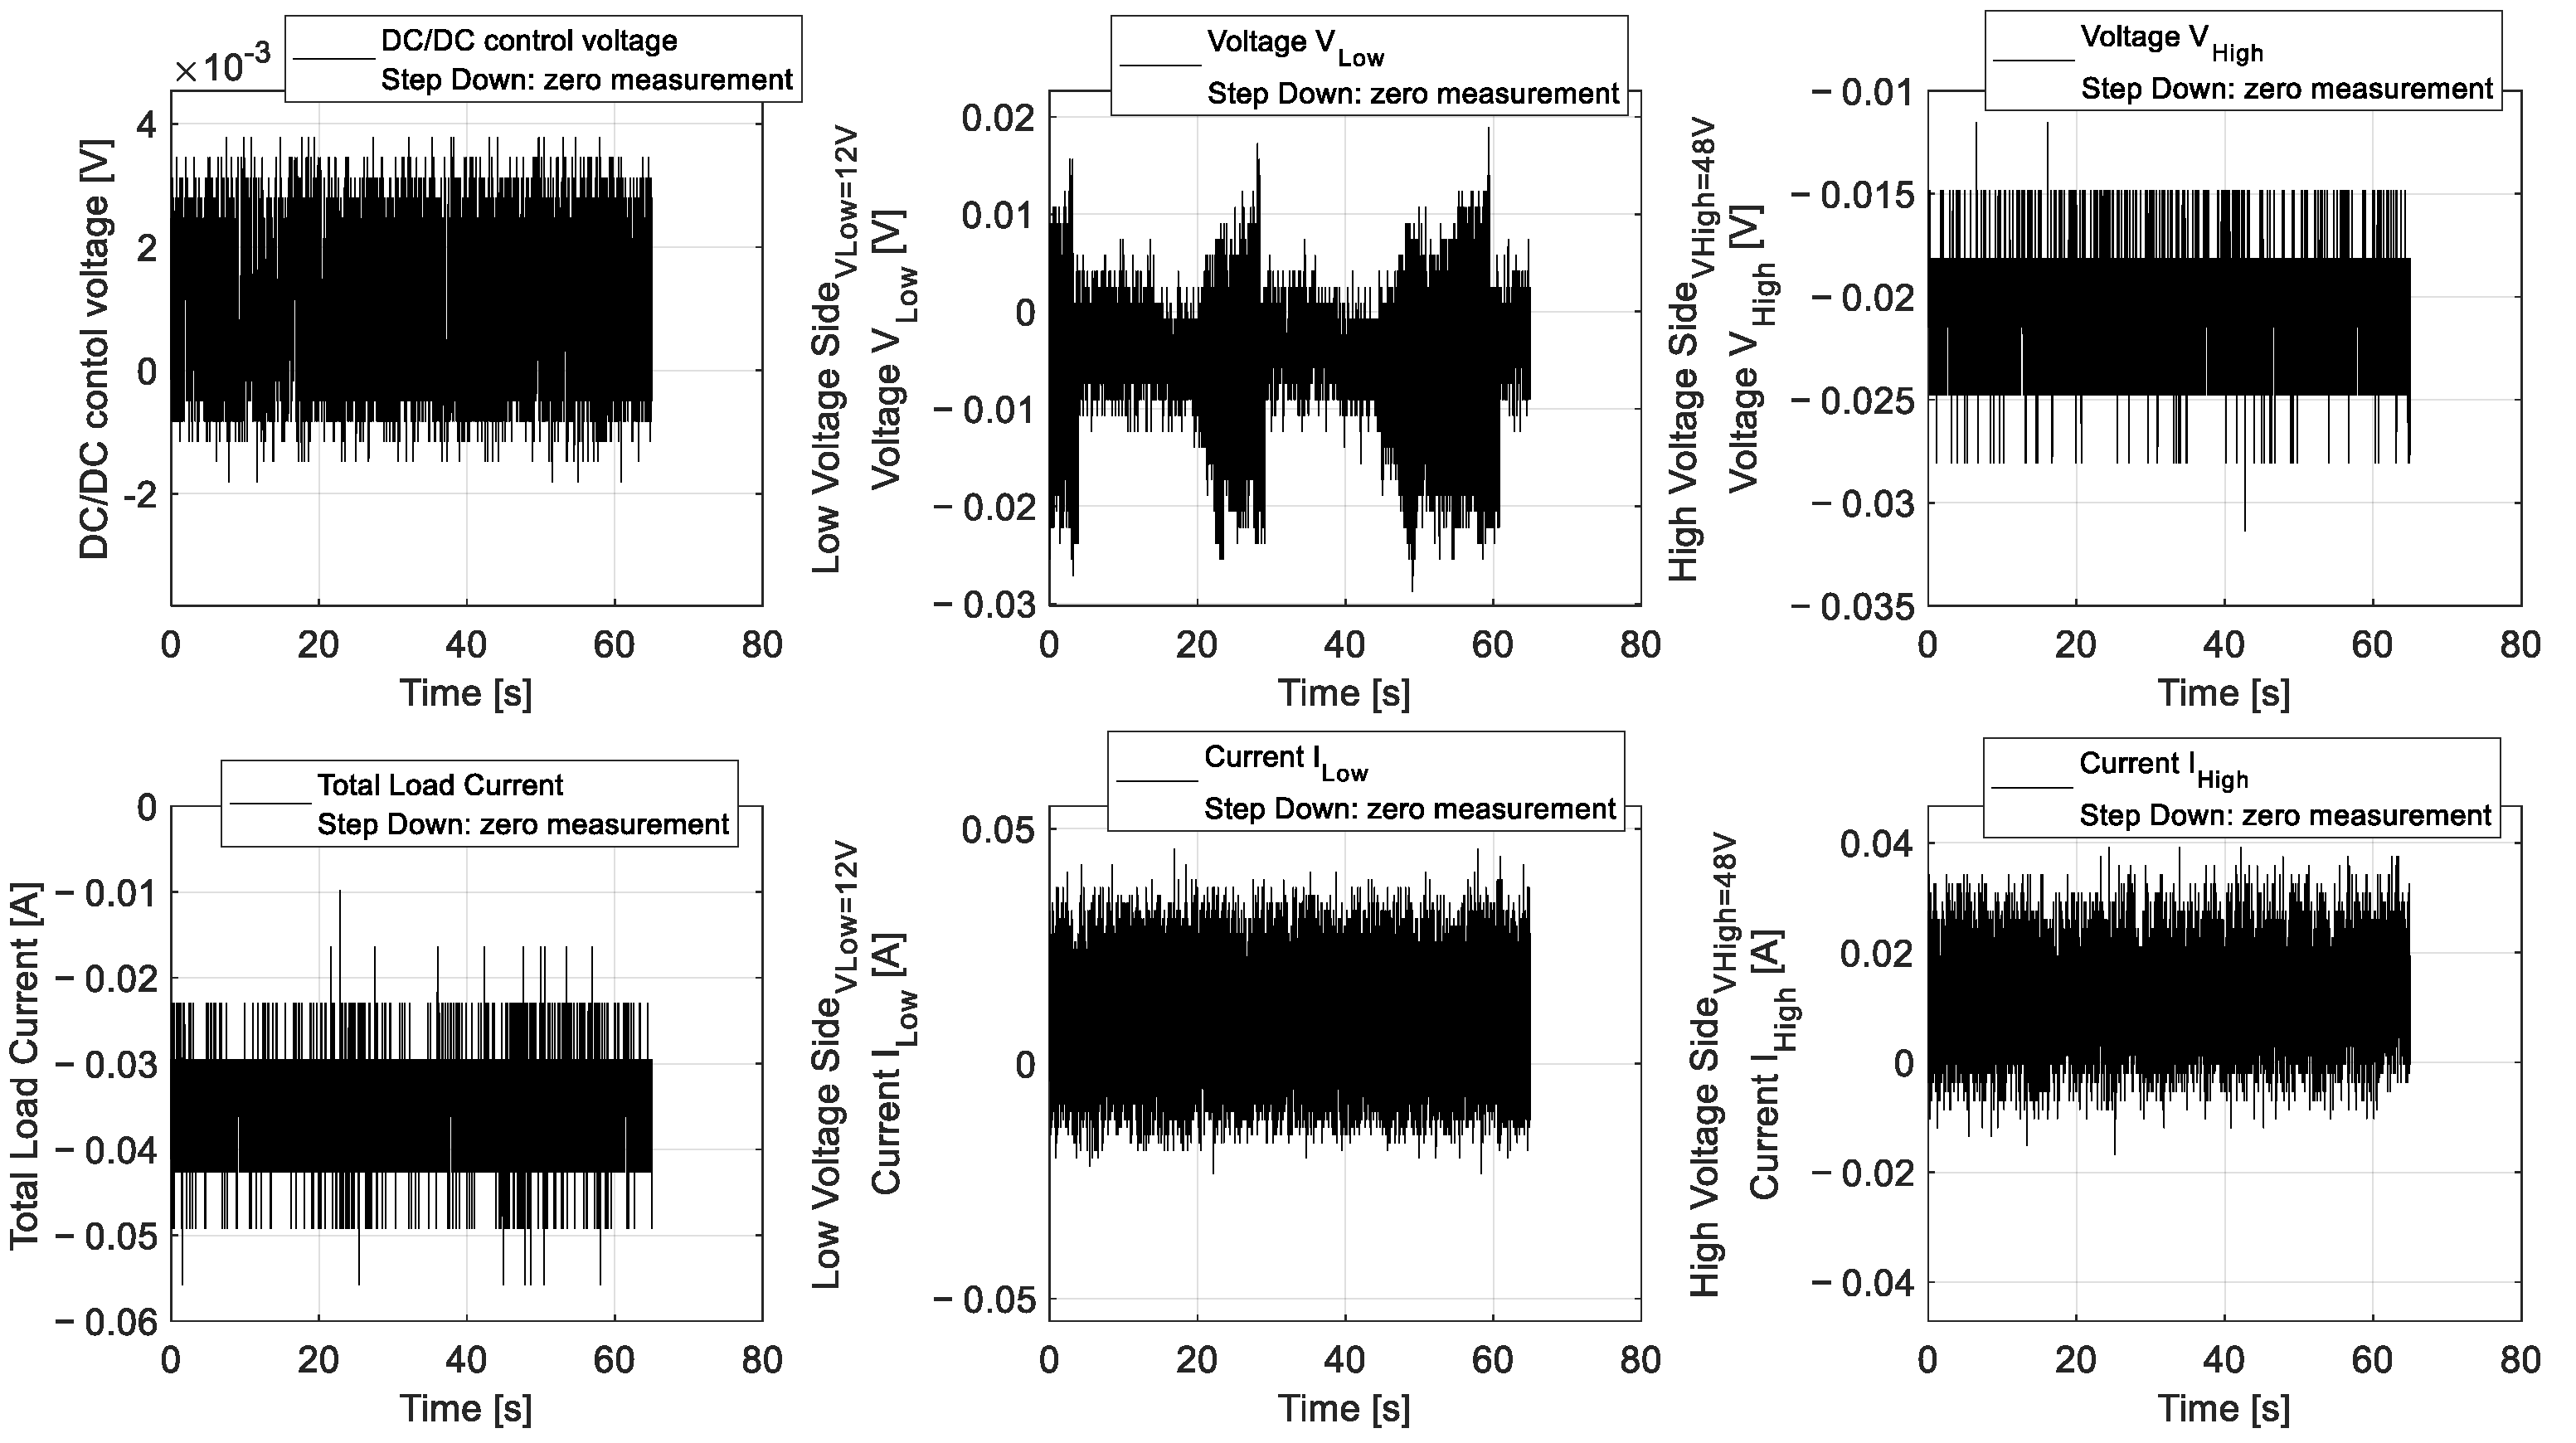
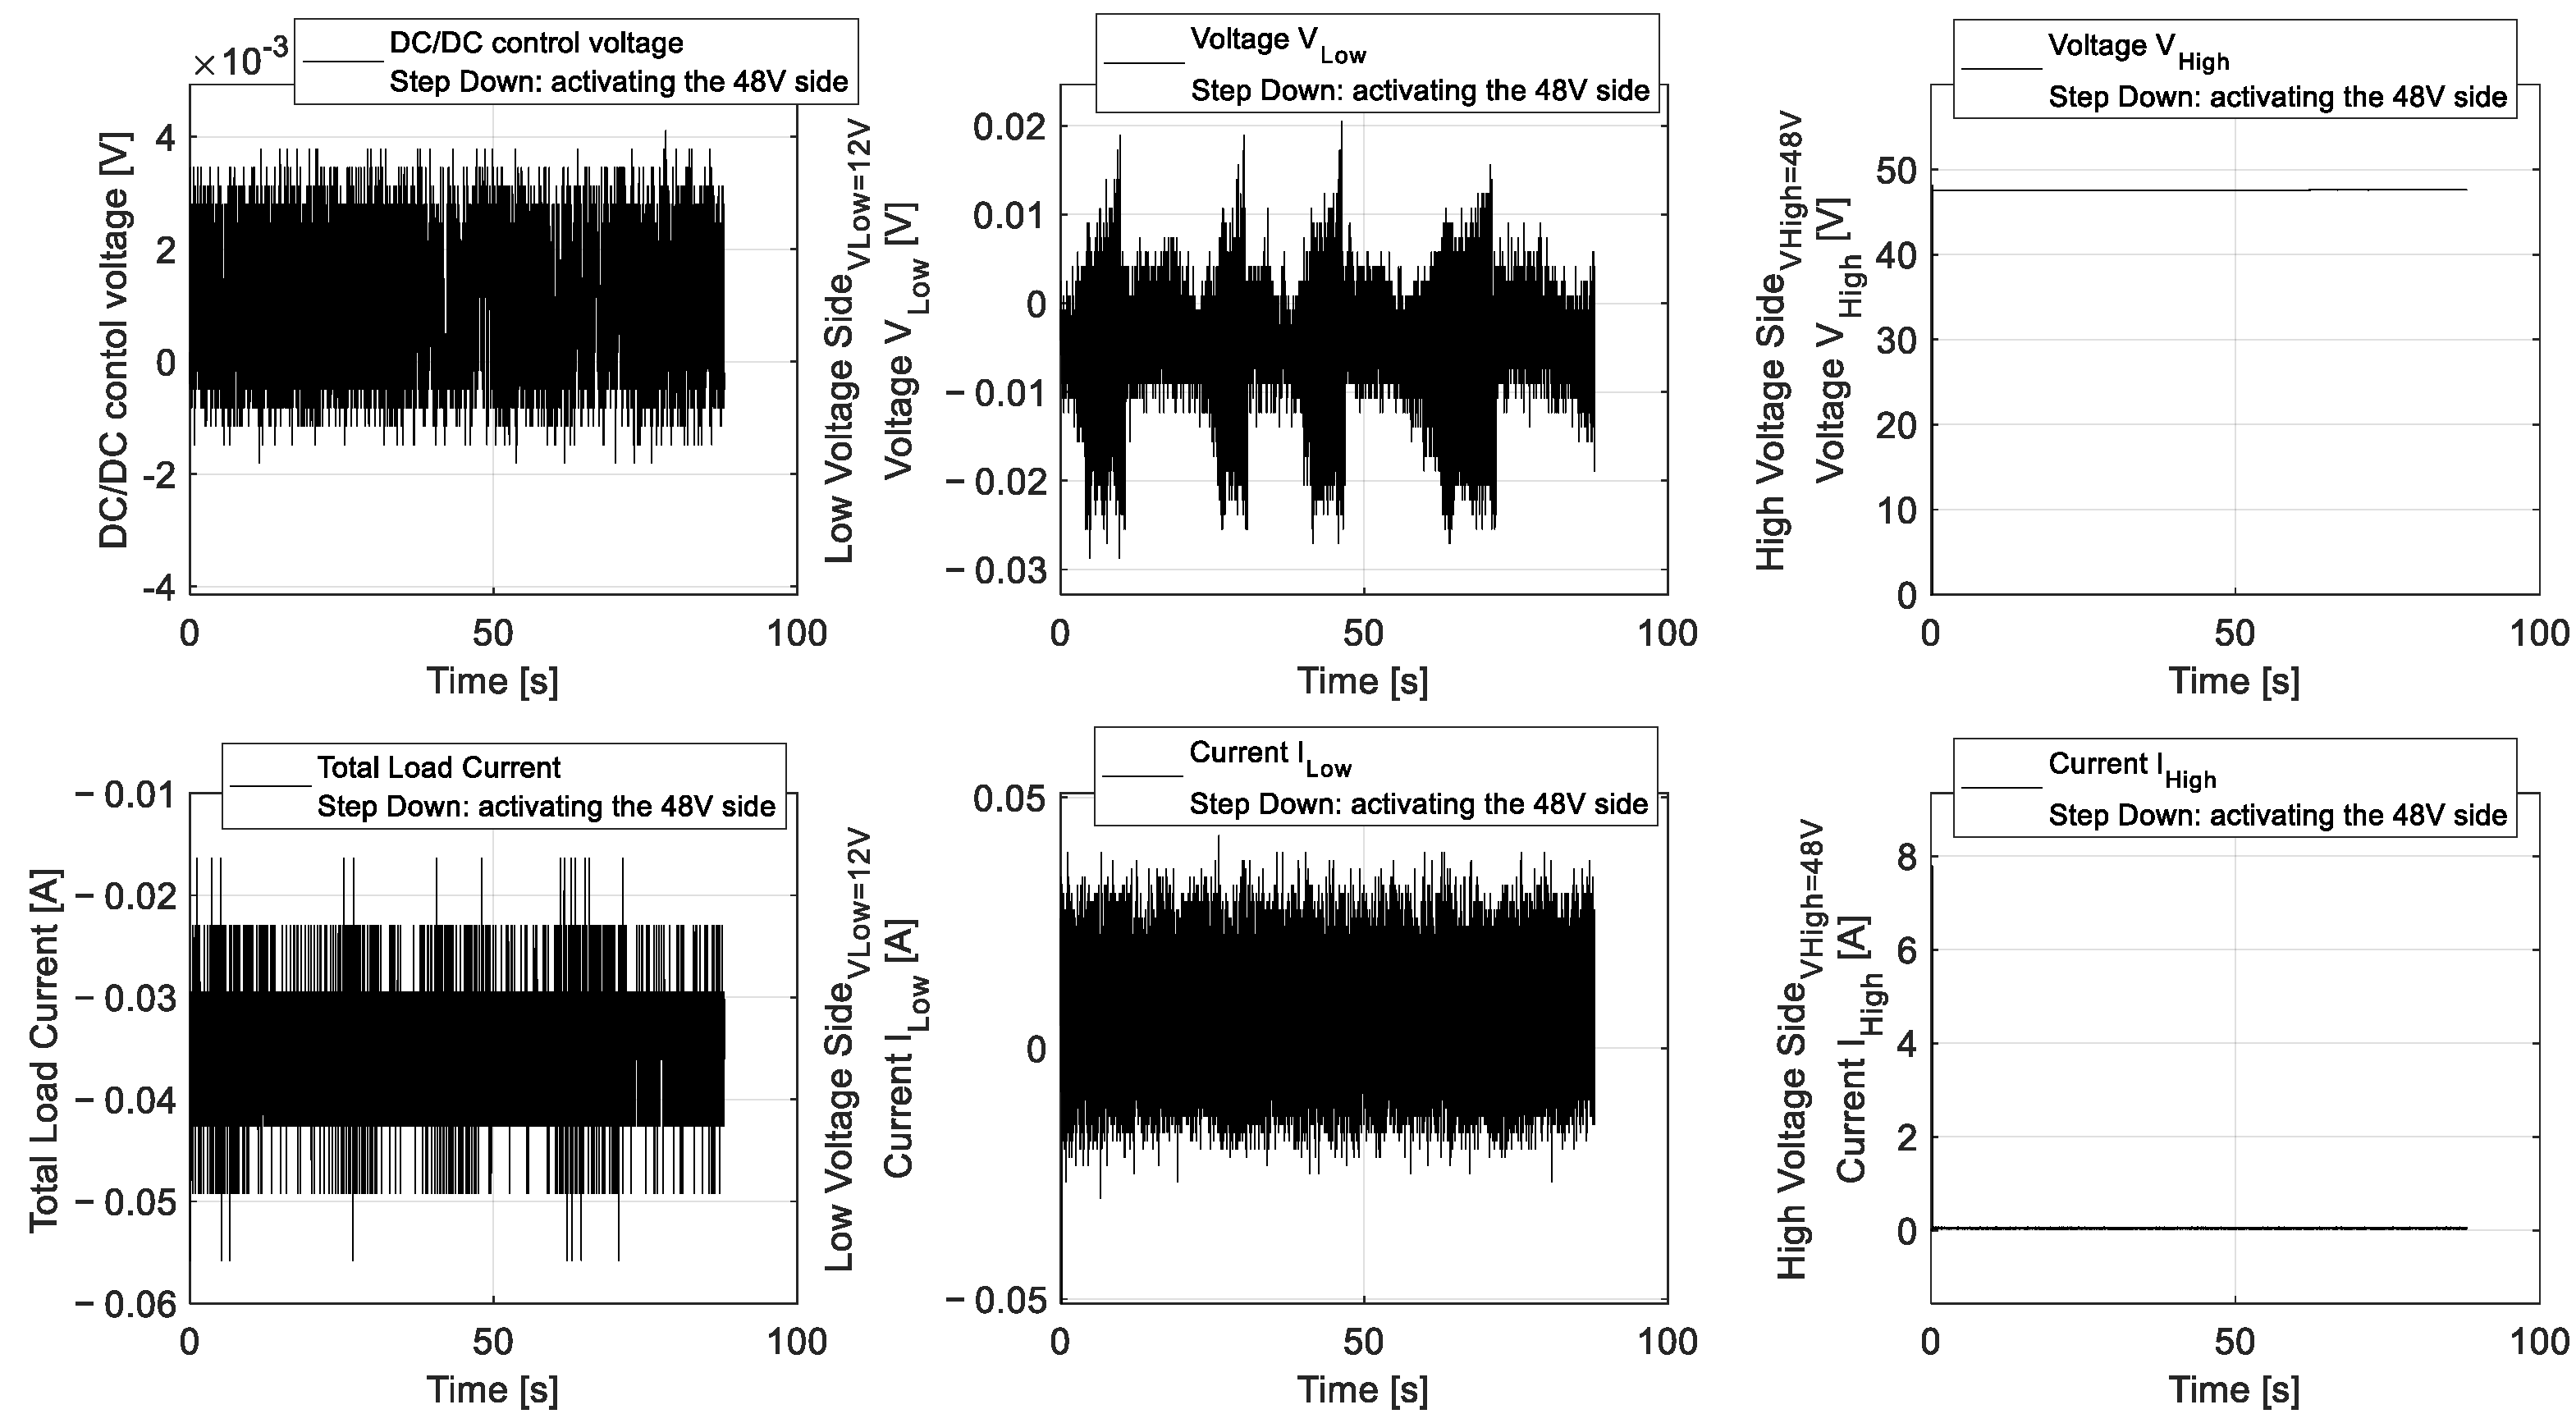
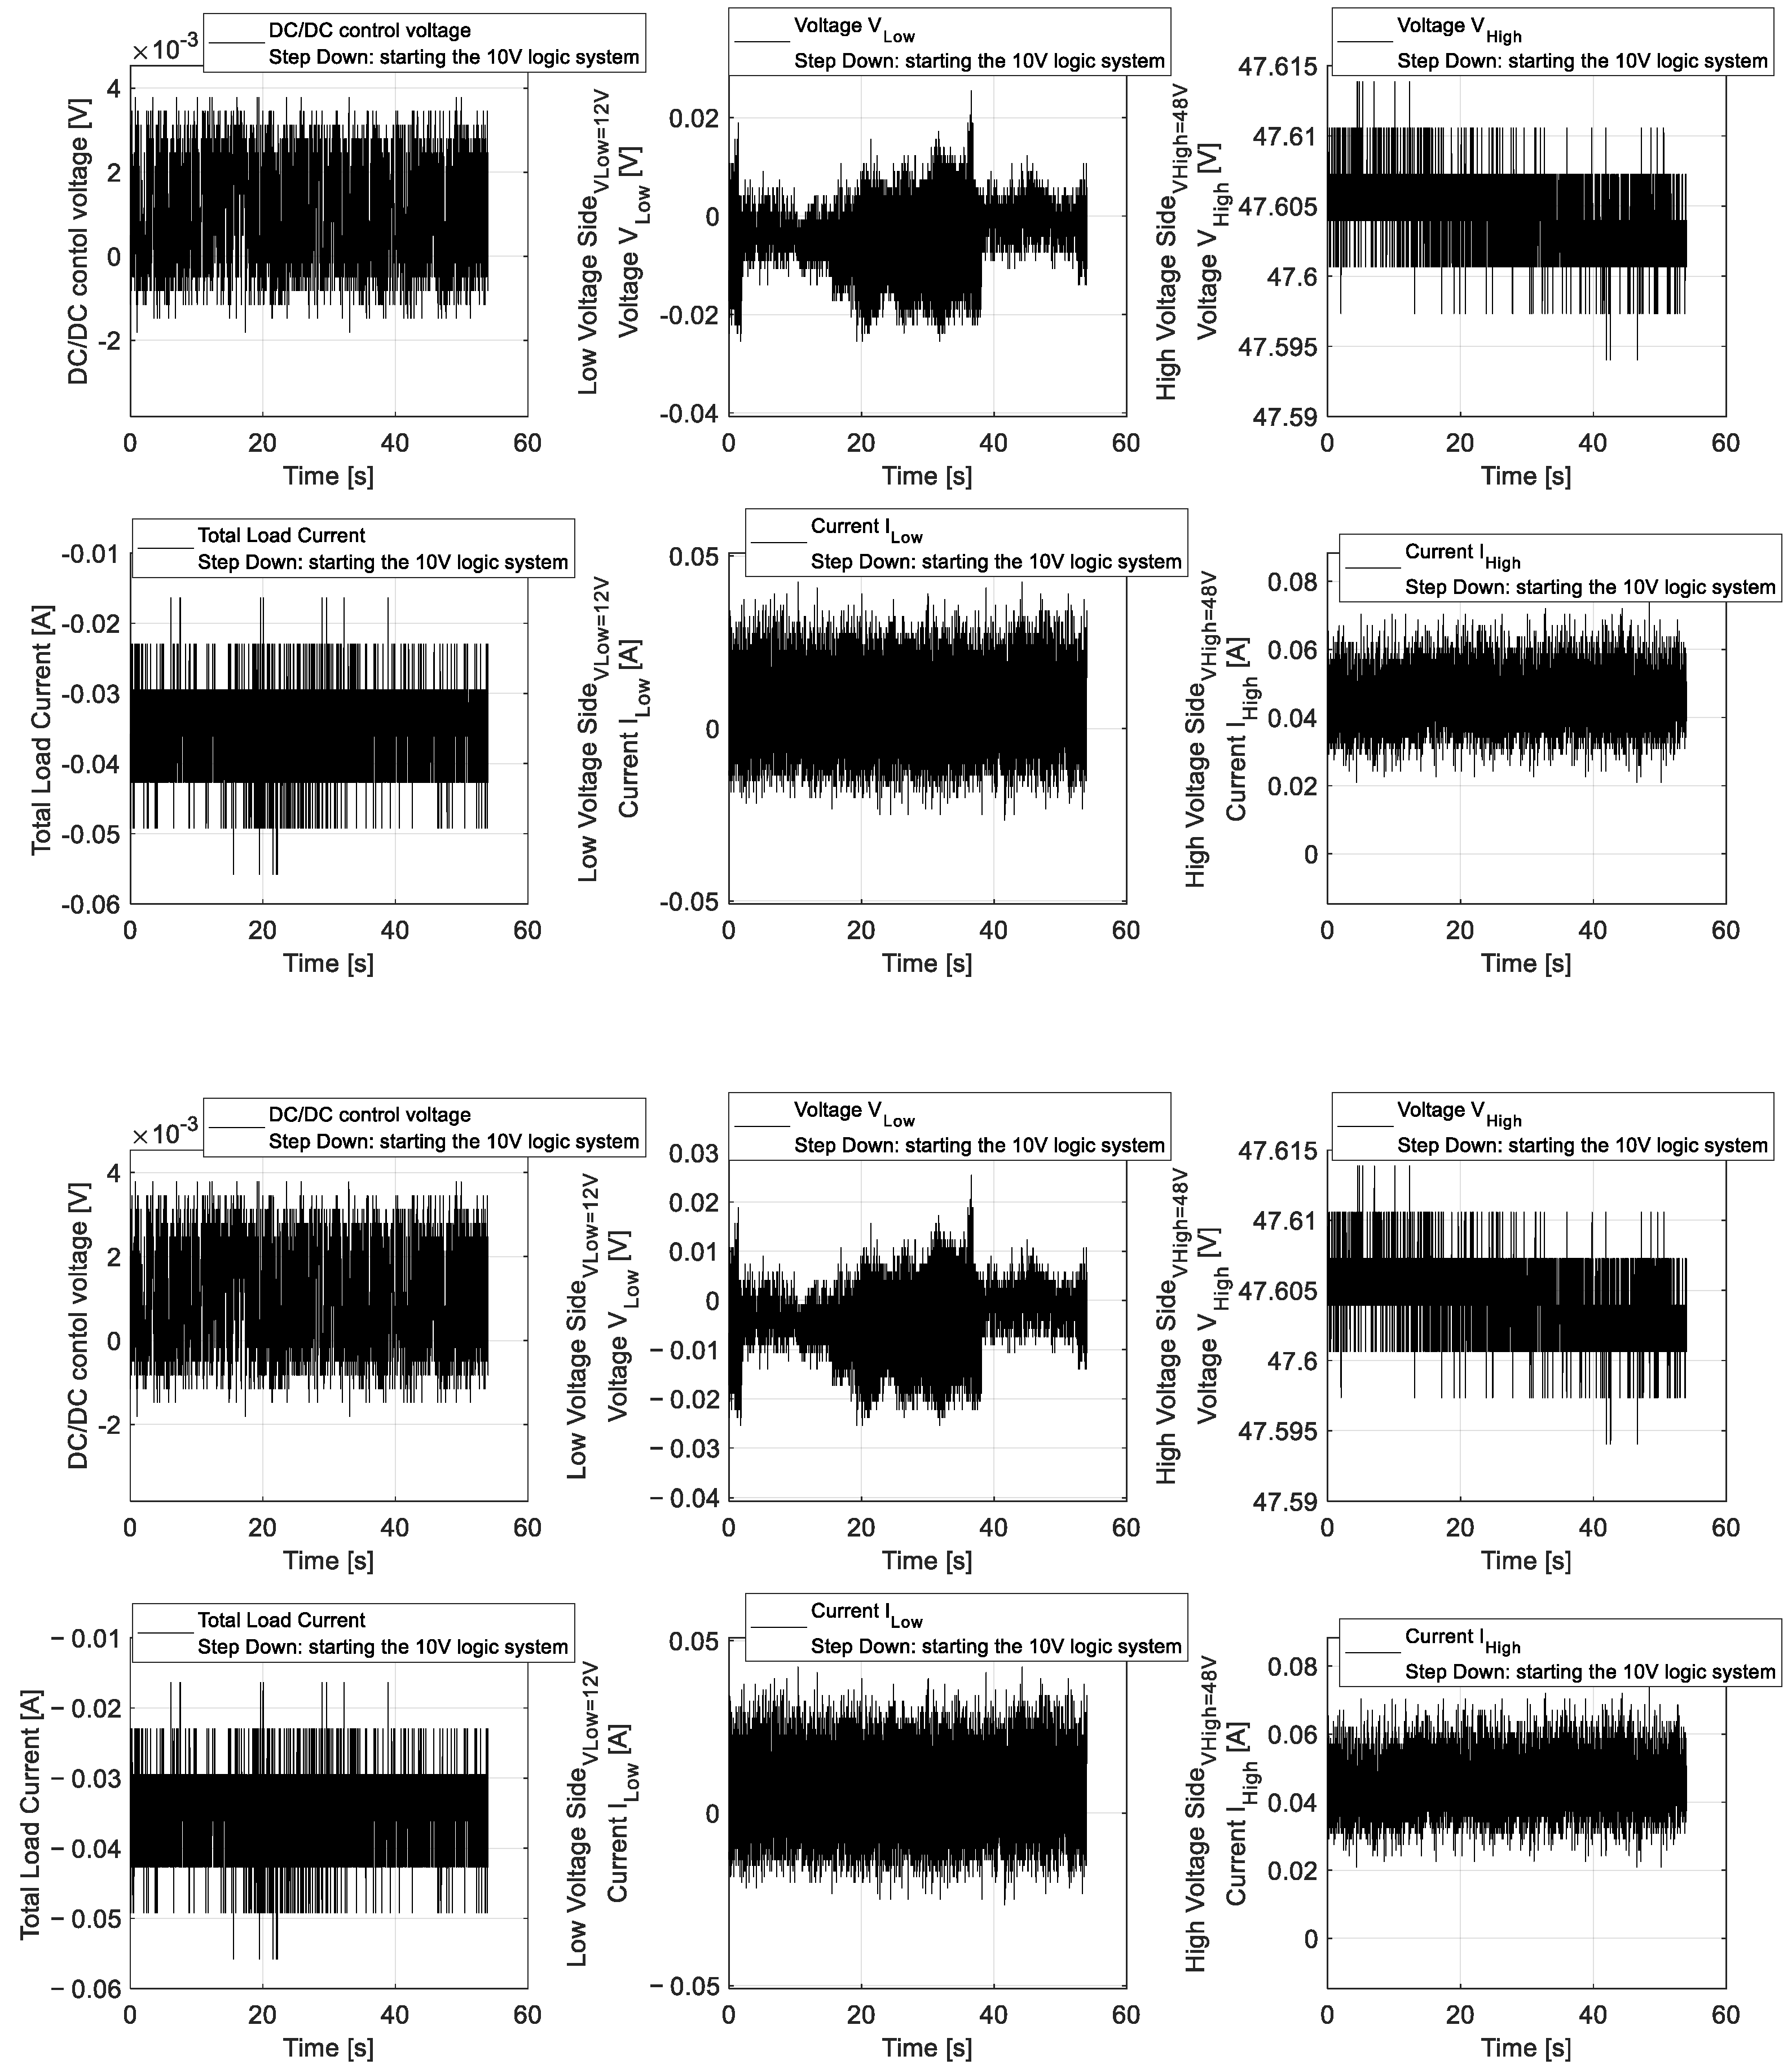
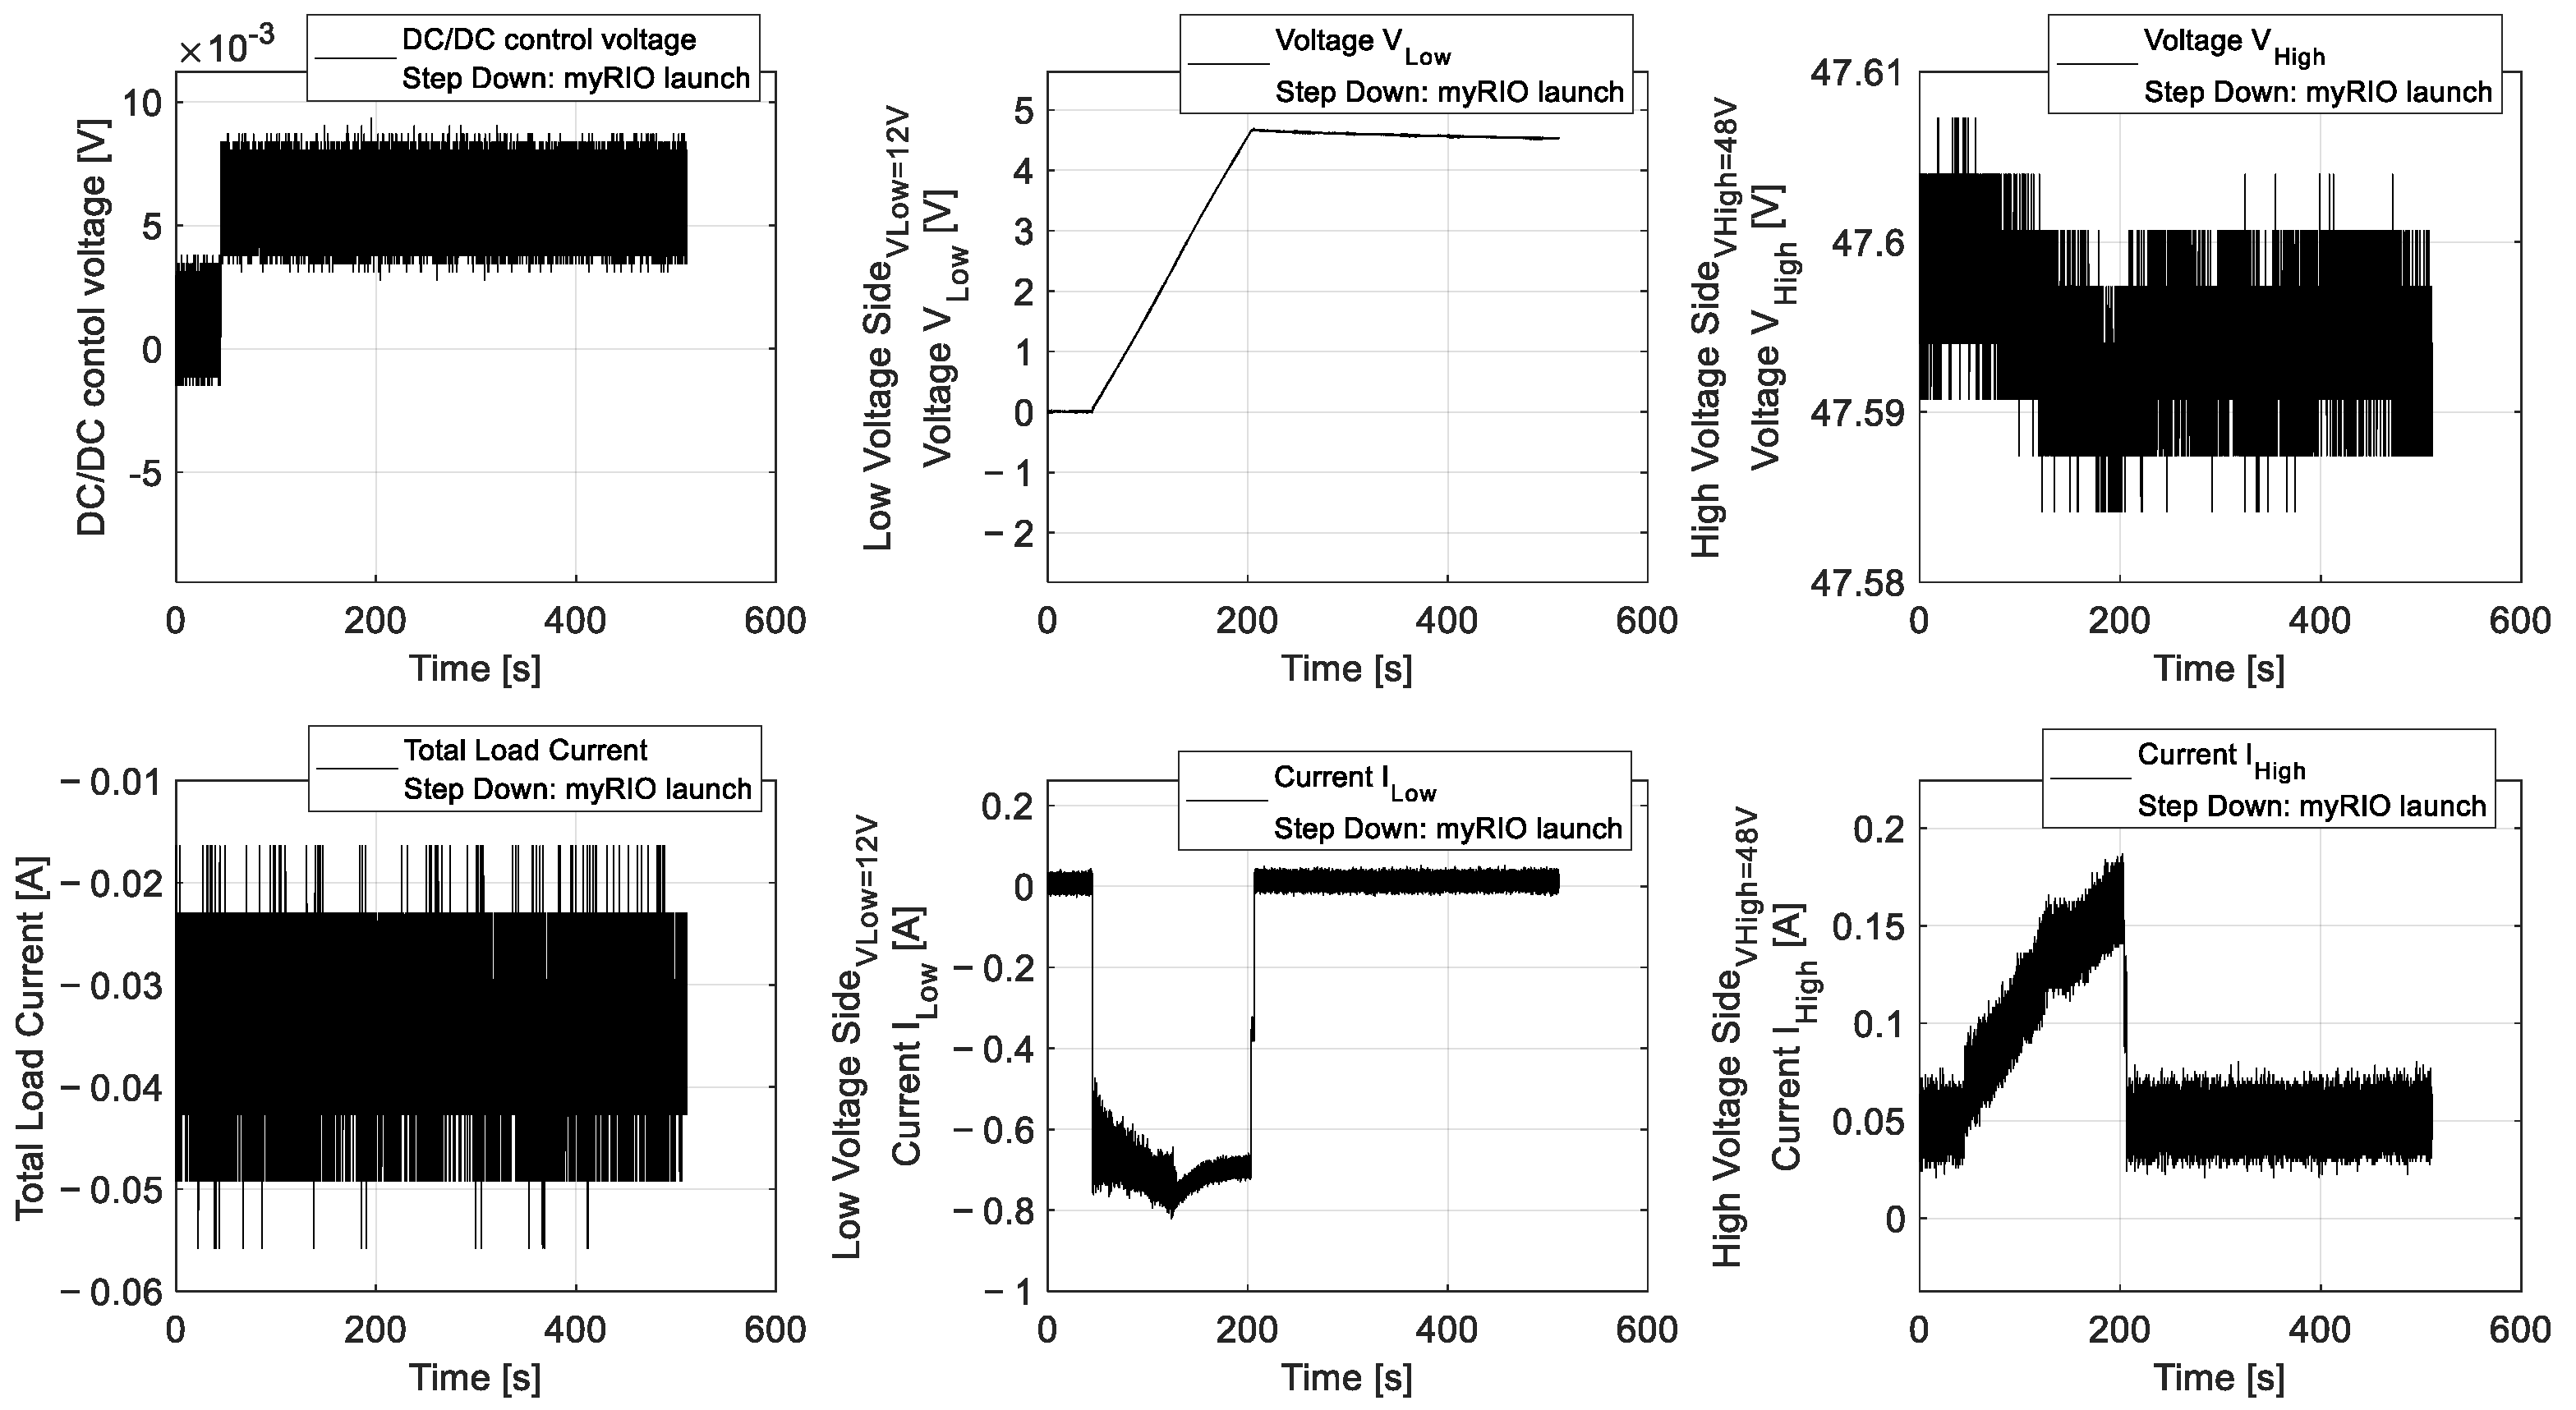
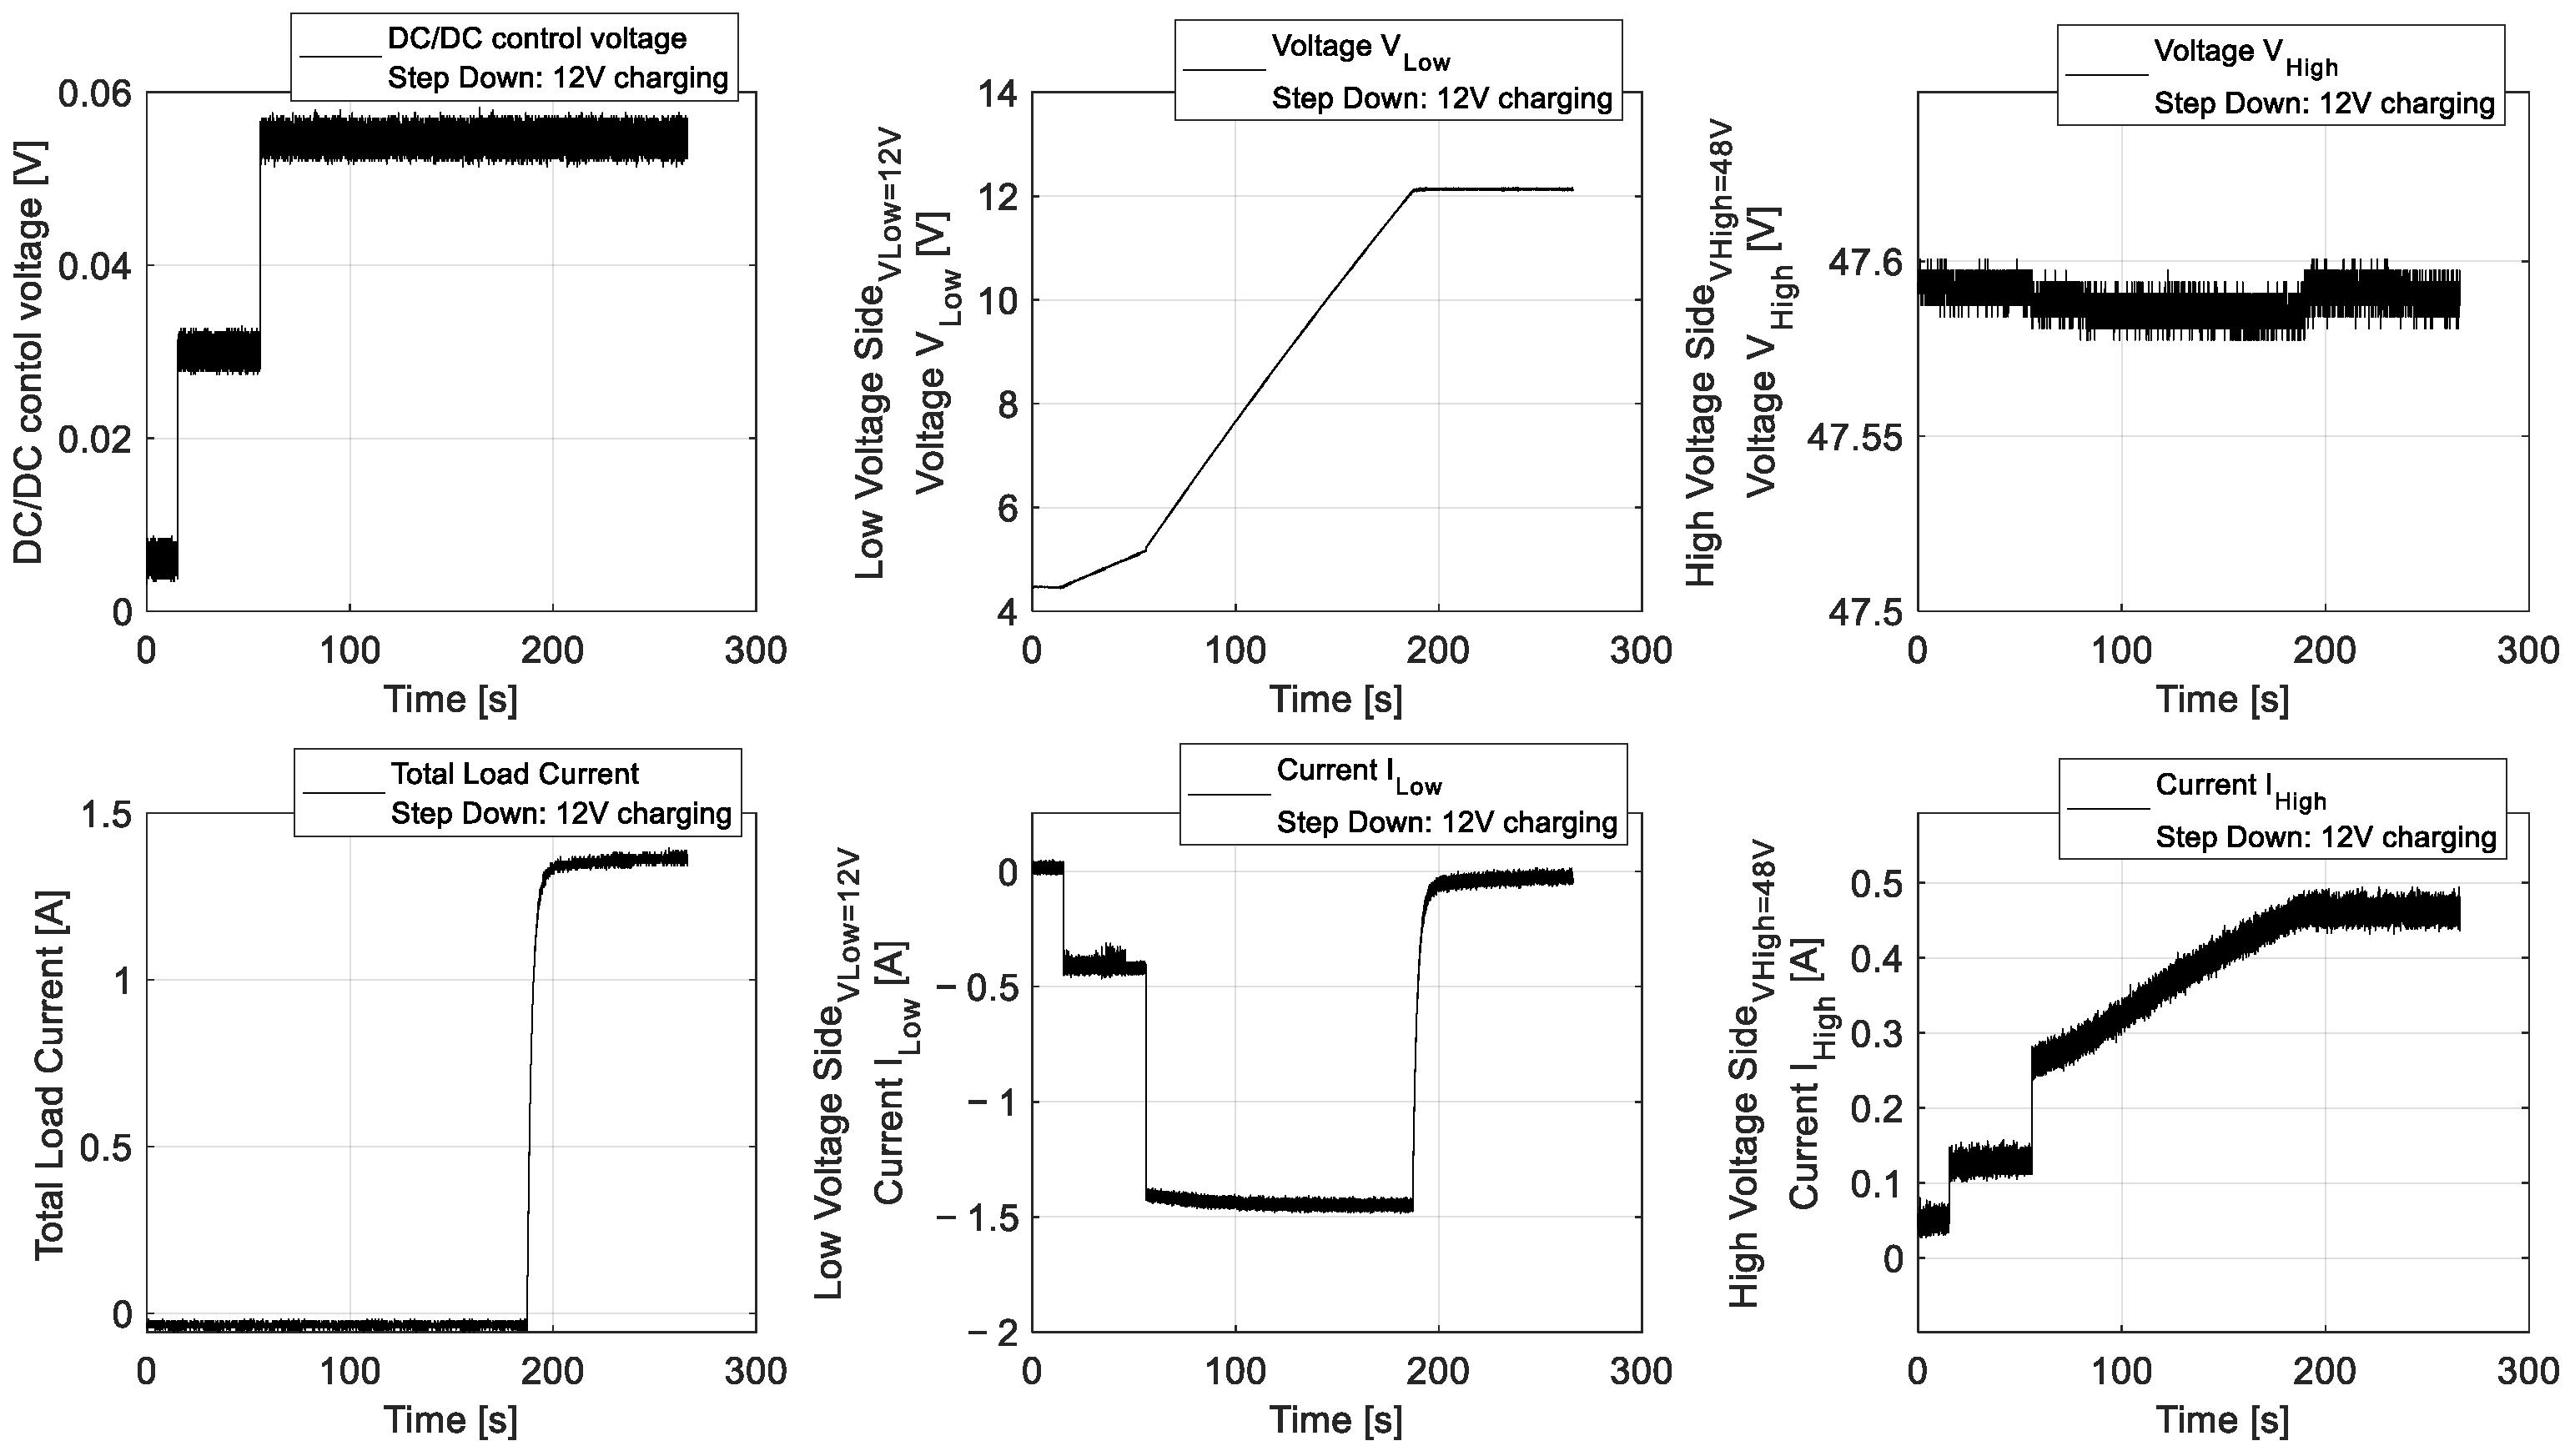
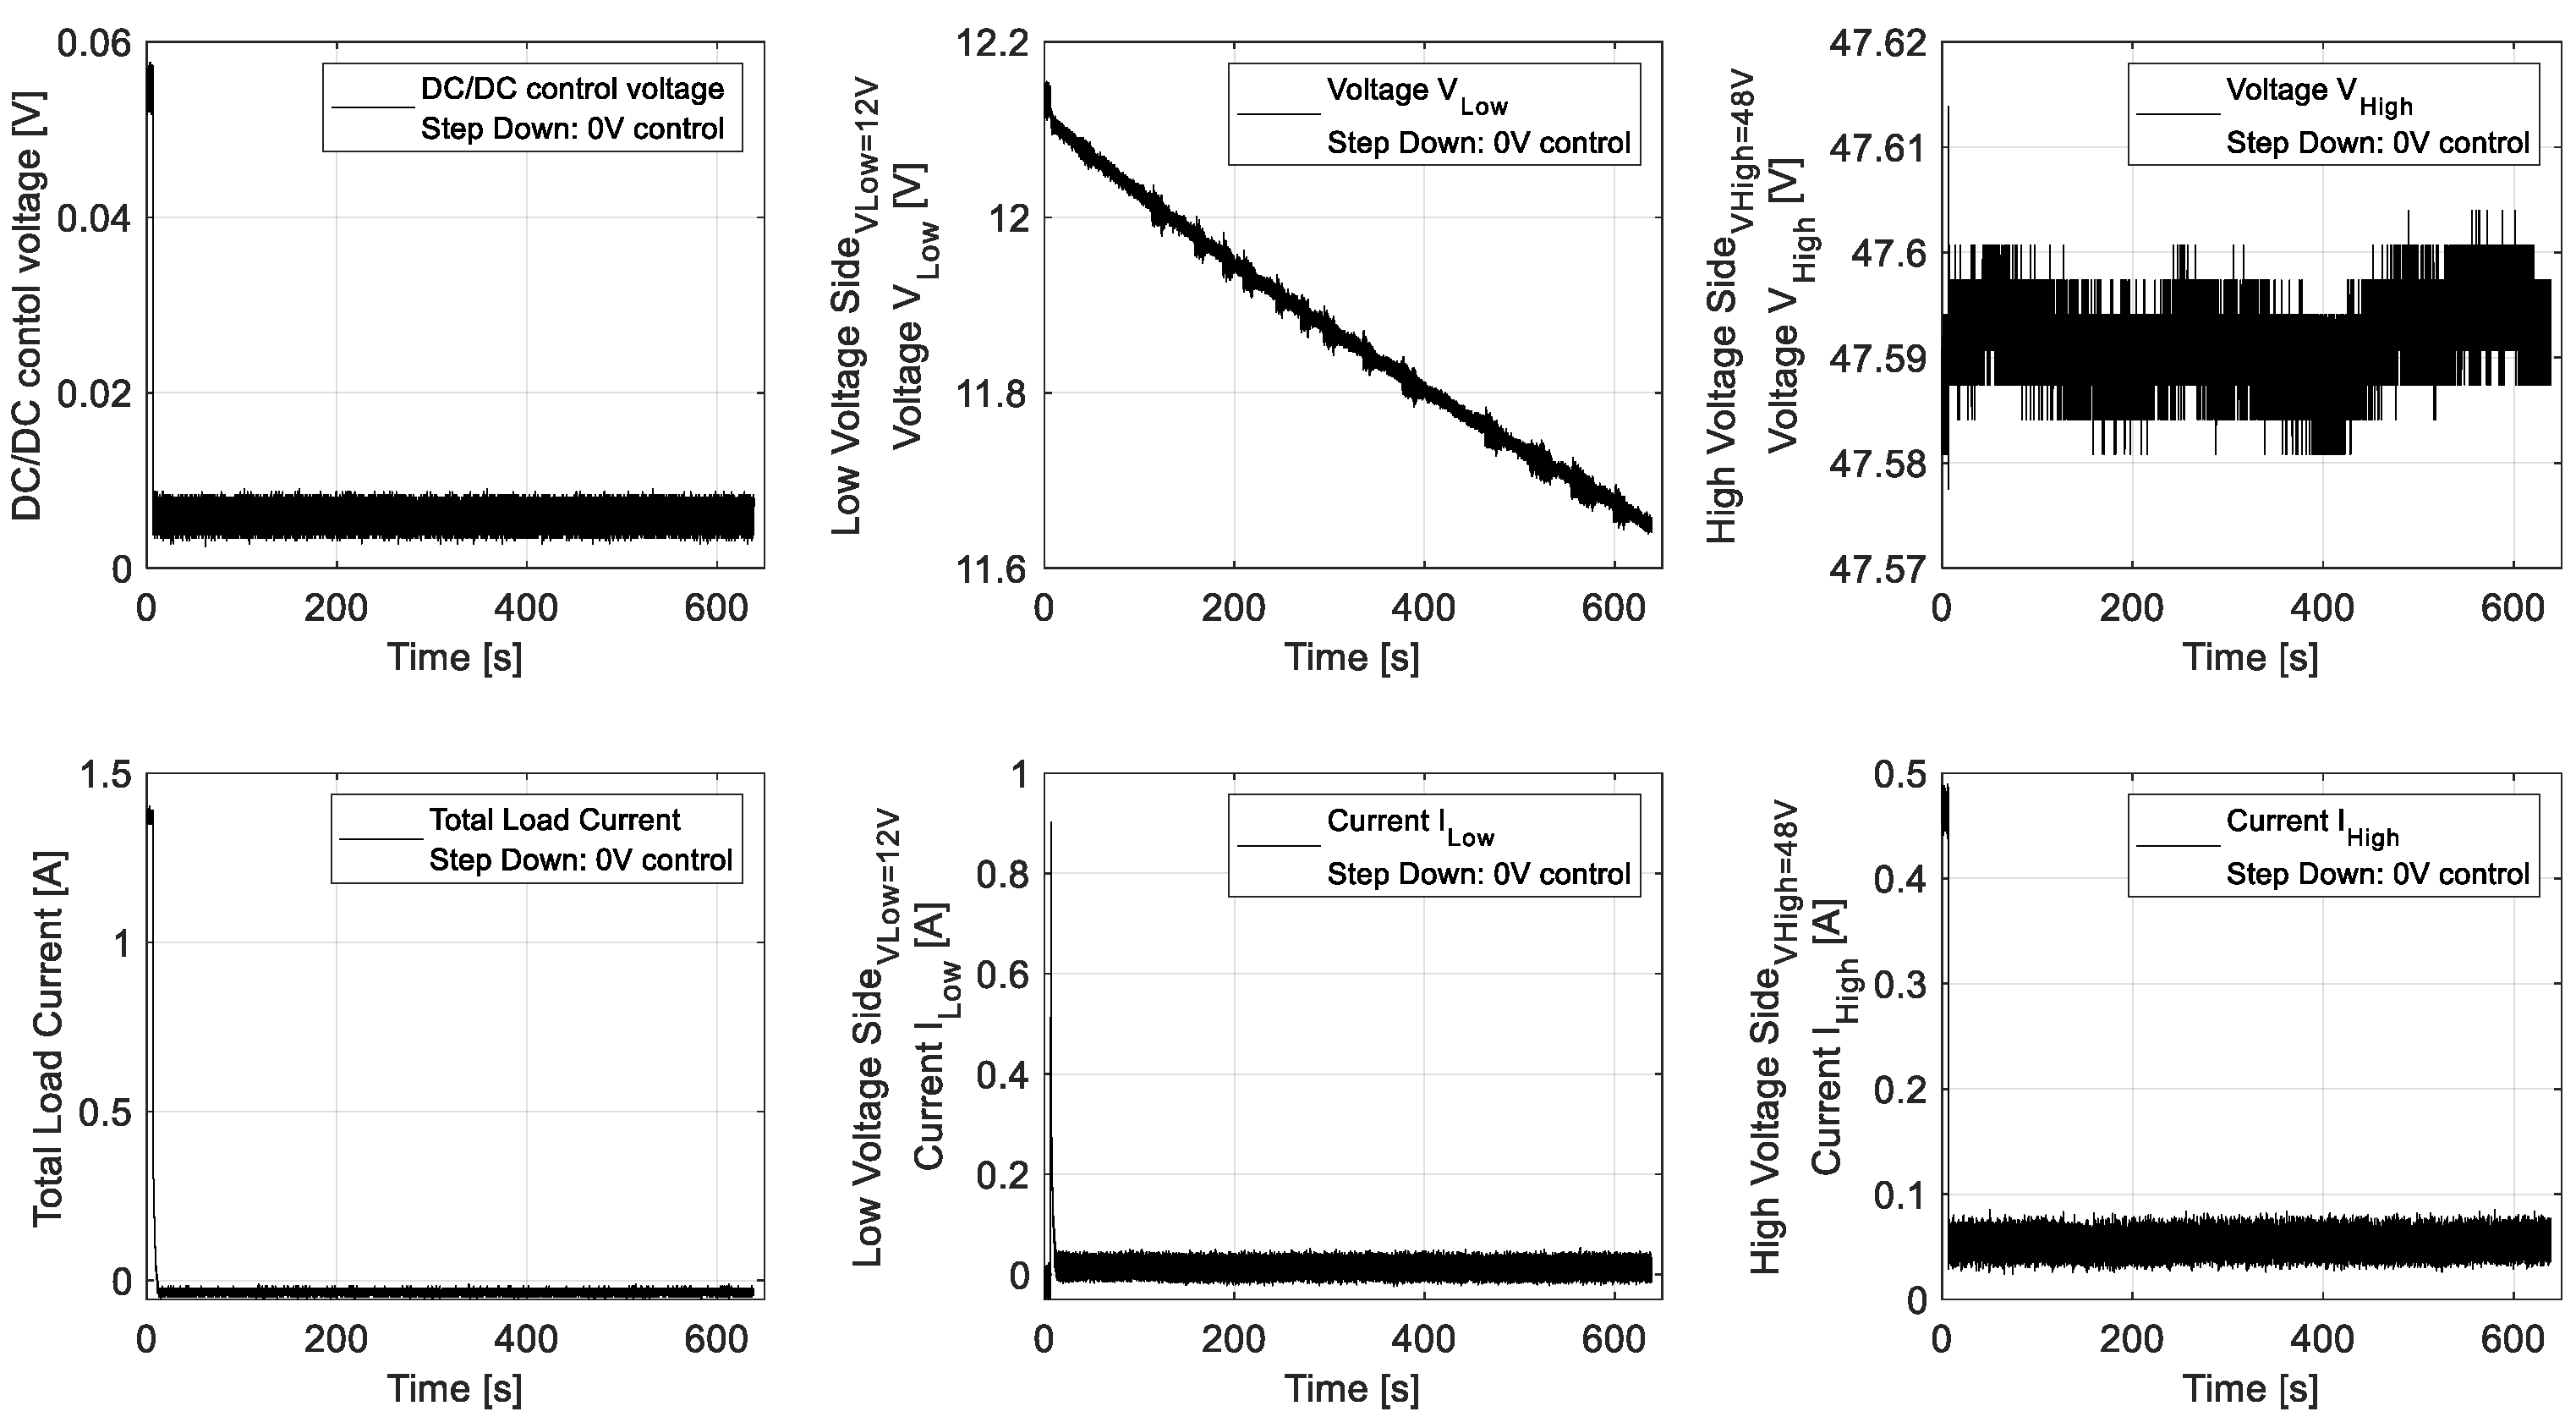
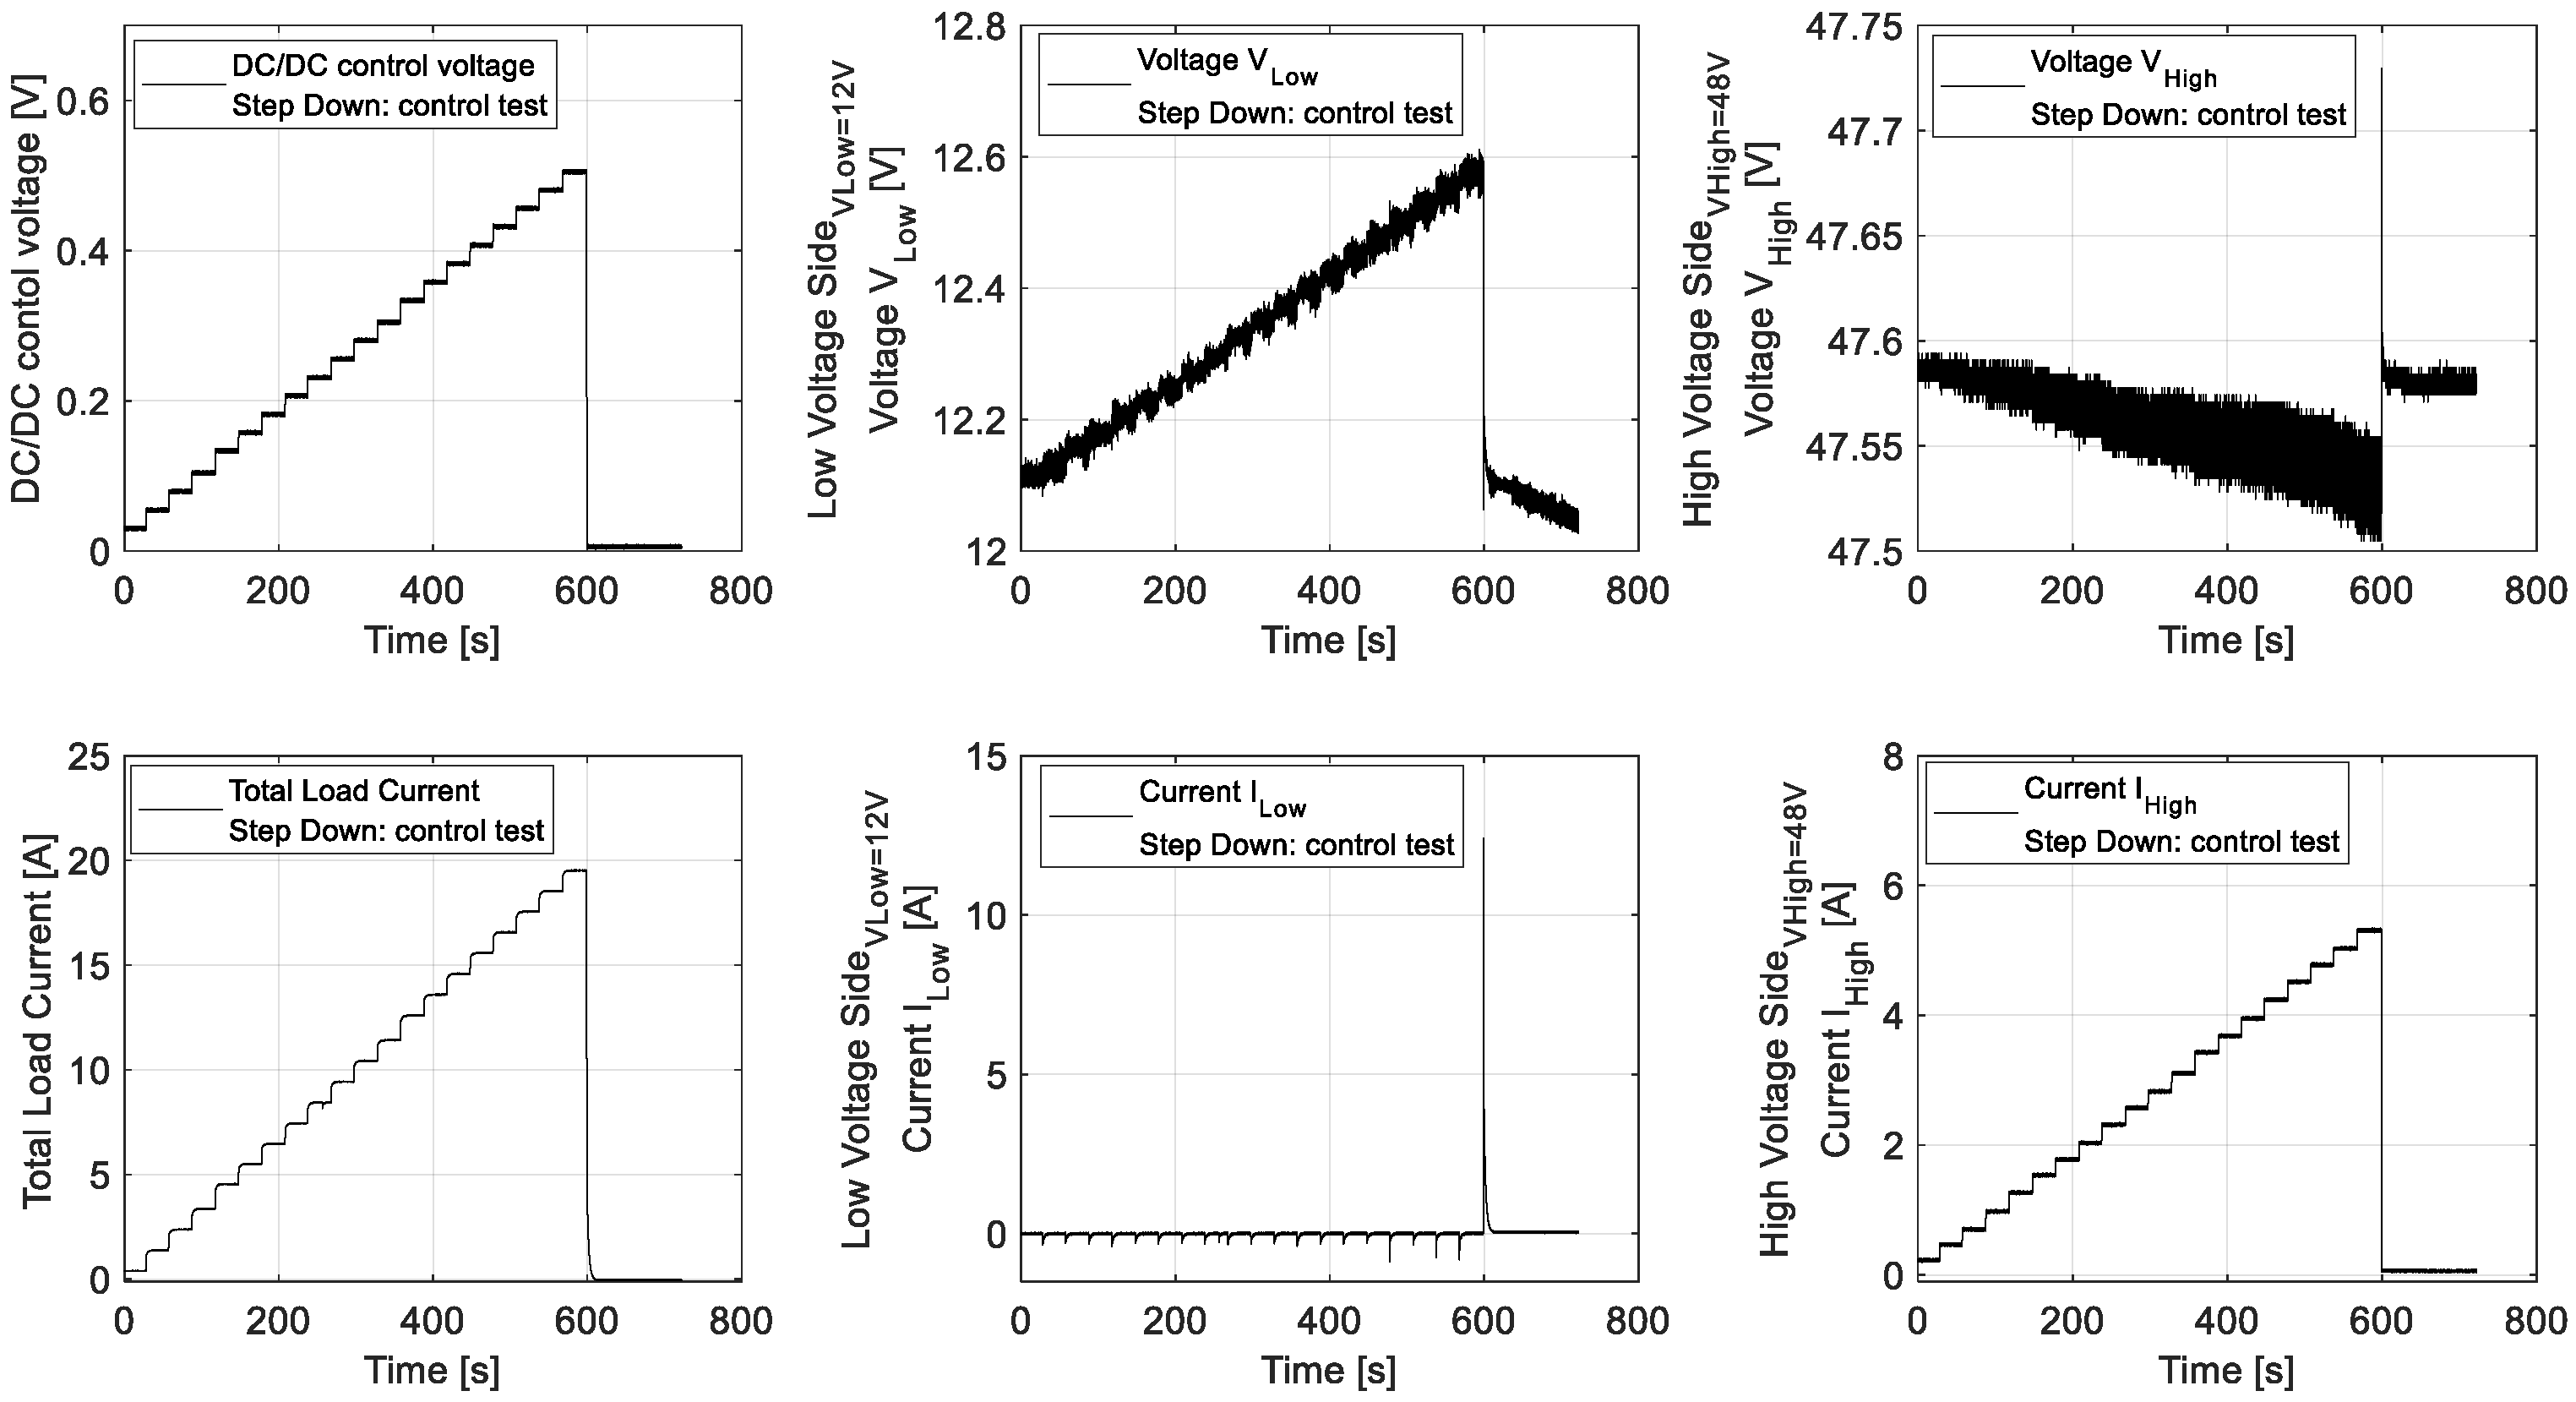
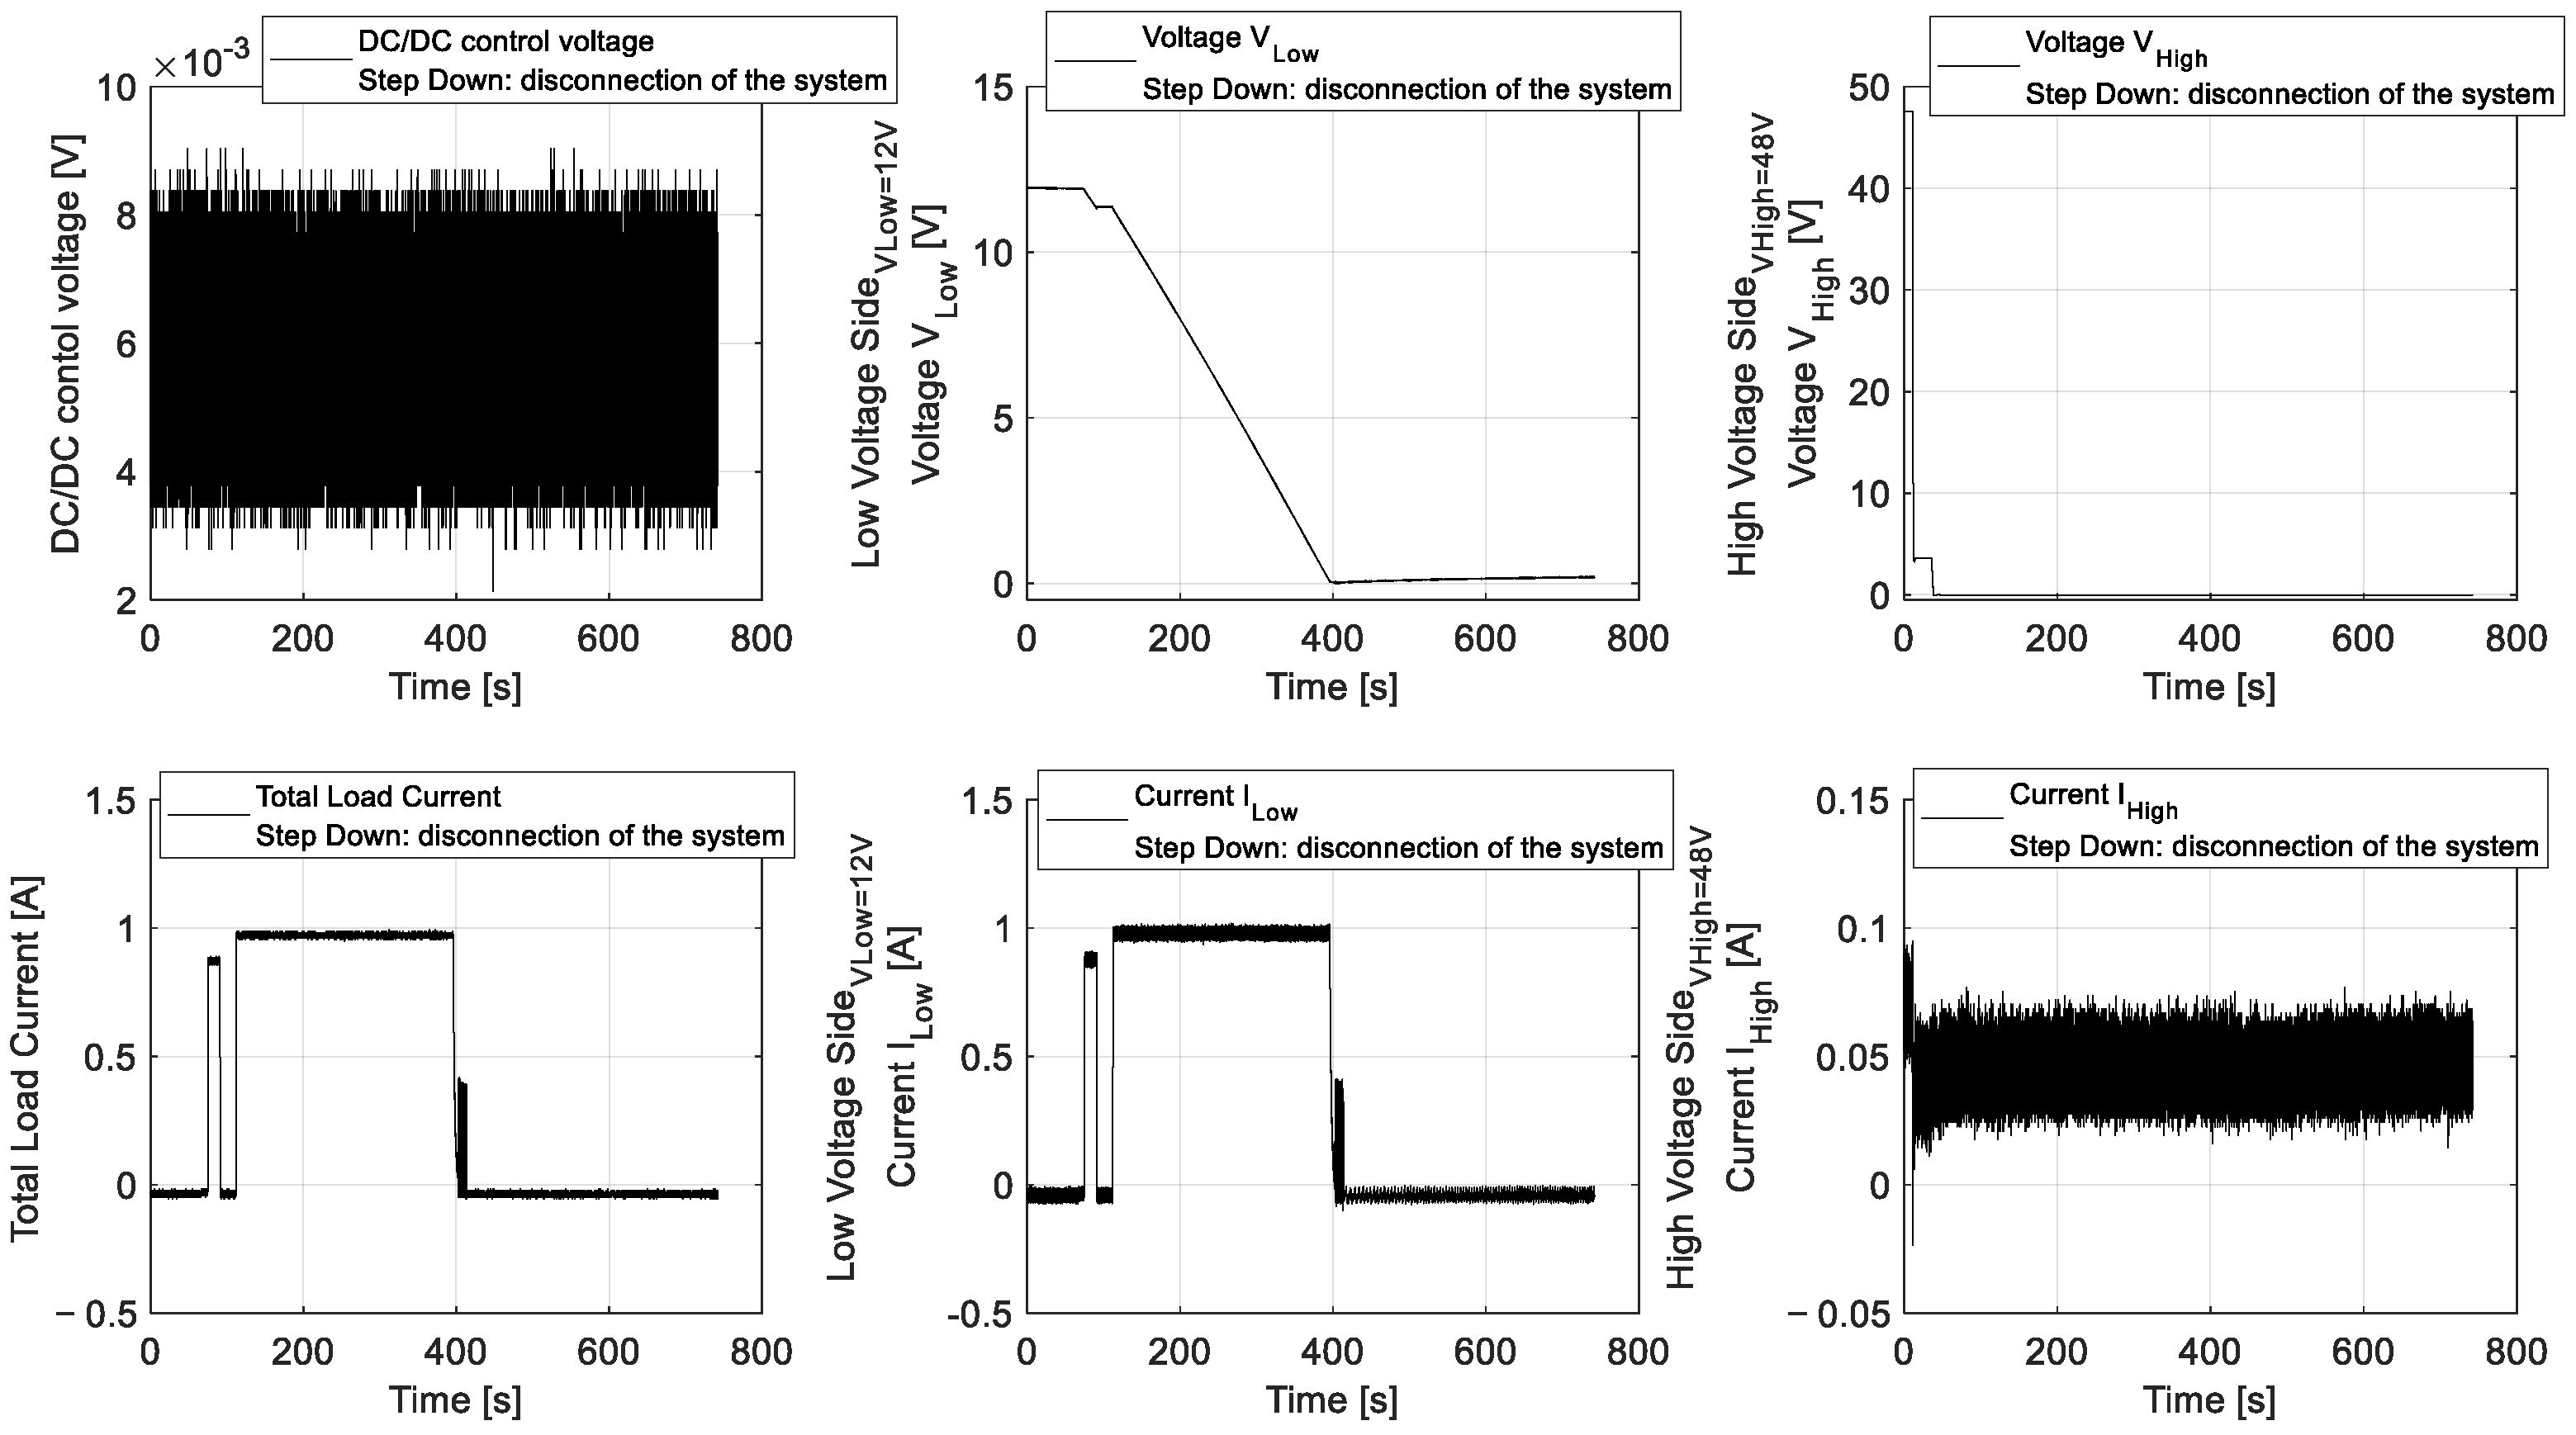
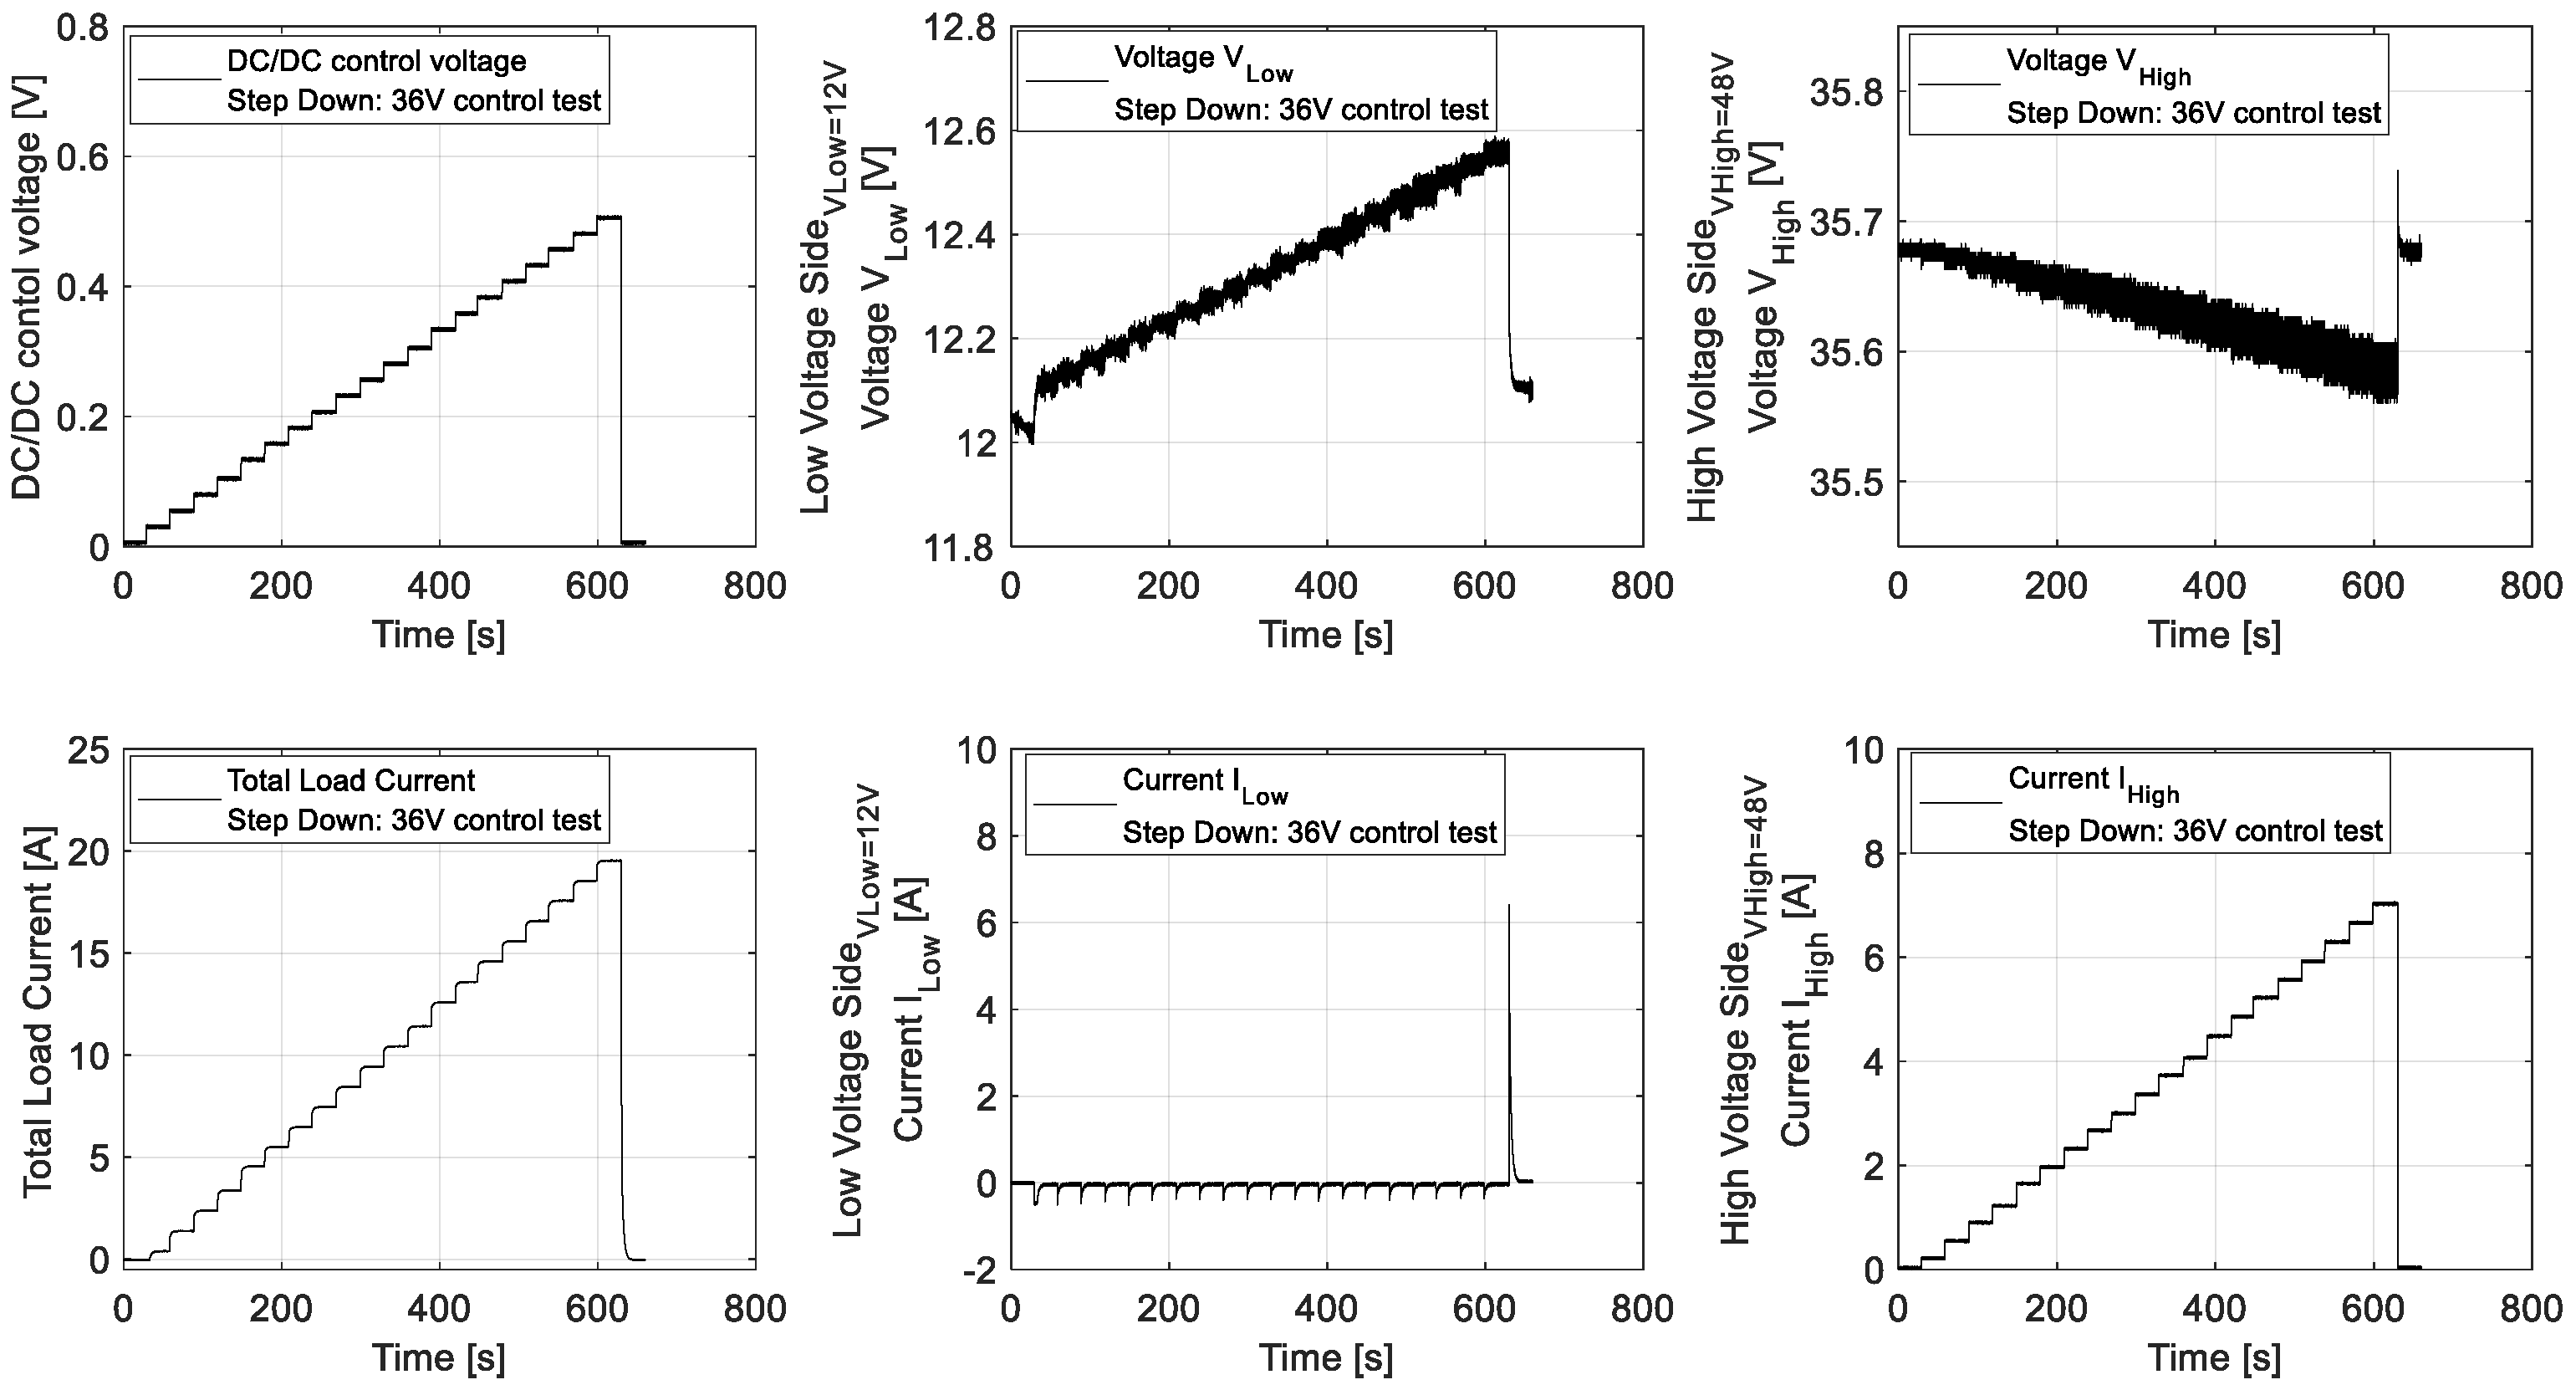
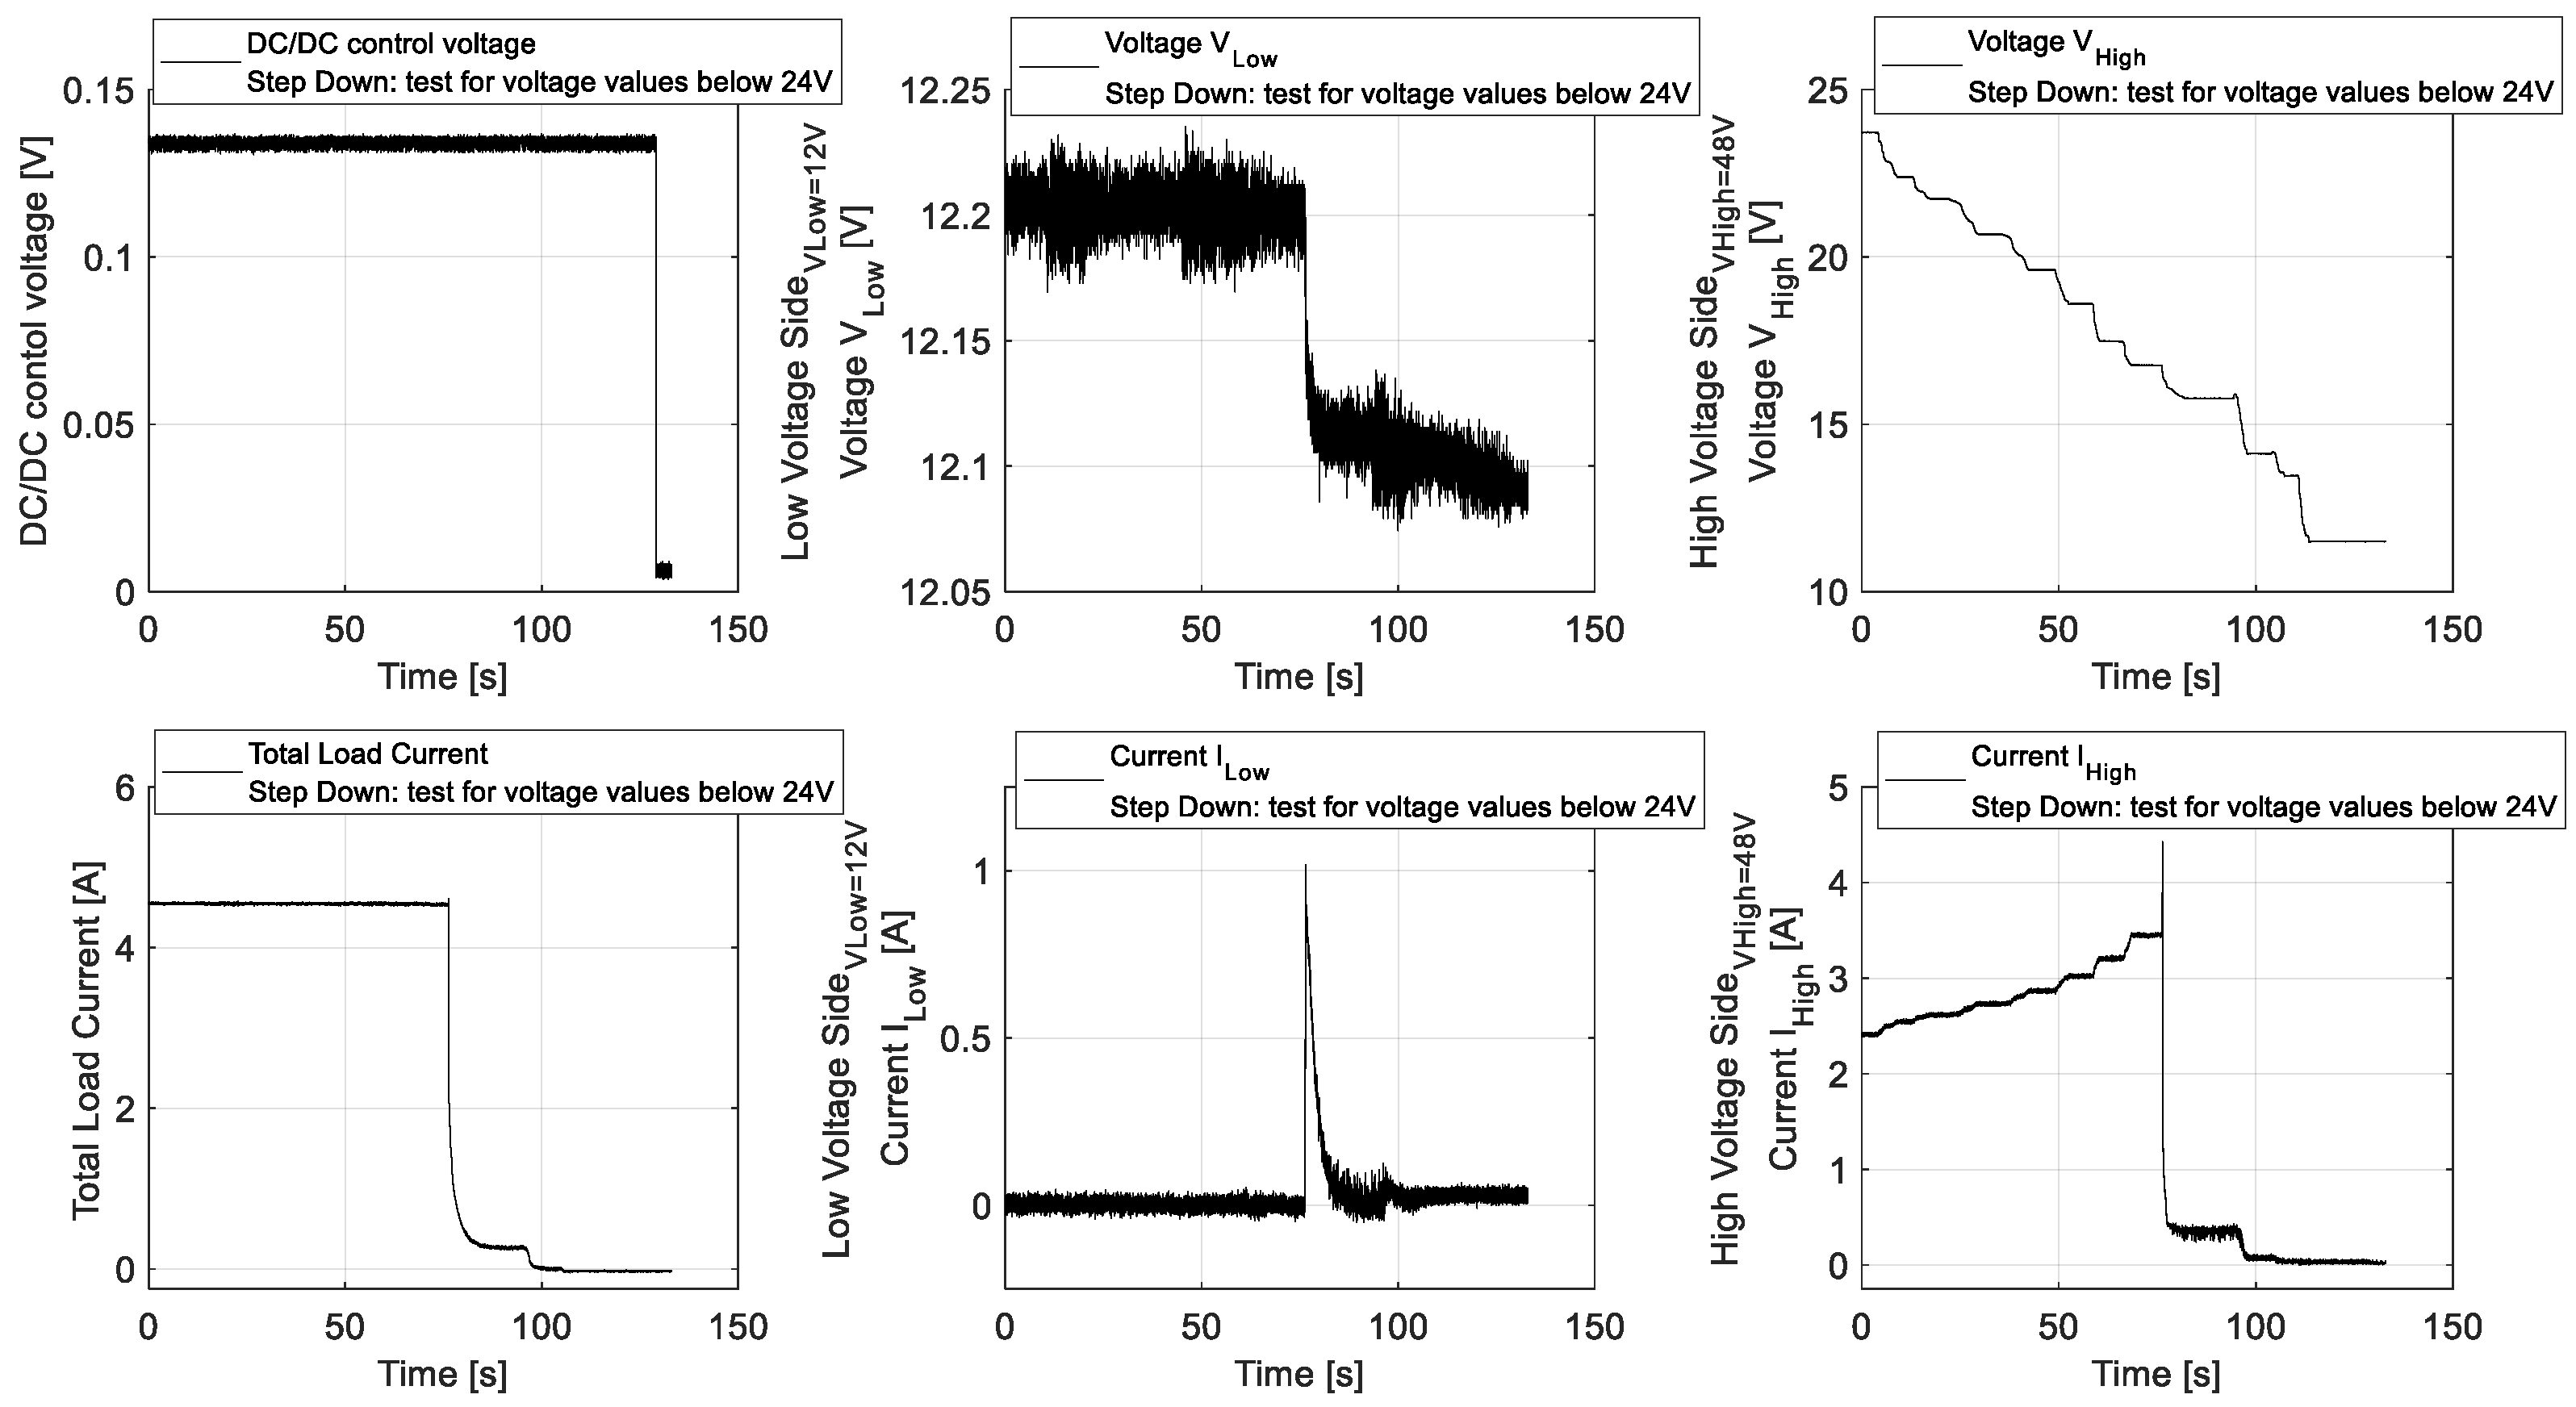
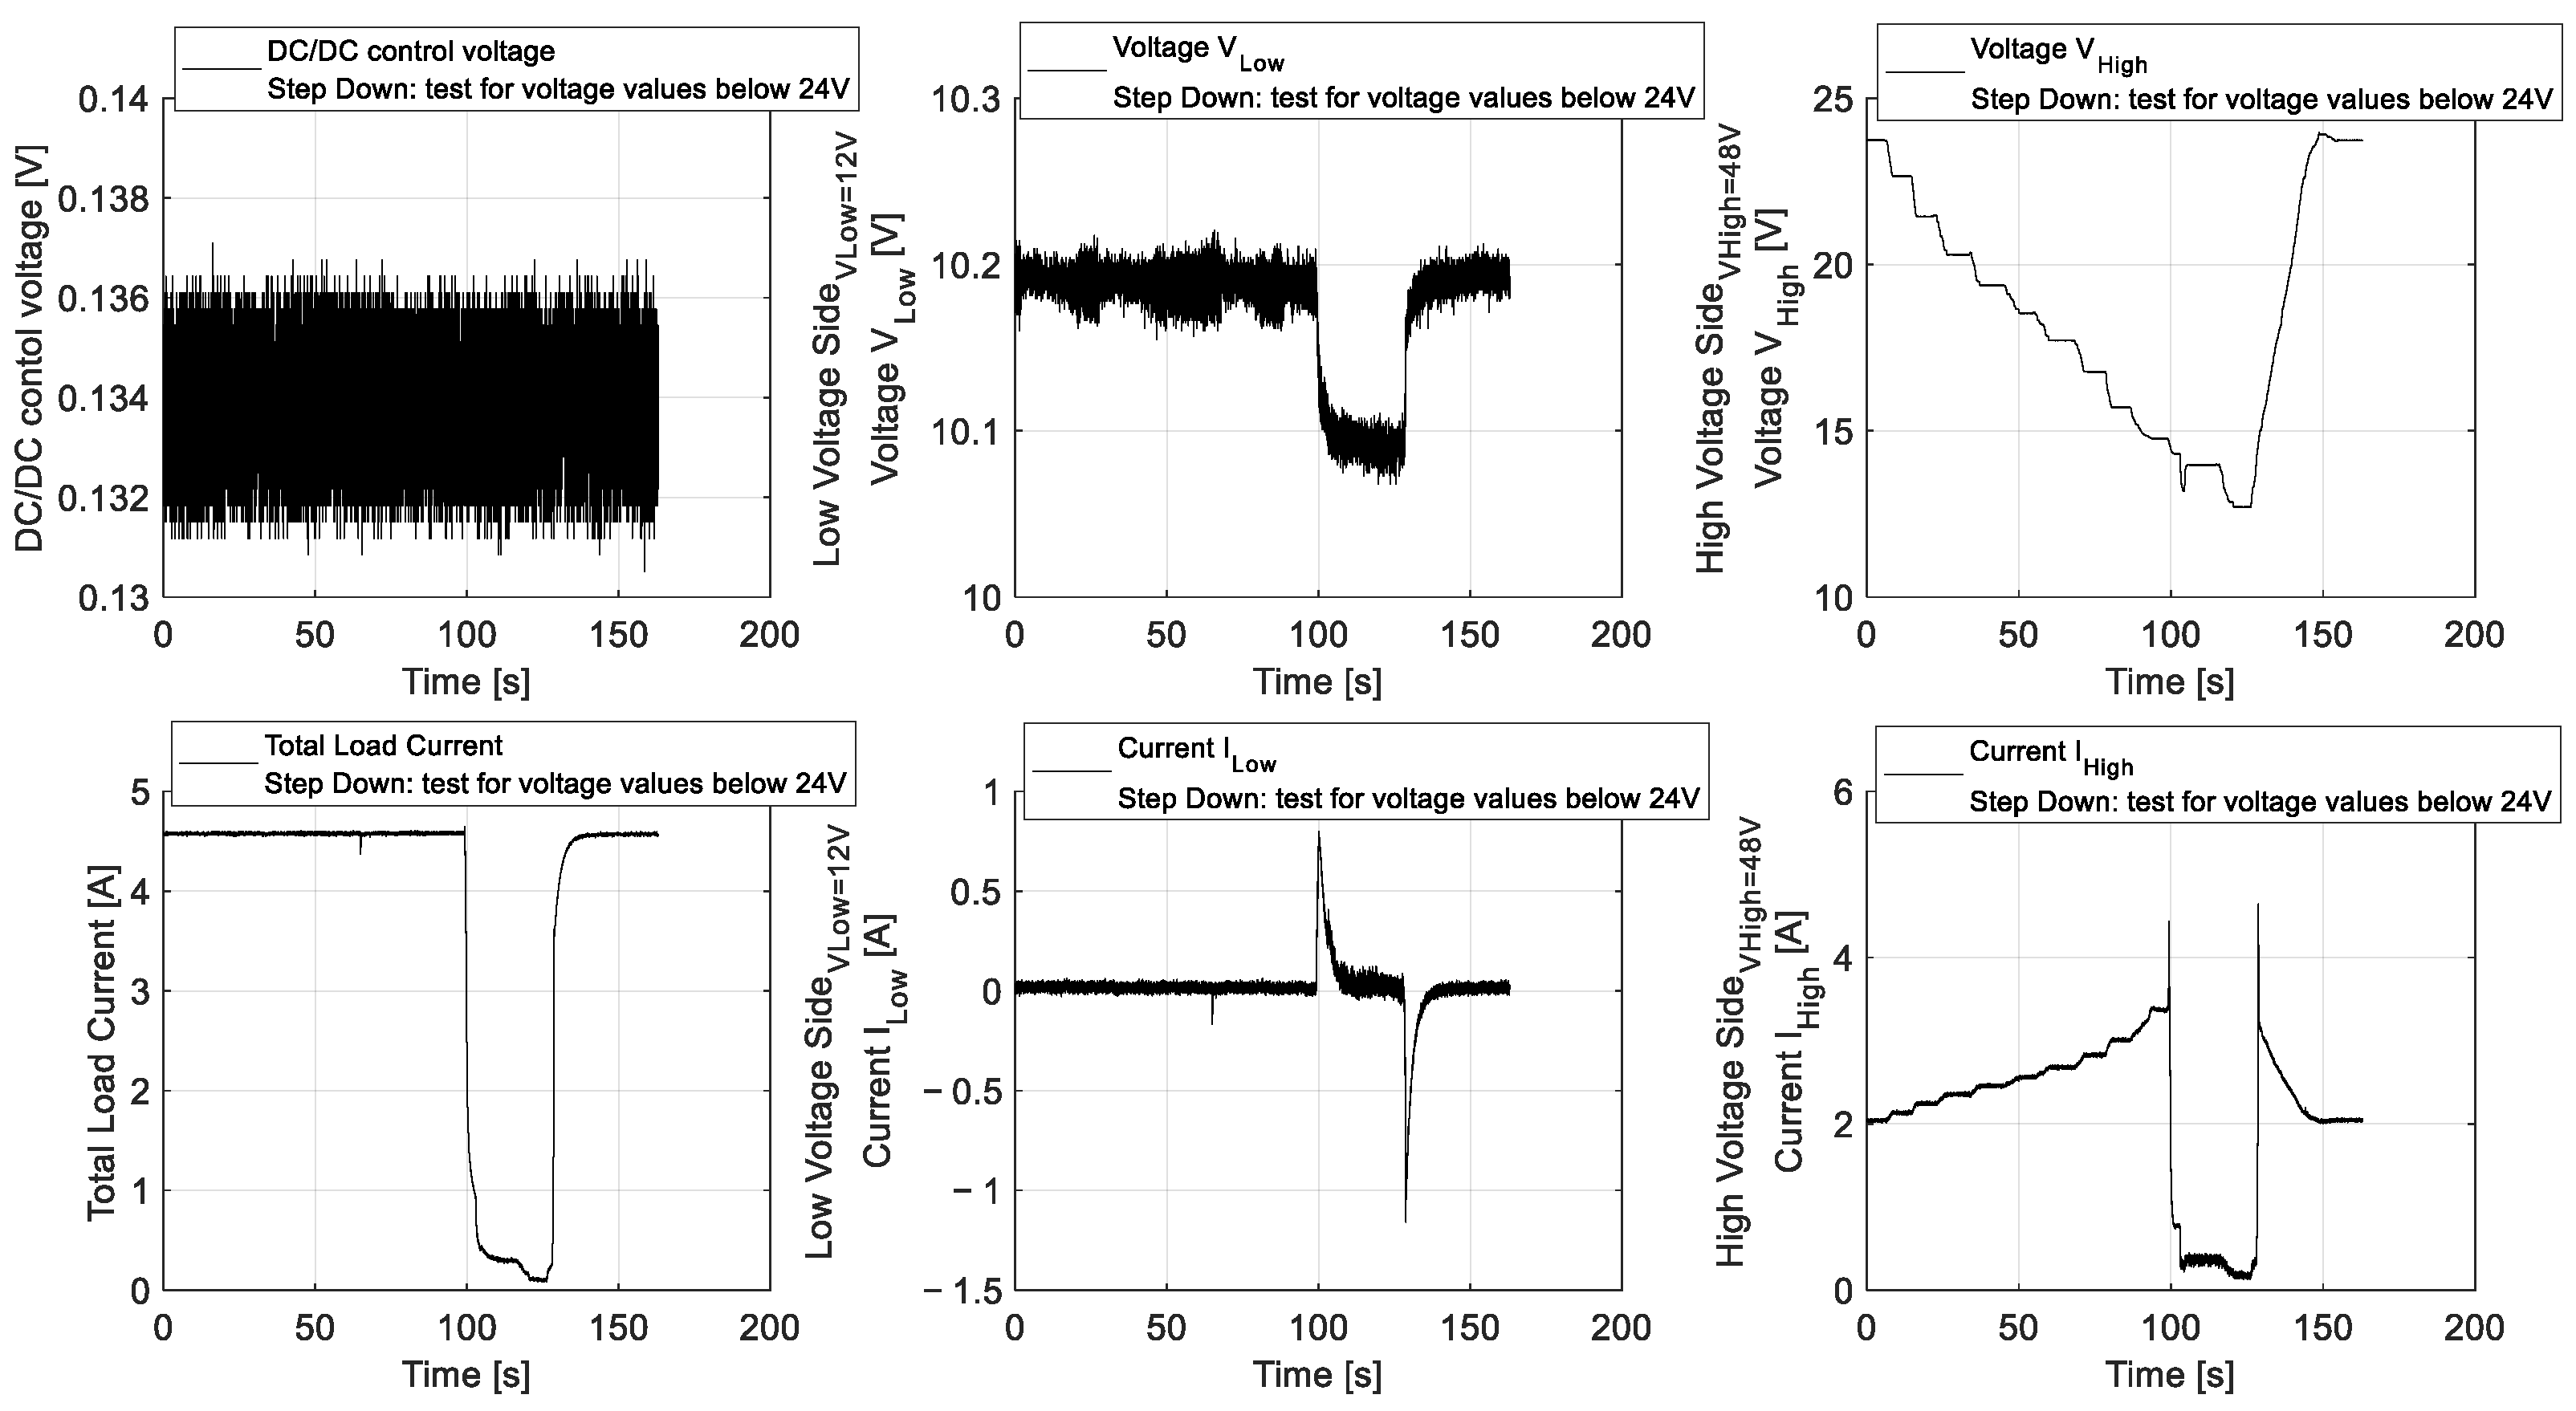
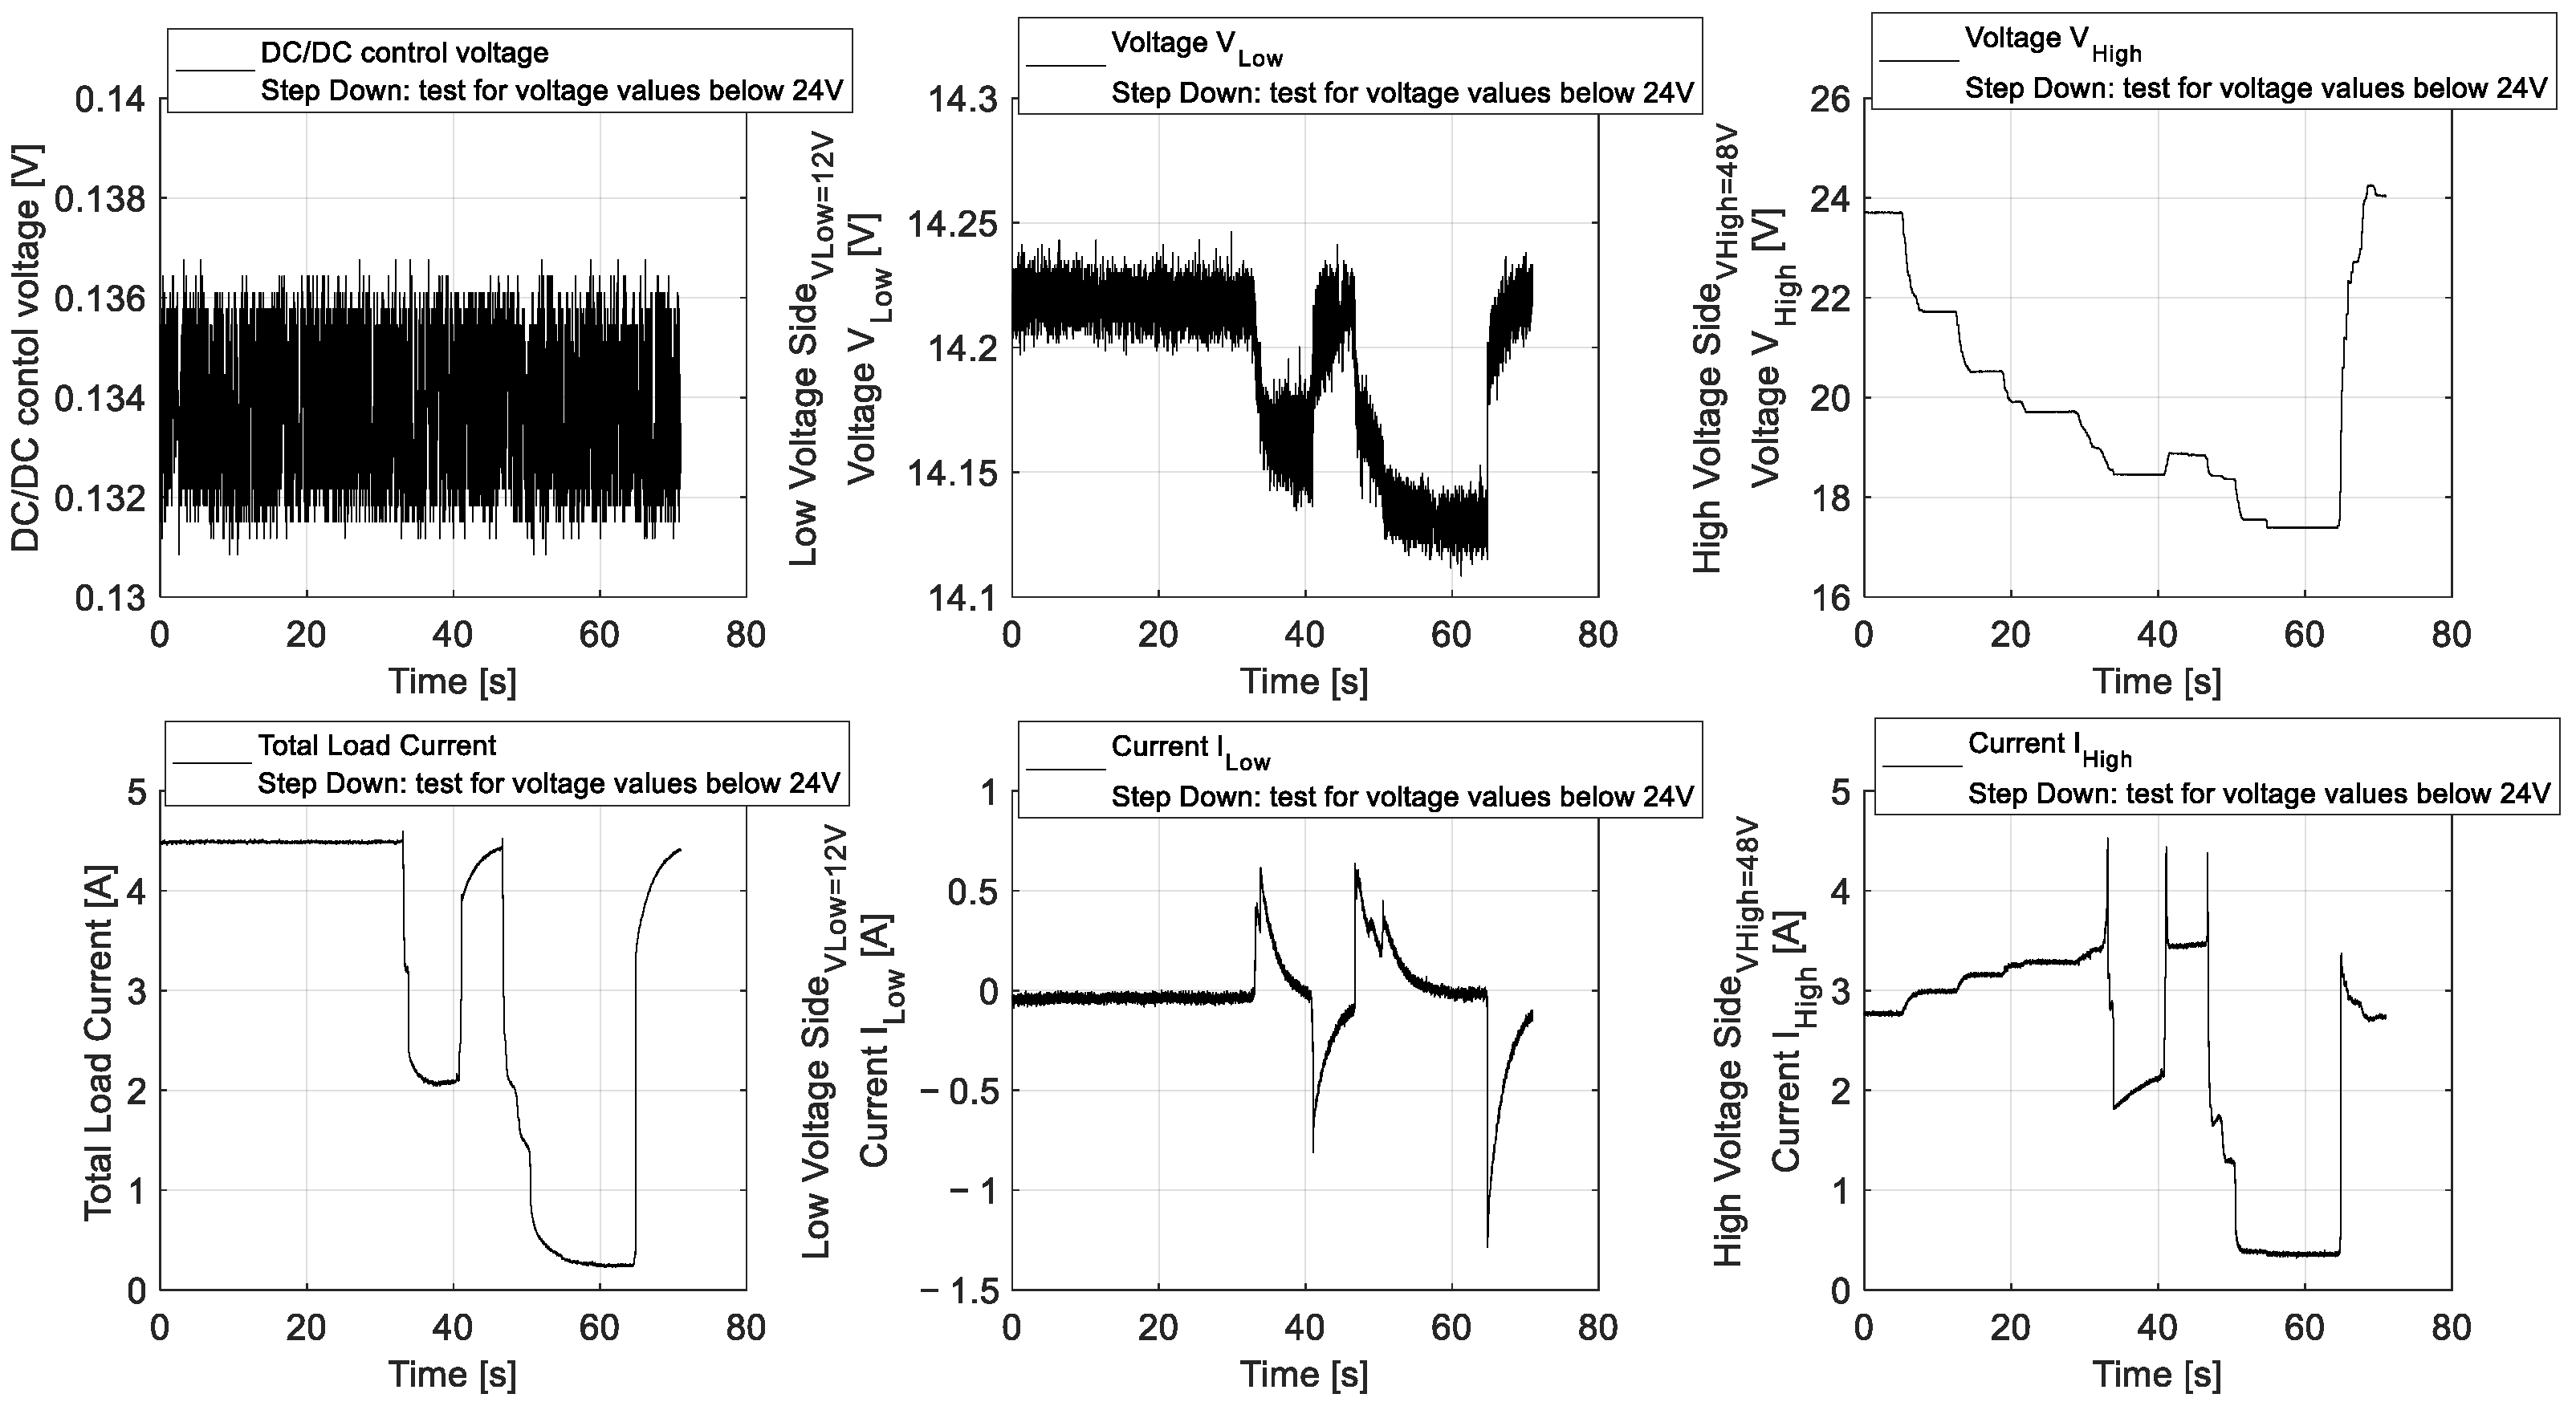
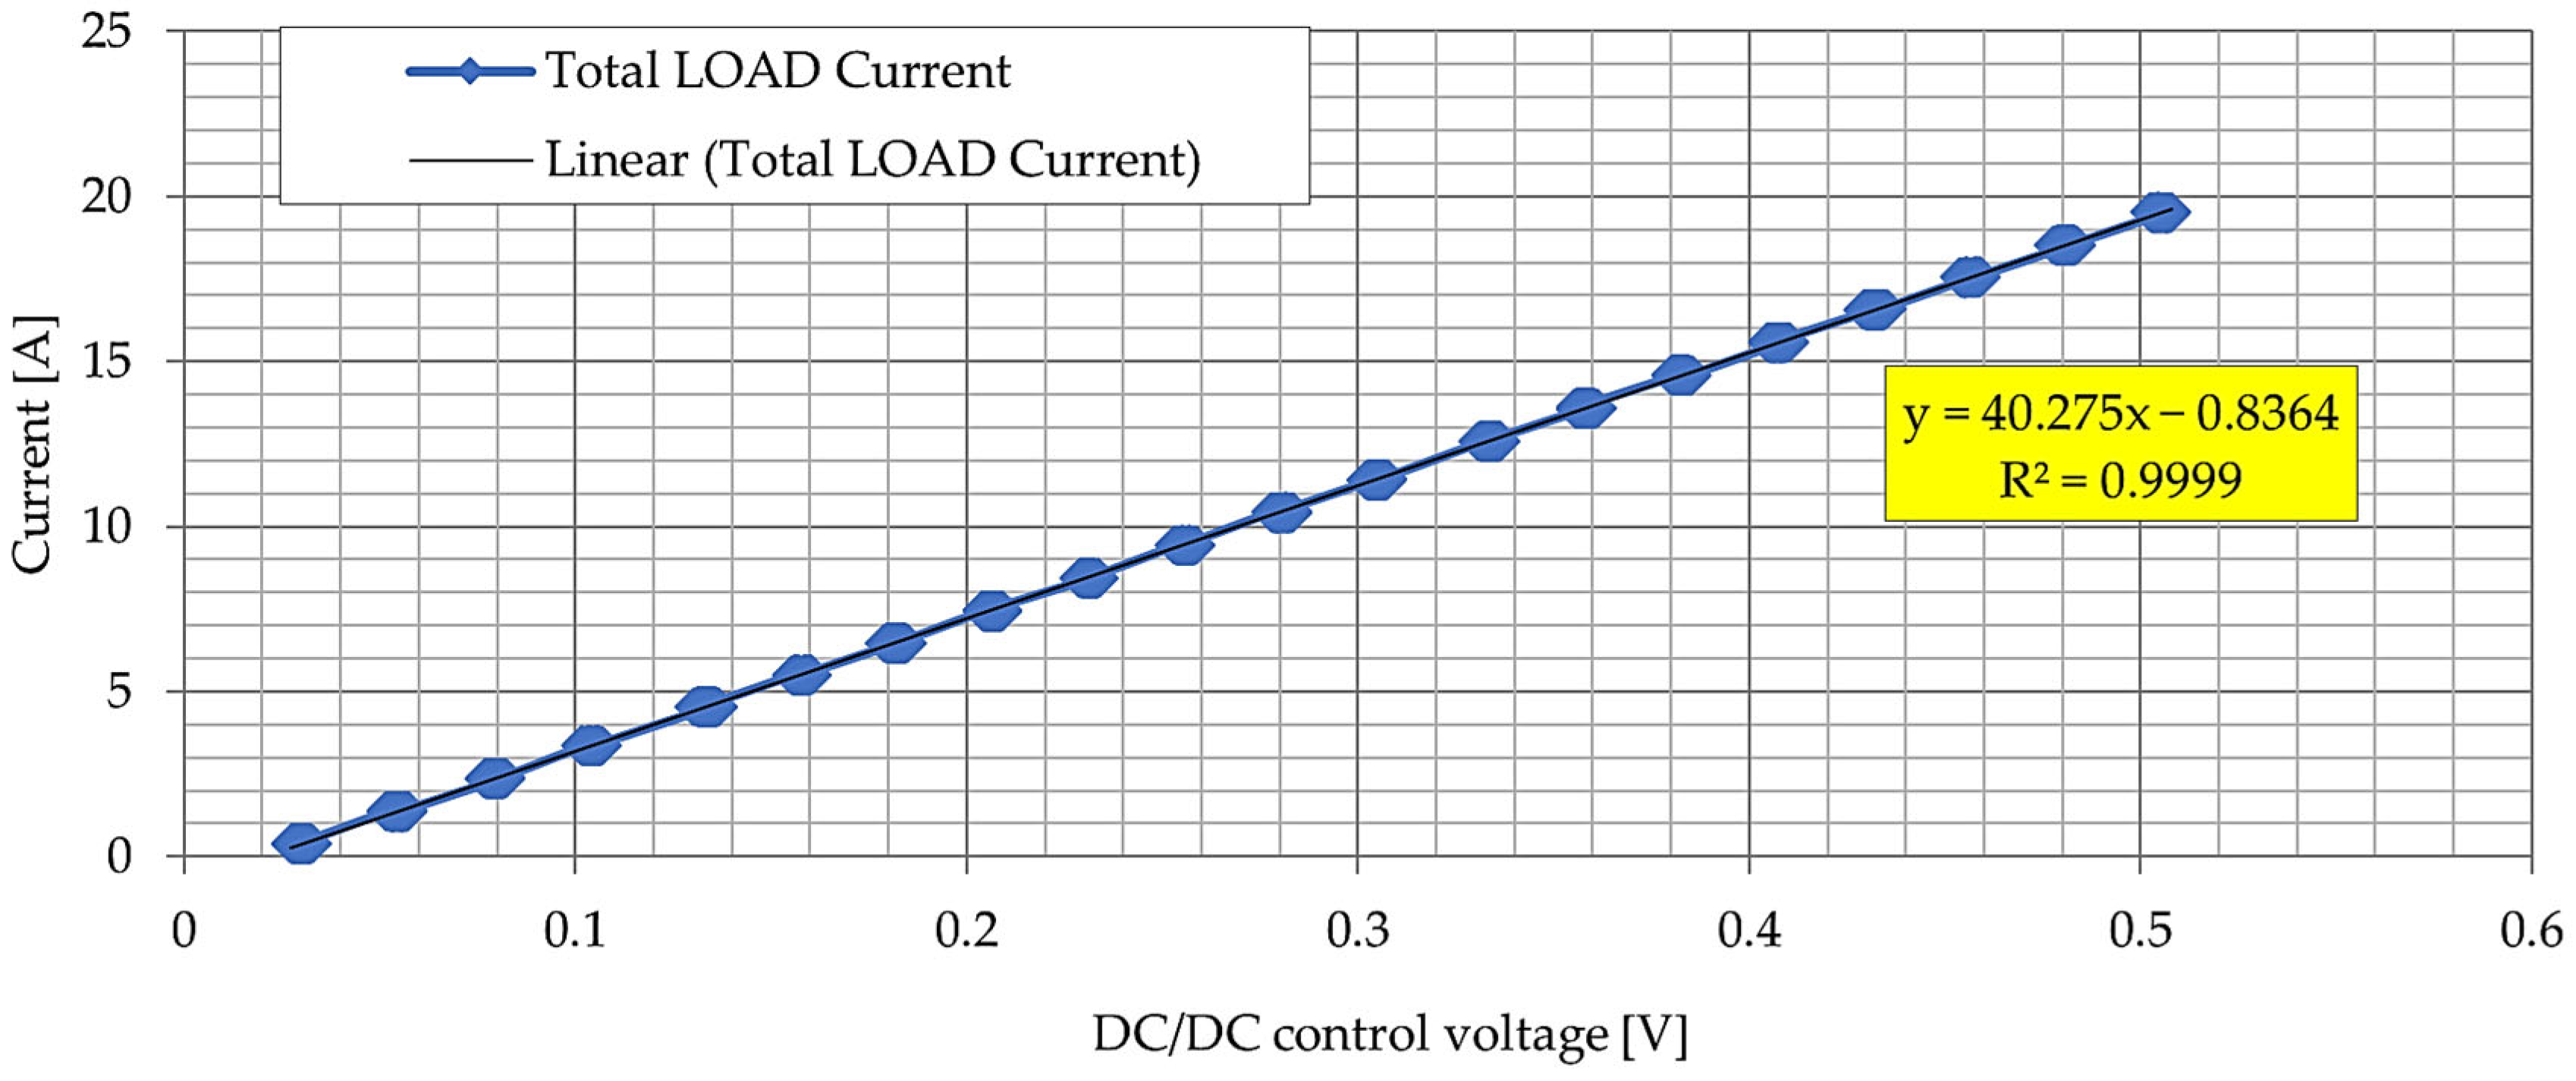
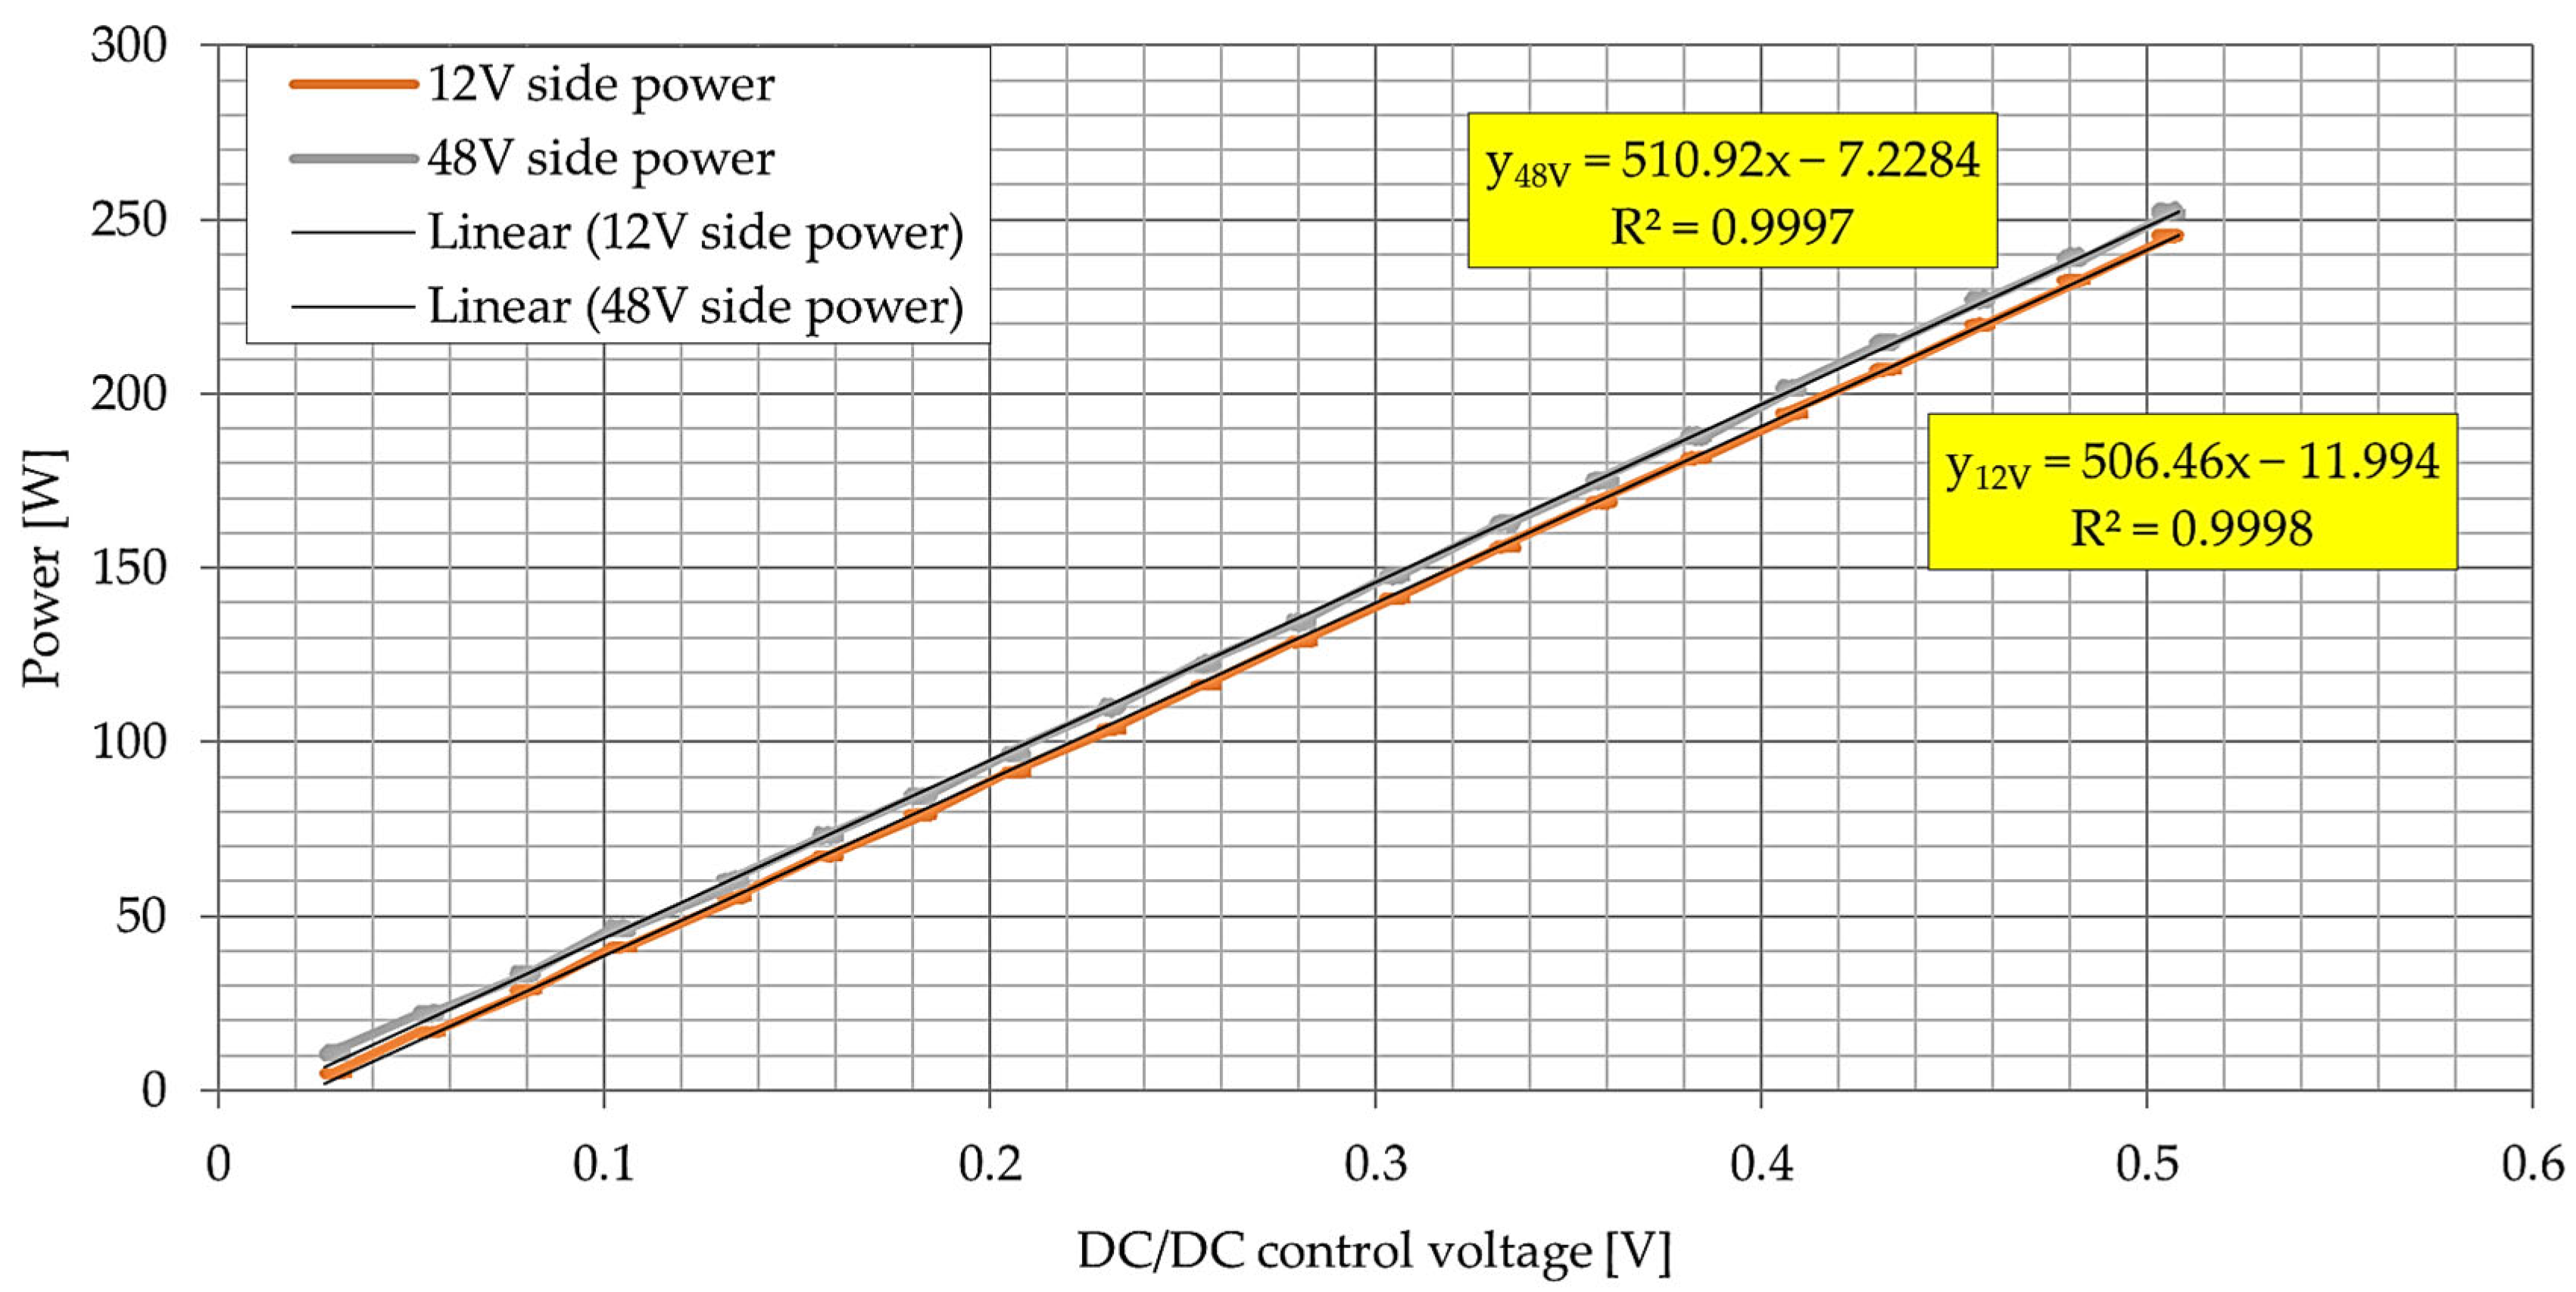
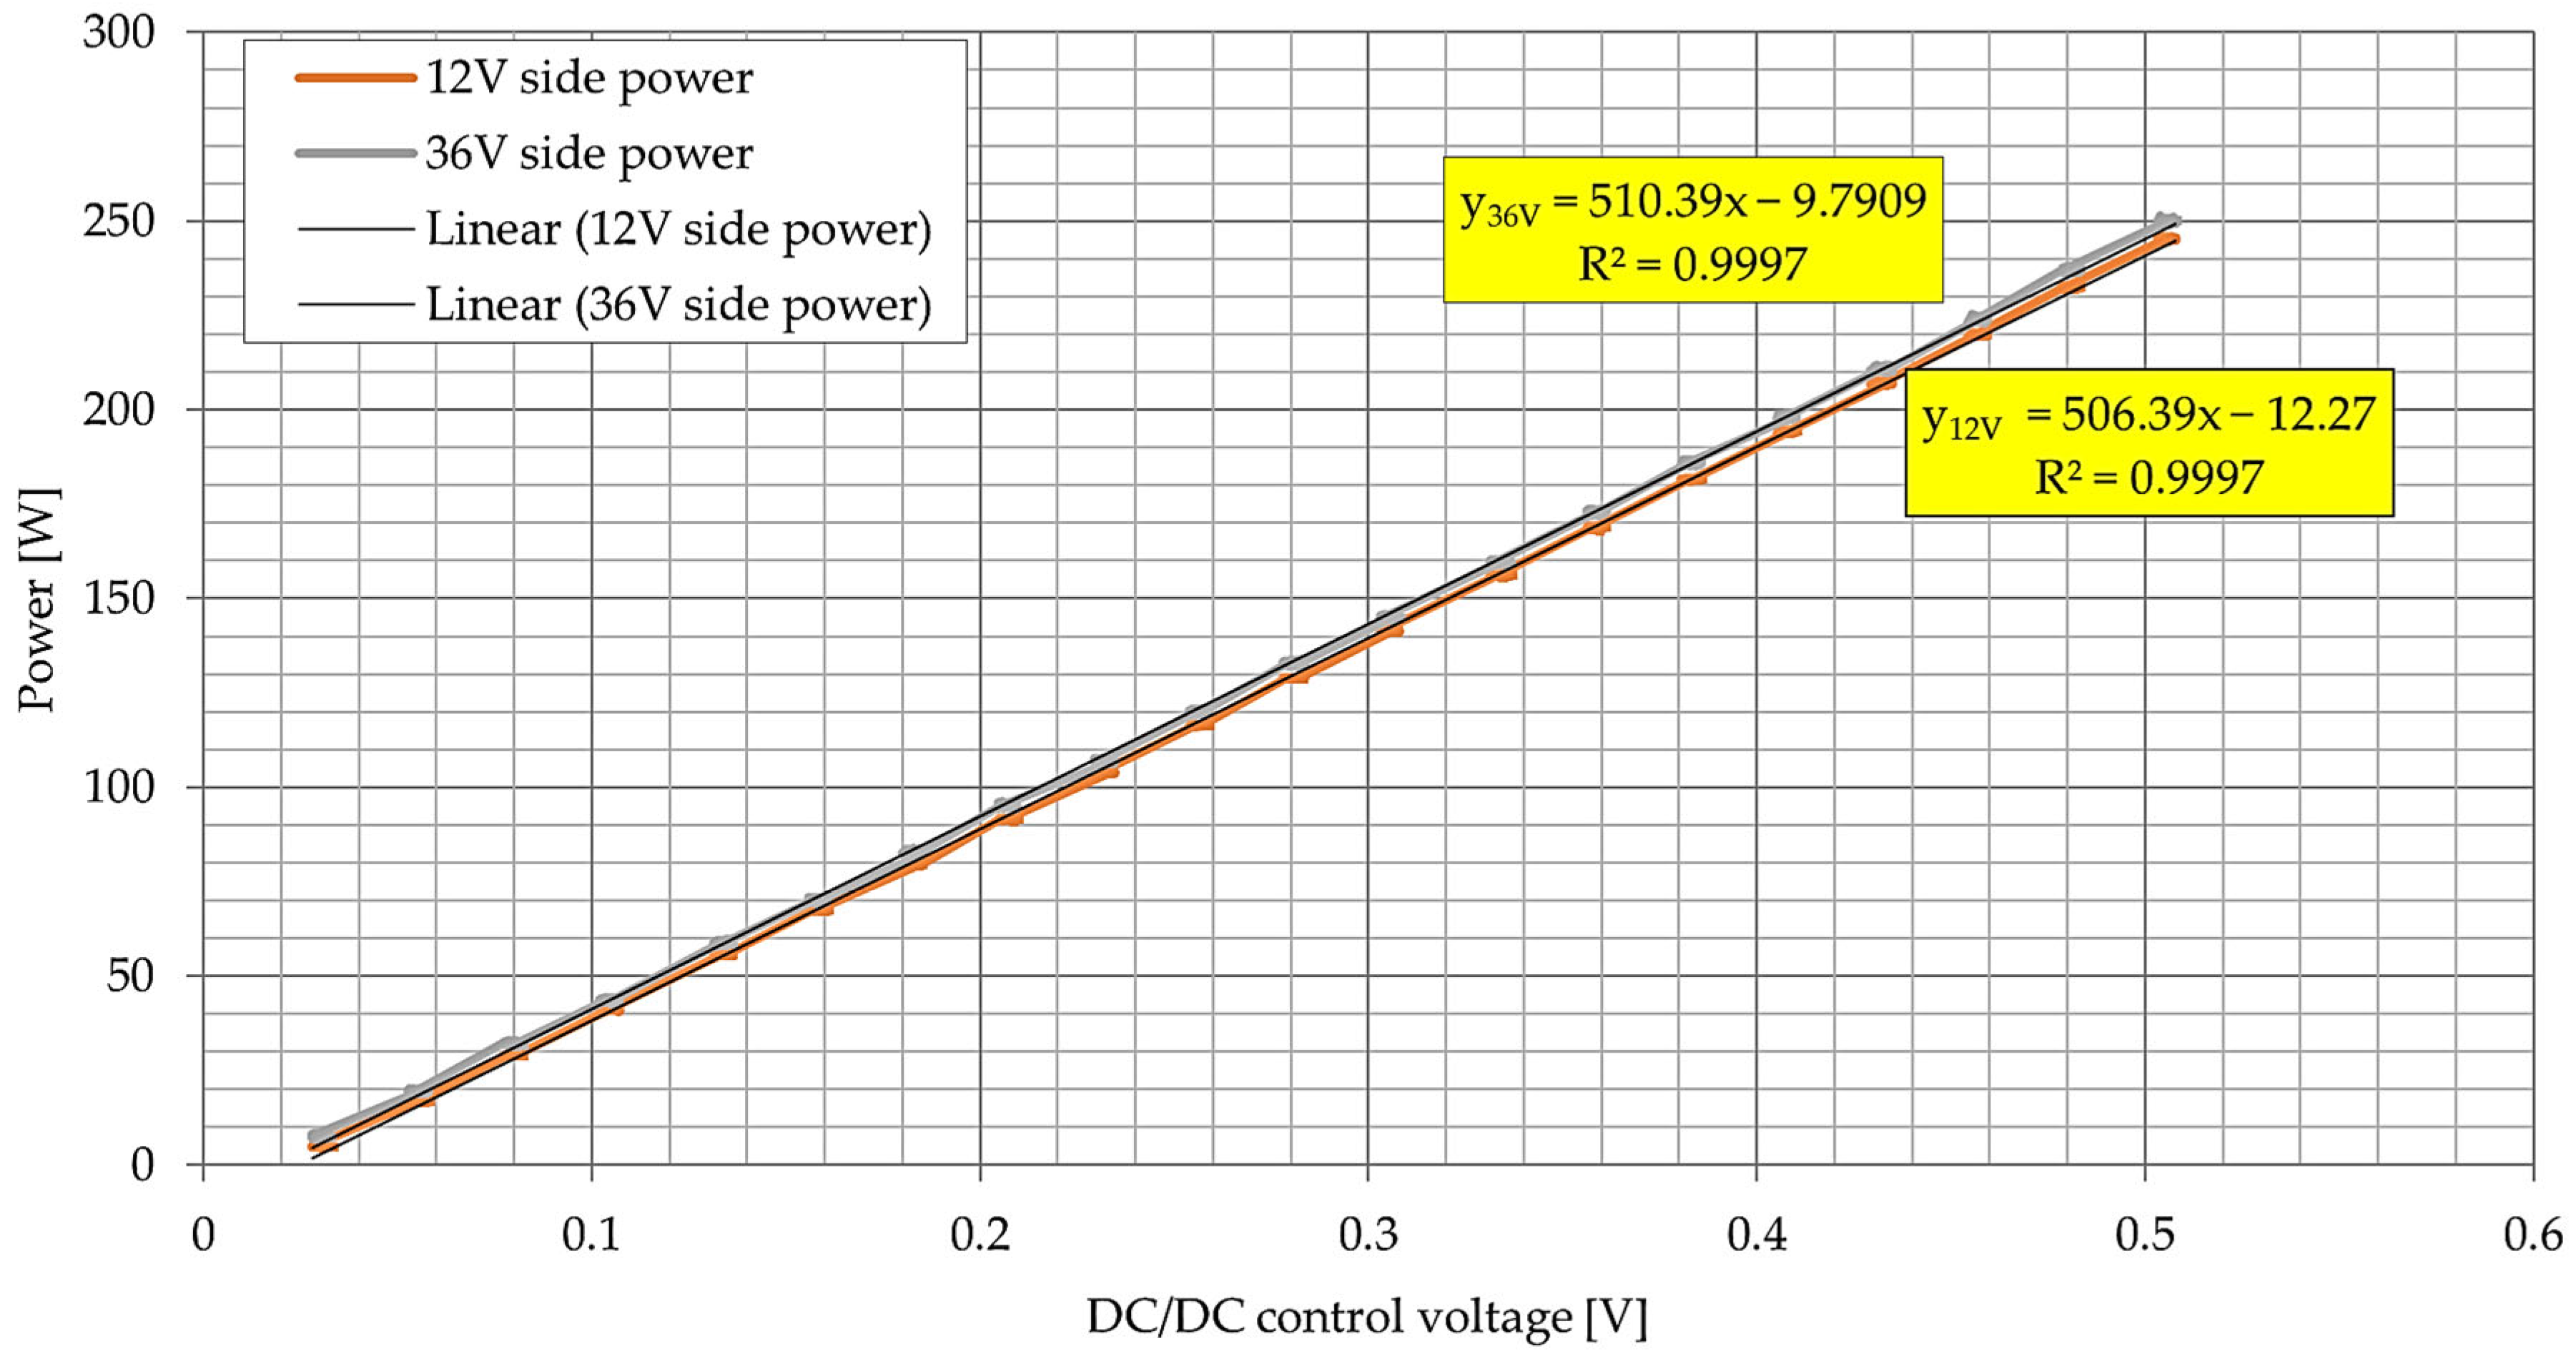
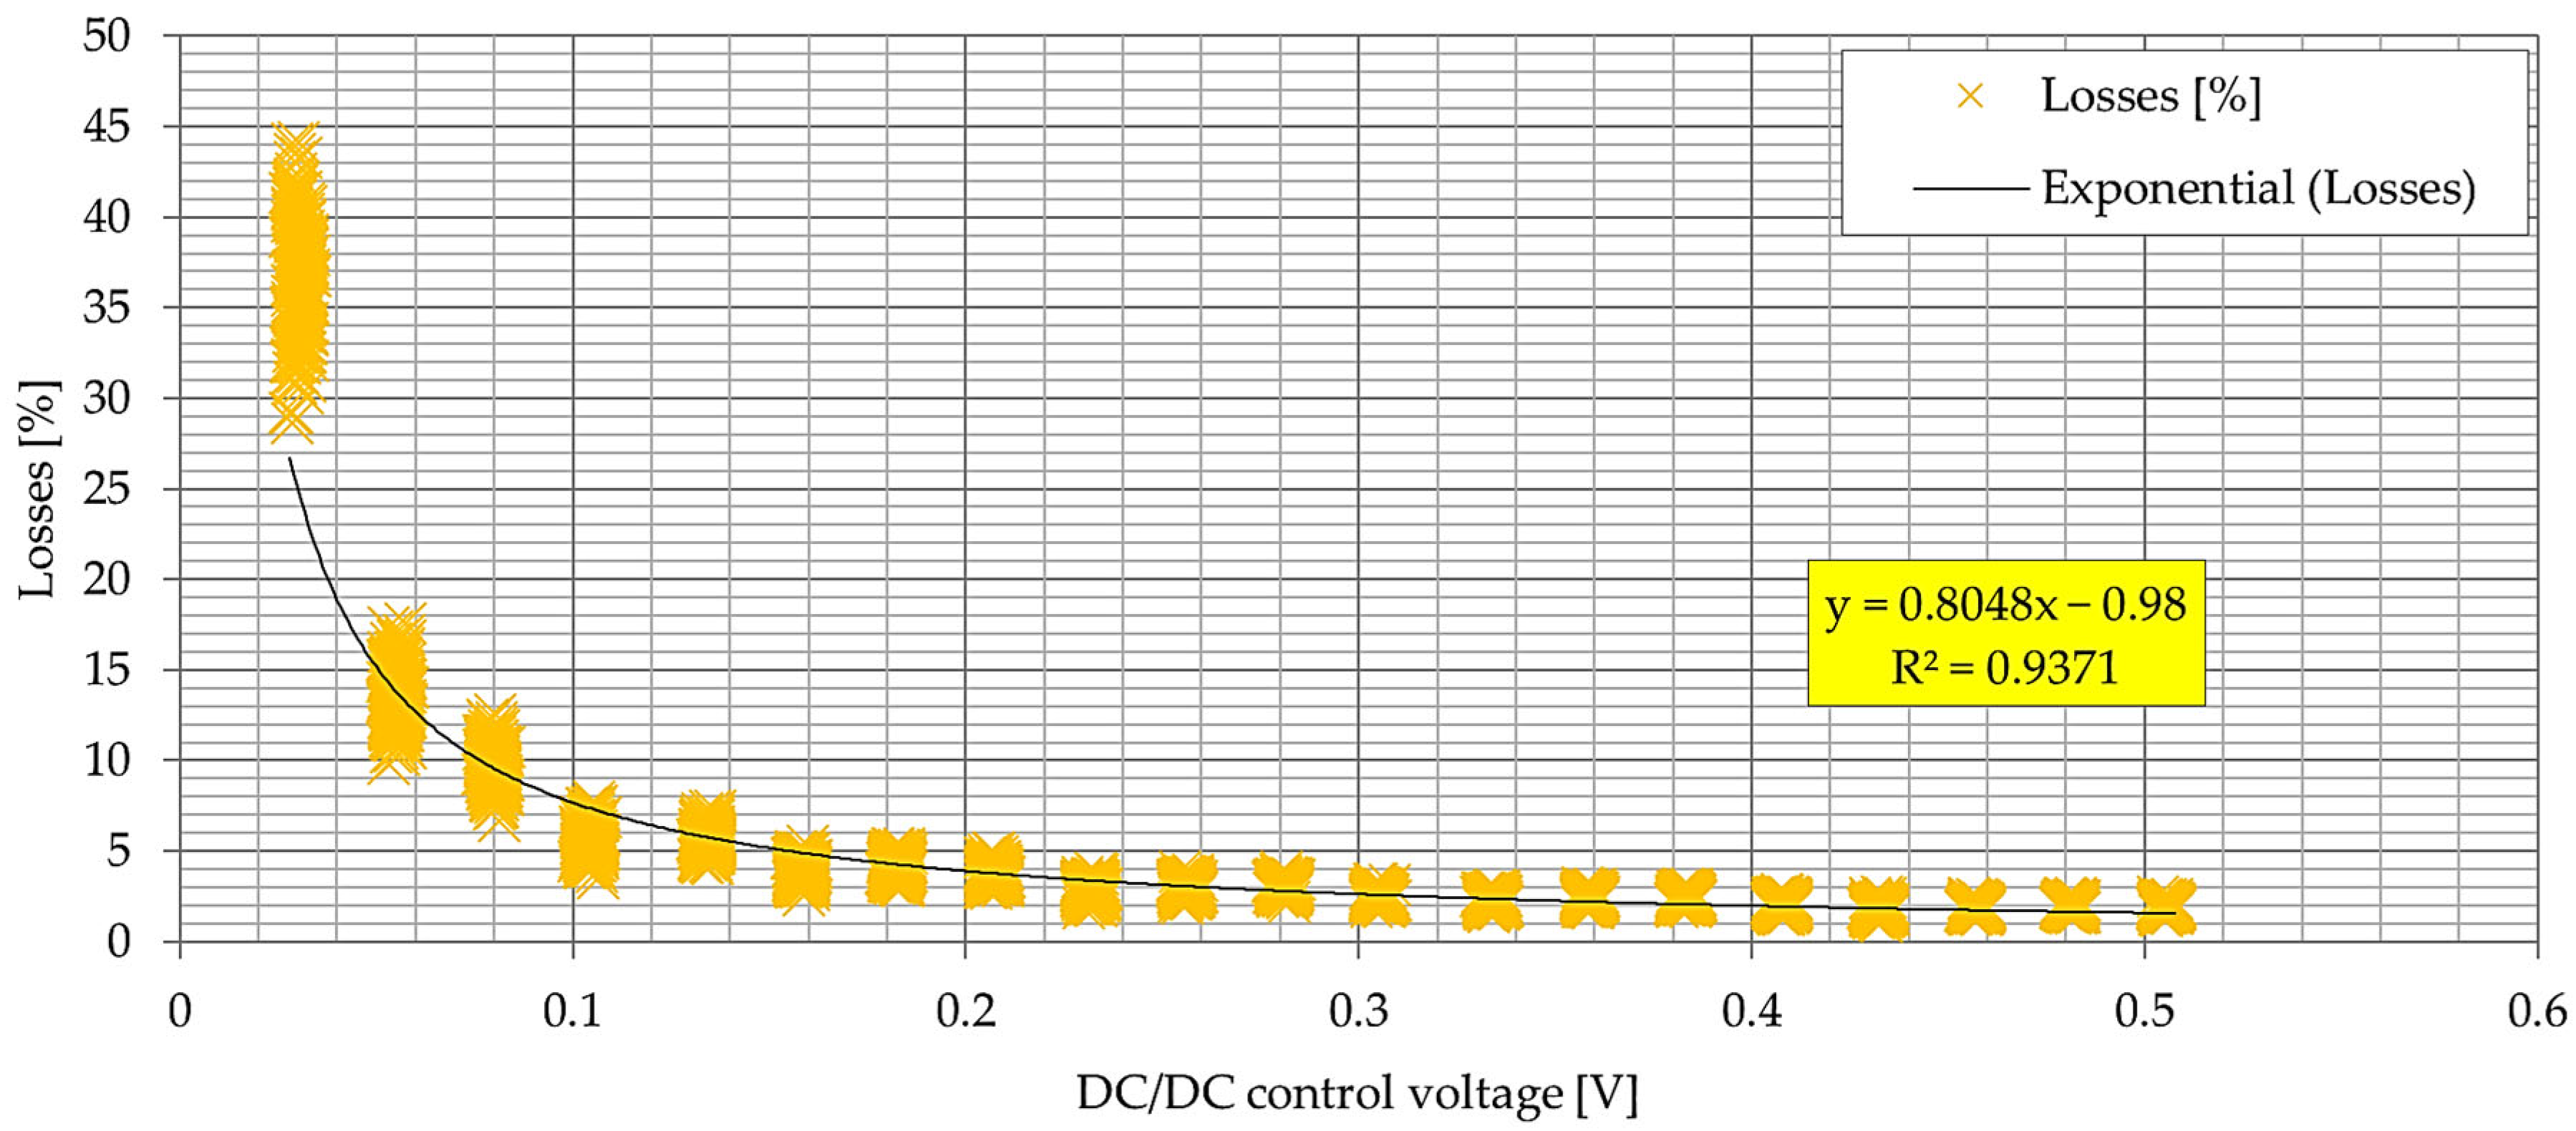
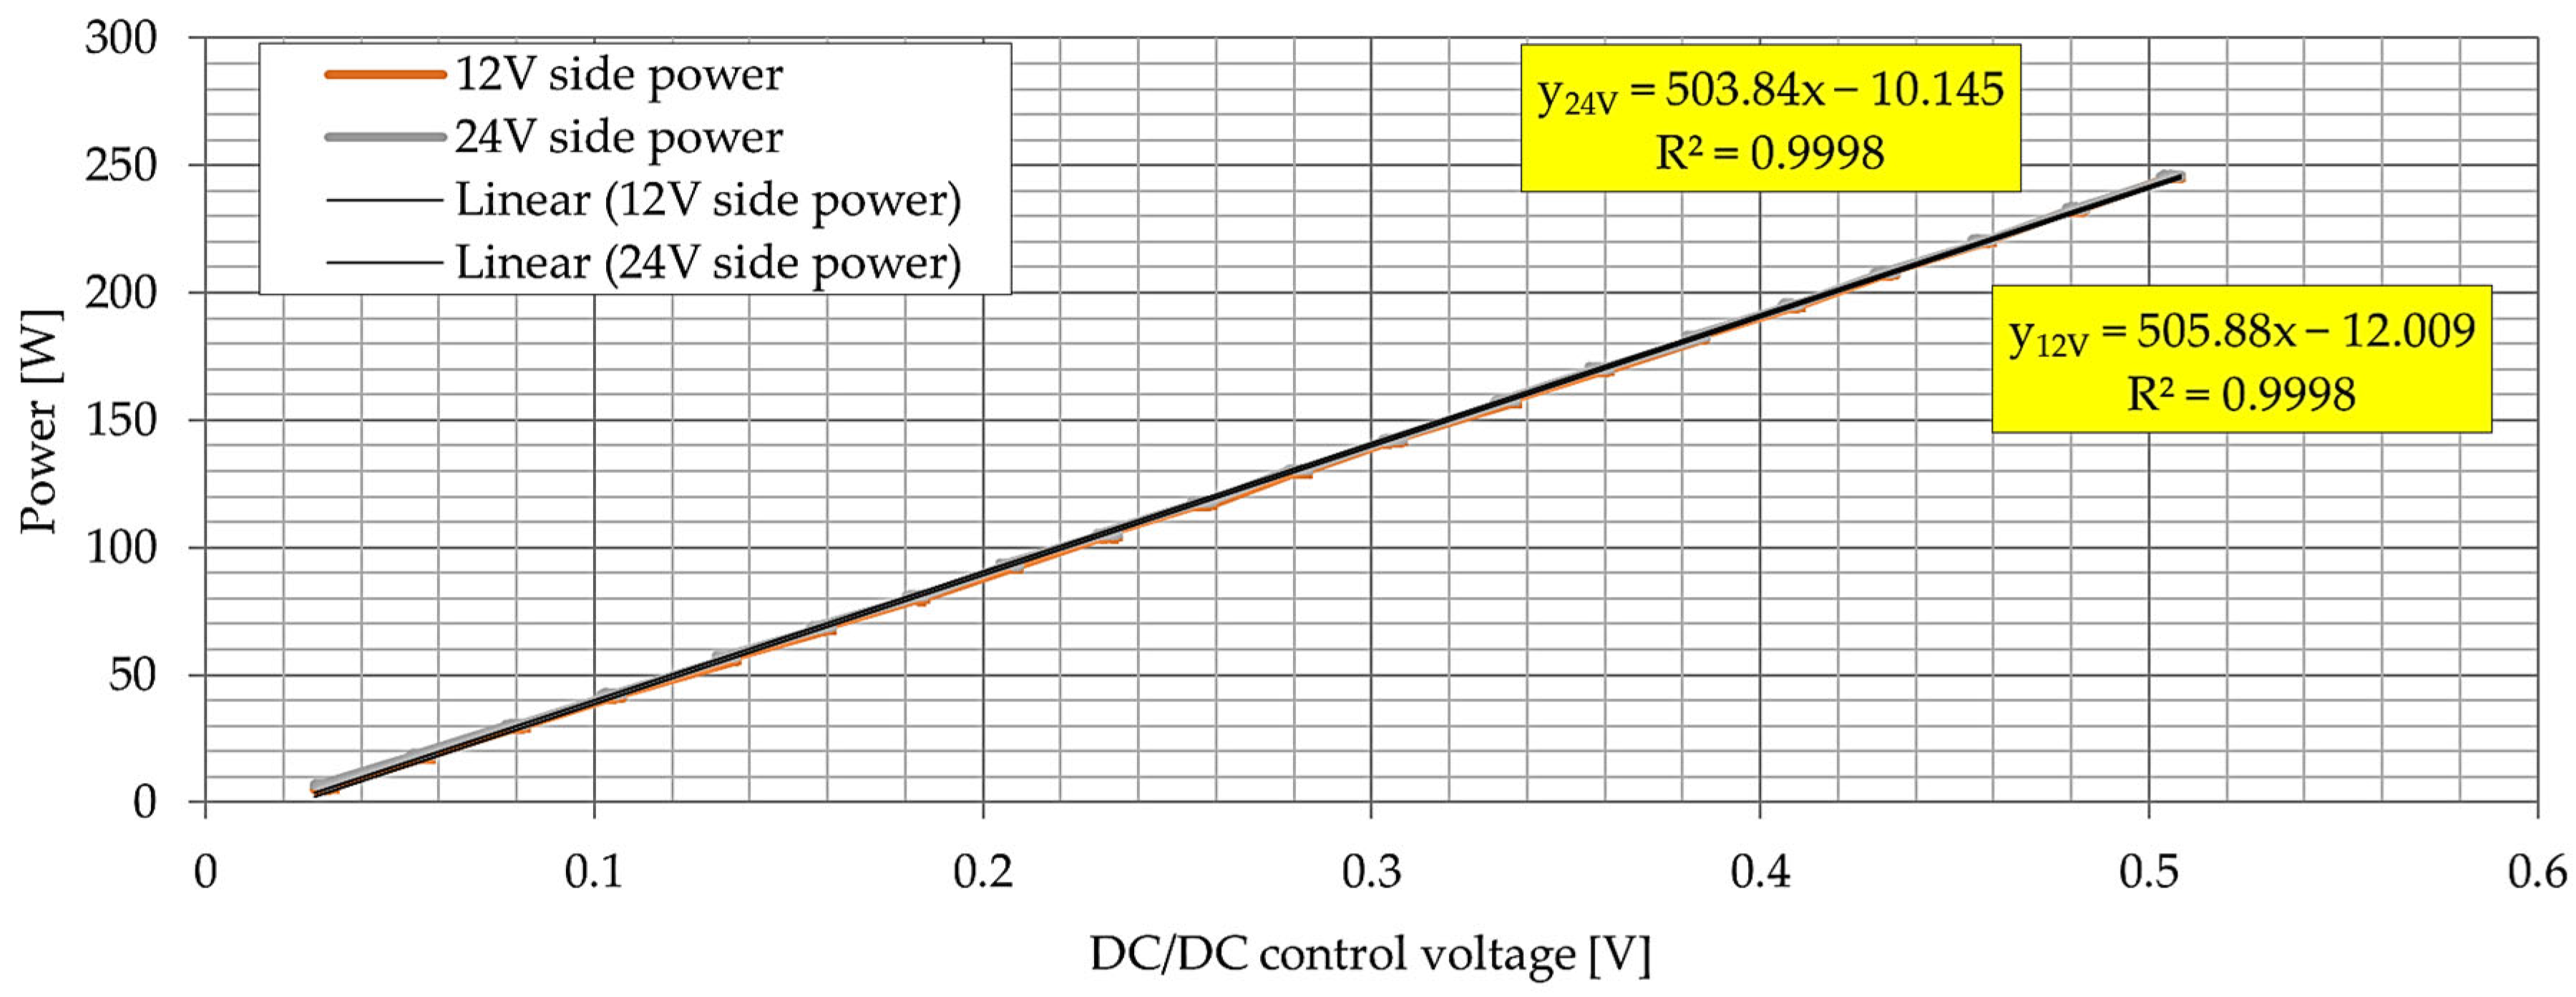
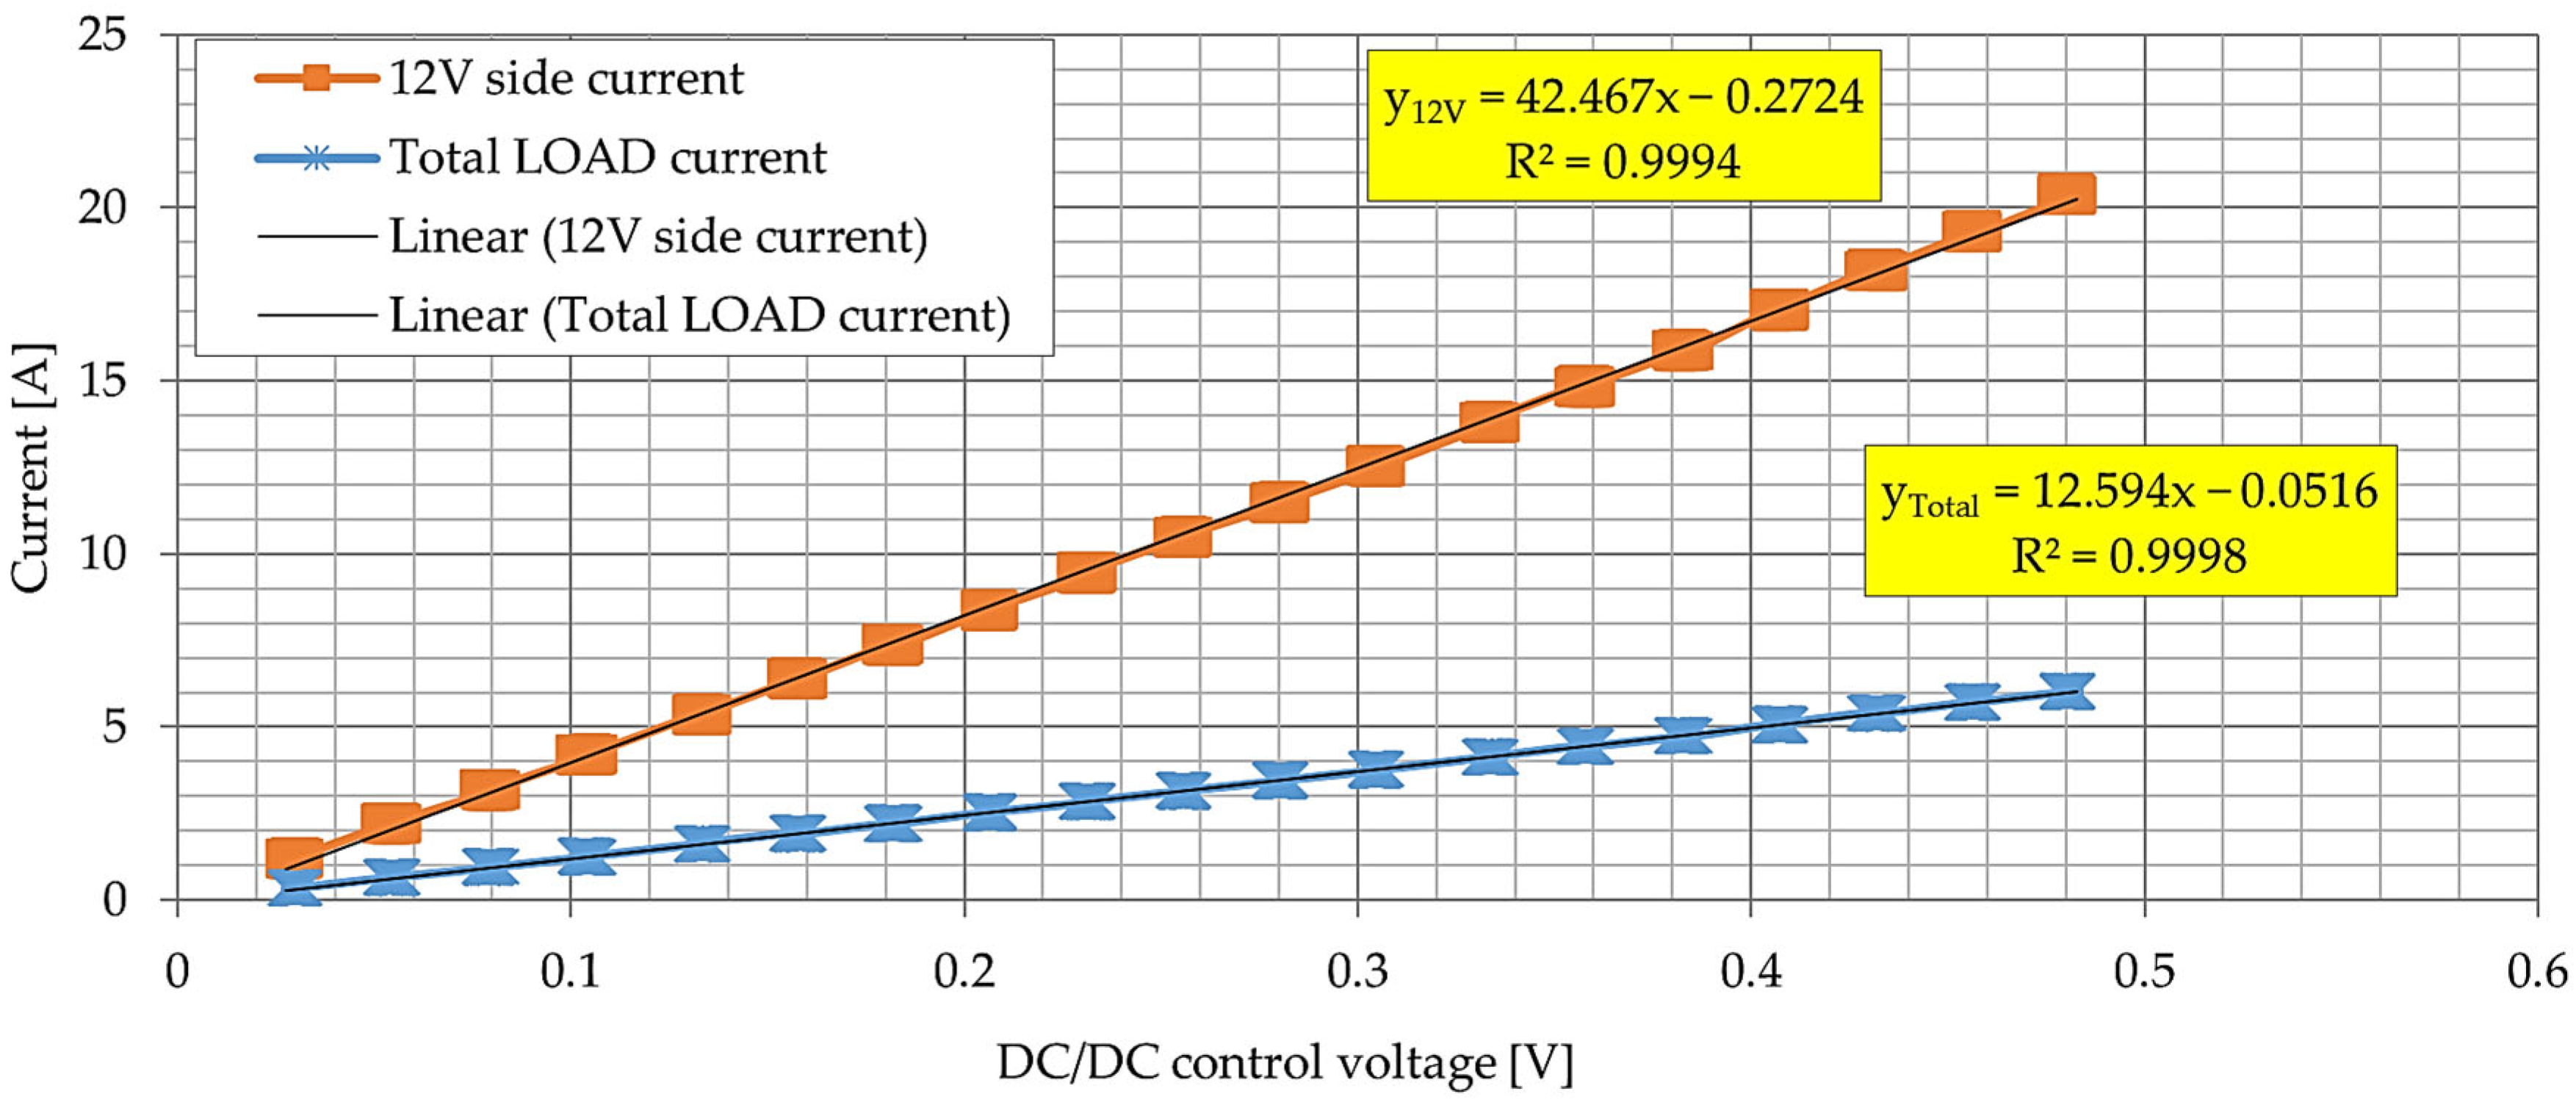
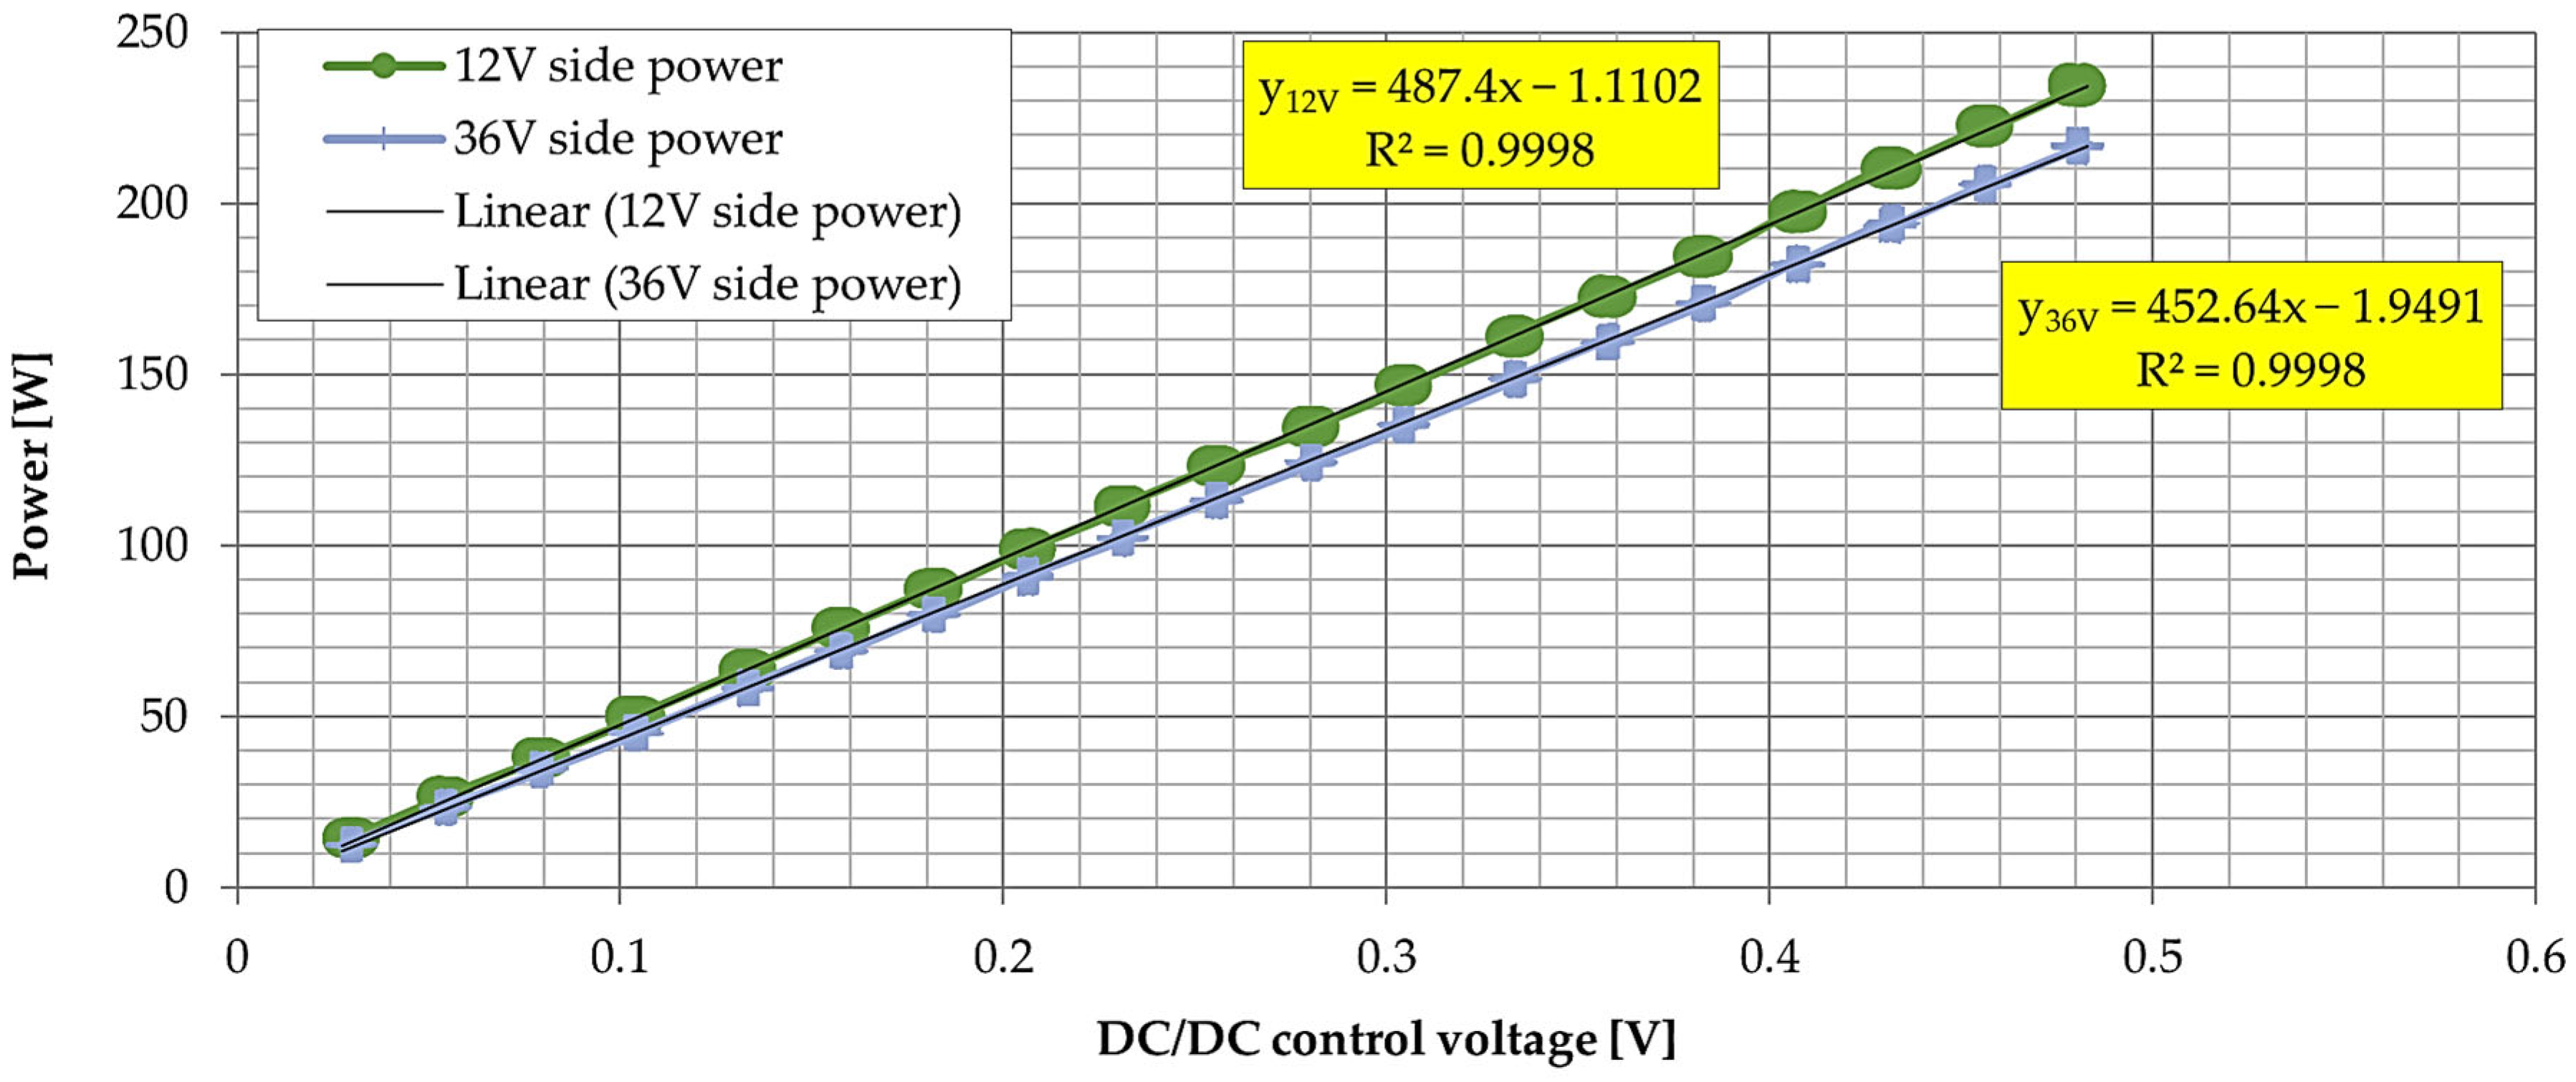
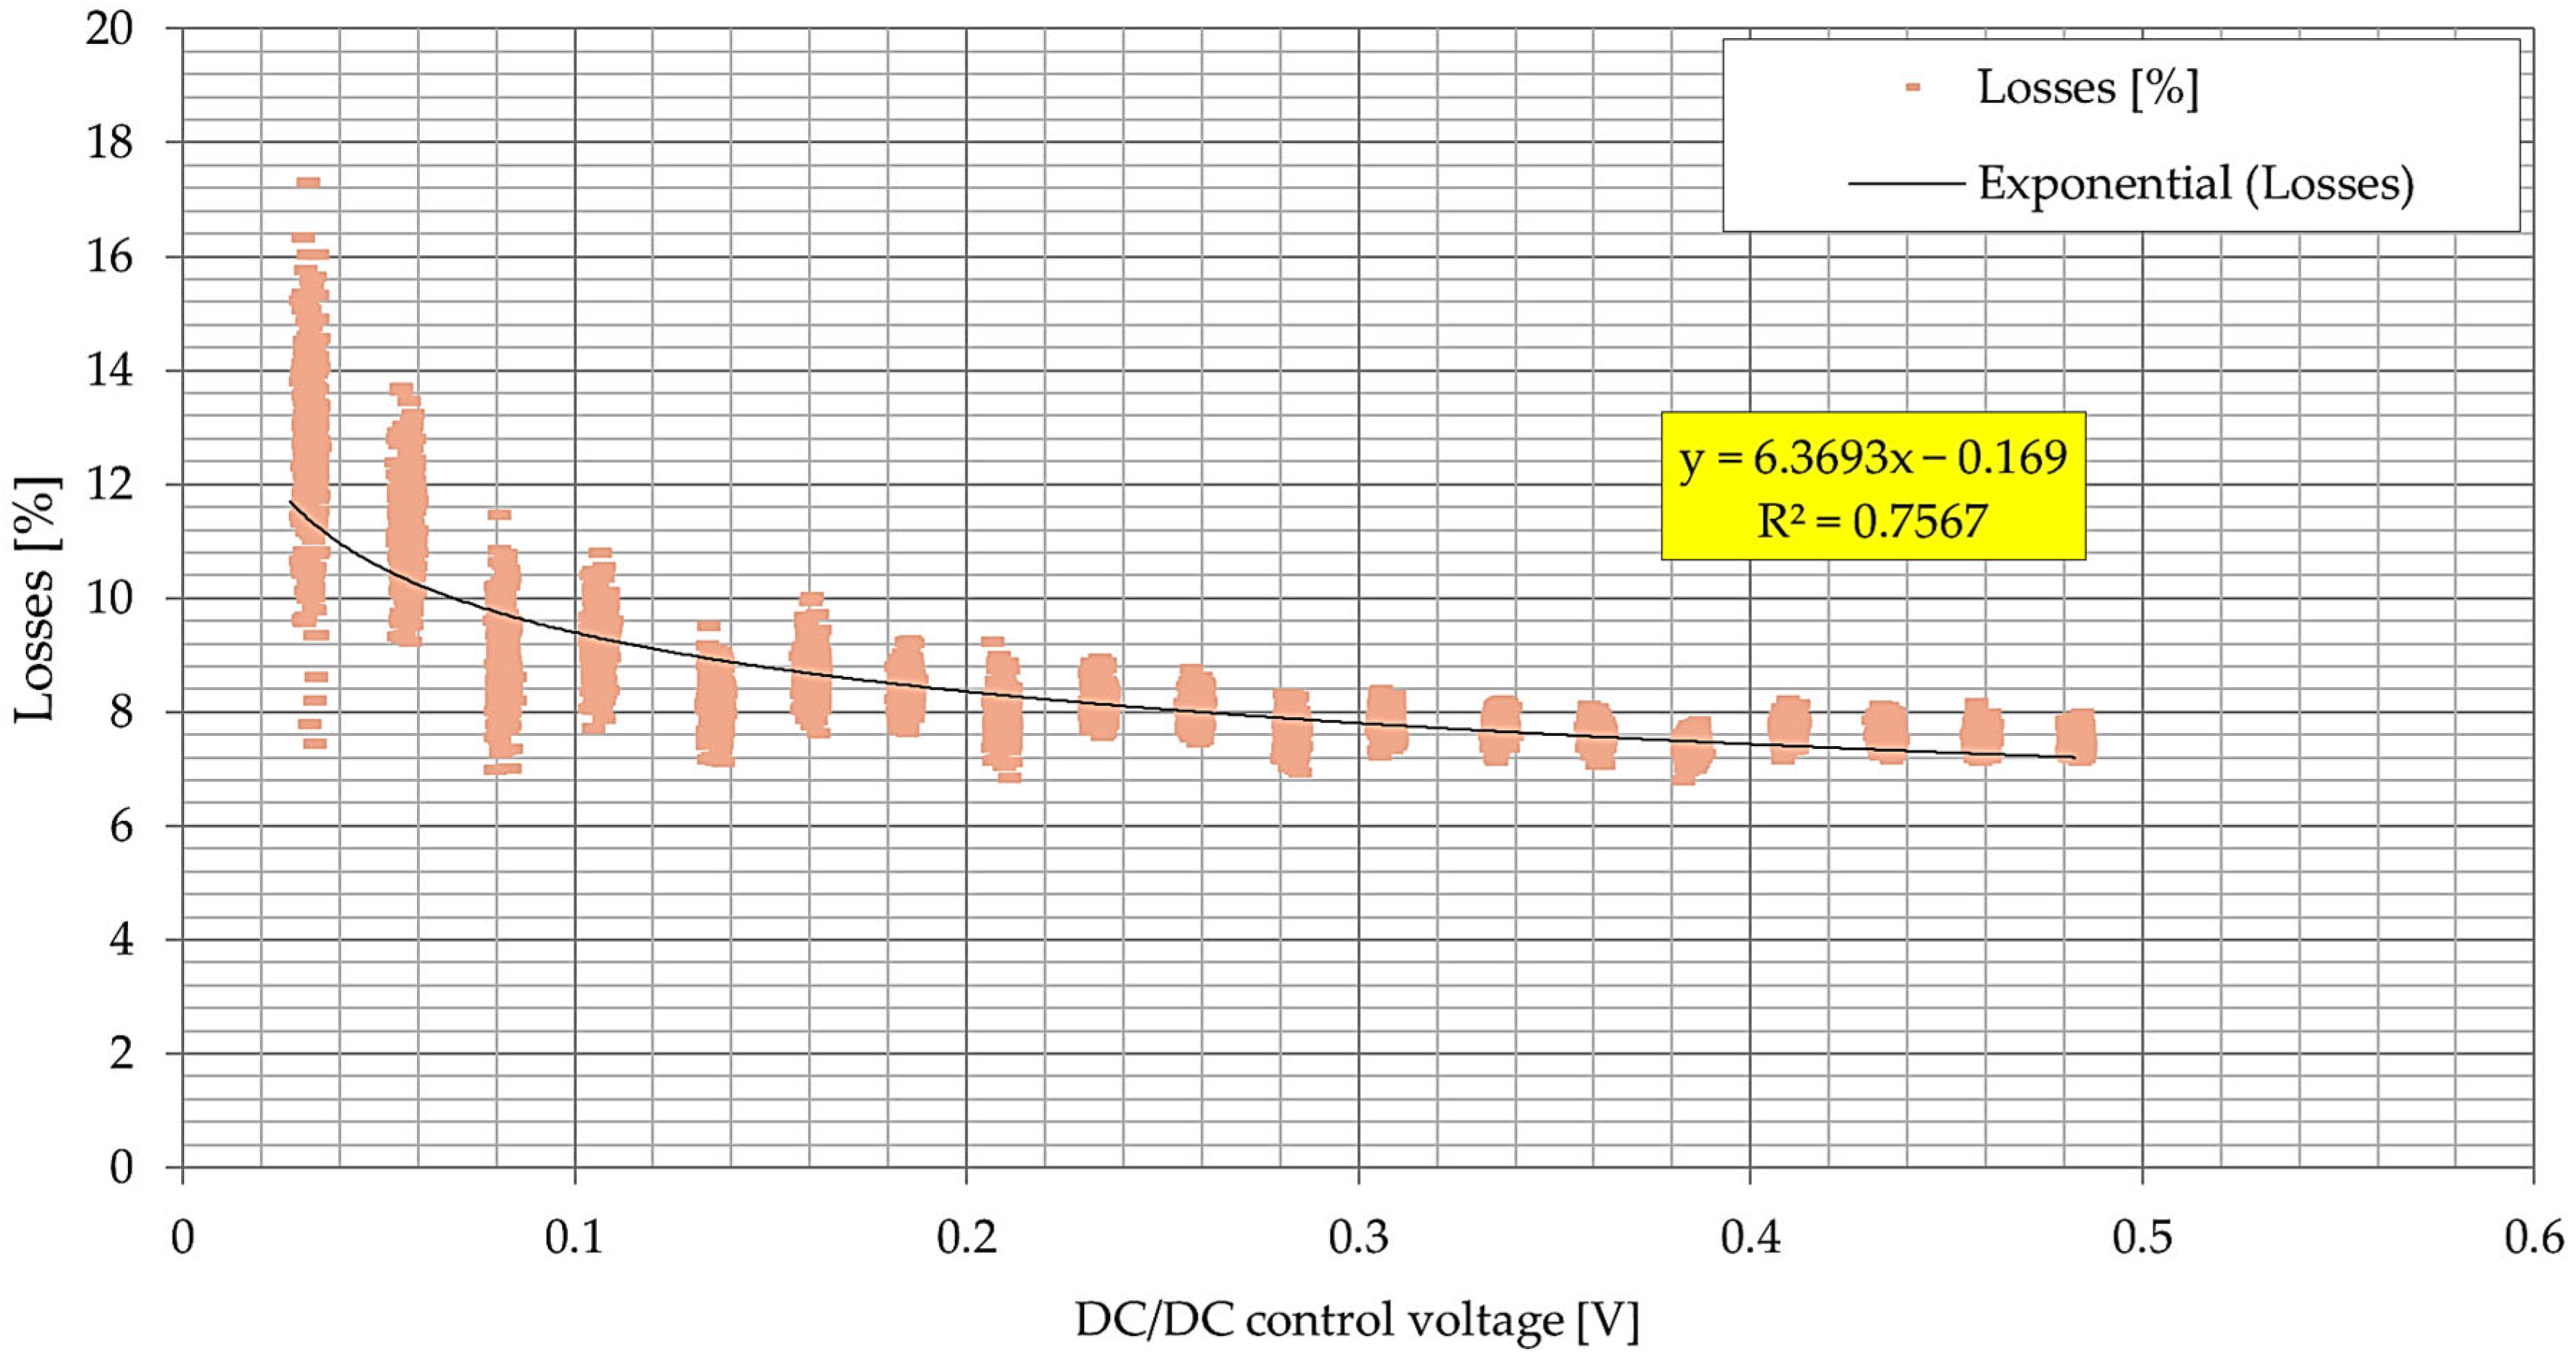
2.2.1. Step Down Measurements (Buck Mode)

This subsection describes the measurements of the inverter in Step Down (Buck Mode). Figure 4 shows a diagram of the DC/DC converter test stand; the measurements were carried out in the Step Down mode.
Measurements for the operation of the DC/DC converter in Step Down/Buck Mode were performed using a programmable load (LOAD) set in constant voltage (CV) mode holding 12 V on the low-voltage side of the DC/DC converter.
During the preliminary tests, the start-up of the system from the state of a fully discharged ultracapacitor was taken into account for the development of appropriate procedures for starting the converter and estimating the power consumption of the converter in the idle state. Figure 5 shows the ultracapacitor voltage of the 12 V side. The voltage equals 0 V. To determine the measurement offset at the beginning of the calibration procedure, a preliminary measurement without load called “zero measurement” was made. Determining the offset in this step is particularly important for the current values that change the sign.
In the next step, the system was started, which is shown in Figure 6. The power supply to the system was started. The 48 V side of the converter was switched on, i.e., the myRIO controller power supply and the DC/DC converter microprocessor system power supply (10 V power left off). The 48 V power supply indicated a current consumption of 0.02 A.
Then, the 10 V power supply of the converter logic was turned on (Figure 7). No change in power consumption was observed.
The converter starts up in Step Up (Boost Mode) by default. Therefore, the myRIO controller was launched and the operating mode of the converter was changed to Step Down at the control voltage of 0 V (Figure 8). Current consumption increased to about 0.06 A–0.12 A at 48 V. The voltage on the 12 V side also increased, from 0 V to 4.63 V, then decreased and stabilized at 4.53 V.
The system was then started up again. The ultracapacitor of the low-voltage side was charged to a nominal voltage of 12 V with the DC/DC converter controlled for a current flow of about 0.4 A and then 1.4 A. After charging, a stable state was obtained with a power supply of 12.09 V and a current of 1.39 A. The reading was taken from the LOAD panel (Figure 9).
In the next step, the control voltage of the converter was changed to 0 V in order to observe the behavior of the system. The voltage on the low-voltage side dropped, the current consumption recorded by the clamps on the 12 V side was about 0.01 A, while on the 48 V side it was 0.02 A. The values were read from the power supply. The measurement was completed manually at a low-voltage side and it rendered the reading of 11.65 V (Figure 10).
The parameters of the converter were measured by increasing the control voltage of the DC/DC converter from 0.025 V, in steps of 0.025 V, in order to determine the control characteristics of the DC/DC converter in the Step Down mode 48–12 V. The control voltage was increased every 30 s (each time the control voltage was changed, the steady state was reached). The measurement was completed after reaching the control voltage of 0.5 V (Figure 11).
The system was disconnected in order to read the zero shift from the current clamps. Then, the ultracapacitors of the 12 V side were discharged with a current of 1 A (Figure 12).
The initial voltage of the ultracapacitors before the measurements was 0.21 V. The ultracapacitors were charged to 12 V. During their charging, a change in the converter current value from 4 A to 2 A was observed without changing the setting, after exceeding the voltage of 4 V. The voltage on the high-voltage side was changed from 48 V to 36 V. The measurement was made from the control voltage of 0.025 V with a step of 0.025 V to the control voltage of 0.5 V, as shown in Figure 13. The step time was 30 s.
Subsequently, the high-side voltage was changed from 36 V to 24 V. The measurement was carried out from the control voltage of 0.025 V with a step of 0.025 V to the control voltage of 0.5 V (Figure 14). Step time 30 s.
The operation of the DC/DC converter in the Step Down mode for the high-side voltage for voltage values lower than 24 V was also checked. The behavior of the converter in the Step Down mode for voltages below 24 V on the high-voltage side was checked. The voltage was regulated manually on the power supply in steps of about 1 V. The setting was approx. 4.5 A. The inverter stopped working at 16 V. Returning to 24 V voltage restored the operation of the converter (Figure 15).
The test was also repeated with the low side target voltage changed from 12 V to 10 V (Figure 16). The converter stopped working at a voltage of about 14 V.
We repeated the test with the low-side voltage changed from 10 V to 14 V. The operation of the converter was disturbed at a voltage of about 19 V. The converter stopped working completely at a voltage of about 18 V (Figure 17).
The next step presents the determined characteristics of the current, power, and losses for controlling the DC/DC converter in the Step Down operating mode with a voltage reduction from 48 V to 12 V. Figure 18 shows the value of the current flowing through the low-voltage side.
Figure 19 shows the input power and output power for Step Down operation from 48 V to 12 V.
Figure 20 shows the losses of the converter configured in Step Down mode from 48 V to 12 V.
The next step presents the determined characteristics of current, power, and losses for controlling the DC/DC converter in the Step Down operating mode with a voltage reduction from 36 V to 12 V. Figure 21 shows the value of the current flowing through the low-voltage side.
Figure 22 shows the characteristics of the input power and output power—Step Down operation from 36 V to 12 V.
Figure 23 shows the losses of the converter in the Step Down mode at the control from 36 V to 12 V.
The last step presents the determined characteristics of current, power, and losses for controlling the DC/DC converter in the Step Down operating mode with a voltage reduction from 24 V to 12 V. Figure 24 shows the value of the current flowing through the low-voltage side.
Figure 25 shows the input power and output power in Step Down operation from 24 V to 12 V.
Figure 26 shows the losses of the Step Down converter from 24 V to 12 V.
Knowledge of the efficiency and operating losses of the converter under various conditions (Figure 18, Figure 19, Figure 20, Figure 21, Figure 22, Figure 23, Figure 24, Figure 25 and Figure 26) is important when designing the target control algorithm. Parameter values were selected in such a way that the value of R2 was as large as possible.
Based on characteristics presented in Figure 18, Figure 21 and Figure 24, the final values used in linear equation for calculating the control voltage output in controller software in Step Down mode was
Output VStep Down = (Desired I + 0.844)/40.288,

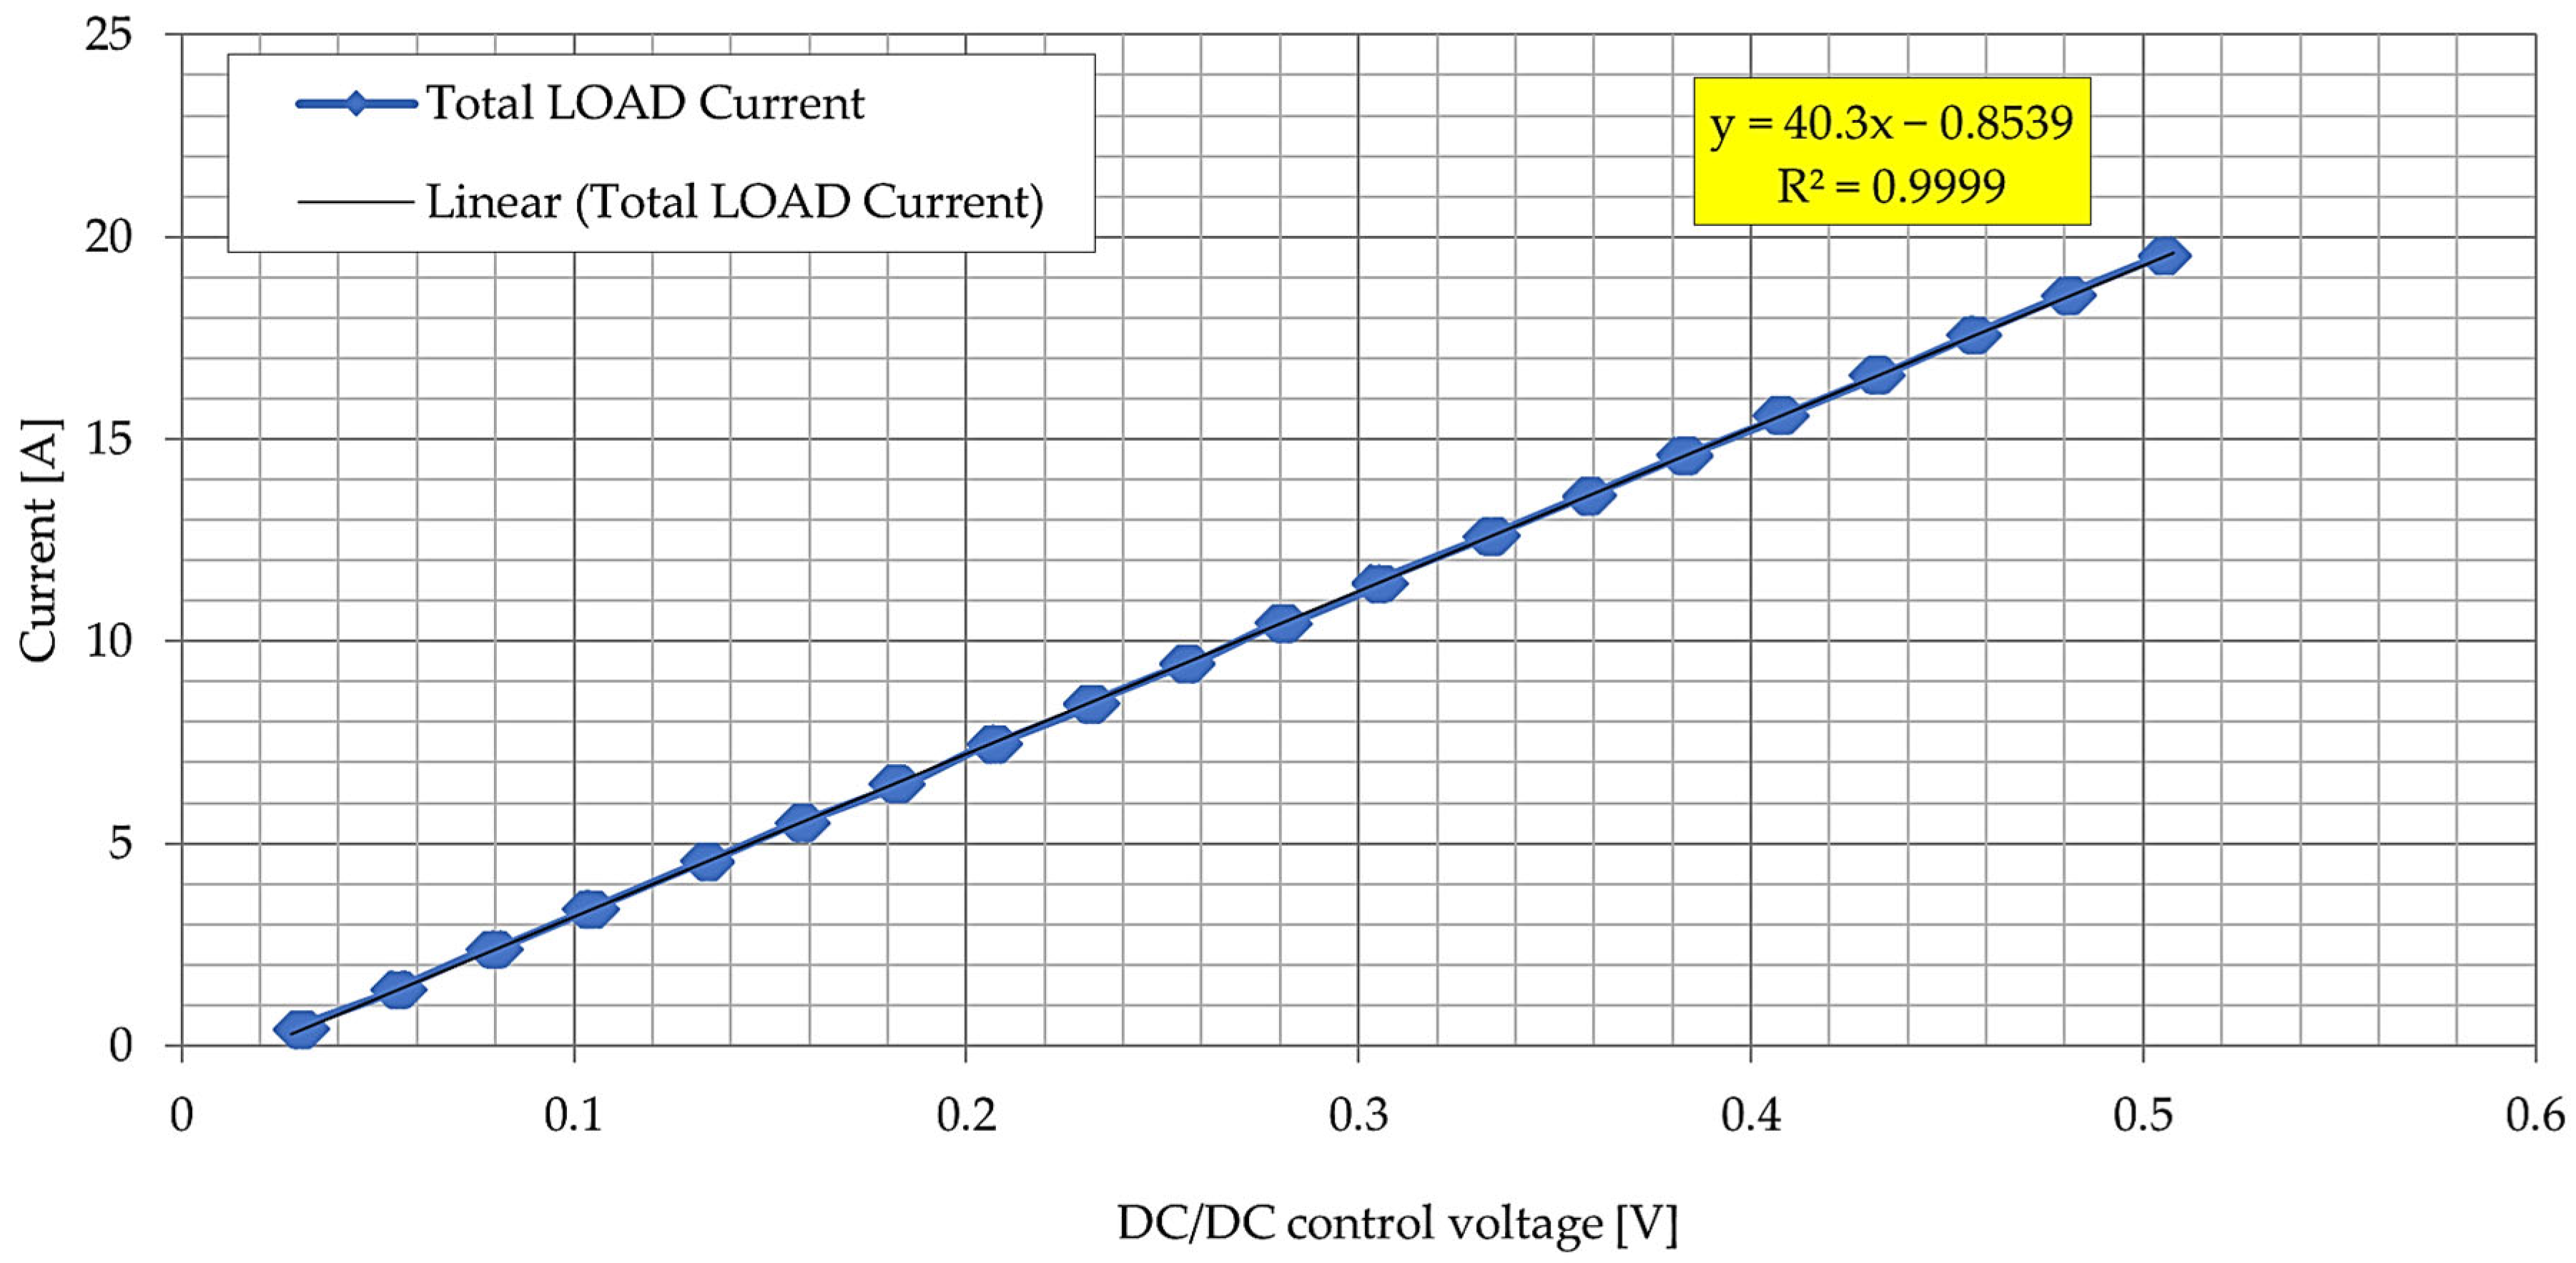
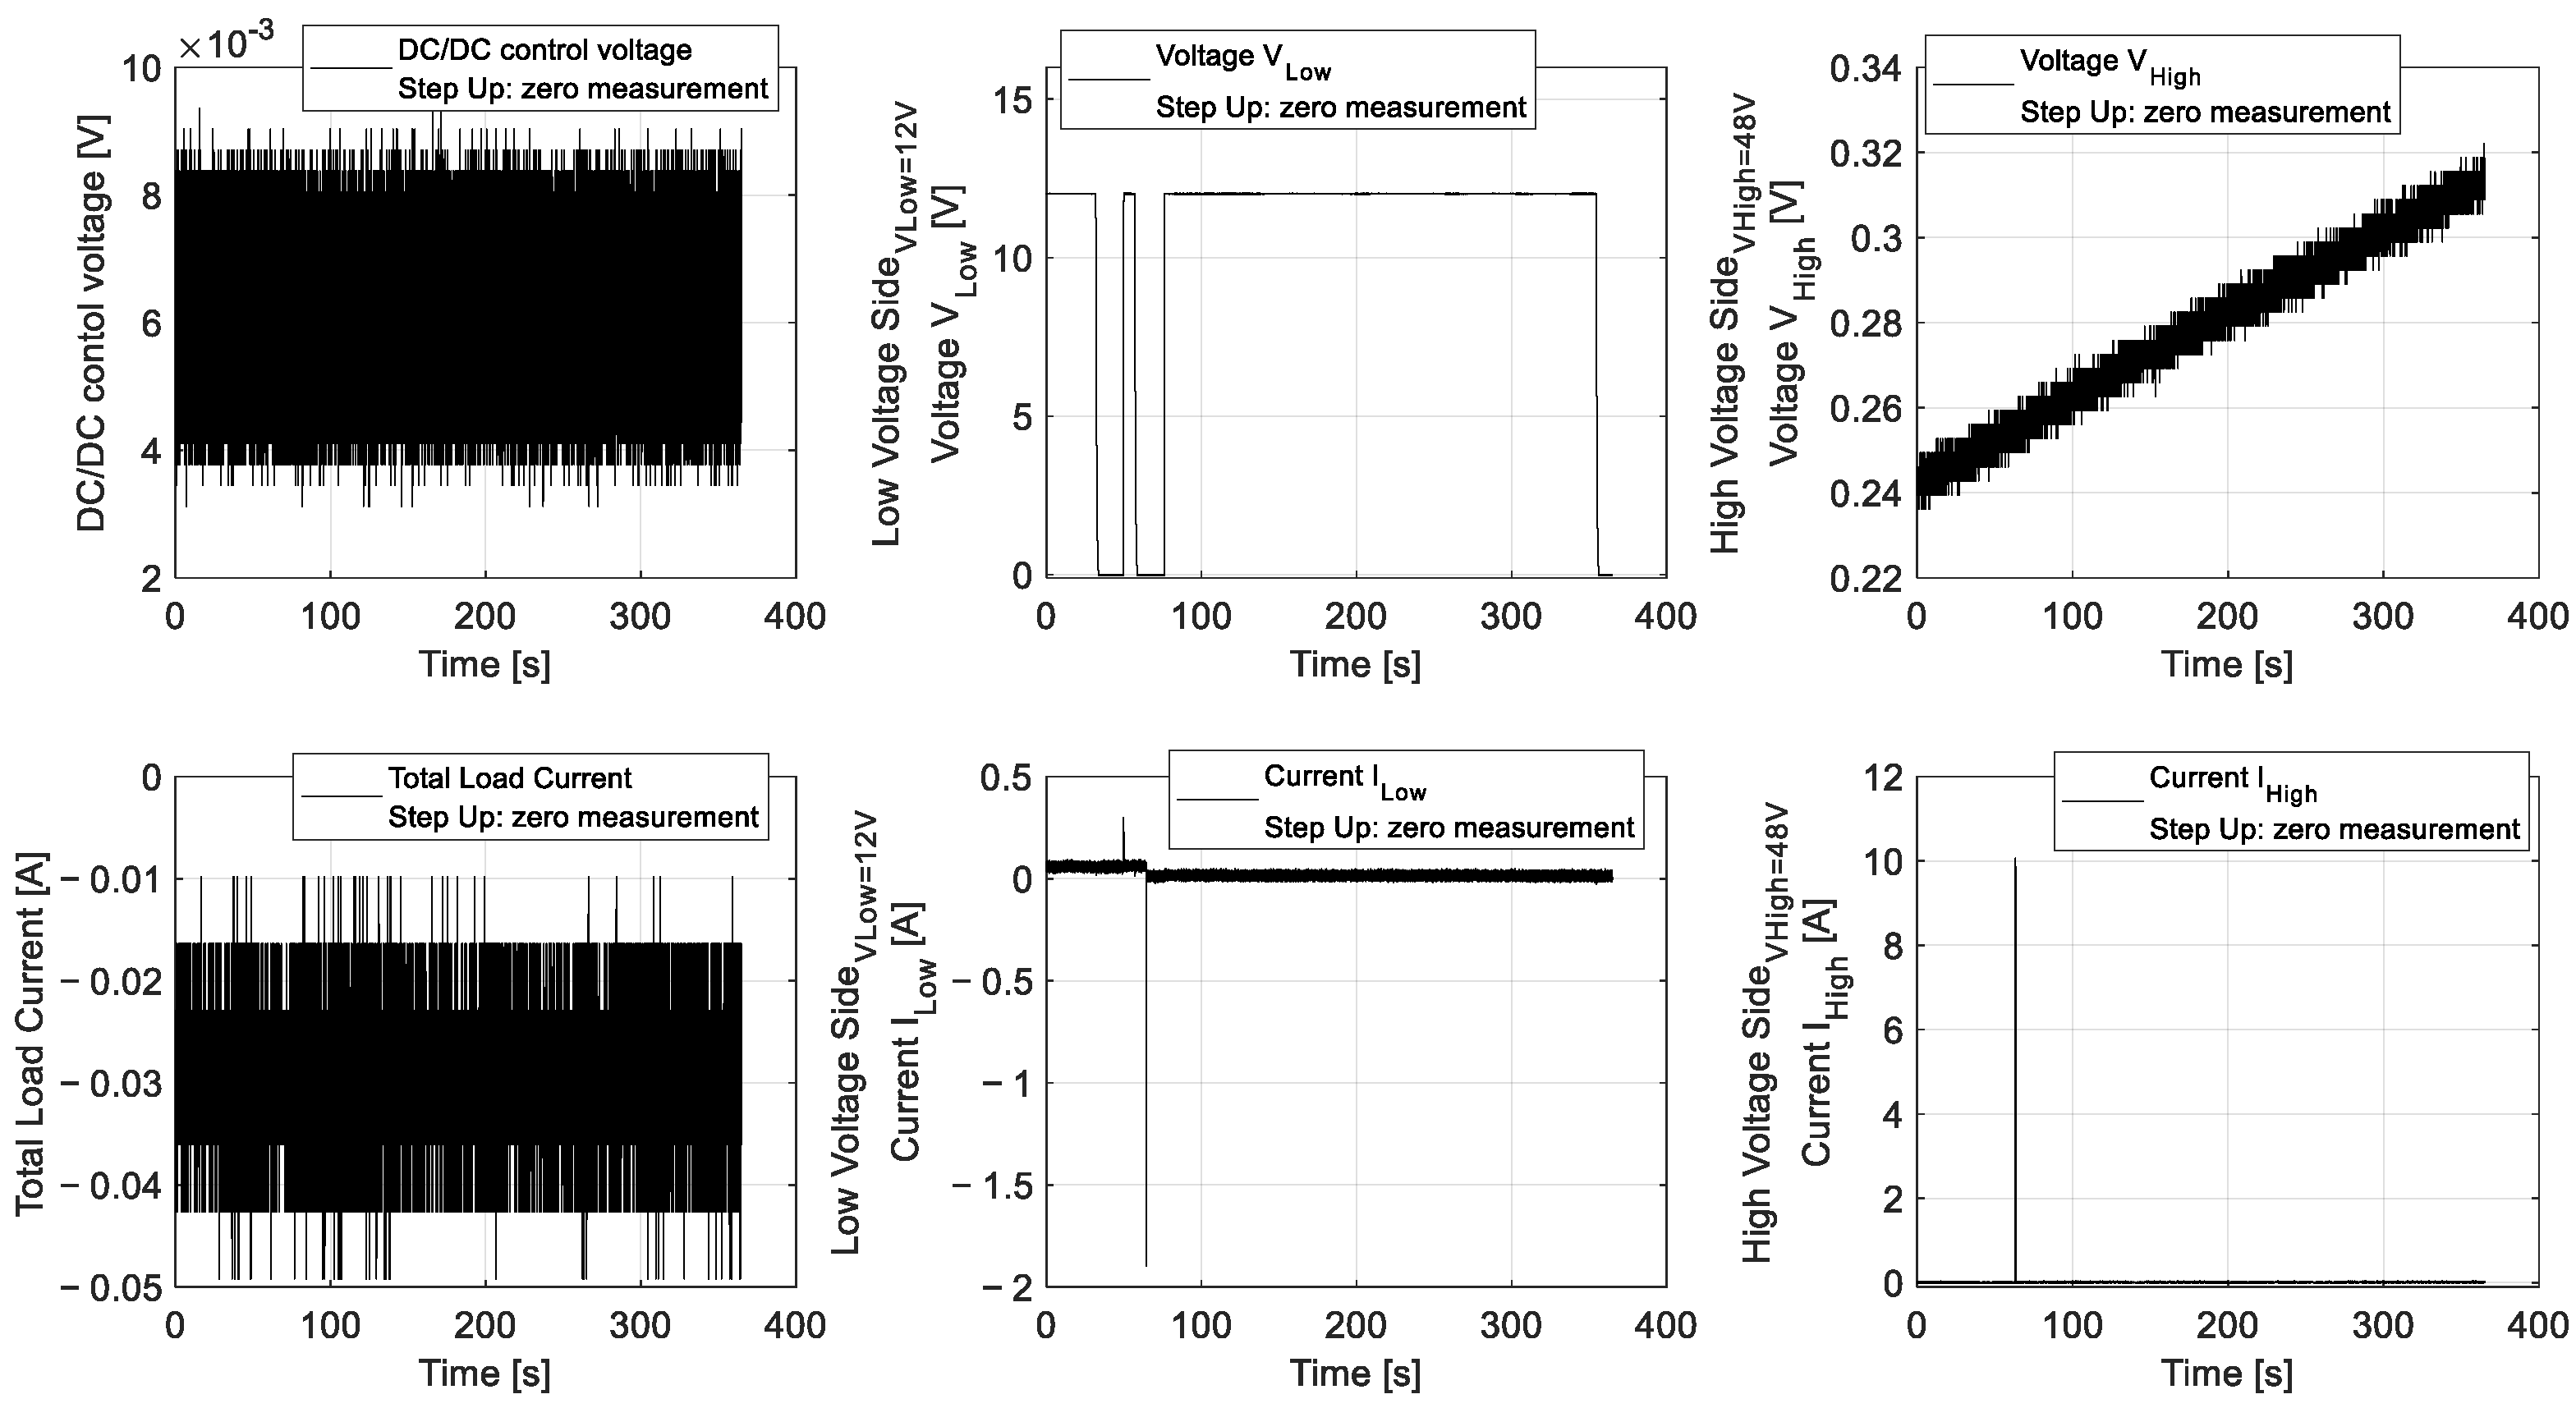
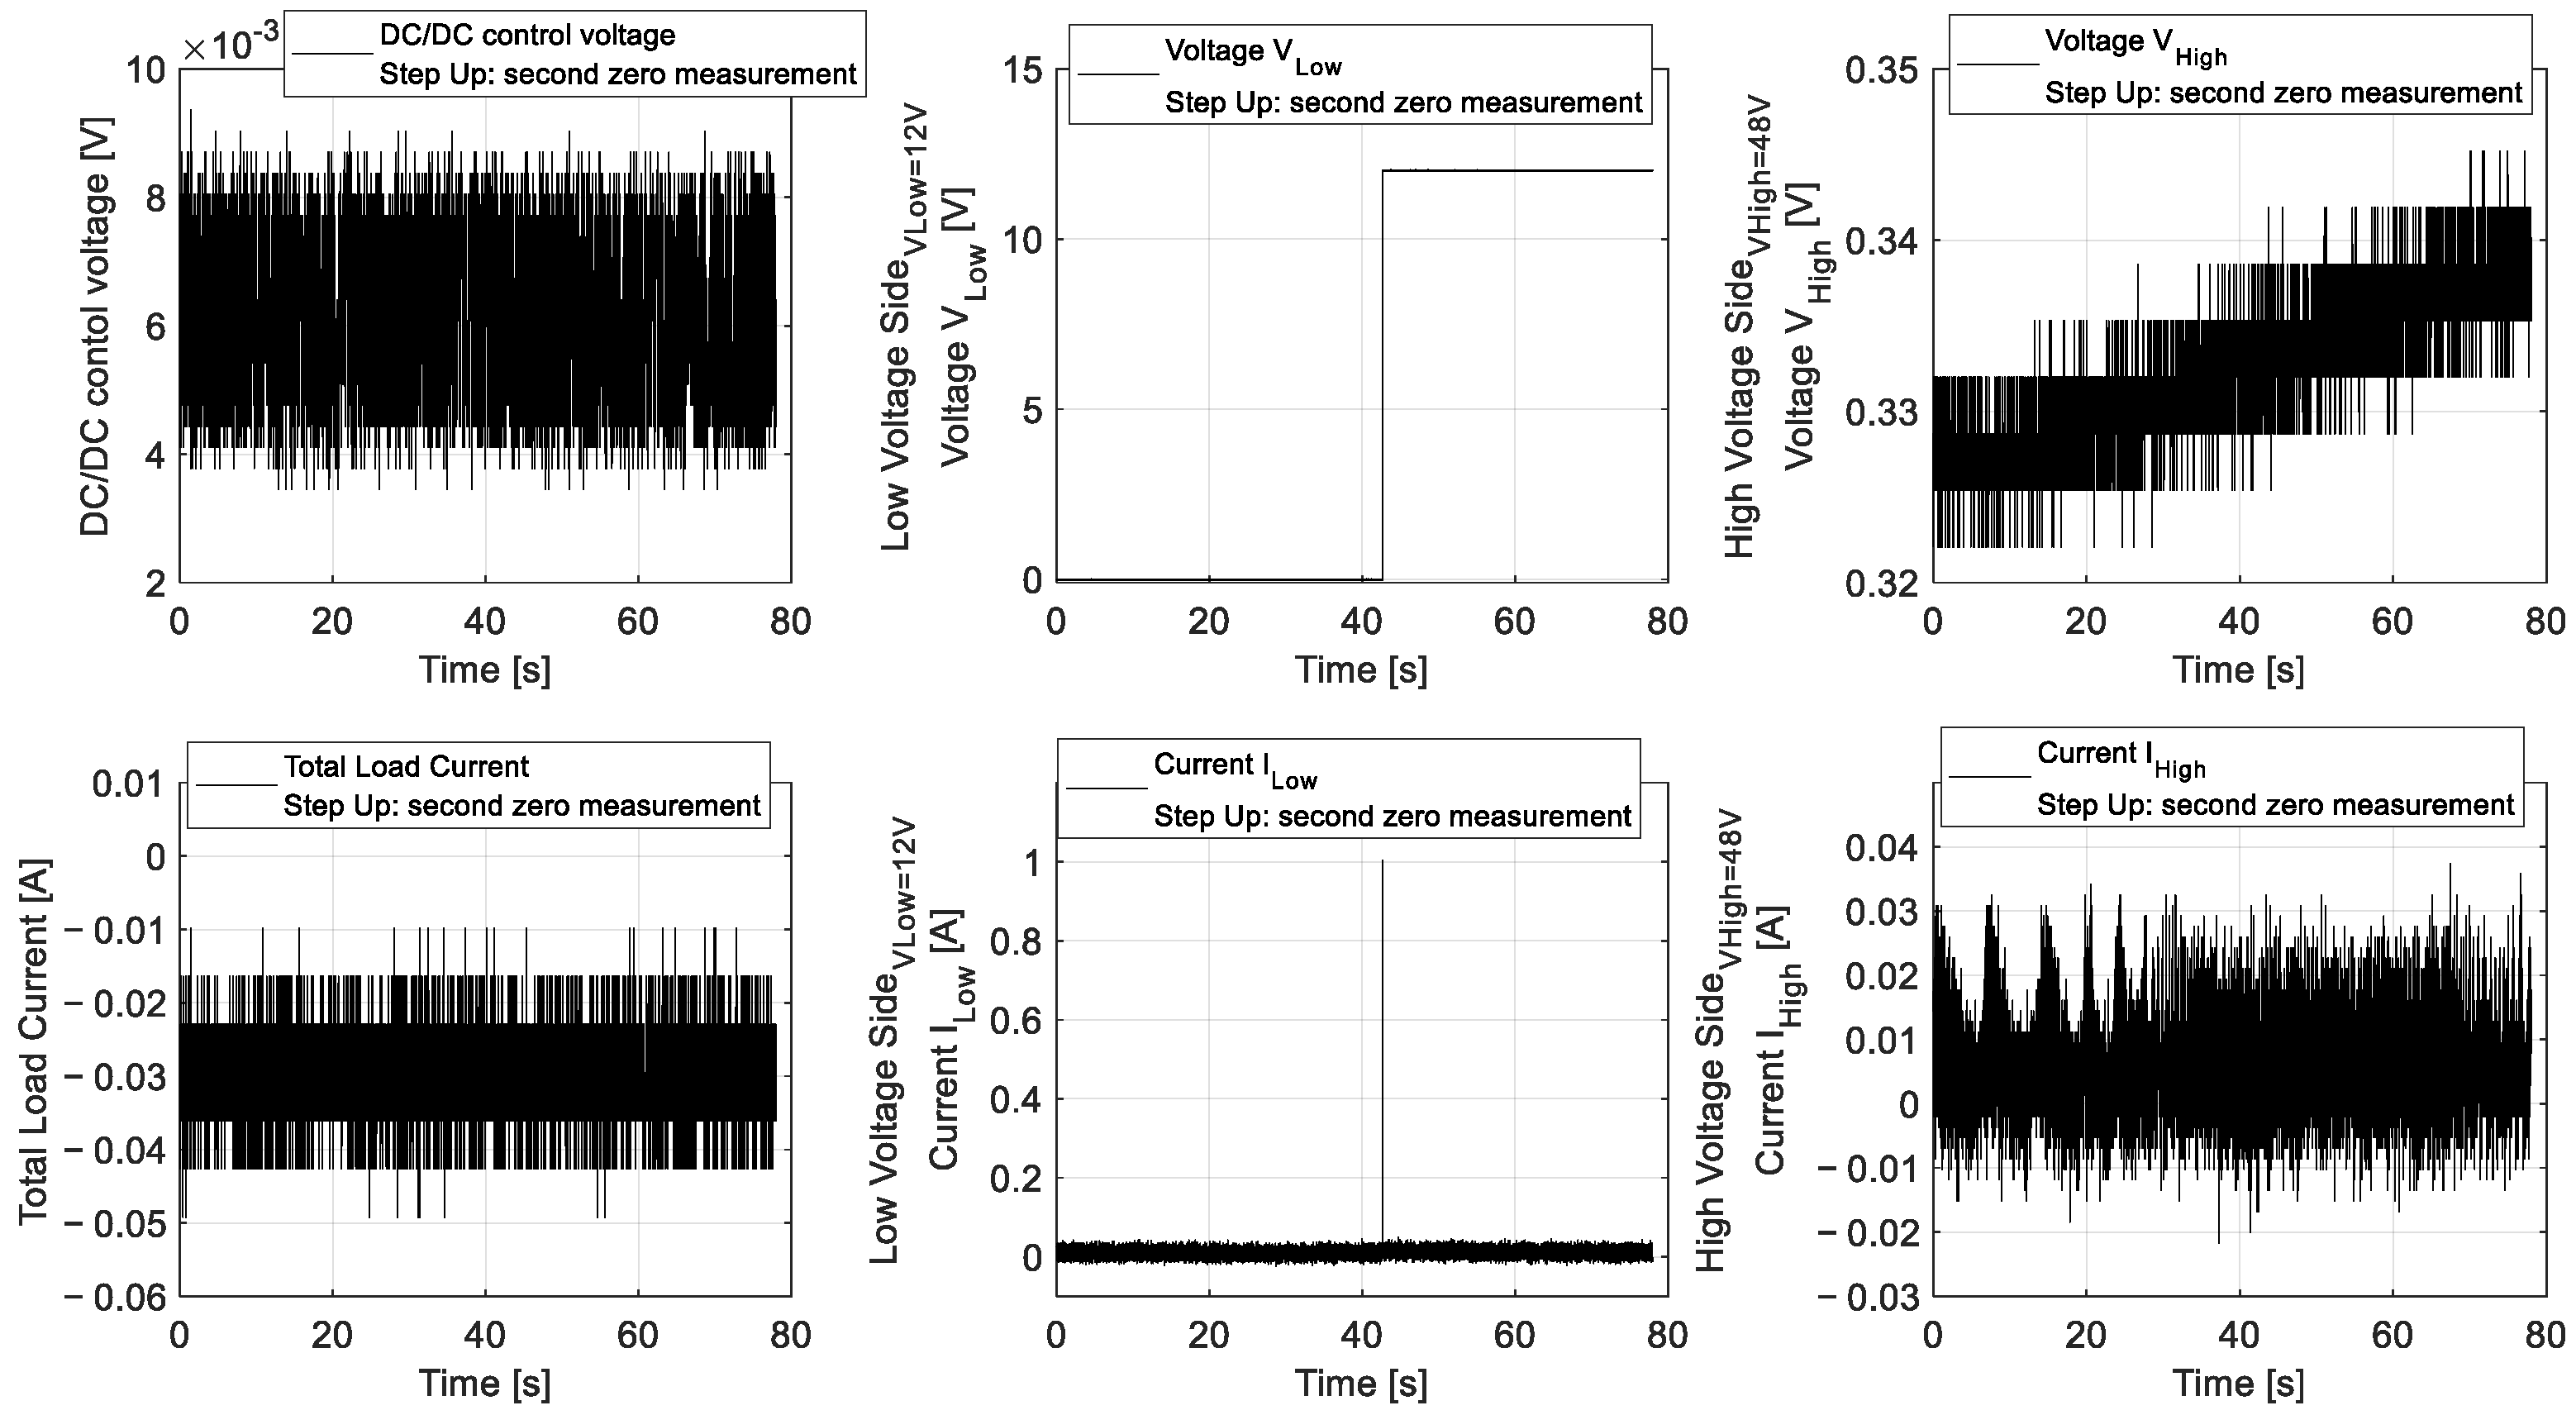
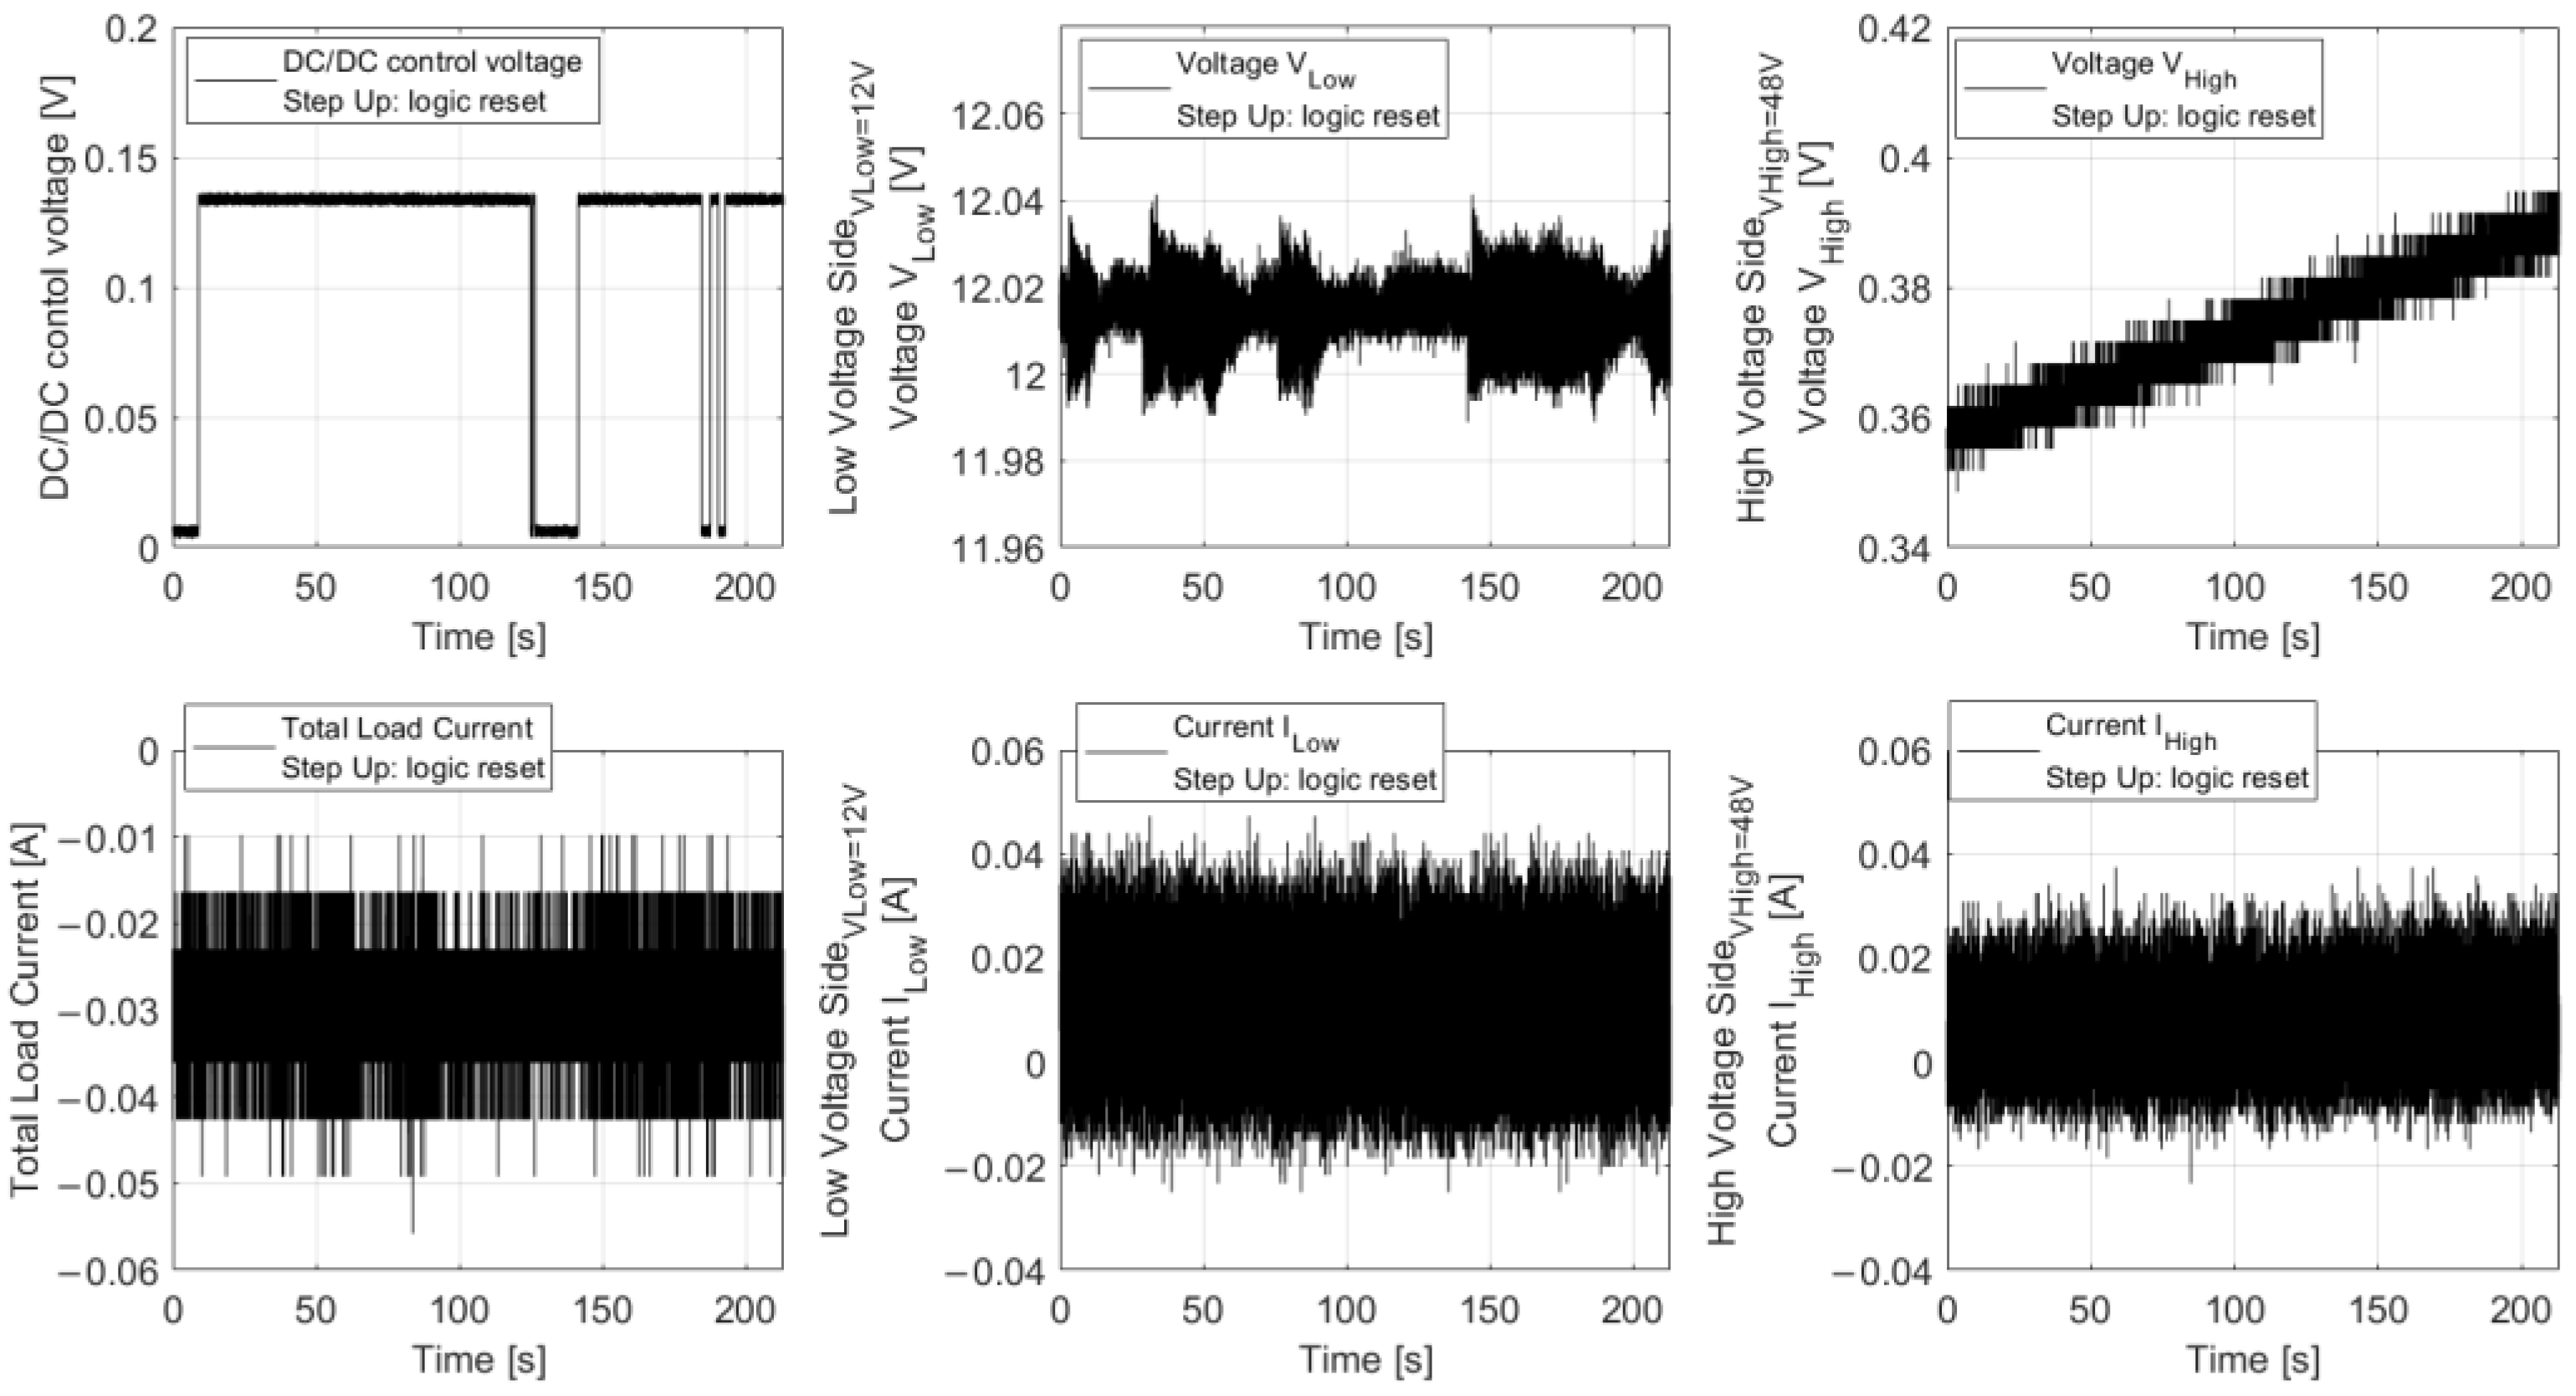
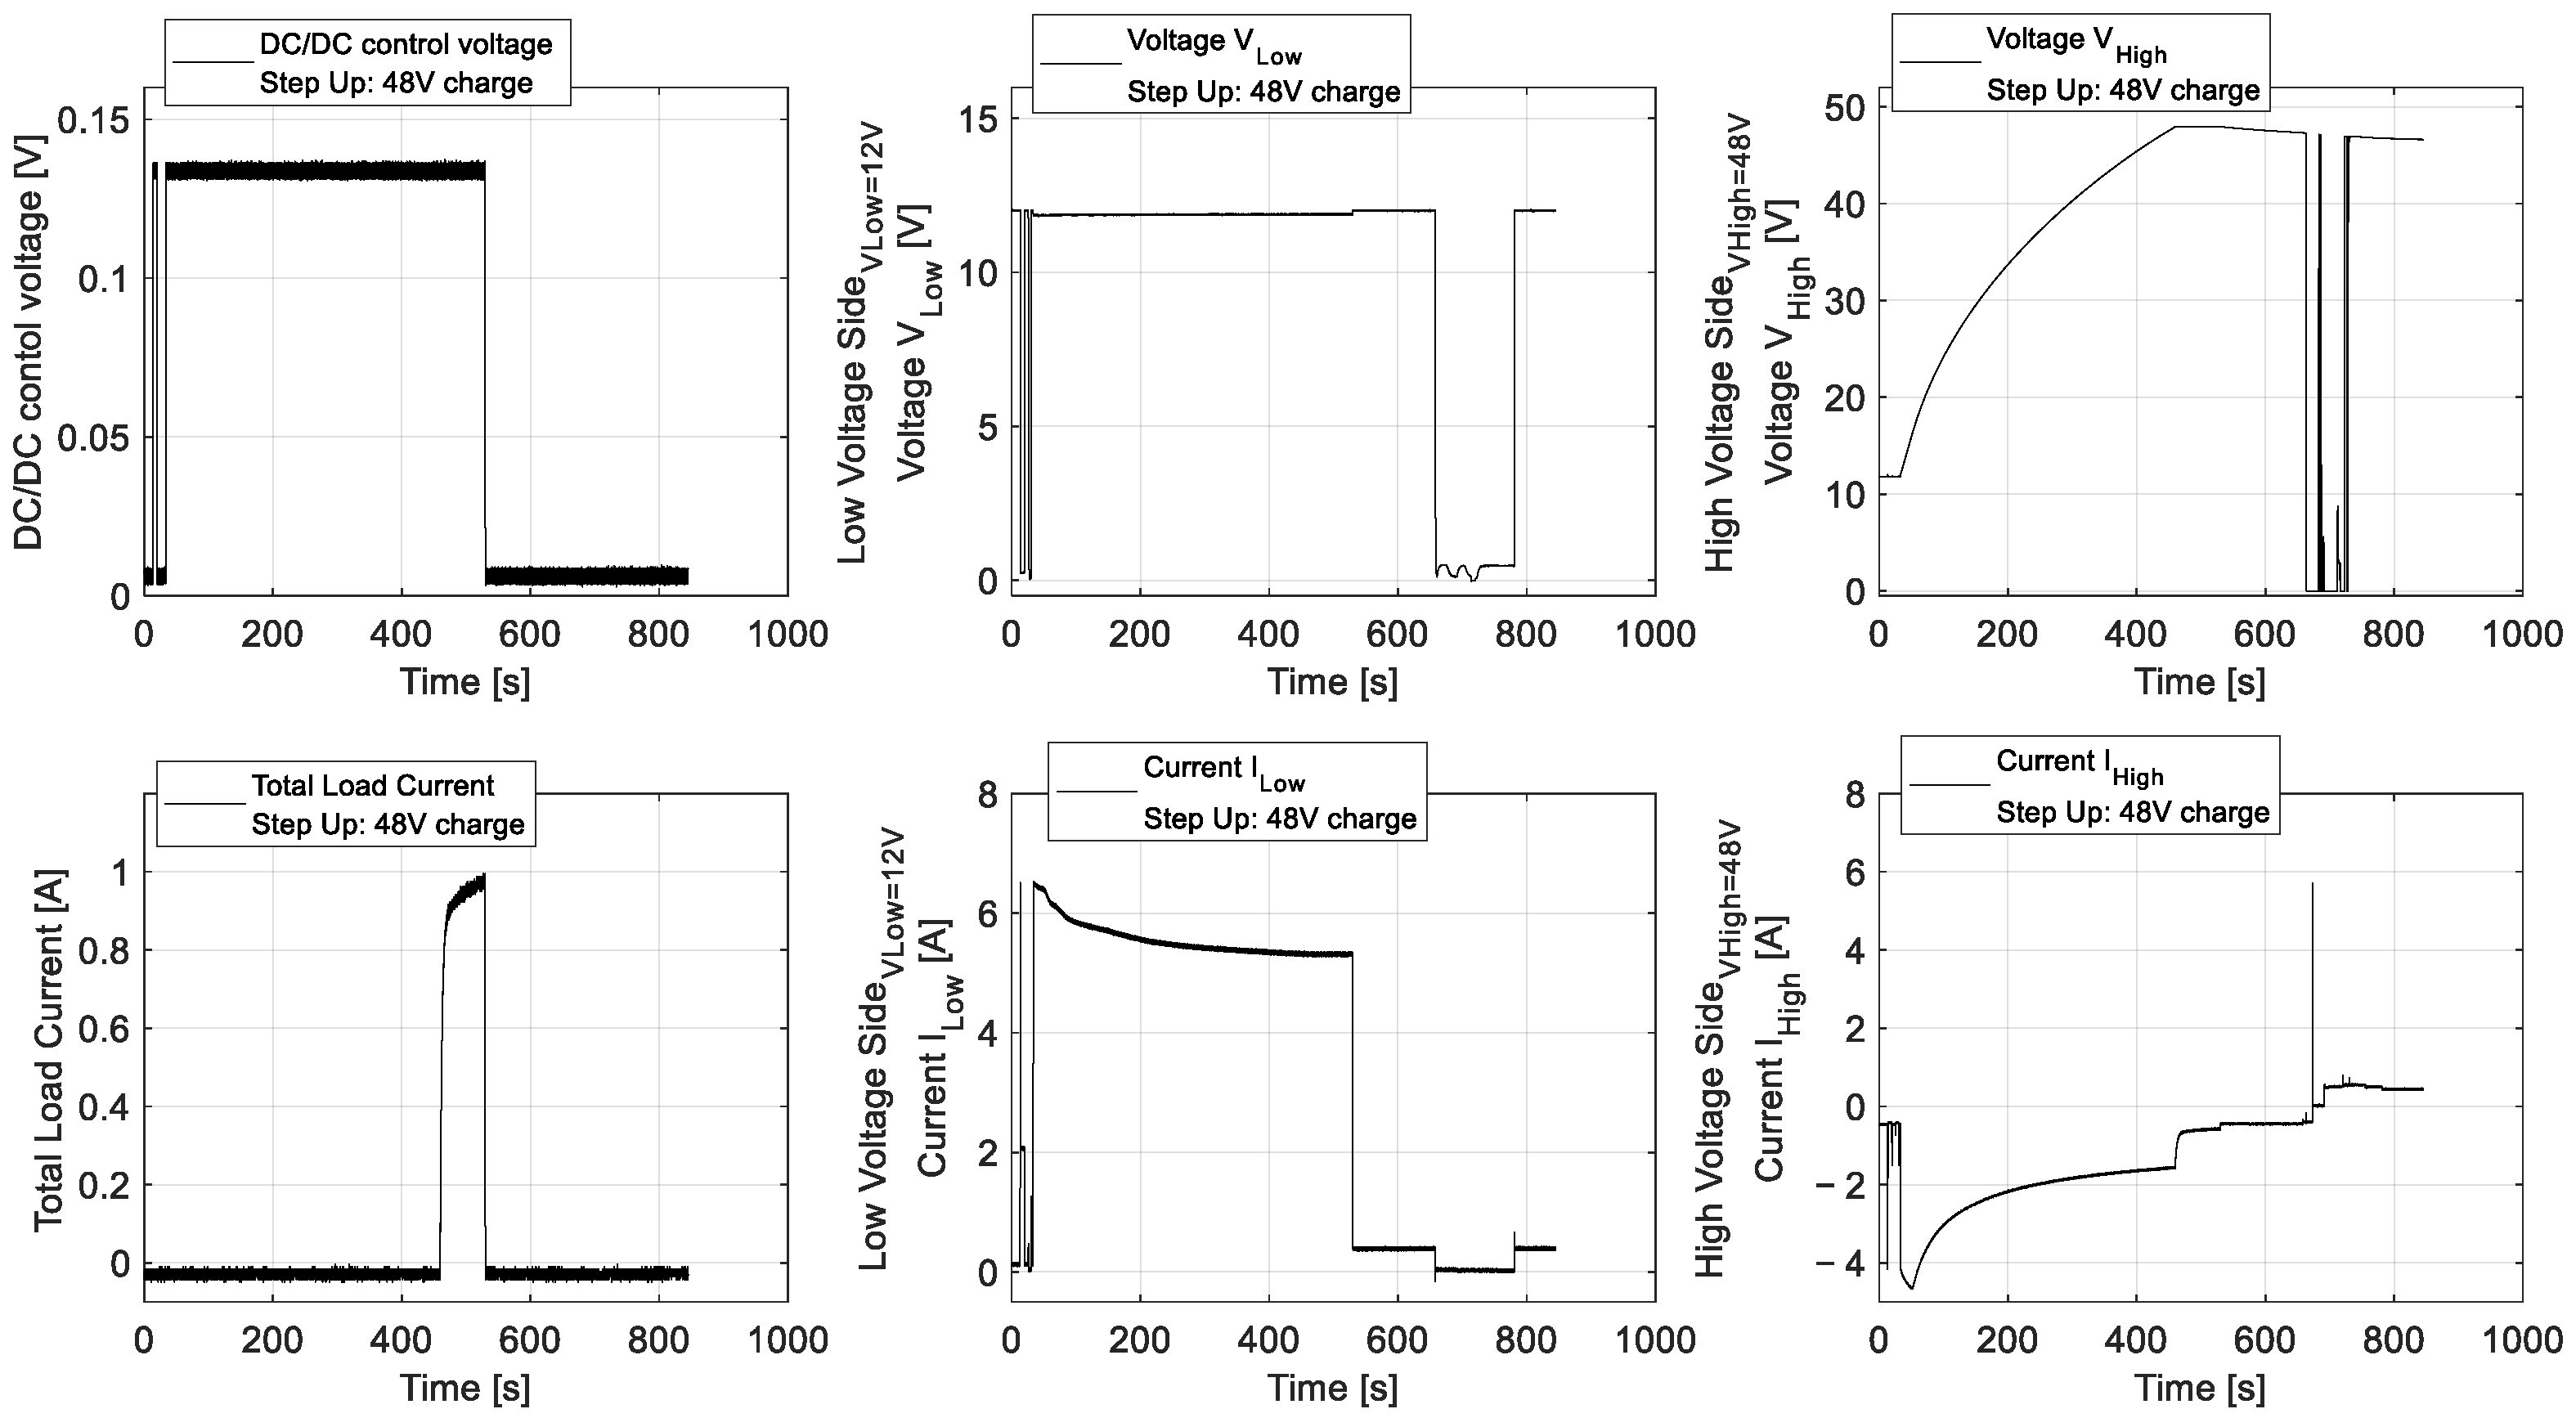
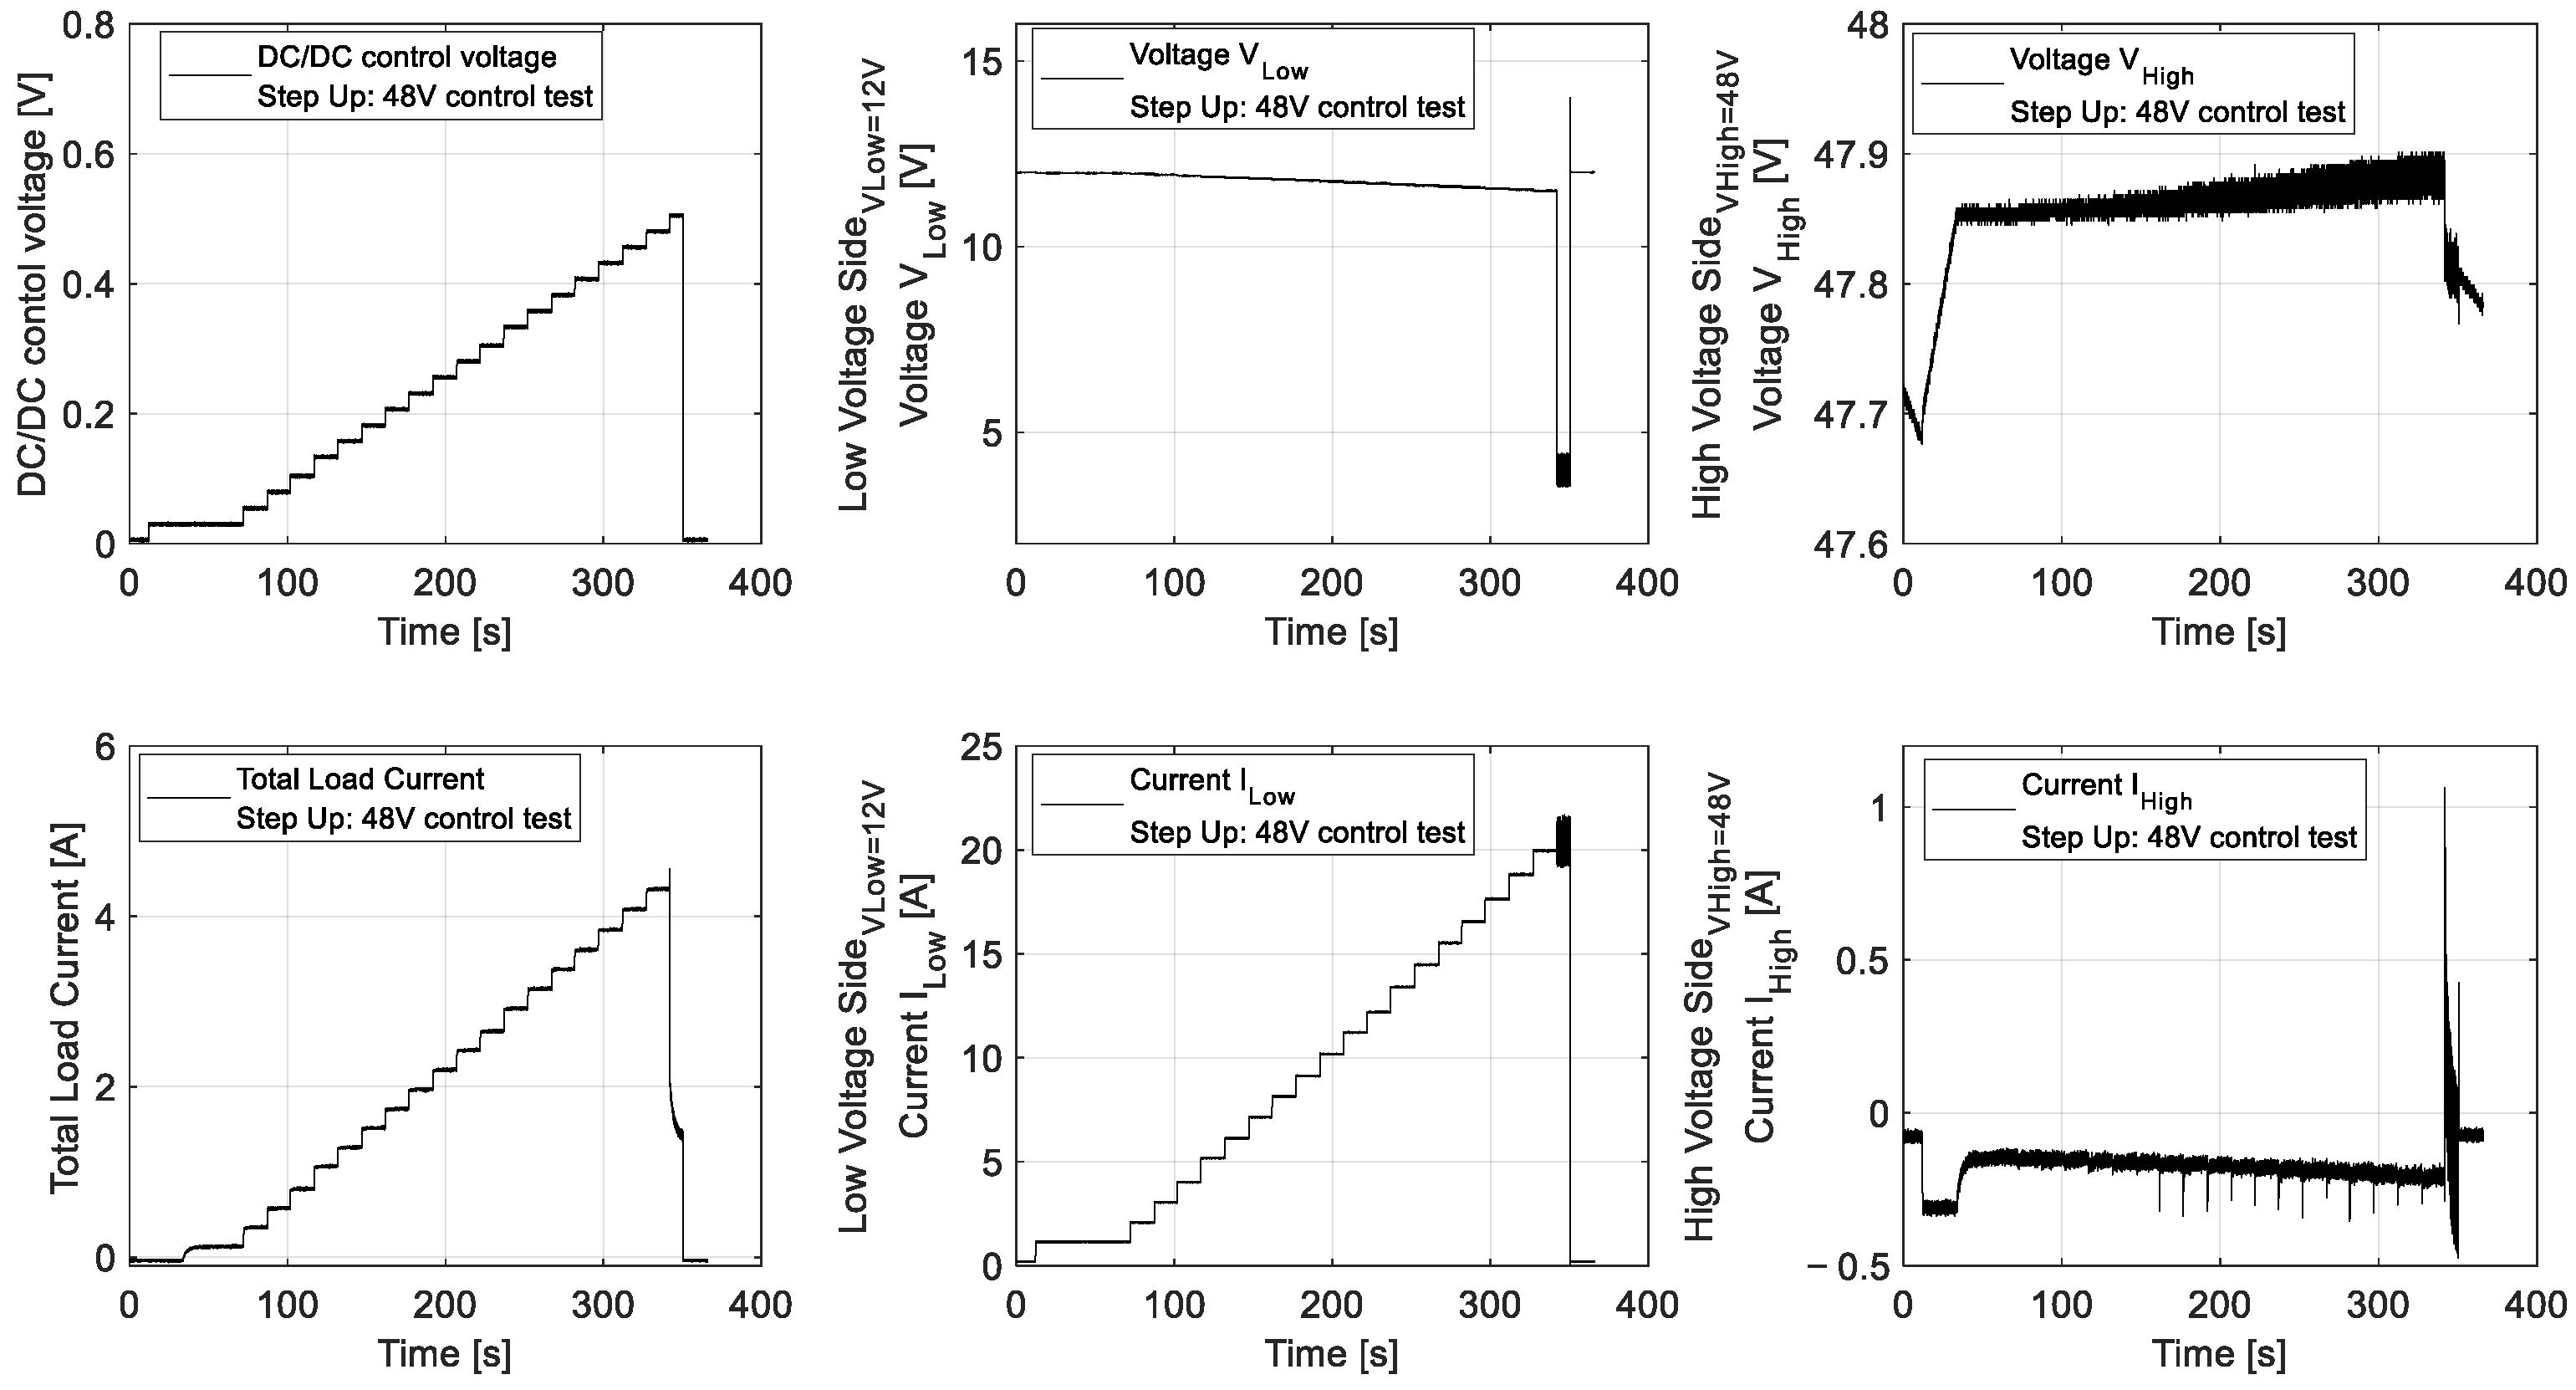
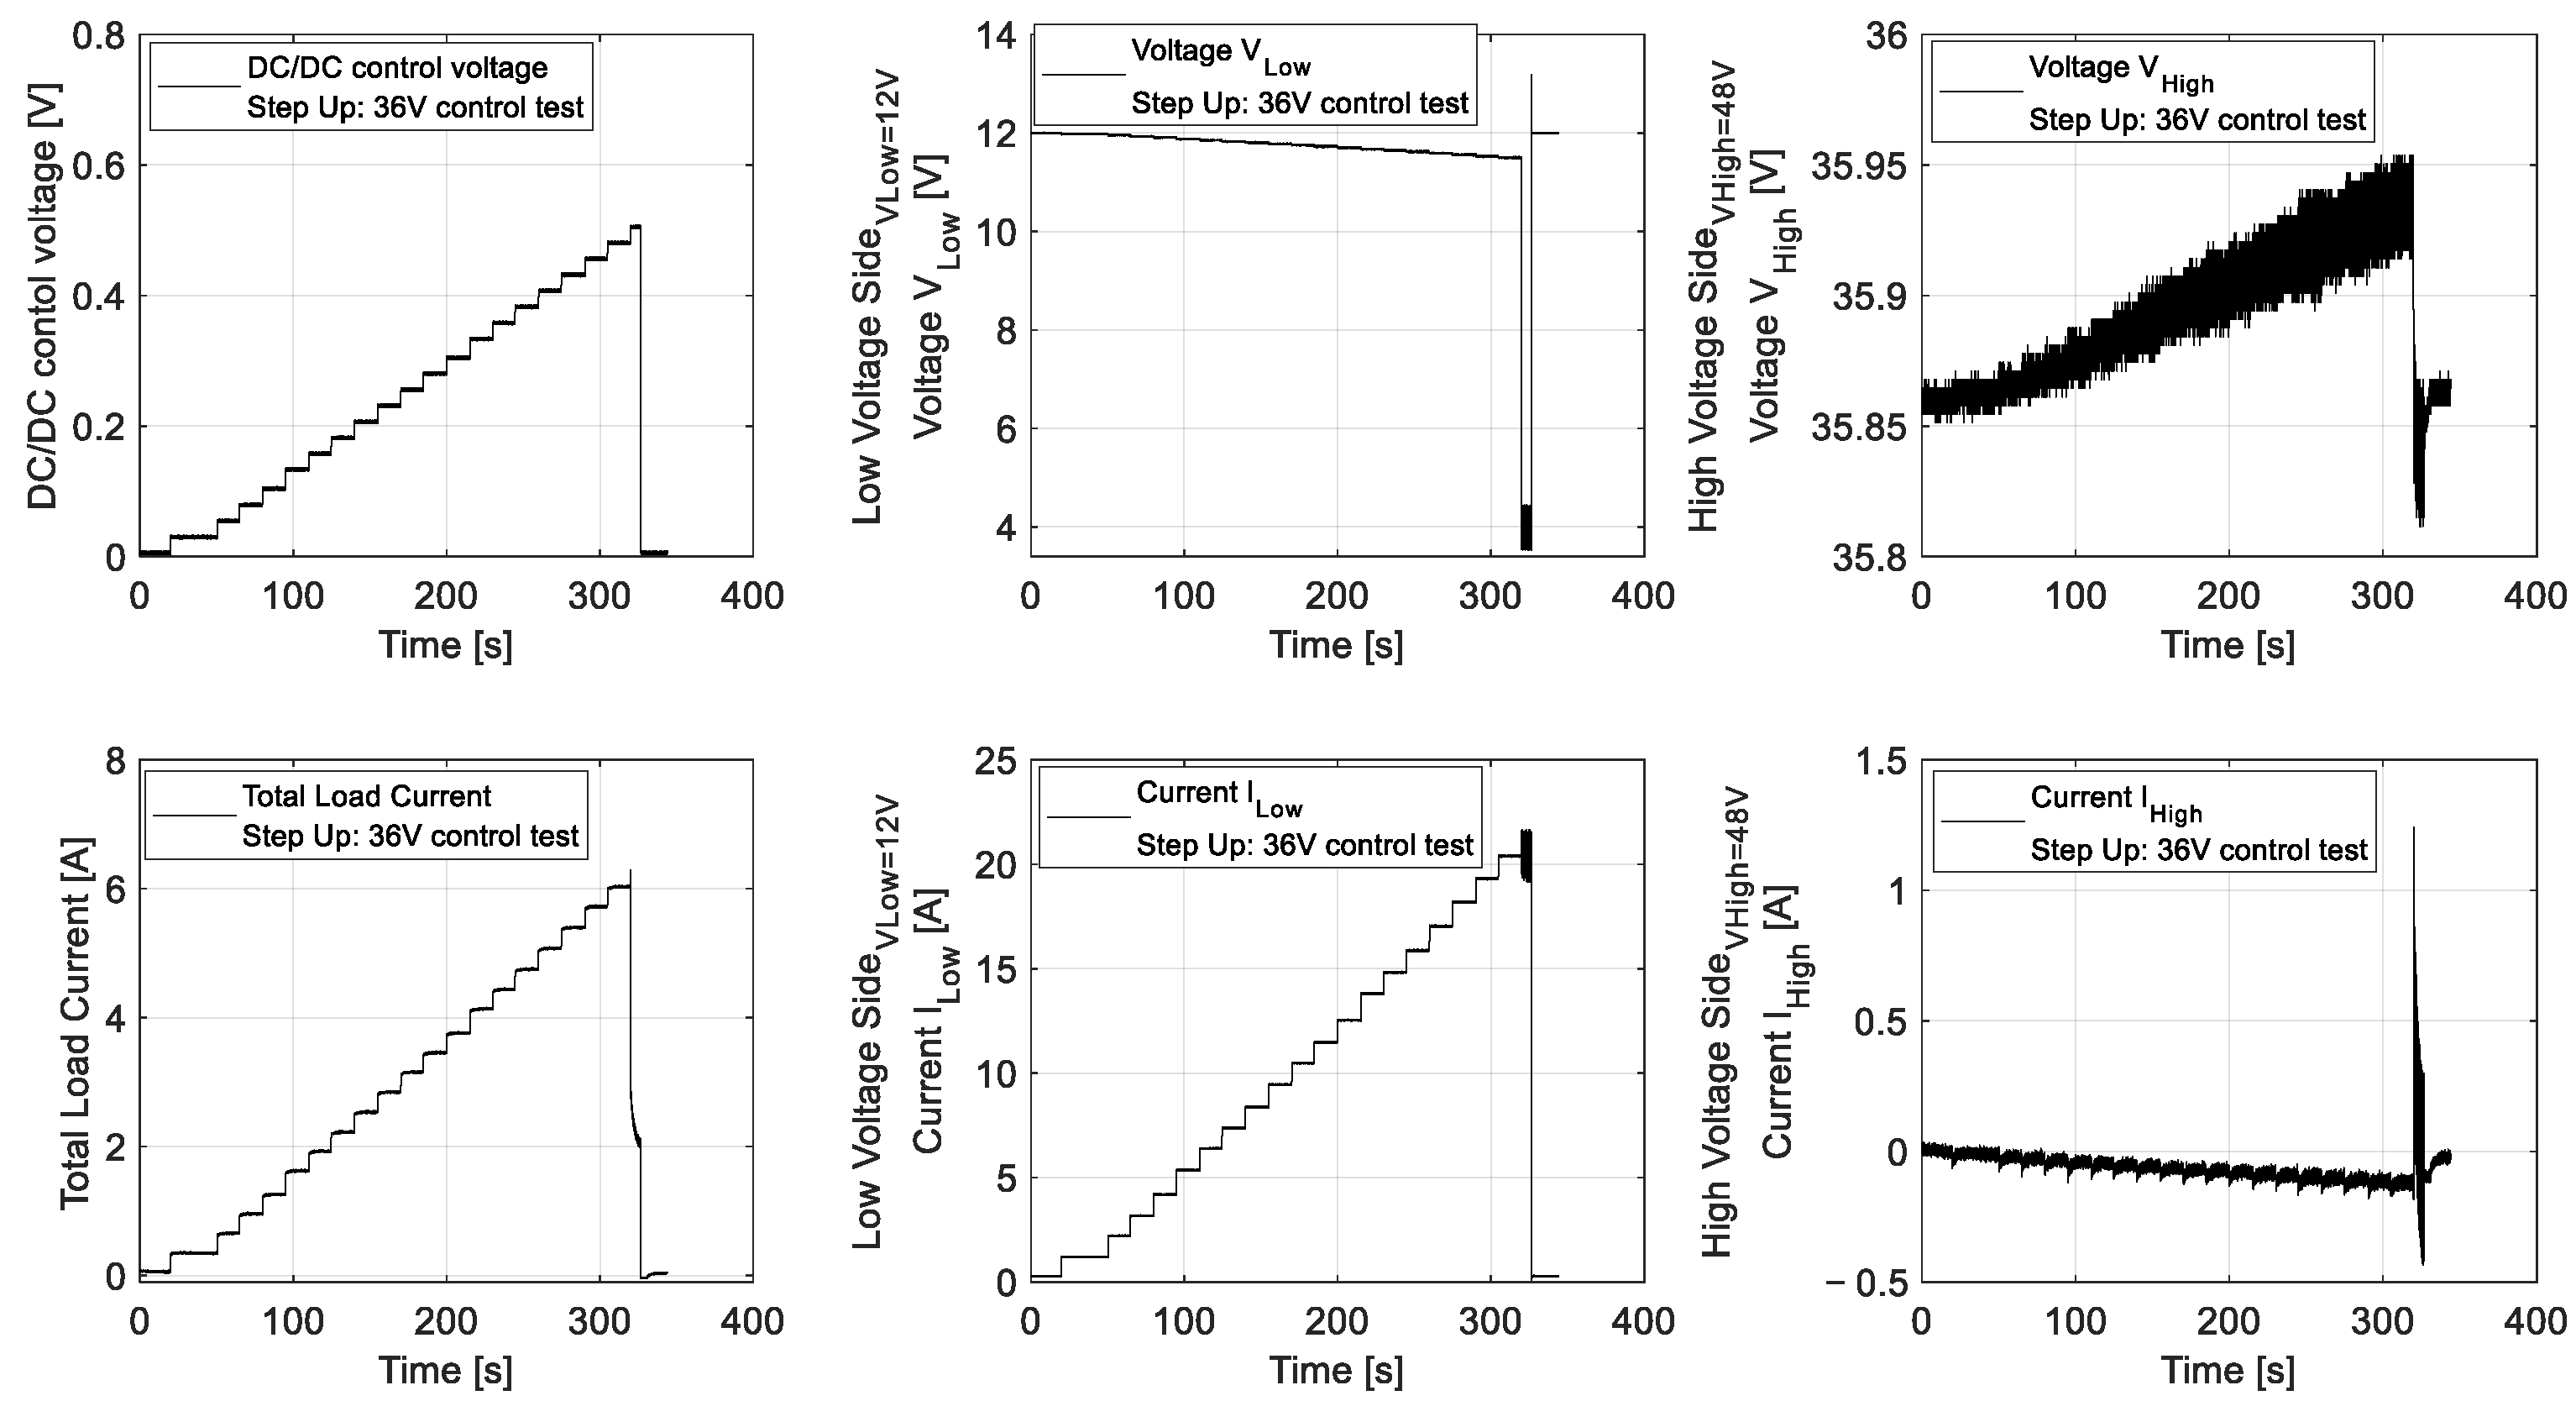
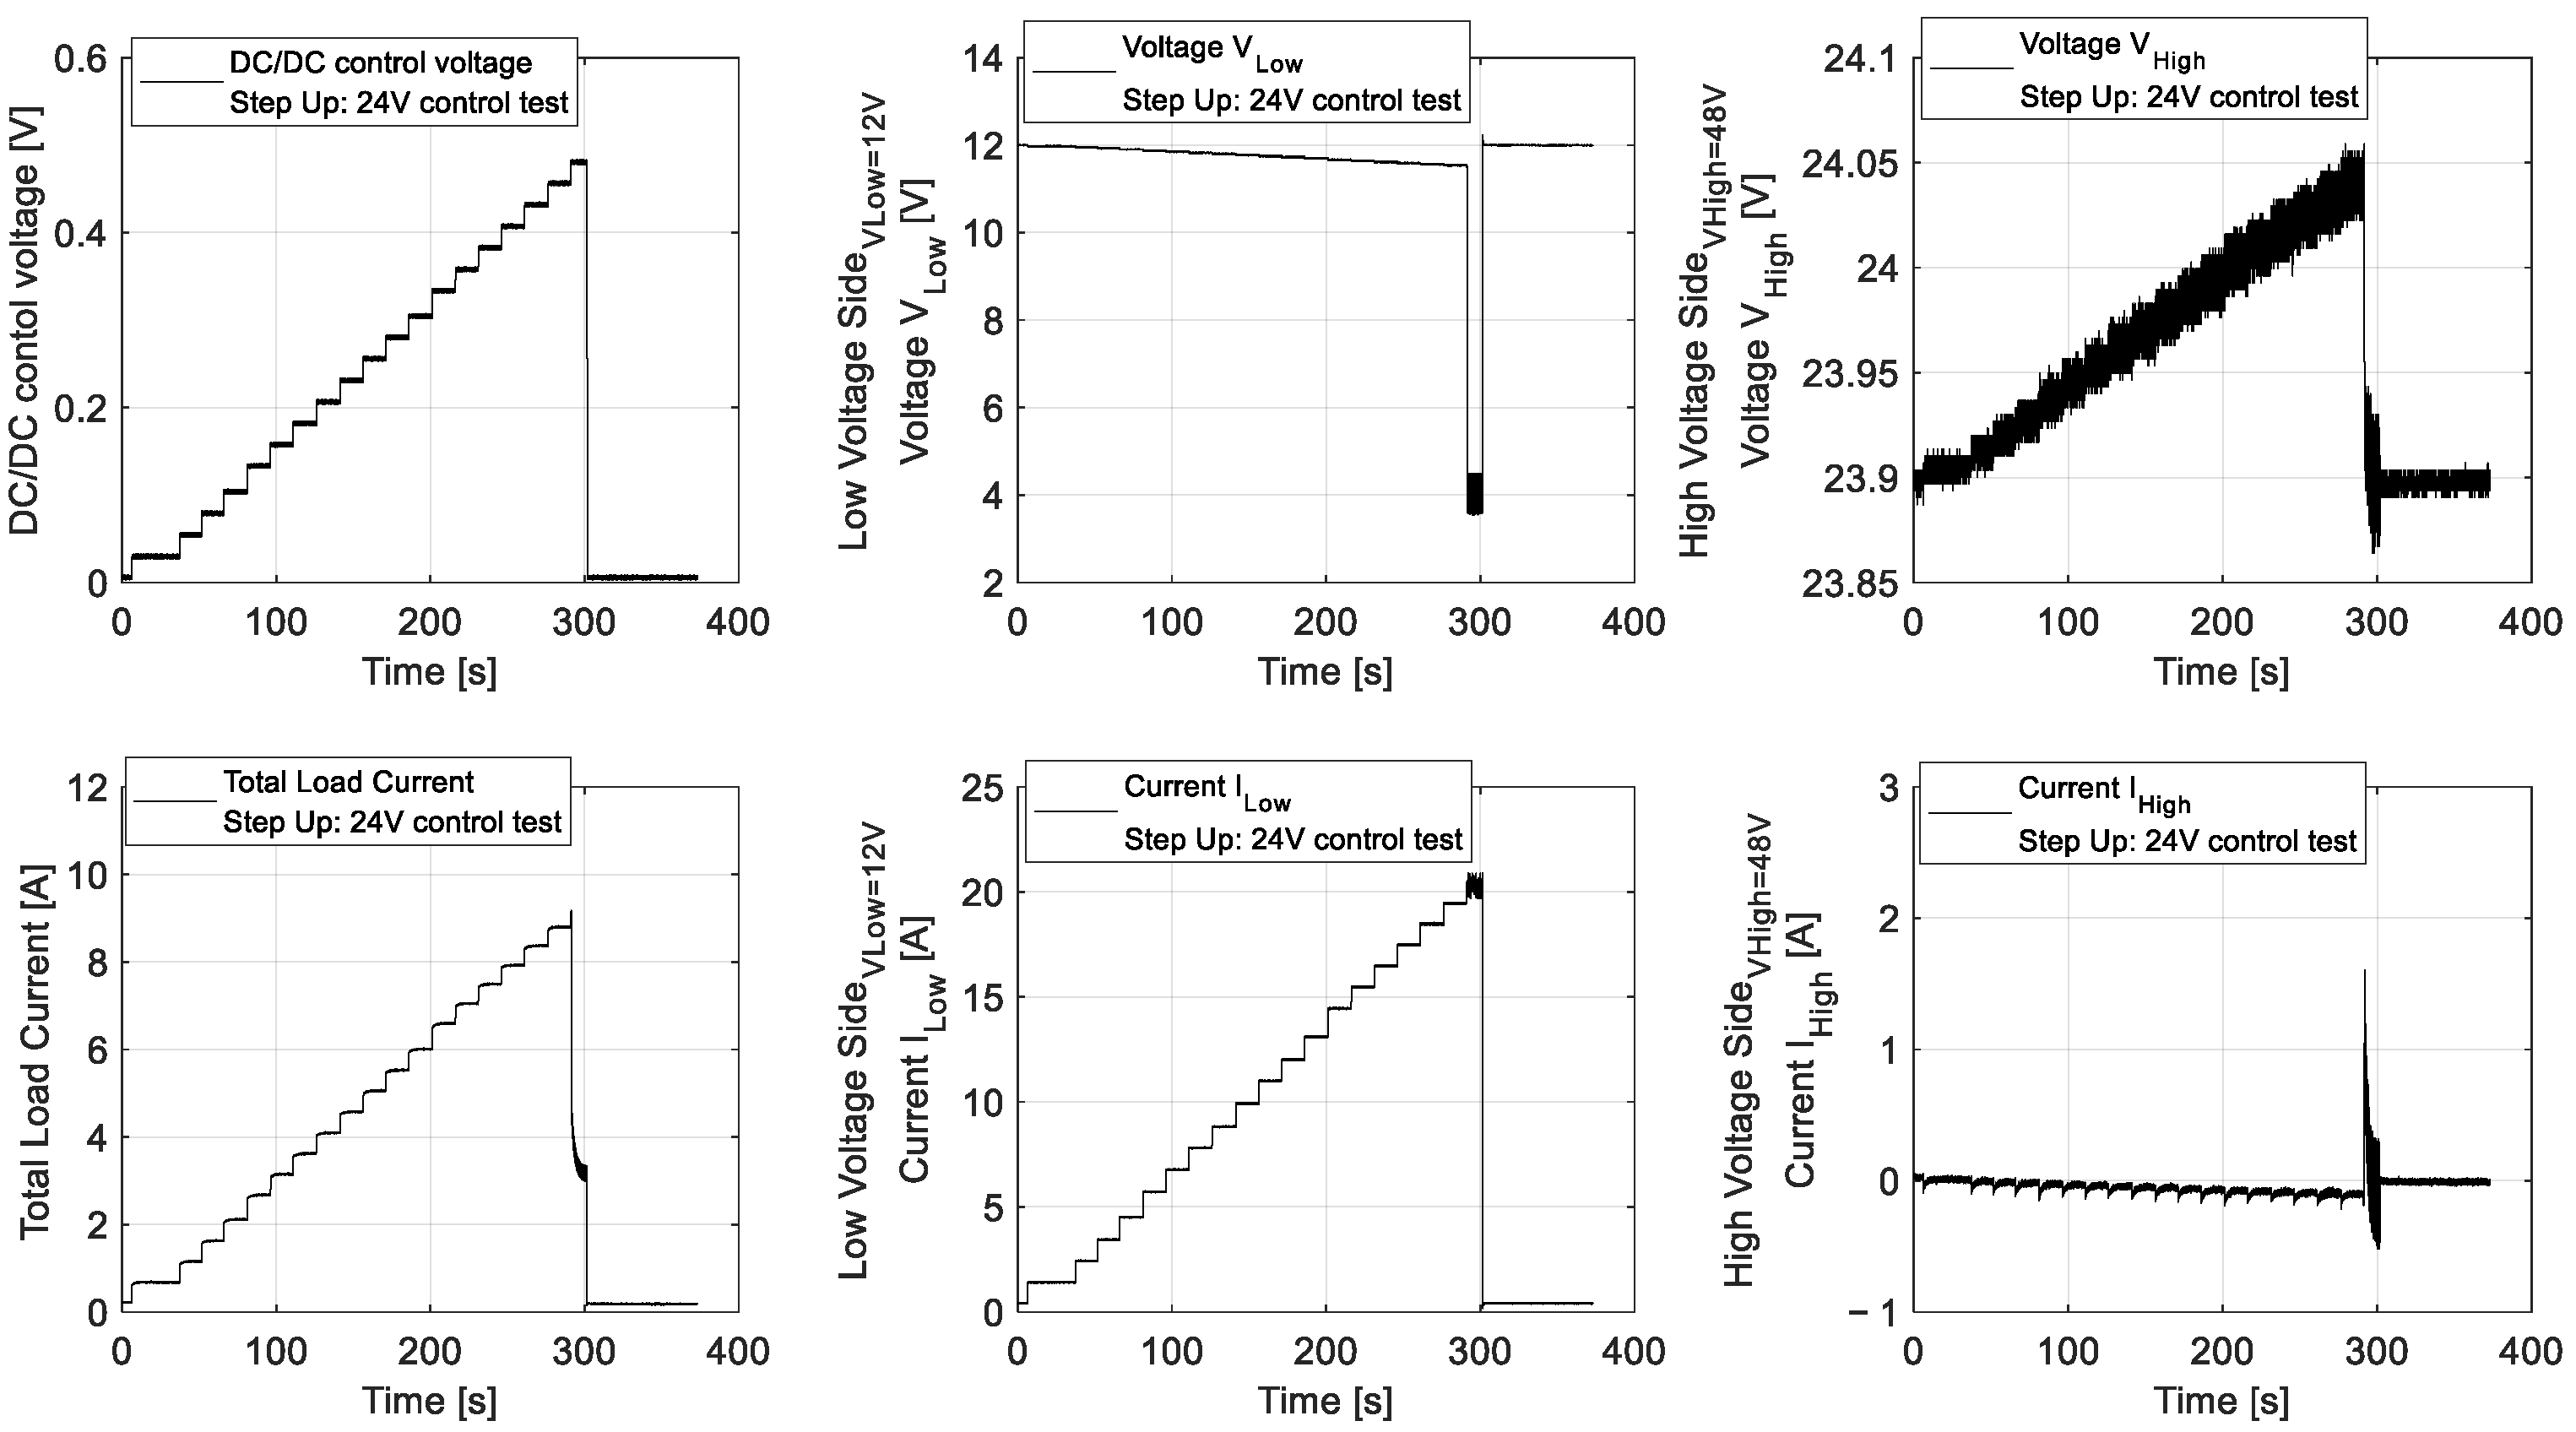
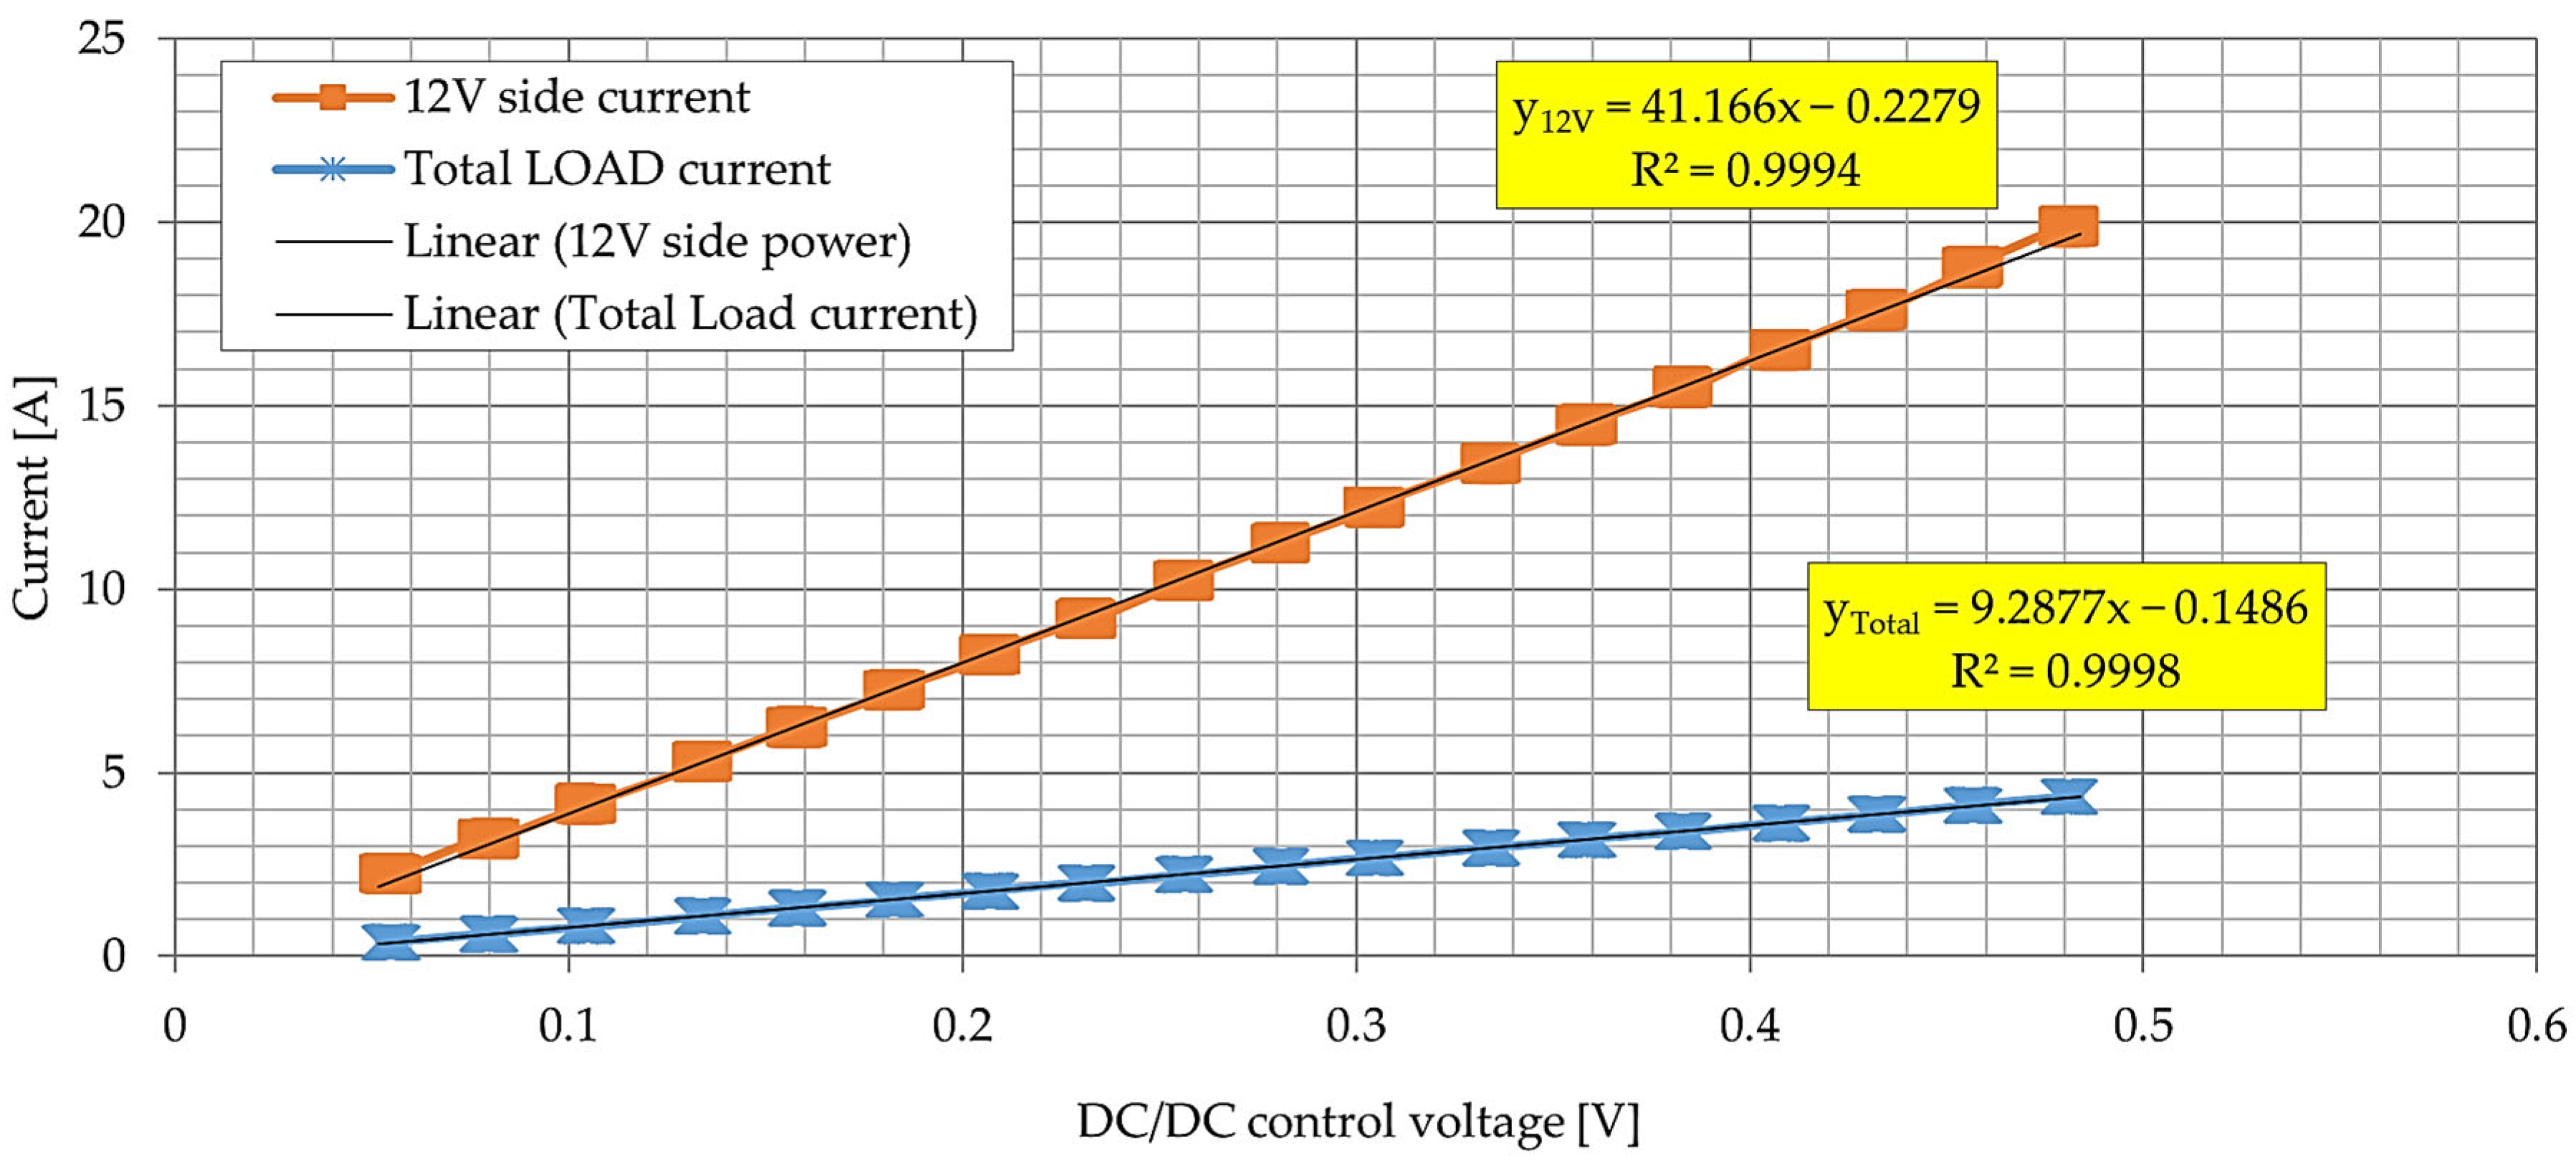
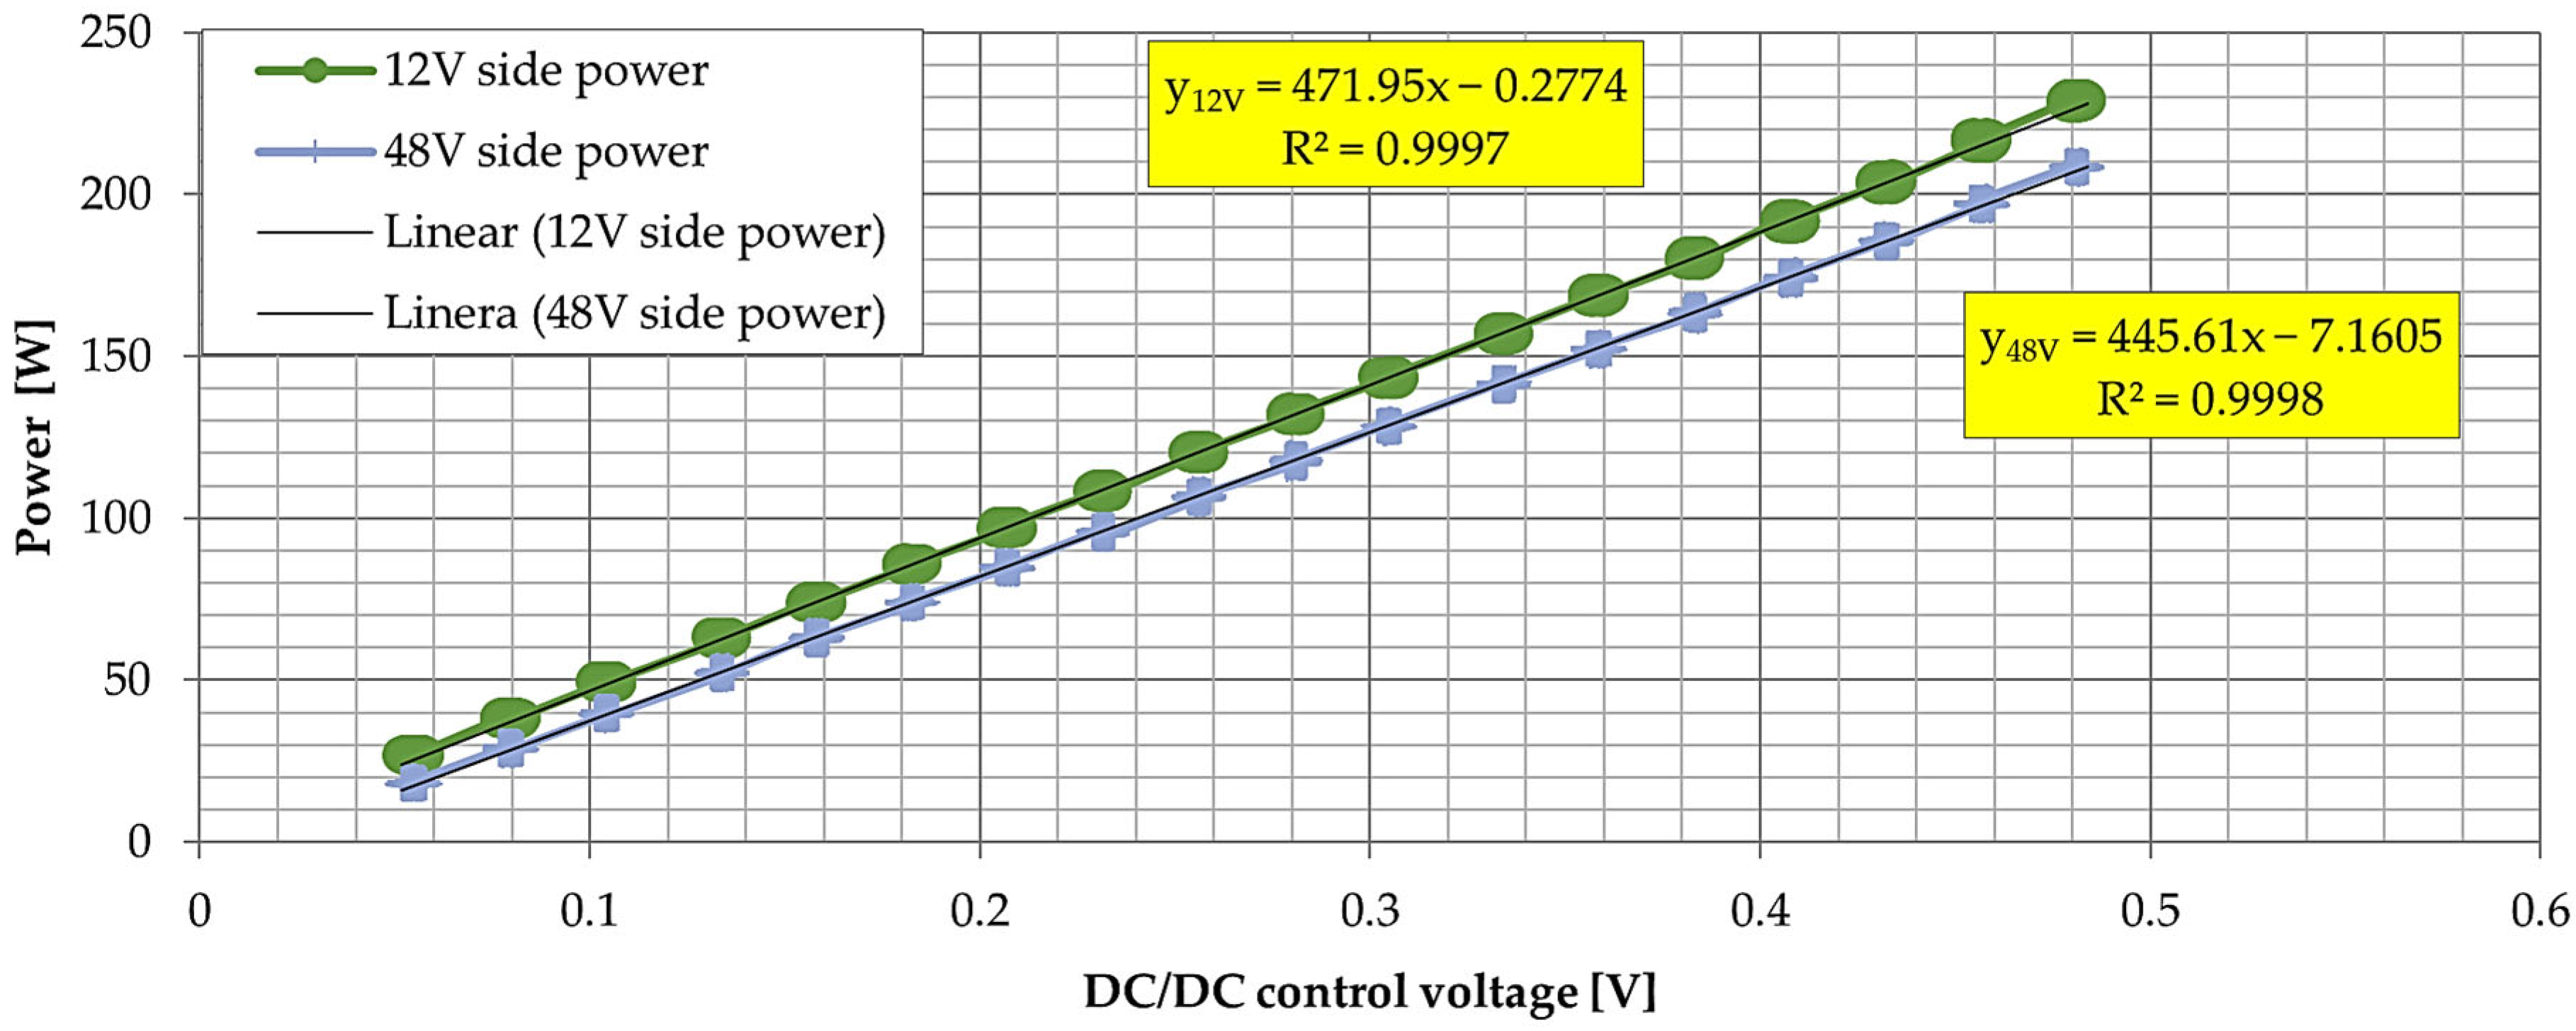
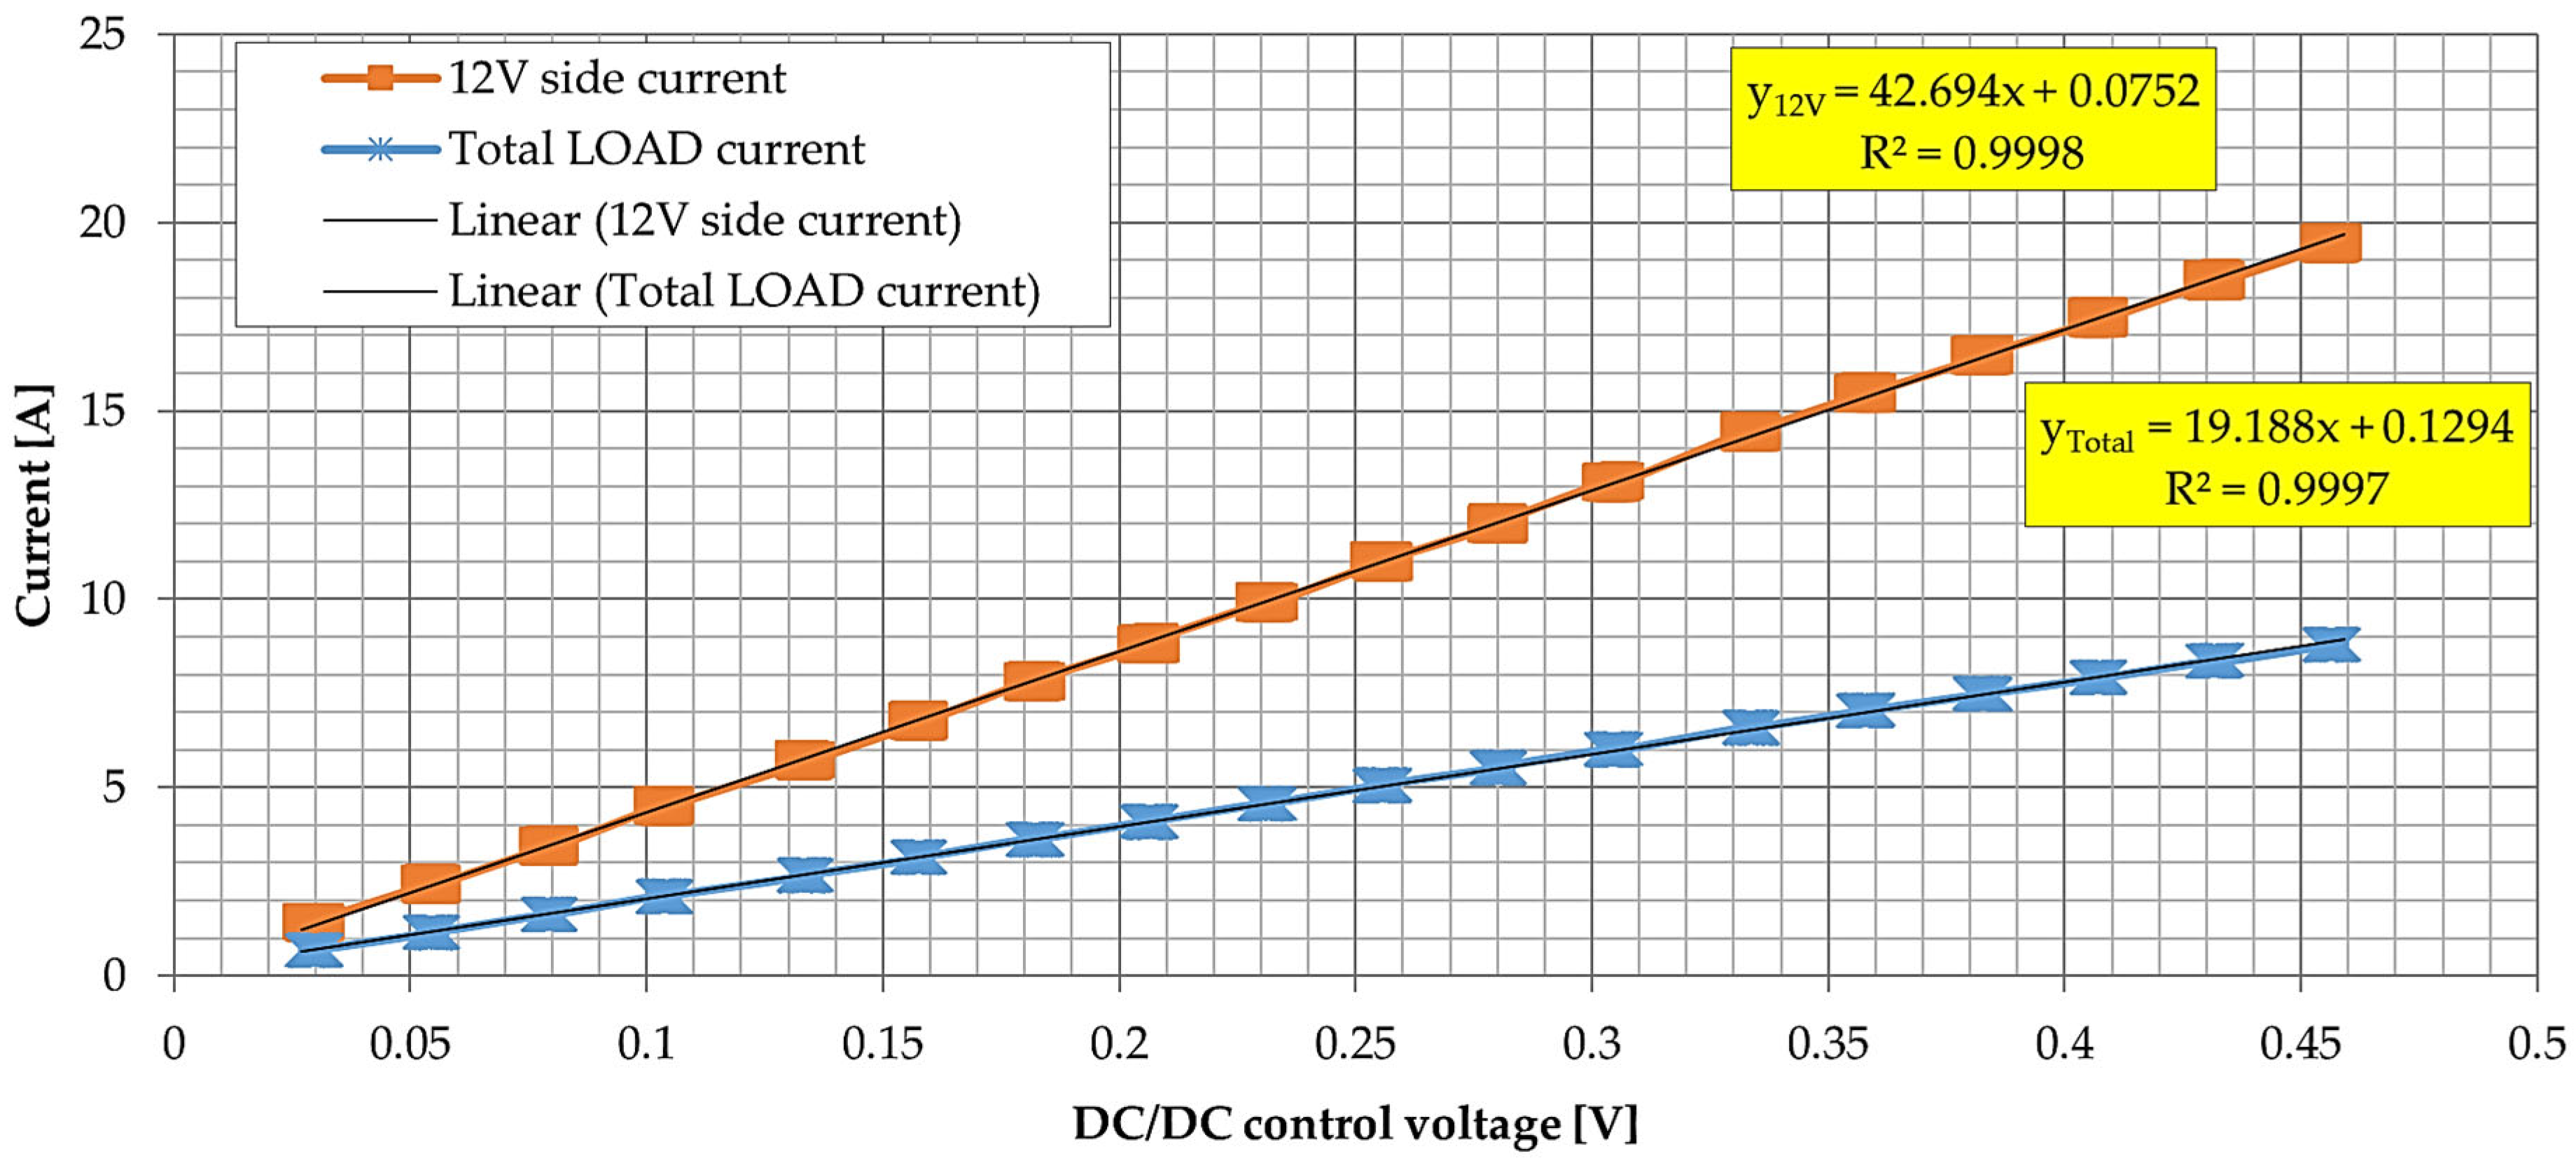
2.2.2. Step Up Measurements (Boost Mode)

In the further configuration, the system was set for tests in the Step Up mode from 12 V to 48 V (Figure 27). After starting the converter in the Step Up mode and controlling 0 V, the power consumption from the 12 V side would be about 0.01 A (below the power supply indication). Load was set to constant voltage (CV) mode with target setpoint of 48 V. Three Maxwell 16.2 V capacitors are connected in series on the high-voltage side. A slight charge of the capacitors was noted, from 0.21 to 0.32 V at the 0 V setting (Figure 28).
The system was disconnected and the current clamps were reset again. We performed 10 V logic inclusion followed by 12 V power (Figure 29).
Then the high-voltage side was charged to 48 V with a current setting between 4 A and 5 A. There was no response from the system (Figure 30). The measurement of voltages from the internal circuit of the converter showed 0 on the high- and low-voltage sides. Logic was reset 2 times.
Next, the ultracapacitors of the high-voltage side were manually charged to 12 V and the system was connected. An attempt was made to charge the 48 V side using the converter. After switching on (without setting—Figure 31), the current consumption from the 12 V power supply is approx. 0.08 A. Initial current consumption from the 12 V line was 6.5 A. The converter setting was 0.125 V. After charging, the setting was removed. Current consumption from the 12 V line without setting was approx. 0.34 A. The voltage of the 48 V line dropped. The system was disconnected and the current clamps on the high-voltage side were reset. A consumption of approx. 0.5 A from the high-voltage side was recorded, without setting and with the 12 V power supply switched off. With the 12 V power supply restored, consumption from the 12 V line was approx. 0.35, and consumption from the 48 V line was approx. 0.44 A.
In the next step, the operating characteristics of the converter in the Step Up mode were tested from the control voltage of 0.025 V with a step of 0.025 V to 0.475 V (maximum range of the power supply 12 V, max 20 A); see Figure 32. The step time was 30 s and started with a charged system and a stabilized system.
Then the load voltage setting was changed from 48 V to 36 V (Figure 33). The operating characteristics of the converter in the Step Up mode from the control voltage of 0.025 V with a step of 0.025 V to 0.475 V (maximum range of the power supply 12 V, max 20 A) were tested. The step time was 30 s and started with a charged system and a stabilized system.
Subsequently, the load voltage setting was changed from 36 V to 24 V (Figure 34). The operating characteristics of the converter in the Step Up mode from the control voltage of 0.025 V with a step of 0.025 V to 0.475 V (maximum range of the power supply 12 V, max 20 A) were tested. The step time was 30 s and started with a charged system and a stabilized system.
The next step presents the determined characteristics of the current, power, and losses for controlling the DC/DC converter in the Step Up operating mode with a voltage reduction from 12 V to 48 V. Figure 35 shows the value of the current flowing through the low-voltage side.
Figure 36 shows the input power and output power for Step Up operation from 12 V to 48 V.
Figure 37 presents the losses of the converter configured in Step Up mode from 12 V to 48 V.
Then presented are the determined characteristics of the current, power, and losses for controlling the DC/DC converter in the Step Up operating mode with a voltage reduction from 12 V to 36 V. Figure 38 shows the value of the current flowing through the low-voltage side.
Figure 39 presents the input power and output power for Step Up operation from 12 V to 36 V.
Figure 40 shows the losses of the converter configured in Step Up mode from 12 V to 36 V.
The last step presents the determined characteristics of the current, power, and losses for controlling the DC/DC converter in the Step Up operating mode with a voltage reduction from 12 V to 24 V. Figure 41 shows the value of the current flowing through the low-voltage side.
Figure 42 presents the input power and output power for Step Up operation from 12 V to 24 V.
Figure 43 shows the losses of the converter configured in Step Up mode from 12 V to 24 V.
Based on characteristics presented in Figure 35, Figure 38 and Figure 41, the final values used in linear equation for calculating the control voltage output in controller software in Step Up mode were:
Output VStep Up = (Desired I + 0.25)/41.817,
The calibrated DC/DC converter was used to carry out bench tests of the battery and ultracapacitor, which is presented in Section 2.3.

2.3. Test Bench

The test stand enables control of the power distribution between the battery and the ultracapacitor, the technical data of which are presented in Table 2. The Texas Instrument LM5170EVM-BIDIR 12 V/48 V converter was used for the system, the calibration of which is discussed in Section 2.2. For the purposes of the conducted research, four LiFePO4 type cells [92] (nominal voltage 13.2 V, in 4s1p configuration) were connected in series to the low-voltage side, while a package of three ultracapacitors BMOD0058 E016 B02 [93] with a capacity of 58 F and a voltage of 16 V each was connected to the high-voltage side (total voltage of the ultracapacitor package at full charge was ~48 V). Figure 44 shows a picture of a system in which the battery and the ultracapacitor have been connected together in a semi-active topology. The photo also shows the monitoring and control application prepared in LabVIEW. The test stand enables recording the parameters of the HES and programming the loading and loading cycles of the storage. The charging and load current values are controlled by connecting to the Ethernet network with the TTI LD400 programmable power supply. The system enables the recording of the following values: voltage (battery and ultracapacitor), current (battery, ultracapacitor and total current loading the system). In addition, the temperatures at the terminals, the housing and the ambient temperature are recorded using thermocouples of J type. The use of the NI LabVIEW programming environment and the CompactDAQ measurement interface allows for a quick adjustment and expansion of the number of station registration channels for specific measurement tasks. Measurement data are saved in the form of TDMS files convertible to formats acceptable by Excel or Matlab software.
The bidirectional converter (Figure 3) makes it possible to connect sources with different voltage values. The use of an external controller in the open loop to control the operation of the converter enables greater flexibility in connecting sources. The operation of the converter was controlled by means of a directional signal (work in Step Up or Step Down mode) and an analog voltage signal setting the value of the current sent in a given direction. The converter also has the option of digital PWM signal control.
The National Instruments myRIO programmable controller was used to control the operation of the converter. The myRIO controller is equipped with FPGA and real-time (RT) circuits, programmable in the LabVIEW environment.
The presented converter control system is based on proportional controller in the open loop with additional conditions limiting the minimum set current (the converter is inactive until the calculated set current exceeds 0.5 A). In addition, the system has a minimum and maximum voltage limitation of the low-voltage side (LiFePO4 battery side), limiting the set current in order to protect the battery against deep discharge and overcharging. The value of the set current flowing through the converter is calculated in proportion to the difference between the measured voltage on the high-voltage side (ultracapacitor side) and the specified threshold voltage of the ultracapacitor.
The DC/DC converter control system is completely independent of the system and measurement and control software of the energy storage test stand.
The programmable FPGA of the myRIO controller enables the implementation of various standard types of control (e.g., PID controller) as well as other, more complex control algorithms using, among others, the extended Kalman filter. The control can be performed using registered voltages or by measuring the current flow (after connecting the additional current sensors to myRIO).
The developed stand was used to carry out tests at different power distribution values, as presented in Section 3.1.

3. Results

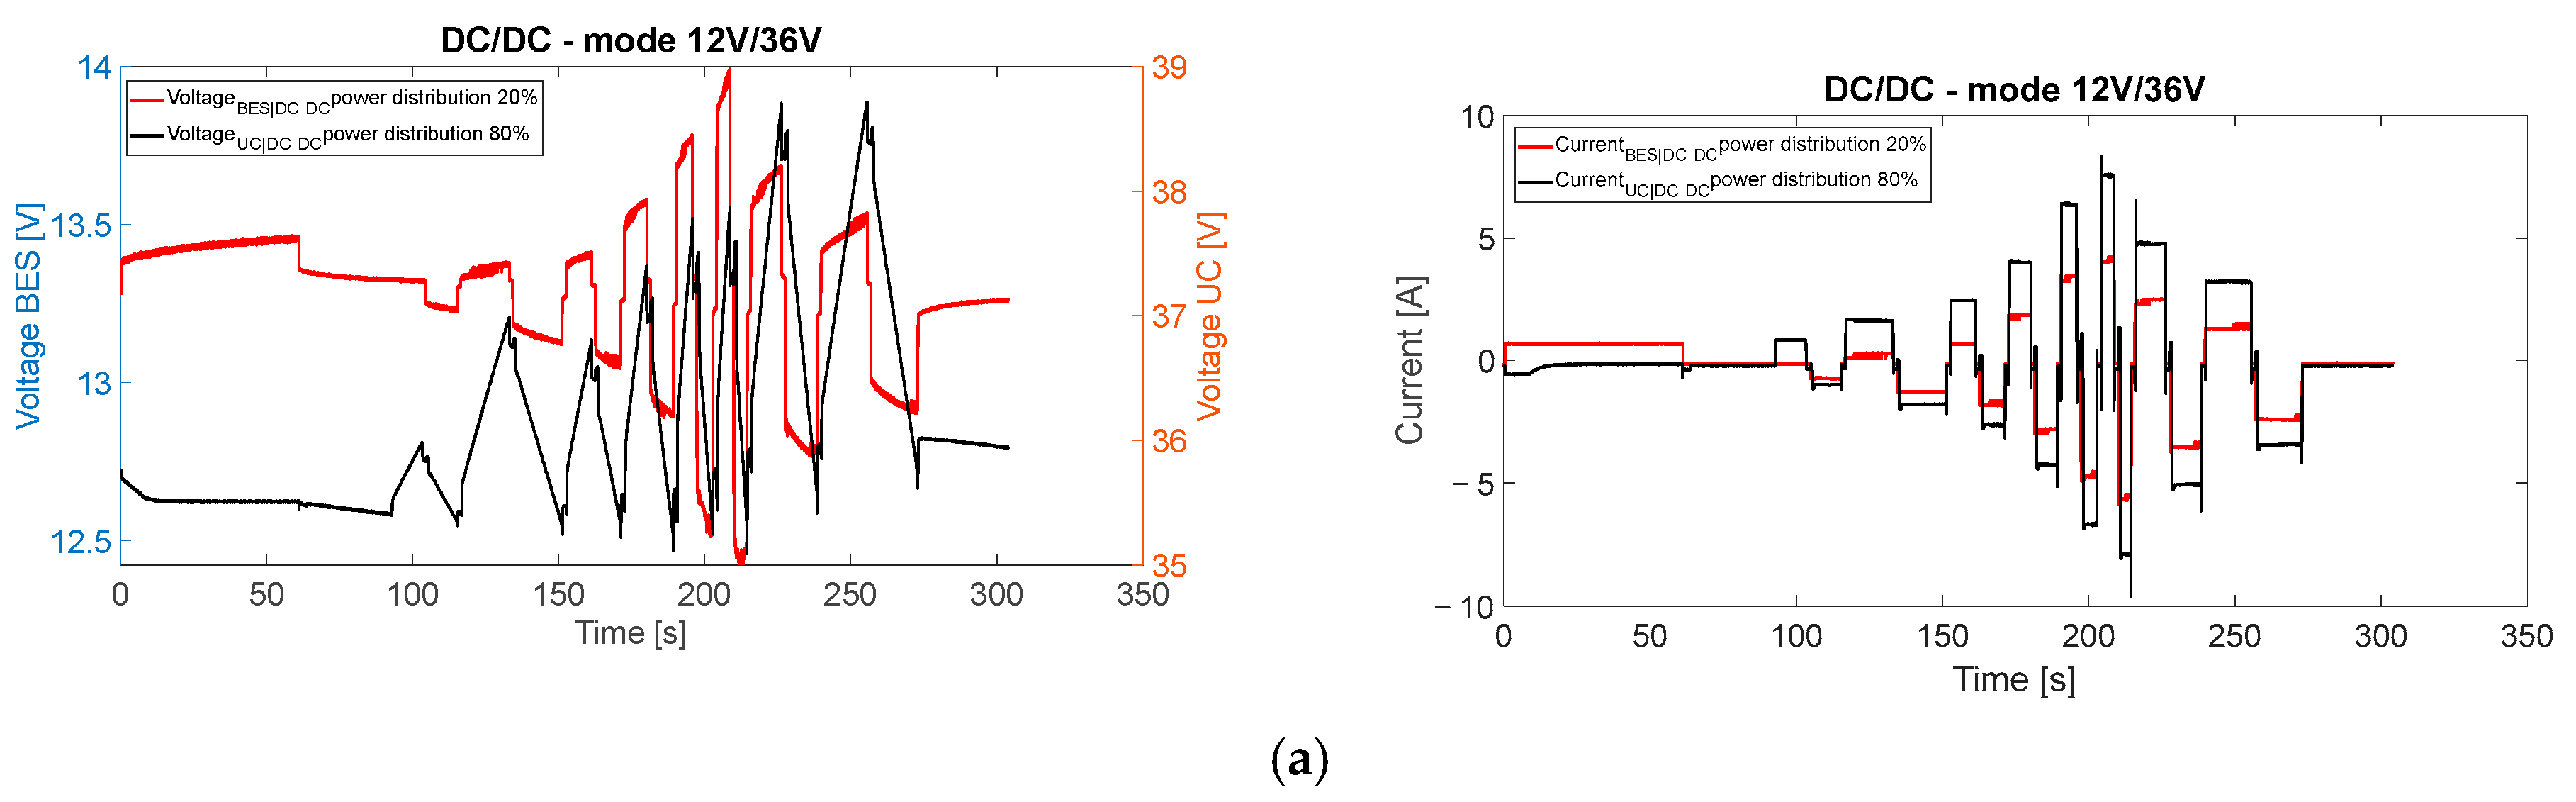
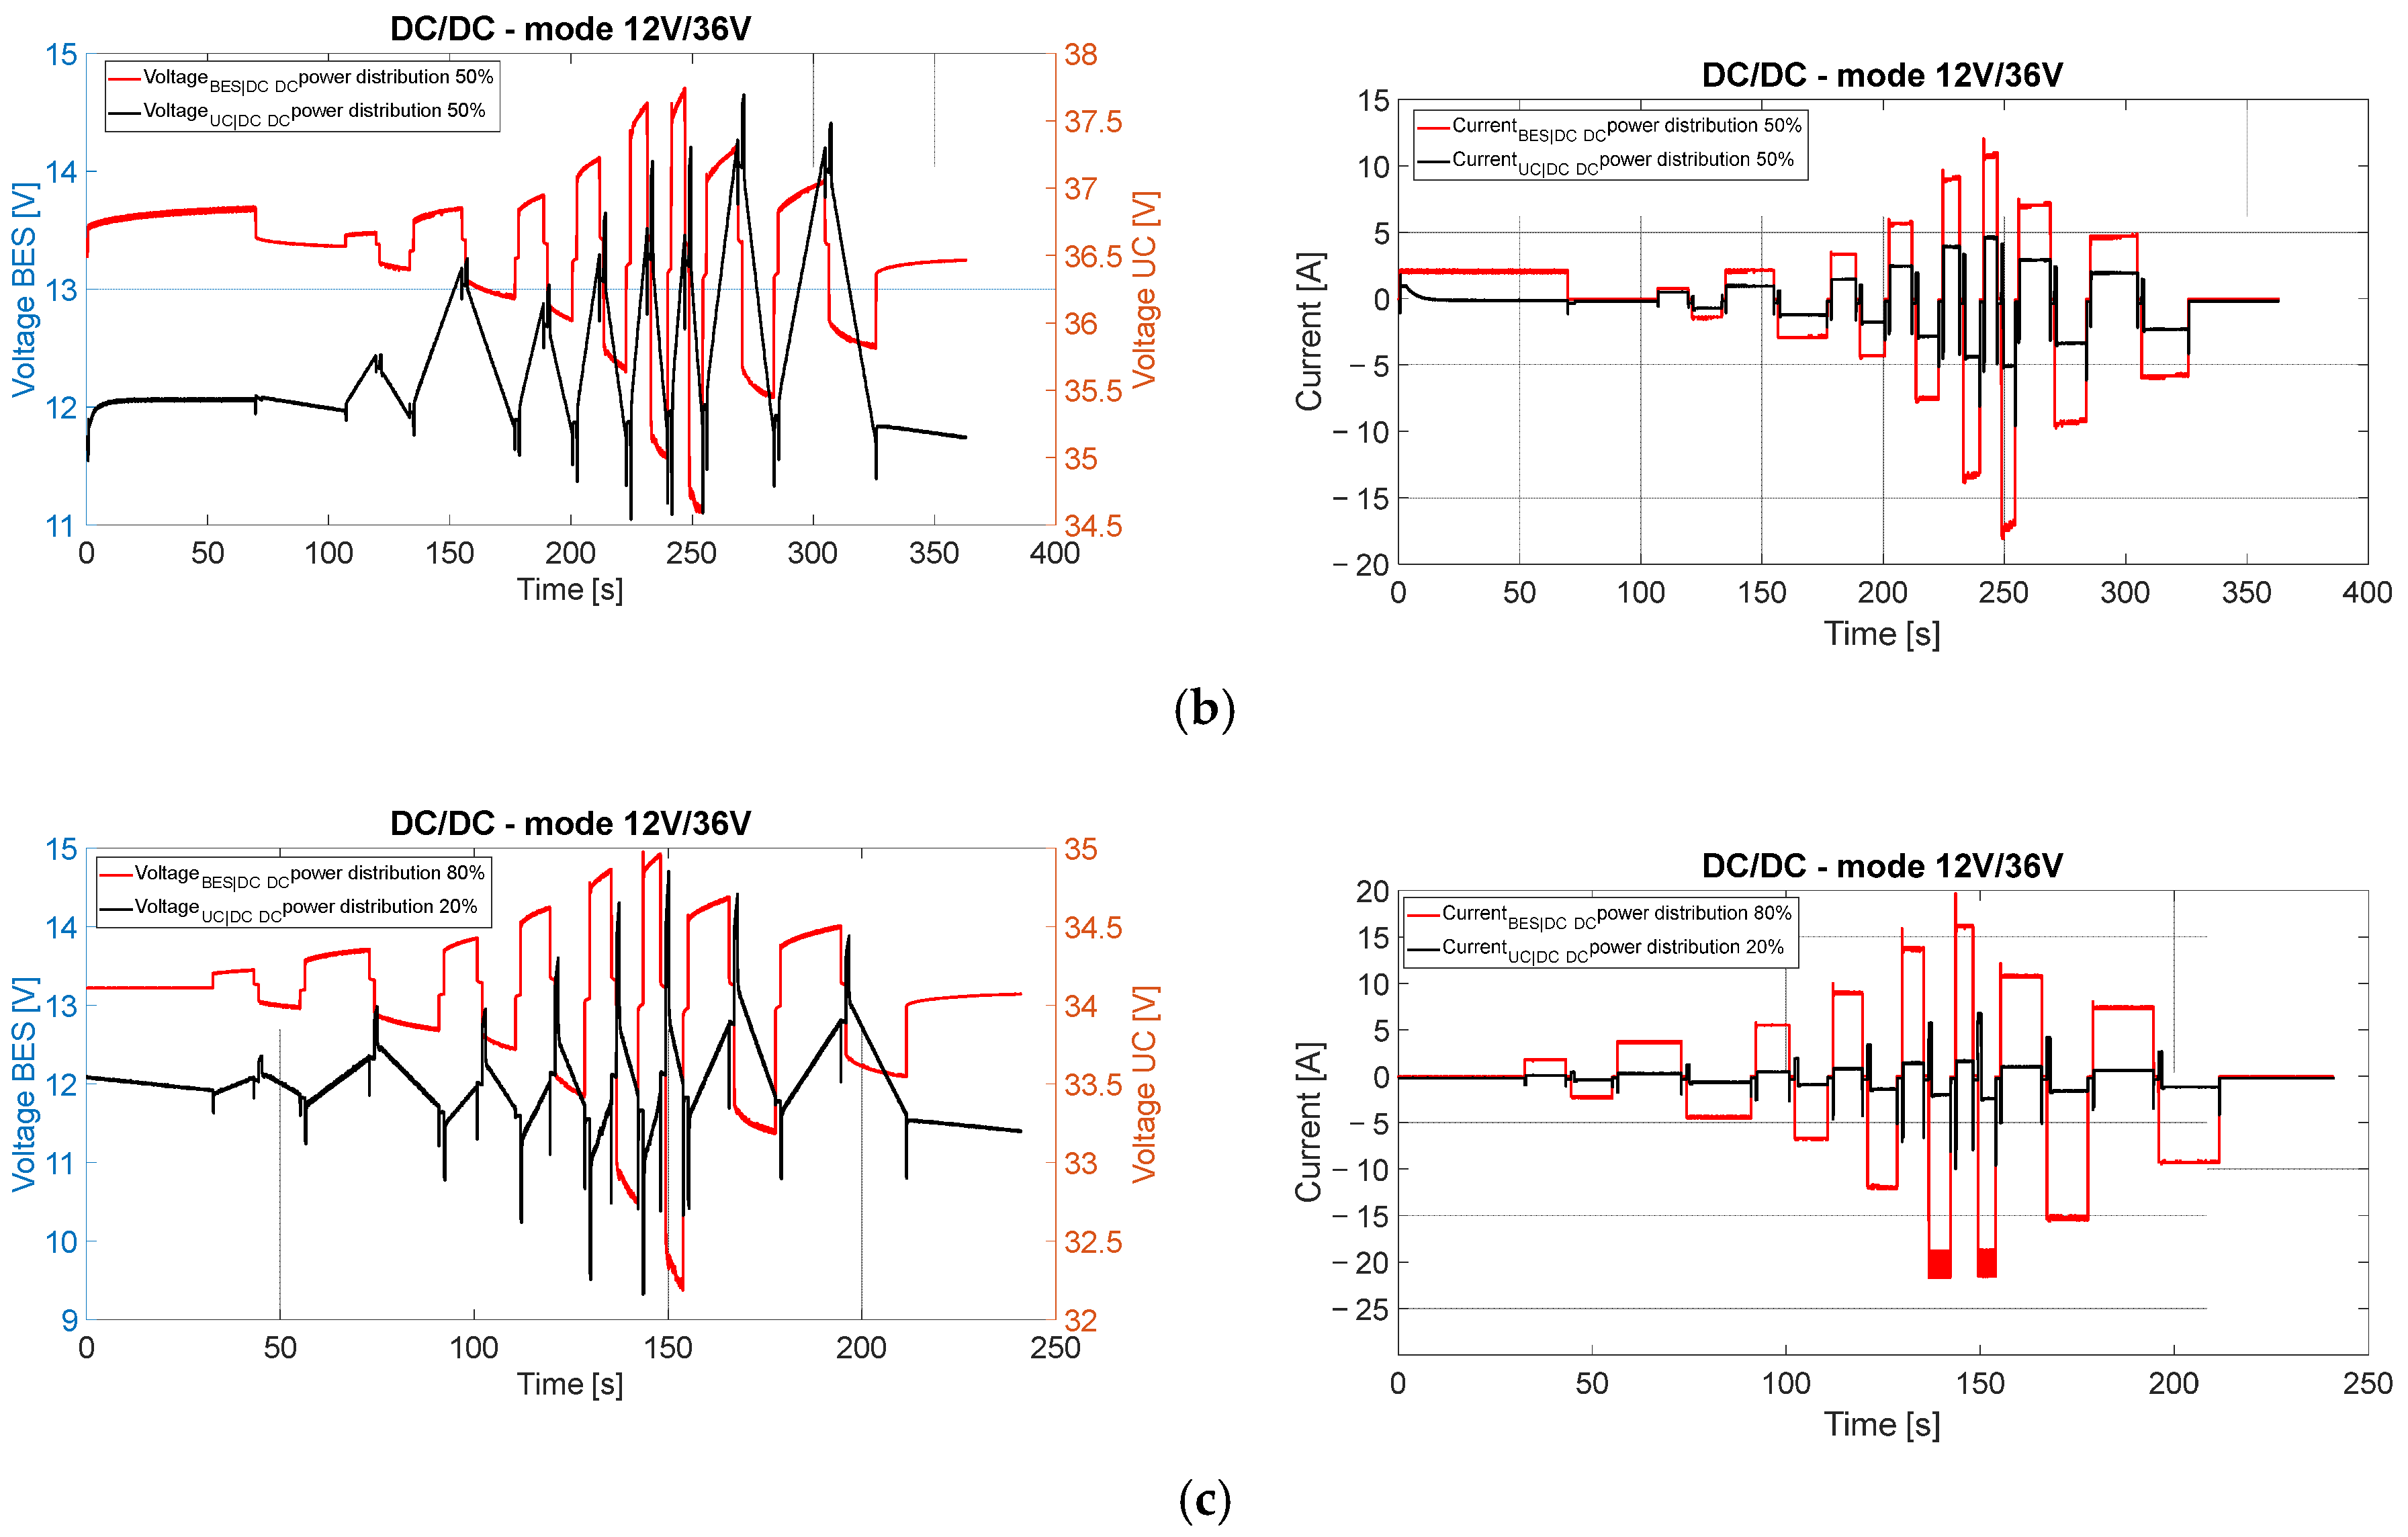
3.1. Experimental Research of Battery–Ultracapacitor System in a Semi-Active Topology with a DC/DC Converter

This subsection presents bench tests for the battery–ultracapacitor system, in a semi-active, cascade topology with a DC/DC converter configured in 12 V/32 V mode.
The innovation presented in the article is the appropriate selection of the nominal voltage UC, appropriately higher than the voltage of the DC bus (see Figure 1d), so that the converter works only in the high-efficiency CC mode with full power, bypassing the CV mode in which the power is deficient, and efficiency decreases.
In order to limit the reduction of losses, the nominal input and output voltages from the converter were selected so that the difference was not too large, as it usually translates into a decrease in efficiency, which was shown in works [82,83,84,85,86,87,88,89,90].
The power distribution was determined on the basis of the current value set from the electronic load (discharging current) and from the power supply (charging current). The myRIO controller controlling the operation of the DC/DC converter monitored the current flowing in and out of the cell.
The control between the input of the DC/DC converter and myRIO was carried out by means of two signals (signal 1 digital TTL—0–5 V responsible for selecting the operating state of the converter Step Up/Step Down, signal 2 analog voltage where the voltage was proportional to the current consumed/transmitted by the converters), which is presented in the schematic diagram in Figure 45.
Utilization of UC should be aimed at reducing the stress on BES. The further the SoC of BES deviates from the efficient middle range (20–80% SoC), the more the usage of UC should be increased. Given the characteristics of the DC/DC converter, the UC utilization at low currents should be limited due to decreased efficiency, which was also noted in the work [77]. Furthermore, utilization of UC in specific exploitation conditions should also be considered, i.e., intentional charging the UC to its full, if high electric load is expected next (for example, a vehicle coming to a stop, then starting).
The tests were carried out with power distribution from 10% to 90%. Figure 46 shows selected graphs of voltage and current values for the power distribution: 20% (BES)/80%(UC)—Figure 46a, 50%(BES)/50% (UC)—Figure 46b, and 80%(BES)/20% (UC)—Figure 46c. As expected, more voltage oscillations are seen with increasing battery load, 9.3–14.9 V (e.g., for 80%BES/20%UC—Figure 46c). From the point of view of durability of LiFePO4 cells, the ultracapacitor should act as a buffer at pulsating current loads [94]. In this configuration, the 20%BES/80%UC split is preferable. In Figure 46a, the pulse current for the battery does not exceed 5.5 A, and the voltage oscillations are low, from 12.4 V to 14 V. Battery life can be extended with this configuration, which has been shown in the work [95]. The studies were carried out for an approximately constant SoC value (SoC = 0.5). In addition, the maximum voltage values (for a single cell not more than 3.6 V, for a package in the 4s1p configuration not more than 15 V) and the minimum voltage (for a single cell not less than 2 V, for a package in the 4s1p configuration not less than 8 V) were set.
The system configured in this way offers large amounts of energy in the voltage range from 12 V (battery) to 36 V (supplied by an ultracapacitor).

3.2. Results Regarding Current Values in Future Research

In the CC charging mode currently discussed in Section 2.1, Section 2.2, Section 2.3 and Section 3.1, where an ultracapacitor module is connected directly to the DC bus in a semi-active connection with the DC/DC converter and the battery (Figure 1d), the processes related to the change of battery temperature and changes in state of health that affect the internal resistance of the battery are not taken into account. Accounting for these processes requires corrections to the CC mode control. In order to reduce losses within the entire system and maintain a sufficiently high efficiency of the DC/DC converter, an appropriate algorithm should be used that takes into account the above degradation processes. Conventional models based on equivalent schemes [30,31], learning methods [35,36], and adaptive methods [96] will be used to develop an appropriate algorithm.
The experimental data obtained in this work will be used in the future in the process of identifying the parameters of models based on equivalent resistance-capacitance (RC) schemes [97,98,99] which describe the dynamics of the cell.
Based on the change in parameters describing the change in battery dynamics [32] (i.e., activation polarization, concentration polarization, change in internal resistance, the change in temperature, and the total heat flux released [100]) as well as the change in charge over time and the change in state of health (SoH), the status will be estimated [35]. With the use of resistive-capacitive (RC) and inductive elements, the parameters of the ultracapacitor will be identified based on the equivalent diagram of the ultracapacitor. In [41], the authors demonstrated that RC models are useful for modeling ultracapacitors and HES based on battery and ultracapacitors. In the process of identifying the parameters to find the minimum of the objective function, which is the minimization of the mean square error values (MSE), as presented in [101], constituting the difference between the experimental data and the vector of unknown parameters from the equivalent scheme, the following algorithms will be used: Levenberg–Marquardt [102,103], Kalman filter [96,102,103] and algorithms using neural networks [101,104,105]. Among the adaptive methods, special attention should be paid to the non-linear, extended Kalman filter (EKF), used as an observer for state estimation [96]). As far as the neural networks are concerned, particular focus should be directed to recursive neural networks (RNN), i.e., nonlinear autoregressive exogenous/nonlinear autoregressive moving average with exogenous (NARX/NARMAX) [101], long short-term memory (LSTM) [106], and convolutional neural networks (CNN) [35,36] for SoH estimation).
On the basis of experimental data, in addition to the correction of the CC charging mode for the DC/DC converter in an HES for the model described by the equations of state, as presented in [96], operating parameters will also be estimated, such as open-circuit voltage (OCV), internal resistance, as well as state of charge (SoC) and state of health (SoH). The state vector will be estimated and updated online on a regular basis from a multidimensional system of state equations, based on the knowledge of the current input values, including the value of the total load current and outputs, charging current in CC mode, terminal and housing temperature of the cell, voltage, and model of the tested system (the model approach based on the equivalent scheme, the so-called RC, from the group of conventional models will be used for this purpose). In the case of parametric models, models based on recurrent neural networks (e.g., NARMAX/NARX, LSTM) will be used. Prediction of degradation changes will come from the fusion of data from the identified parameters of analytical and parametric models for different SoC charge levels, using a non-linear, extended Kalman filter (EKF); similar data fusion for predictive control was carried out in works [34,35,36,38,97,98]. The advantage of using the extended Kalman filter is that the average error value of the measured values and those calculated on the basis of the model should be zero. In future studies, the average error value will be used as the input of the adaptive procedure, correcting the model parameters in order to minimize this error. Thanks to this procedure, the up-to-date information on the current values of model parameters will also be available (identification of model parameters, online), which in the next steps will be used to determine the non-linear characteristics of the model parameters identified in real time on the basis of the previously adopted equivalent scheme, which was presented in [101,107]. The extended Kalman filter will be implemented in the measurement and control circuits as an algorithm in the application for monitoring and controlling the DC/DC converter, prepared in the LabVIEW environment, in a cascade, semi-active topology (Figure 1d).
It is worth noting that research is currently being conducted around the world on the fusion of data from various models for HES. The work [108] presents the use of analytical models together with genetic algorithms for modeling and controlling the power distribution in the battery–ultracapacitor system through a bidirectional DC/DC converter in a semi-active connection in a dynamic cycle, e.g., Worldwide Harmonized Light Vehicle Test Procedure (WLTP). Further, in [94] the use of fractional order derivatives for estimation of parameters in an HES based on a battery and an ultracapacitor represented in the equivalent circuit as constant-phase elements (CPE) based on the Nyquist spectroscopic impedance characteristic was presented. A metaheuristic swarm algorithm—particle swarm optimization (PSO)—was used to identify the parameters of the equations of state. For the verification and analysis of the obtained results, e.g., mean squared error (MSE) and root mean square error (RMSE) indices, similar to the assumptions in this project with the difference that in this proposal, the decision was taken to normalize RMSE with respect to 1, i.e., normalized root mean square error (NRMSE). Previous studies presented in [101] have shown that this indicator is more representative for the purposes of conducting analyses. The work [95] presents the operational tests of 124 LFP electrochemical cells, which were aimed at determining the possibility of predicting the change of state of health (SoH) up to 2300 cycles. Similar tests in the Votsch climatic chamber are planned to be performed, with one difference, which is that a group of several LFP batteries and ultracapacitors are to be used in future tests. Paper [109] presents the optimization of power distribution control in a semi-active battery-ultracapacitor system with the hardware implementation for the NI myRIO-1900 controller with PWM signal control of the converter. It should be added that a similar approach to the construction of the control architecture and hardware implementation was assumed in this article, with the difference that the control of the bidirectional DC/DC converter in the CC mode will be based on the CAN/Ethernet network. The National Instruments myRIO programmable controller, equipped with FPGA and real-time (RT) circuits and programmable in the LabVIEW environment will be used to control the operation of the converter. The programmable FPGA of the myRIO controller will enable efficient implementation of the extended Kalman filter. The control will take place using registered voltages and by measuring the current flow (after connecting additional current sensors to the myRIO controller). The proposed structures of non-linear models will be transformed into structural models of state variables, applicable in control systems and algorithms (including predictive control, as presented in [96,107]) with a DC/DC converter in combination with semi-active charging for correction of the CC mode, which is considered in this article.

4. Conclusions

4.1. Conclusions from the Calibration of the DC/DC Converter

Conclusions on the efficiency of the DC/DC converter:
  • In the Step Down operating mode, the control voltage of the converter translates directly into the value of the current transferred to the low-voltage side. The value of the voltage on the high-voltage side has no effect on the value of the current transferred to the low-voltage side.
  • In the Step Up operating mode, the control voltage of the converter also translates directly into the current value on the low-voltage side (consumed current). The value of the voltage on the high-voltage side does not affect the value of the current drawn on the low-voltage side.
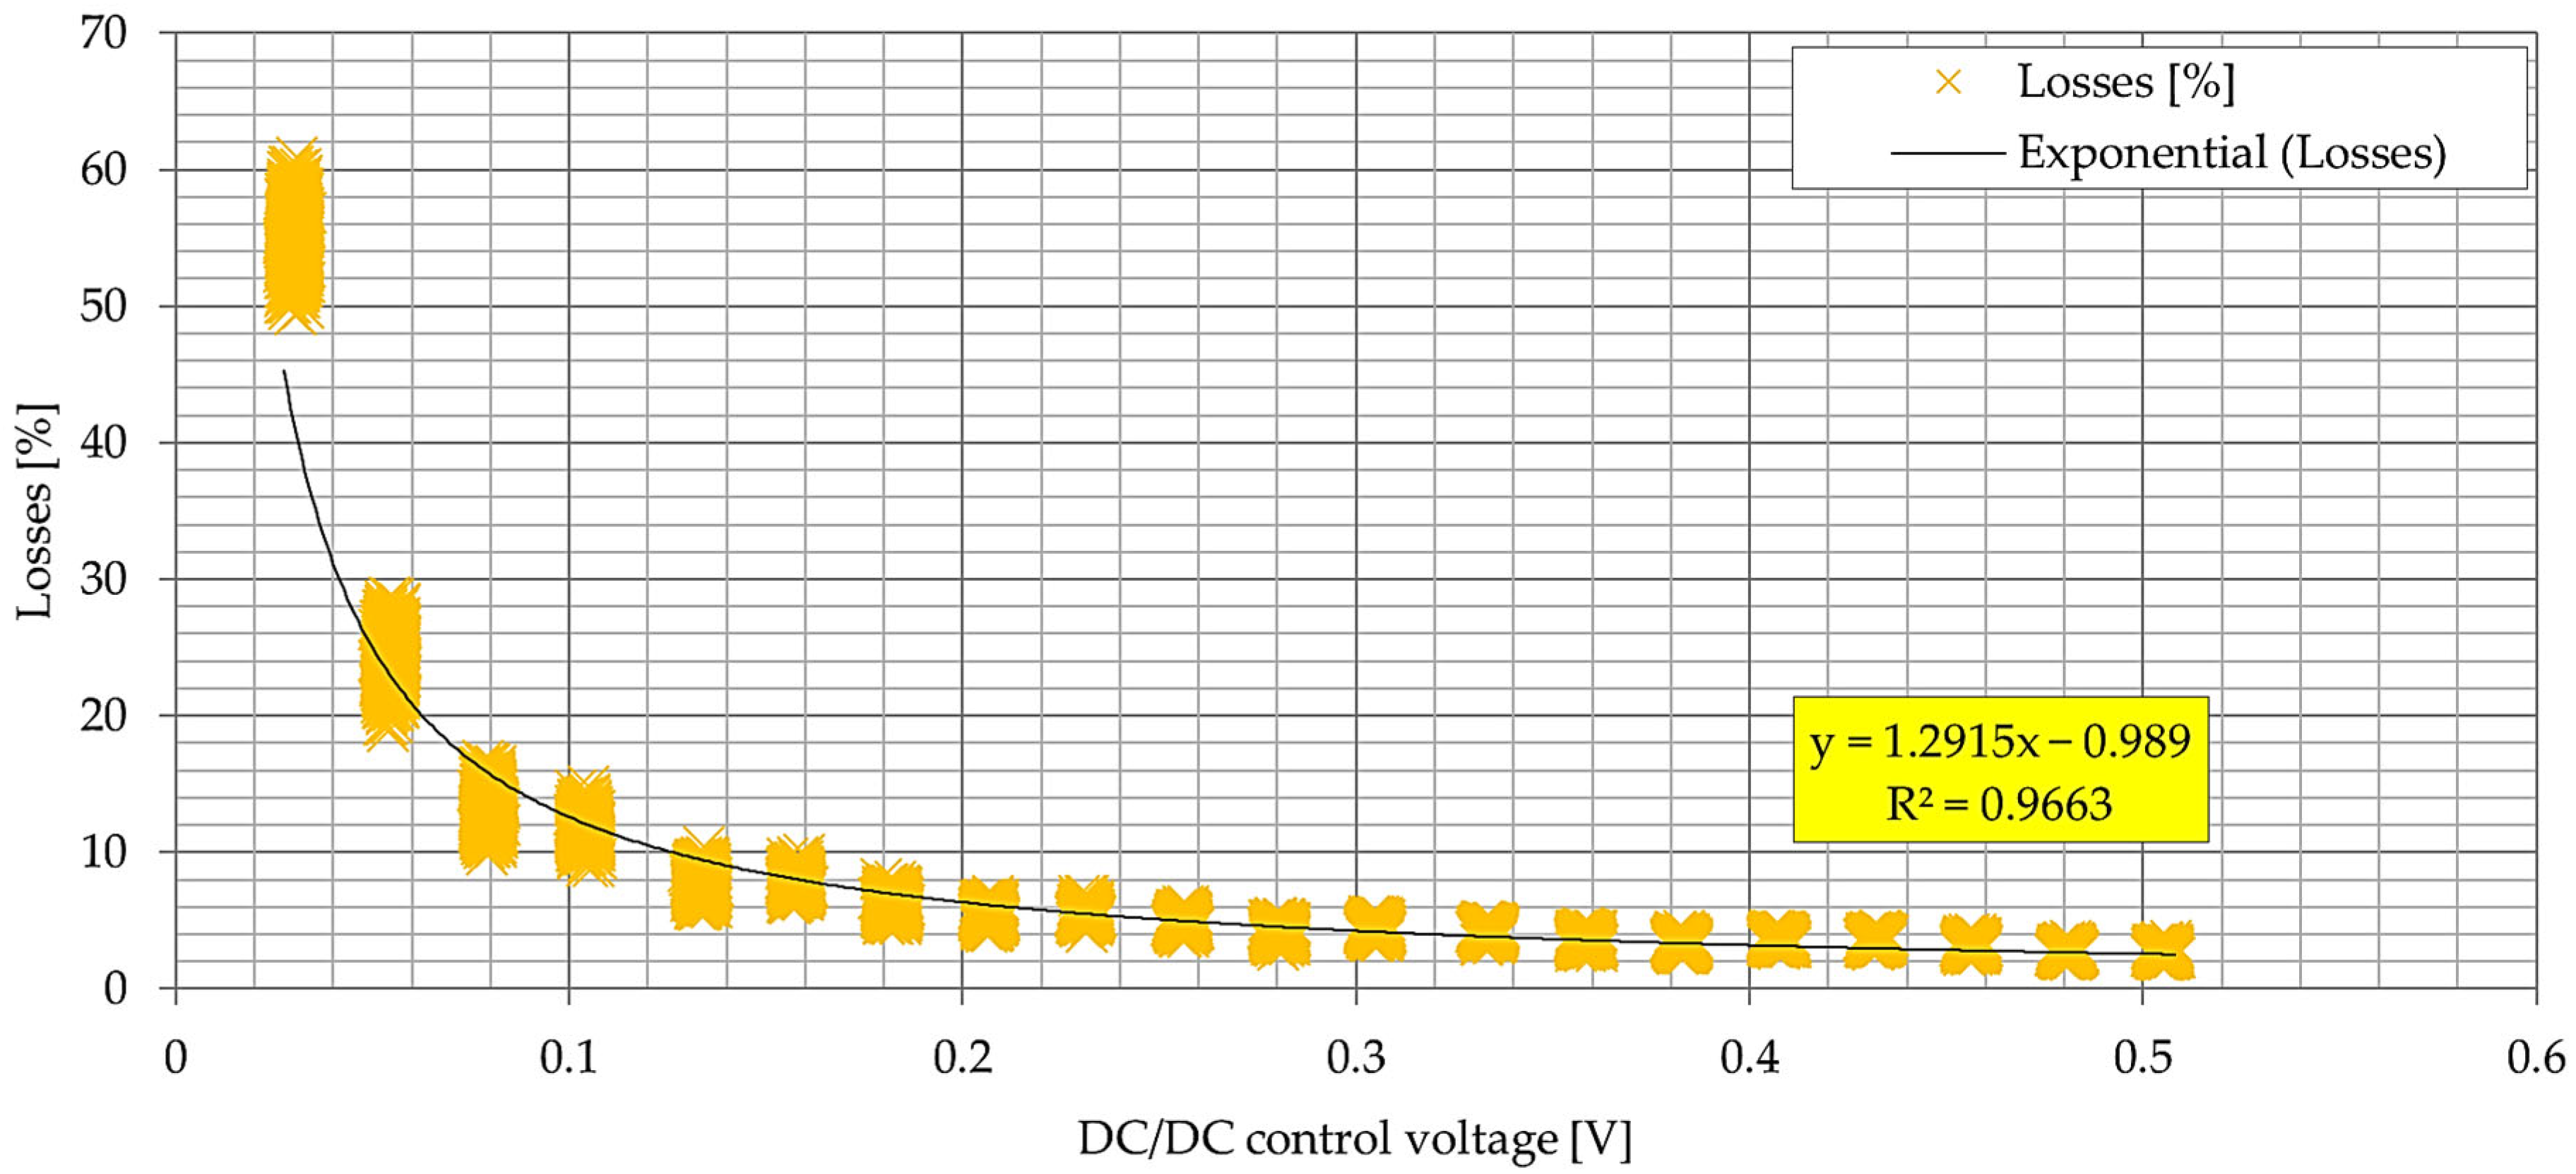
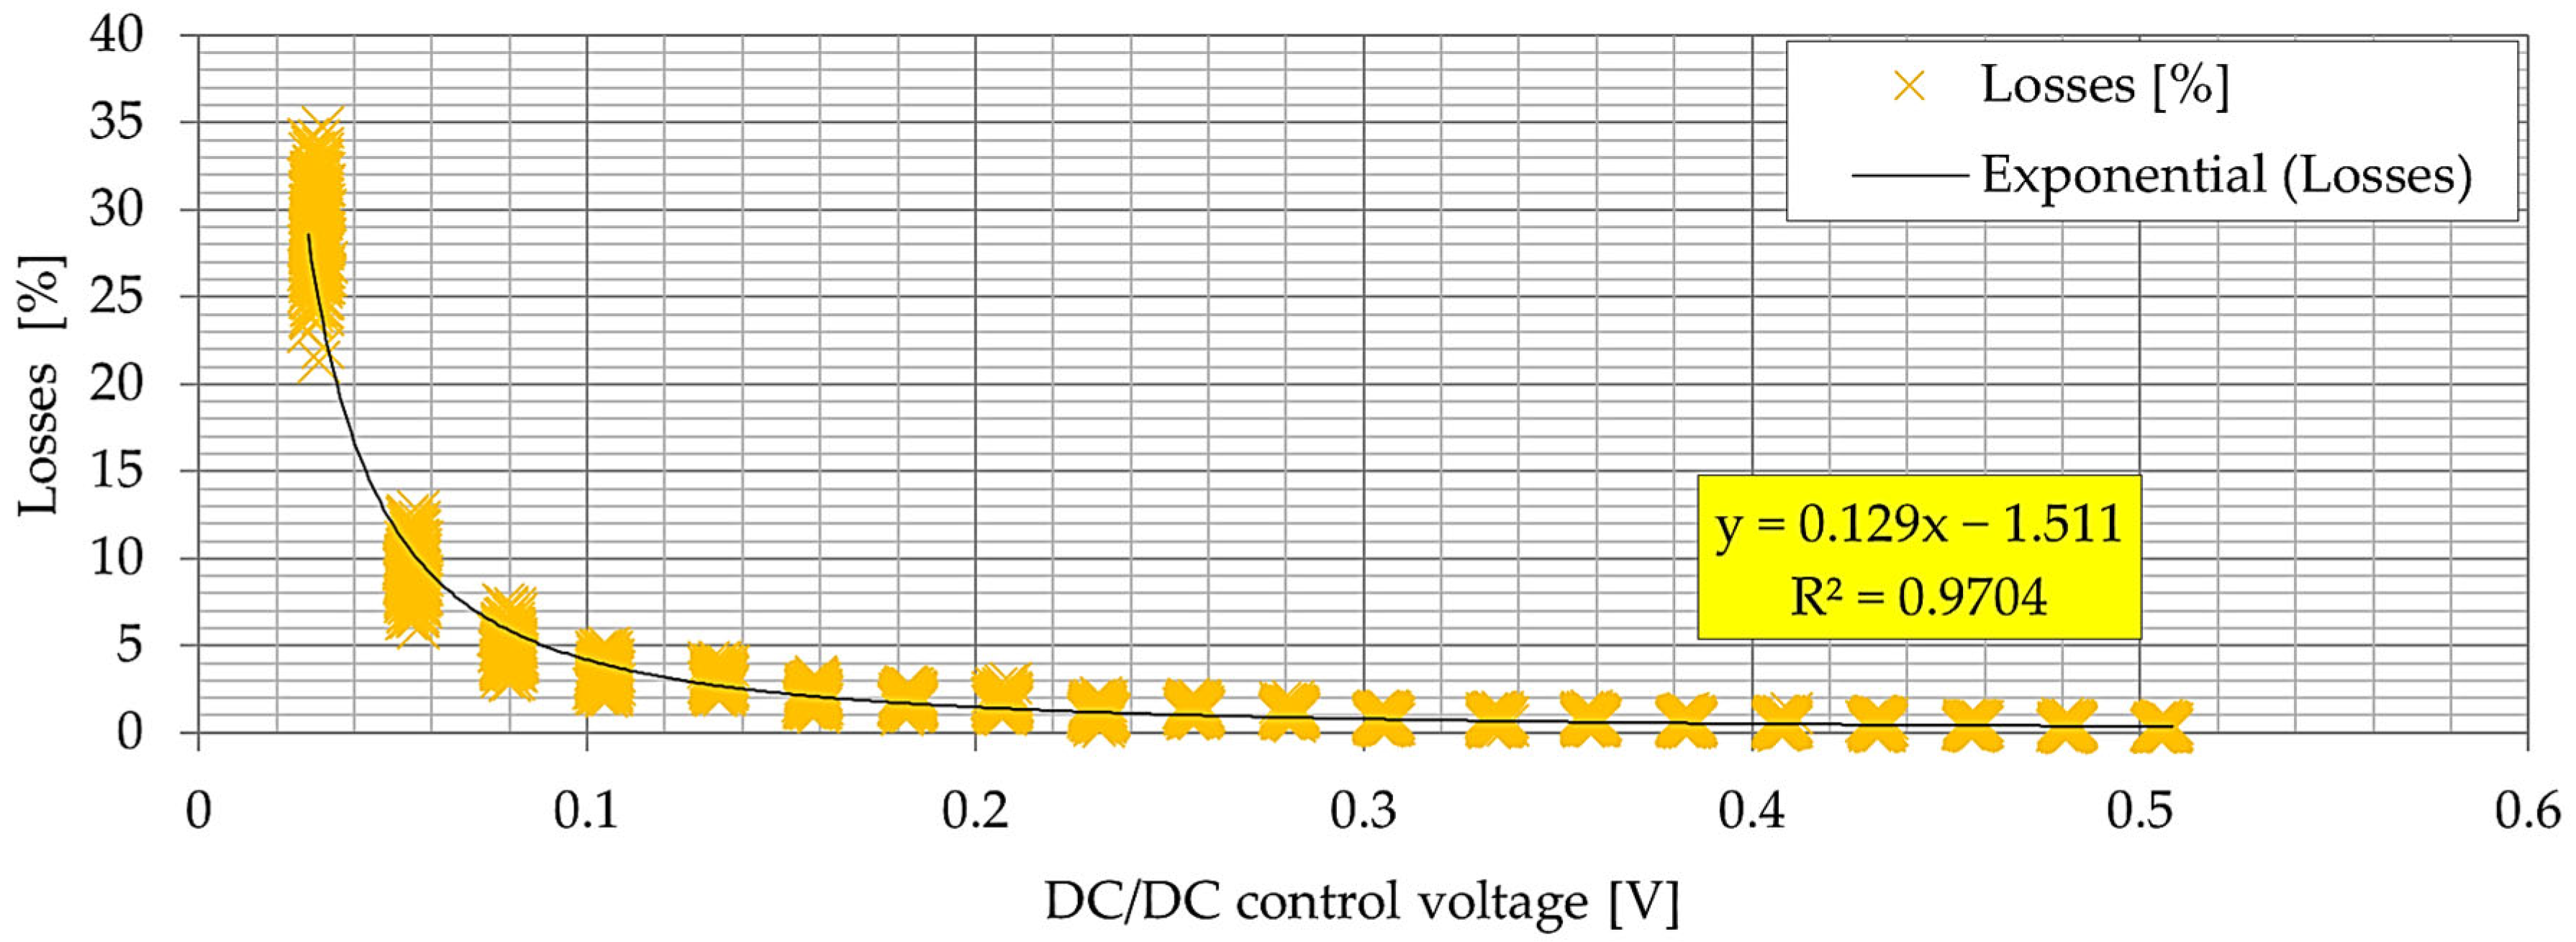
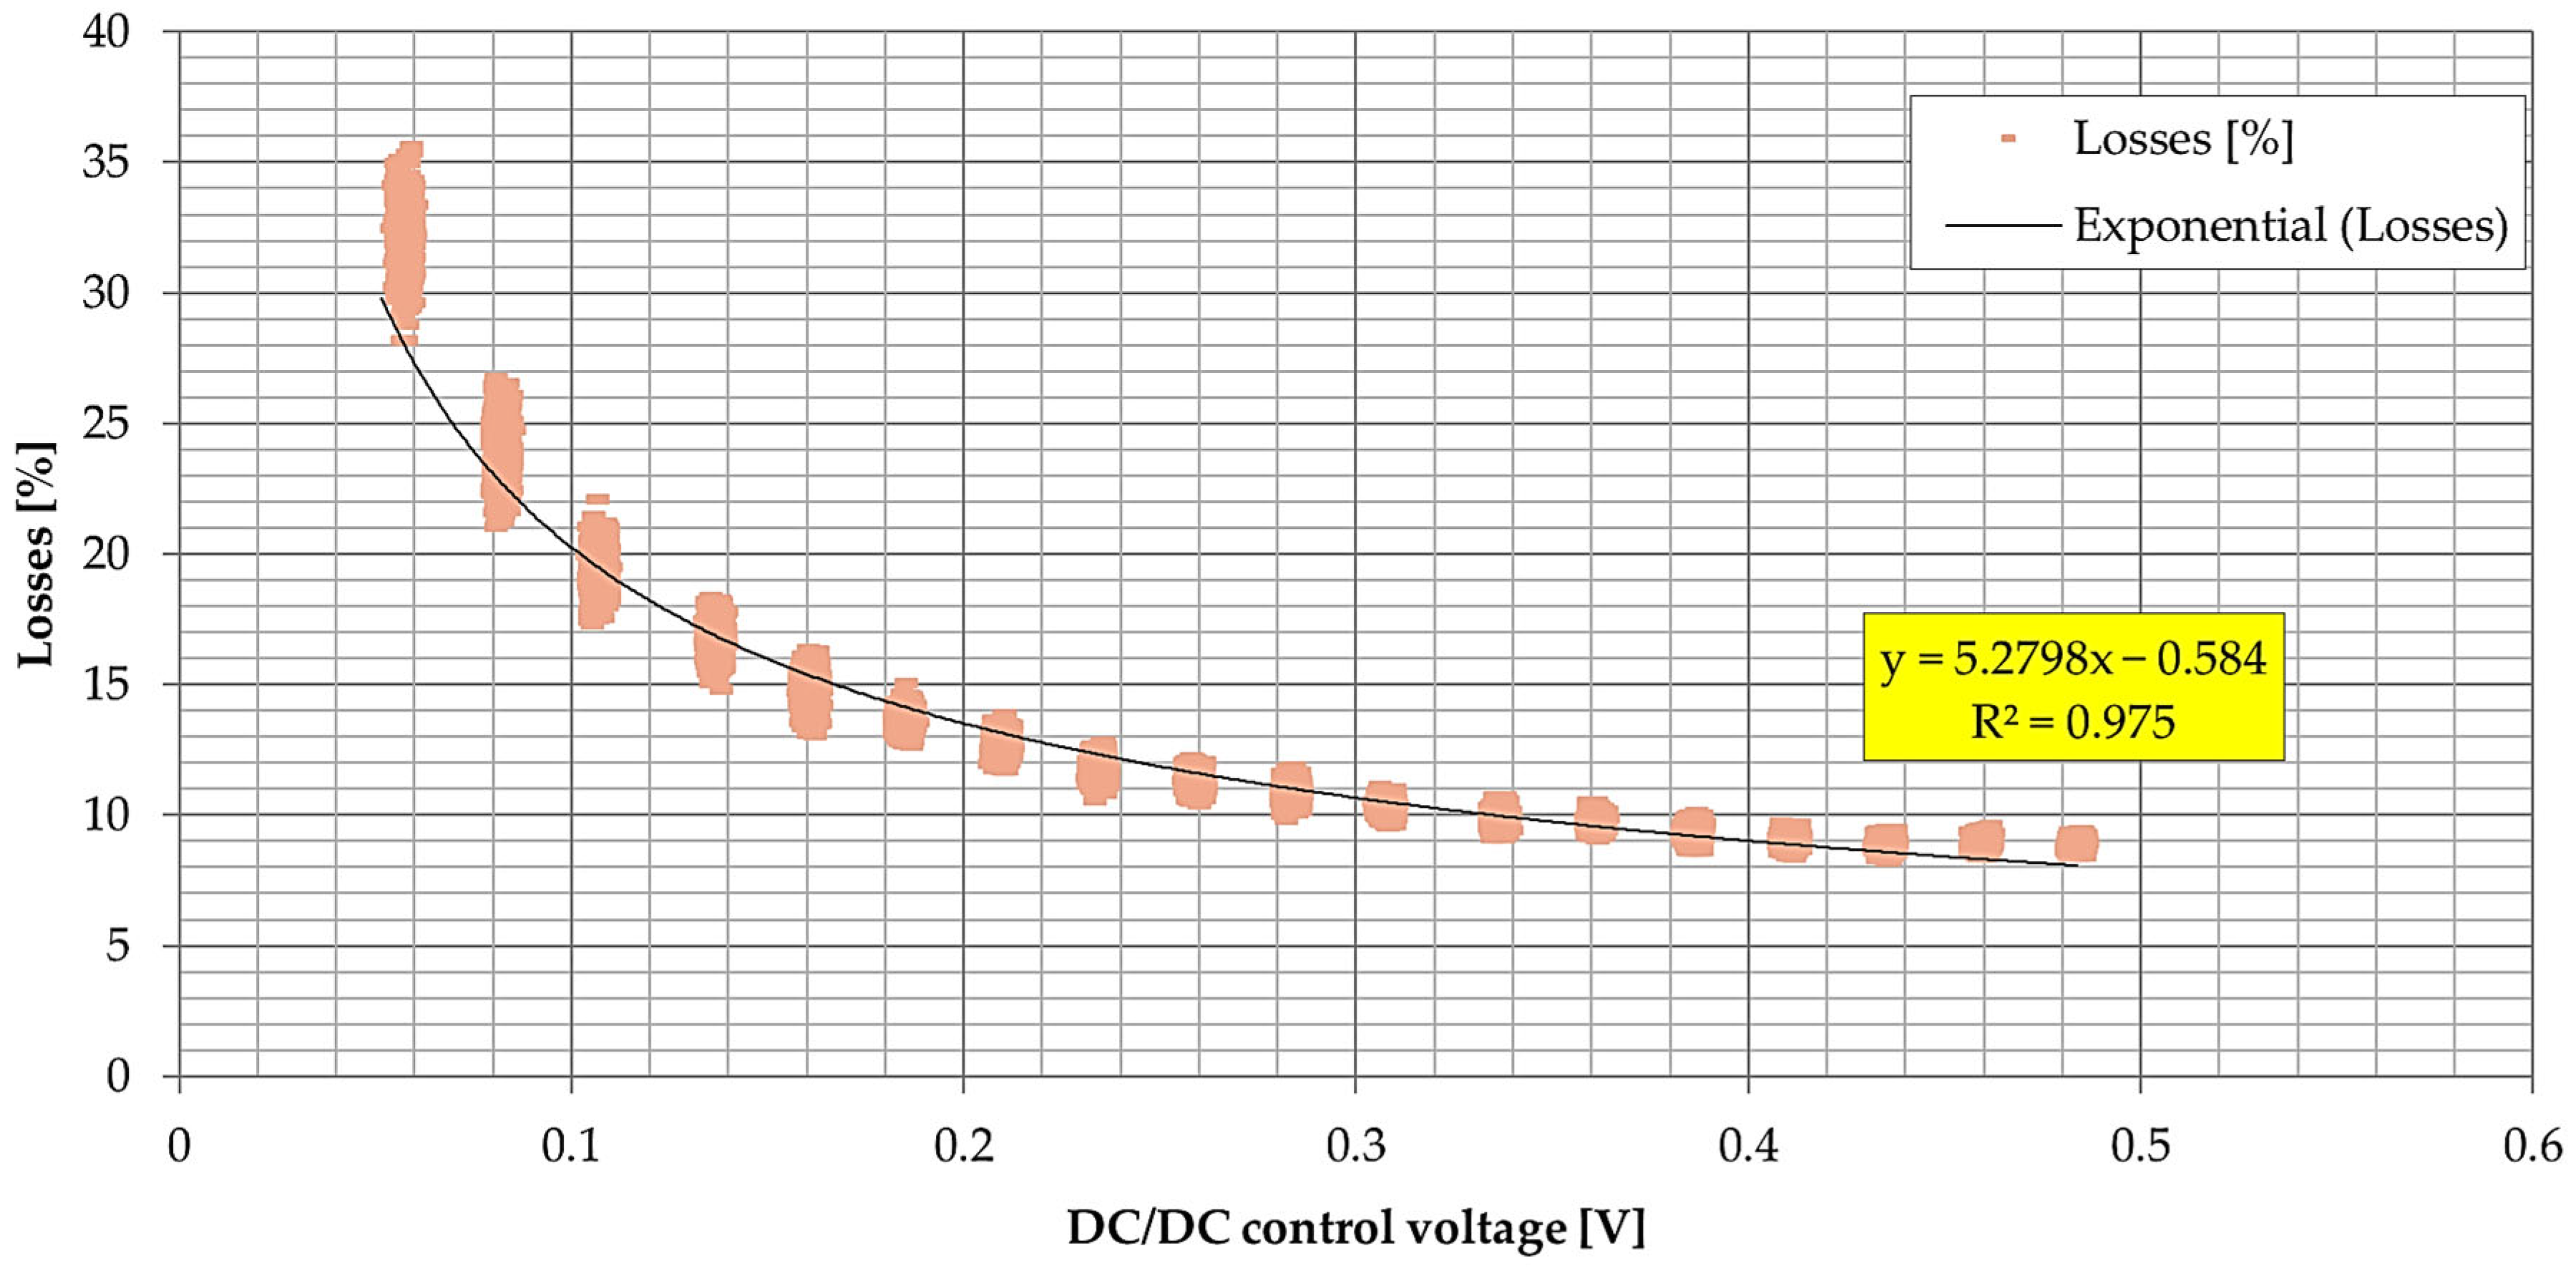
  • Step Down losses decrease exponentially as the DC/DC converter set-up voltage increases. The value of losses slightly increases with the increase of the voltage difference between the sides of the converter.
  • Inverter losses in Step Up mode are more than twice as high as in Step Down mode.
  • Idle power consumption is less than 0.5 A.
Conclusions on the operation of the DC/DC converter:
  • Step Down mode—it is possible to start the converter when the voltage on the low-voltage side is zero; it is recommended that the voltage on the low-voltage side is not lower than 4 V.
  • In Step Down mode, the voltage difference between the low and high-voltage sides must be at least 4 V.
  • Step Up mode—it is not possible to start the system when the high side voltage is zero; a voltage equal to at least the low side voltage is required to start the system.
  • The current consumption of the converter in the idle state, both from the low- and high-voltage side, was observed to be as low as 0.5 A. In the case of energy storage measurements in relaxation, it is recommended to completely disconnect the converter from the circuit.

4.2. Conclusions from the Experimental Research of Battery–Ultracapacitor System in a Semi-Active Topology with a DC/DC Converter

The paper highlights the essential advantages of BES-UC system with DC/DC converter, such as:
  • Higher volumetric power density of the HES in comparison to the battery component only.
  • Possibility of smooth power distribution from 0% to 100% between the battery and the ultracapacitor.
  • Successful limitation of unfavorable battery operating states for pulsed currents exceeding 2.5 C and, as a result, extending the life of the cell, reducing the costs associated with replacing the entire package, e.g., in electric vehicles [10,110,111].
  • Increasing the range of energy use (possible supply of energy to the system when the battery is completely discharged, the only limitation is the range of input/output voltages of the DC/DC converter).
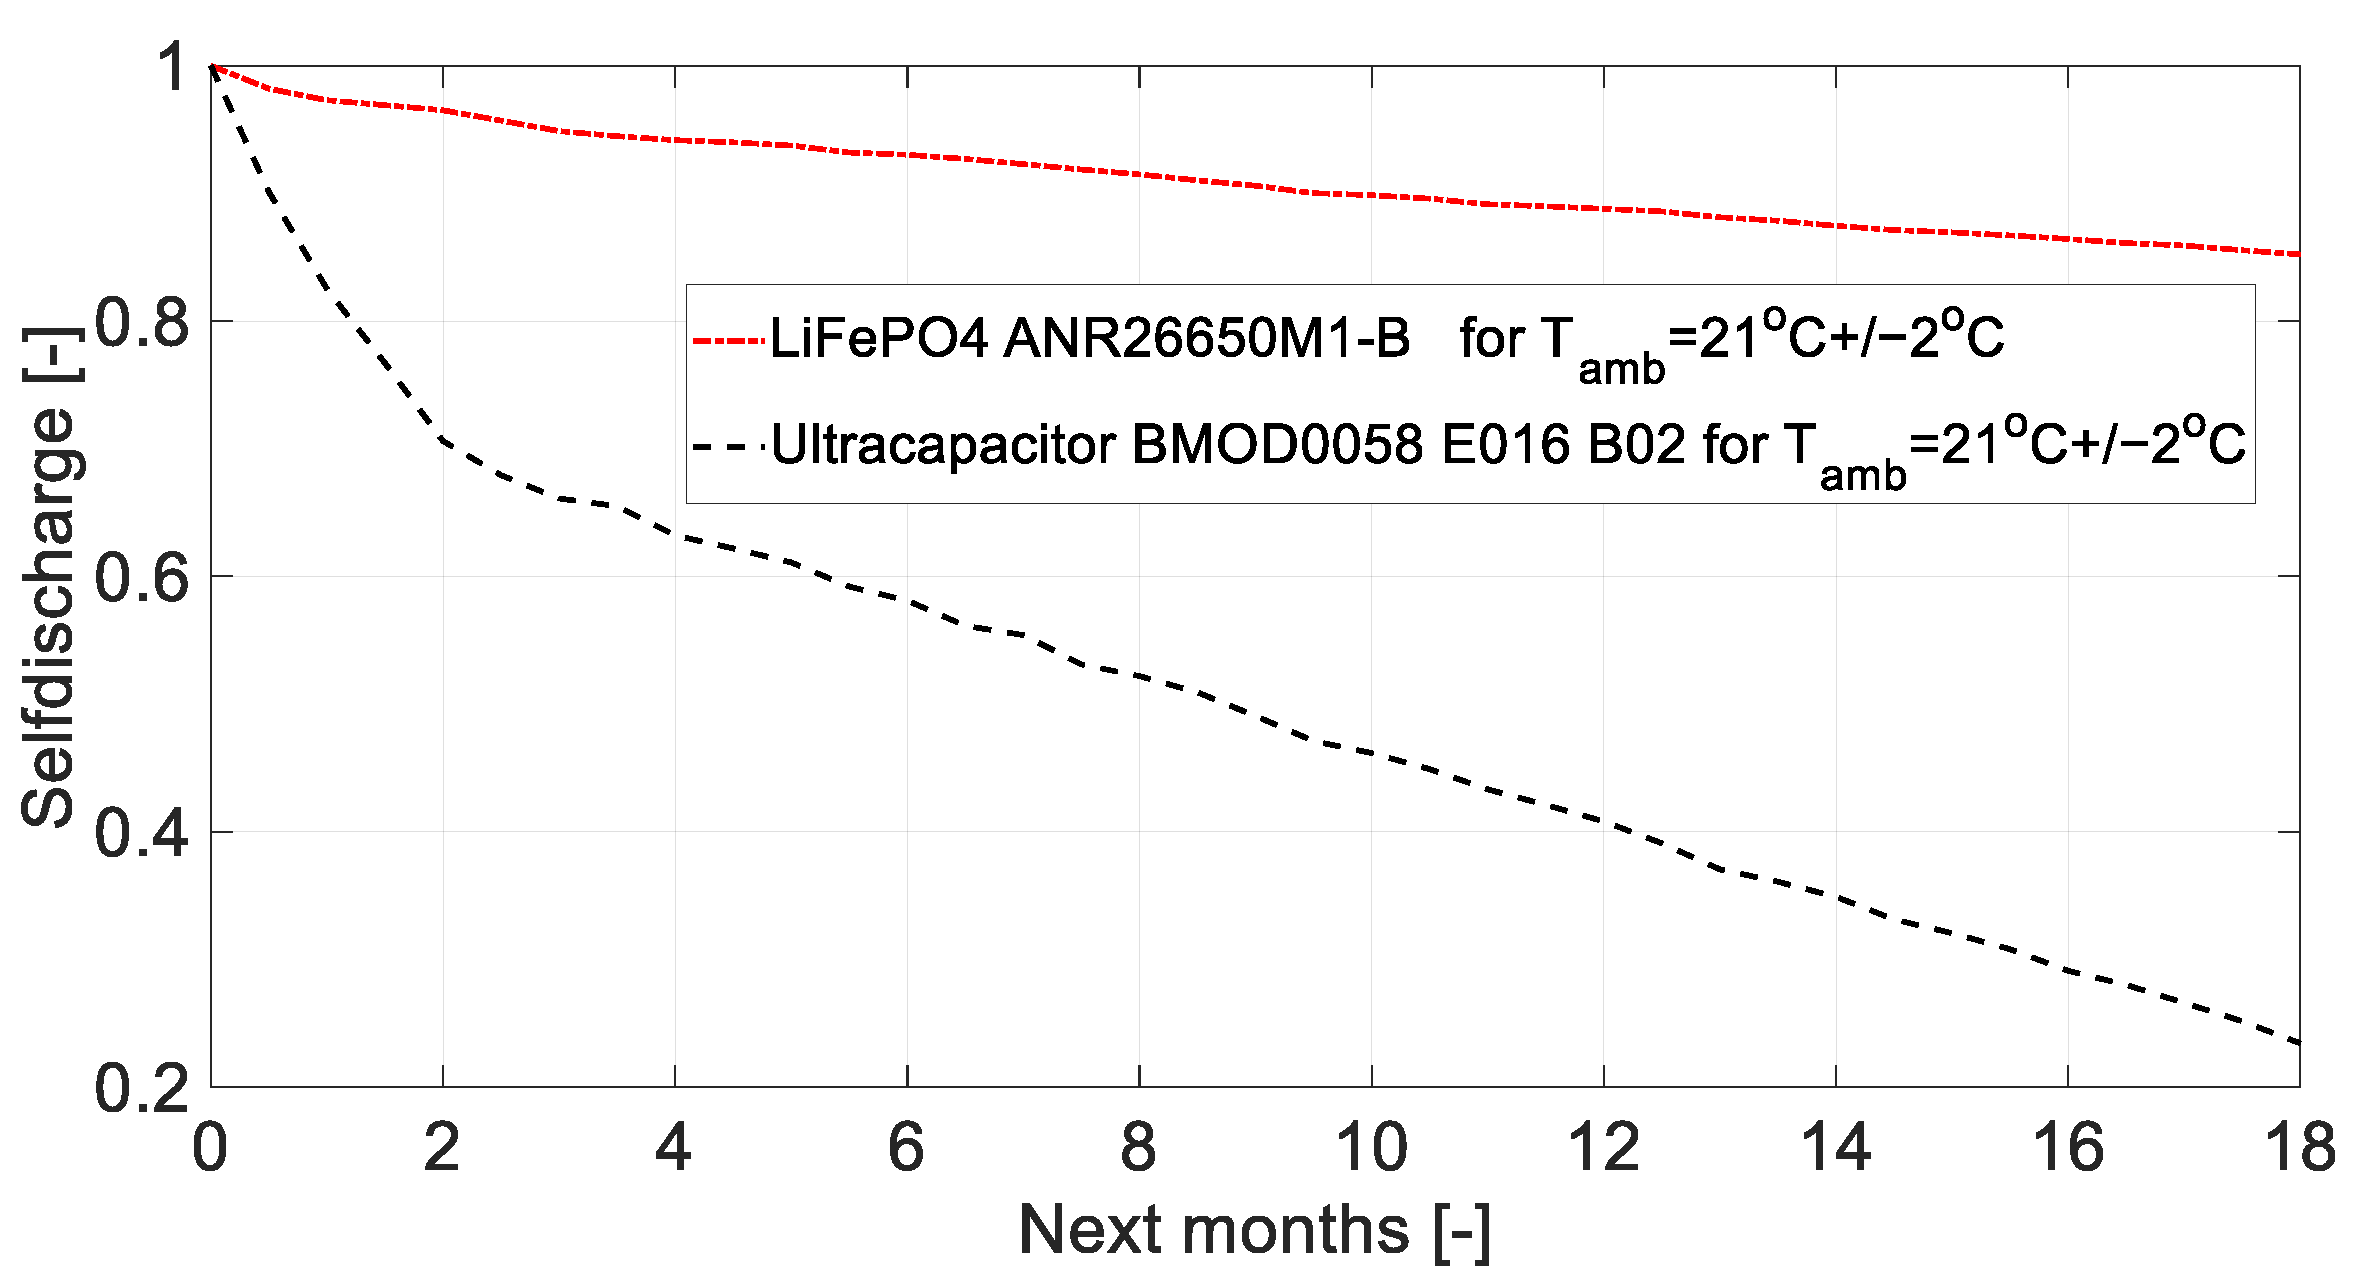
  • Reduction of ultracapacitor self-discharge (the rate of self-discharge is about 80% per year [50]). For batteries, self-discharge does not exceed 30% per year [31]. The self-discharge value for the battery and ultracapacitor considered in this paper is presented below, in Figure 47. Self-discharge measurements were performed twice a month for 18 consecutive months.

Author Contributions

Conceptualization: A.C.; Data curation, A.C. and K.B.; Formal analysis, A.C.; Investigation, A.C. and K.B.; Methodology, A.C.; Software, A.C. and K.B.; Supervision, A.C.; Visualization, A.C. and K.B.; Writing—original draft, A.C. and K.B.; Writing—review & editing, A.C., K.B., P.P. and J.M. All authors have read and agreed to the published version of the manuscript.

Funding

Studies were funded by ENERGYTECH-1 project granted by Warsaw University of Technology under the program Excellence Initiative: Research University (ID-UB), No. 504/04496/1155/45.010700.

Data Availability Statement

Data will be made available on request.

Conflicts of Interest

The authors declare no conflict of interest.

References

  1. The European Green Deal COM(2019) 640 Final—European Commision. Available online: https://eur-lex.europa.eu/resource.html?uri=cellar:b828d165-1c22-11ea-8c1f-01aa75ed71a1.0002.02/DOC_1&format=PDF (accessed on 28 March 2023).
  2. ChaoJi 3.0 Standard. Available online: https://www.vector.com/int/en/know-how/protocols/gbt-27930/#c204146 (accessed on 26 March 2023).
  3. White Paper of ChaoJi EV Charging Technology. In State Grid Corporation of China China Electricity Council Jointly Released June 2020; China Electricity Council: Beijiing, China, 2020.
  4. IEC 61851-23:2014; Electric Vehicle Conductive Charging System—Part 23: DC Electric Vehicle Charging Station. International Electrotechnical Commission: Geneva, Switzerland, 1906.
  5. Transport GHG Emission in EU. Available online: https://www.consilium.europa.eu/en/infographics/fit-for-55-afir-alternative-fuels-infrastructure-regulation/ (accessed on 25 March 2023).
  6. Directive (EU) 2018/2001 of the European Parliament and of the Council of 11 December 2018 on the Promotion of the Use of Energy from Renewable Sources. Available online: https://eur-lex.europa.eu/legal-content/EN/TXT/PDF/?uri=CELEX:32018L2001&from=EN (accessed on 24 March 2023).
  7. Revision of the Renewable Energy Directive: Fit for 55 Package. Available online: https://www.europarl.europa.eu/RegData/etudes/BRIE/2021/698781/EPRS_BRI(2021)698781_EN.pdf (accessed on 24 March 2023).
  8. Chmielewski, A.; Gumiński, R.; Mączak, J.; Radkowski, S.; Szulim, P. Aspects of balanced development of RES and distributed micro-cogeneration use in Poland: Case study of mCHP with Stirling engine. Renew. Sustain. Energy Rev. 2016, 60, 930–952. [Google Scholar] [CrossRef]
  9. Regulation of the European Parliament and of the Council on the Deployment of Alternative Fuels Infrastructure, and Repealing Directive 2014/94/EU of the European Parliament and of the Council. Available online: https://eur-lex.europa.eu/resource.html?uri=cellar:dbb134db-e575-11eb-a1a5-01aa75ed71a1.0001.02/DOC_1&format=PDF (accessed on 24 March 2023).
  10. Wasim, M.S.; Habib, S.; Amjad, M.; Bhatti, A.R.; Ahmed, E.M.; Qureshi, M.A. Battery-Ultracapacitor Hybrid Energy Storage System to Increase Battery Life Under Pulse Loads. IEEE Access 2022, 10, 62173–62182. [Google Scholar] [CrossRef]
  11. Jankowska, E.; Kopciuch, K.; Błażejczyk, M.; Majchrzycki, W.; Piórkowski, P.; Chmielewski, A.; Bogdziński, K. Hybrid energy storage based on ultracapacitor and lead acid battery: Case study. In Automation 2018; Springer: Berlin/Heidelberg, Germany, 2018; Volume 743, pp. 339–349. [Google Scholar]
  12. Piórkowski, P.; Chmielewski, A.; Bogdziński, K.; Możaryn, J.; Mydłowski, T. Research on Ultracapacitors in Hybrid systems: Case Study. Energies 2018, 11, 2551. [Google Scholar] [CrossRef]
  13. Chariot, Electric Buses. Available online: https://chariot-electricbus.com/cmproduct/battery-electric-buses/ (accessed on 24 March 2023).
  14. Chariot, Ultracapacitor E-Bus. Available online: https://chariot-electricbus.com/cmproduct/12m-ultracapacitor-chariot-e-bus/ (accessed on 24 March 2023).
  15. Lee, S.; Kim, J. Power capability analysis of lithium battery and supercapacitor by pulse duration. Electronics 2019, 8, 1395. [Google Scholar] [CrossRef]
  16. Podder, A.K.; Chakraborty, O.; Islam, S.; Kumar, N.M.; Alhelou, A.H.H. Control Strategies of Different Hybrid Energy Storage Systems for Electric Vehicles Applications. IEEE Access 2021, 9, 51865–51895. [Google Scholar] [CrossRef]
  17. Hu, S.; Liang, Z.; He, X. Ultracapacitor-battery hybrid energy storage system based on the asymmetric bidirectional Z-source topology for EV. Trans. Power Electron. 2016, 11, 7489–7498. [Google Scholar] [CrossRef]
  18. Wang, J.; Wang, B.; Zhang, L.; Wang, J.; Shchurov, N.I.; Malozyomov, B.V. Review of bidirectional DC–DC converter topologies for hybrid energy storage system of new energy vehicles. Green Energy Intell. Transp. 2022, 1, 100010. [Google Scholar] [CrossRef]
  19. Yuhimenko, V.; Lerman, C.; Kuperman, A. DC active power filter-based hybrid energy source for pulsed power loads. IEEE J. Emerg. Sel. Top. Power Electron. 2015, 3, 1001–1010. [Google Scholar] [CrossRef]
  20. Demircalı, A.P.; Sergeant, S.; Koroglu, K.S.; Oztürk, E.; Tumbek, M. Influence of the temperature on energy management in battery–ultracapacitor electric vehicles. J. Clean. Prod. 2018, 176, 716–725. [Google Scholar] [CrossRef]
  21. Hung, N.B.; Jaewon, S.; Lim, O. A study of the effects of input parameters on the dynamics and required power of an electric bicycle. Appl. Energy 2017, 204, 1347–1362. [Google Scholar] [CrossRef]
  22. Akar, F.; Tavlasoglu, Y.; Vural, B. An Energy Management Strategy for a Concept Battery/Ultracapacitor Electric Vehicle With Improved Battery Life. IEEE Trans. Transp. Electrif. 2017, 3, 191–200. [Google Scholar] [CrossRef]
  23. Kollmeyer, P.K.; Jahns, T.M. Aging and performance comparison of absorbed glass matte, enhanced flooded, PbC, NiZn, and LiFePO4 12V start stop vehicle batteries. J. Power Sources 2019, 441, 227139. [Google Scholar] [CrossRef]
  24. Esfandyaria, A.B.; Nortona, M.; Conlona, M.C.; Cormack, S.J. Performance of a campus photovoltaic electric vehicle charging station in a temperate climate. Sol. Energy 2019, 177, 762–771. [Google Scholar] [CrossRef]
  25. Hu, J.S.; Lu, F.; Zhu, C.; Cheng, C.Y.; Chen, S.L.; Ren, T.J.; Mi, C.C. Hybrid Energy Storage System of an Electric Scooter Based on Wireless Power Transfer. IEEE Trans. Ind. Inform. 2018, 8, 4169–4178. [Google Scholar] [CrossRef]
  26. Park, J.; Appiah, W.A.; Byun, S.; Jin, D.; Ryou, M.H.; Lee, Y.M. Semi-empirical long-term cycle life model coupled with an electrolyte depletion function for large-format graphite/LiFePO4 lithium-ion batteries. J. Power Sources 2017, 365, 257–265. [Google Scholar] [CrossRef]
  27. Pattipati, B.; Balasingam, B.; Avvari, G.V.; Pattipati, K.R.; Bar-Shalom, Y. Open circuit voltage characterization of lithium–ion batteries. J. Power Sources 2014, 269, 317–333. [Google Scholar] [CrossRef]
  28. Chmielewski, A.; Bogdziński, K.; Gumiński, R.; Szulim, P.; Piórkowski, P.; Możaryn, J.; Mączak, J. Operational research of VRLA battery. Advances in Intelligent Systems and Computing. In Automation 2018; Springer: Berlin/Heidelberg, Germany, 2018; Volume 743, pp. 783–791. [Google Scholar]
  29. Czerwiński, A. Akumulatory, Baterie, Ogniwa; Wyd. WKŁ: Warszawa, Poland, 2012. [Google Scholar]
  30. Sarasketa-Zabala, E.; Gandiaga, I.; Martinez-Laserna, E.; Rodriguez-Martinez, L.M.; Villarreal, I. Cycle ageing analysis of a LiFePO4/graphite cell with dynamic model validations: Towards realistic lifetime predictions. J. Power Sources 2015, 275, 573–587. [Google Scholar] [CrossRef]
  31. Wang, J.; Gan, Y.; Yao, M.; Li, Y. Cycle-life model for graphite-LiFePO4 cells. J. Power Sources 2011, 196, 3942–3948. [Google Scholar] [CrossRef]
  32. Liang, J.; Gan, Y.; Yao, M.; Li, Y. Numerical analysis of capacity fading for a LiFePO4 battery under different current rates and ambient temperatures. Int. J. Heat Mass Transf. 2021, 165, 120615. [Google Scholar] [CrossRef]
  33. Li, J.; Adewuyi, K.; Lotfi, N.; Landers, R.G.; Park, J. A single particle model with chemical/mechanical degradation physics for lithium ion battery State of Health (SOH) estimation. Appl. Energy 2018, 212, 1178–1190. [Google Scholar] [CrossRef]
  34. Xiong, R.; Li, L.; Tian, J. Towards a smarter battery management system: A critical review on battery state of health monitoring methods. J. Power Sources 2018, 405, 18–29. [Google Scholar] [CrossRef]
  35. Tian, J.; Xiong, R.; Shen, W.; Lu, J.; Sun, F. Flexible battery state of health and state of charge estimation using partial charging data and deep learning. Energy Storage Mater. 2022, 51, 372–381. [Google Scholar] [CrossRef]
  36. Lu, J.; Xiong, R.; Tian, J.; Wang, C.; Hsu, C.W.; Tsou, N.T.; Sun, F.; Li, J. Battery degradation prediction against uncertain future conditions with recurrent neural network enabled deep learning. Energy Storage Mater. 2022, 50, 139–151. [Google Scholar] [CrossRef]
  37. Tian, J.; Xiong, R.; Shen, W. State-of-Health Estimation Based on Differential Temperature for Lithium Ion Batteries. IEEE Trans. Power Electron. 2020, 35, 10363–10373. [Google Scholar] [CrossRef]
  38. Tian, J.; Xiong, R.; Lu, J.; Chen, C.; Shen, W. Battery state-of-charge estimation amid dynamic usage with physics-informed deep learning. Energy Storage Mater. 2022, 50, 718–729. [Google Scholar] [CrossRef]
  39. Yang, R.; Xiong, R.; Ma, S.; Lin, X. Characterization of external short circuit faults in electric vehicle Li-ion battery packs and prediction using artificial neural networks. Appl. Energy 2020, 260, 114253. [Google Scholar] [CrossRef]
  40. Wu, S.; Xiong, R.; Li, H.; Nian, V.; Ma, S. The state of the art on preheating lithium-ion batteries in cold weather. J. Energy Storage 2020, 27, 101059. [Google Scholar] [CrossRef]
  41. Chmielewski, A.; Piórkowski, P.; Bogdzinski, K.; Szulim, P.; Guminski, R. Test bench and model research of hybrid energy storage. J. Power Technol. 2017, 97, 406–415. [Google Scholar]
  42. Shen, J.; Khaligh, A. A supervisory energy management control strategy in a battery/ultracapacitor hybrid energy storage system. IEEE Trans. Transp. Electrif. 2015, 1, 223–231. [Google Scholar] [CrossRef]
  43. Kuperman, A.; Aharon, I.; Malki, S.; Kara, A. Design of a semiactive battery-ultracapacitor hybrid energy source. IEEE Trans. Power Electron. 2013, 28, 806–815. [Google Scholar] [CrossRef]
  44. Lin, X.; Zamora, R. Controls of hybrid energy storage systems in microgrids: Critical review, case study and future trends, Journal of Energy Storage. J. Energy Storage 2022, 47, 103884. [Google Scholar] [CrossRef]
  45. Chen, C.; Xiong, R.; Yang, R.; Shen, W.; Sun, F. State-of-charge estimation of lithium-ion battery using an improved neural network model and extended Kalman filter. J. Clean. Prod. 2019, 234, 1153–1164. [Google Scholar] [CrossRef]
  46. Mamun, A.A.; Liu, Z.; Rizzi, D.M.; Onori, S. An Integrated Design and Control Optimization Framework for Hybrid Military Vehicle Using Lithium-Ion Battery and Supercapacitor as Energy Storage Devices. IEEE Trans. Transp. Electrif. 2019, 5, 239–251. [Google Scholar] [CrossRef]
  47. Blasius, E.; Wang, Z. Effects of charging battery electric vehicles on local grid regarding standardized load profile in administration sector. Appl. Energy 2018, 224, 330–339. [Google Scholar] [CrossRef]
  48. Reddy, K.J.; Natarajan, S. Energy sources and multi-input DC-DC converters used in hybrid electric vehicle applications—A review. Int. J. Hydrog. Energy 2018, 43, 17387–17408. [Google Scholar] [CrossRef]
  49. The Act on Road Traffic in Poland. Available online: https://prawooruchudrogowym.pl/ (accessed on 12 February 2023). (In Polish).
  50. Kowal, J.; Avaroglu, E.; Chamekh, F.; Šenfelds, A.; Thien, T.; Wijaya, D.; Sauer, D.U. Detailed analysis of the self-discharge of supercapacitors. J. Power Sources 2011, 196, 573–579. [Google Scholar] [CrossRef]
  51. Hossain Lipu, M.S.; Hannan, M.A.; Hussain, A.; Hoque, M.M.; Pin, J.K.; Saad, M.H.M.; Ayob, A. A review of state of health and remaining useful life estimation methods for lithium–ion battery in electric vehicles: Challenges and recommendations. J. Clean. Prod. 2018, 205, 115–133. [Google Scholar] [CrossRef]
  52. Miluski, T. BMW Group Poland Training Course for Teachers of Technical Schools. BMW Electric Drive Systems. Generation 5.0″, 16 September 2022, Warsaw, Poland. Available online: https://aos.bmwgroup.com/web/oss/start (accessed on 28 February 2023).
  53. Chmielewski, A.; Szulim, P.; Gregorczyk, M.; Gumi’nski, R.; Mydłowski, T.; Maczak, J. Model of an electric vehicle powered by a PV cell—A case study. In Proceedings of the 2017 22nd International Conference on Methods and Models in Automation and Robotics (MMAR), Miedzyzdroje, Poland, 28–31 August 2017. [Google Scholar]
  54. Chen, H.; Sui, Y.; Shang, W.; Sun, R.; Chen, Z.; Wang, C.; Han, C.; Zhang, Y.; Zhang, H. Towards renewable public transport: Mining the performance of electric buses using solar-radiation as an auxiliary power source. Appl. Energy 2022, 325, 119863. [Google Scholar] [CrossRef]
  55. Argyrou, M.C.; Marouchos, C.C.; Kalogirou, S.A.; Christodoulides, P. A novel power management algorithm for a residential grid-connected PV system with battery-supercapacitor storage for increased self-consumption and self-sufficiency. Energy Convers. Manag. 2021, 246, 114671. [Google Scholar] [CrossRef]
  56. Sumsurooah, S.; He, Y.; Torchio, M.; Kouramas, K.; Guida, B.; Cuomo, F.; Atkin, J.; Bozhko, S.; Renzetti, A.; Russo, A.; et al. ENIGMA—A Centralised Supervisory Controller for Enhanced Onboard Electrical Energy Management with Model in the Loop Demonstration. Energies 2021, 14, 5518. [Google Scholar] [CrossRef]
  57. Cavallo, A.; Russo, A.; Canciello, G. Control of Supercapacitors for smooth EMA Operations in Aeronautical Applications. In Proceedings of the 2019 American Control Conference (ACC), Philadelphia, PA, USA, 10–12 July 2019; pp. 4948–4954. [Google Scholar]
  58. Russo, A.; Cavallo, A. Stability and Control for Buck–Boost Converter for Aeronautic Power Management. Energies 2023, 16, 988. [Google Scholar] [CrossRef]
  59. Cavallo, A.; Canciello, G.; Russo, A. Integrated supervised adaptive control for the more Electric Aircraft. Automatica 2020, 117, 108956. [Google Scholar] [CrossRef]
  60. Cavallo, A.; Canciello, G.; Russo, A. Buck-Boost Converter Control for Constant Power Loads in Aeronautical Applications. In Proceedings of the 2018 IEEE Conference on Decision and Control (CDC), Miami Beach, FL, USA, 17–19 December 2018; pp. 6741–6747. [Google Scholar]
  61. Zhao, C.; Yin, H.; Yang, Z.; Ma, C. Equivalent series resistance based energy loss analysis of a battery semiactive hybrid energy storage system. Trans. Energy Convers. 2015, 30, 1081–1091. [Google Scholar] [CrossRef]
  62. Cabrane, Z.; Kim, J.; Yoo, K.; Ouassaid, M. HESS-based photovoltaic/batteries/supercapacitors: Energy management strategy and DC bus voltage stabilization. Sol. Energy 2021, 216, 551–563. [Google Scholar] [CrossRef]
  63. Hredzak, B.; Agelidis, V.G.; Jang, M. A model predictive control system for a hybrid battery-ultracapacitor power source. Trans. Power Electron. 2014, 29, 1469–1479. [Google Scholar] [CrossRef]
  64. Lencwe, M.J.; Chowdhury, S.P.D.; Olwal, T.O. Hybrid energy storage system topology approaches for use in transport vehicles: A review. Energy Sci. Eng. 2022, 10, 1449–1477. [Google Scholar] [CrossRef]
  65. Sinha, S.; Bajpai, P. Power management of hybrid energy storage system in a standalone DC microgrid. J. Energy Storage 2020, 30, 101523. [Google Scholar] [CrossRef]
  66. Kurm, S.; Agarwal, V. Interfacing Standalone Loads with Renewable Energy Source and Hybrid Energy Storage System Using a Dual Active Bridge Based Multi-Port Converter. IEEE J. Emerg. Sel. Top. Power Electron. 2020, 10, 4738–4748. [Google Scholar] [CrossRef]
  67. Song, Z.; Li, J.; Han, X.; Xu, L.; Lu, L.; Ouyang, M. Multi-objective optimization of a semi-active battery/supercapacitor energy storage system for electric vehicles. Appl. Energy 2014, 135, 212–224. [Google Scholar] [CrossRef]
  68. Kumar, K.; Bae, S. Dynamic power management based on model predictive control for hybrid-energy-storage-based grid-connected microgrids. Electr. Power Energy Syst. 2022, 143, 108384. [Google Scholar] [CrossRef]
  69. Linxiao, G.; Denecke, M.E.; Foley, S.B.; Dong, H.; Qi, Z.; Koenig, G.M., Jr. Electrochemical characterization of lithium cobalt oxide within aqueous flow suspensions as an indicator of rate capability in lithiumion battery electrodes. Electrochim. Acta 2018, 281, 822–830. [Google Scholar]
  70. Xiong, R.; Chen, H.; Wang, C.; Sun, F. Towards a smarter hybrid energy storage system based on battery and ultracapacitor—A critical review on topology and energy management. J. Clean. Prod. 2018, 202, 1228–1240. [Google Scholar] [CrossRef]
  71. Mohamed, M.M.; Zoghby, H.M.E.; Sharaf, S.M.; Mosa, M.A. Optimal virtual synchronous generator control of battery/supercapacitor hybrid energy storage system for frequency response enhancement of photovoltaic/diesel microgrid. J. Energy Storage 2022, 51, 104317. [Google Scholar] [CrossRef]
  72. Arjanaki, A.A.; Kolagar, A.D.; Pahlavani, M.R.A. A two-level power management strategy in a DC-coupled hybrid microgrid powered by fuel cell and energy storage systems with model predictive controlled interface converter. J. Energy Storage 2022, 52, 104861. [Google Scholar] [CrossRef]
  73. Capasso, C.; Lauria, D.; Veneri, O. Experimental evaluation of model-based control strategies of sodium-nickel chloride battery plus supercapacitor hybrid storage systems for urban electric vehicles. Appl. Energy 2018, 228, 2478–2489. [Google Scholar] [CrossRef]
  74. Guo, F.; Sharma, R. A modular multilevel converter with half-bridge submodules for hybrid energy storage systems integrating battery and ultracapacitor. In Proceedings of the 2015 IEEE Applied Power Electronics Conference and Exposition (APEC), Charlotte, NC, USA, 15–19 March 2015. [Google Scholar]
  75. Jing, W.; Lai, C.H.; Wong, S.H.W.; Wong, M.L.D. Battery supercapacitor hybrid energy storage system in standalone dc microgrids: A review. IET Renew. Power Gener. 2016, 11, 461–469. [Google Scholar] [CrossRef]
  76. Beuse, T.; Fingerle, M.; Wagner, C.; Winter, M.; Börner, M. Comprehensive Insights into the Porosity of Lithium-Ion Battery Electrodes: A Comparative Study on Positive Electrodes Based on LiNi0.6Mn0.2Co0.2O2 (NMC622). Batteries 2021, 7, 70. [Google Scholar] [CrossRef]
  77. Qi, N.; Yin, Y.; Dai, K.; Wu, C.; Wang, X.; You, Z. Comprehensive optimized hybrid energy storage system for long-life solar-powered wireless sensor network nodes. Appl. Energy 2021, 290, 116780. [Google Scholar] [CrossRef]
  78. Ke, M.Y.; Chiu, Y.H.; Wu, C.Y. Battery Modelling and SOC Estimation of a LiFePO4 Battery. In Proceedings of the 2016 International Symposium on Computer, Consumer and Control, Xi’an, China, 4–6 July 2016; pp. 208–211. [Google Scholar]
  79. Guo, F.; Ye, Y.; Sharma, R. A Modular multilevel converter based battery-ultracapacitor hybrid energy storage system for photovoltaic applications. In Proceedings of the 2015 Clemson University Power Systems Conference (PSC), Clemson, SC, USA, 10–13 March 2015. [Google Scholar]
  80. Wu, Y.-U.; Tai, C.-H. Novel Bidirectional Isolated DC/DC Converter with High Gain Ratio and Wide Input Voltage for Electric Vehicle Storage Systems. Batteries 2022, 240, 240. [Google Scholar] [CrossRef]
  81. Liao, H.; Chen, Y.-T.; Chen, J.-F. Development of a Bidirectional DC–DC Converter with Rapid Energy Bidirectional Transition Technology. Energies 2022, 15, 4583. [Google Scholar] [CrossRef]
  82. Yi, W.; Ma, H.; Peng, S.; Dali, Z.M.L.; Dampage, U.; Hajjiah, A. Analysis and implementation of multi-port bidirectional converter for hybrid energy systems. Energy Rep. 2022, 8, 1538–1549. [Google Scholar] [CrossRef]
  83. Tomar, P.S.; Srivastava, M.; Verma, A. An Improved Current-Fed Bidirectional DC–DC Converter for Reconfigurable Split Battery in EVs. IEEE Trans. Ind. Appl. 2020, 56, 6957–6967. [Google Scholar] [CrossRef]
  84. Liu, Y.-C.; K-DSyu, Y.-L.C.; Dung, N.A. High-Frequency and High-Efficiency Isolated Two-Stage Bidirectional DC–DC Converter for Residential Energy Storage Systems. IEEE J. Emerg. Sel. Top. Power Electron. 2020, 8, 1994–2006. [Google Scholar] [CrossRef]
  85. Shreelakshmi, M.P.; Das, M.; Agarwal, V. Design and Development of a Novel High Voltage Gain, High-Efficiency Bidirectional DC–DC Converter for Storage Interface. IEEE Trans. Ind. Electron. 2019, 66, 4490–4501. [Google Scholar]
  86. Wu, Y.-E.; Ke, Y.-T. A Novel Bidirectional Isolated DC-DC Converter with High Voltage Gain and Wide Input Voltage. IEEE Trans. Power Electron. 2021, 36, 7973–7985. [Google Scholar] [CrossRef]
  87. Packnezhad, M.; Farzanehfard, H. Soft-Switching High Step-Up/Down Converter Using Coupled Inductors with Minimum Number of Components. IEEE Trans. Ind. Electron. 2021, 68, 7938–7945. [Google Scholar] [CrossRef]
  88. Santra, S.B.; Liang, T.-J. High Gain and High-Efficiency Bidirectional DC–DC Converter With Current Sharing Characteristics Using Coupled Inductor. IEEE Trans. Power Electron. 2021, 36, 12819–12833. [Google Scholar] [CrossRef]
  89. Mohammadi, M.R.; Amoorezaei, A.; Khajehoddin, S.A.; Moez, K. A High Step-Up/Step-Down LVS-Parallel HVS-Series ZVS Bidirectional Converter with Coupled Inductors. IEEE Trans. Power Electron. 2022, 37, 1945–1961. [Google Scholar]
  90. Kardan, F.; Alizadeh, R.; Banaei, M.R. A New Three Input DC/DC Converter for Hybrid PV/FC/Battery Applications. IEEE J. Emerg. Sel. Top. Power Electron. 2017, 5, 1771–1778. [Google Scholar] [CrossRef]
  91. Texas Instruments LM5170EVM-BIDIR Manual. Available online: https://www.ti.com/tool/LM5170EVM-BIDIR (accessed on 28 January 2023).
  92. LiFePO4 ANR26650M1-B Technical Data. Available online: https://www.bto.pl/pdf/04579/MD100113-01-ANR26650M1B.pdf (accessed on 28 January 2023).
  93. Maxwell BMOD0058 E016 B02 Technical Data. Available online: https://maxwell.com/wp-content/uploads/2021/08/3003212.2_Datasheet_BMOD0058-E016-C02.pdf (accessed on 28 January 2023).
  94. Wang, Y.; Gao, G.; Li, X.; Chen, Z. A Fractional–Order Model–Based State Estimation Approach for Lithium–Ion Battery and Ultra–Capacitor Hybrid Power Source System Considering Load Trajectory. J. Power Sources 2020, 449, 227543. [Google Scholar] [CrossRef]
  95. Kristen, A.S.; Attia, P.M.; Jin, N.; Perkins, N.; Jiang, B.; Yang, Z.; Chen, M.H.; Aykol, M.; Herring, P.K.; Fraggedakis, D.; et al. Data–Driven Prediction of Battery Cycle Life Before Capacity Degradation. Nat. Energy 2019, 4, 383–391. [Google Scholar]
  96. Tan, B.; Li, H.; Zhao, D.; Liang, Z.; Ma, R.; Huangfu, Y. Finite-control-set model predictive control of interleaved DC-DC boost converter Based on Kalman observer. eTransportation 2022, 11, 100158. [Google Scholar] [CrossRef]
  97. He, H.; Xiong, R.; Fan, J. Evaluation of Lithium–Ion Battery Equivalent Circuit Models for State of Charge Estimation by an Experimental Approach. Energies 2011, 4, 582–598. [Google Scholar] [CrossRef]
  98. Zhang, C.; Allafi, W.; Dinh, Q.; Ascencio, P.; Marco, J. Online Estimation of Battery Equivalent Circuit Model Parameters and State of Charge Using Decoupled Least Squares Technique. Energy 2018, 142, 678–688. [Google Scholar] [CrossRef]
  99. Guo, W.; Sun, Z.; Vilsen, S.B.; Meng, J.; Stroe, D.I. Review of “grey box” lifetime modeling for lithium-ion battery: Combining physics and data-driven methods. J. Energy Storage 2022, 56, 105992. [Google Scholar] [CrossRef]
  100. Lai, Y.; Du, S.; Ai, L.; Cheng, Y.; Ji, M. Insight into Heat Generation of Lithium–Ion Batteries Based on the Electrochemical–Thermal Model at High Discharge Rates. Int. J. Hydrog. Energy 2015, 40, 13039–13049. [Google Scholar] [CrossRef]
  101. Chmielewski, A.; Możaryn, J.; Piórkowski, P.; Bogdziński, K. Comparison of NARX and Dual Polarization Models for Estimation of the VRLA Battery Charging/Discharging Dynamics in Pulse Cycle. Energies 2018, 11, 3160. [Google Scholar] [CrossRef]
  102. Ramadan, H.S.; Becherif, M.; Claude, F. Extended kalman filter for accurate state of charge estimation of lithium-based batteries: A comparative analysis. Int. J. Hydrog. Energy 2017, 42, 29033–29046. [Google Scholar] [CrossRef]
  103. He, H.; Xiong, R.; Zhang, X.; Sun, F.; Fan, J.X. State-of-Charge Estimation of the Lithium-Ion, Battery Using an Adaptive Extended Kalman Filter Based on an Improved Thevenin Model. IEEE Trans. Veh. Technol. 2011, 60, 1461–1469. [Google Scholar]
  104. Chia, Y.Y.; Lee, L.H.; Shafiabady, N.; Isa, D. A load predictive energy management system for supercapacitor–battery hybrid energy storage system in solar application using the Support Vector Machine. Appl. Energy 2015, 137, 588–602. [Google Scholar] [CrossRef]
  105. Bordes, A.; Danilov, D.; Desprez, P.; Lecocq, A.; Marlair, G.; Truchot, B.; Dahmani, M.; Siret, C.; Laurent, S.; Herreyre, S.; et al. A holistic contribution to fast innovation in electric vehicles: An overview of the DEMOBASE research project. eTransportation 2022, 11, 100144. [Google Scholar] [CrossRef]
  106. Chmielewski, A.; Możaryn, J.; Piórkowski, P.; Dybała, J. Comparison of hybrid recurrent neural networks and dual polarization models of valve regulated lead acid battery. Int. J. Energy Res. 2021, 45, 2560–2580. [Google Scholar] [CrossRef]
  107. Sun, J.; Tang, C.; Li, X.; Wang, T.; Jiang, T.; Tang, Y.; Chen, S.; Qiu, S.; Zhu, C. A remaining charging electric quantity based pack available capacity optimization method considering aging inconsistency. eTransportation 2022, 11, 100149. [Google Scholar] [CrossRef]
  108. Chang, L.; Yujie, W.; Li, W.; Zonghai, C. Load–Adaptive Real–Time Energy Management Strategy for Battery/ Ultracapacitor Hybrid Energy Storage System Using Dynamic Programming Optimization. J. Power Sources 2019, 438, 227024. [Google Scholar]
  109. Lu, X.; Chen, Y.; Fu, M.; Wang, H. Multi–Objective Optimization–Based Real–Time Control Strategy for Battery/Ultracapacitor Hybrid Energy Management Systems. IEEE Access 2019, 7, 11640–11650. [Google Scholar] [CrossRef]
  110. Piao, N.; Gao, X.; Yang, H.; Guo, Z.; Hu, G.; Cheng, H.-M.; Li, F. Challenges and development of lithium-ion batteries for low temperature environments. eTransportation 2022, 11, 100145. [Google Scholar] [CrossRef]
  111. Li, X.; Yuan, C.; Wang, Z.; He, J.; Yu, S. Lithium battery state-of-health estimation and remaining useful lifetime prediction based on non-parametric aging model and particle filter algorithm. eTransportation 2022, 11, 100156. [Google Scholar] [CrossRef]
Figure 1. (a) Physical model of BES-UC system (topology of parallel passive connection), (b) topology of semi-active connection with DC/DC converter located directly in front of the battery, (c) topology of semi-active connection with DC/DC converter located directly in front of ultracapacitor, (d) topology of semi-active cascade connection with DC/DC converter between the ultracapacitor and the battery.
Energies 16 03687 g001
Figure 2. (a) Topology of parallel active hybrid BES-UC connection, (b) topology of cascade active connection of BES-UC system.
Energies 16 03687 g002
Figure 3. Texas Instruments DC/DC converter, LM5170EVM-BIDIR model [91].
Energies 16 03687 g003
Figure 4. Scheme of the DC/DC converter test stand, with measurements in Step Down mode.
Energies 16 03687 g004
Figure 5. Waveforms of measured values—zero measurement.
Energies 16 03687 g005
Figure 6. Waveforms of measured values—Step Down mode activating the 48 V side.
Energies 16 03687 g006
Figure 7. Waveforms of measured values—Step Down mode starting the 10 V logic system.
Energies 16 03687 g007
Figure 8. Waveforms of measured values—Step Down mode, myRIO launch.
Energies 16 03687 g008
Figure 9. Waveforms of measured values, Step Down mode, 12 V charging.
Energies 16 03687 g009
Figure 10. Waveforms of measured values, Step Down mode, 0 V control.
Energies 16 03687 g010
Figure 11. Waveforms of measured values, Step Down mode, control test.
Energies 16 03687 g011
Figure 12. Waveforms of measured values, Step Down mode, disconnection of the system.
Energies 16 03687 g012
Figure 13. Waveforms of measured values, Step Down mode, 36 V control test.
Energies 16 03687 g013
Figure 14. Waveforms of measured values, Step Down mode, 24 V control test.
Energies 16 03687 g014
Figure 15. Waveforms of measured values, Step Down mode, test for voltage values below 24 V.
Energies 16 03687 g015
Figure 16. Measured value waveforms, Step Down mode, test for voltage values below 24 V (test with low side target voltage changed from 12 V to 10 V).
Energies 16 03687 g016
Figure 17. Measured value waveforms, Step Down mode, test for voltage values below 24 V (test for low side voltage changed from 10 V to 14 V).
Energies 16 03687 g017
Figure 18. Plot of the load current as a function of the control voltage of the DC/DC converter.
Energies 16 03687 g018
Figure 19. Plot of the value of the power measured on the high- and low-voltage sides as a function of the DC/DC converter’s control voltage.
Energies 16 03687 g019
Figure 20. Power losses as a function of the control voltage of the DC/DC converter.
Energies 16 03687 g020
Figure 21. Plot of the load current as a function of the control voltage of the DC/DC converter (36 V to 12 V).
Energies 16 03687 g021
Figure 22. Plot of the value of power measured on the high and low-voltage side as a function of the DC/DC converter control voltage (36 V to 12 V).
Energies 16 03687 g022
Figure 23. Plot of power losses as a function of the control voltage of the DC/DC converter (36 V to 12 V).
Energies 16 03687 g023
Figure 24. Plot of the load current as a function of the control voltage of the DC/DC converter (24 V to 12 V).
Energies 16 03687 g024
Figure 25. Plot of the value of power measured on the high- and low-voltage side as a function of the DC/DC converter control voltage (24 V to 12 V).
Energies 16 03687 g025
Figure 26. Power losses as a function of the control voltage of the DC/DC converter (24 V to 12 V).
Energies 16 03687 g026
Figure 27. Scheme of the DC/DC converter test stand and measurements in Step Up mode.
Energies 16 03687 g027
Figure 28. Waveforms of measured values—zero measurement.
Energies 16 03687 g028
Figure 29. Waveforms of measured values and second zero measurement.
Energies 16 03687 g029
Figure 30. Waveforms of measured values and Step Up mode (logic reset).
Energies 16 03687 g030
Figure 31. Waveforms of measured values, Step Up mode, 48 V charge.
Energies 16 03687 g031
Figure 32. Waveforms of measured values, Step Up mode, 48 V control test.
Energies 16 03687 g032
Figure 33. Waveforms of measured values, Step Up mode, 36 V control test.
Energies 16 03687 g033
Figure 34. Waveforms of measured values, Step Up mode, 24 V control test.
Energies 16 03687 g034
Figure 35. Plot of the load current and the current drawn from the low-voltage side as a function of the control voltage of the DC/DC converter.
Energies 16 03687 g035
Figure 36. Plot of the value of power measured on the high- and low-voltage sides as a function of the DC/DC converter’s control voltage.
Energies 16 03687 g036
Figure 37. Plot of the power losses as a function of the control voltage of the DC/DC converter.
Energies 16 03687 g037
Figure 38. Plot of the load current and the current drawn from the low-voltage side as a function of the control voltage of the DC/DC converter.
Energies 16 03687 g038
Figure 39. Plot of the power measured on the high- and low-voltage sides as a function of the DC/DC converter’s control voltage.
Energies 16 03687 g039
Figure 40. Plot of power losses as a function of the control voltage of the DC/DC converter.
Energies 16 03687 g040
Figure 41. Plot of the load current and the current drawn from the low-voltage side as a function of the control voltage of the DC/DC converter.
Energies 16 03687 g041
Figure 42. Plot of the value of the power measured on the high- and low-voltage sides as a function of the control voltage of the DC/DC converter.
Energies 16 03687 g042
Figure 43. Plot of power losses as a function of the control voltage of the DC/DC converter.
Energies 16 03687 g043
Figure 44. Photo of the test stand and the monitoring and control application developed in LabVIEW.
Energies 16 03687 g044
Figure 45. Scheme of power distribution control implemented using the myRIO platform.
Energies 16 03687 g045
Figure 46. Plots of voltage and current values for the power distribution: (a) 20%BES/80%UC, (b) 50%BES/50%UC, (c) 80%BES/20%UC, mode 12 V/36 V.
Energies 16 03687 g046aEnergies 16 03687 g046b
Figure 47. Self-discharge of the battery and ultracapacitor module (value 1: fully charged to 16 V; ultracapacitor, 3.3 V LiFePO4 cell) from the authors’ study.
Energies 16 03687 g047
Table 1. Technical data comparison of low power bidirectional DC/DC converters presented in papers [80,81,82,83,84,85,86,87,88,89,90] and DC/DC converter presented in this paper [91].
ParameterDC/DC Converter in [80]DC/DC Converter in [81]DC/DC Converter in [82]DC/DC Converter in [83]DC/DC Converter in [84]DC/DC Converter in [85]DC/DC Converter in [86]DC/DC Converter in [87]DC/DC Converter in [88]DC/DC Converter in [89]DC/DC Converter in [90]This Paper [91]
The number of
switches
6424104636444
The number of diodes0--000000342
The number of capacitors423632314342
Number of inductors122111111221
Input voltage Vin24–58 V24 V12–20 V24–48 V35–50 V40 V24–55 V48 V48 V48 V35 Vfrom 6 V to 75 V
Output voltage Vout400 V200 V60–70 V360 V400 V400 V400 V380 V384 V400 V285 V12–48 V
BidirectionalyesyesYesyesyesyesyesyesyesyesyesYes
Efficiency of Step Down mode [%]95%94%94.2%93%94%94%94%95%96%95%90%Presented in this paper
Efficiency of Step Up mode [%]96%95%94.2%94%94%94%96%94%96%95%90%Presented in this paper
Boost or
buck
operation
yesyesyesyesyesyesyesyesyesyesyesyes
Rated power [W]1000 W500 W120 W250 W1000 W300 W500 W300 W250 W400 W140 WUp to 750 W or 500 W per channel
Switching frequency
[kHz]
40 kHz50 kHz50 kHz100–145 kHz700 kHz 350 kHz–1 MHz50 kHz40 kHz100 kHz50 kHz100–180 kHz30 kHz50–500 kHz
PWM control signalsnormalnormalnormalnormalcomplexnormalnormalnormalnormalcomplexnormalnormal
Table 2. Technical data of the LiFePO4 battery and Maxwell ultracapacitor module.
Battery LiFePO4 [92]Ultracapacitor BMOD0058 E016 B02 [93]
Parameter NameValueParameter NameValue
Nominal voltage3.3 VMaximum rated voltage16 V
Minimum voltage2 VMinimum voltage0 V
Maximum voltage3.6 VAbsolute maximum voltage17 V
Capacity2.5 AhCapacity58 F
Internal resistance6 mΩInitial equivalent series resistance22 mΩ
Maximum discharge current70 A(cont.)/120 AMaximum continuous current23 A (cont.)/190 A
Dimensions (L × W × H, [mm])Ø26 × 65Dimensions (L × W × H, [mm])226.5 × 49.5 × 75.9
Cycle life>1000 ~5,000,000
Weight0.076 kgWeight0.63 kg
Disclaimer/Publisher’s Note: The statements, opinions and data contained in all publications are solely those of the individual author(s) and contributor(s) and not of MDPI and/or the editor(s). MDPI and/or the editor(s) disclaim responsibility for any injury to people or property resulting from any ideas, methods, instructions or products referred to in the content.

