
Decarbonizing Telecommunication Sector: Techno-Economic Assessment and Optimization of PV Integration in Base Transceiver Stations in Telecom Sector Spreading across Various Geographically Regions
 , , ,
, , ,  and
and
Abstract
:1. Introduction
Major Contributions
- (a)
- To comprehend the nature of power outage events at various outdoor telecom towers over a geographical region, examining the grid power accessibility at multiple locations;
- (b)
- To create hybrid systems with PV arrays sized to perfection to meet the electrical needs of telecom towers in various power-outage circumstances across the country;
- (c)
- To determine the levelized cost of electricity needed to power telecom towers using hybrid systems based on PV arrays;
- (d)
- Compared to the currently available conventional choices, compare and evaluate hybrid systems’ financial viability (LCOE and NPC) based on PV arrays for powering telecom towers.
2. Recent Studies on Techno-Economic Analysis of Hybrid Energy System
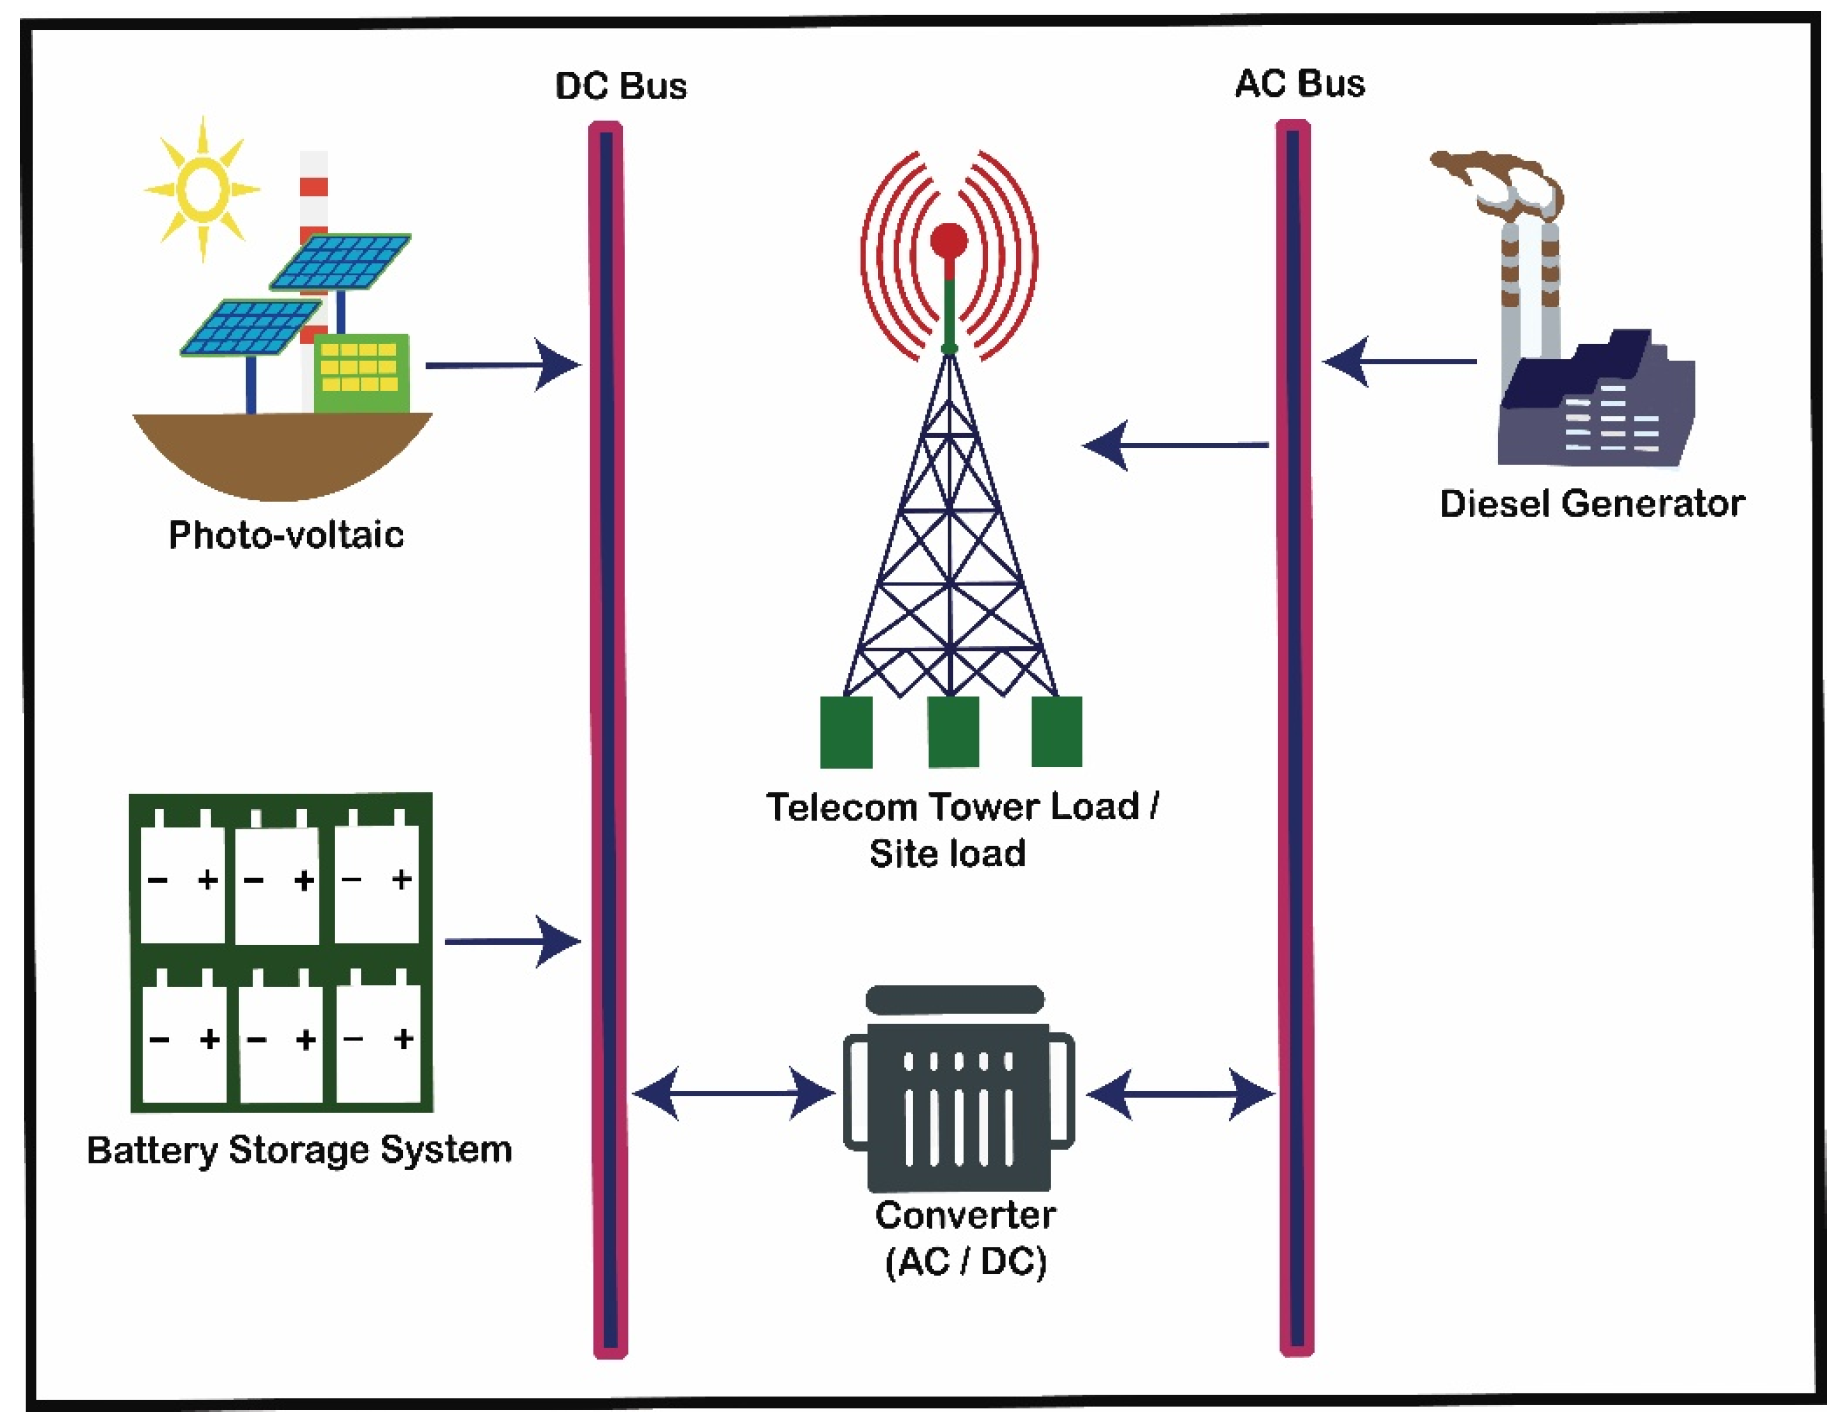
Existing and Proposed Base Transceiver Stations (BTS) Design Framework
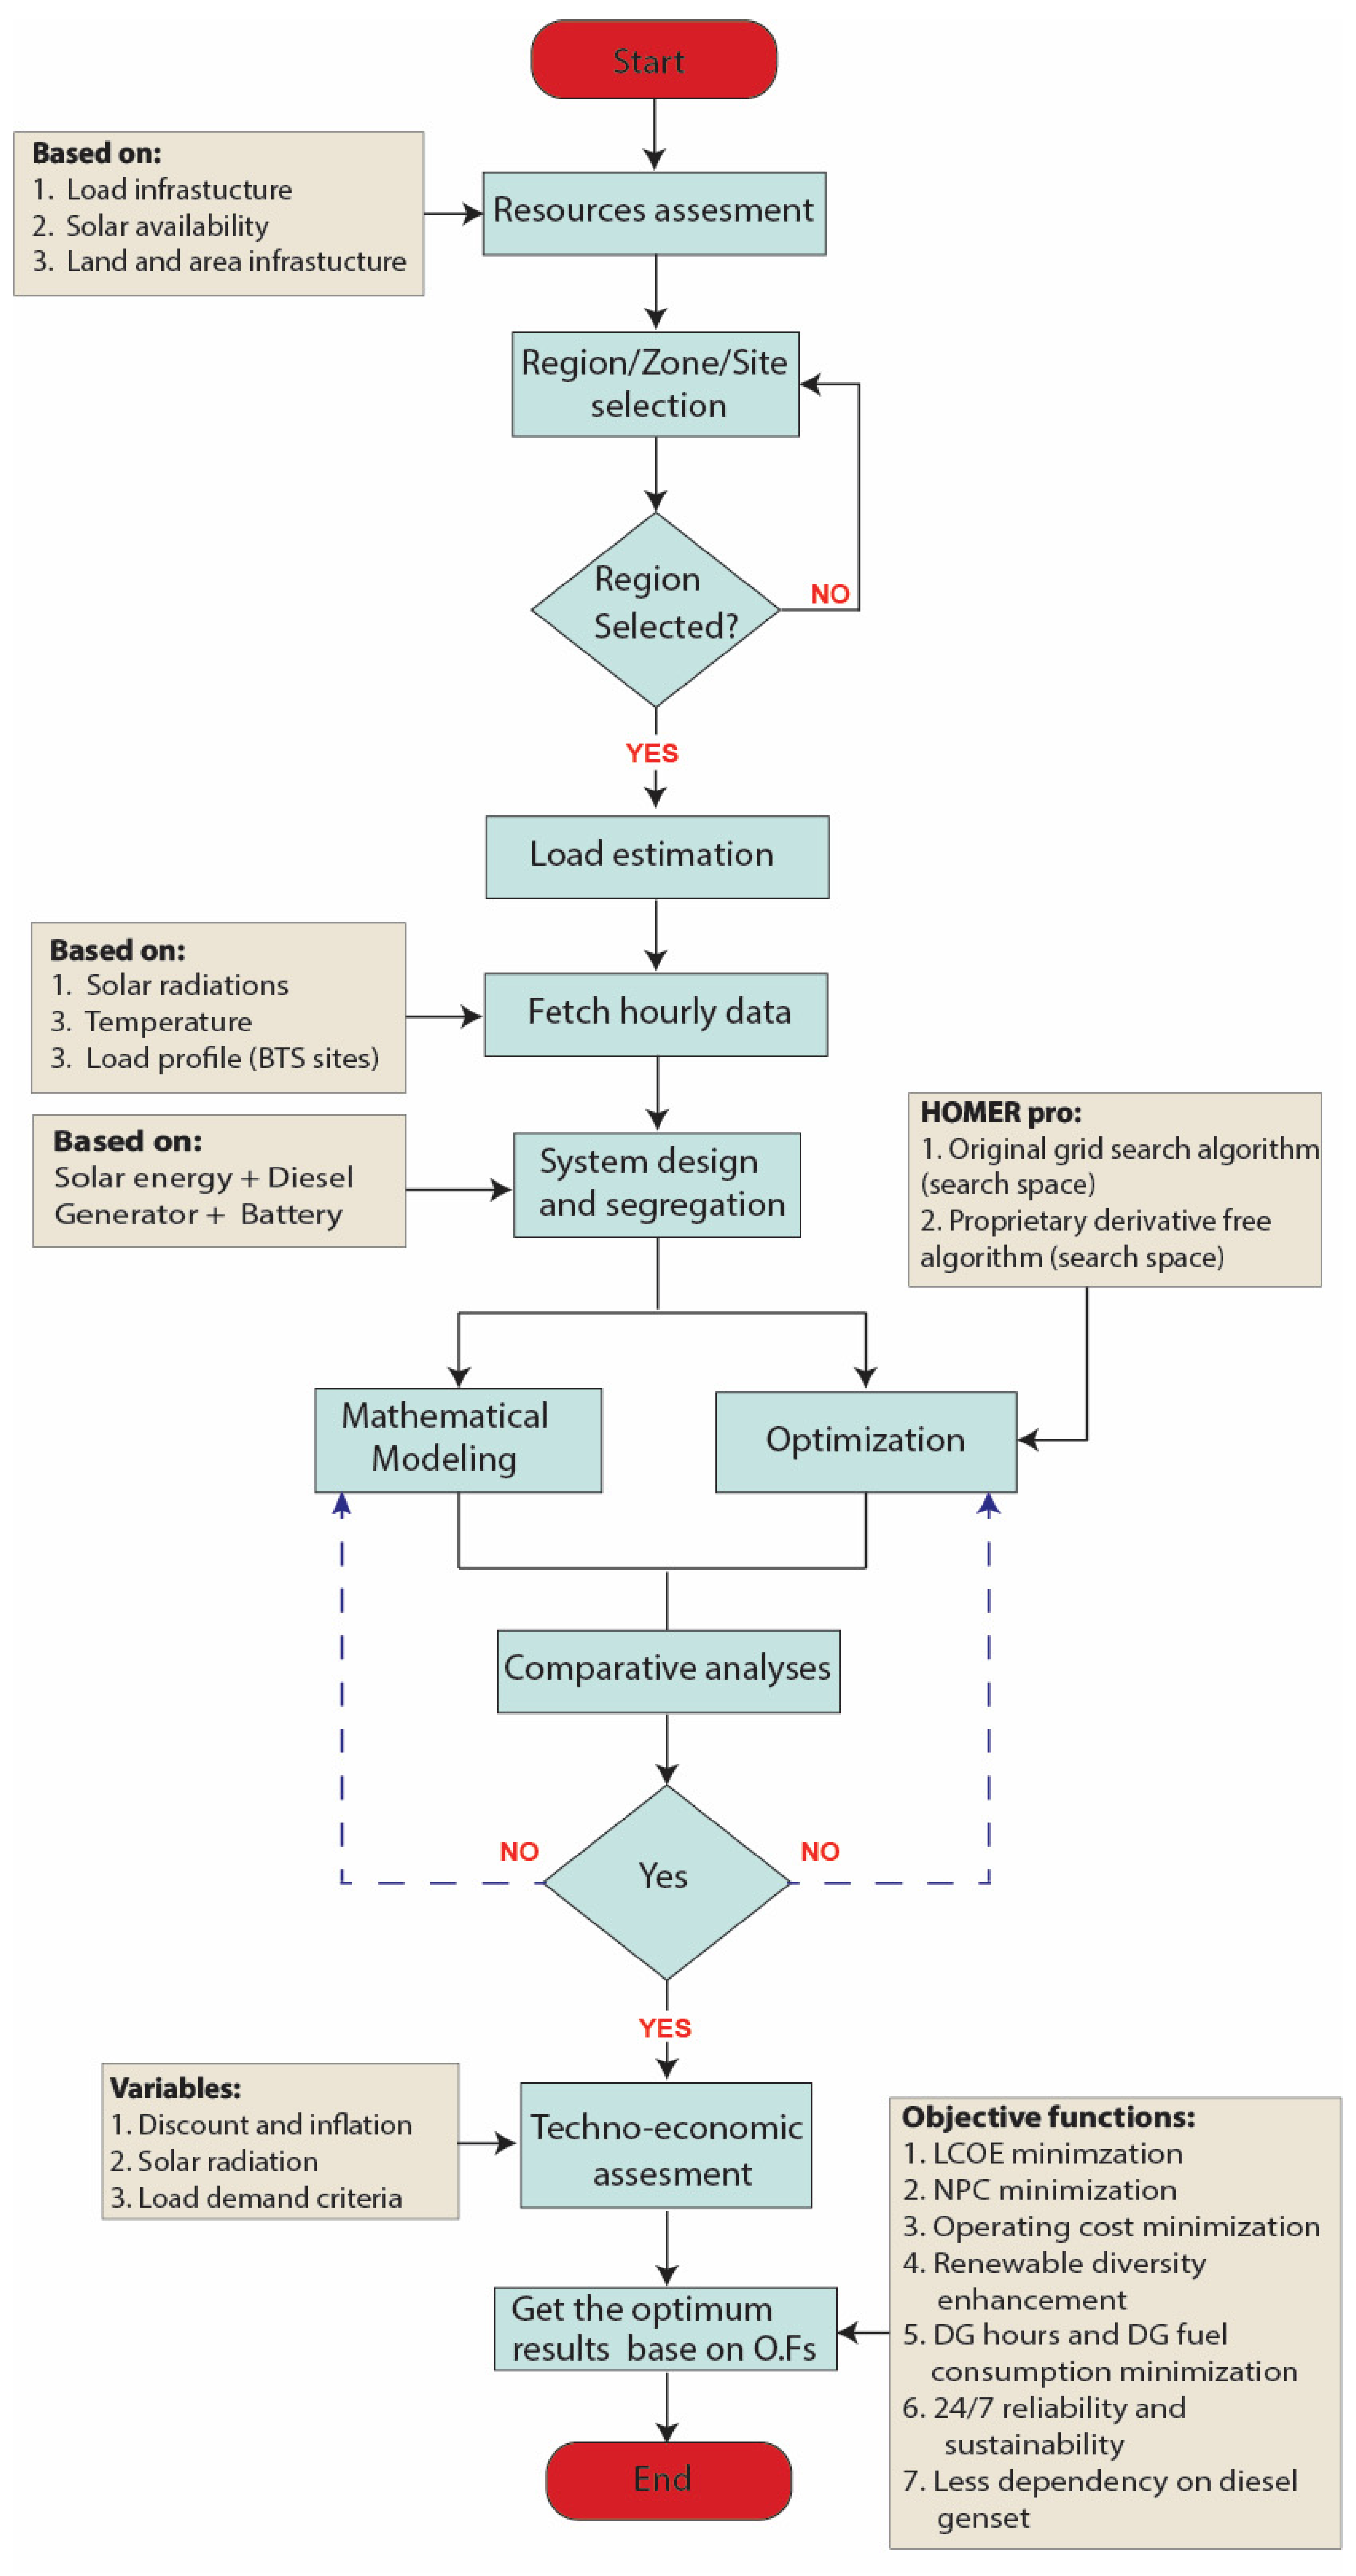
3. Methodology
3.1. Site Selection and Load Estimation
- (1)
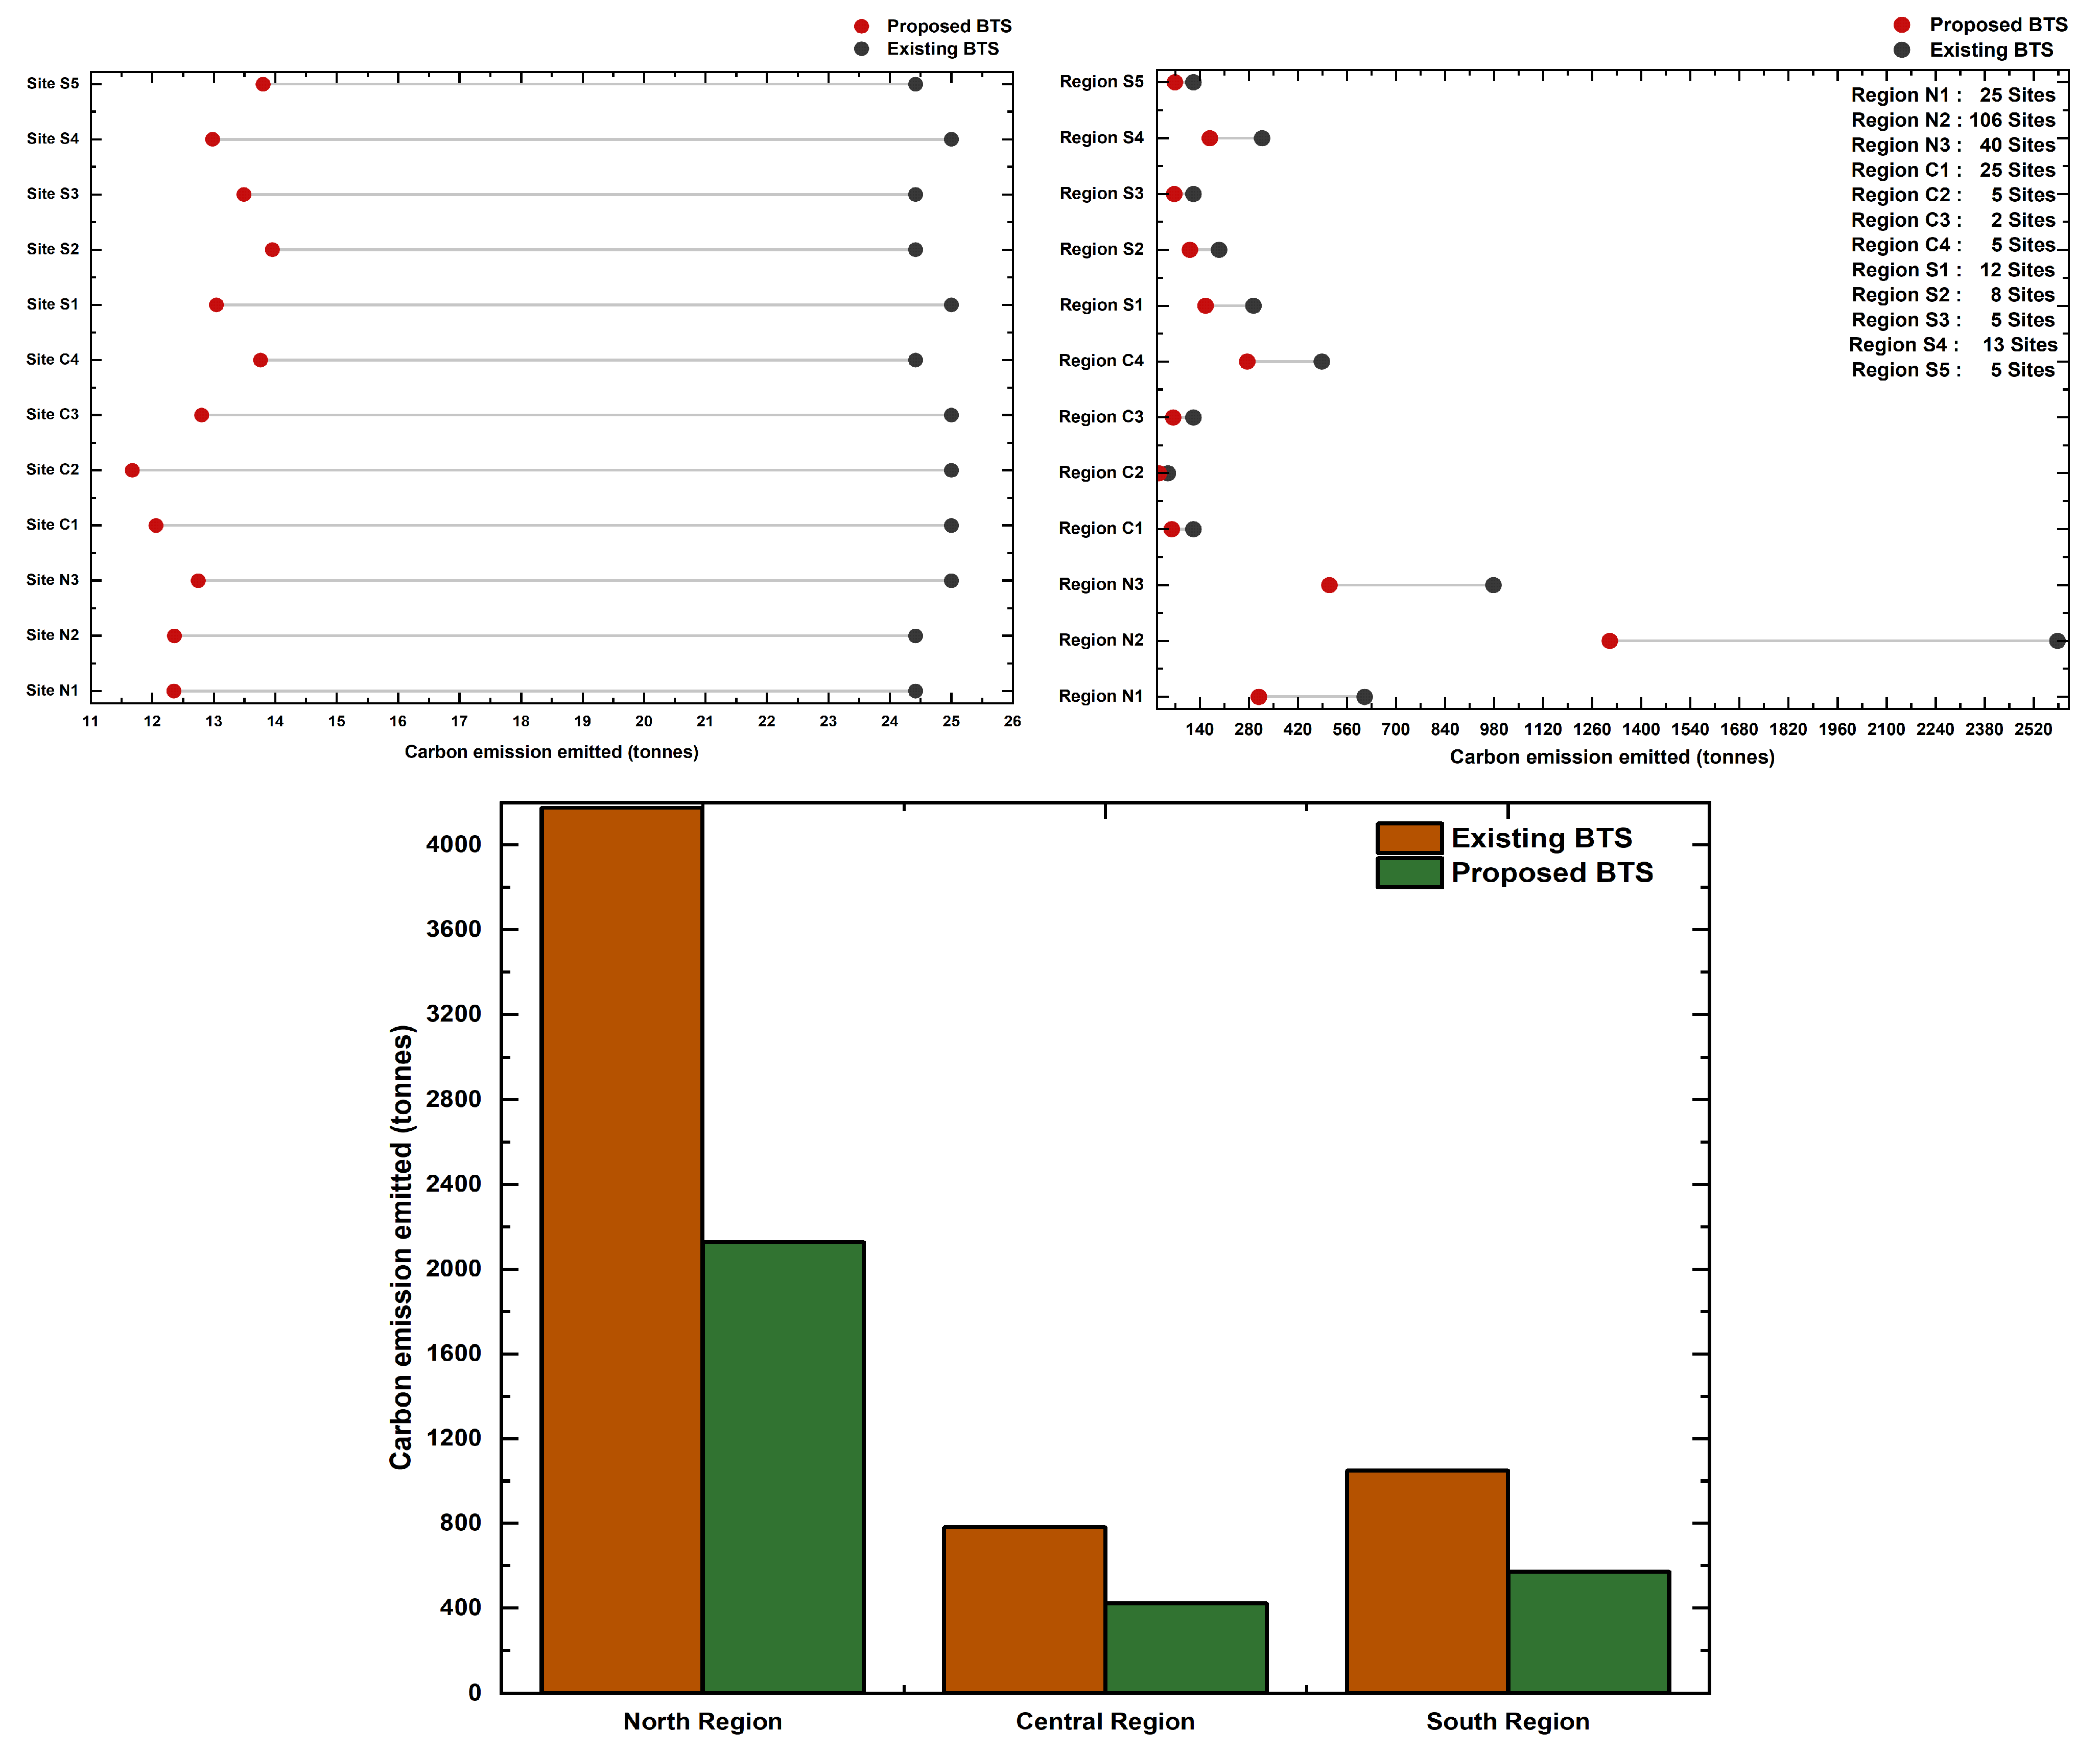
- Stations will become clean source of energy. Thus, there will be no CO2 emission and environmentally friendly systems;
- (2)
- The running hours of DG (diesel generator) is reduced. Thus, the net present cost (NPC) is reduced;
- (3)
- There is less dependency on DG, because the primary source is currently solar energy. Thus, power shortage issues are also resolved.
3.2. Mathematical Model Relationships
3.3. Potential Cases for Implementation of Proposed BTS System
3.3.1. Solar PV Panels
3.3.2. Case of 12 Selective Sites
3.3.3. Case of 263 Selective Sites
4. Case Studies and Results
4.1. Case-A: Technical and Economic Comparison of 2 Base Sites
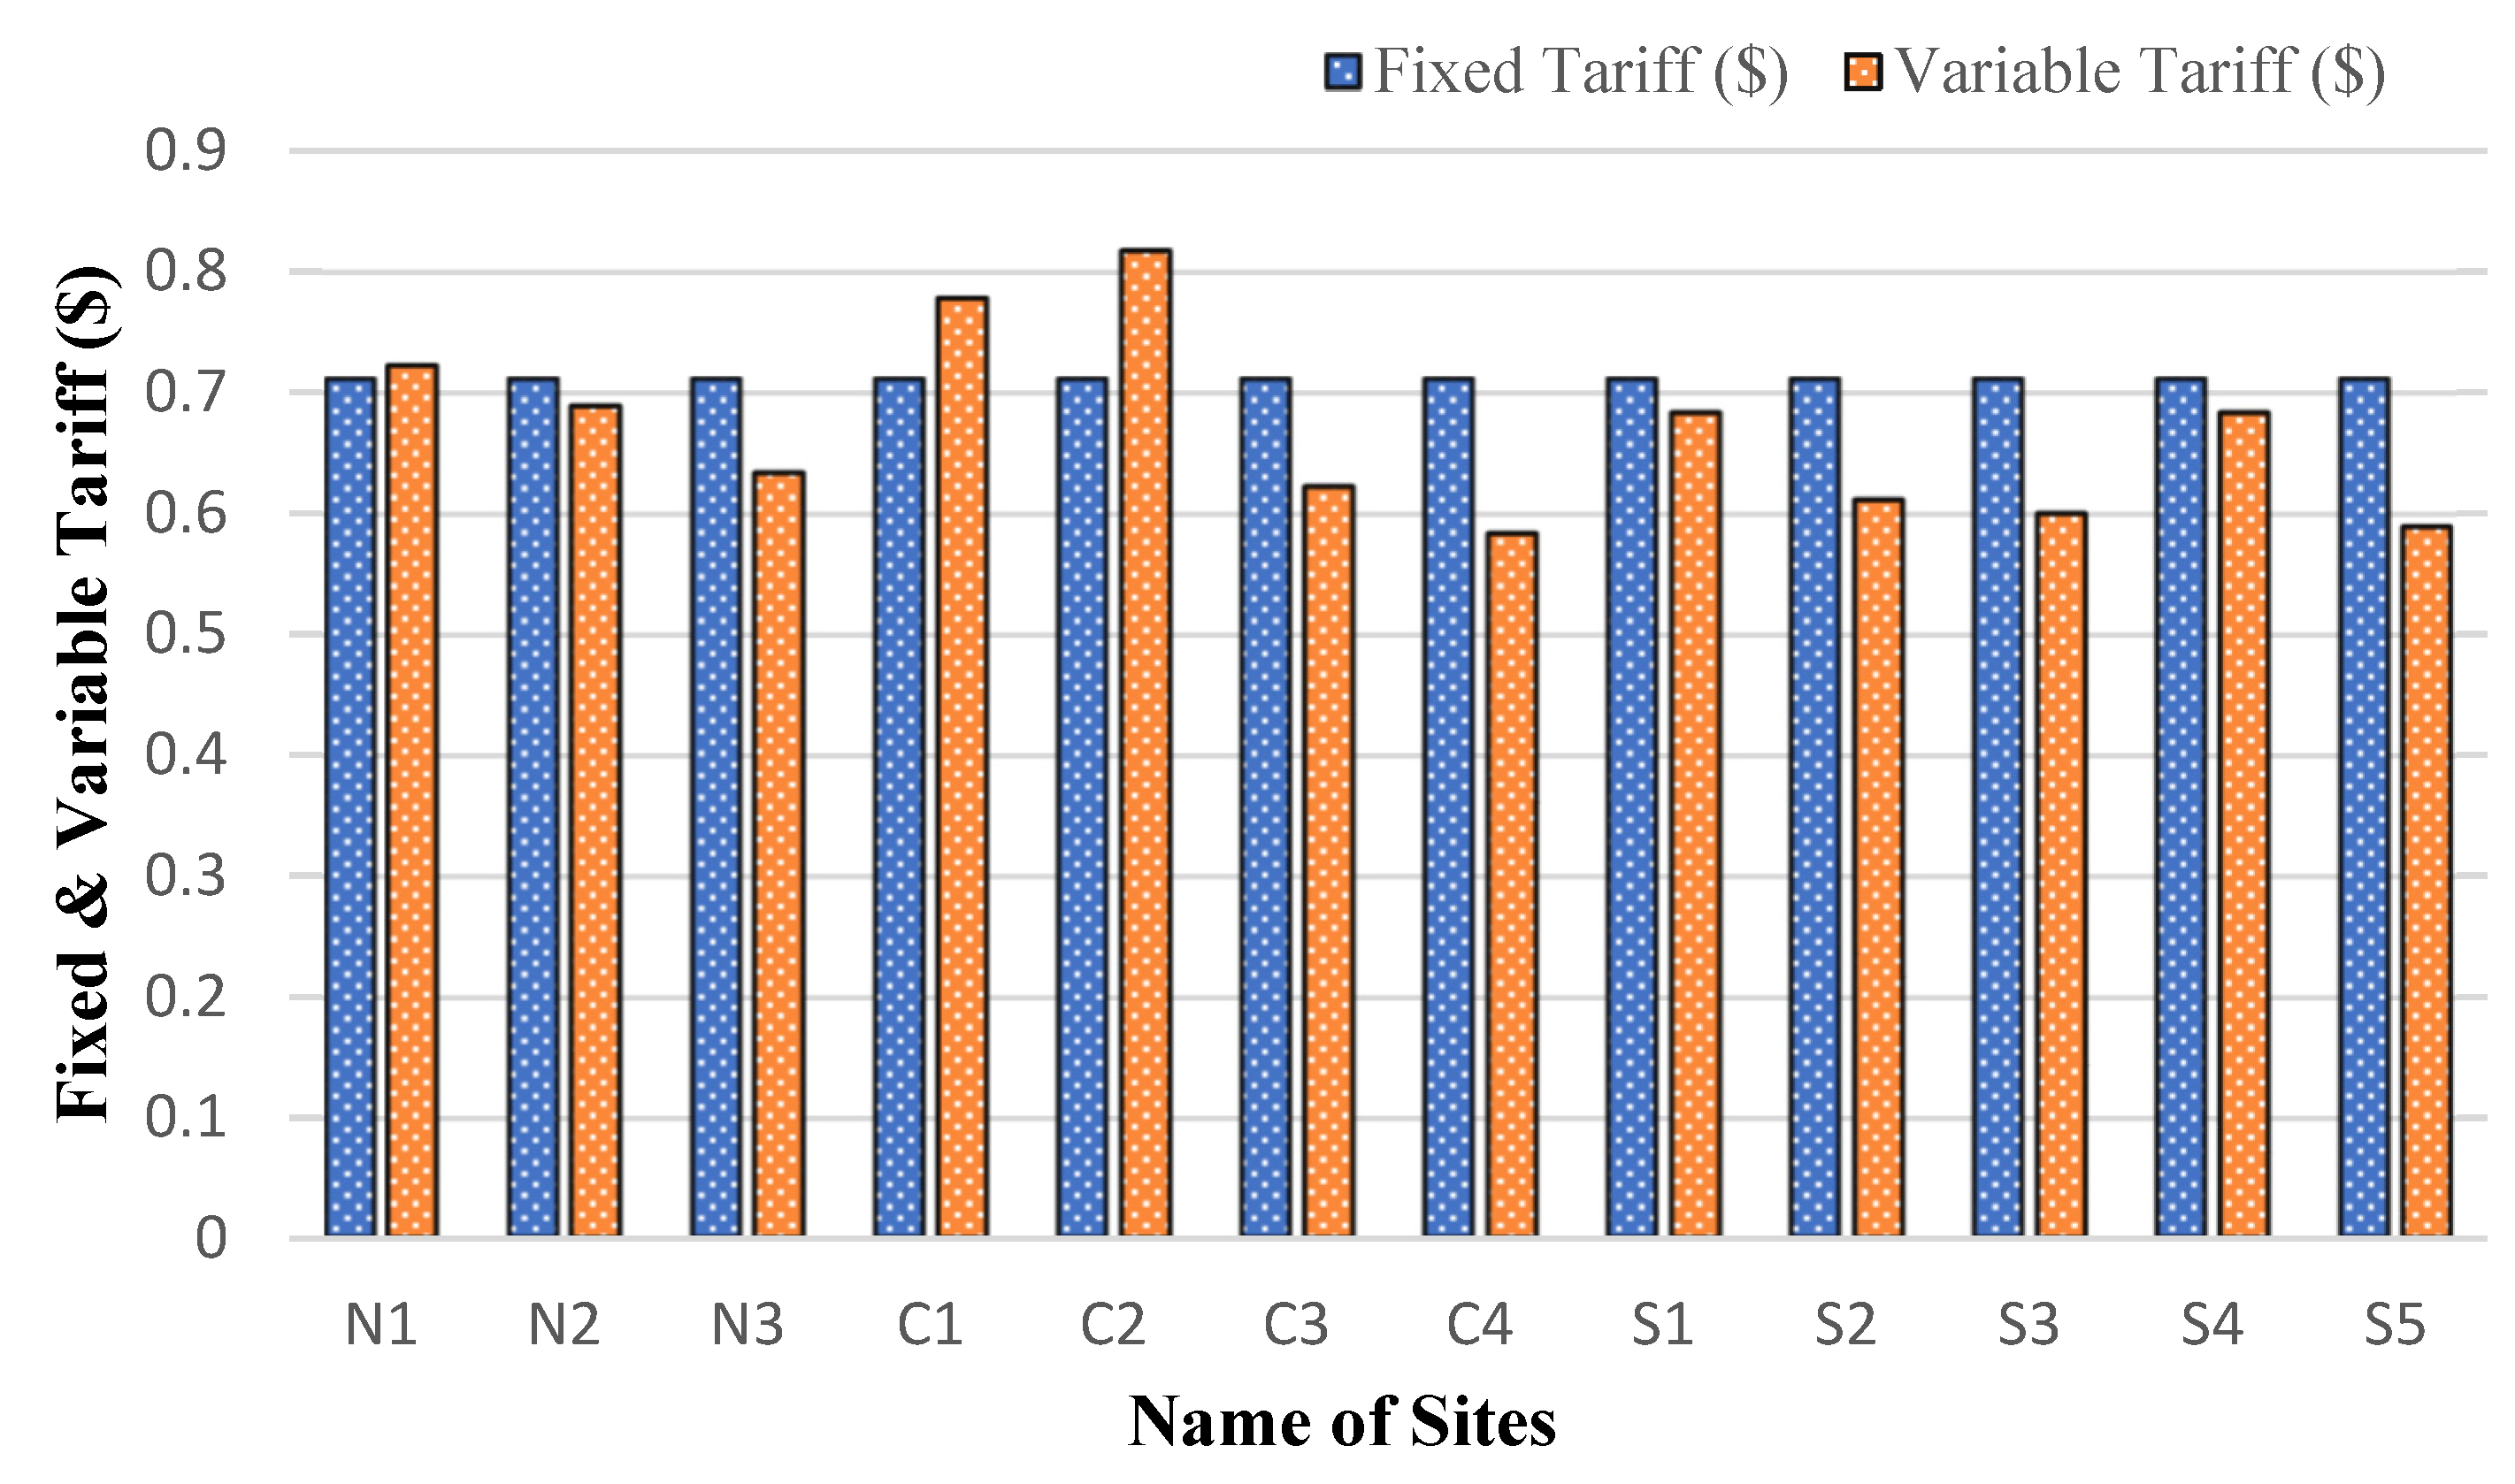
4.2. Selective Sites with Same and Different Tariff
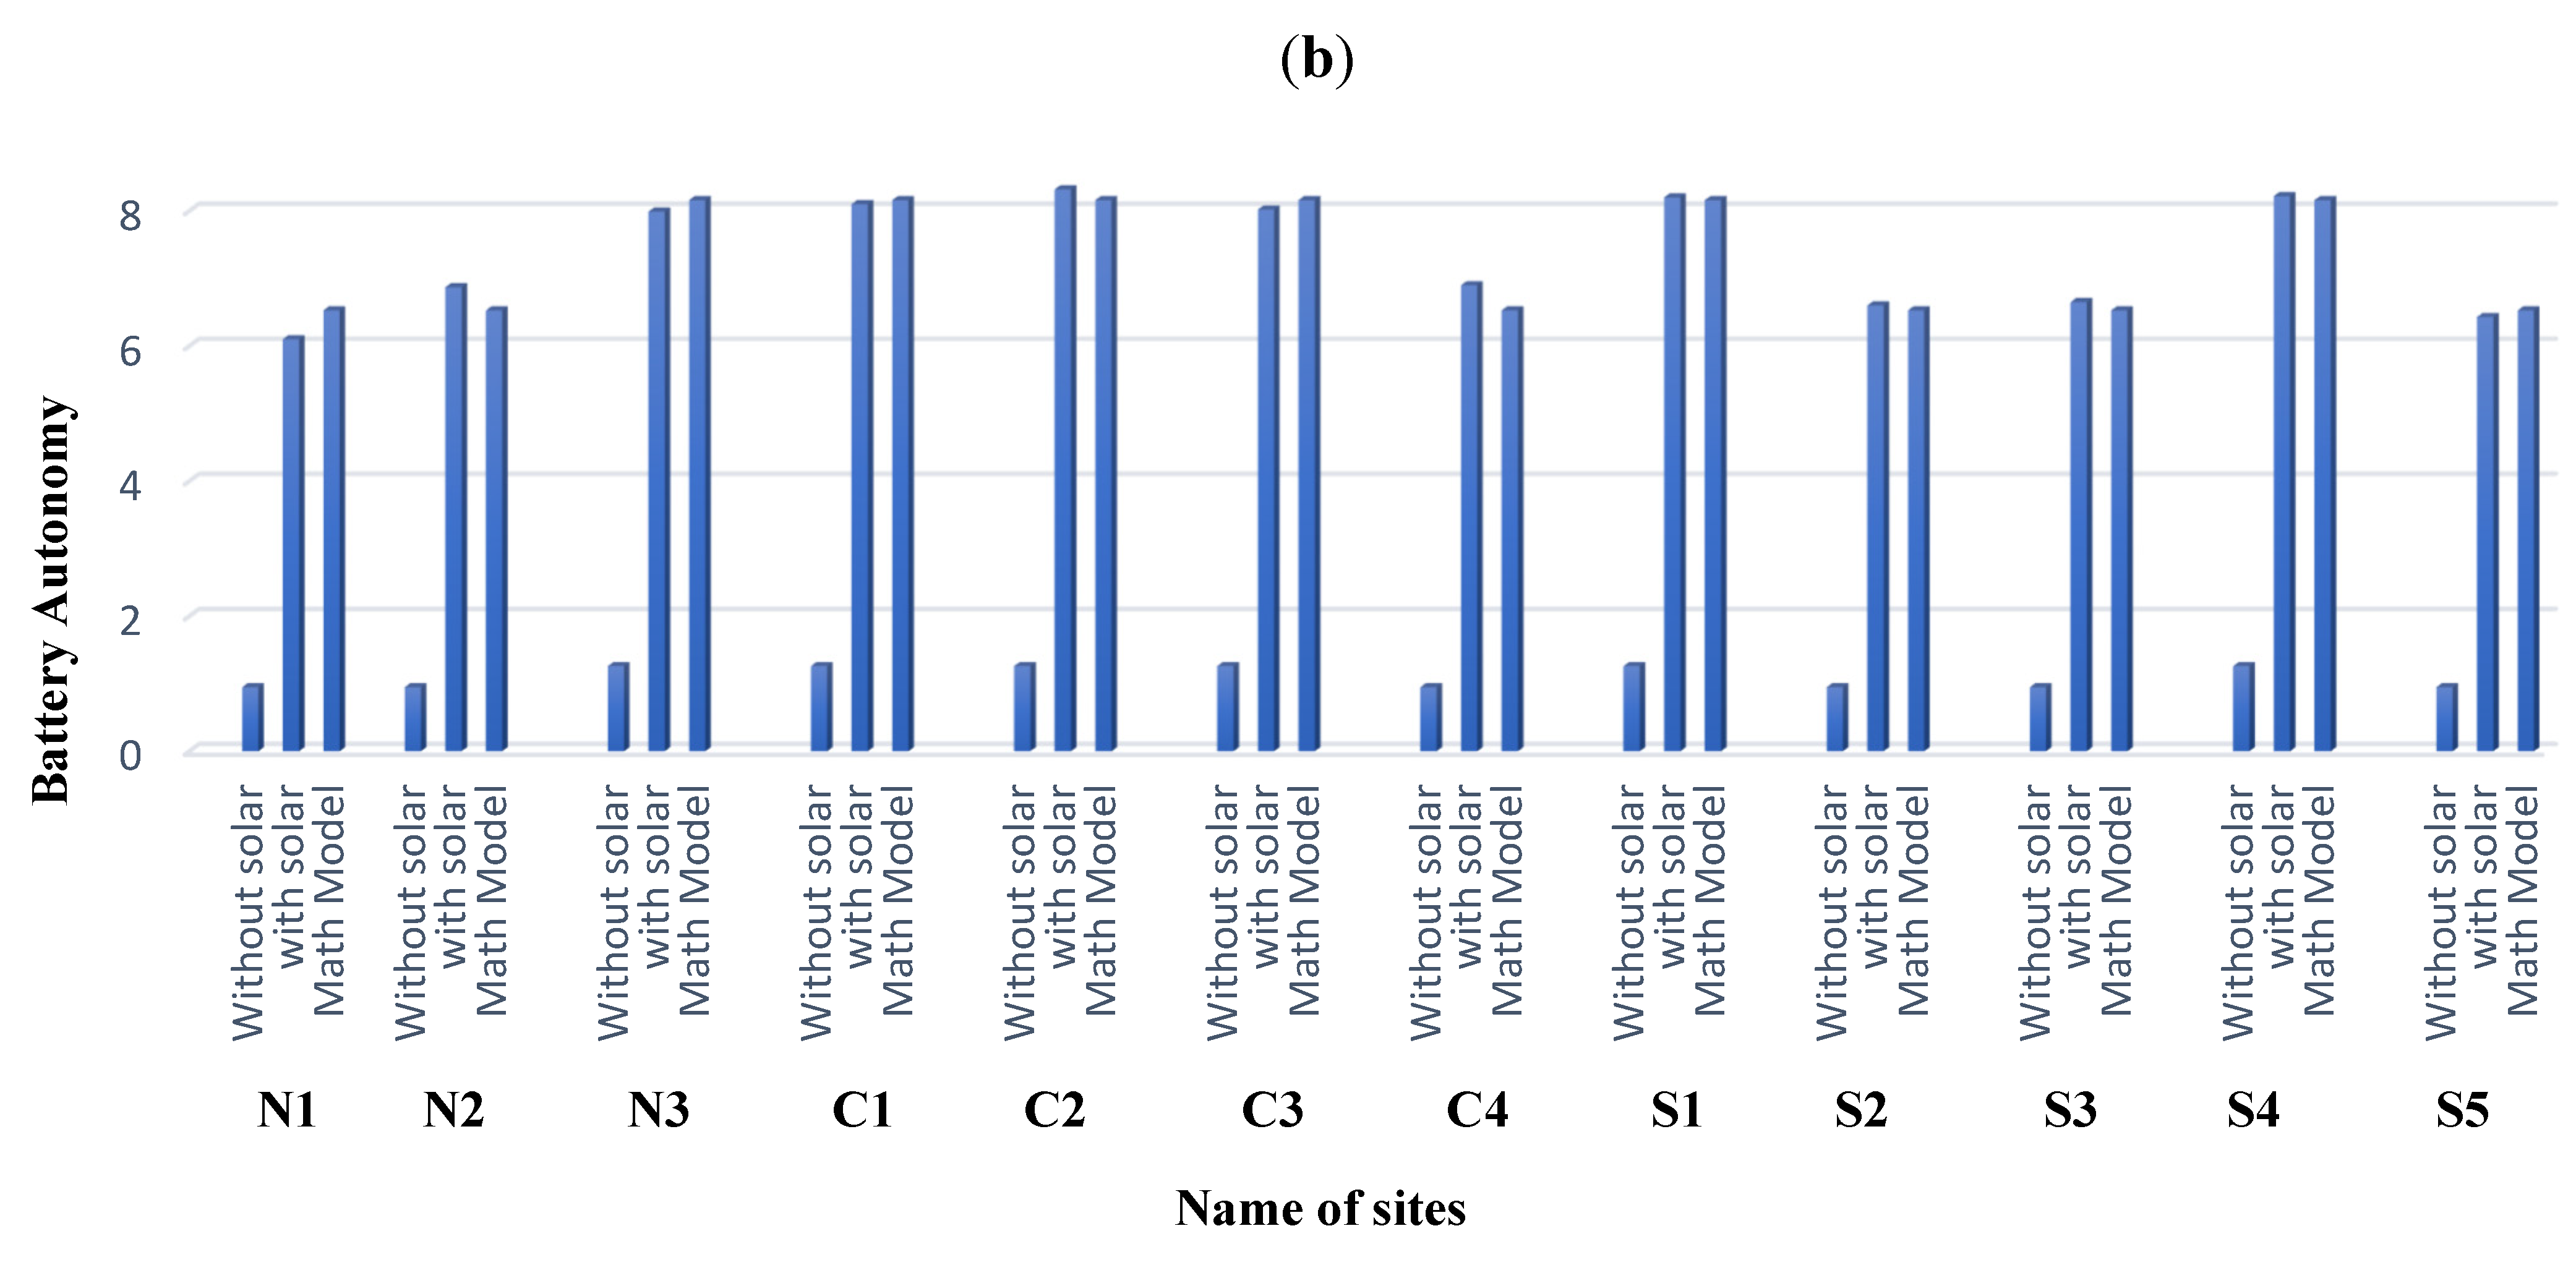
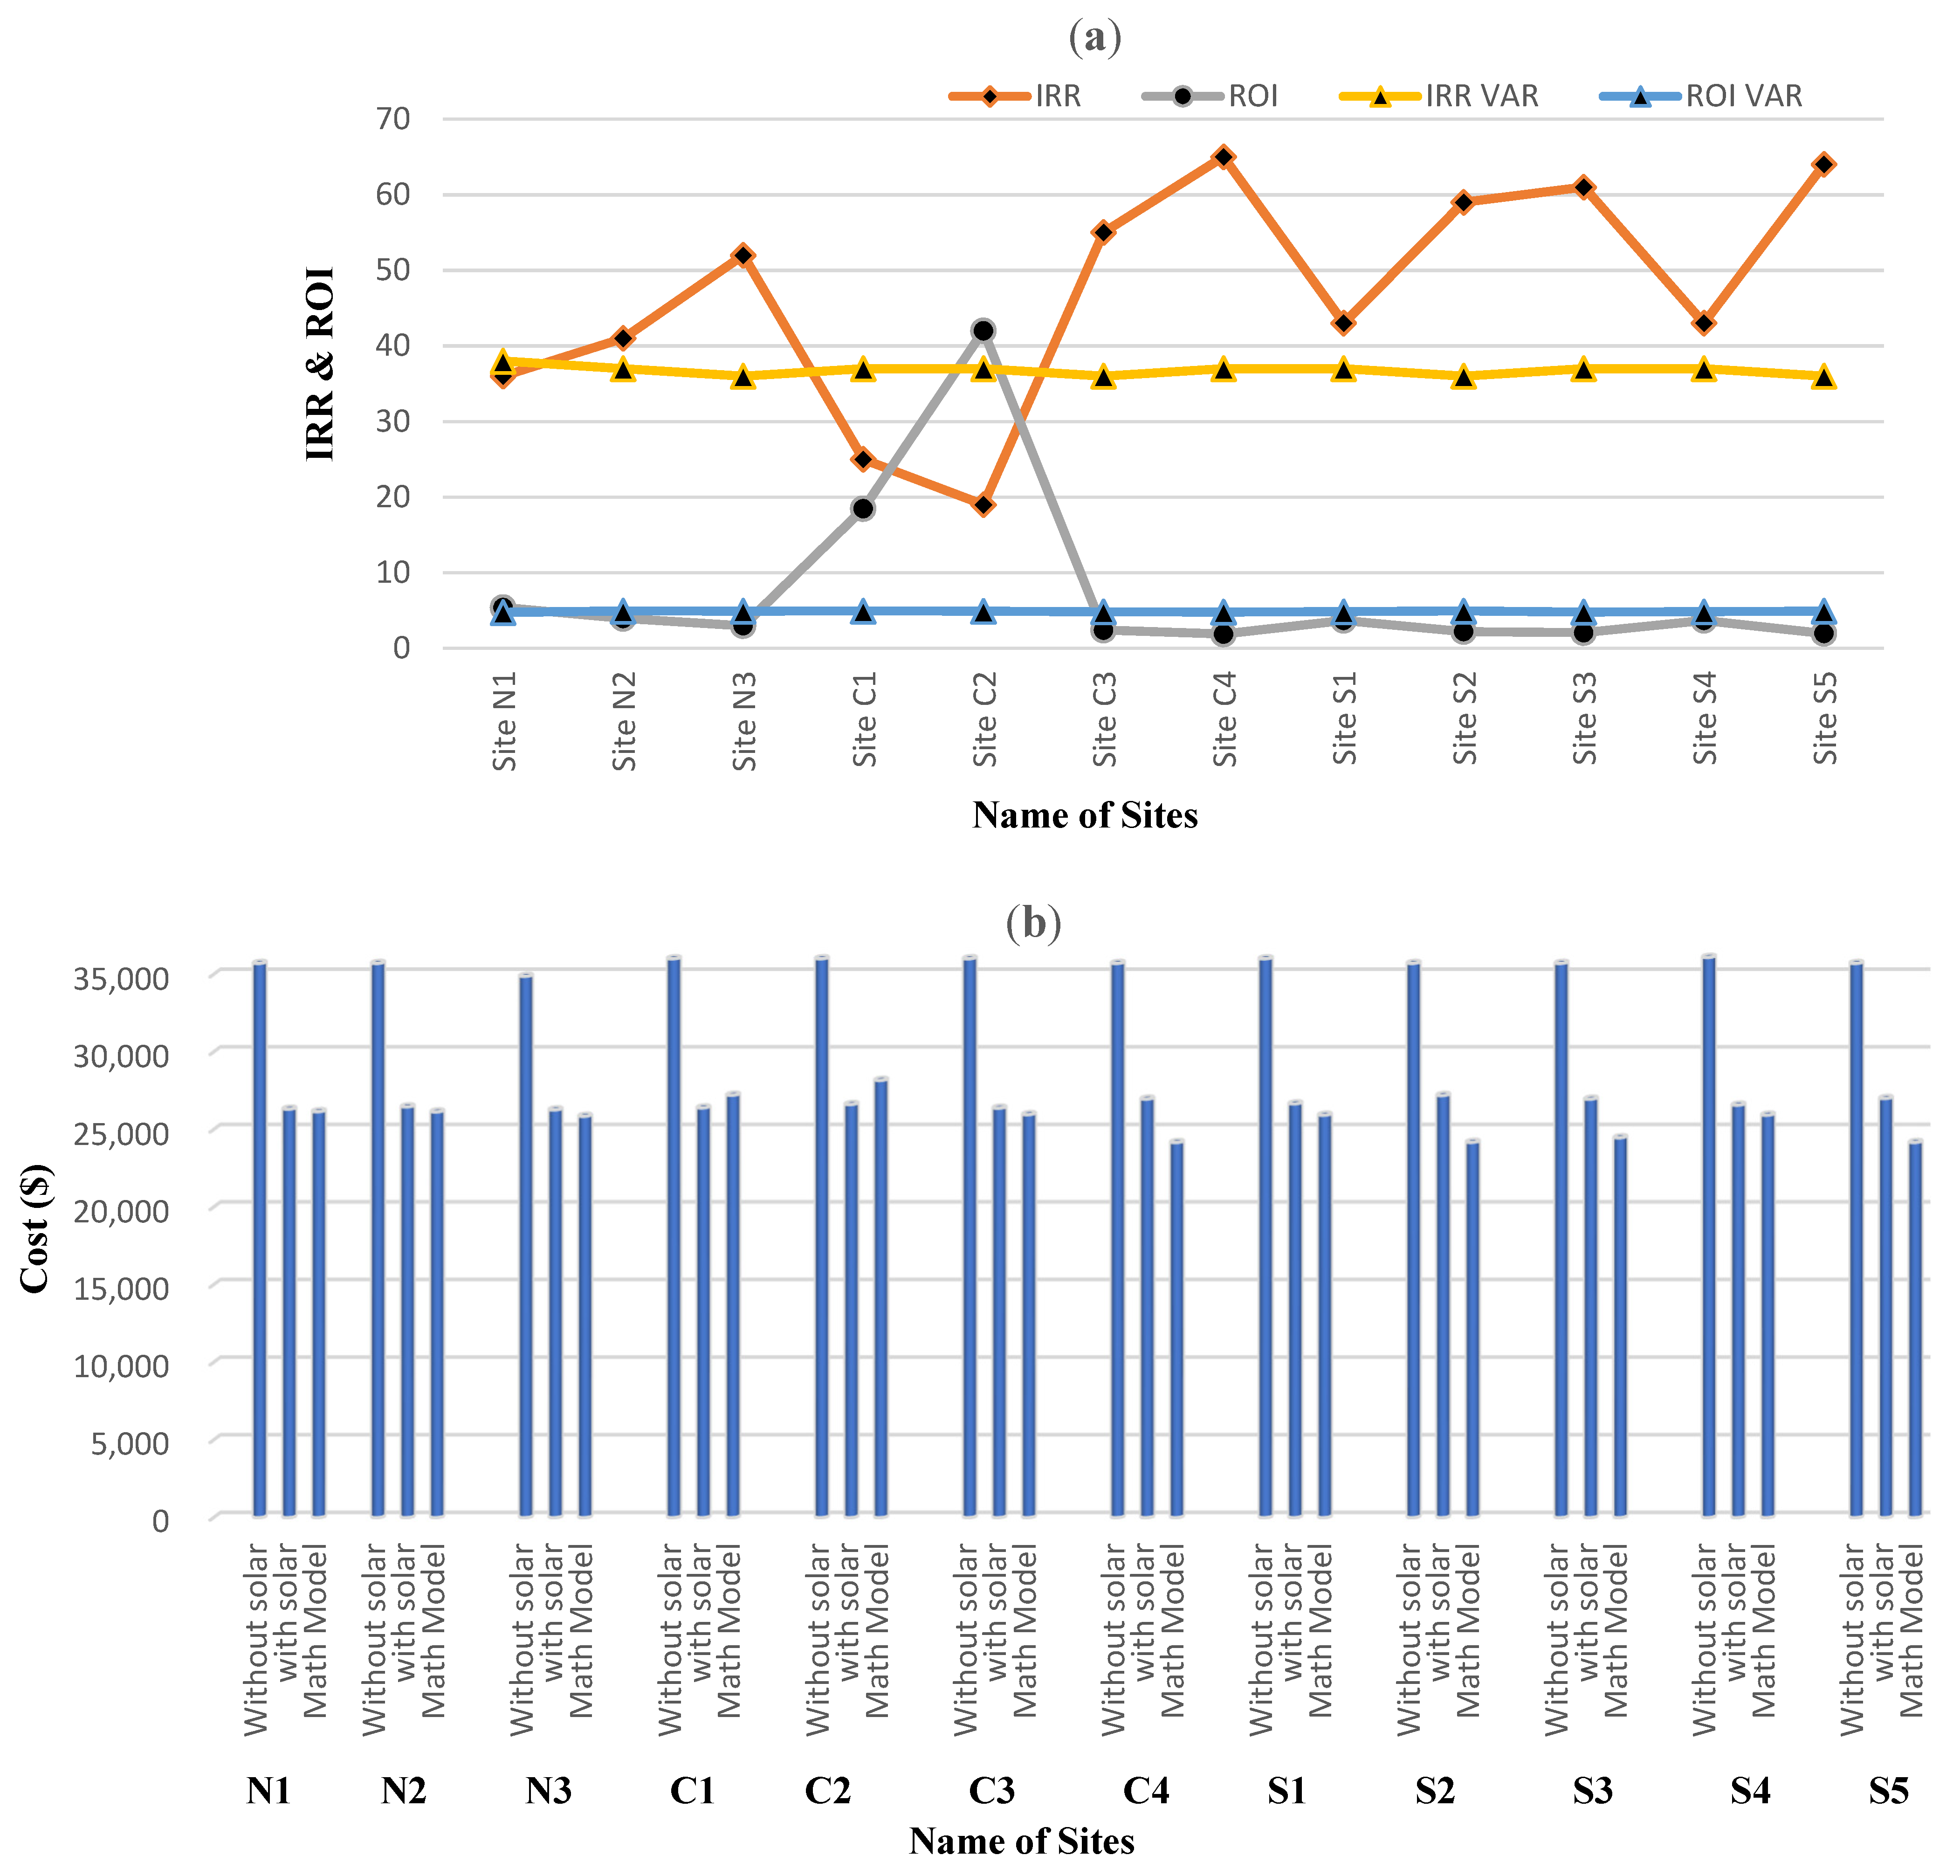
4.3. Case-B: Technical and Economic Comparison of All 12 Sites
4.4. Case-C: Region Wise (N, S and C) Technical and Economic Comparison
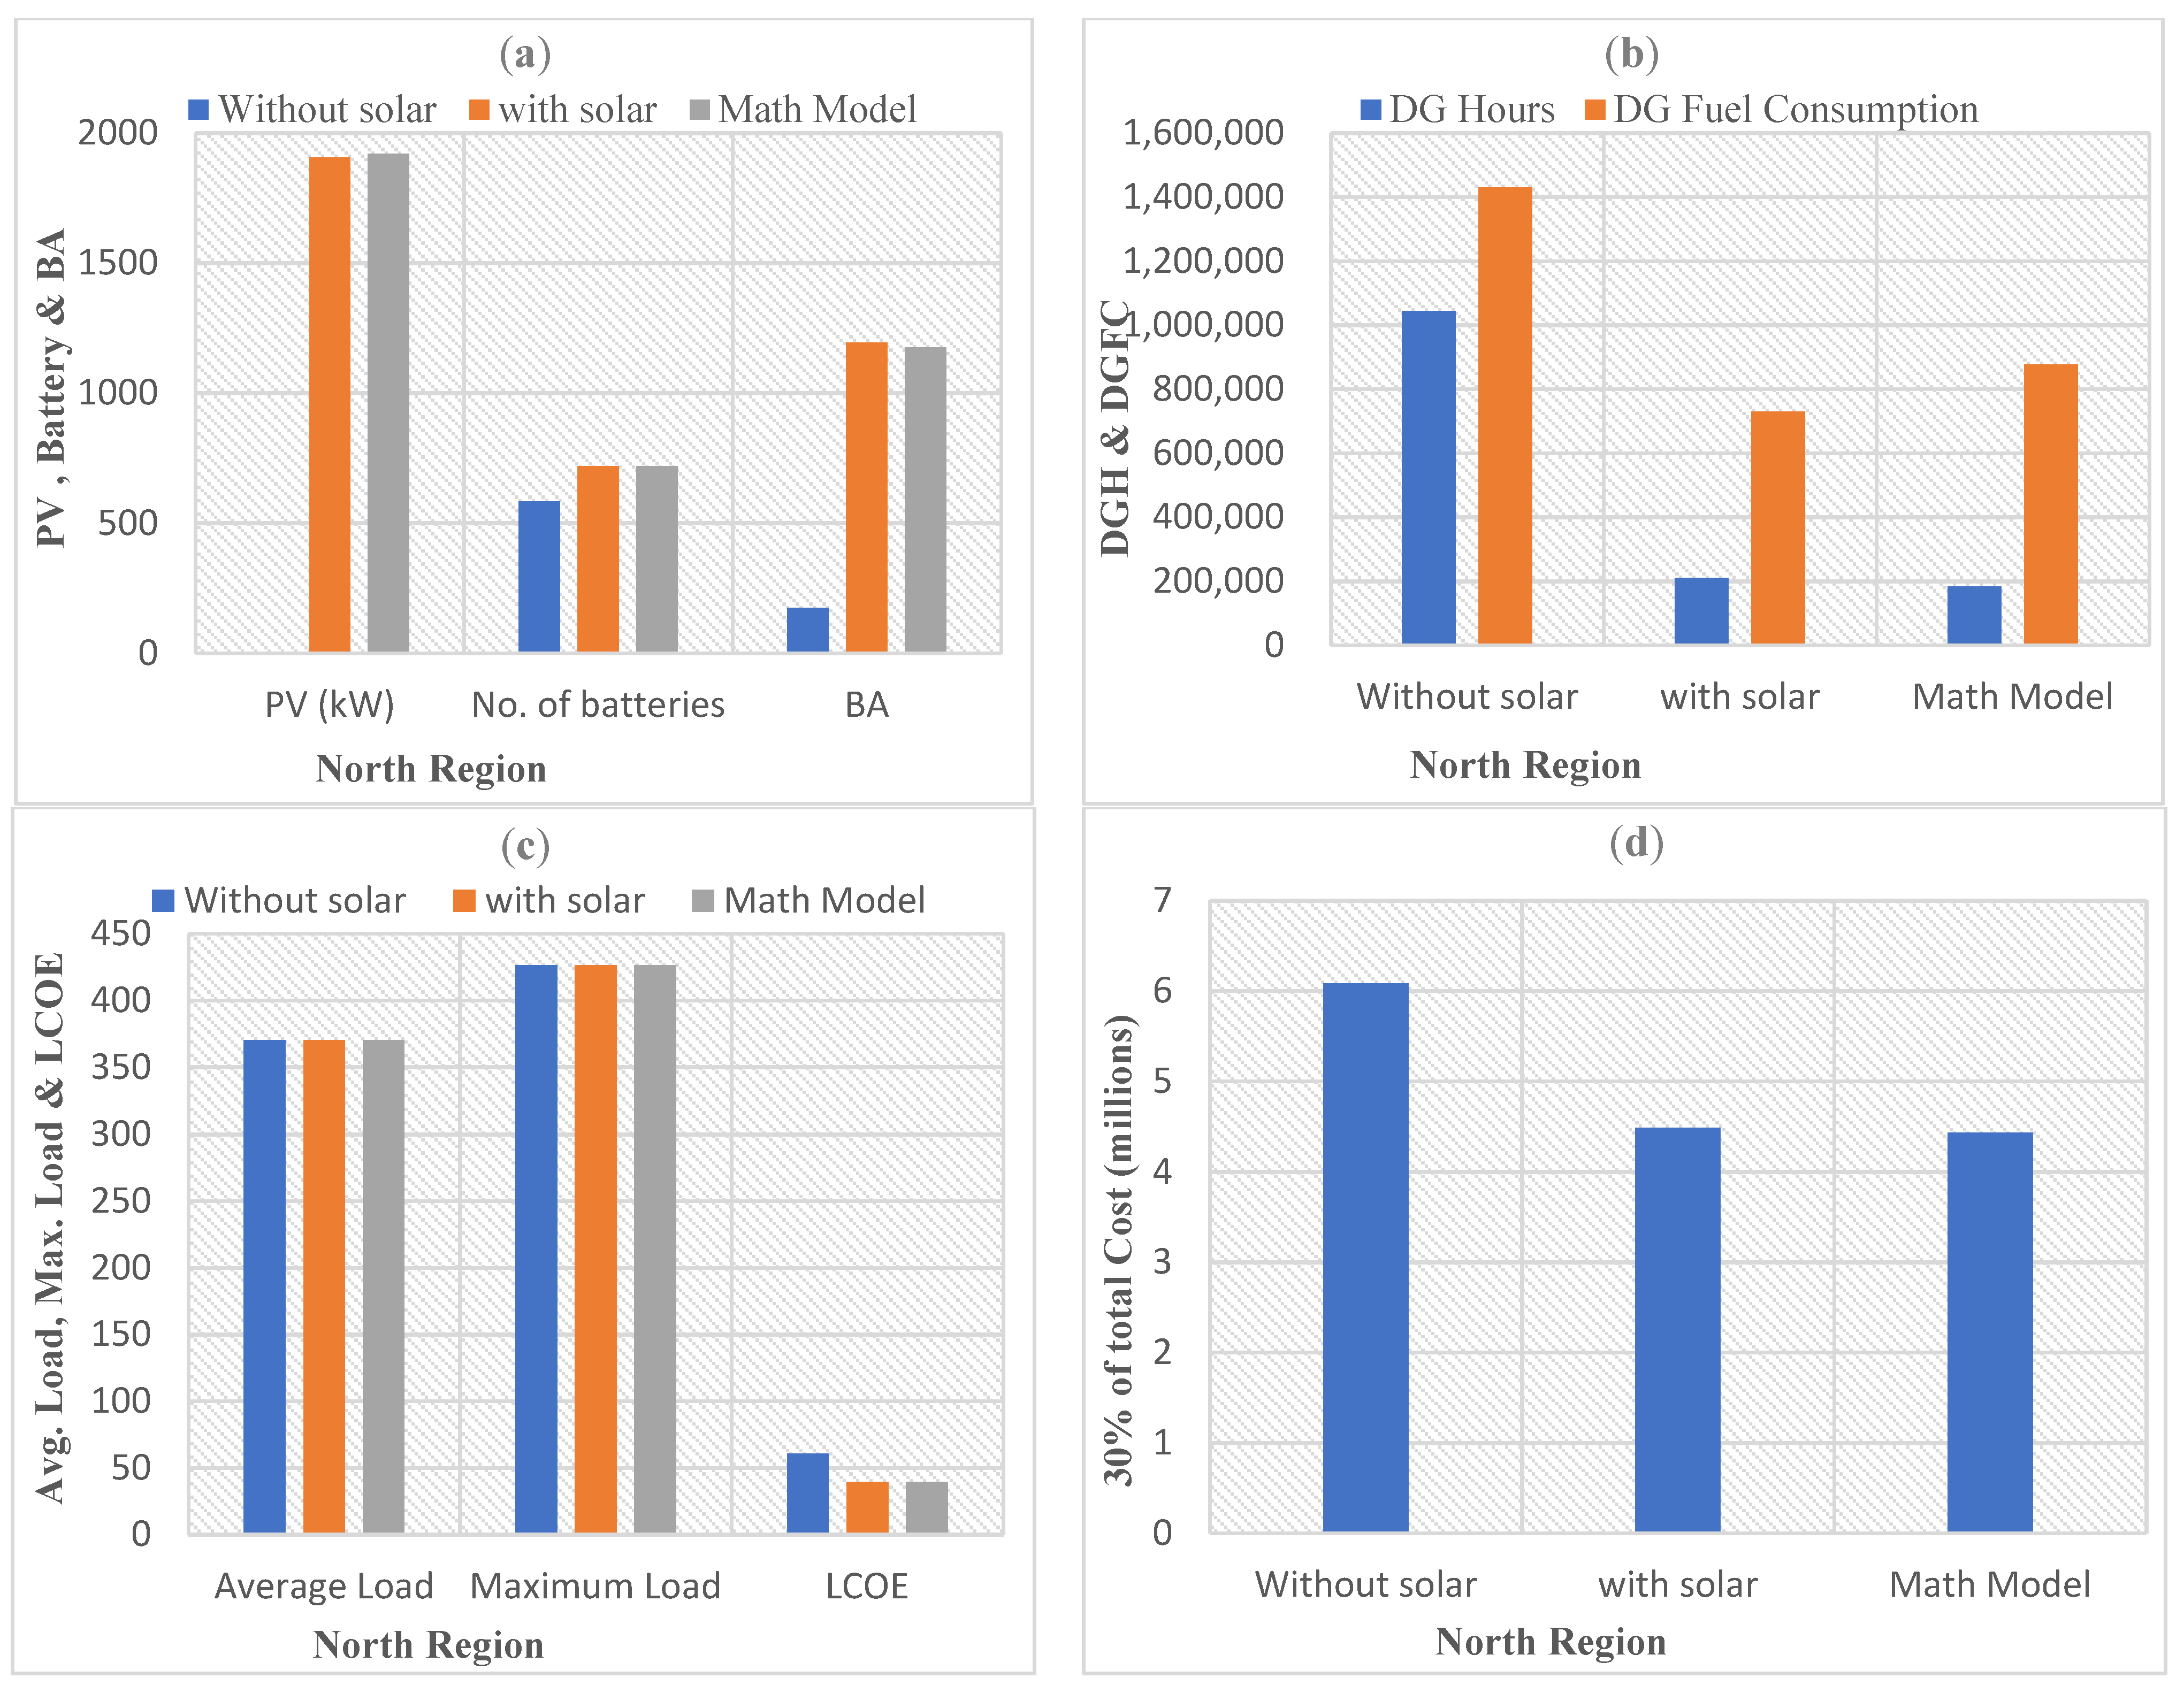
4.4.1. North Region
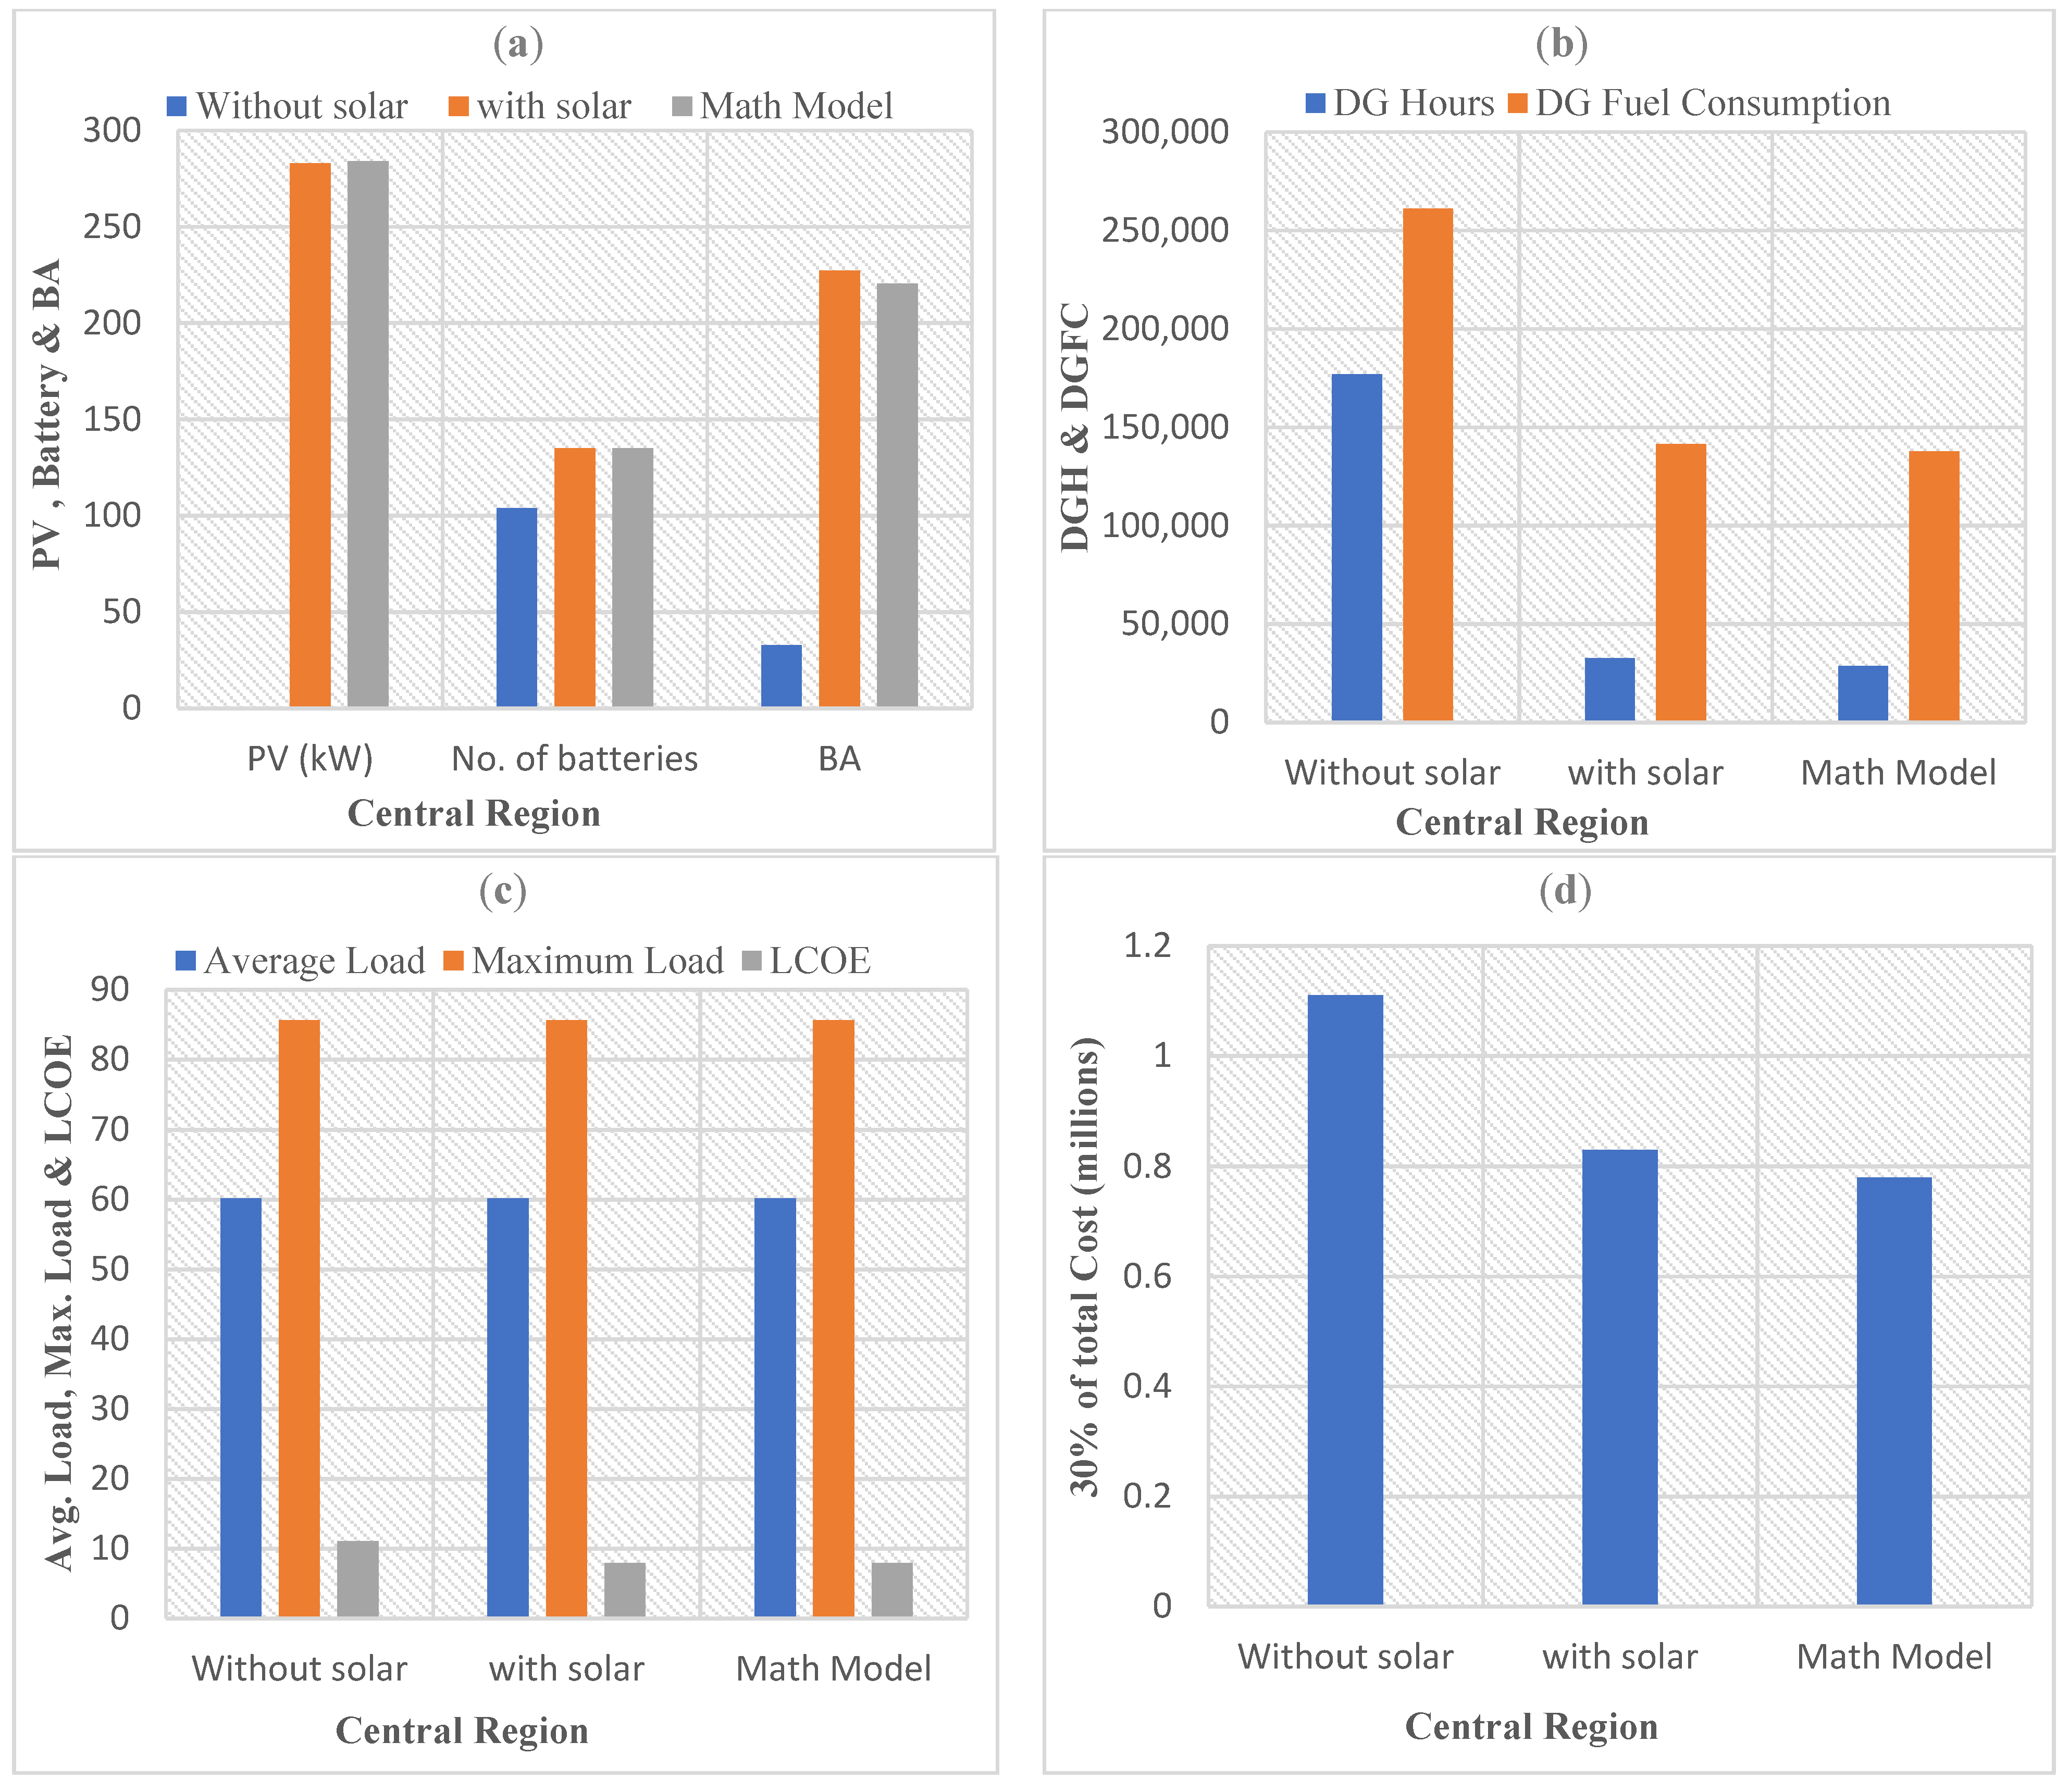
4.4.2. Central Region
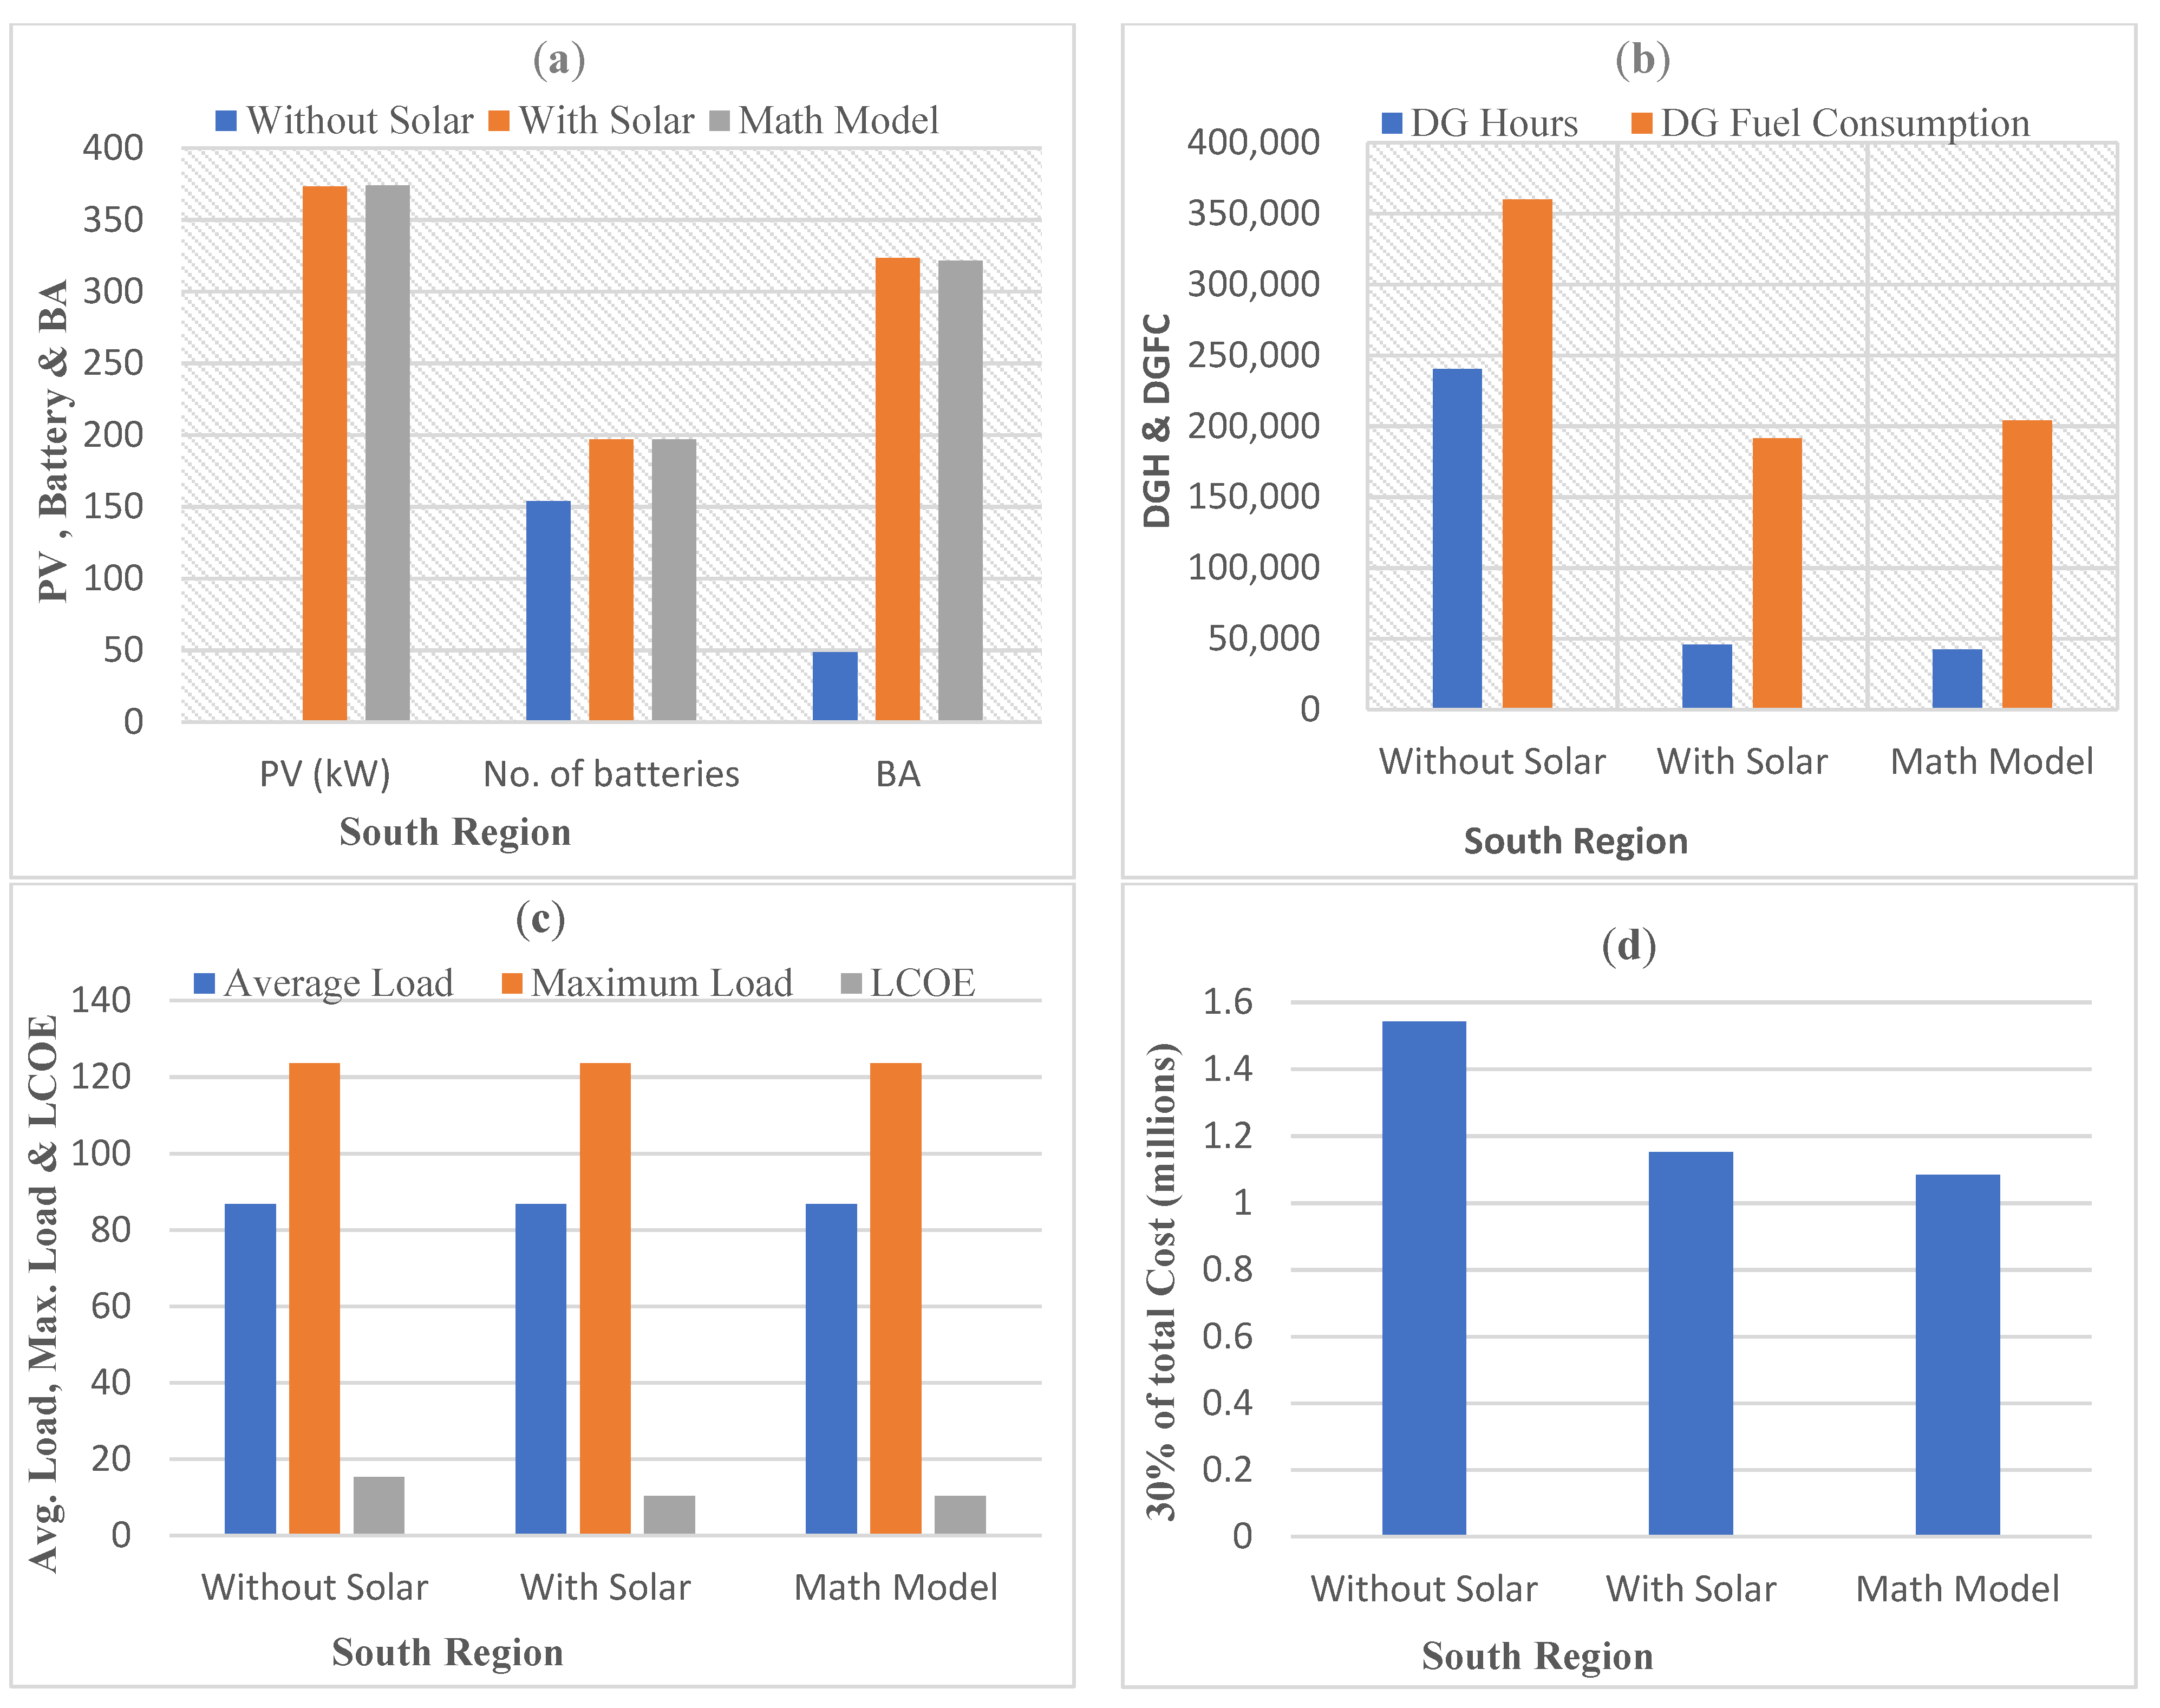
4.4.3. South Region
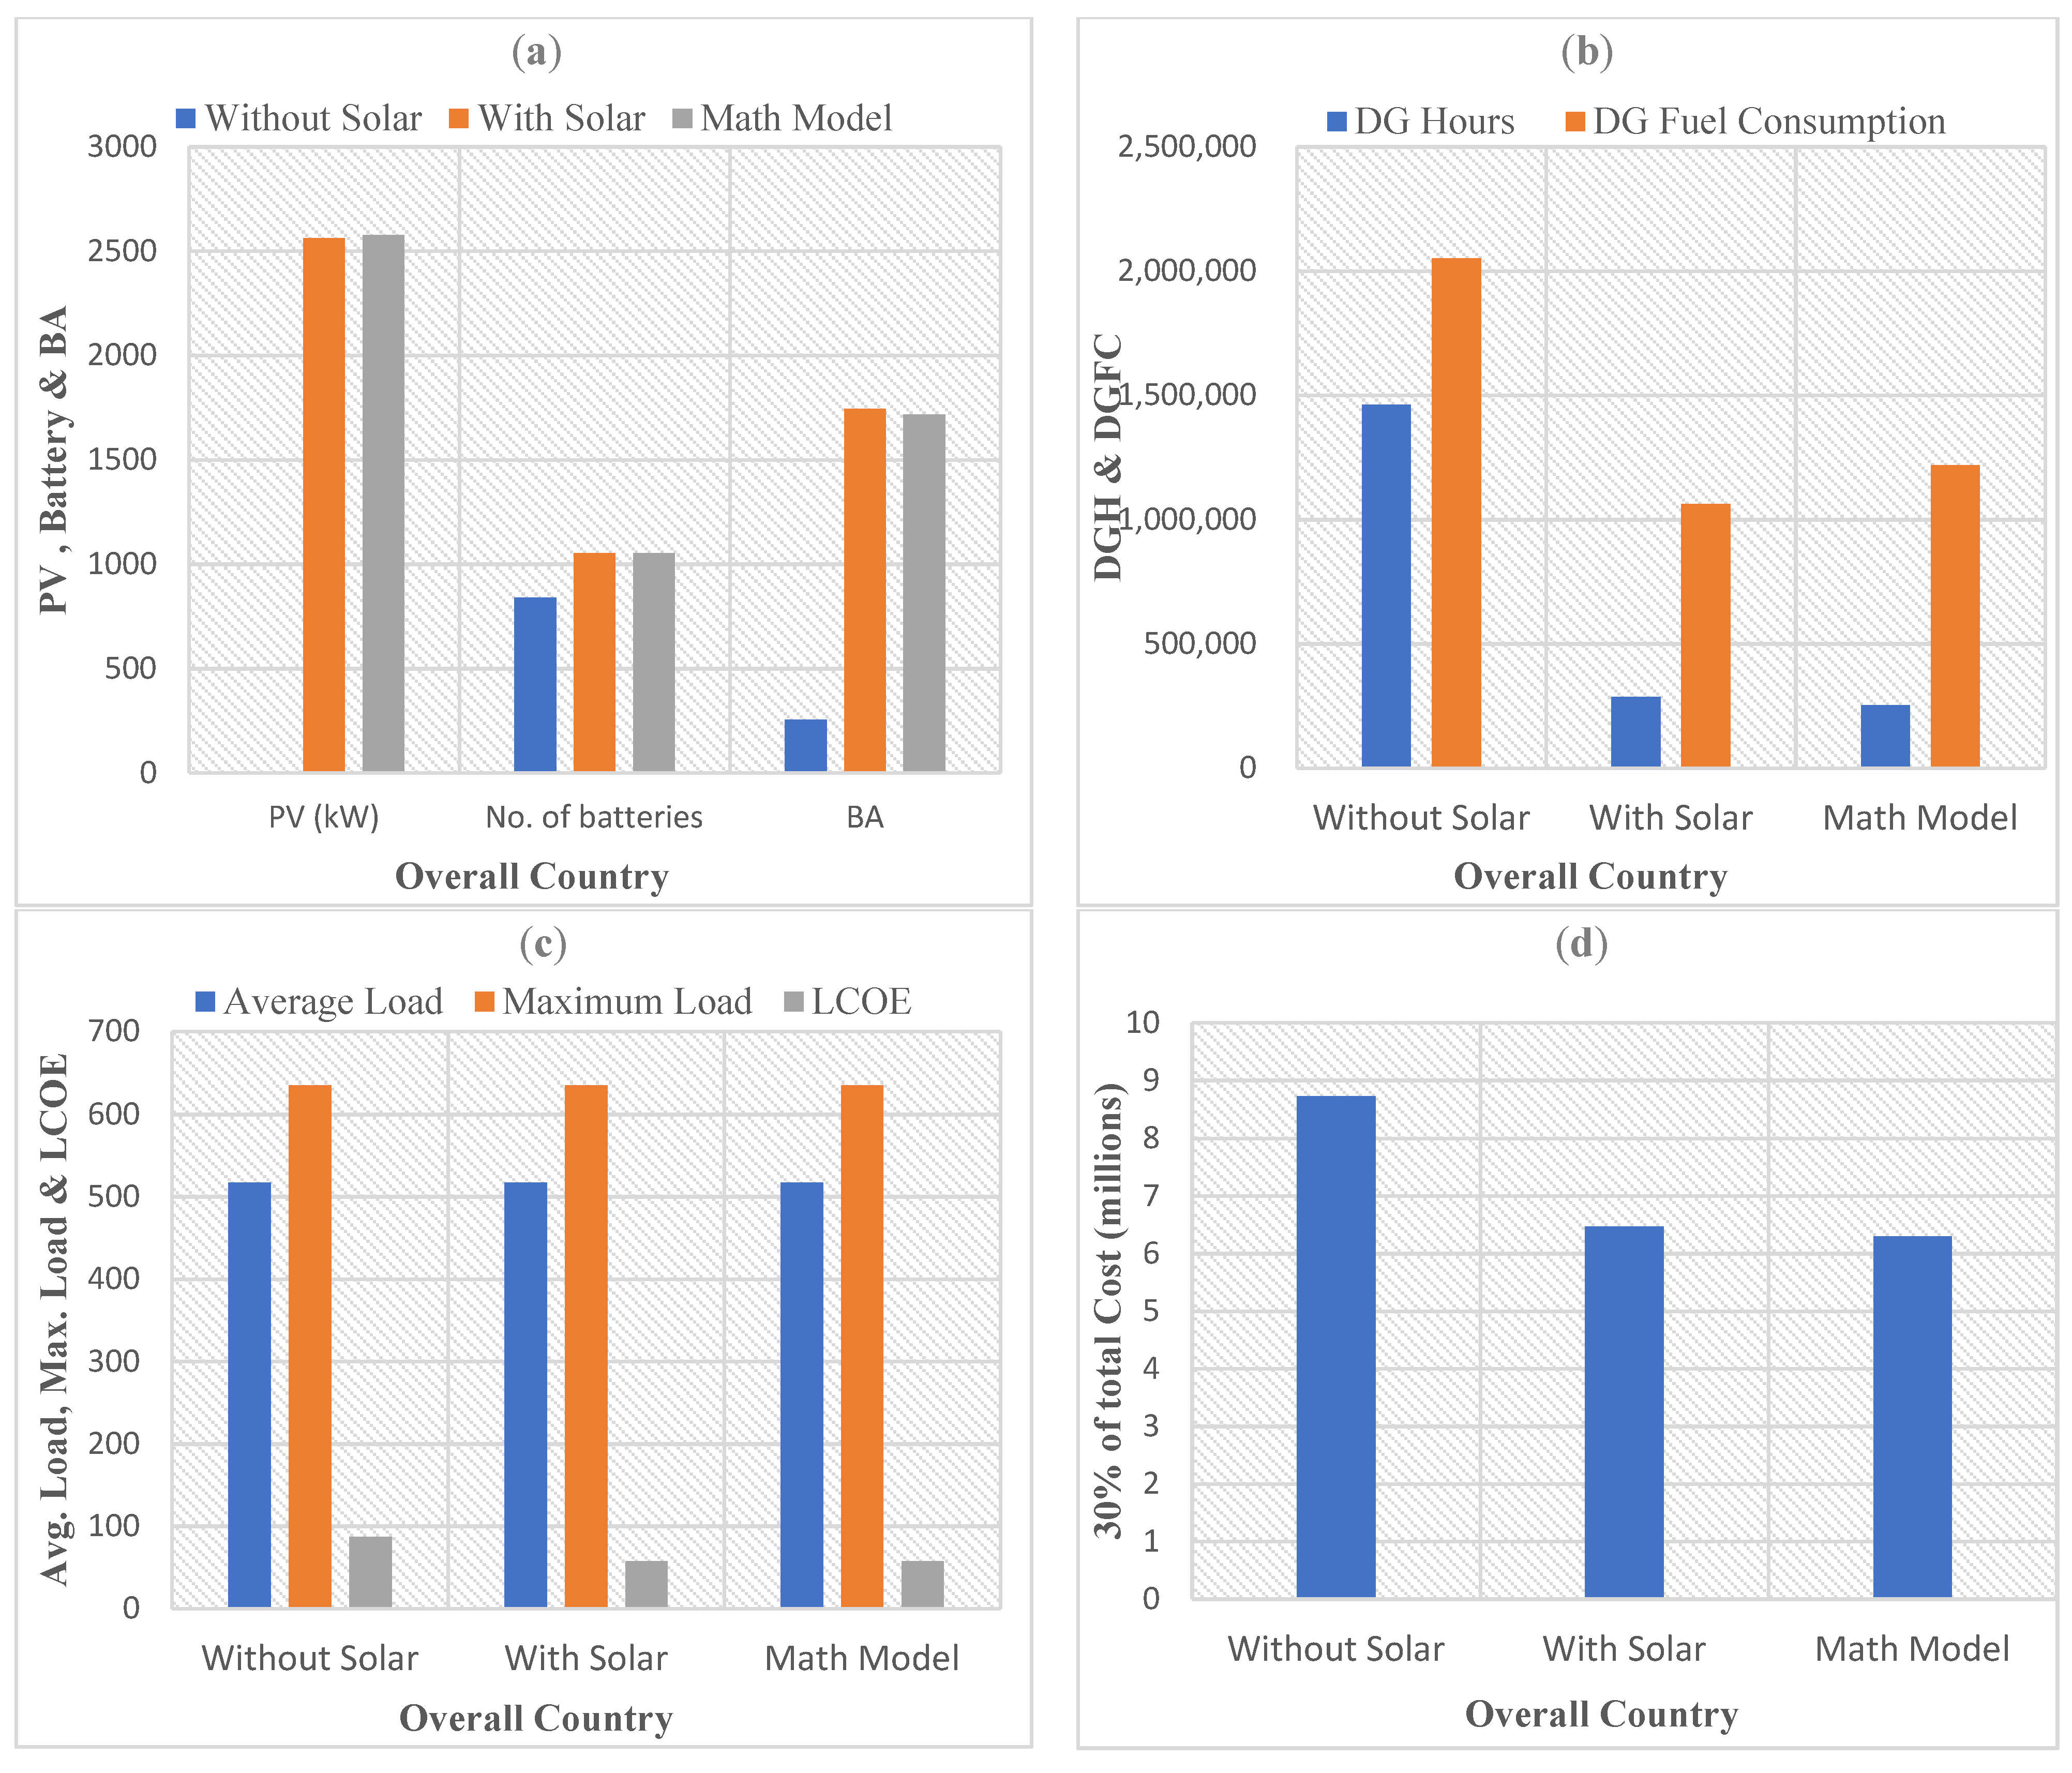
4.5. Case-D: Technical and Economic Comparison of Entire Country (North, Central and South)
4.6. Environmental Analysis
5. Discussion and Conclusions
Author Contributions
Funding
Institutional Review Board Statement
Informed Consent Statement
Data Availability Statement
Acknowledgments
Conflicts of Interest
Nomenclature
| List of Abbreviations | |||
| ARC | Annual Recurring Cost | HRER | Hybrid renewable energy resource |
| AP | Annual Production | HRES | Hybrid renewable energy system |
| AOB | Amount of Bill | HSC | Hybrid System Cost |
| AC | Auxiliary Cost | INF | Inflation |
| ATWC | Anti-theft wall Cost | IC | Insurance Cost |
| BA | Bill Amount | NPC | Net Present Cost ($) |
| BOMC | Battery O & M Cost | LCE | Life cycle emission |
| BSC | Battery Salvage Cost | LCOE | Levelized cost of electricity ($) |
| BP | Bank Payment | LA | Loan Amount |
| BTS | Base Transceiver Stations | LCC | Line conditioner Cost |
| BP | Bank Payment | LIC | Li-ion Battery Cost |
| BCR | Battery Cycle Rate | MBP | Monthly Bank Payment |
| BESS | Battery energy storage system | MG | Micro-grid |
| BA | Bill Amount | MGS | Multi-generation system |
| BOGF | Bill of Generator Fuel | MGT | Micro gas turbine |
| BOMC | Battery O & M Cost | NPC | Net Present Cost |
| BSC | Battery Salvage Cost | OMC | O & M Cost |
| COS | Cost of System | OMIC | (O & M + Insurance) Cost |
| COE | Cost of energy ($) | PPI | Previous Paid Installment |
| COER | Cost of Energy Replaced | PV | Photovoltaic |
| COUS | Cost of Unit saved | PABP | Profit after Bank Payment |
| CI | Cash Investment | PBM | Month required for payback |
| CPC | CP Bill Cost | RWH | Recovering waste heat |
| DGH | DG hours | RE | Renewable Energy |
| DGFC | DG Fuel Consumption | RPC | DG & rectifier Pads Cost |
| DG | Diesel Generator | RC | Refueling Cost |
| DER | Distributed energy resources | RMSC | RMS Cost |
| DPSP | Deficiency of power supply probability | RCC | Rectifier Cabinet Cost |
| DGC7 | 07 kVA DG Cost | ROI | Return on Investment |
| DGC13 | 13 kVA DG Cost | RMC | Rectifier Module 3000 W Cost |
| DGC27 | 27 kVA DG Cost | RAT | Revenue after Tax |
| DGCC | DG Consumable Cost | SCWC | Solar civil work Cost |
| DGMC | DG material Cost | STIC | Solar transportation & installation Cost |
| DGOHC | DG Overhauling Cost | STC | System transportation Cost |
| DTC | Design & test Cost | SMC | Solar Modules 3000 W Cost |
| EP | Equity Payment | SMC | Smart Meter Cost |
| EE | Excess Energy (kWh) | SC | Security Cost |
| EPC | Electrical Part Cost | SMTC | RMS/S.M maintenance Cost |
| EFC | Extra Fuel till Energization Cost | SSC | Site Survey Cost |
| EC | Energization Cost | SHC | Site HOTO Cost |
| ES | Energy saving | SMRC | Solar Module Replacement Cost |
| FCs | Fuel Cell | SPMC | Solar PV modules per watt Cost |
| FCP | Fuel Consumption | SoC | State of charge |
| FC | Fuel Cost | TIS | Total Installed Solar |
| FR | Fuel Rate | TI (%) | Total Investment Portion |
| GF | Generator Fuel | TLP | Total Loan Payment |
| GC | Grounding Cost | TLC | Thermal load controller |
| HES | Hybrid energy system | TV | Tax Value/Cost of Tax |
| HOMER | Hybrid optimization model for electric renewable | TNPC | Total net present cost |
| ARC | Annual Recurring Cost | TC | Team Cost |
| AP | Annual Production | WT | Wind turbine |
| AOB | Amount of Bill | ||
Appendix A

References
- Al Garni, H.; Awasthi, A. Techno-Economic Feasibility Analysis of a Solar PV Grid-Connected System with Different Tracking Using HOMER Software. In Proceedings of the 2017 IEEE International Conference on Smart Energy Grid Engineering (SEGE), Oshawa, ON, Canada, 14–17 August 2017. [Google Scholar]
- Ali, M.; Wazir, R.; Imran, K.; Ullah, K.; Janjua, A.K.; Ulasyar, A.; Khattak, A.; Guerrero, J.M. Techno-economic assessment and sustainability impact of hybrid energy systems in Gilgit-Baltistan, Pakistan. Energy Rep. 2021, 7, 2546–2562. [Google Scholar] [CrossRef]
- Khan, F.A.; Pal, N.; Saeed, S.H. Optimization and sizing of SPV/Wind hybrid renewable energy system: A techno-economic and social perspective. Energy 2021, 233, 121114. [Google Scholar] [CrossRef]
- Elbar, A.R.A.; Yousef, M.S.; Hassan, H. Energy, exergy, exergoeconomic and enviroeconomic (4E) evaluation of a new integration of solar still with photovoltaic panel. J. Clean. Prod. 2019, 233, 665–680. [Google Scholar] [CrossRef]
- Al Garni, H.Z.; Awasthi, A.; Ramli, M.A. Optimal design and analysis of grid-connected photovoltaic under different tracking systems using HOMER. Energy Convers. Manag. 2017, 155, 42–57. [Google Scholar] [CrossRef]
- Alsharif, M.H. Optimization design and economic analysis of energy management strategy based on photovoltaic/energy storage for heterogeneous cellular networks using the HOMER model. Sol. Energy 2017, 147, 133–150. [Google Scholar] [CrossRef]
- Odoi-Yorke, F.; Woenagnon, A. Techno-economic assessment of solar PV/fuel cell hybrid power system for telecom base stations in Ghana. Cogent Eng. 2021, 8, 1911285. [Google Scholar] [CrossRef]
- Das, B.K.; Hassan, R.; Tushar, M.S.H.; Zaman, F.; Hasan, M.; Das, P. Techno-economic and environmental assessment of a hybrid renewable energy system using multi-objective genetic algorithm: A case study for remote Island in Bangladesh. Energy Convers. Manag. 2021, 230, 113823. [Google Scholar] [CrossRef]
- Das, B.K.; Tushar, M.S.H.; Zaman, F. Techno-economic feasibility and size optimisation of an off-grid hybrid system for supplying electricity and thermal loads. Energy 2020, 215, 119141. [Google Scholar] [CrossRef]
- Nocera, S.; Basso, M.; Cavallaro, F. Micro and Macro modelling approaches for the evaluation of the carbon impacts of transportation. Transp. Res. Procedia 2017, 24, 146–154. [Google Scholar] [CrossRef]
- Maestre, V.; Ortiz, A.; Ortiz, I. Challenges and prospects of renewable hydrogen-based strategies for full decarbonization of stationary power applications. Renew. Sustain. Energy Rev. 2021, 152, 111628. [Google Scholar] [CrossRef]
- Nocera, S.; Tonin, S.; Cavallaro, F. The economic impact of greenhouse gas abatement through a meta-analysis: Valuation, consequences and implications in terms of transport policy. Transp. Policy 2015, 37, 31–43. [Google Scholar] [CrossRef]
- Xiao, M.; Junne, T.; Haas, J.; Klein, M. Plummeting costs of renewables-are energy scenarios lagging? Energy Strategy Rev. 2021, 35, 100636. [Google Scholar] [CrossRef]
- Amutha, W.M.; Rajini, V. Cost benefit and technical analysis of rural electrification alternatives in southern India using HOMER. Renew. Sustain. Energy Rev. 2016, 62, 236–246. [Google Scholar] [CrossRef]
- Ani, V.A.; Ani, E.O. Simulation of Solar-Photovoltaic Hybrid Power Generation System with Energy Storage and Supervisory Control for Base Transceiver Station (BTS) Site Located in Rural Nigeria. Int. J. Renew. Energy Res. 2014, 4, 23–30. [Google Scholar]
- Siyoucef, H.; Afif, B.; Kobibi, Y.I.D.; Ghouali, S.; Merabet, B.; Motahhir, S. Performance Analysis and Techno-Economic Optimization of Green Energy Systems for Remote Areas in the Maghreb. Technol. Econ. Smart Grids Sustain. Energy 2021, 6, 1–12. [Google Scholar] [CrossRef]
- Stevovic, I.; Mirjanic, D.; Petrovic, N. Integration of solar energy by nature-inspired optimization in the context of circular economy. Energy 2021, 235, 121297. [Google Scholar] [CrossRef]
- Swarnkar, N.M.; Gidwani, L. Economic and financial assessment of integrated solar and wind energy system in Rajasthan, India. In Proceedings of the 2017 International Conference on Computation of Power, Energy Information and Commuincation (ICCPEIC), Melmaruvathur, India, 22–23 March 2017. [Google Scholar]
- Spyrou, C.; Papageorgas, P.; Vokas, G.; Moronis, A. Techno-economic analysis of a hybrid power supply system on a telecom site. In AIP Conference Proceedings; AIP Publishing LLC: Melville, NY, USA, 2020. [Google Scholar]
- Usman, M.; Malik, A.M.; Mahmood, A.; Kousar, A.; Sabeel, K. HOMER analysis for integrating solar energy in off-grid and on-grid SCO telecommunication sites. In Proceedings of the 2019 1st Global Power, Energy and Communication Conference (GPECOM), Nevsehir, Turkey, 12–15 June 2019. [Google Scholar]
- Delapedra-Silva, V.; Ferreira, P.; Cunha, J.; Kimura, H. Methods for Financial Assessment of Renewable Energy Projects: A Review. Processes 2022, 10, 184. [Google Scholar] [CrossRef]
- William, M.A.; Suárez-López, M.J.; Soutullo, S.; Fouad, M.; Hanafy, A.A. Enviro-economic assessment of buildings decarbonization scenarios in hot climates: Mindset toward energy-efficiency. Energy Rep. 2022, 8, 172–181. [Google Scholar] [CrossRef]
- Basit, A.; Sudiarto, B.; Setiabudy, R. Hybrid energy of Photovoltaic and Palm Oil Diesel for alternative electricity supply of Base Transceiver Station (BTS) on rural Area-South Sumatera. In IOP Conference Series: Materials Science and Engineering; IOP Publishing: Bristol, UK, 2021. [Google Scholar]
- Chowdhury, S.A.; Aziz, S. Solar-diesel hybrid energy model for Base Transceiver Station (BTS) of mobile phone operators. In Proceedings of the 2nd International Conference on the Developments in Renewable Energy Technology (ICDRET 2012), Dhaka, Bangladesh, 5–7 January 2012. [Google Scholar]
- Kuetche, C.F.M.; Tsuanyo, D.; Fopah-Lele, A. Analysis of Hybrid Energy Systems for Telecommunications Equipment: A Case Study in Buea Cameroon. E3S Web Conf. 2022, 354, 02007. [Google Scholar] [CrossRef]
- Kushwaha, P.K.; Bhattacharjee, C. Integrated techno-economic-enviro-socio design of the hybrid renewable energy system with suitable dispatch strategy for domestic and telecommunication load across India. J. Energy Storage 2022, 55, 105340. [Google Scholar] [CrossRef]
- Okundamiya, M.S.; Wara, S.T.; Obakhena, H.I. Optimization and techno-economic analysis of a mixed power system for sustainable operation of cellular sites in 5G era. Int. J. Hydrog. Energy 2022, 47, 17351–17366. [Google Scholar] [CrossRef]
- Das, B.K.; Alotaibi, M.A.; Das, P.; Islam, M.; Das, S.K.; Hossain, A. Feasibility and techno-economic analysis of stand-alone and grid-connected PV/Wind/Diesel/Batt hybrid energy system: A case study. Energy Strat. Rev. 2021, 37, 100673. [Google Scholar] [CrossRef]
- Kumar, A.; Verma, A. Optimal techno-economic sizing of a solar-biomass-battery hybrid system for off-setting dependency on diesel generators for microgrid facilities. J. Energy Storage 2021, 36, 102251. [Google Scholar]
- Amara, S.; Toumi, S.; Ben Salah, C.; Saidi, A.S. Improvement of techno-economic optimal sizing of a hybrid off-grid micro-grid system. Energy 2021, 233, 121166. [Google Scholar] [CrossRef]
- Li, C.; Zhou, D.; Wang, H.; Lu, Y.; Li, D. Techno-economic performance study of stand-alone wind/diesel/battery hybrid system with different battery technologies in the cold region of China. Energy 2019, 192, 116702. [Google Scholar] [CrossRef]
- Veilleux, G.; Potisat, T.; Pezim, D.; Ribback, C.; Ling, J.; Krysztofiński, A.; Ahmed, A.; Papenheim, J.; Pineda, A.M.; Sembian, S.; et al. Techno-economic analysis of microgrid projects for rural electrification: A systematic approach to the redesign of Koh Jik off-grid case study. Energy Sustain. Dev. 2019, 54, 1–13. [Google Scholar] [CrossRef]
- Aziz, A.S.; Tajuddin, M.F.N.; Adzman, M.R.; Mohammed, M.F.; Ramli, M.A. Feasibility analysis of grid-connected and islanded operation of a solar PV microgrid system: A case study of Iraq. Energy 2019, 191, 116591. [Google Scholar] [CrossRef]
- Odou, O.D.T.; Bhandari, R.; Adamou, R. Hybrid off-grid renewable power system for sustainable rural electrification in Benin. Renew. Energy 2019, 145, 1266–1279. [Google Scholar] [CrossRef]
- Kumar, J.; Suryakiran, B.; Verma, A.; Bhatti, T. Analysis of techno-economic viability with demand response strategy of a grid-connected microgrid model for enhanced rural electrification in Uttar Pradesh state, India. Energy 2019, 178, 176–185. [Google Scholar] [CrossRef]
- Kim, M.-H.; Kim, D.; Heo, J.; Lee, D.-W. Techno-economic analysis of hybrid renewable energy system with solar district heating for net zero energy community. Energy 2019, 187, 115916. [Google Scholar] [CrossRef]
- Baseer, M.; Alqahtani, A.; Rehman, S. Techno-economic design and evaluation of hybrid energy systems for residential communities: Case study of Jubail industrial city. J. Clean. Prod. 2019, 237, 117806. [Google Scholar] [CrossRef]
- Javed, M.S.; Song, A.; Ma, T. Techno-economic assessment of a stand-alone hybrid solar-wind-battery system for a remote island using genetic algorithm. Energy 2019, 176, 704–717. [Google Scholar] [CrossRef]
- Ahmad, J.; Imran, M.; Khalid, A.; Iqbal, W.; Ashraf, S.R.; Adnan, M.; Ali, S.F.; Khokhar, K.S. Techno economic analysis of a wind-photovoltaic-biomass hybrid renewable energy system for rural electrification: A case study of Kallar Kahar. Energy 2018, 148, 208–234. [Google Scholar] [CrossRef]
- Duman, A.C.; Güler, Ö. Techno-economic analysis of off-grid PV/wind/fuel cell hybrid system combinations with a comparison of regularly and seasonally occupied households. Sustain. Cities Soc. 2018, 42, 107–126. [Google Scholar] [CrossRef]
- Alharthi, Y.Z.; Siddiki, M.K.; Chaudhry, G.M. Resource Assessment and Techno-Economic Analysis of a Grid-Connected Solar PV-Wind Hybrid System for Different Locations in Saudi Arabia. Sustainability 2018, 10, 3690. [Google Scholar] [CrossRef]
- Das, B.K.; Zaman, F. Performance analysis of a PV/Diesel hybrid system for a remote area in Bangladesh: Effects of dispatch strategies, batteries, and generator selection. Energy 2018, 169, 263–276. [Google Scholar] [CrossRef]
- Kumar, A.; Singh, A.R.; Deng, Y.; He, X.; Kumar, P.; Bansal, R.C. A Novel Methodological Framework for the Design of Sustainable Rural Microgrid for Developing Nations. IEEE Access 2018, 6, 24925–24951. [Google Scholar] [CrossRef]
- Park, E. Potentiality of renewable resources: Economic feasibility perspectives in South Korea. Renew. Sustain. Energy Rev. 2017, 79, 61–70. [Google Scholar] [CrossRef]
- Yilmaz, S.; Dincer, F. Optimal design of hybrid PV-Diesel-Battery systems for isolated lands: A case study for Kilis, Turkey. Renew. Sustain. Energy Rev. 2017, 77, 344–352. [Google Scholar] [CrossRef]
- Al-Sharafi, A.; Sahin, A.Z.; Ayar, T.; Yilbas, B.S. Techno-economic analysis and optimization of solar and wind energy systems for power generation and hydrogen production in Saudi Arabia. Renew. Sustain. Energy Rev. 2016, 69, 33–49. [Google Scholar] [CrossRef]
- Shahzad, M.K.; Zahid, A.; Rashid, T.U.; Rehan, M.A.; Ali, M.; Ahmad, M. Techno-economic feasibility analysis of a solar-biomass off grid system for the electrification of remote rural areas in Pakistan using HOMER software. Renew. Energy 2017, 106, 264–273. [Google Scholar] [CrossRef]
- Jaiswal, A. Lithium-ion battery based renewable energy solution for off-grid electricity: A techno-economic analysis. Renew. Sustain. Energy Rev. 2017, 72, 922–934. [Google Scholar] [CrossRef]
- Azimoh, C.L.; Klintenberg, P.; Mbohwa, C.; Wallin, F. Replicability and scalability of mini-grid solution to rural electrification programs in sub-Saharan Africa. Renew. Energy 2017, 106, 222–231. [Google Scholar] [CrossRef]
- Das, H.S.; Tan, C.W.; Yatim, A.; Lau, K.Y. Feasibility analysis of hybrid photovoltaic/battery/fuel cell energy system for an indigenous residence in East Malaysia. Renew. Sustain. Energy Rev. 2017, 76, 1332–1347. [Google Scholar] [CrossRef]
- Vides-Prado, A.; Camargo, E.O.; Vides-Prado, C.; Orozco, I.H.; Chenlo, F.; Candelo, J.E.; Sarmiento, A.B. Techno-economic feasibility analysis of photovoltaic systems in remote areas for indigenous communities in the Colombian Guajira. Renew. Sustain. Energy Rev. 2018, 82, 4245–4255. [Google Scholar] [CrossRef]
- Ajlan, A.; Tan, C.W.; Abdilahi, A.M. Assessment of environmental and economic perspectives for renewable-based hybrid power system in Yemen. Renew. Sustain. Energy Rev. 2017, 75, 559–570. [Google Scholar] [CrossRef]
- Halabi, L.M.; Mekhilef, S.; Olatomiwa, L.; Hazelton, J. Performance analysis of hybrid PV/diesel/battery system using HOMER: A case study Sabah, Malaysia. Energy Convers. Manag. 2017, 144, 322–339. [Google Scholar] [CrossRef]
- Qolipour, M.; Mostafaeipour, A.; Tousi, O.M. Techno-economic feasibility of a photovoltaic-wind power plant construction for electric and hydrogen production: A case study. Renew. Sustain. Energy Rev. 2017, 78, 113–123. [Google Scholar] [CrossRef]
- Becerra, M.; Morán, J.; Jerez, A.; Cepeda, F.; Valenzuela, M. Wind energy potential in Chile: Assessment of a small scale wind farm for residential clients. Energy Convers. Manag. 2017, 140, 71–90. [Google Scholar] [CrossRef]
- Babatunde, O.M.; Denwigwe, I.H.; Babatunde, D.E.; Ayeni, A.O.; Adedoja, T.B.; Adedoja, O.S. Techno-economic assessment of photovoltaic-diesel generator-battery energy system for base transceiver stations loads in Nigeria. Cogent Eng. 2019, 6, 1684805. [Google Scholar] [CrossRef]
- Manmadharao, S.; Chaitanya, S.; Srinivasarao, G. Design and Optimization of Grid Integrated Solar Energy System Using HOMER GRID software. In Proceedings of the 2019 Innovations in Power and Advanced Computing Technologies (i-PACT), Vellore, India, 22–23 March 2019. [Google Scholar]
- Mohammed, N.Q.; Ahmed, M.S.; Mohammed, M.A.; Hammood, O.A.; Alshara, H.A.N.; Kamil, A.A. Comparative Analysis between Solar and Wind Turbine Energy Sources in IoT Based on Economical and Efficiency Considerations. In Proceedings of the 2019 22nd International Conference on Control Systems and Computer Science (CSCS), Bucharest, Romania, 28–30 May 2019. [Google Scholar]
- Mostafaeipour, A.; Qolipour, M.; Rezaei, M.; Jahangiri, M.; Goli, A.; Sedaghat, A. A novel integrated approach for ranking solar energy location planning: A case study. J. Eng. Des. Technol. 2020, 19, 698–720. [Google Scholar] [CrossRef]
- Muh, E.; Tabet, F. Comparative analysis of hybrid renewable energy systems for off-grid applications in Southern Cameroons. Renew. Energy 2018, 135, 41–54. [Google Scholar] [CrossRef]
- Tahir, M.U.R.; Amin, A.; Baig, A.A.; Manzoor, S.; Haq, A.U.; Asgha, M.A.; Khawaja, W.A.G. Design and optimization of grid Integrated hybrid on-site energy generation system for rural area in AJK-Pakistan using HOMER software. AIMS Energy 2021, 9, 1113–1135. [Google Scholar] [CrossRef]
- Nsengimana, C.; Han, X.T.; Li, L.-L. Comparative Analysis of Reliable, Feasible, and Low-Cost Photovoltaic Microgrid for a Residential Load in Rwanda. Int. J. Photoenergy 2020, 2020, 8855477. [Google Scholar] [CrossRef]


| Sr. No. | Location | Publication Year | BTS Site | Technical Characteristics Components | Objective Functions | Load Type | |||||||
|---|---|---|---|---|---|---|---|---|---|---|---|---|---|
| PV | WE | BG | DG | BC | BA | LCOE | IRR | ROI | |||||
| 1 | Buea Cameroon [25] | 2022 | ✘ | ✔ | ✔ | ✘ | ✔ | ✘ | ✘ | ✔ | ✘ | ✔ | Telecom |
| 2 | India [26] | 2022 | ✘ | ✔ | ✔ | ✘ | ✔ | ✘ | ✔ | ✔ | ✘ | ✔ | Domestic |
| 3 | Nigeri [27] | 2022 | ✘ | ✔ | ✔ | ✘ | ✘ | ✘ | ✔ | ✔ | ✘ | ✘ | Rural |
| 4 | Northern India [3] | 2021 | ✘ | ✔ | ✔ | ✘ | ✔ | ✘ | ✔ | ✔ | ✘ | ✔ | Residential |
| 5 | Rajshahi, Bangladesh [28] | 2021 | ✘ | ✔ | ✔ | ✘ | ✔ | ✘ | ✔ | ✔ | ✘ | ✔ | Residential |
| 6 | Delhi, India [29] | 2021 | ✘ | ✔ | ✘ | ✔ | ✘ | ✘ | ✔ | ✘ | ✔ | ✘ | Residential |
| 7 | Sousse, Tunisia [30] | 2021 | ✘ | ✔ | ✔ | ✘ | ✘ | ✘ | ✔ | ✔ | ✘ | ✘ | Commercial |
| 8 | Lanzhou, Gansu, China [31] | 2020 | ✘ | ✘ | ✔ | ✘ | ✔ | ✔ | ✔ | ✔ | ✘ | ✔ | Industrial |
| 9 | Koh Jik island, Thailand [32] | 2020 | ✘ | ✔ | ✘ | ✘ | ✔ | ✔ | ✔ | ✘ | ✘ | ✔ | Island |
| 10 | Baghdad, Iraq [33] | 2020 | ✘ | ✔ | ✘ | ✘ | ✘ | ✔ | ✔ | ✘ | ✘ | ✘ | Residential |
| 11 | Benin, Africa [34] | 2020 | ✘ | ✔ | ✘ | ✘ | ✔ | ✔ | ✔ | ✘ | ✘ | ✔ | Village |
| 12 | Uttar Pradesh, India [35] | 2019 | ✘ | ✔ | ✘ | ✘ | ✘ | ✔ | ✔ | ✘ | ✘ | ✘ | Village |
| 13 | Chungbuk, South Korea [36] | 2019 | ✘ | ✔ | ✘ | ✘ | ✔ | ✔ | ✔ | ✘ | ✘ | ✔ | Town |
| 14 | Jubail, Saudi Arabia [37] | 2019 | ✘ | ✔ | ✔ | ✘ | ✔ | ✔ | ✔ | ✘ | ✘ | ✘ | Industrial |
| 15 | Jiuduansha, China [38] | 2019 | ✘ | ✔ | ✔ | ✘ | ✘ | ✔ | ✔ | ✘ | ✘ | ✔ | Island |
| 16 | Kallar Kahar, Pakistan [39] | 2018 | ✘ | ✔ | ✔ | ✔ | ✘ | ✔ | ✔ | ✘ | ✘ | ✘ | Rural |
| 17 | Izmir Province, Turkey [40] | 2018 | ✘ | ✔ | ✔ | ✘ | ✔ | ✔ | ✔ | ✘ | ✘ | ✔ | Residential |
| 18 | Saudi Arabia [41] | 2018 | ✘ | ✔ | ✔ | ✘ | ✘ | ✔ | ✘ | ✔ | ✘ | ✔ | City |
| 19 | Godagari, Bangladesh [42] | 2018 | ✘ | ✔ | ✘ | ✘ | ✔ | ✔ | ✔ | ✔ | ✘ | ✘ | Rural |
| 20 | Himalayas, India [43] | 2018 | ✘ | ✔ | ✔ | ✘ | ✔ | ✔ | ✔ | ✔ | ✔ | ✘ | Village |
| 21 | South Korea [44] | 2017 | ✘ | ✔ | ✔ | ✘ | ✔ | ✔ | ✔ | ✔ | ✘ | ✔ | City |
| 22 | Kilis, Southern Turkey [45] | 2017 | ✘ | ✔ | ✘ | ✘ | ✔ | ✔ | ✔ | ✔ | ✘ | ✘ | Residential |
| 23 | Saudi Arabia [46] | 2017 | ✘ | ✔ | ✔ | ✘ | ✘ | ✔ | ✔ | ✘ | ✘ | ✔ | Community |
| 24 | Layyah, Pakistan [47] | 2017 | ✘ | ✔ | ✘ | ✔ | ✘ | ✔ | ✔ | ✔ | ✔ | ✔ | Agricultural |
| 25 | Varanasi, India [48] | 2017 | ✘ | ✔ | ✘ | ✘ | ✘ | ✘ | ✘ | ✔ | ✔ | ✔ | Homes |
| 26 | Tsumkwe, Namibia [49] | 2017 | ✘ | ✔ | ✘ | ✘ | ✔ | ✔ | ✔ | ✔ | ✔ | ✔ | Residential |
| 27 | Sarawak, East Malaysia [50] | 2017 | ✘ | ✔ | ✘ | ✘ | ✘ | ✔ | ✔ | ✔ | ✔ | ✔ | Village |
| 28 | Colombia [51] | 2017 | ✘ | ✔ | ✔ | ✘ | ✔ | ✔ | ✔ | ✘ | ✔ | ✔ | Village |
| 29 | Shafar, Yamen [52] | 2017 | ✘ | ✔ | ✔ | ✘ | ✔ | ✔ | ✘ | ✘ | ✔ | ✔ | Household |
| 30 | Sabah, Malaysia [53] | 2017 | ✘ | ✔ | ✘ | ✘ | ✔ | ✔ | ✔ | ✔ | ✘ | ✔ | Community |
| 31 | Hendijan County, Iran [54] | 2017 | ✘ | ✔ | ✔ | ✘ | ✔ | ✔ | ✔ | ✔ | ✘ | ✘ | Industrial |
| 32 | Chile [55] | 2017 | ✘ | ✘ | ✔ | ✘ | ✘ | ✔ | ✘ | ✘ | ✘ | ✔ | Residential |
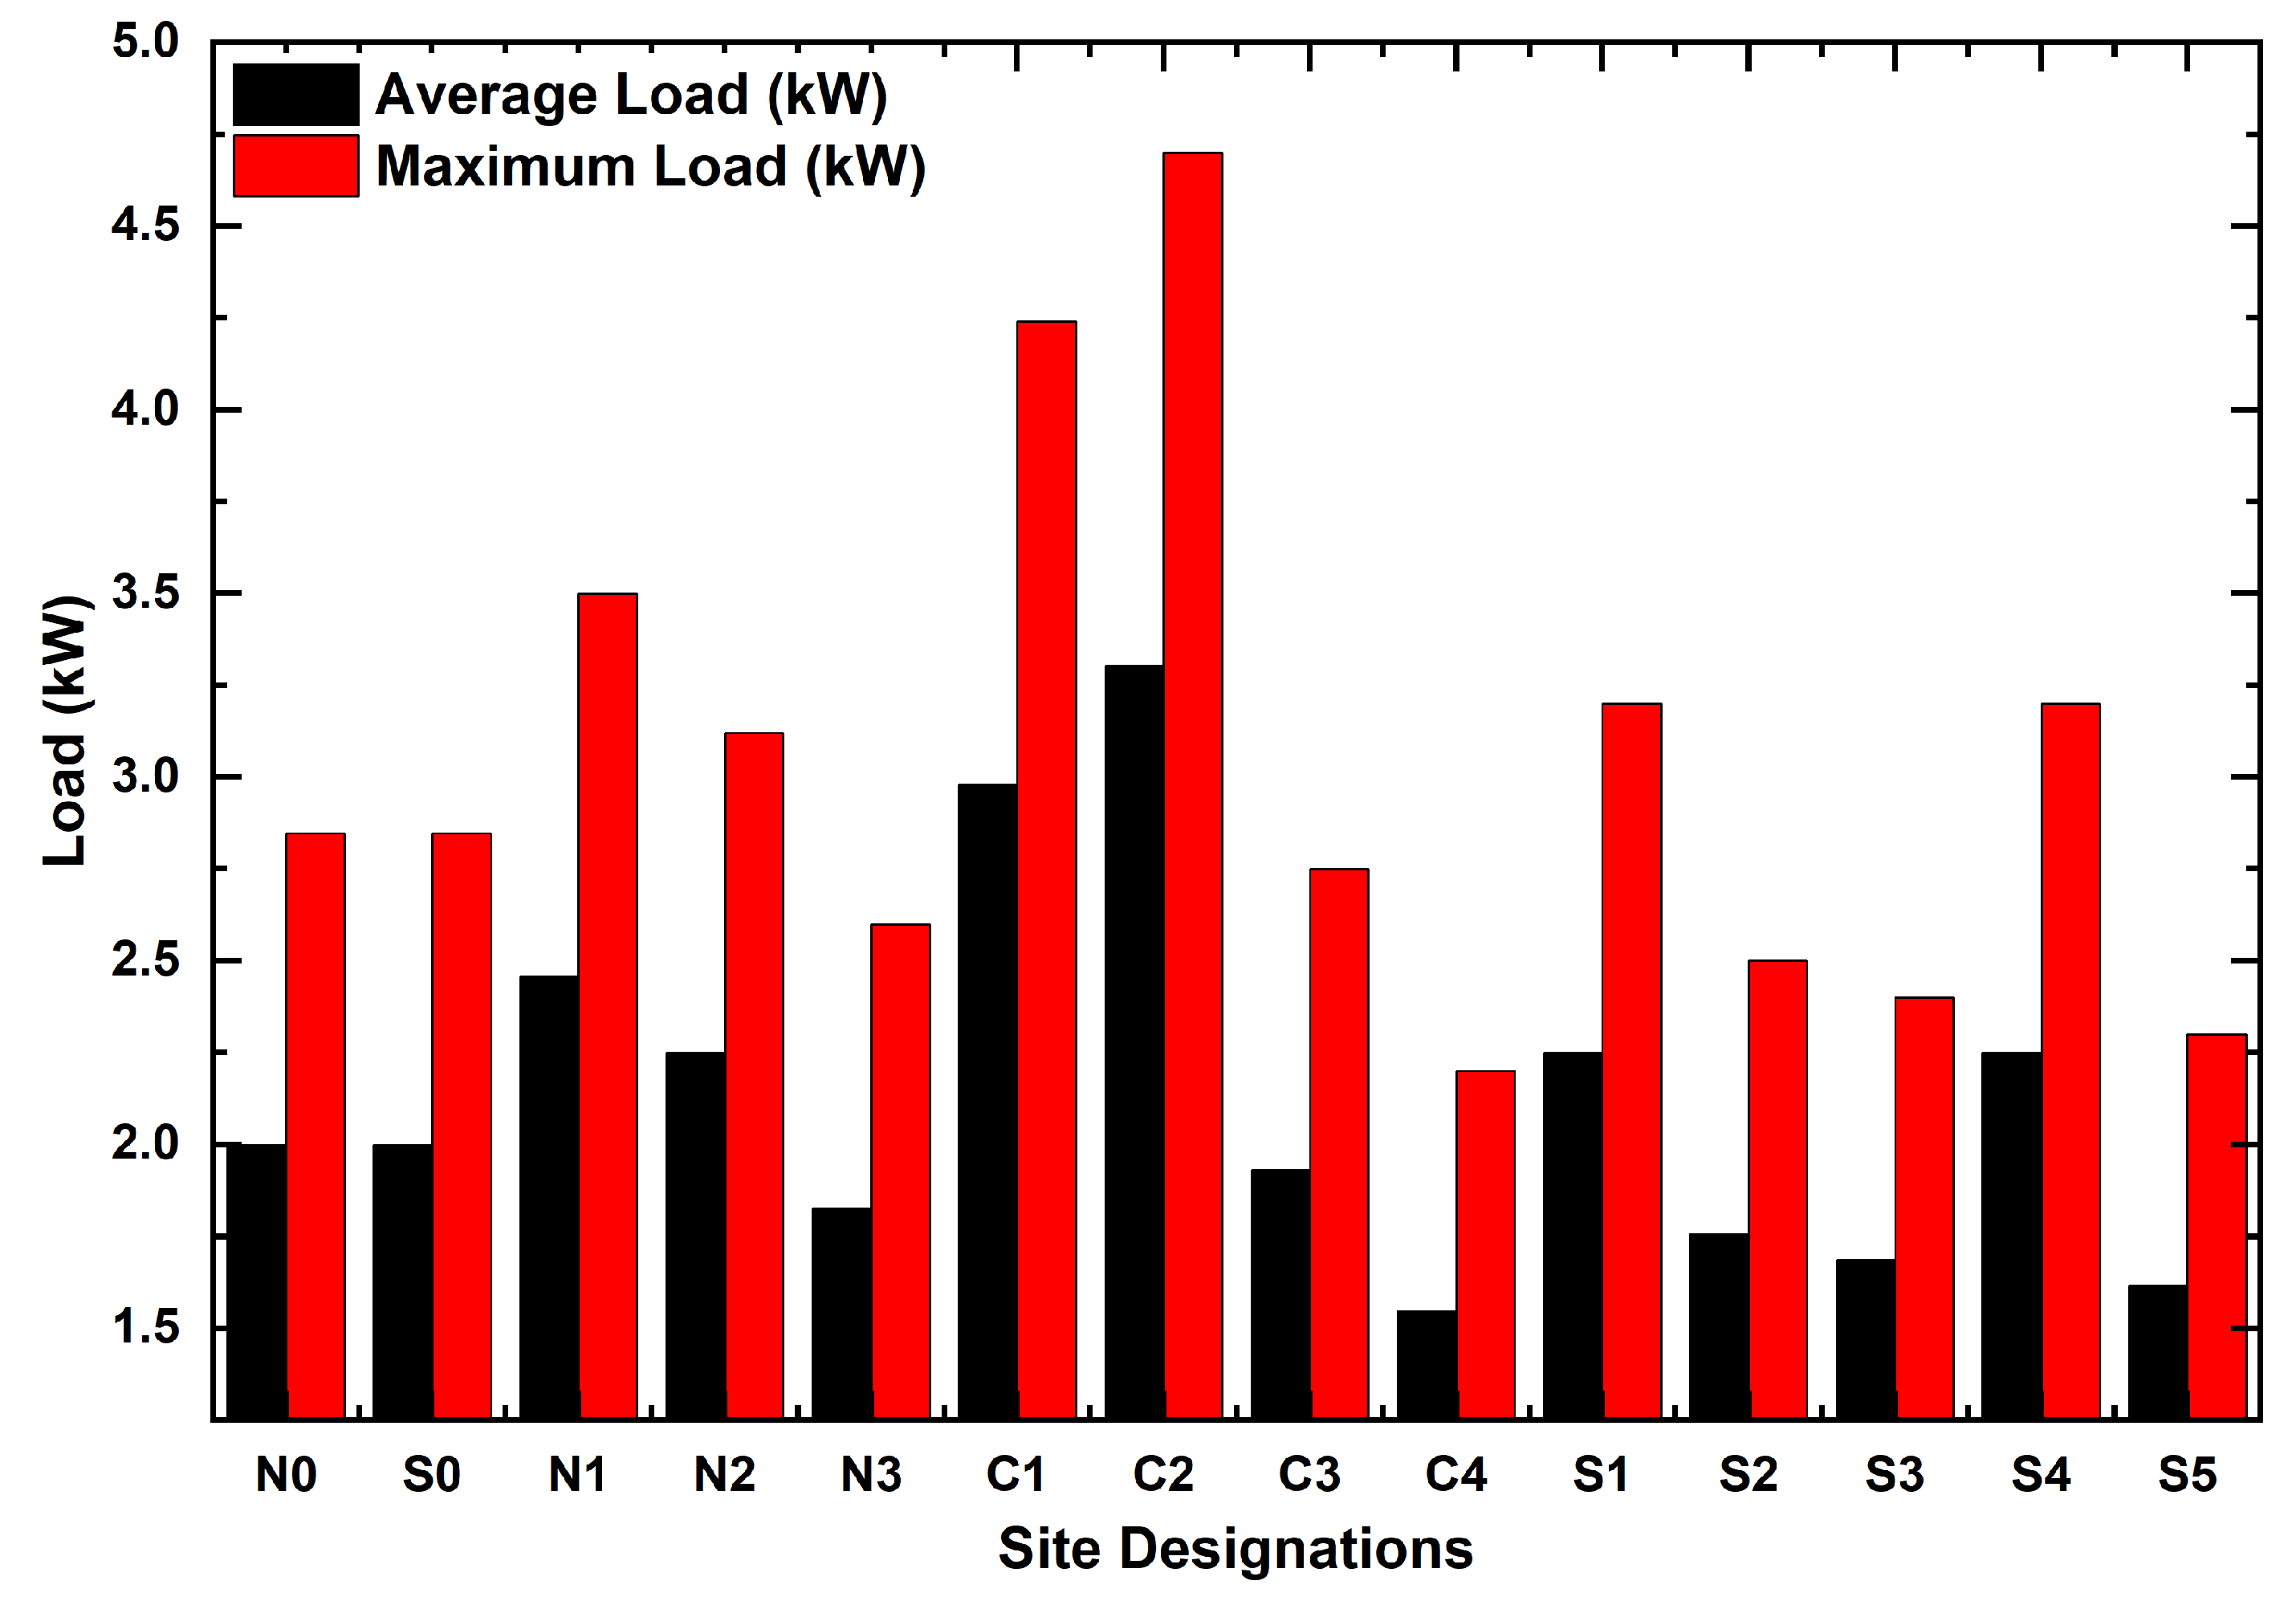
| Sr. No. | Site Designations | Avg. Load (kW) | Max. Load (kW) |
|---|---|---|---|
| 1 | Base Site N0 | 2 | 2.8470 |
| 2 | Base Site S0 | 2 | 2.8470 |
| 3 | N1 | 2.459 | 3.5 |
| 4 | N2 | 2.2482 | 3.12 |
| 5 | N3 | 1.8268 | 2.6 |
| 6 | C1 | 2.9796 | 4.241 |
| 7 | C2 | 3.30206 | 4.7 |
| 8 | C3 | 1.932 | 2.75 |
| 9 | C4 | 1.5456 | 2.2 |
| 10 | S1 | 2.24822 | 3.2 |
| 11 | S2 | 1.75642 | 2.5 |
| 12 | S3 | 1.6862 | 2.4 |
| 13 | S4 | 2.24822 | 3.2 |
| 14 | S5 | 1.616 | 2.3 |
| Sr.No | Region | Site Names | Site Codes | DG Make | DG (kVA) | Site Load (kW) | Rectifier Capacity (kW) | City | Solar Space Availability |
|---|---|---|---|---|---|---|---|---|---|
| 1 | North | N0 | MBT3950 | HP Perkin | 27 | 2.8470 | 18 | Rawalpindi | YES |
| 2 | South | S0 | MDSI5759 | CM Perkin | 27 | 2.8470 | 18 | Karachi | YES |
| Operating Temp | Rated Capacity | Temp. Coefficient | Efficiency | Lifetime | Derating Factor | Capital Cost | O & M Cost | Replacement Cost |
|---|---|---|---|---|---|---|---|---|
| ($) | kWp | (%/°C) | (%) | (year) | (%) | ($) | ($/year) | ($) |
| 47.5 | 0.300 | −0.38 | 19.5 | 25.00 | 80.00 | 209 | 3.20 | 178 |
| Min. State of Charge | Degradation Limit | Nominal Capacity | Trip Losses | Lifetime | Ground Reflectance | Capital Cost | O & M Cost | Replacement Cost |
|---|---|---|---|---|---|---|---|---|
| (%) | (%) | (kWh) | (%) | (year) | (%) | ($) | ($/year) | ($) |
| 18.00 | 25.00 | 1.02 | 9.1 | 10.00 | 20.00 | 210 | 11.00 | 190 |
| Sr. No | Region | Site Names | Site Codes | DG Make | DG (kVA) | Site Load (kW) | Rectifier Capacity (kW) | City | Solar Space Availability |
|---|---|---|---|---|---|---|---|---|---|
| 1 | Central | C-1 | LHR1459 | CM Perkin | 27 | 5.8 | 18 | Lahore | YES |
| 2 | Central | C-2 | LHR4749 | HP Perkin | 20 | 5.3 | 18 | Lahore | YES |
| 3 | Central | C-5 | PPL4965 | HP Perkin | 20 | 3.3 | 18 | Bukkar | YES |
| 4 | Central | C-6 | TSA7842 | CM Perkin | 27 | 3.4 | 27 | DG Khan | YES |
| 5 | North | N-1 | HWY1795 | GJ Perkin | 20 | 2.2 | 18 | Chakwal | YES |
| 6 | North | N-2 | RUR3407 | CM Perkin | 27 | 3.6 | 18 | Dir | YES |
| 7 | North | N-3 | SPH1778 | CM Perkin | 27 | 2.0 | 18 | Gilgit | YES |
| 8 | South | S-1 | HUB5038 | CM Perkin | 27 | 2.4 | 18 | Karachi | YES |
| 9 | South | S-2 | MDKA4714 | CM Perkin | 27 | 3.4 | 18 | Karachi | YES |
| 10 | South | S-3 | MDHY4599 | CM Perkin | 27 | 2.3 | 18 | Hyderabad | YES |
| 11 | South | S-4 | MR245214 | CM Perkin | 27 | 2.0 | 18 | Rajan pur | YES |
| 12 | South | S-5 | MDQU6169 | CM Perkin | 27 | 2.2 | 18 | Quetta | YES |
| Sr. No | North/South/Central | Region | Sites | Available Sites | Not Available Sites |
|---|---|---|---|---|---|
| 1 | North N-1 + N-2 + N-3 | N-1 | 26 | 24 | 2 |
| N-2 | 117 | 106 | 11 | ||
| N-3 | 41 | 40 | 1 | ||
| 2 | Central C-1 + C-2 + C-3 + C-4 | C-1 | 5 | 5 | 0 |
| C-2 | 2 | 2 | 0 | ||
| C-3 | 5 | 4 | 1 | ||
| C-4 | 20 | 20 | 0 | ||
| 3 | South S-1 + S-2 + S-3 + S-4 + S-5 | S-1 | 14 | 12 | 2 |
| S-2 | 10 | 8 | 2 | ||
| S-3 | 5 | 5 | 0 | ||
| S-4 | 13 | 13 | 0 | ||
| S-5 | 5 | 5 | 0 | ||
| 4 | Total | Regions-12 | 263 | 244 | 19 |
| Sr. No. | Base North Site | Base South Site |
|---|---|---|
| PV (kW) | 9 | 9 |
| No. of Batteries | 5 | 4 |
| DG Hours | 965 | 921 |
| Battery Autonomy | 8.16 | 6.528 |
| DG Fuel Consumption (L/h) | 4632 | 4420.8 |
| Rate Fix (PKR) | 128 | 128 |
| IRR/ROI Fix | 48/2.985 | 55/2.4474 |
| Rate Variable (PKR) | 118 | 113 |
| IRR/ROI Variable | 37/4.8776 | 37/4.858 |
| Average Load (kW) | 2 | 2 |
| Maximum Load (kW) | 2.8470 | 2.8467 |
| Sr. No. | Site Designations | Fix Tariff (PKR/$) | Variable Tariff (PKR/$) |
|---|---|---|---|
| 1 | N1 | 128/0.711 | 130/0.722 |
| 2 | N2 | 128/0.711 | 124/0.689 |
| 3 | N3 | 128/0.711 | 141/0.633 |
| 4 | C1 | 128/0.711 | 140/0.777 |
| 5 | C2 | 128/0.711 | 147/0.817 |
| 6 | C3 | 128/0.711 | 112/0.622 |
| 7 | C4 | 128/0.711 | 105/0.583 |
| 8 | S1 | 128/0.711 | 123/0.683 |
| 9 | S2 | 128/0.711 | 110/0.611 |
| 10 | S3 | 128/0.711 | 108/0.600 |
| 11 | S4 | 128/0.711 | 123/0.683 |
| 12 | S5 | 128/0.711 | 106/0.588 |
| Techno-Economic Evaluation Parameters | Site N1 | Site N2 | Site N3 | ||||||
|---|---|---|---|---|---|---|---|---|---|
| Without Solar | With Solar | Math Model | Without Solar | With Solar | Math Model | Without Solar | With Solar | Math Model | |
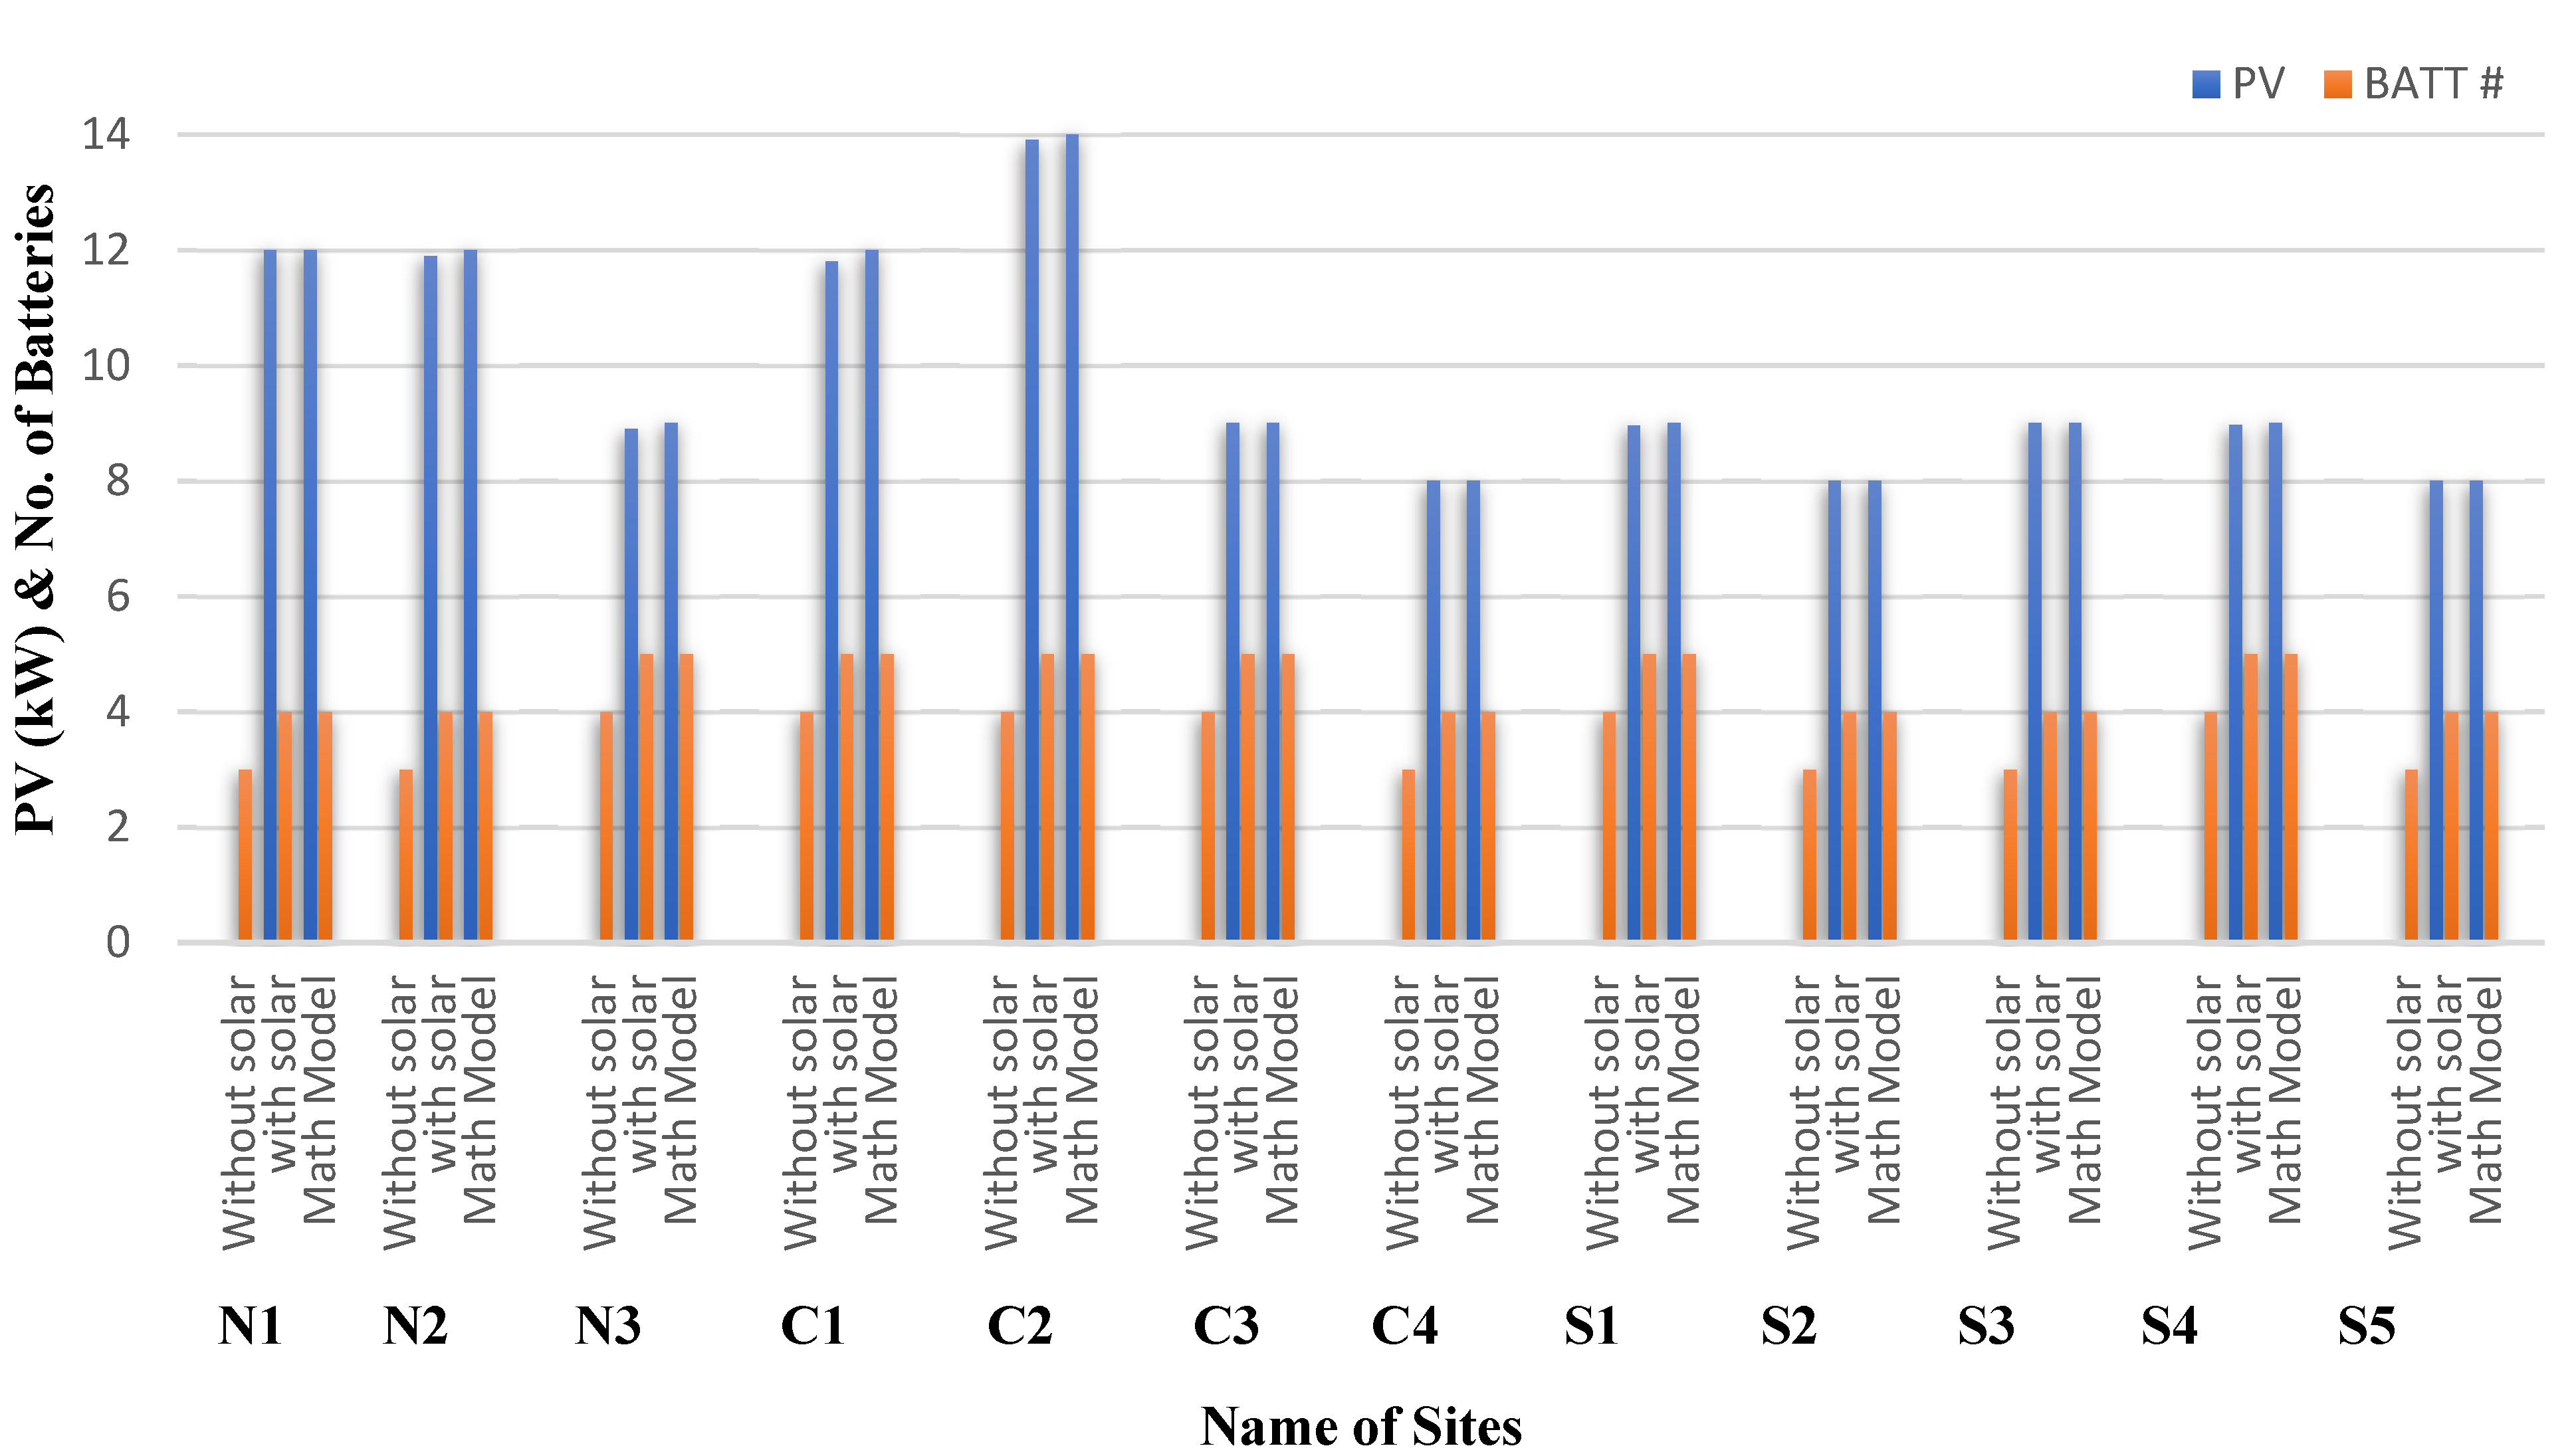
| PV (kW) | 0 | 12 | 12 | 0 | 11.9 | 12 | 0 | 8.9 | 9 |
| Number of Batteries | 3 | 4 | 4 | 3 | 4 | 4 | 4 | 5 | 5 |
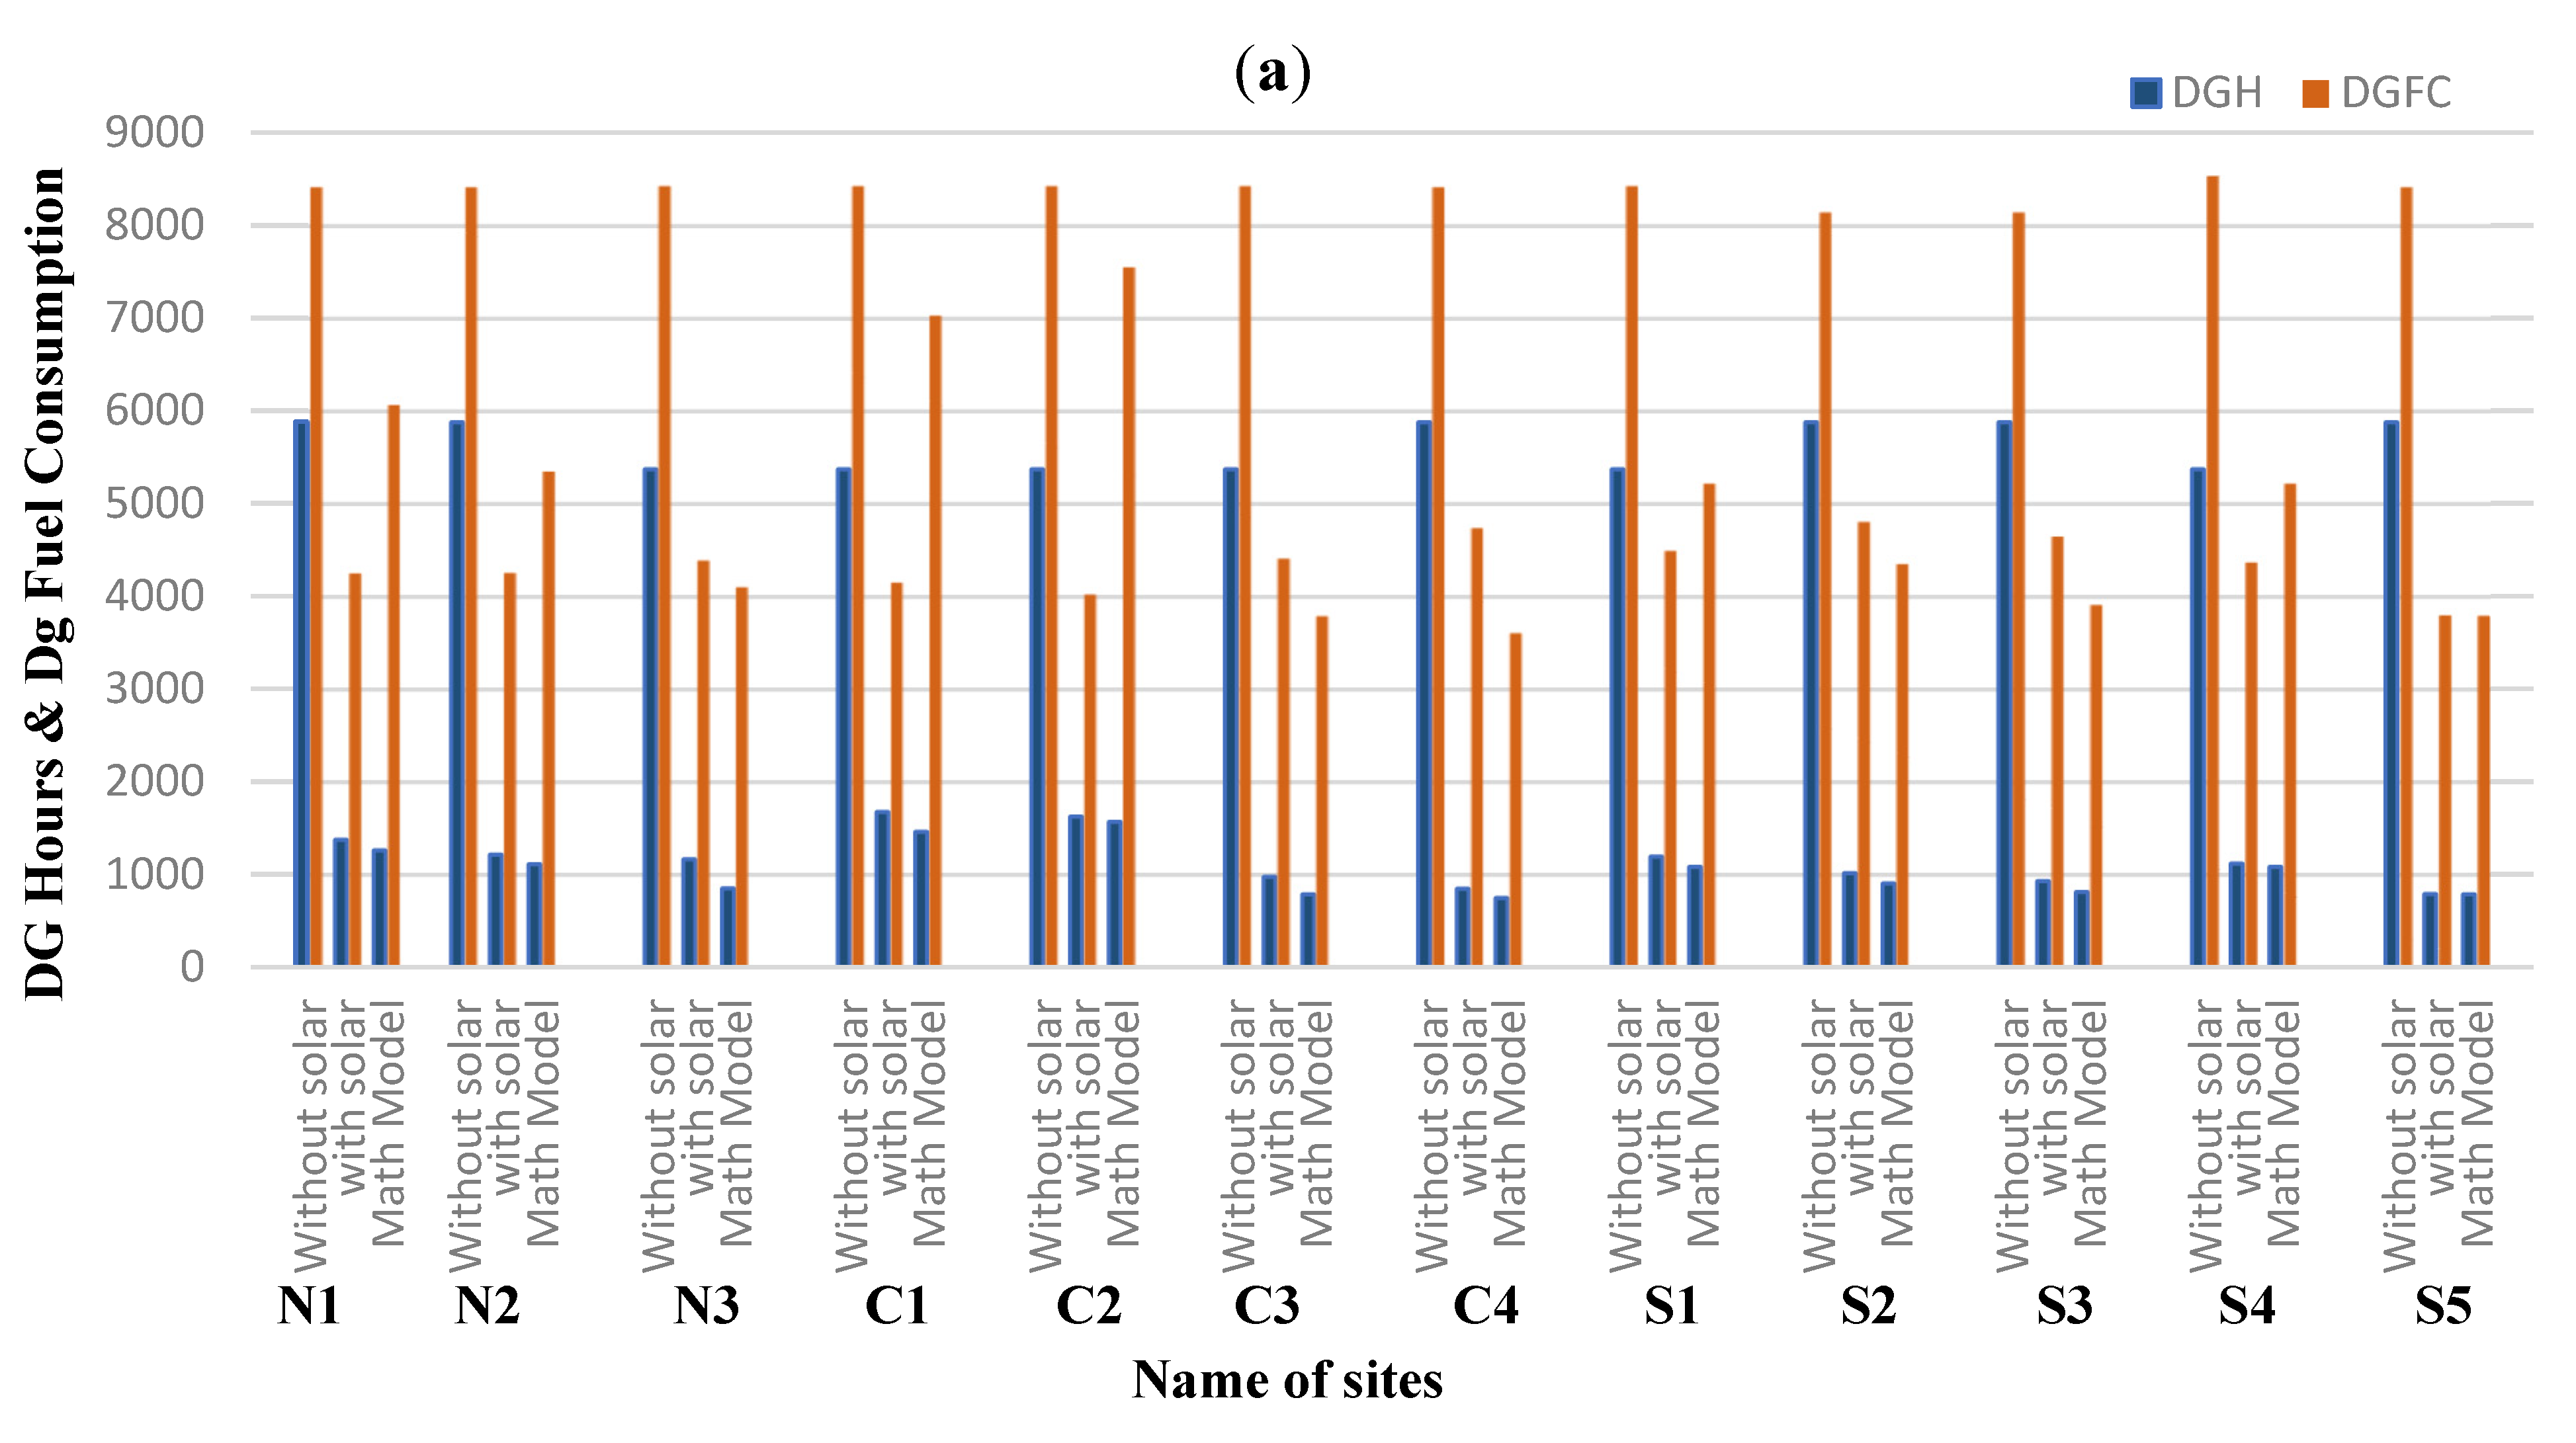
| DG Hours | 5884 | 1380 | 1264 | 5884 | 1220 | 1115 | 5375 | 1169 | 855 |
| Battery Autonomy | 0.948 | 6.1 | 6.528 | 0.948 | 6.87 | 6.528 | 1.26 | 7.99 | 8.16 |
| DG Fuel Consumption (L/h) | 8412 | 4255 | 6067.2 | 8412 | 4258 | 5352 | 8424 | 4391 | 4104 |
| IRR (Fixed Tariff) | ---- | ---- | 36 | ---- | ---- | 41 | ---- | ---- | 52 |
| ROI (Fixed Tariff) | ---- | ---- | 5.402 | ---- | ---- | 3.95 | ---- | ---- | 2.984 |
| ICAPAX ($) | 12,642 | 19,090 | 24,100 | 12,642 | 19,590 | 24,100 | 13,642 | 19,091 | 23,866 |
| ECAPAX ($) | ---- | ---- | 2057 | ---- | ---- | 2040 | ---- | ---- | 1992 |
| Same Tariff ($) | 0.711 | 0.711 | 0.711 | 0.711 | 0.711 | 0.711 | 0.711 | 0.711 | 0.711 |
| Different Tariff ($) | 0.722 | 0.722 | 0.722 | 0.689 | 0.689 | 0.689 | 0.633 | 0.633 | 0.633 |
| IRR (Different Tariff) | ---- | ---- | 38 | ---- | ---- | 37 | ---- | ---- | 36 |
| ROI (Different Tariff) | ---- | ---- | 4.743 | ---- | ---- | 4.95 | ---- | ---- | 4.924 |
| Average Load (kW) | 2.459 | 2.459 | 2.459 | 2.2482 | 2.2482 | 2.2482 | 1.8268 | 1.8268 | 1.8268 |
| Maximum Load (kW) | 3.5 | 3.5 | 3.5 | 3.12 | 3.12 | 3.12 | 2.6 | 2.6 | 2.6 |
| LCOE ($/kWh) | 0.356 | 0.234 | 0.235 | 0.356 | 0.232 | 0.233 | 0.356 | 0.233 | 0.234 |
| Net Present Cost ($) | 98,262 | 64,383 | ---- | 98,262 | 64,364 | ---- | 98,348 | 64,192 | ---- |
| O & M Cost ($) | 8140 | 4254 | ---- | 8140 | 4257 | ---- | 8053 | 4288 | ---- |
| Total Cost ($) | 119,044 | 87,727 = 26,318 (30%) | 26,157 | 119,044 | 88,211 = 26,463 (30%) | 26,140 | 116,278 | 87,571 = 26,271 (30%) | 25,858 |
| Techno-Economic Evaluation Parameters | Site C1-C3 | Site C1 | Site C2 | Site C3 | Site C4 | |||||
|---|---|---|---|---|---|---|---|---|---|---|
| Without Solar | With Solar | Math Model | With Solar | Math Model | With Solar | Math Model | Without Solar | With Solar | Math Model | |
| PV (kW) | 0 | 11.8 | 12 | 13.9 | 14 | 9 | 9 | 0 | 8 | 8 |
| Number of Batteries | 4 | 5 | 5 | 5 | 5 | 5 | 5 | 3 | 4 | 4 |
| DG Hours | 5375 | 1678 | 1464 | 1628 | 1573 | 980 | 790 | 5884 | 850 | 752 |
| Battery Autonomy | 1.26 | 8.1 | 8.16 | 8.32 | 8.16 | 8.02 | 8.16 | 0.948 | 6.9 | 6.528 |
| DG Fuel Consumption (L/h) | 8424 | 4154 | 7027.2 | 4022 | 7550.4 | 4411 | 3792 | 0 | 8 | 3610 |
| IRR (Fixed Tariff) | ---- | ---- | 25 | ---- | 19 | ---- | 55 | ---- | ---- | 65 |
| ROI (Fixed Tariff) | ---- | ---- | 18.46 | ---- | 42 | ---- | 2.413 | ---- | ---- | 1.897 |
| ICAPAX ($) | 13,642 | 20,559 | 25,045 | 21,590 | 25,922 | 19,142 | 23,866 | 12,642 | 17,642 | 22,344 |
| ECAPAX ($) | ---- | ---- | 2173 | ---- | 2252 | ---- | 2100 | ---- | ---- | 1825 |
| Same Tariff ($) | 0.711 | 0.711 | 0.711 | 0.711 | 0.711 | 0.711 | 0.711 | 0.711 | 0.711 | 0.711 |
| Different Tariff ($) | 0.622–0.817 | 0.777 | 0.777 | 0.817 | 0.817 | 0.622 | 0.622 | 0.583 | 0.583 | 0.583 |
| IRR (Different Tariff) | ---- | ---- | 37 | ---- | 37 | ---- | 36 | ---- | ---- | 37 |
| ROI (Different Tariff) | ---- | ---- | 4.935 | ---- | 4.912 | ---- | 4.838 | ---- | ---- | 4.803 |
| Average Load (kW) | 2.9796 | 2.9796 | 2.9796 | 3.3021 | 3.3021 | 1.932 | 1.932 | 1.5456 | 1.5456 | 1.5456 |
| Maximum Load (kW) | 4.241 | 4.241 | 4.241 | 4.7 | 4.7 | 2.75 | 2.75 | 2.2 | 2.2 | 2.2 |
| LCOE ($/kWh) | 0.356 | 0.299 | 0.30 | 0.298 | 0.299 | 0.233 | 0.232 | 0.356 | 0.244 | 0.25 |
| Net Present Cost ($) | 98,348 | 63,368 | ---- | 63,190 | ---- | 64,486 | ---- | 98,262 | 67,508 | ---- |
| O & M Cost ($) | 8053 | 4070 | ---- | 3949 | ---- | 4311 | ---- | 8140 | 4741 | ---- |
| Total Cost ($) | 120,043 | 87,997 = 26,399 (30%) | 27,218 | 88,729 = 26,618 (30%) | 28,174 | 8793 = 26,381 (30%) | 25,966 | 119,044 | 89,891 = 26,967 (30%) | 24,169 |
| Techno-Economic Evaluation Parameters | Site S1/S4 | Site S2/S3/S5 | Site S1 | Site S2 | Site S3 | Site S4 | Site S5 | |||||
|---|---|---|---|---|---|---|---|---|---|---|---|---|
| Without Solar | Without Solar | With Solar | Math Model | With Solar | Math Model | With Solar | Math Model | With Solar | Math Model | With Solar | Math Model | |
| PV (kW) | 0 | 0 | 8.96 | 9 | 8 | 8 | 9 | 9 | 8.97 | 9 | 8 | 8 |
| Number of Batteries | 4 | 3 | 5 | 5 | 4 | 4 | 4 | 4 | 5 | 5 | 4 | 4 |
| DG Hours | 5375 | 5884 | 1196 | 1087 | 1021 | 907 | 932 | 815 | 1121 | 1087 | 796 | 791 |
| Battery Autonomy | 1.26 | 0.948 | 8.2 | 8.16 | 6.6 | 6.528 | 6.65 | 6.528 | 8.22 | 8.16 | 6.43 | 6.528 |
| DG Fuel Consumption (L/h) | 8424 | 8140 | 4494 | 5218 | 4807 | 4354 | 4653 | 3912 | 4370 | 5218 | 3800 | 3797 |
| IRR (Fixed Tariff) | ---- | ---- | ---- | 43 | ---- | 59 | ---- | 61 | ---- | 43 | ---- | 64 |
| ROI (Fixed Tariff) | ---- | ---- | ---- | 3.69 | ---- | 2.213 | ---- | 2.076 | ---- | 3.691 | ---- | 1.967 |
| ICAPAX ($) | 13,642 | 12,642 | 19,144 | 23,866 | 17,642 | 22,344 | 18,142 | 22,644 | 19,129 | 23,866 | 17,642 | 22,344 |
| ECAPAX ($) | ---- | ---- | ---- | 2065 | ---- | 1834 | ---- | 1829 | ---- | 2066 | ---- | 1827 |
| Same Tariff ($) | 0.711 | 0.711 | 0.711 | 0.711 | 0.711 | 0.711 | 0.711 | 0.711 | 0.711 | 0.711 | 0.711 | 0.711 |
| Different Tariff ($) | 0.683 | 0.5-0.61 | 0.683 | 0.683 | 0.611 | 0.611 | 0.60 | 0.60 | 0.683 | 0.683 | 0.588 | 0.588 |
| IRR (Different Tariff) | ---- | ---- | ---- | 37 | ---- | 36 | ---- | 37 | ---- | 37 | ---- | 36 |
| ROI (Different Tariff) | ---- | ---- | ---- | 4.854 | ---- | 4.944 | ---- | 4.805 | ---- | 4.854 | ---- | 4.923 |
| Average Load (kW) | 2.2482 | 1.7564 | 2.24 | 2.24 | 1.75 | 1.75 | 1.686 | 1.686 | 2.248 | 2.248 | 1.616 | 1.616 |
| Maximum Load (kW) | 3.2 | 2.5 | 3.2 | 3.2 | 2.5 | 2.5 | 2.4 | 2.4 | 3.2 | 3.2 | 2.3 | 2.3 |
| LCOE ($/kWh) | 0.356 | 0.356 | 0.236 | 0.356 | 0.247 | 0.248 | 0.243 | 0.242 | 0.236 | 0.236 | 0.245 | 0.245 |
| Net Present Cost ($) | 98,348 | 98,262 | 65,331 | 98,348 | 68,211 | ---- | 67,082 | ---- | 65,091 | ---- | 67,631 | ---- |
| O & M Cost ($) | 8053 | 8140 | 4391 | 8053 | 4807 | ---- | 4653 | ---- | 4370 | ---- | 4752 | ---- |
| Total Cost ($) | 120,043 | 119,044 | 88,866 = 26,659 (30%) | 25,931 | 90,660 = 27,198 (30%) | 24,178 | 89,877 = 26,963 (30%) | 24,473 | 88,590 = 26,577 (30%) | 25,932 | 90,025 = 27,007 (30%) | 24,171 |
| Techno-Economic Evaluation Parameters | Region N-1 (Total Sites: 25) | Region N-2 (Total Sites: 106) | Region N-3 (Total Sites: 40) | ||||||
|---|---|---|---|---|---|---|---|---|---|
| Without Solar | With Solar | Math Model | Without Solar | With Solar | Math Model | Without Solar | With Solar | Math Model | |
| PV (kW) | 0 | 288 | 288 | 0 | 1261.4 | 1272 | 0 | 356 | 360 |
| Number of Batteries | 72 | 96 | 96 | 318 | 424 | 424 | 160 | 200 | 200 |
| DG Hours | 141,216 | 33,120 | 30,336 | 623,704 | 129,320 | 118,190 | 215,000 | 46,760 | 34,200 |
| Battery Autonomy | 22.752 | 146.4 | 156.672 | 100.488 | 728.22 | 691.968 | 50.4 | 319.6 | 326.4 |
| DG Fuel Consumption (L/h) | 201,888 | 102,120 | 145,612.8 | 891,672 | 451,348 | 567,312 | 336,960 | 175,640 | 164,160 |
| Average Load (kW) | 59.016 | 59.016 | 59.016 | 238.309 | 238.309 | 238.309 | 73.072 | 73.072 | 73.072 |
| Maximum Load (kW) | 84 | 84 | 84 | 330.72 | 330.72 | 330.72 | 104 | 104 | 104 |
| ICAPAX ($) | 303,408 | 458,160 | 578,400 | 1,340,052 | 2,076,540 | 2,554,600 | 545,680 | 763,640 | 954,667 |
| ECAPAX ($) | ---- | ---- | 49,371.466 | ---- | ---- | 216,301.5 | ---- | ---- | 79,678 |
| LCOE ($/kWh) | 8.544 | 5.616 | 5.615 | 37.736 | 24.592 | 24.592 | 14.24 | 9.32 | 9.32 |
| Net Present Cost ($) | 2,358,288 | 1,545,192 | ---- | 10,415,772 | 6,822,584 | ---- | 3,933,920 | 2,567,680 | ---- |
| O & M Cost ($) | 195,360 | 102,096 | ---- | 862,840 | 451,242 | ---- | 322,120 | 171,520 | ---- |
| Total Cost ($) | 2,857,056 | 2,105,448 | 627,771.47 | 12,618,664 | 9,350,366 | 2,770,901.5 | 4,801,720 | 3,502,840 | 1,034,345 |
| Total Cost ($) 30% | 857,116 | 631,634.4 | 627,771.47 | 3,785,599.2 | 2,805,109 | 2,770,901.5 | 1,440,516 | 1,050,852 | 1,034,345 |
| Techno-Economic Evaluation Parameters | North Region | ||
|---|---|---|---|
| Without Solar | With Solar | Math Model | |
| PV (kW) | 0 | 1905.4 | 1920 |
| Number of Batteries | 583 | 720 | 720 |
| DG Hours | 1,044,644 | 209,200 | 182,726 |
| Battery Autonomy | 173.64 | 1194.22 | 1175.04 |
| DG Fuel Consumption (L/h) | 1,430,520 | 729,108 | 877,084.8 |
| Average Load (kW) | 370.3972 | 370.3972 | 370.3972 |
| Maximum Load (kW) | 426.3092 | 426.3092 | 426.3092 |
| ICAPAX ($) | 1,885,732 | 3,298,340 | 4,087,667 |
| ECAPAX ($) | ---- | ---- | 345,351 |
| LCOE (L/h) | 60.52 | 39.528 | 39.528 |
| Net Present Cost ($) | 16,707,980 | 10,935,456 | ---- |
| O & M Cost ($) | 1,380,320 | 724,858 | ---- |
| Total Cost ($) | 6,083,232 | 4,487,596 | 4,433,018 |
| Techno-Economic Evaluation Parameters | Region C-1 (Total Sites: 5) | Region C-2 (Total Sites: 2) | Region C-3 (Total Sites: 5) | Region C-4 (Total Sites: 20) | ||||||||
|---|---|---|---|---|---|---|---|---|---|---|---|---|
| Without Solar | With Solar | Math Model | Without Solar | With Solar | Math Model | Without Solar | With Solar | Math Model | Without Solar | With Solar | Math Model | |
| PV (kW) | 0 | 59 | 60 | 0 | 27.8 | 28 | 0 | 36 | 36 | 0 | 160 | 160 |
| Number of Batteries | 20 | 25 | 25 | 8 | 10 | 10 | 16 | 20 | 20 | 60 | 80 | 80 |
| DG Hours | 26,875 | 8390 | 7320 | 10,750 | 3256 | 3146 | 21,500 | 3920 | 3160 | 117,680 | 17,000 | 15,040 |
| Battery Autonomy | 6.3 | 40.5 | 40.8 | 2.52 | 16.64 | 16.32 | 5.04 | 32.08 | 32.64 | 18.96 | 138 | 130.56 |
| DG Fuel Cons. (L/h) | 42,120 | 20,770 | 35,136 | 16,848 | 8044 | 15,100.8 | 33,696 | 17,644 | 15,168 | 168,240 | 94,820 | 72,200 |
| Avg. Load (kW) | 14.898 | 14.898 | 14.898 | 6.60412 | 6.60412 | 6.60412 | 7.728 | 7.728 | 7.728 | 30.912 | 30.912 | 30.912 |
| Maximum Load (kW) | 21.205 | 21.205 | 21.205 | 9.4 | 9.4 | 9.4 | 11 | 11 | 11 | 44 | 44 | 44 |
| ICAPAX ($) | 68,210 | 102795 | 125,222 | 27,284 | 43,180 | 51,844 | 54,568 | 76,568 | 95,466 | 252,840 | 352,840 | 446,888 |
| ECAPAX ($) | ---- | ---- | 10,869 | ---- | ---- | 4505 | ---- | ---- | 8398 | 0 | ---- | 36,503 |
| LCOE ($/kWh) | 1.78 | 1.495 | 1.495 | 0.712 | 0.596 | 0.596 | 1.424 | 0.932 | 0.932 | 7.12 | 4.88 | 4.88 |
| Net Present Cost ($) | 491,740 | 316,840 | ---- | 196,696 | 126,380 | ---- | 393,392 | 257,944 | ---- | 1,965,240 | 1,350,160 | ---- |
| O & M Cost ($) | 40,265 | 20,350 | ---- | 16,106 | 7898 | ---- | 32,212 | 17,244 | ---- | 162,800 | 94,820 | ---- |
| Total Cost ($) | 600,215 | 439,985 | 24,496,430 | 240,086 | 177,458 | 10,142,932 | 480,172 | 351,756 | 18,695,612 | 2,380,880 | 1,797,820 | 87,010,460 |
| Total Cost ($) 30% | 180,064 | 131,995 | 136,091 | 72,025.8 | 53,237.4 | 56,349 | 144,051 | 105,526 | 103,864 | 714,264 | 539,346 | 483,391 |
| Techno-Economic Evaluation Parameters | Central Region | ||
|---|---|---|---|
| Without Solar | With Solar | Math Model | |
| PV (kW) | 0 | 282.8 | 284 |
| Number of Batteries | 104 | 135 | 135 |
| DG Hours | 176,805 | 32,566 | 28,666 |
| Battery Autonomy | 32.82 | 227.22 | 220.32 |
| DG Fuel Consumption (L/h) | 260,904 | 141,278 | 137,604.8 |
| Average Load (kW) | 60.14212 | 60.14212 | 60.14212 |
| Maximum Load (kW) | 85.605 | 85.605 | 85.605 |
| ICAPAX ($) | 402,902 | 575,383 | 129,496,000 |
| ECAPAX ($) | ---- | ---- | 10,849,434 |
| LCOE ($/kWh) | 11.036 | 7.903 | 7.903 |
| Net Present Cost ($) | 3,047,068 | 2,051,324 | ---- |
| O & M Cost ($) | 251,383 | 140,312 | ---- |
| Total Cost ($) | 1,110,405.9 | 830,105.7 | 779,696.855 |
| Techno-Economic Evaluation Parameters | Region S-1 (Total Sites: 12) | Region S-2 (Total Sites: 8) | Region S-3 (Total Sites: 5) | Region S-4 (Total Sites: 13) | Region S-5 (Total Sites: 5) | |||||||||
|---|---|---|---|---|---|---|---|---|---|---|---|---|---|---|
| Without Solar | With Solar | Math Model | Without Solar | With Solar | Math Model | Without Solar (S-3/S-5) | With Solar | Math Model | Without Solar | With Solar | Math Model | With Solar | Math Model | |
| PV (kW) | 0 | 107.52 | 108 | 0 | 64 | 64 | 0 | 45 | 45 | 0 | 116.61 | 117 | 40 | 40 |
| Number of Batteries | 48 | 60 | 60 | 24 | 32 | 32 | 15 | 20 | 20 | 52 | 65 | 65 | 20 | 20 |
| DG Hours | 64,500 | 14,352 | 13,044 | 47,072 | 8168 | 7256 | 29,420 | 4660 | 4075 | 69,875 | 14,573 | 14131 | 3980 | 3955 |
| Battery Autonomy | 15.12 | 98.4 | 97.92 | 7.584 | 52.8 | 52.224 | 4.74 | 33.25 | 32.64 | 16.38 | 106.86 | 106.08 | 32.15 | 32.64 |
| DG Fuel Cons. (L/h) | 101,088 | 53,928 | 62,616 | 65,120 | 38,456 | 34,832 | 40,700 | 23,265 | 19,560 | 110,890 | 56,810 | 67,834 | 19,000 | 18,985 |
| Avg. Load (kW) | 26.9786 | 26.9786 | 26.9786 | 14.0513 | 14.0513 | 14.0513 | 8.431 | 8.431 | 8.431 | 29.226 | 29.226 | 29.226 | 8.08 | 8.08 |
| Maximum Load (kW) | 38.4 | 38.4 | 38.4 | 20 | 20 | 20 | 12 | 12 | 12 | 41.6 | 41.6 | 41.6 | 11.5 | 11.5 |
| ICAPAX ($) | 163,704 | 229,728 | 286,400 | 101,136 | 141,136 | 178,755 | 63,210 | 90,710 | 113,222 | 177,346 | 248,677 | 310,266 | 88,210 | 111,722 |
| ECAPAX ($) | ---- | ---- | 24,782 | ---- | ---- | 14,670 | ---- | ---- | 9143 | ---- | ---- | 26,848 | ---- | 9136 |
| LCOE ($/kWh) | 4.272 | 2.832 | 2.832 | 2.848 | 1.976 | 1.976 | 1.78 | 1.215 | 1.215 | 4.628 | 3.068 | 3.068 | 1.225 | 1.225 |
| Net Present Cost ($) | 1,180,176 | 783,972 | ---- | 786,096 | 545,688 | ---- | 491,310 | 335,410 | ---- | 1,278,524 | 846,183 | ---- | 338,155 | ---- |
| O & M Cost ($) | 96,636 | 52,692 | ---- | 65,120 | 38,456 | ---- | 40,700 | 23,265 | ---- | 104,689 | 56,810 | ---- | 23,760 | ---- |
| Total Cost ($) | 1,440,516 | 1,066,392 | 56,012,928 | 952,352 | 725,280 | 34,816,592 | 595,220 | 449,385 | 22,025,765 | 1,560,559 | 1,151,670 | 60,680,672 | 450,125 | 21,754,565 |
| Total Cost ($) 30% | 432,154 | 319,917 | 311,182 | 285,706 | 217,584 | 193,425 | 178,566 | 134,816 | 122,365 | 468,167 | 345,501 | 337,114 | 135,037 | 120,858 |
| Techno-Economic Evaluation Parameters | South Region | ||
|---|---|---|---|
| Without Solar | With Solar | Math Model | |
| PV (kW) | 0 | 373.13 | 374 |
| Number of Batteries | 154 | 197 | 197 |
| DG Hours | 240,287 | 45,733 | 42,461 |
| Battery Autonomy | 48.564 | 323.46 | 321.504 |
| DG Fuel Consumption (L/h) | 359,858 | 191,459 | 203,827 |
| Average Load (kW) | 86.76786 | 86.76786 | 86.76786 |
| Maximum Load (kW) | 123.5 | 123.5 | 123.5 |
| ICAPAX ($) | 568,606 | 798,461 | 1,000,366 |
| ECAPAX ($) | ---- | ---- | 84,581 |
| LCOE ($/kWh) | 15.308 | 10.316 | 10.316 |
| Net Present Cost ($) | 4,227,416 | 2,849,408 | ---- |
| O & M Cost ($) | 347,845 | 194,983 | ---- |
| Total Cost ($) | 1,543,160.1 | 1,152,855.6 | 1,084,947 |
| Techno-Economic Evaluation Parameters | Overall Region | ||
|---|---|---|---|
| Without Solar | With Solar | Math Model | |
| PV (kW) | 0 | 2561.33 | 2578 |
| Number of Batteries | 841 | 1052 | 1052 |
| DG Hours | 1,461,736 | 287,499 | 253,853 |
| Battery Autonomy | 255.024 | 1744.9 | 1716.864 |
| DG Fuel Consumption (L/h) | 2,051,282 | 1,061,845 | 1,218,516.6 |
| Average Load (kW) | 517.30718 | 517.30718 | 517.30718 |
| Maximum Load (kW) | 635.4142 | 635.4142 | 635.4142 |
| ICAPAX ($) | 2,857,240 | 4,672,184 | 5,807,455 |
| ECAPAX ($) | ---- | ---- | 490,207 |
| LCOE ($/kWh) | 86.864 | 57.747 | 57.747 |
| Net Present Cost ($) | 23,982,464 | 15,836,188 | ---- |
| O & M Cost ($) | 1,979,548 | 1,060,153 | ---- |
| Total Cost ($) | 8,736,798 | 6,470,557.5 | 6,297,662 |
Disclaimer/Publisher’s Note: The statements, opinions and data contained in all publications are solely those of the individual author(s) and contributor(s) and not of MDPI and/or the editor(s). MDPI and/or the editor(s) disclaim responsibility for any injury to people or property resulting from any ideas, methods, instructions or products referred to in the content. |
© 2023 by the authors. Licensee MDPI, Basel, Switzerland. This article is an open access article distributed under the terms and conditions of the Creative Commons Attribution (CC BY) license (https://creativecommons.org/licenses/by/4.0/).
Share and Cite
Ali, M.B.; Kazmi, S.A.A.; Altamimi, A.; Khan, Z.A.; Alghassab, M.A. Decarbonizing Telecommunication Sector: Techno-Economic Assessment and Optimization of PV Integration in Base Transceiver Stations in Telecom Sector Spreading across Various Geographically Regions. Energies 2023, 16, 3800. https://0-doi-org.brum.beds.ac.uk/10.3390/en16093800
Ali MB, Kazmi SAA, Altamimi A, Khan ZA, Alghassab MA. Decarbonizing Telecommunication Sector: Techno-Economic Assessment and Optimization of PV Integration in Base Transceiver Stations in Telecom Sector Spreading across Various Geographically Regions. Energies. 2023; 16(9):3800. https://0-doi-org.brum.beds.ac.uk/10.3390/en16093800
Chicago/Turabian StyleAli, Muhammad Bilal, Syed Ali Abbas Kazmi, Abdullah Altamimi, Zafar A. Khan, and Mohammed A. Alghassab. 2023. "Decarbonizing Telecommunication Sector: Techno-Economic Assessment and Optimization of PV Integration in Base Transceiver Stations in Telecom Sector Spreading across Various Geographically Regions" Energies 16, no. 9: 3800. https://0-doi-org.brum.beds.ac.uk/10.3390/en16093800