1. Introduction
The reliability of DN is essential for ensuring the efficient operation of power systems. The distribution network is the last stage of the power delivery system, which connects the bulk power system to the end users. The distribution network is subject to various types of faults, such as short-circuits, open-circuits, and earth faults, which can cause power outages and affect the quality of the power supply. Therefore, it is important to detect and locate the faults in the distribution network as quickly as possible to minimize the impact on the system and to restore the power supply. Unlike transmission networks, DNs are more prone to disturbances because of their inherent characteristics such as complex network topology, geographically spread over wide areas, unbalanced loading, short amplitude and angle difference between the nodes, faster dynamics (due to the presence of a large number of distributed generations (DG), capacitor banks, autoreclosers, load break switches, fuses, etc.) In general, short circuit faults are more common than open circuit faults in power systems, including unbalanced DN. This is because short circuit faults can occur due to a wide range of factors, including equipment failure, lightning strikes, and other transient events, while open circuit faults typically only occur due to a specific type of failure, such as a broken conductor or faulty switch. Hence, this investigation is focused on the short circuit faults only.
Conventional fault detection and classification methods are based on analyzing the voltage and current signals at the substation. These methods rely on voltage and current signals to detect and classify the faults in the distribution network. However, the voltage and current signals at the substation do not provide sufficient information to accurately detect and locate the faults in the distribution network. This is due to the fact that the voltage and current signals at the substation are affected by the network topology and the load variations, which can lead to false alarms and misclassification of the faults. To overcome the limitations of the conventional fault detection and classification methods, micro-Phasor Measurement Units (PMUs) have been developed. The PMUs are small-sized devices that can measure the voltage and current signals with high resolution and synchronized with the power system frequency. The PMUs can be installed at different locations in the distribution network to capture the dynamic behavior of the system during fault conditions. The synchronized measurements from the PMUs can provide more accurate information about the location and type of the fault, which can be used to develop new fault detection and classification methods.
Several research studies have proposed new fault detection and classification methods based on the synchronized measurements from the
PMUs. These methods utilize the high-resolution synchronized measurements from the
PMUs to detect and classify different types of faults and identify the faulty section of the distribution network. However, most of these methods are based on machine learning algorithms, which require large amounts of training data and computation resources. The performance of these methods is also affected by the quality and availability of the training data. Traditional fault detection and classification methods often suffer from low accuracy and long detection times, particularly in the presence of noise and measurement errors [
1]. In recent years,
PMUs have emerged as a promising technology for improving the accuracy and timeliness of fault detection and location in DN [
2,
3]. The use of
PMUs for fault detection and classification in DN has been the subject of extensive research in recent years [
4,
5,
6]. However, there is still a need for more accurate and efficient fault detection and classification methods for DN, particularly in the presence of noise, measurement errors, and distributed energy resources (DERs) [
1]. Since the real-world
PMU data were not available, the author generated the realistic
PMU data for different real-time events in an unbalanced distribution network to recreate the real grid dynamics [
7]. These dynamics of fault events and line current variations were taken as the thresholds for different algorithms developed in this paper.
In this paper, we propose a rules-based Integrated Fault Detection, Classification, and Section Identification (I-FDCSI) method for real DN using PMUs. The I-FDCSI method is based on a set of rules developed using expert knowledge and statistical analysis of the measured data. The proposed method does not require large amounts of training data or computation resources, and it can provide accurate fault detection and classification results with fast response time. The proposed method has been tested on a real distribution network and its performance has been compared with the conventional fault detection and classification methods.
The main contributions of this paper are as follows:
Development of an integrated fault detection, classification and section identification (I-FDCSI) method for an unbalanced DN which can be subsequently used as a stand-alone operator support application at the distribution control centres (DCC) to enhance the existing service restoration process.
Testing and validation of the I-FDCSI method in a real unbalanced distribution network.
The remainder of this paper is organized as follows.
Section 2 provides an overview of the fault management process in DN using
PMUs.
Section 3 describes the challenges in the fault management process and the need for
PMUs.
Section 4 presents the I-FDCSI method.
Section 5 presents the algorithm testing and validation results. Finally,
Section 6 concludes the paper and discusses potential future research directions.
2. Fault Management Process in DN
The fault management process in real-time starts with the detection of a fault event by the CTs of the circuit breaker (CB) connected to feeder panels. Based on the capability of the bay control and protection unit, the faults can be further classified into over current, earth fault, and sensitive earth fault in general. Up to this stage, the DCC operator can visualize the status of the feeder CB, the type of fault, histogram data, etc., from the supervisory control and data acquisition (SCADA) system. The automated switch status and the remote fault indicator status are also visible to the operators if the respective feeder network is completely automated and the communication channels perform well during the occurrence of the fault.
Figure 1 illustrates the fault management process from the occurrence of a fault in a DN to the restoration of service back to the maximum possible number of customers. Most of the utilities become selective while implementing the fully automated distribution feeder network based on the priority loads connected such as ruler’s building, emergency services, schools, festival centres, etc. However, in many utilities, the majority of the DNs are unautomated due to the huge installation and maintenance costs [
8,
9,
10]. Most of the DNs around the world have less visibility and observability from the DCCs [
11]. This delays the identification of faulted sections or sections of the network. FSI is considered as the most important and challenging task of the fault management process. After proper identification of the fault section, the section can be isolated either manually or by opening the automated switches from the DCC. The prime aim is to isolate the faulty section from the healthy portion of the DN and finally restore the service back to the healthy networks. The isolated faulty section will be under observation to check and repair the faulty cable or conductor and after ensuring the complete healthiness of the section, it will be taken back to service to keep the system back to normal. Even though FSI is an important process, each step of the fault management process from detection to service restoration has vital and systematic roles in contributing towards system reliability indices, e.g., the system average interruption frequency index (SAIFI), system average interruption duration index (SAIDI), etc. [
12]. The performance of the fault location isolation and service restoration techniques are evaluated using the reliability matrices [
13,
14].
2.1. Fault Detection
Fault detection (FD) is considered the prime step in saving the power system components connected to the network from damage and field operation crews who are working day and night on the network to ensure the continuity of the service from the utility to the connected customers or their loads. Different protection devices are used by utilities for detecting the faults in DN whether they are temporary or permanent in nature. Temporary faults such as sensitive earth faults are common in overhead lines (OHL) as the conductors are kept exposed to nature. Any natural phenomenon such as extreme weather conditions will directly affect the lines. These types of faults are detected using sensitive earth fault relays which are usually installed at the substation feeding panels. Most of the OHL feeders will be equipped with this type of relay and once such a fault occurs, the CB recloses at 145 mS [
15] from the time of tripping the CB. If the CB successfully closes and makes the circuit connected to the feeding substation, then the fault is detected as temporary. If the CB trips again, then the fault is detected as a permanent fault [
16,
17,
18].
2.2. Fault Classification
Even though fault classification (FC) is not remarkable information during the process of FD compared to the FSI in pure underground cables, it still gives more insights or situational awareness to line patrolling crews while identifying the exact locations of faults in OHL and a mixed combination of OHL and UG DN. Traditional utility grids equipped with single-phase transformers to feed loads of customers can make use of these classified faults to identify the locations of fault by gathering different information such as customer outage complaints, GPS locations of customer and transformer, etc. However, in the modern DN, the network is equipped with three-phase transformers. So, detected and classified faults has fewer roles in FSI, especially in urban DN or underground DN. Hence the FD process is comparatively easy in a UG cable type of network than in OHL [
19,
20,
21].
2.3. Fault Section Identification
Fault section identification (FSI) is the identification of the exact faulted section of the DN. In most cases, this will be the UG cables or OHL as they have more probability of failures such as via differently aged conductors or cables, more joints with a combination of old and new cables, different insulation types in cables joined together, vegetation growth near the OHL, extreme weather conditions, etc. Comparing the transmission lines, the equipment or other components connected to the real DN such as ring main units (RMUs), distribution transformers (DTs), and low-voltage distribution boards (LVDBs) are less probable to fail. From practical experience, sometimes cable termination failures such as termination flashovers even lead to the failure of RMUs but are very less in number. In this case, the faulted section will be the combination of cables and RMU. Identifying the faulted sections is the most challenging and time-consuming task for the DCC operators and field crews during the fault management process. Traditional DNs are installed with FIs at almost all the nodes but the RFIs are at selected nodes due to the huge funding requirements [
22,
23,
24,
25,
26]. The logic behind FSI is to perfectly identify the faulted section to isolate it from the healthy portion of the DN and to restore the service to the maximum possible number of customers. Even though utilities are implementing advanced monitoring devices, communication technologies and distribution automation projects such as RFIs, automated switches, and RF mesh communication technologies, it is still restricted to a minimum number of assets or priority/critical loads. The reason is nothing but the huge investment and maintenance cost, aged assets, feasibility issues with integration of differently aged assets and their integration limitations with state-of-the-art communication technologies. The utility employs a different mix of assets and communication technologies to keep the assets and manage them to their maximum limits to avoid additional investment costs. Although different technologies and devices are installed towards the smart grid concept to speed up the FSI process, malfunctions and failures of such devices (fault indicators, other monitoring devices, automated switches, etc.) make the fault management process more critical and challenging as the wrong identification of faulted sections leads to the recreation of fault events while energizing the wrong healthy portions. This even damages the different power system components and poses potential safety challenges to the operational crews and customers. This may affect the image of the utilities. So the failure or malfunctions of these fault monitoring devices needs to be addressed to avoid these consequences [
27,
28,
29,
30,
31].
2.4. Fault Section Isolation
After the occurrence of any permanent fault in the DN, the line cannot be energized without isolating the faulty section as it leads to an energizing towards a fault and recreation of the fault event. This may put the men and machinery involved in a dangerous situation. Hence the isolation of the section is important. This is normally done by opening the manual or automated switches connected at both ends of the respective cable section [
32].
2.5. Service Restoration
This is the final step involved in the fault management process. Once the isolation is complete, it means the rest of the network or the healthy proportions of the network are isolated from the fault and is safe to energize and restore the service back to the healthy portions. The reliability indices, mainly SAIDI and SAIFI, depend on how fast and how often the service interruptions are restored to the customers [
33].
3. Challenges in Fault Management Process and Need for PMUs in DN
When we compare the different stages of the fault management process in real-distribution systems, the FD is the easiest step as all the DN are equipped with relays and well-coordinated protection systems. The challenging stage of fault management process is the FSI [
34], where the identification time purely depends on the number of faults in current monitoring devices such as fault indicators (FIs), remote fault indicators (RFIs) and switches or automated switches at both ends of the sections. From the author’s experience, these fault current monitoring devices with and without the capability to communicate their status to SCADA fail or malfunction during the process of FD. This even complicates the fault management process. In some cases, automated switches lose control of the SCADA or fail to execute the open or close commands send from the SCADA. These failures can occur due to various reasons, such as hardware or software malfunctions, and communication disruptions, and a field crew must physically visit the stations to operate the switches manually. In general, the FSI with a limited number of monitoring devices and their failures and malfunctions are the main challenges of real DN.
Synchrophasors are synchronized measurements of voltage and current magnitude and phase angle. Grid operators can see the state of the grid by using synchronized measurements of these parameters. They provide more precision and accuracy, better temporal resolution, and cross-location synchronization as compared to traditional sensor measurements, e.g., SCADA. As operators and planners must manage the growing penetrations of variable generation and controllable energy resources, this information is only becoming more and more important. Therefore, while applying synchrophasor technology to the distribution tier is of interest, sensing in distribution systems is challenging compared to transmission since the signals of interest are less in size and the number of nodes is much greater [
35,
36].
A phasor measuring unit specifically created for use in distribution circuits is known as a micro-PMU (or
PMU). With two samples each cycle or 120 samples per second, the device reports a phasor (magnitude and angle) defining each waveform when in
PMU mode. The phasor measurements are synchronized across locations using GPS time stamping. Using GPS, the
PMU time-stamping has nanosecond- and microsecond-level precision. As a result, phase variations on the order of hundredths of a degree, which are common in distribution circuits but are too small to be monitored with transmission PMUs, can be measured by the
PMU network [
37,
38].
Because of the different X/R ratios, the angle discrepancies and variations in distribution demand a higher degree of accuracy than in transmission. Micro-PMUs enhance the monitoring, analysis, and control capabilities of distribution systems, enabling utilities to improve grid performance, optimize operations, and enhance reliability. They provide valuable data for distribution planning, system optimization, and decision-making processes, leading to more efficient and resilient distribution operations. Apart from current and voltage magnitude, phase angle also provides information on the direction of power flow for topology research. Line-level measurement outperforms smart metering for calculating loads on a per-phase basis. Even though
PMUs have different parameter monitoring capabilities, the investigations in short circuit faults are better observed in the current values and a few variations from the voltage. So this paper considers only current measurements from the
PMUs than any other parameters [
39,
40].
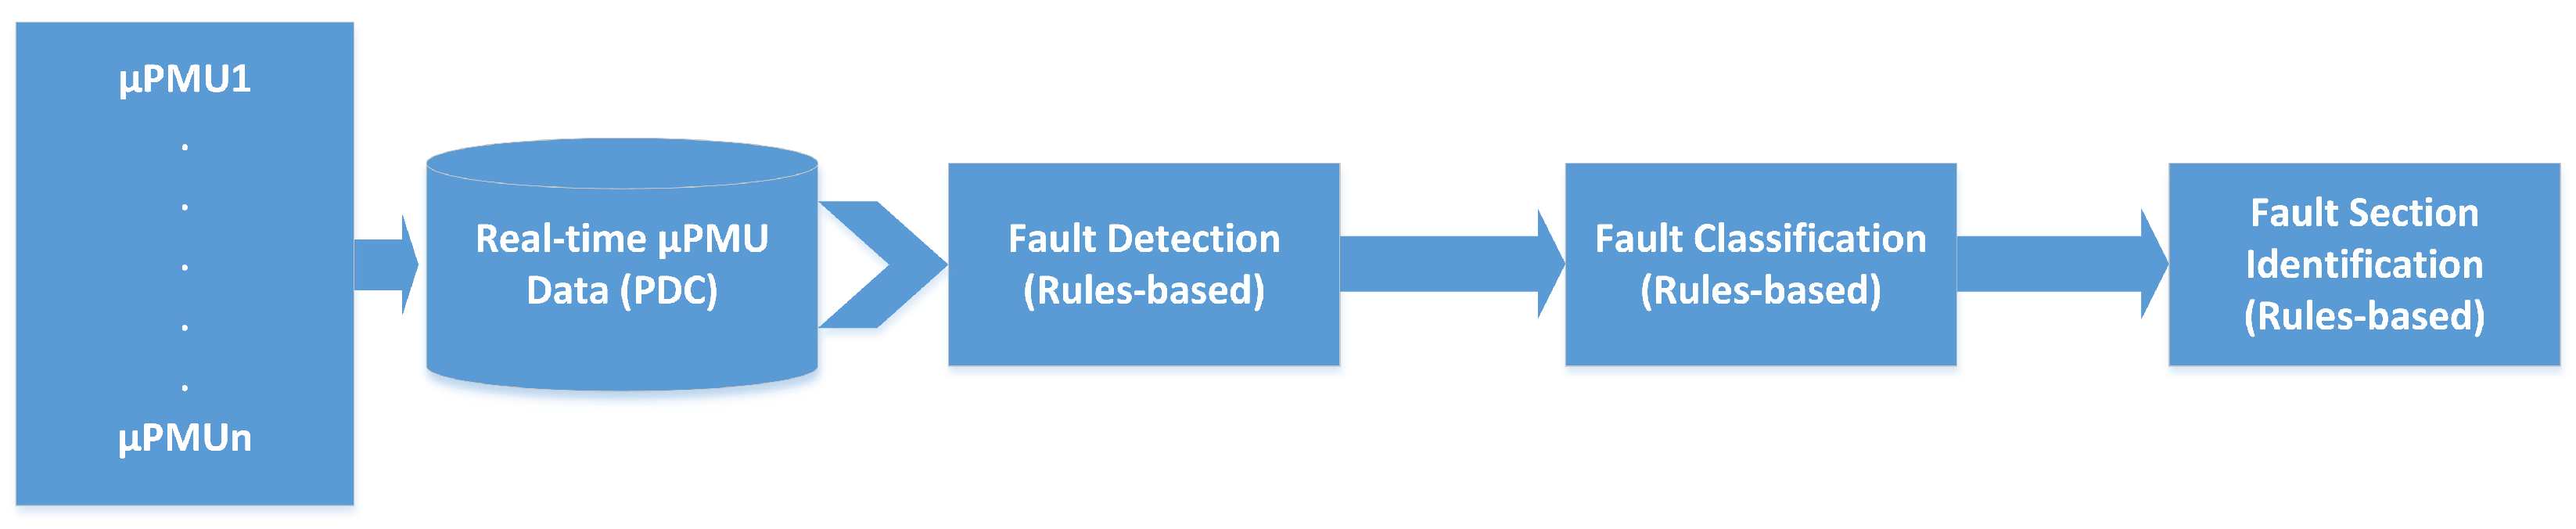
4. I-FDCSI Algorithm
The I-FDCSI method is a combination of three algorithms namely fault detection, fault classification and fault section identification. These algorithms are executed one by one in a flow as shown in
Figure 2.
All three algorithms are rules-based and are derived from the real-time data measured and reported by the
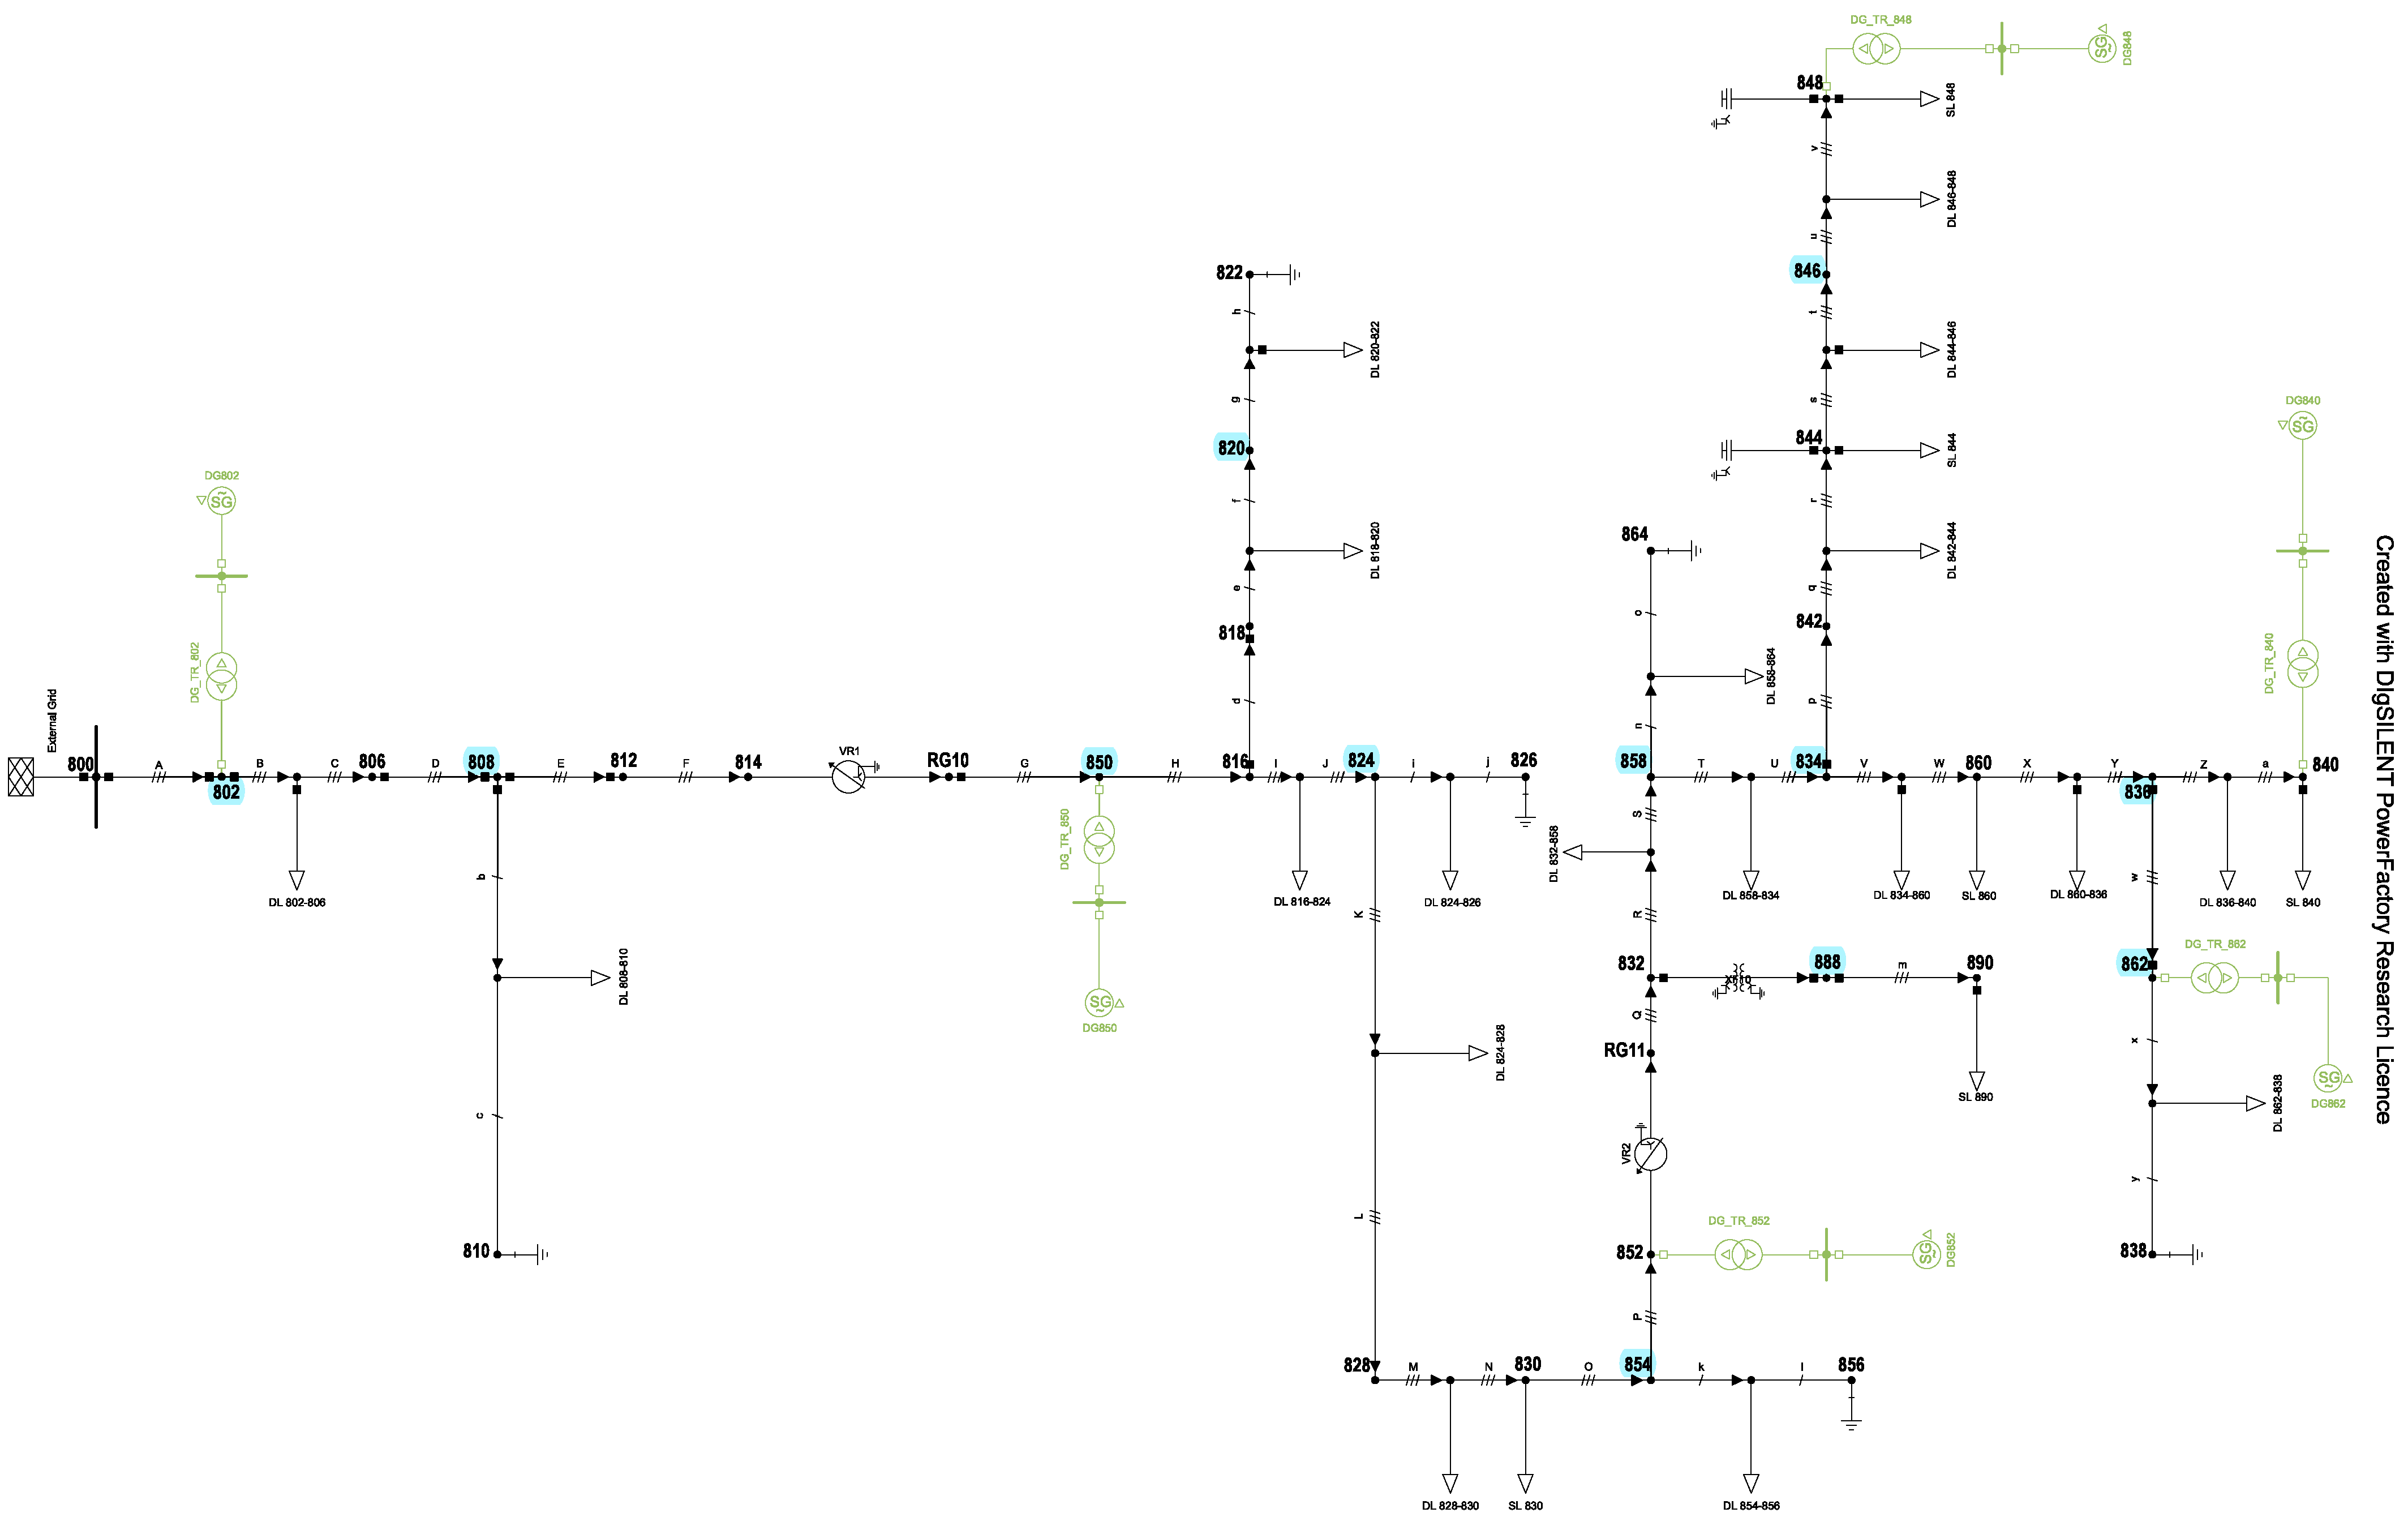
PMUs installed at strategic locations of the DN. The DN selected for this study is the IEEE 34 node test feeder. The components and load flow settings used for modeling and simulation of this feeder are clearly given in [
7]. The test feeder has been integrated with six distributed generations (DG), each having a capacity of 20% of the total feeder load. The feeder is also installed with 12
PMUs at strategic locations.
Figure 3 shows the IEEE 34 node test feeder with DG and
PMUs locations. The details of the DG locations and sizing and
PMUs placements are selected as in [
7].
Before developing the individual algorithms, the following steps are followed:
4.1. Calculate the Minimum Short Circuit Current Ratio per Phase of the Network
To calculate the per phase, the below steps are followed.
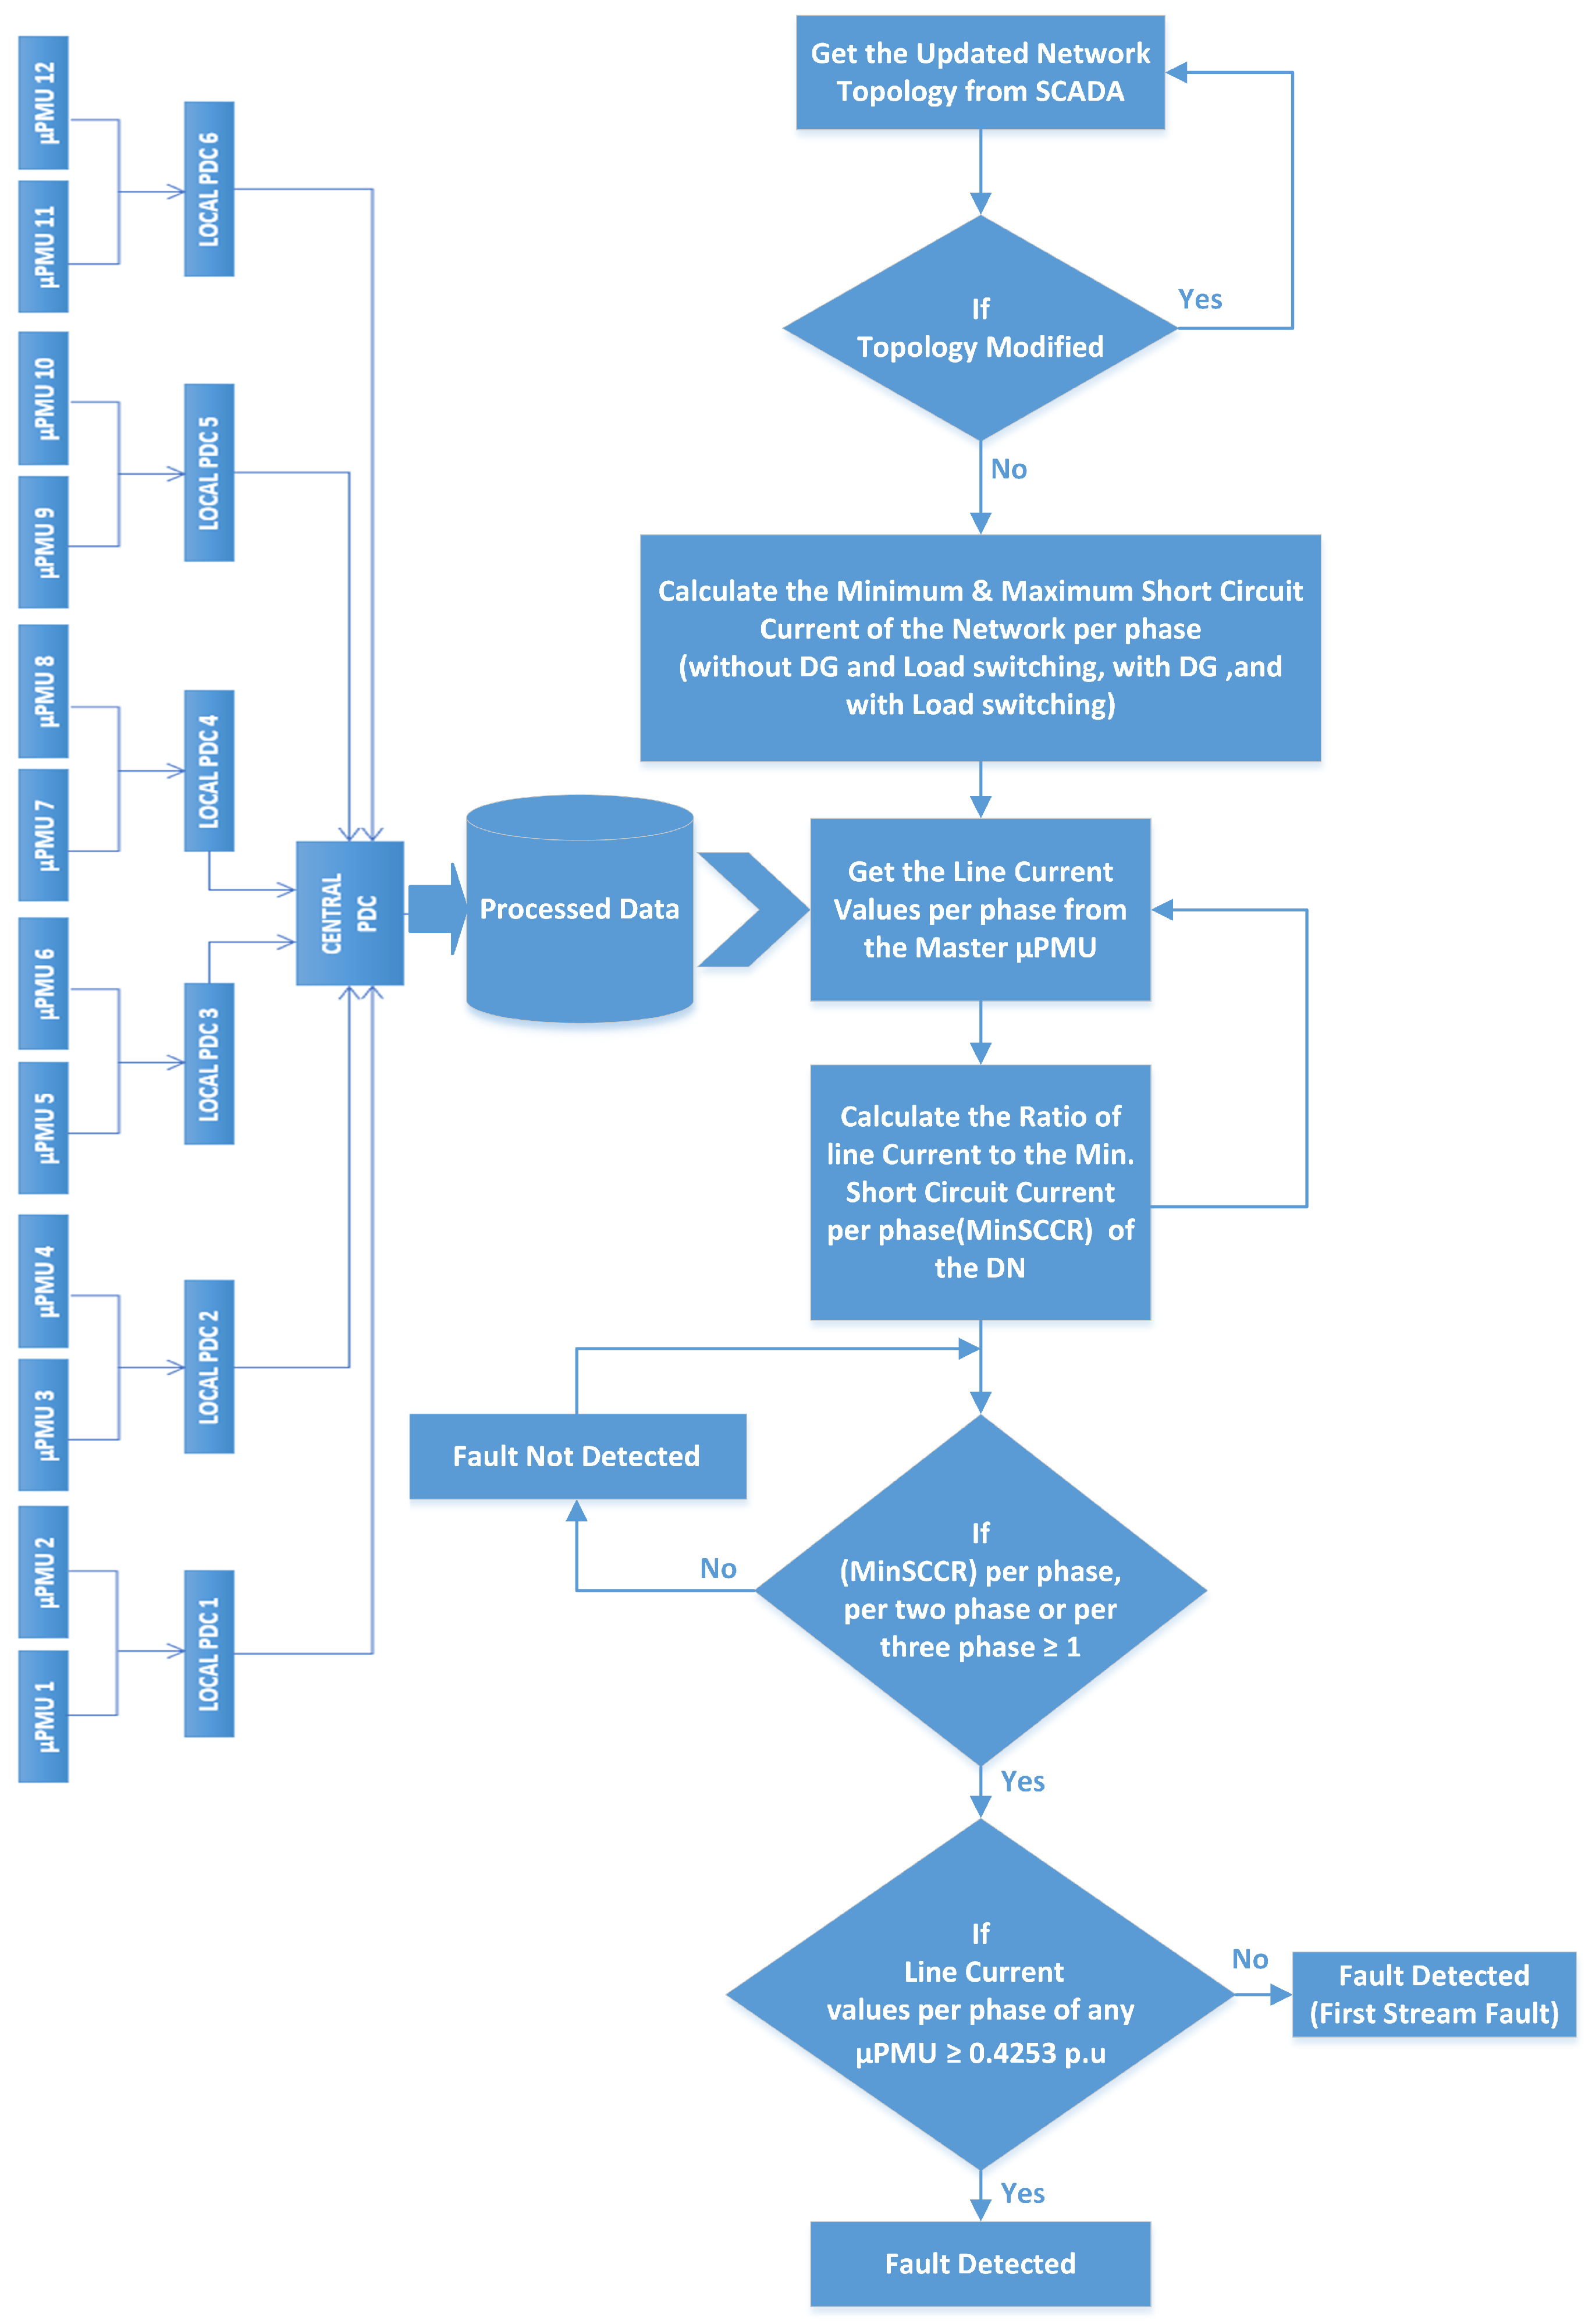
4.2. Fault Detection Algorithm
To detect the fault in the DN with strategically placed
PMUs, a real-time measurement rules-based algorithm is implemented. The fault to trip duration settings was adapted from a real-world
PMU data analysis carried out in reference [
15]. This algorithm uses the rules in 25, 26, and 27. The flow chart of the algorithm using these rules is shown in
Figure 4.
4.2.1. Fault Detection without DG and Load Switching
4.2.2. Fault Detection with DG
4.2.3. Fault Detection with Load Switching
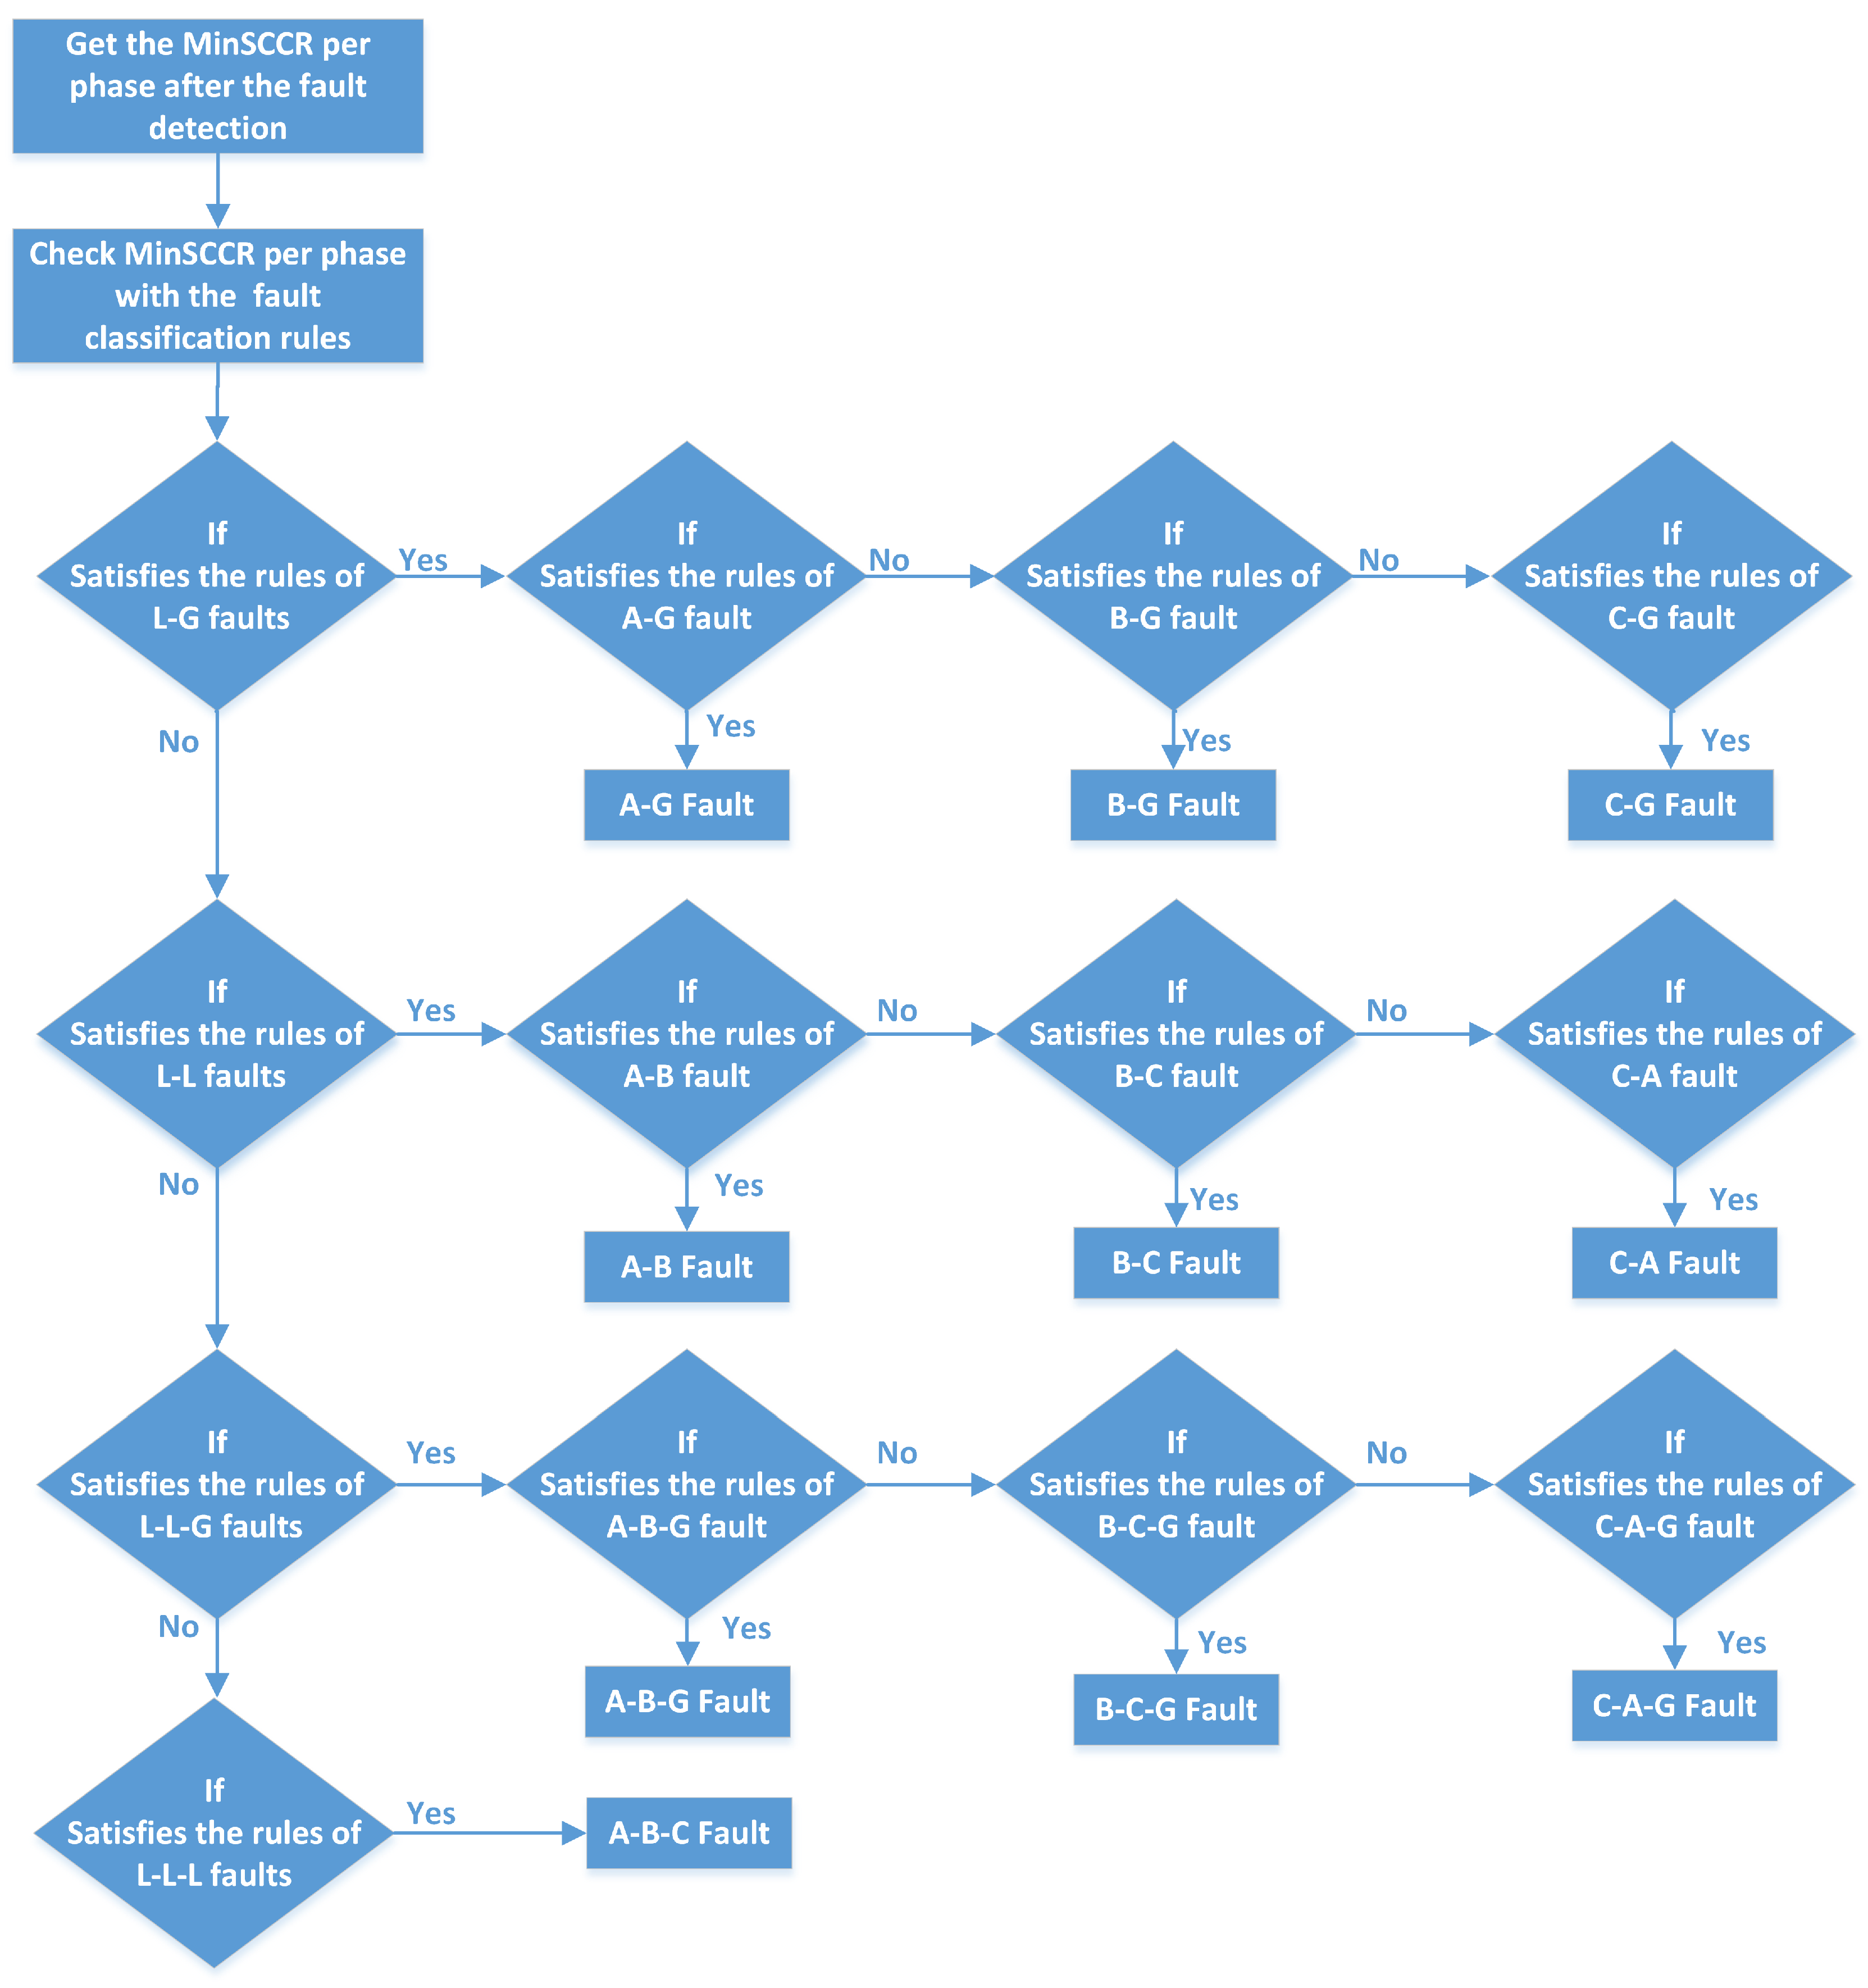
4.3. Fault Classification Algorithm
The detected faults are classified by defining separate rules for different classes of faults. The following are the rules defined by investigating all the combinations of fault classes. The flow chart of the algorithm using these rules is shown in
Figure 5.
4.4. Rules for Line to Ground Faults (L-G)
4.4.1. Rules for A-G Fault
4.4.2. Rules for B-G Fault
4.4.3. Rules for C-G Fault
4.5. Rules for Line to Line Faults (L-L)
4.5.1. Rules for Line to Line Faults (A-B)
4.5.2. Rules for Line to Line Faults (B-C)
4.5.3. Rules for Line to Line Faults (C-A)
4.6. Rules for Line to Line to Ground Faults (L-L-G)
4.6.1. Rules for Line to Line Faults (A-B-G)
4.6.2. Rules for Line to Line Faults (B-C-G)
4.6.3. Rules for Line to Line Faults (C-A-G)
4.7. Rules for Three Phase Faults (A-B-C)
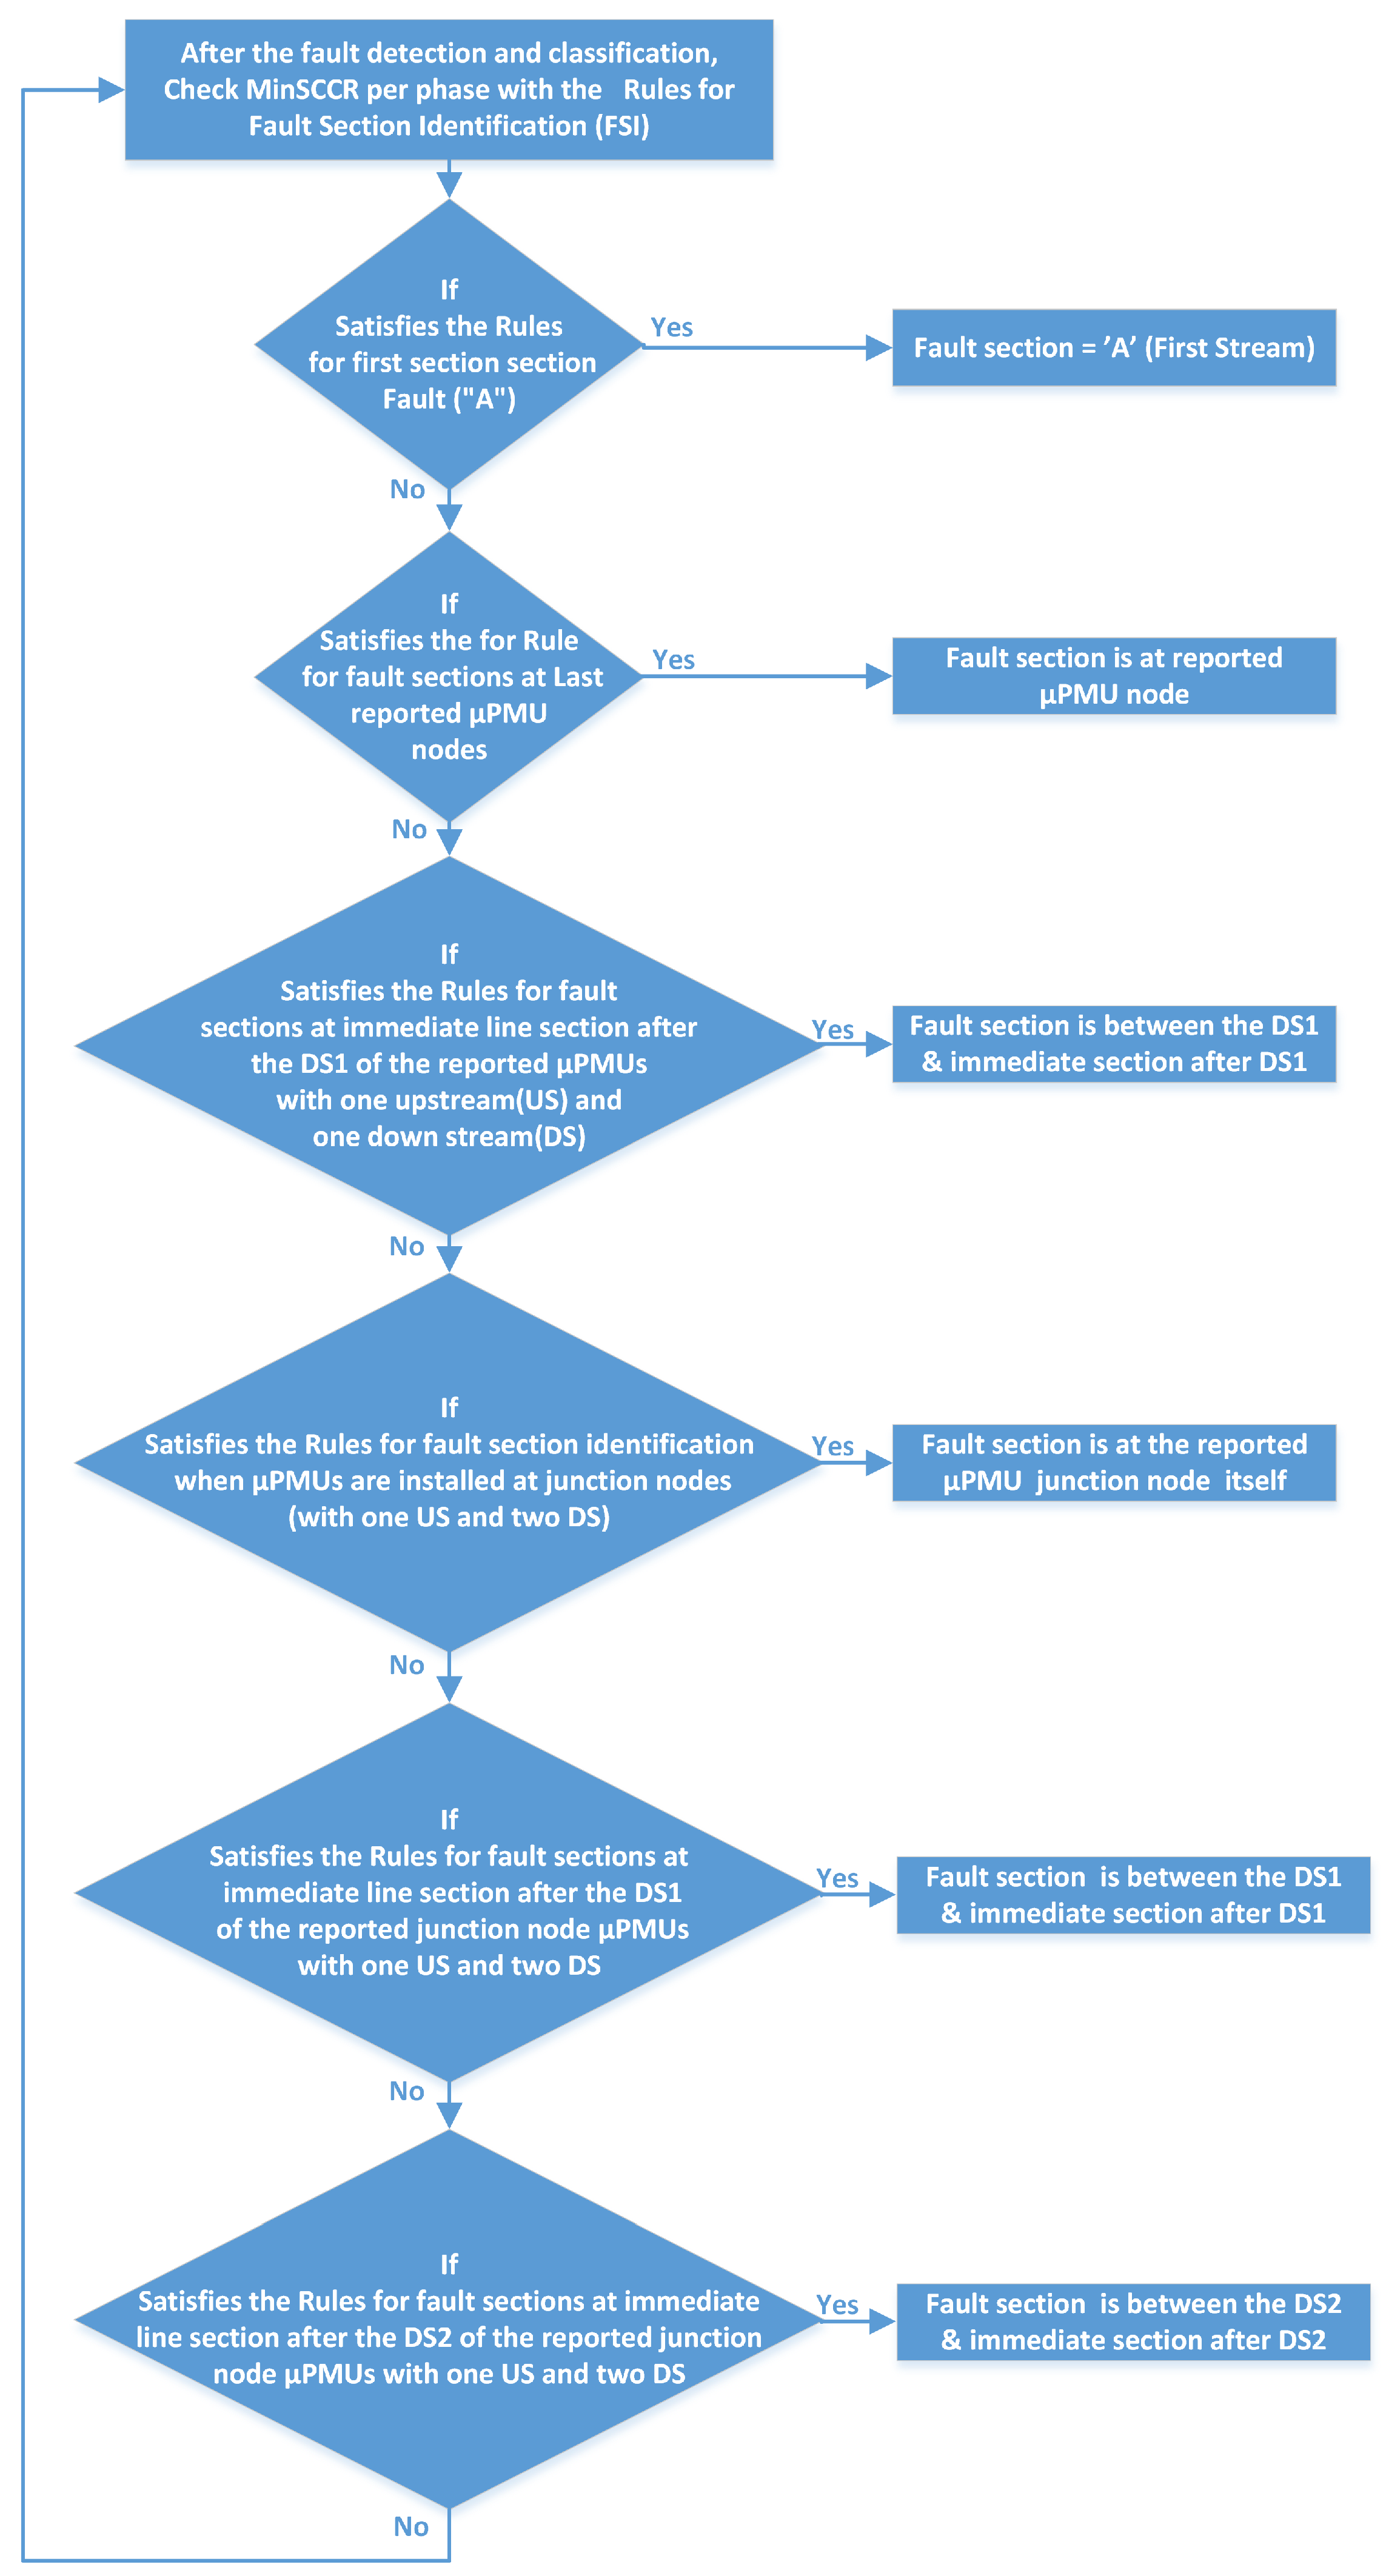
4.8. Fault Section Identification Algorithm
Fault section is usually identified in radial DN between the last reported and first not reported
PMU. The flow chart of the algorithm using these rules is shown in
Figure 6.
4.8.1. Rules for First Line Section (“A”) Fault
4.8.2. Rules for Rule for Fault Sections at MicroPMU Nodes
4.9. Rules for Fault Sections at Immediate Line Section after the DS1 of the Reported MicroPMUs with One Upstream (US) and One Down Stream (DS)
4.10. Rules for Fault Section Identification When MicroPMUs Are Installed at Junction Nodes (with One US and Two DS)
Here, stream leading to the main feeder line from the junction node is considered as DS1 and the stream leading to the laterals are considered as DS2.
4.10.1. Rules for Fault Sections at Immediate Line Section after the DS1 of the Reported Junction Node MicroPMUs with One US and Two DS
4.10.2. Rules for Fault Sections at Immediate Line Section after the DS2 of the Reported Junction Node MicroPMUs with One US and Two DS
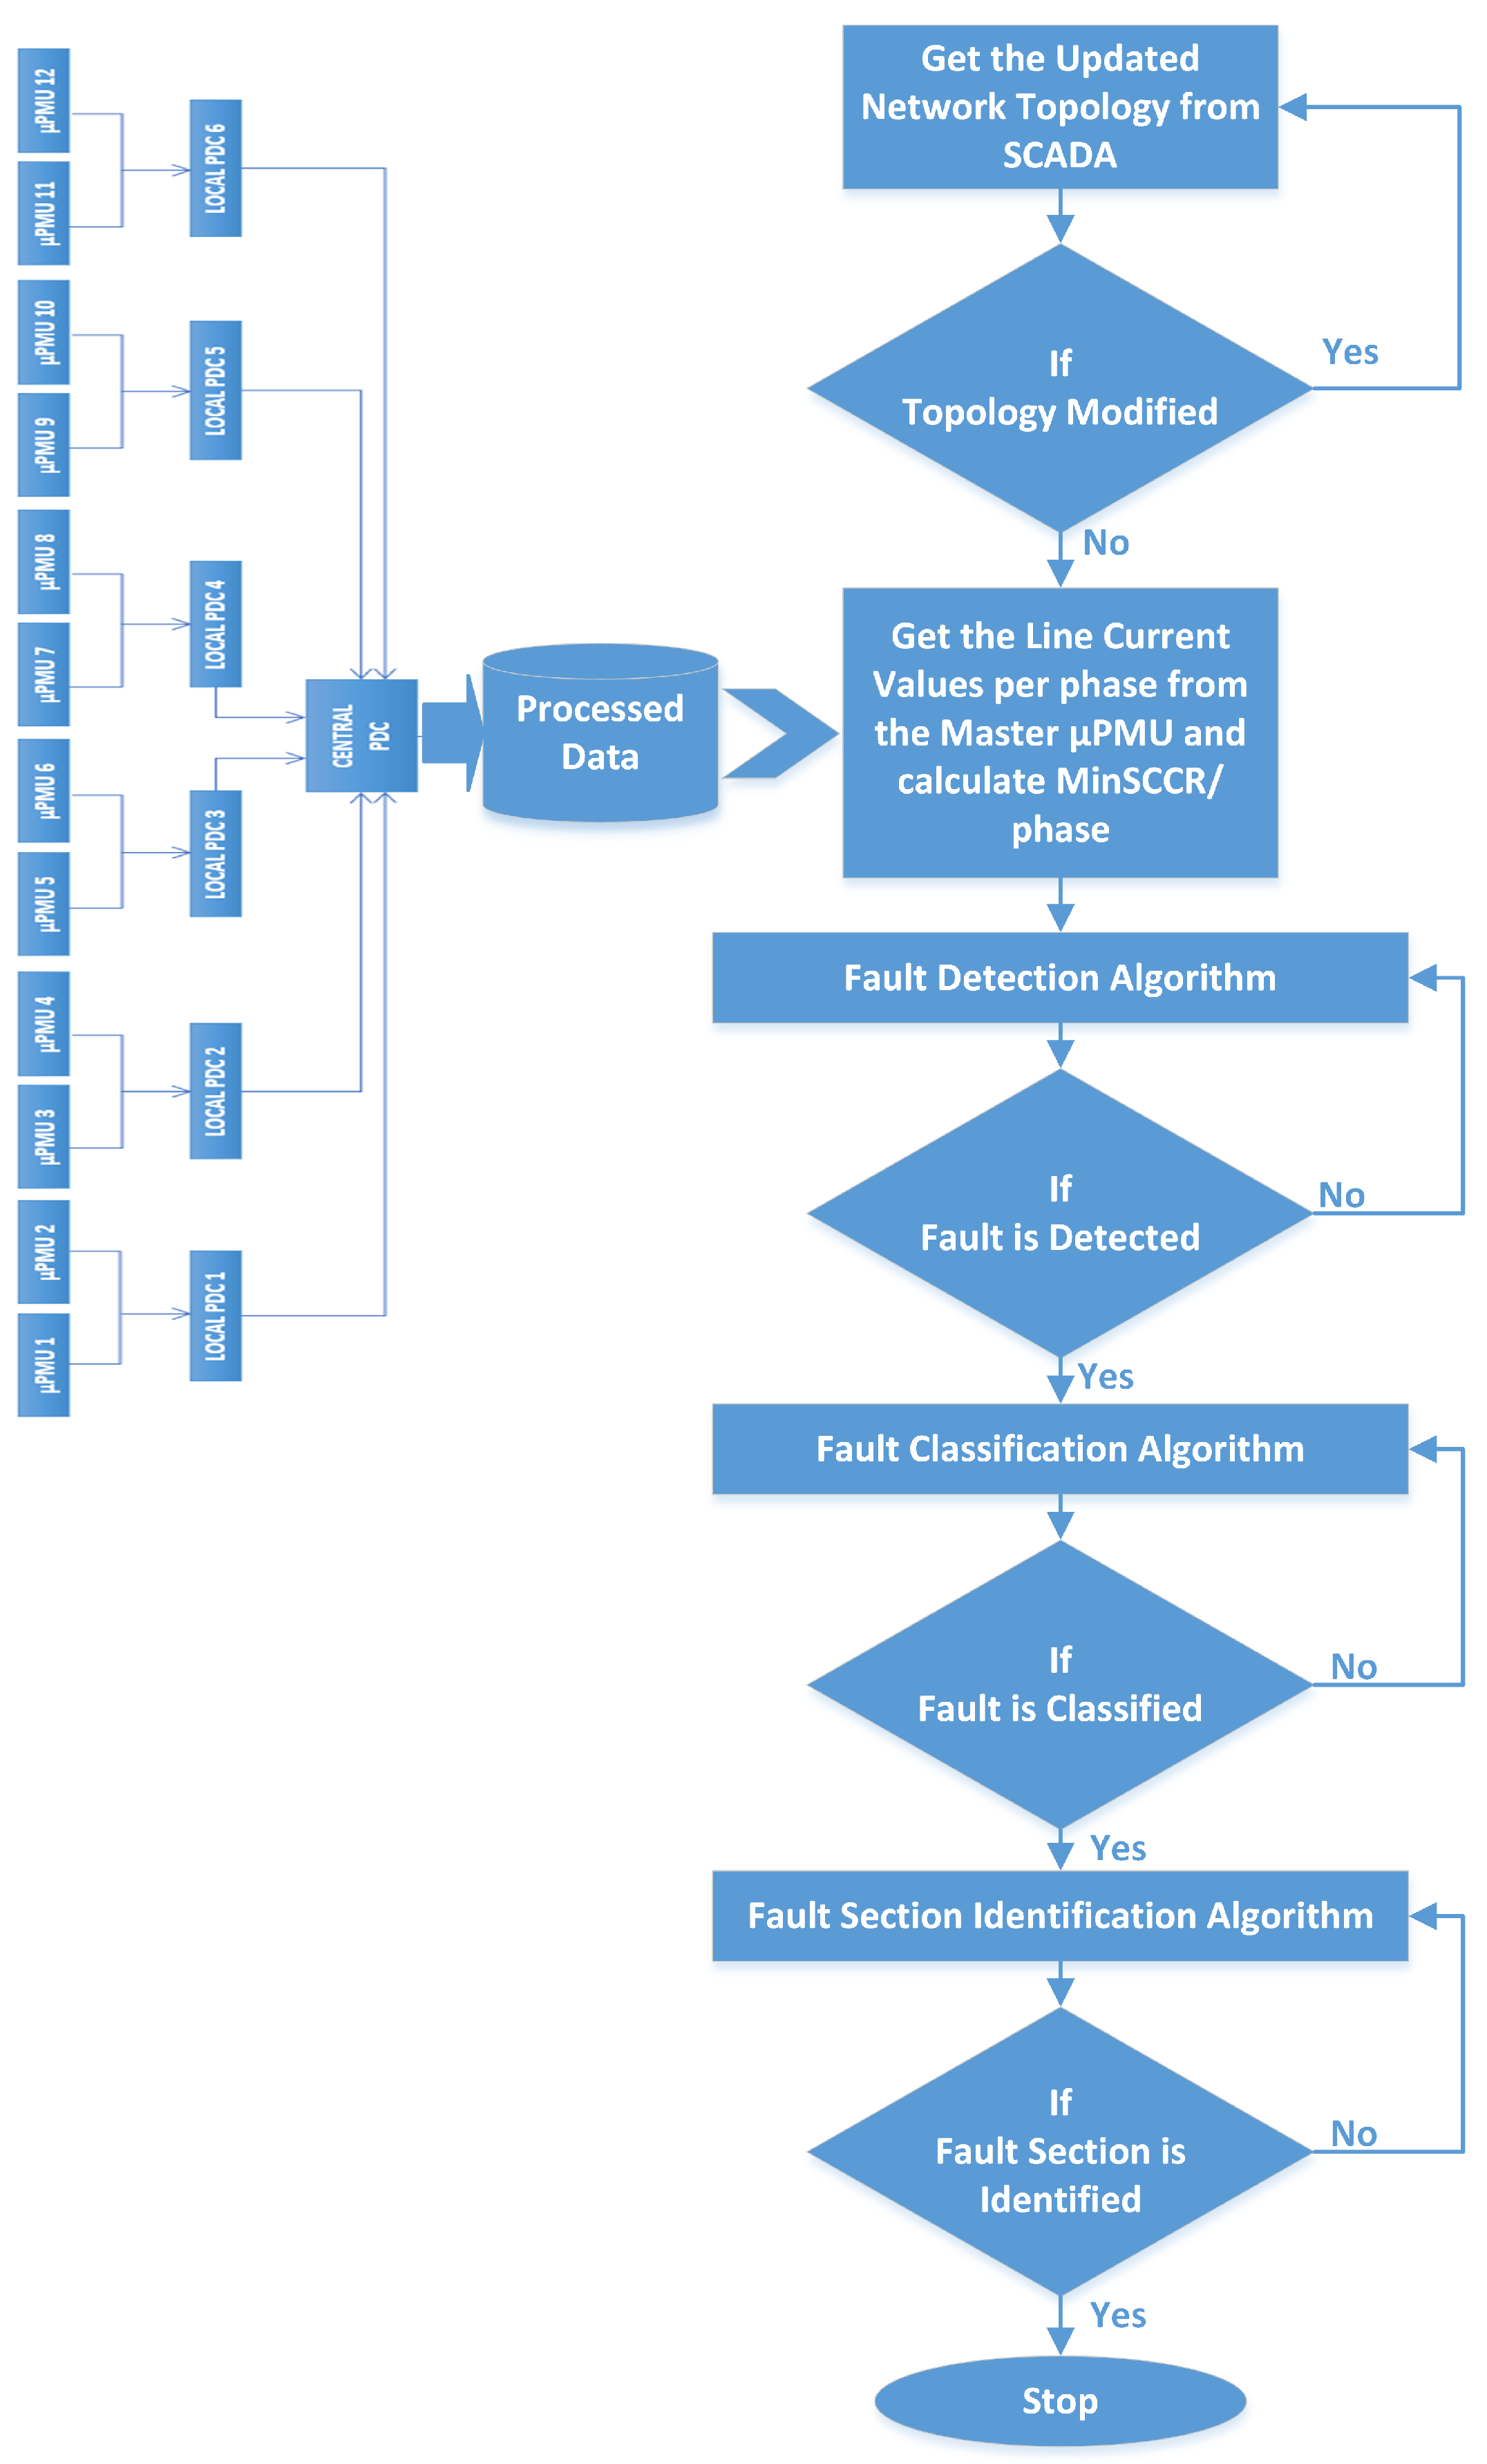
4.11. Integration of FDCSI Algorithm
Figure 7 shows the integrated algorithm for fault detection, classification, and section identification. This is performed by combining the different algorithms step-by-step to ensure that all the steps are followed in order to meet the objectives of the algorithm process.
5. Testing and Validation of Algorithms
The validation of the individual algorithms and integrated algorithms is performed by the proposed rules-based I-FDCSI method for real distribution networks using PMUs. The method was tested and validated using data from a real distribution network. The method was tested on all the possible faults with different % of sections ranging from 0.001% to 99.99% and with different fault resistances (0.01 , 1 , 2.5 , 5 , 10 , 15 , and 20 ) and was able to successfully detect, classify, and sectionalise faults with a high degree of accuracy. For all the classes and sections of faults, the algorithm is giving highly accurate results for both simulated data and the generated realistic PMU data. Additionally, the method was able to accurately estimate the fault when the fault occurs at the nodes, which is important for the isolation of the faulted section from the healthy portion of the network and restoration of service. Overall, the testing and validation results demonstrate the effectiveness and accuracy of the proposed I-FDCSI method for fault detection, classification, and section identification in real distribution networks using PMUs.
5.1. Fault Detection Test
The developed algorithm was tested with different events such as load switching, DG switching, tap change event, capacitor switching and fault events and the results of non-fault events and fault event detection are plotted in
Table 2.
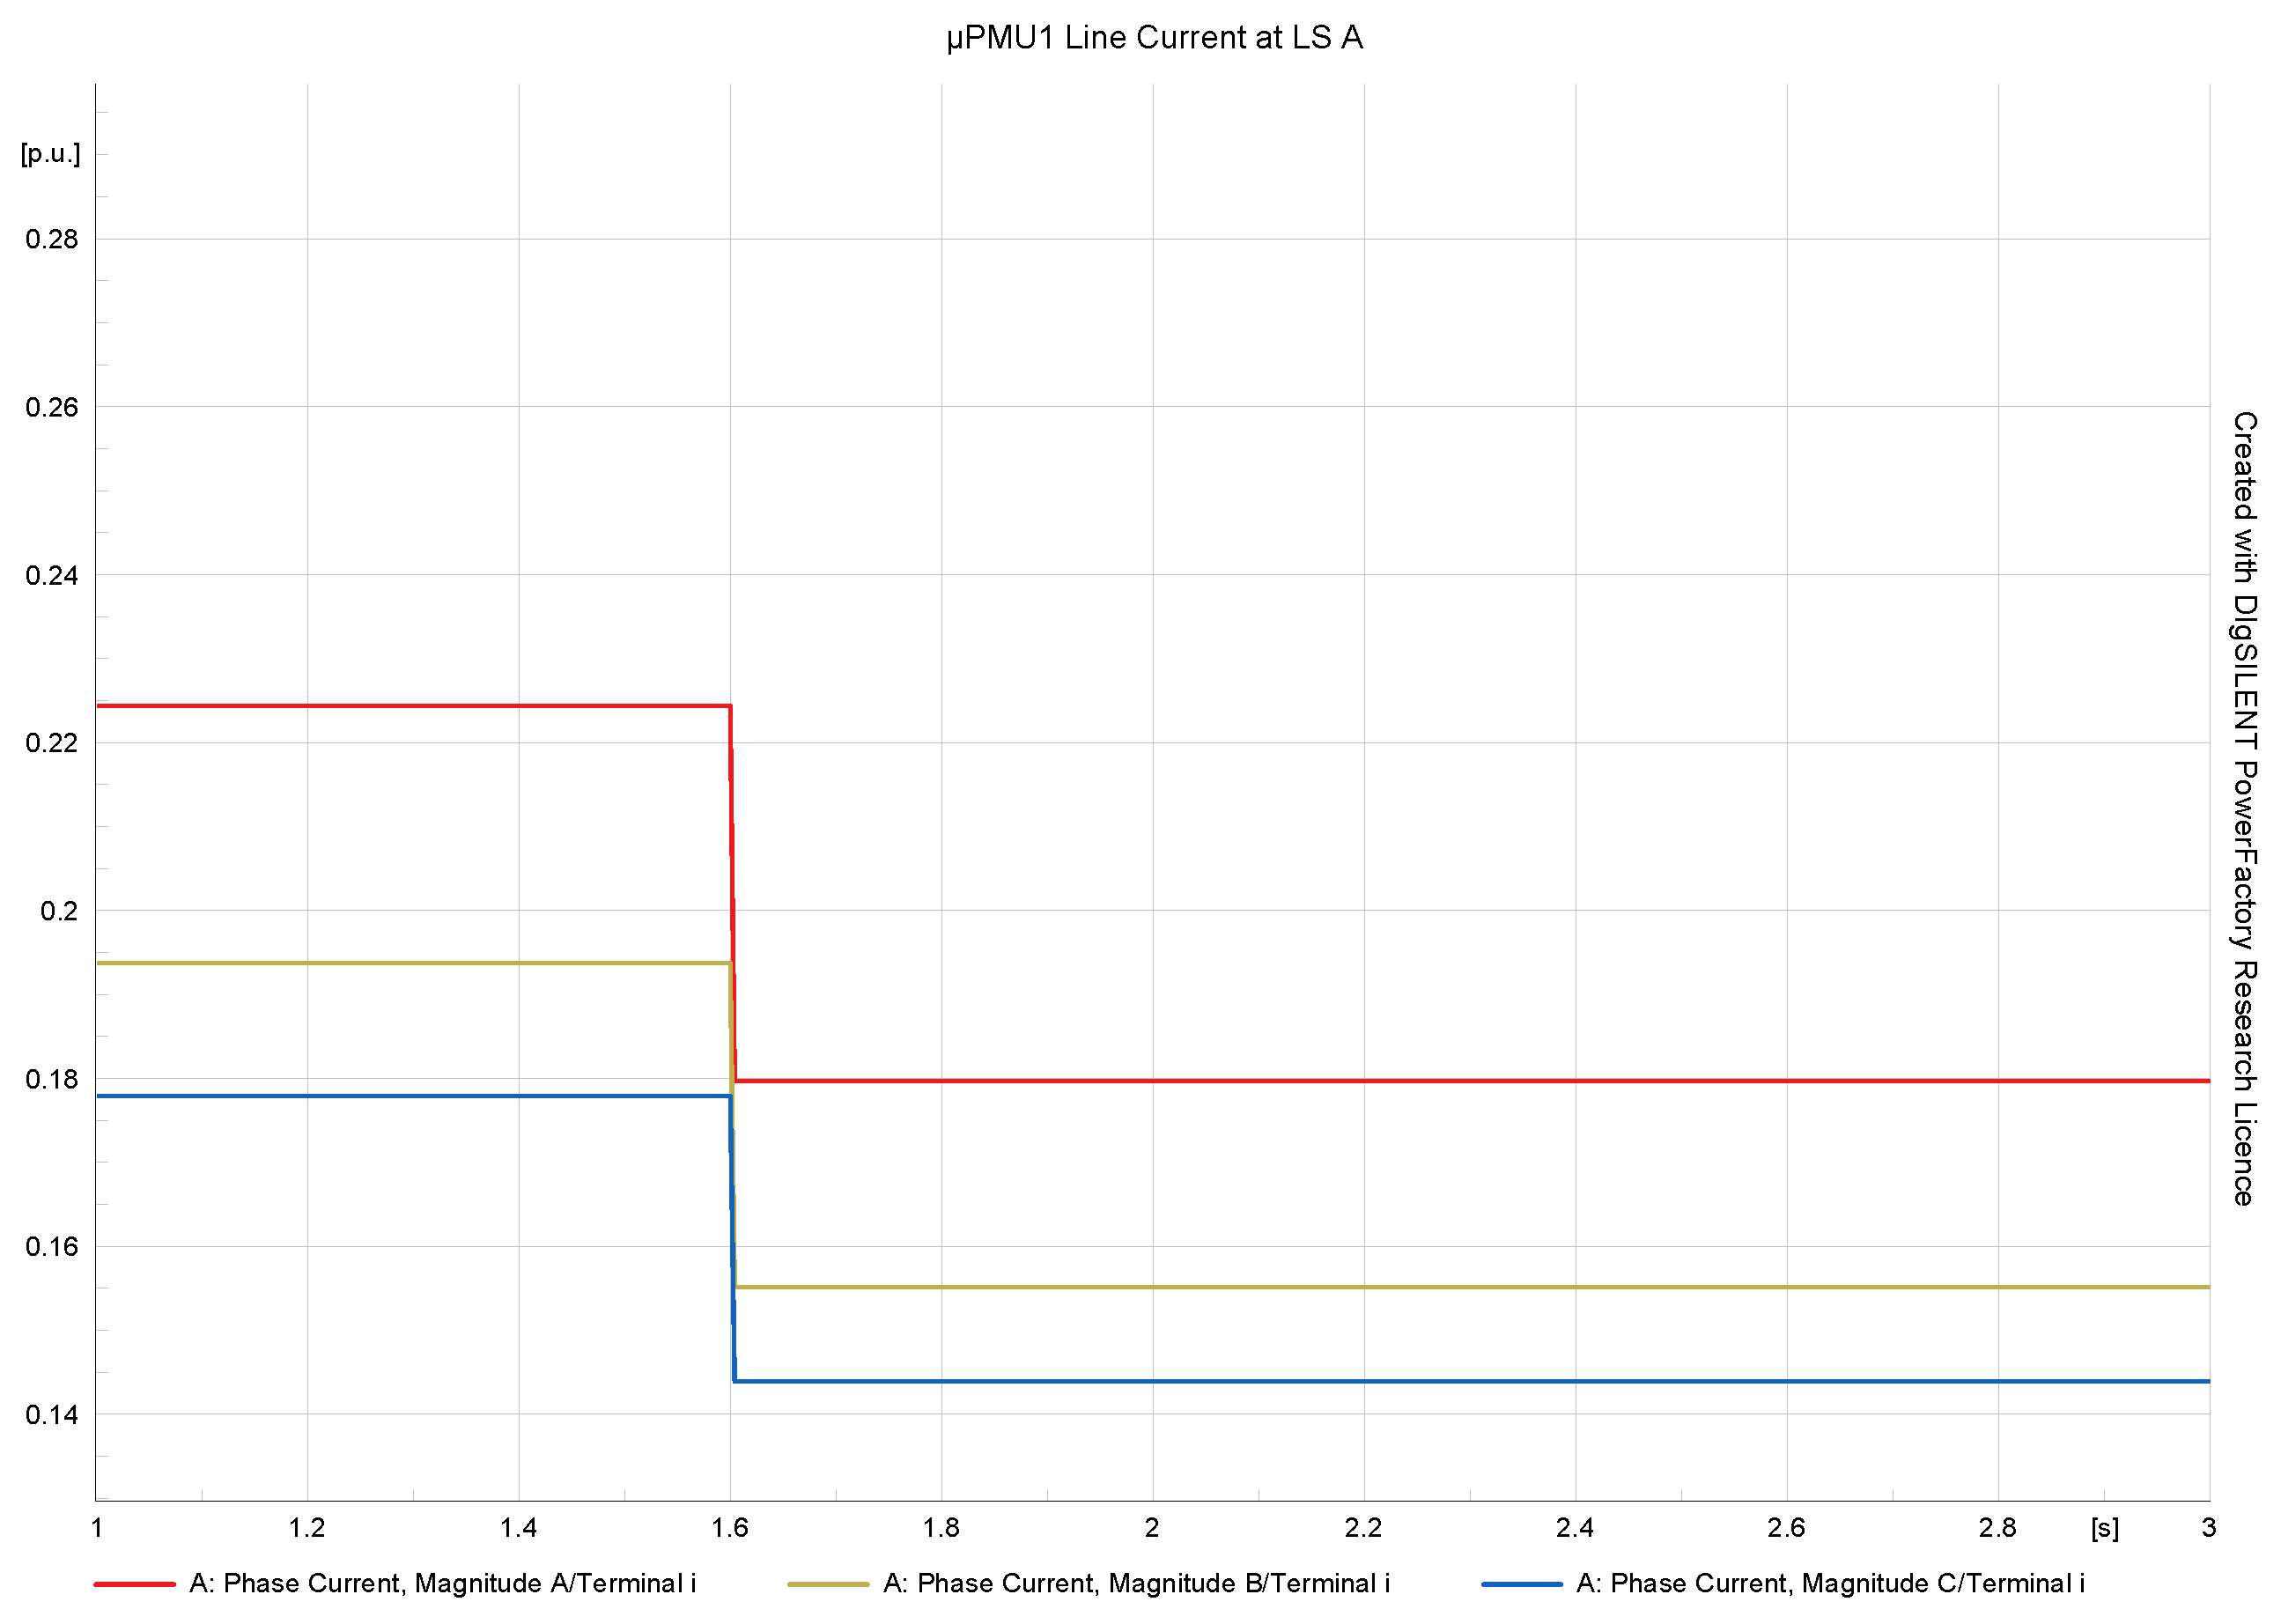
5.1.1. No-Fault Event Test
All the non-fault events tested using the FD algorithm were not detected as “fault”. The events include load switching (
Figure 8), DG switching event (
Figure 9), tap changer event (
Figure 10), and capacitor switching event (
Figure 11). None of these events were detected as faults because these events are not satisfying the defined FD algorithm conditions.
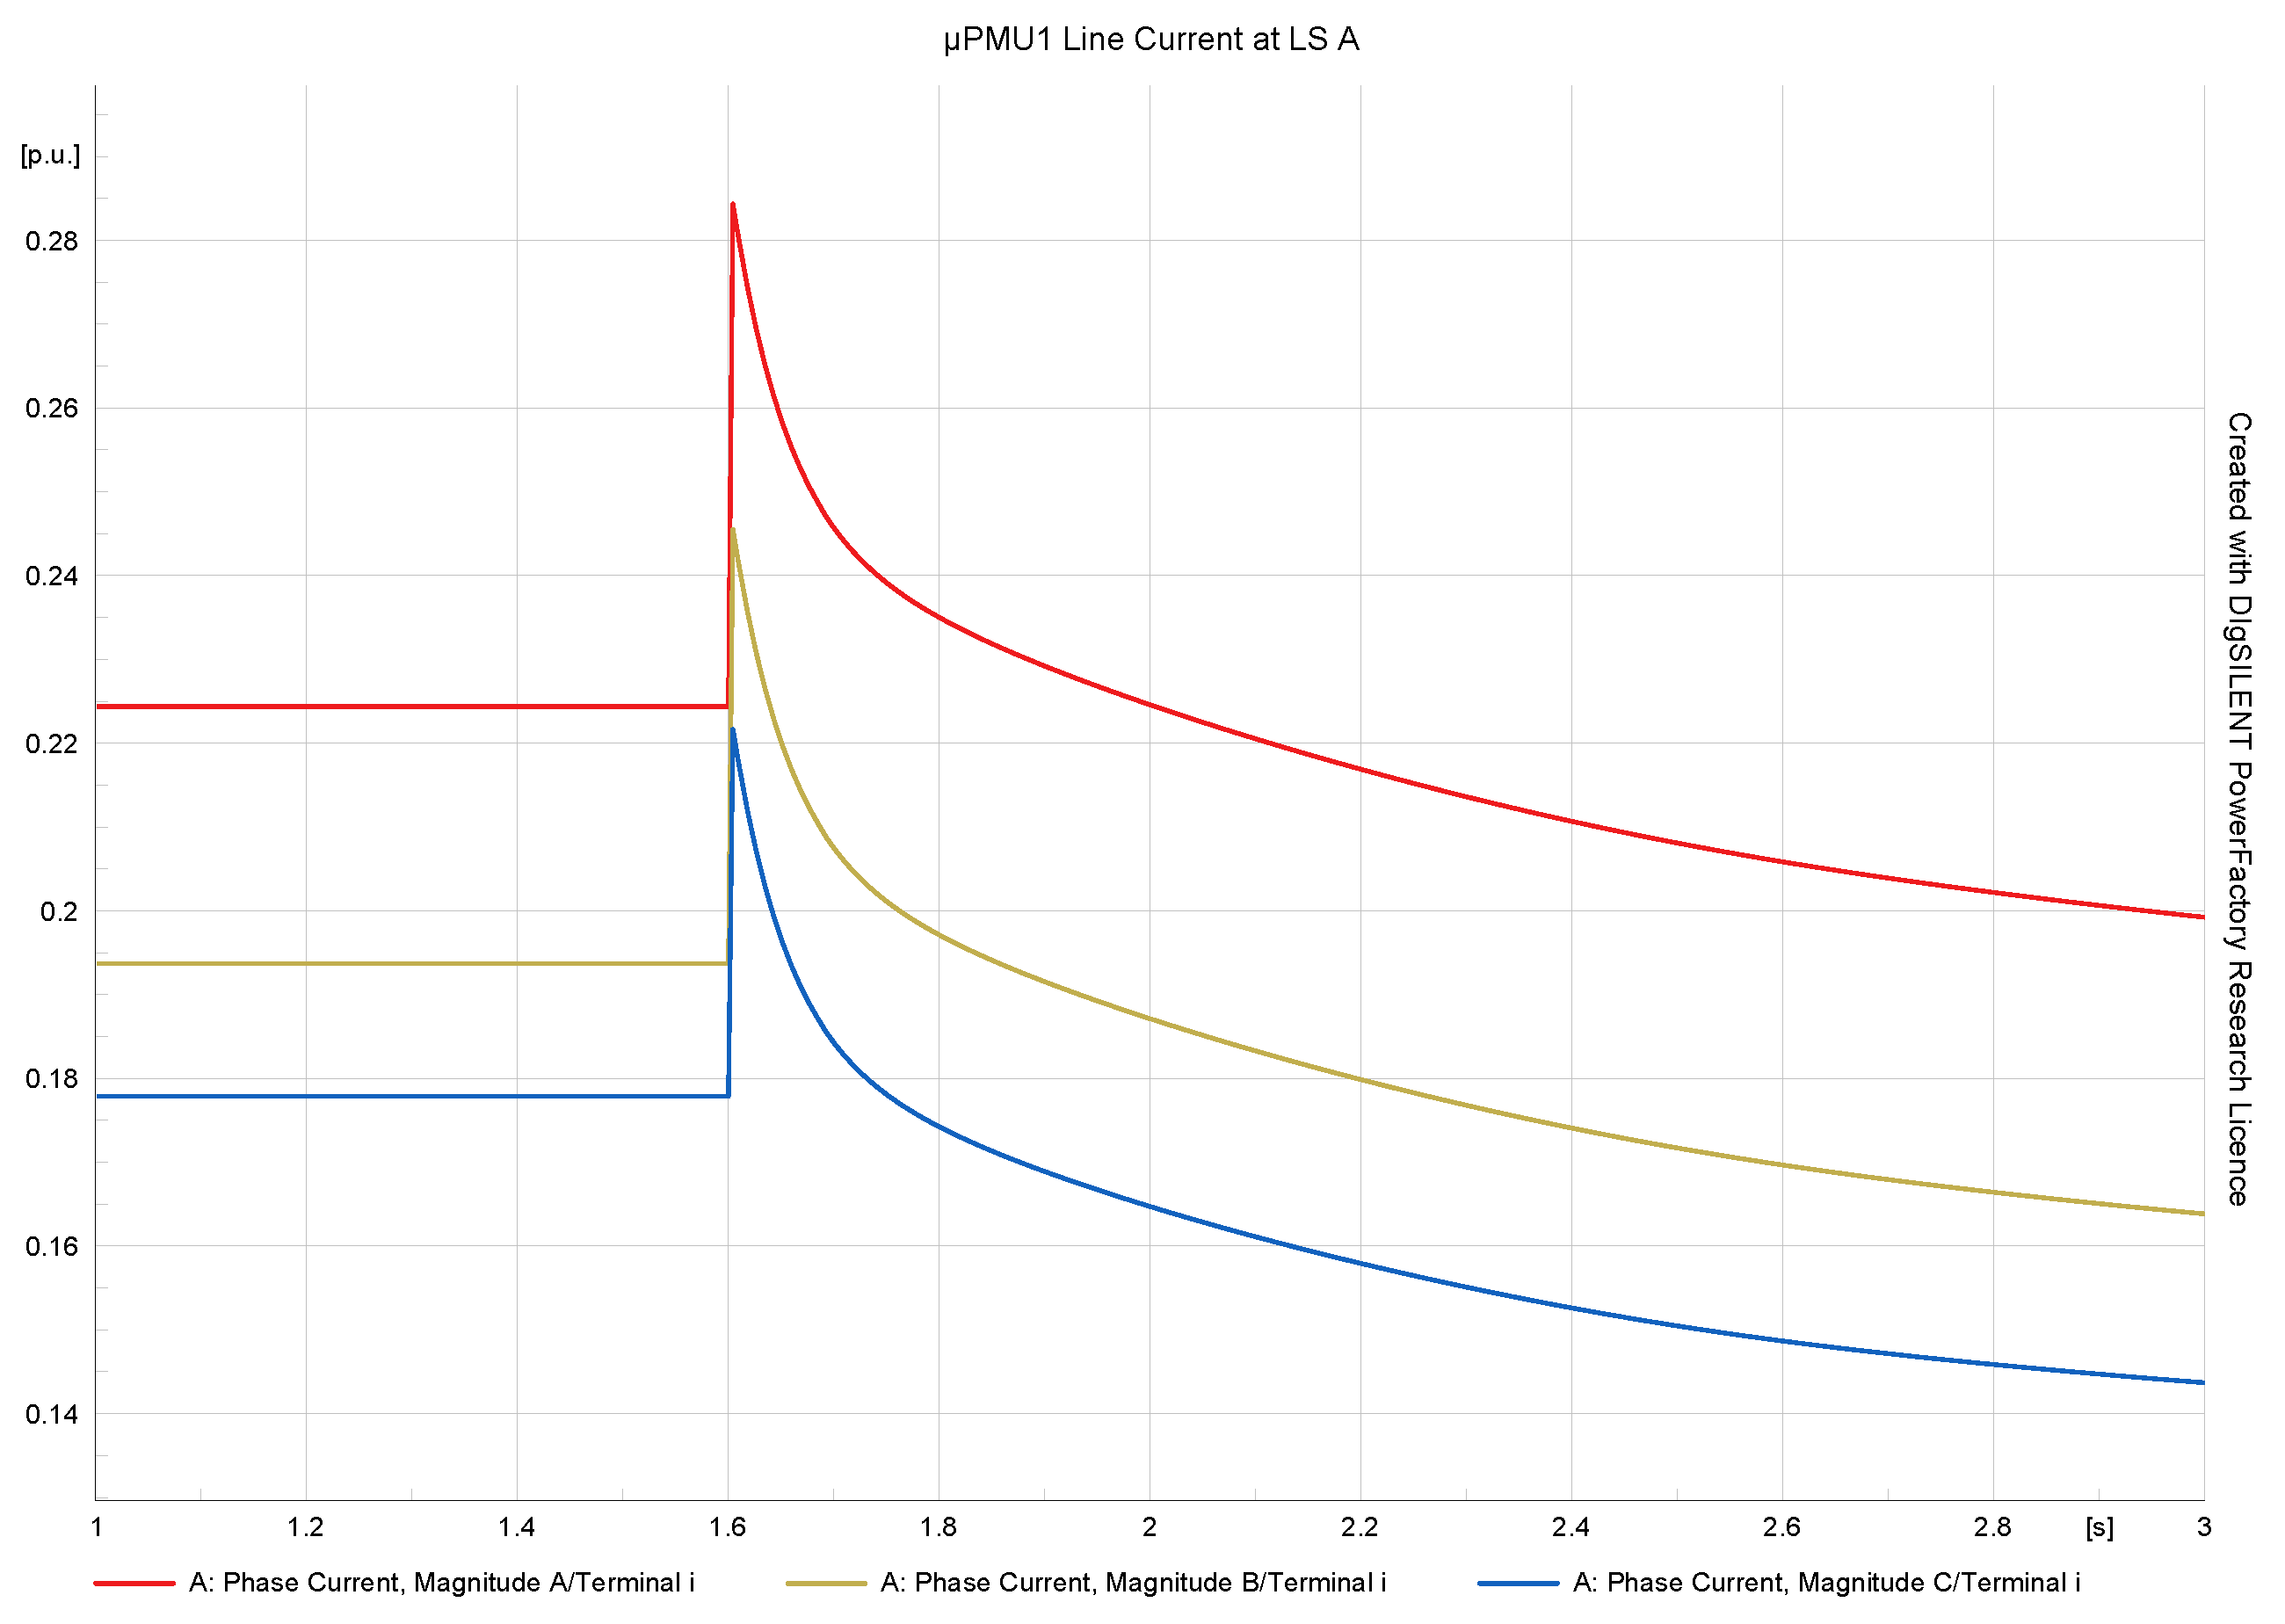
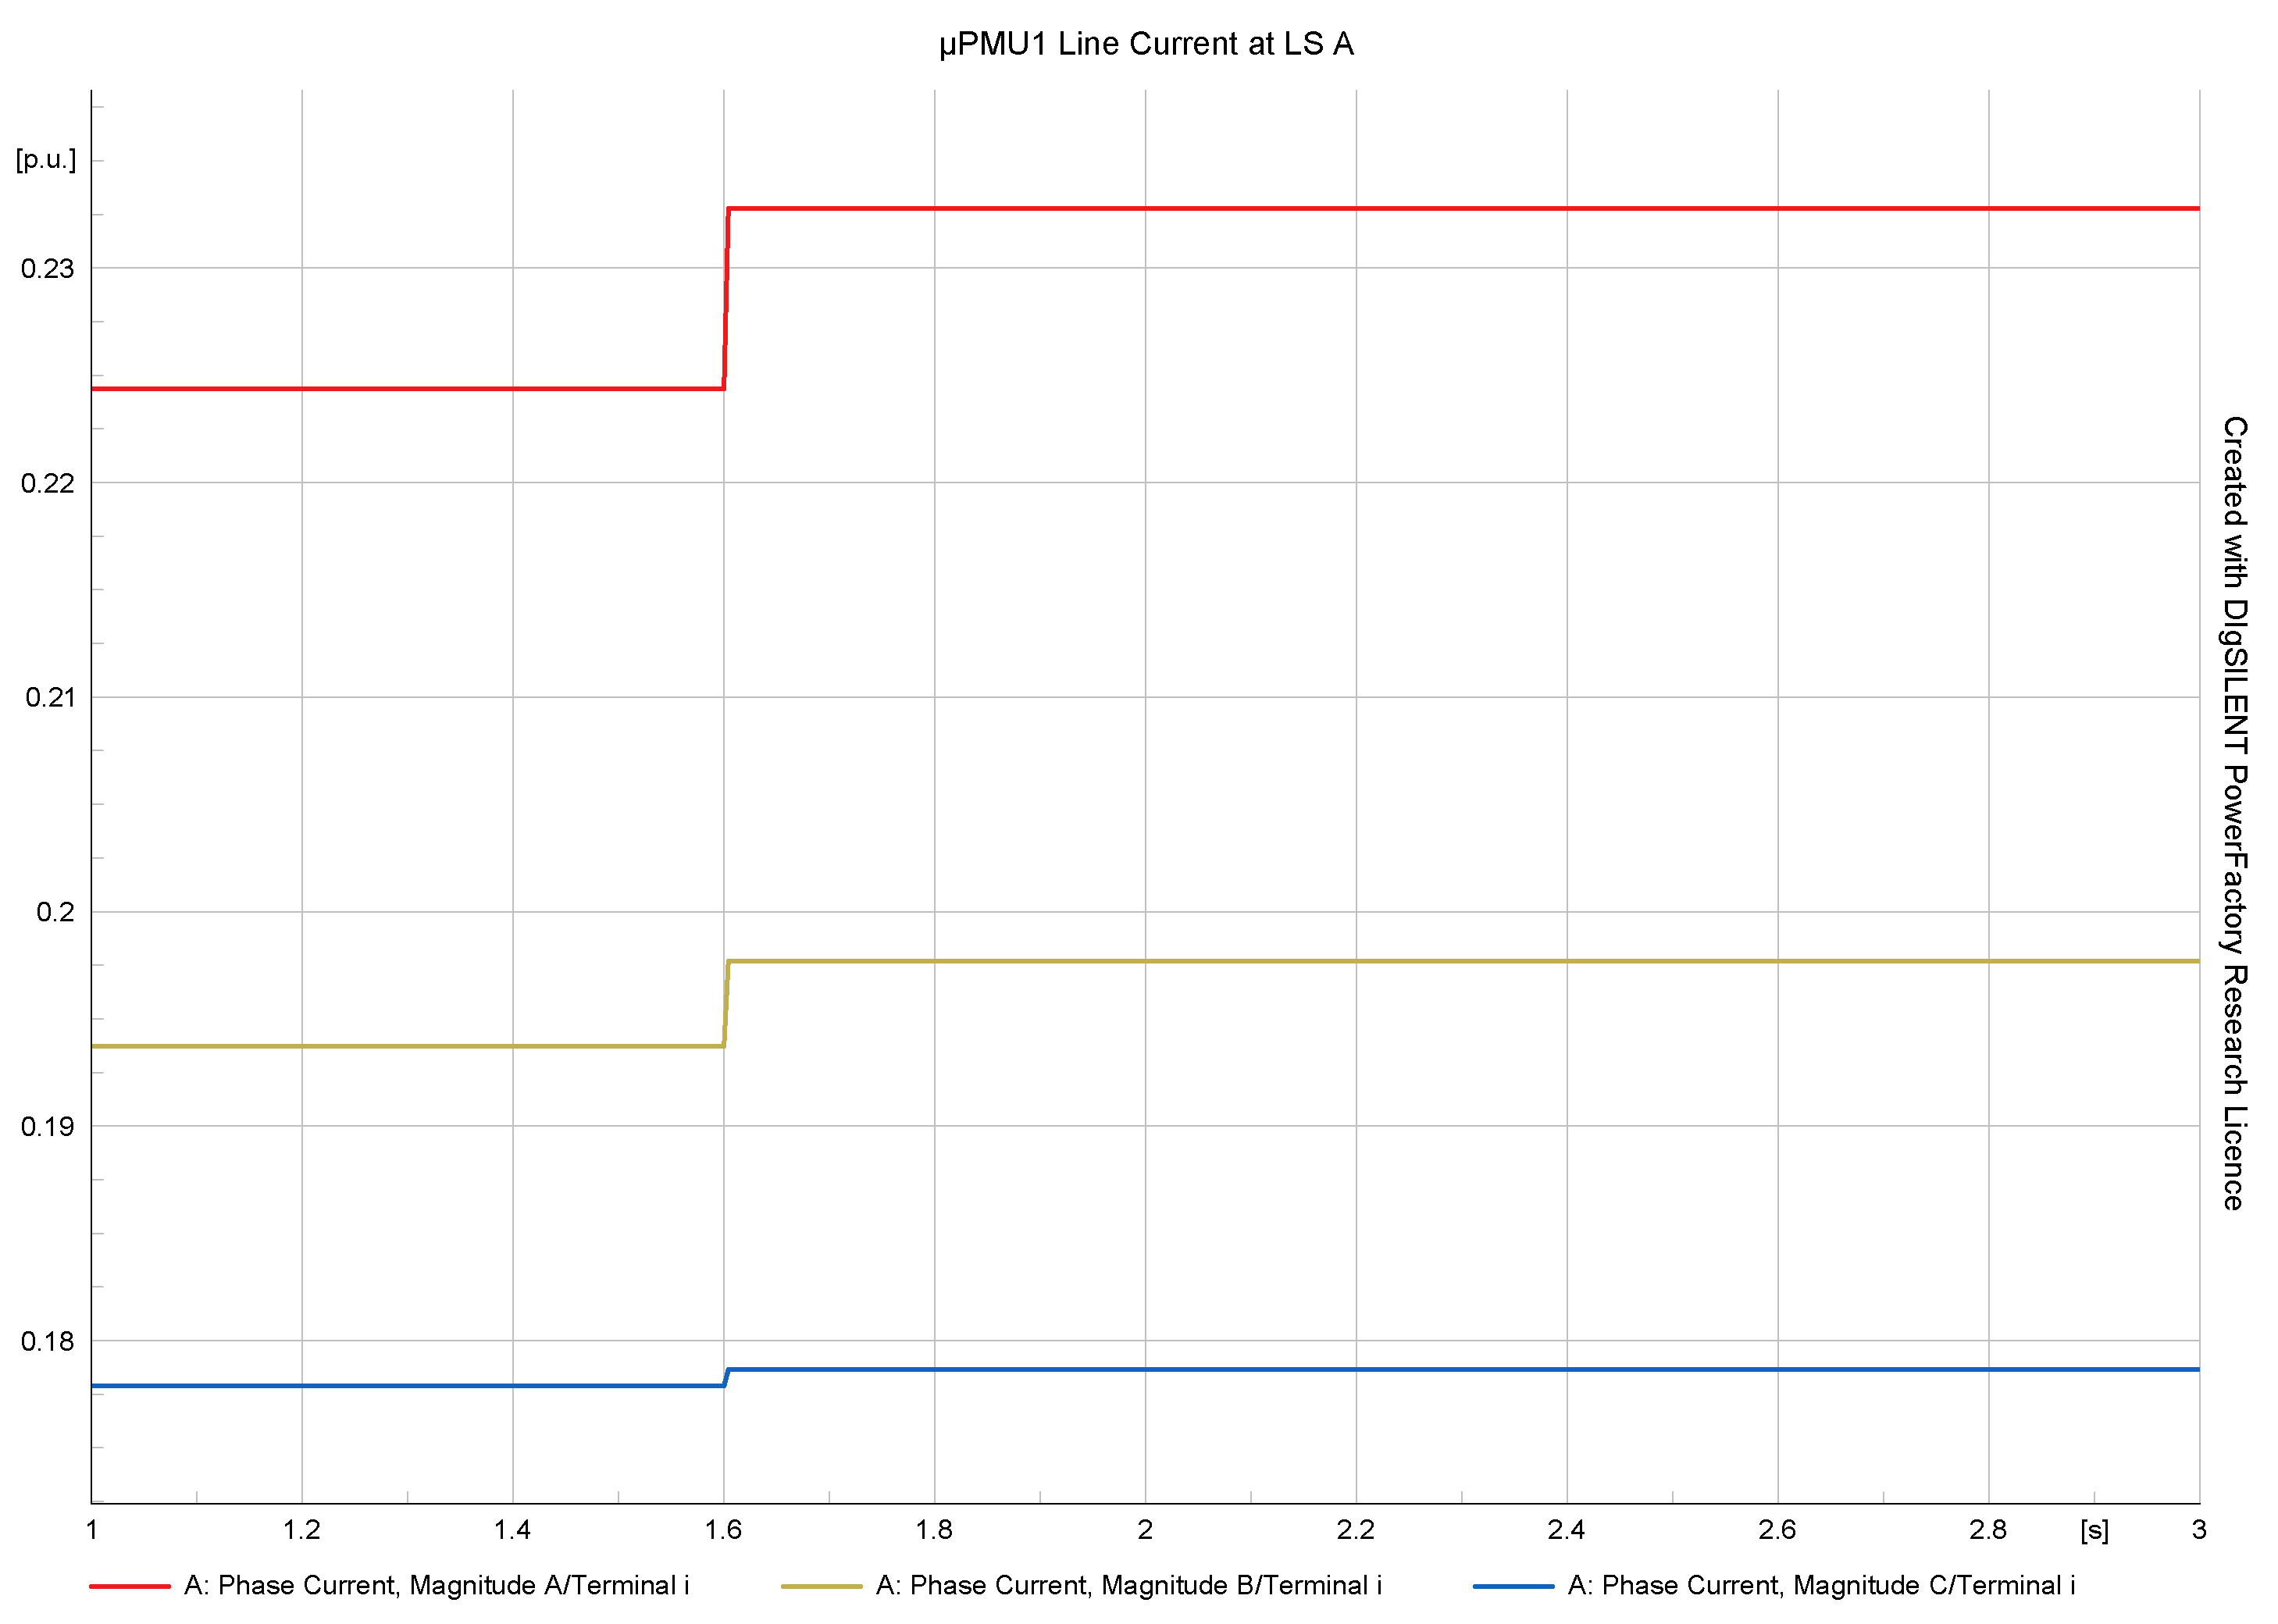
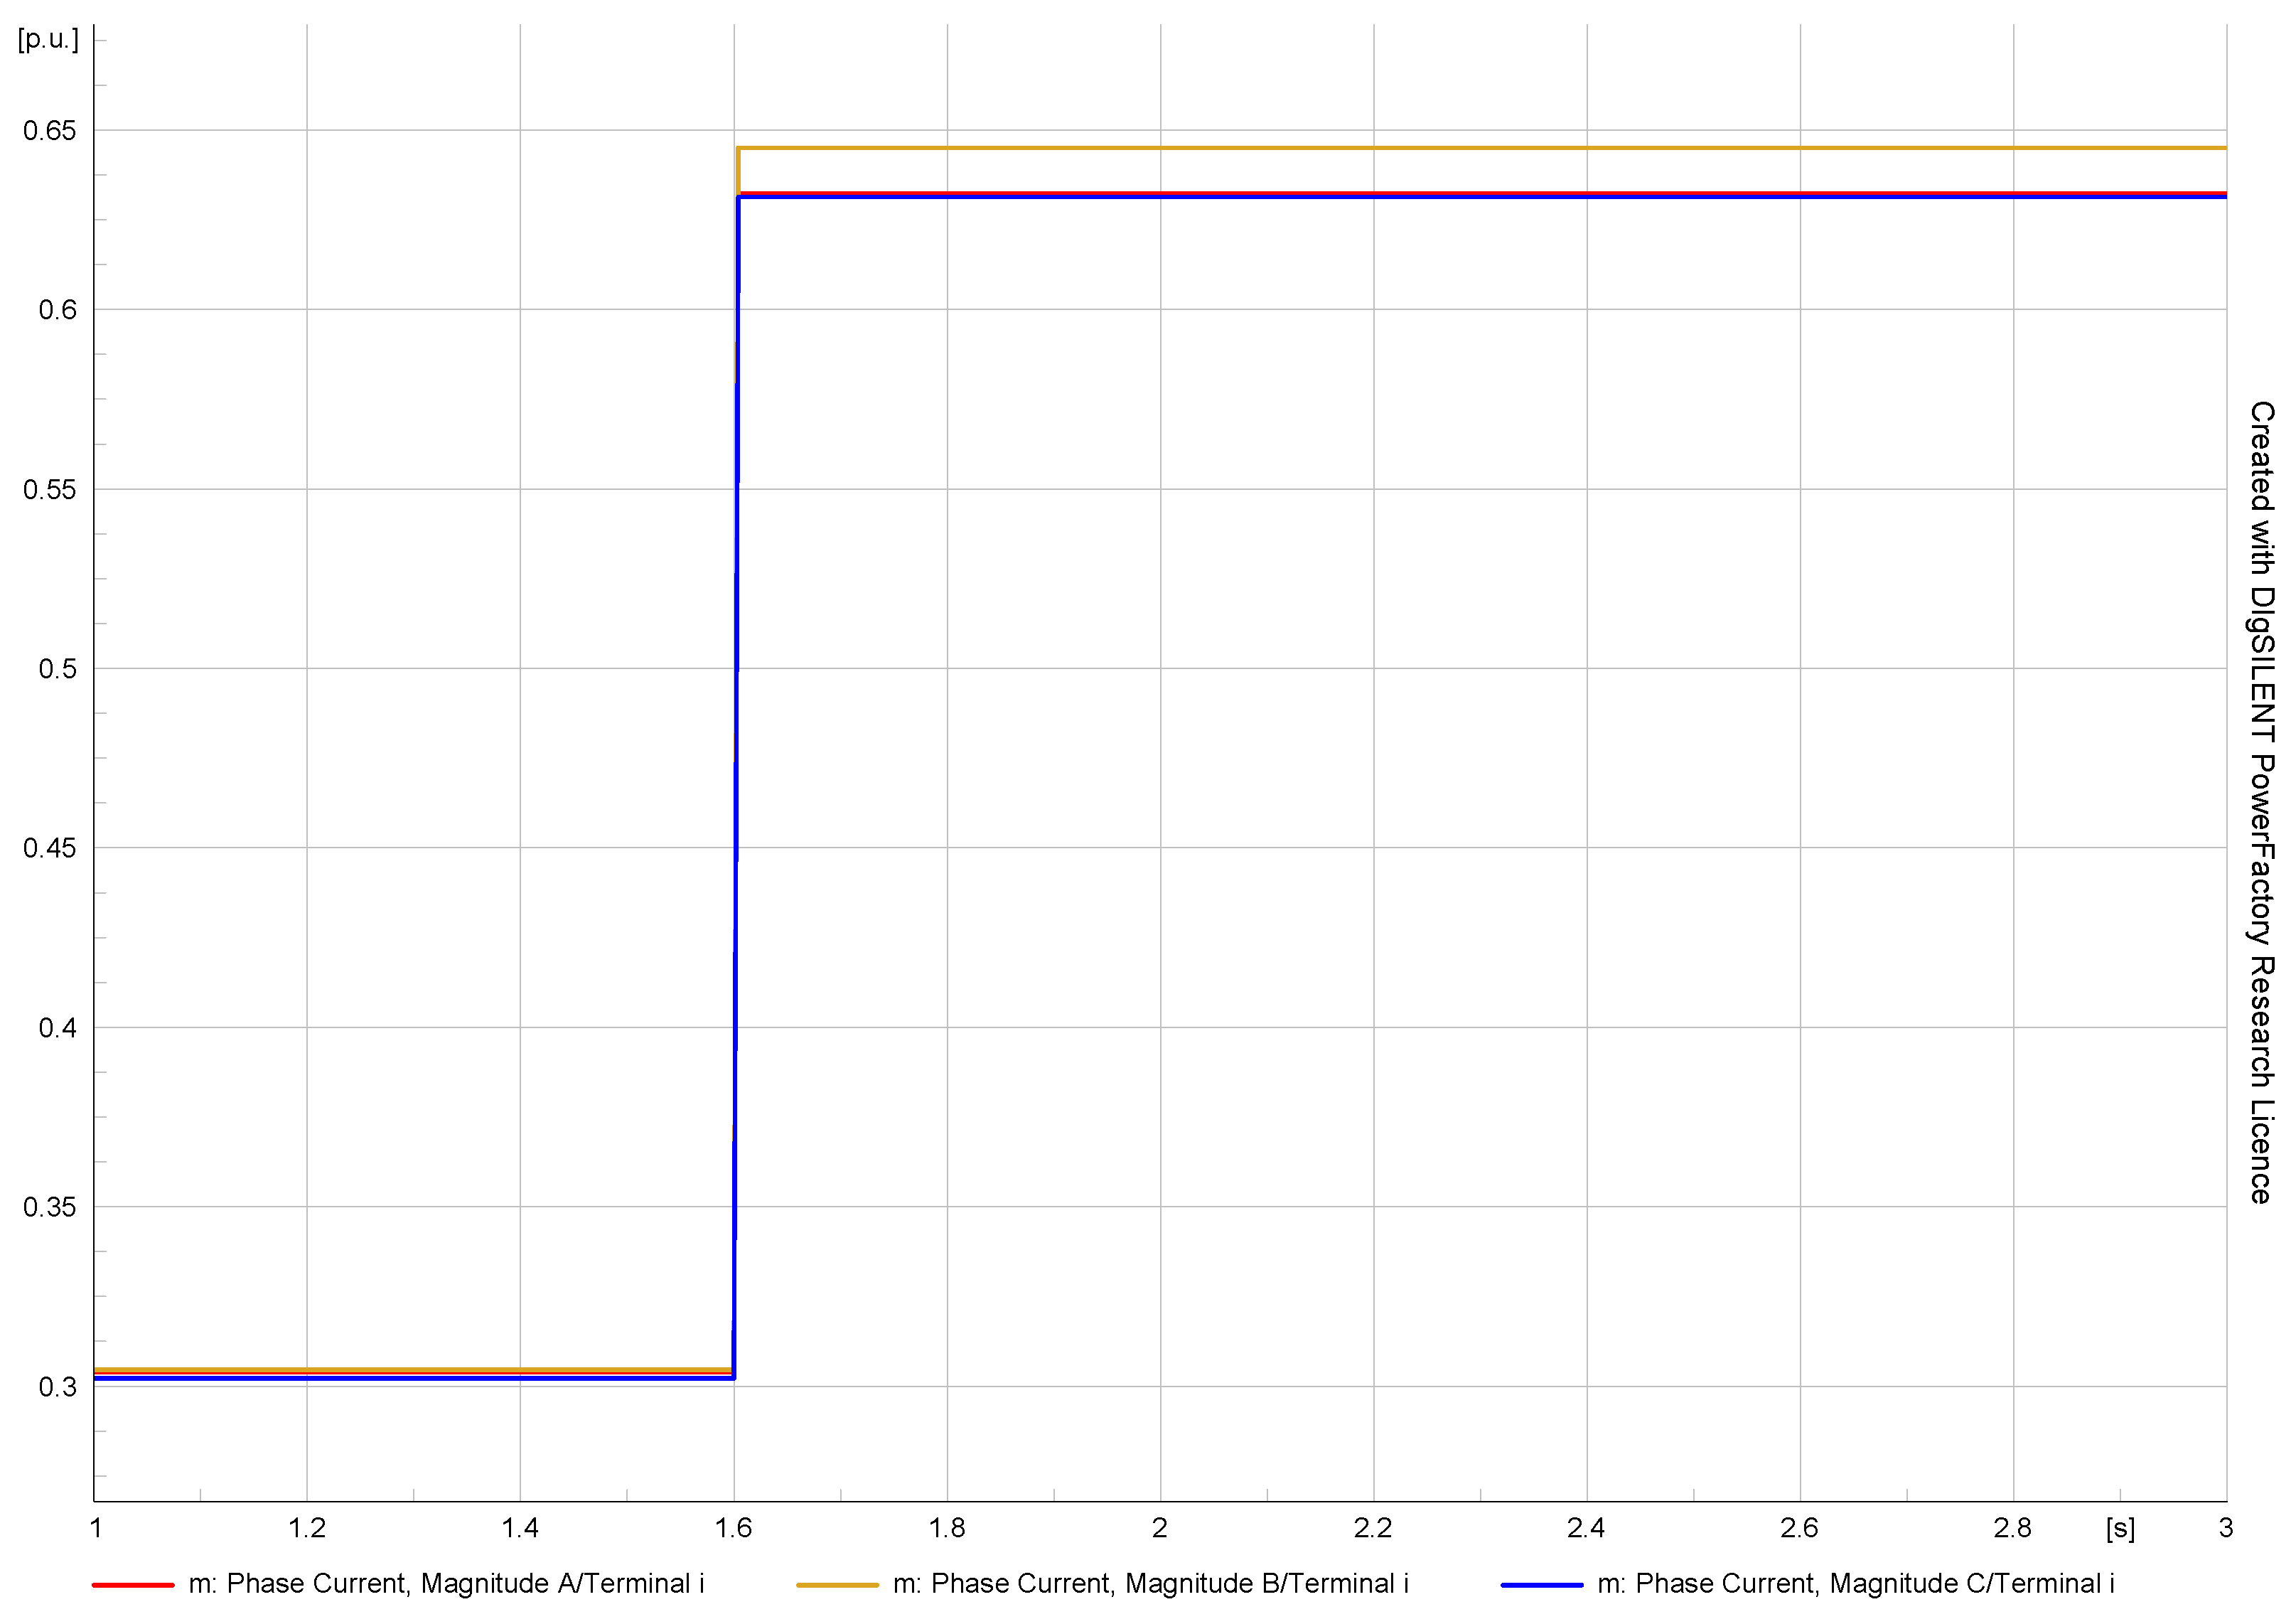
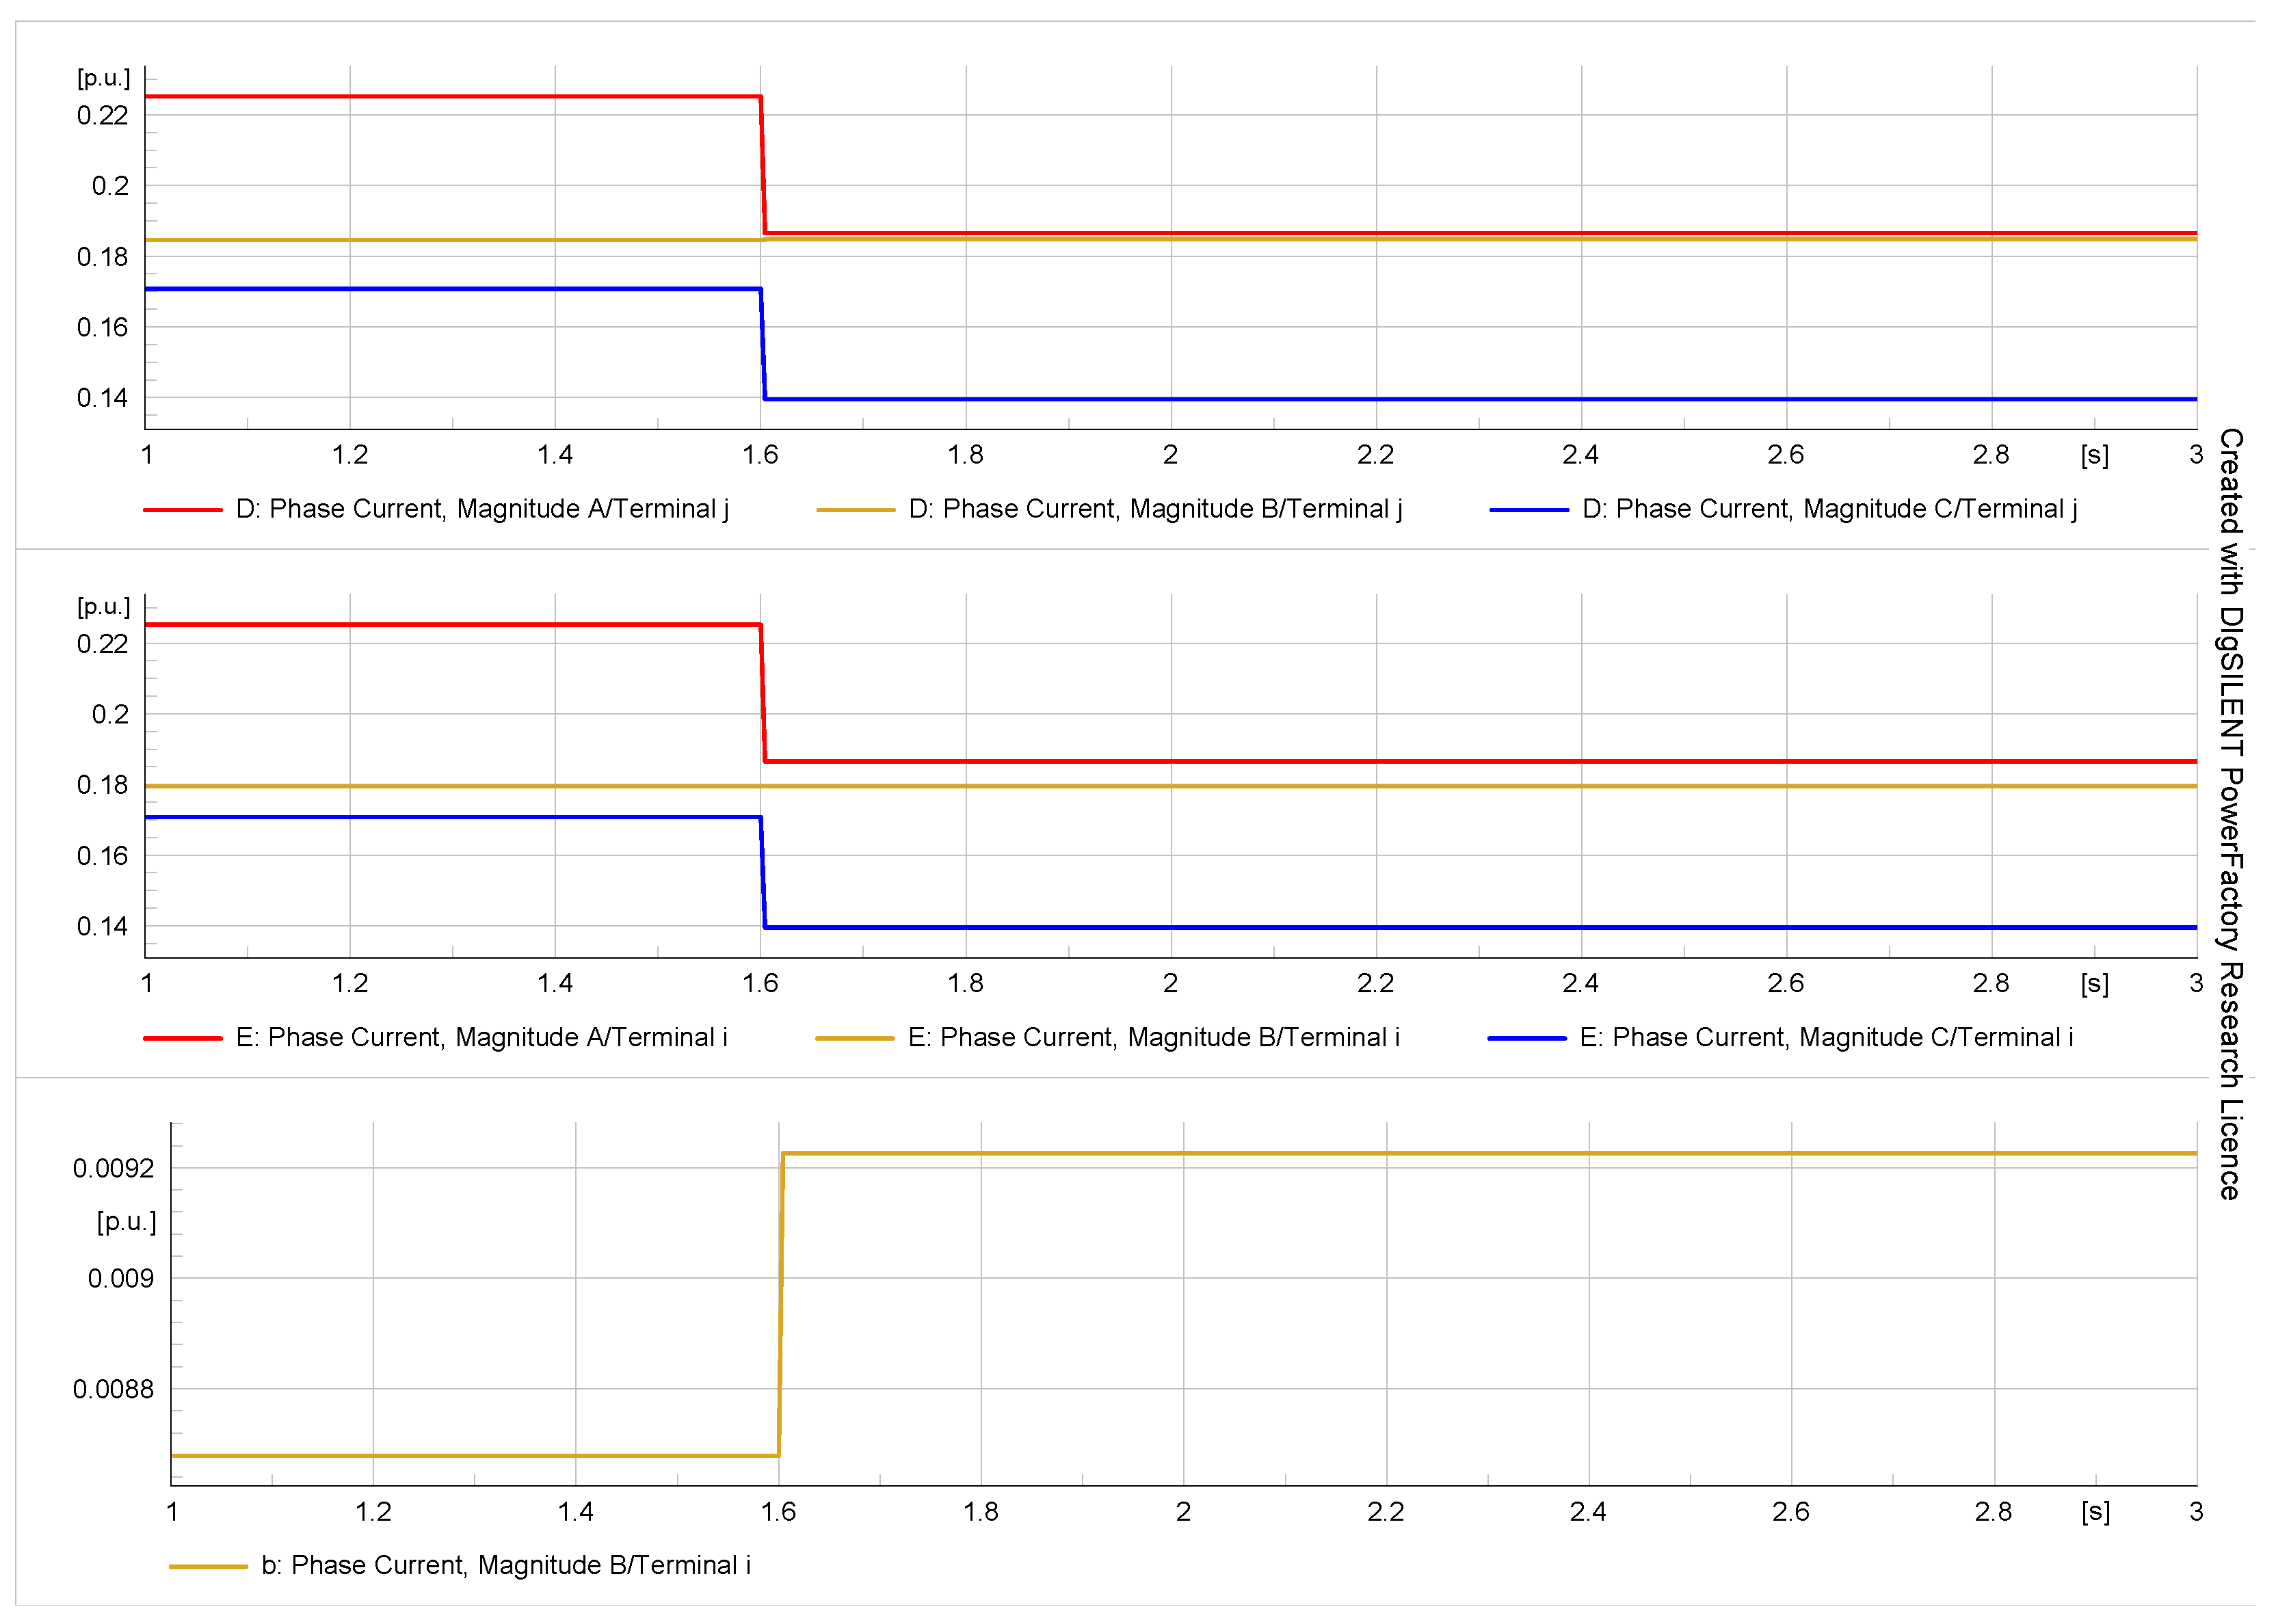
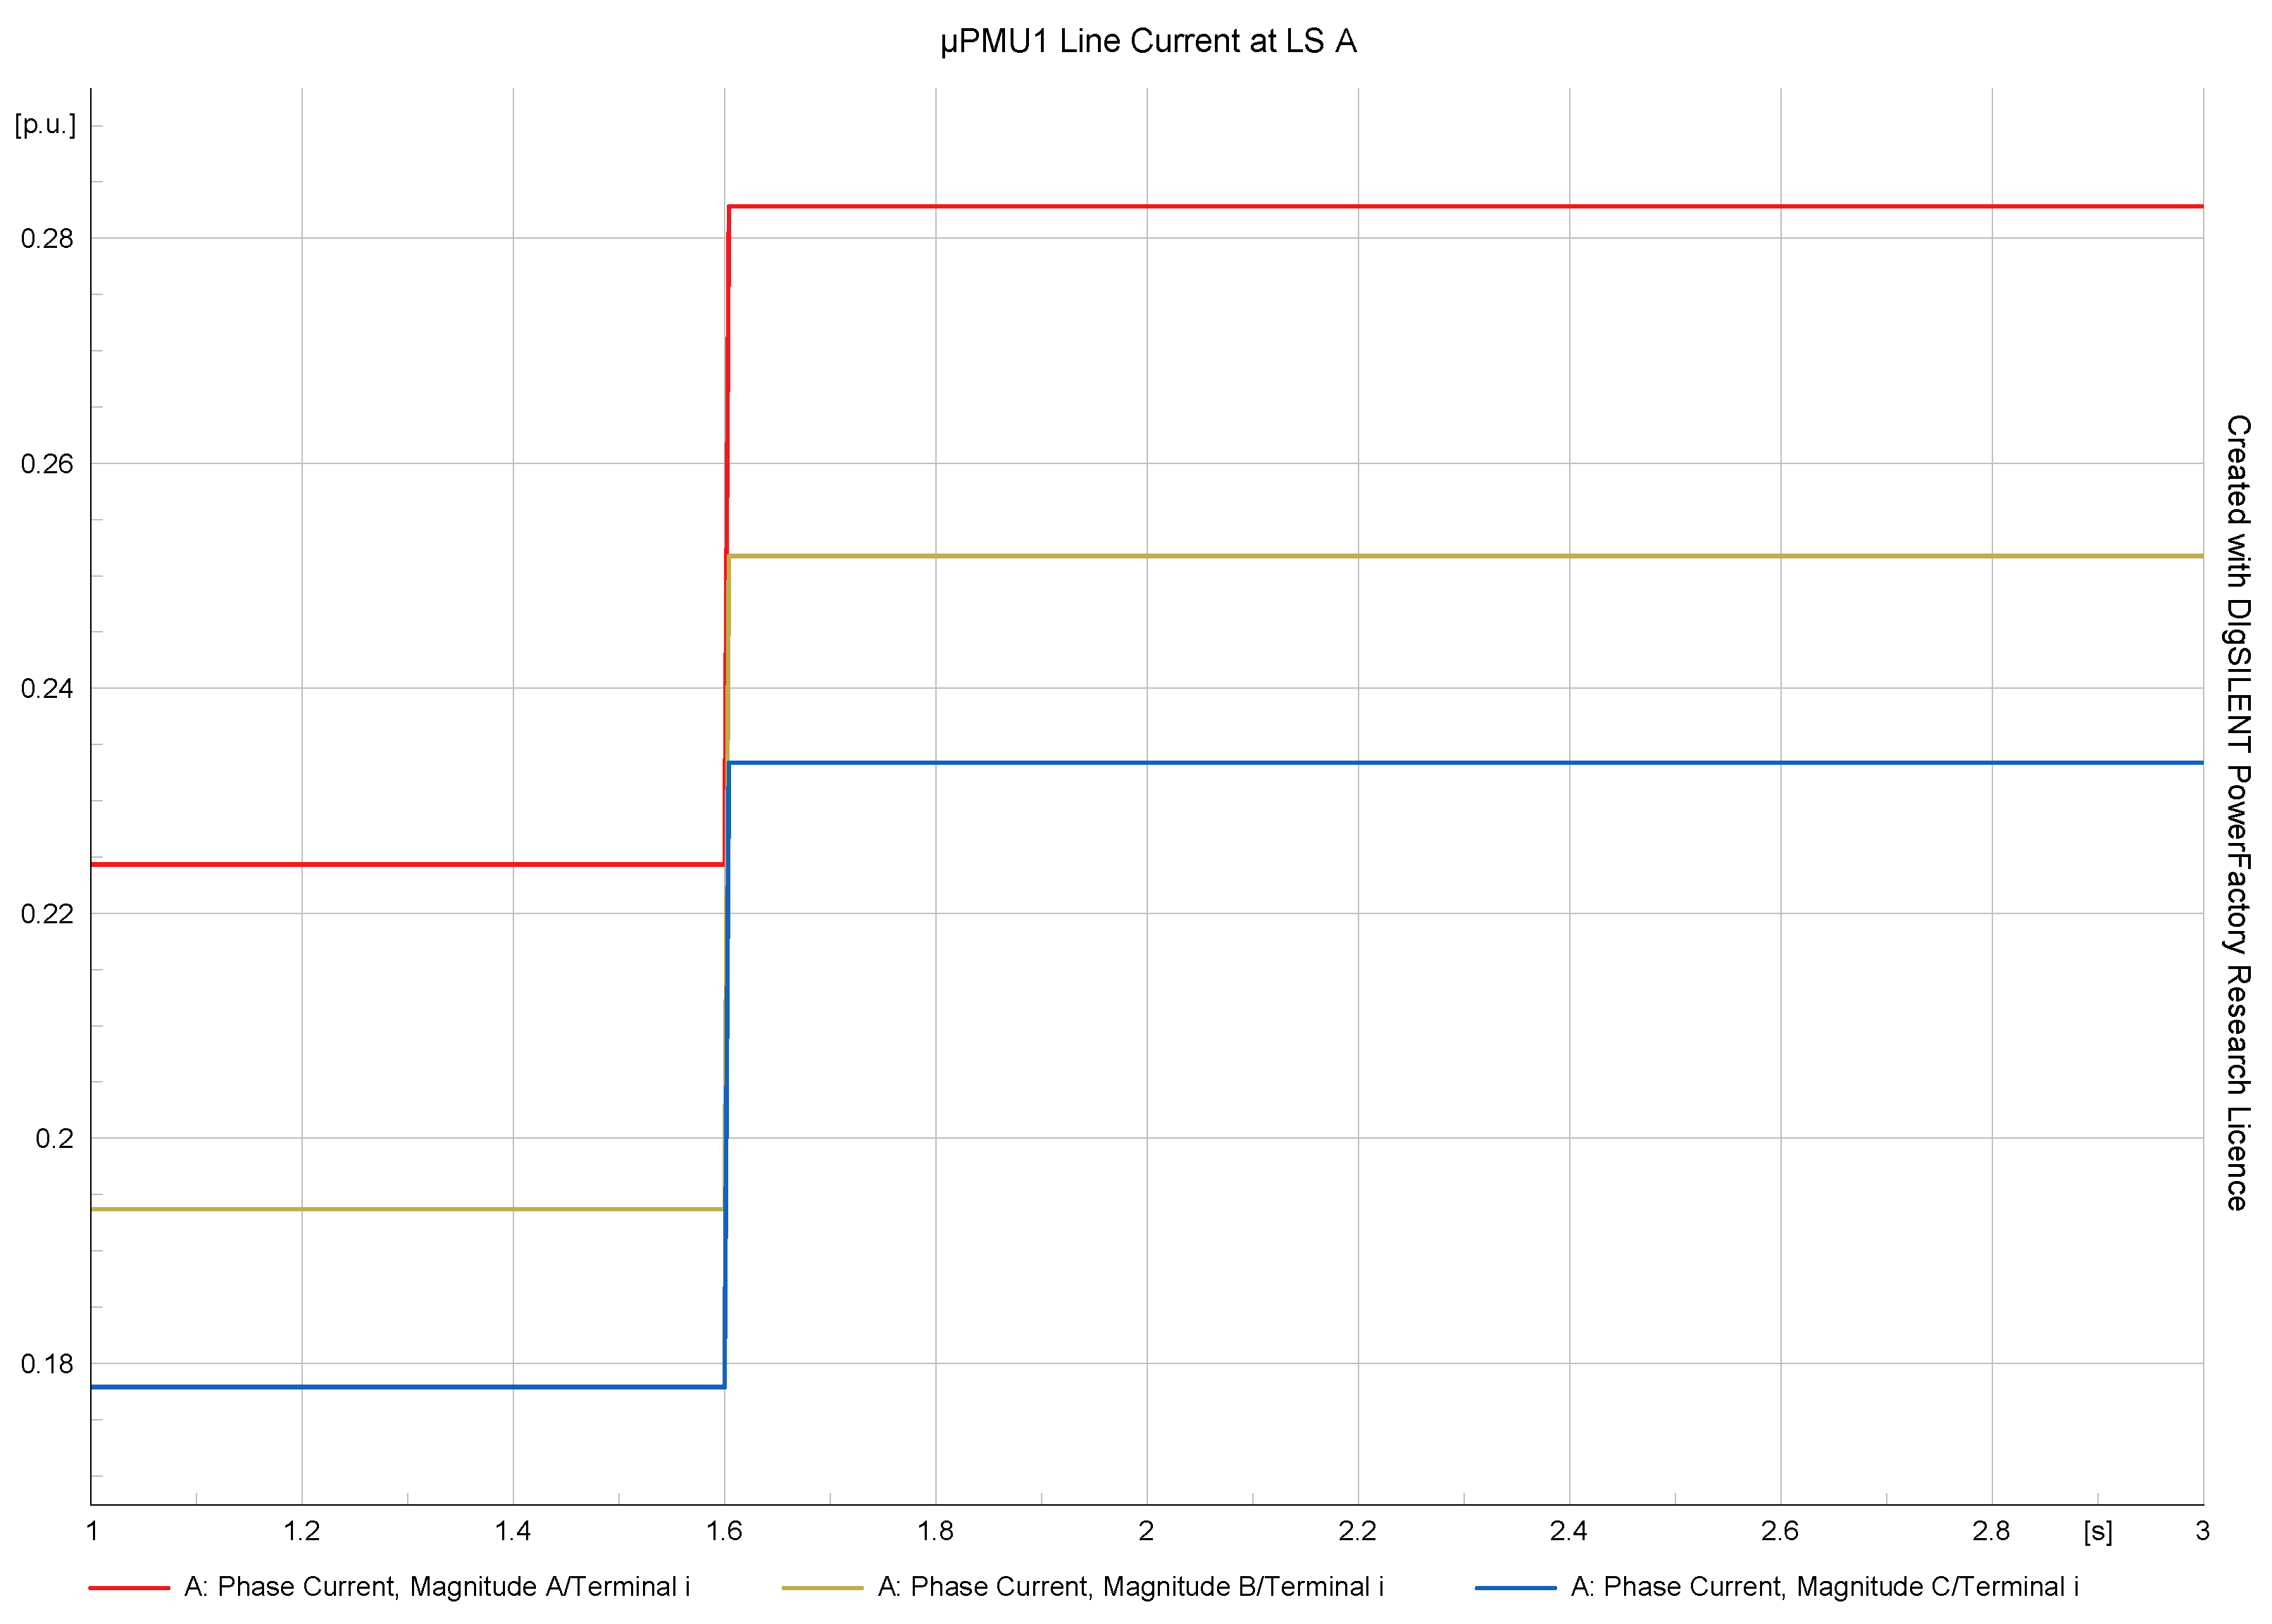
5.1.2. Fault Event Test
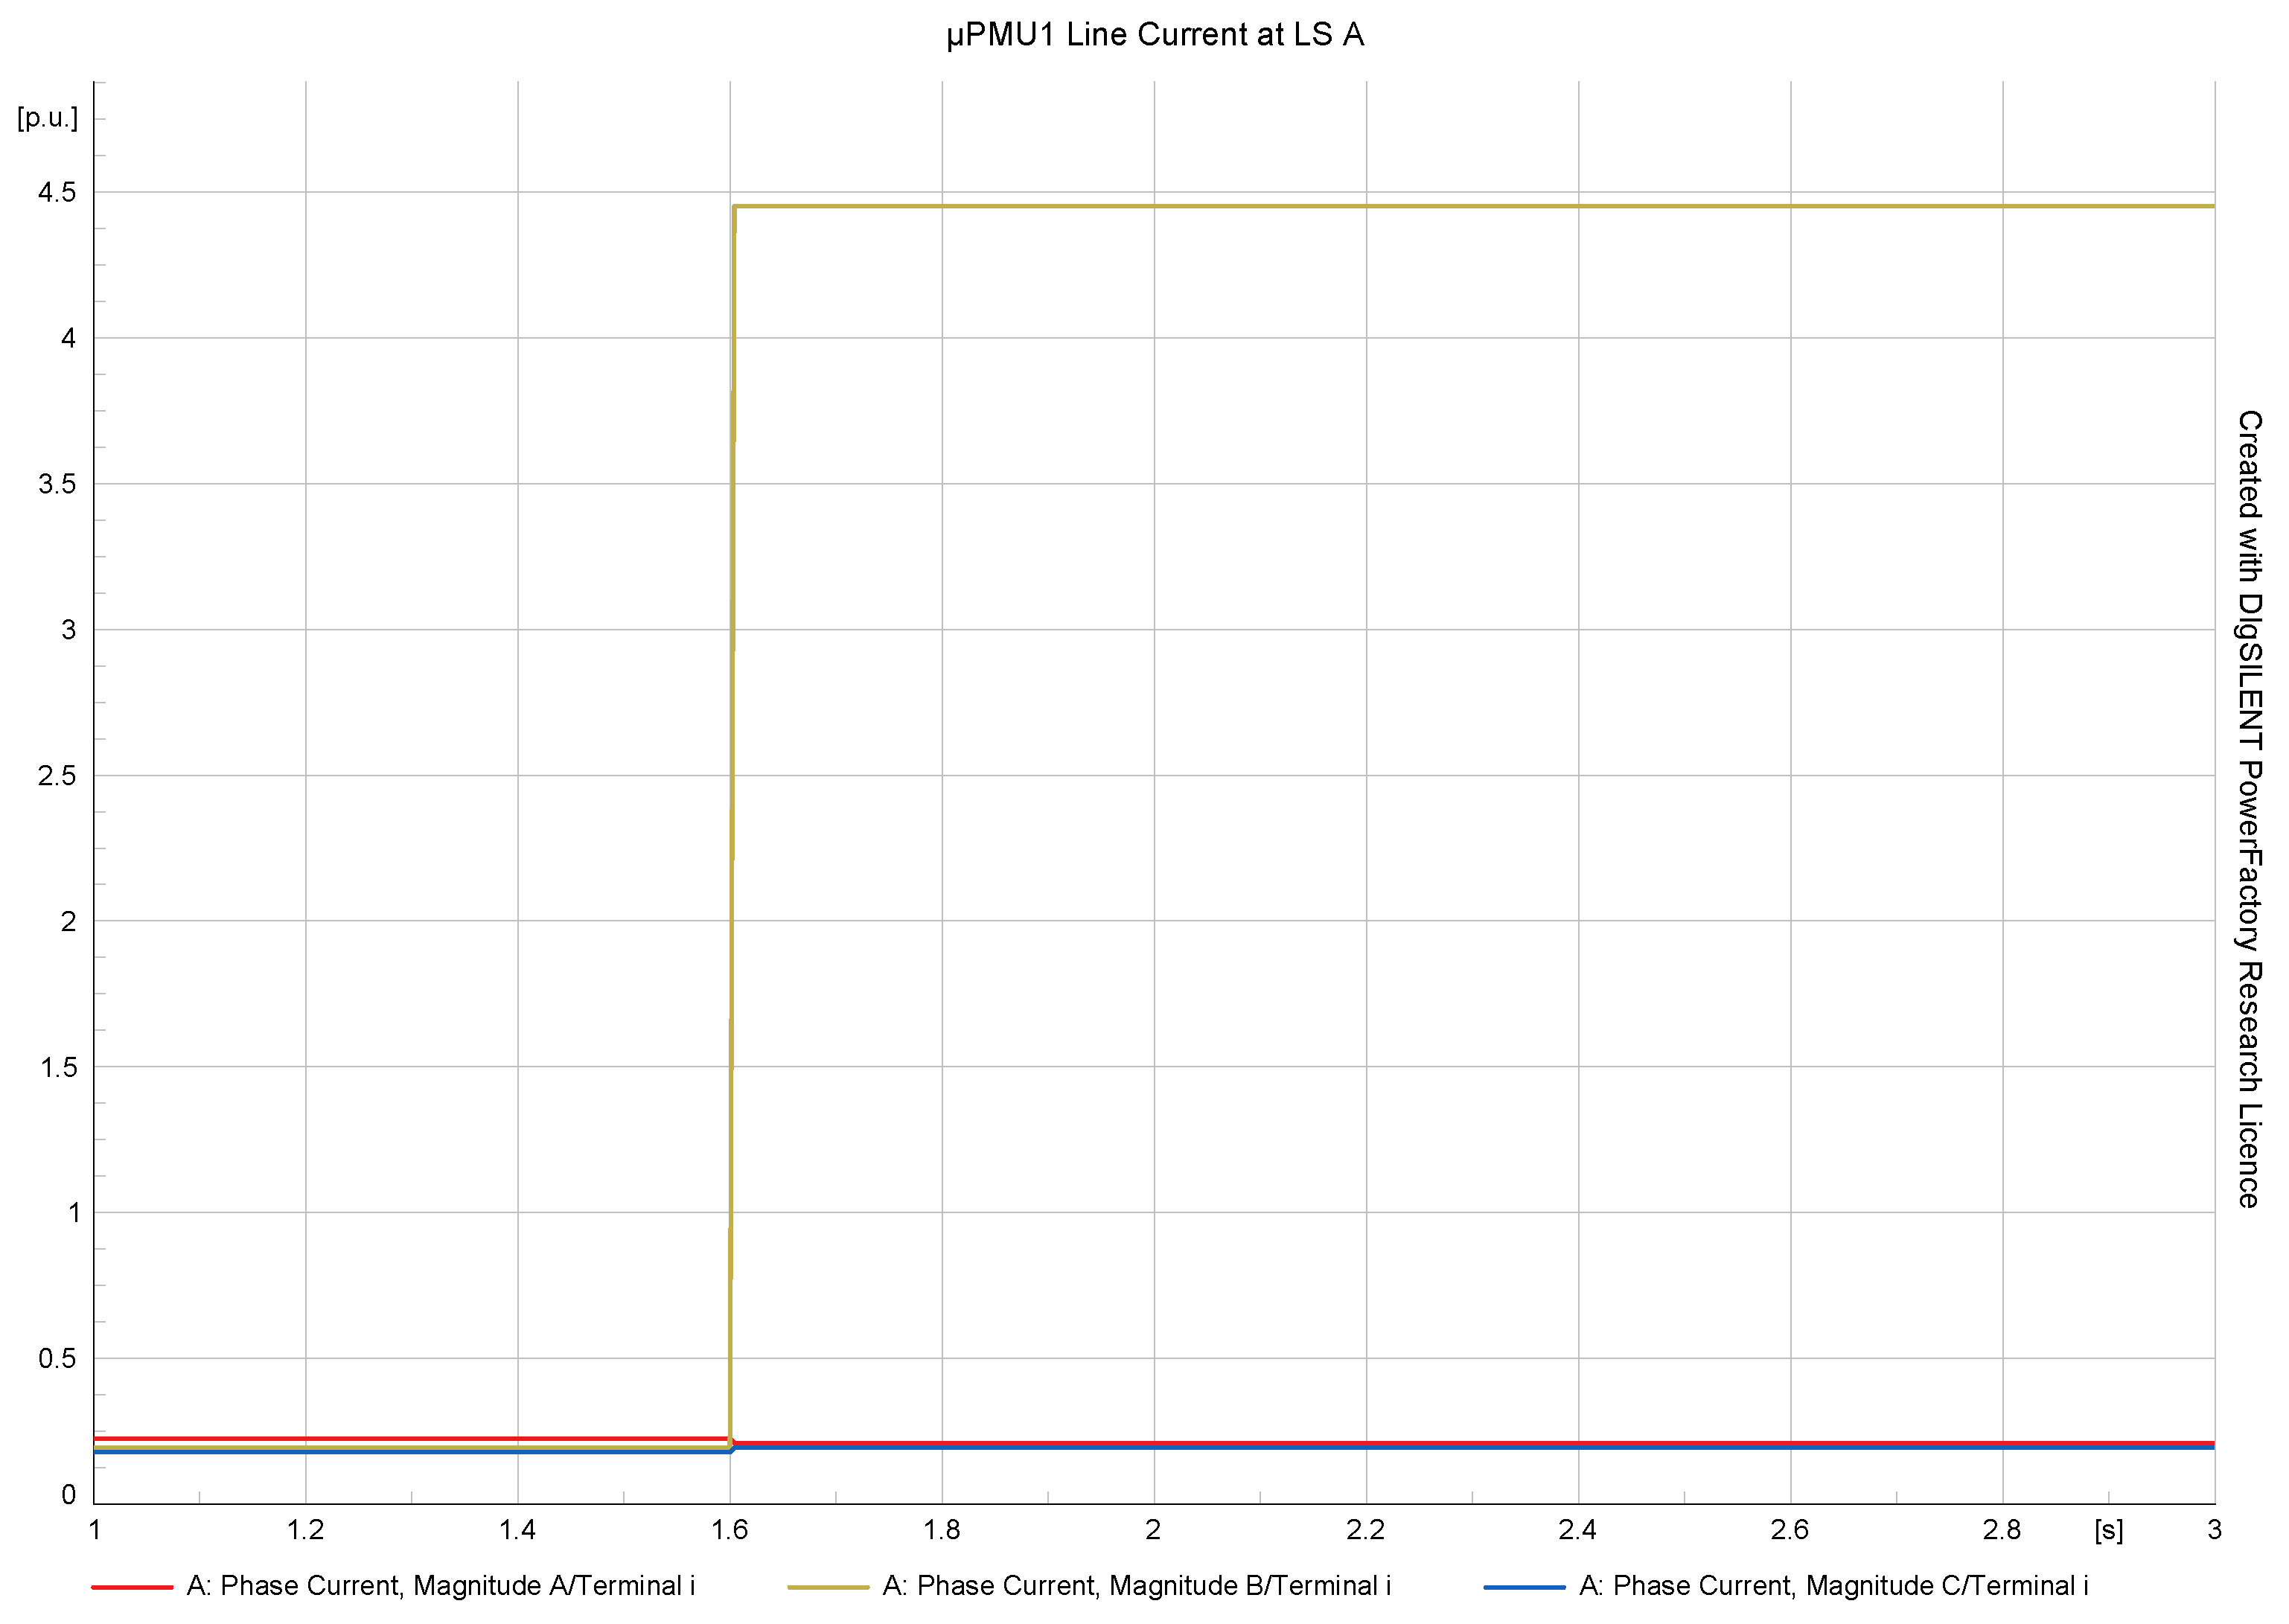
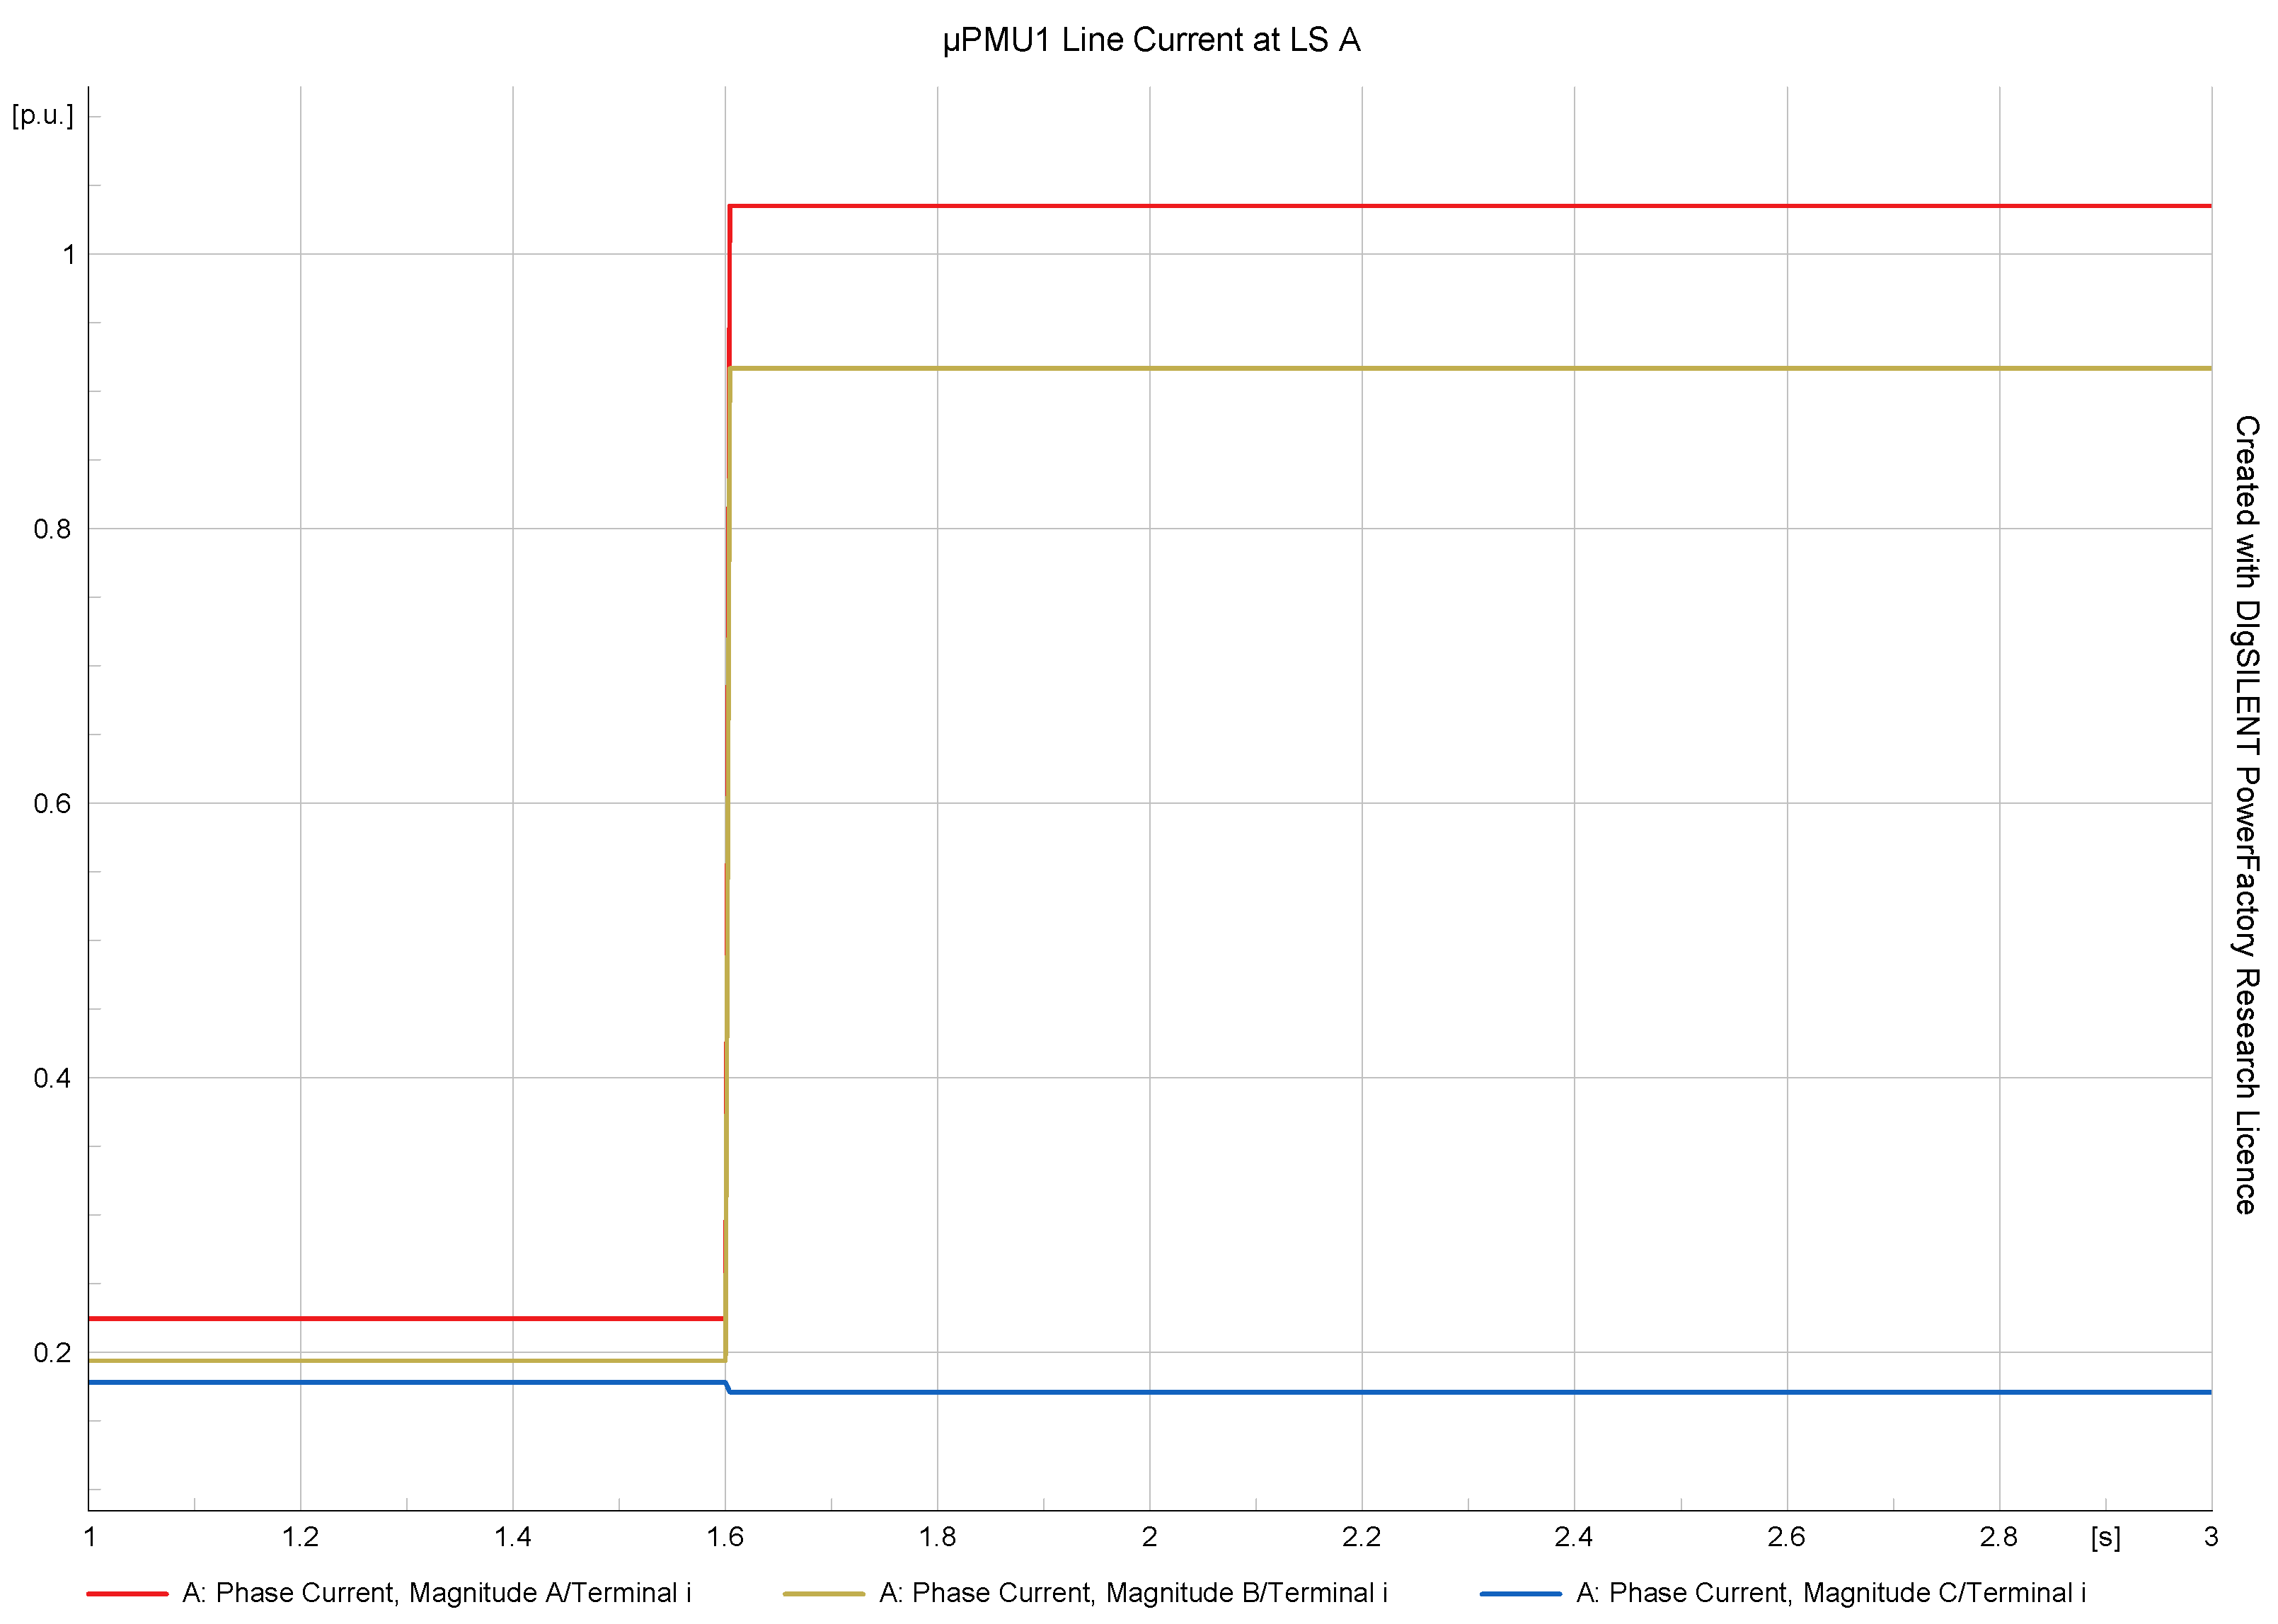
All the fault events tested crossed the thresholds of at least one phase to satisfy the fault detection rules. The thresholds are set after fine-tuning the line currents during the fault with respect to the maximum impedance location of the network or the farthest point from the main feeder. Even though the unbalanced loads are showing frequent variations in the line currents per phase, all the tested fault events met at least one phase threshold to detect the fault. The A-B-C fault detection simulation results from the master
PMU and nearest
PMU are shown in
Figure 12 and
Figure 13, respectively. The results cross the threshold values and conditions of the FD algorithm. Hence, the fault is detected.
The fault detection algorithm test results are shown in
Table 2. Out of the tested events, almost all the fault events with different types of faults worked perfectly using the developed algorithm. The first stream fault tested at line section ‘A’ was also detected by the algorithm.
5.2. Fault Classification Test
The developed algorithm was tested with different classes of faults such as LG, LL, LLG, and LLL. Their simulation results are plotted below figures and their summary is listed in
Table 3. All the classes of faults at different locations and fault resistances (0
, 0.001
, 0.01
, 1
, 5
, 10
, 15
, and 20
). A total of 24,480 simulations with all the possible fault classes were carried out to test the classification algorithm with real-time time fault scenarios.
5.2.1. LG Fault
Figure 14 shows the results of L-G fault classification through the measurement observed by the master
PMU. The result of L-G fault classification through the measurement observed by the
PMU near the fault is shown in
Figure 15.
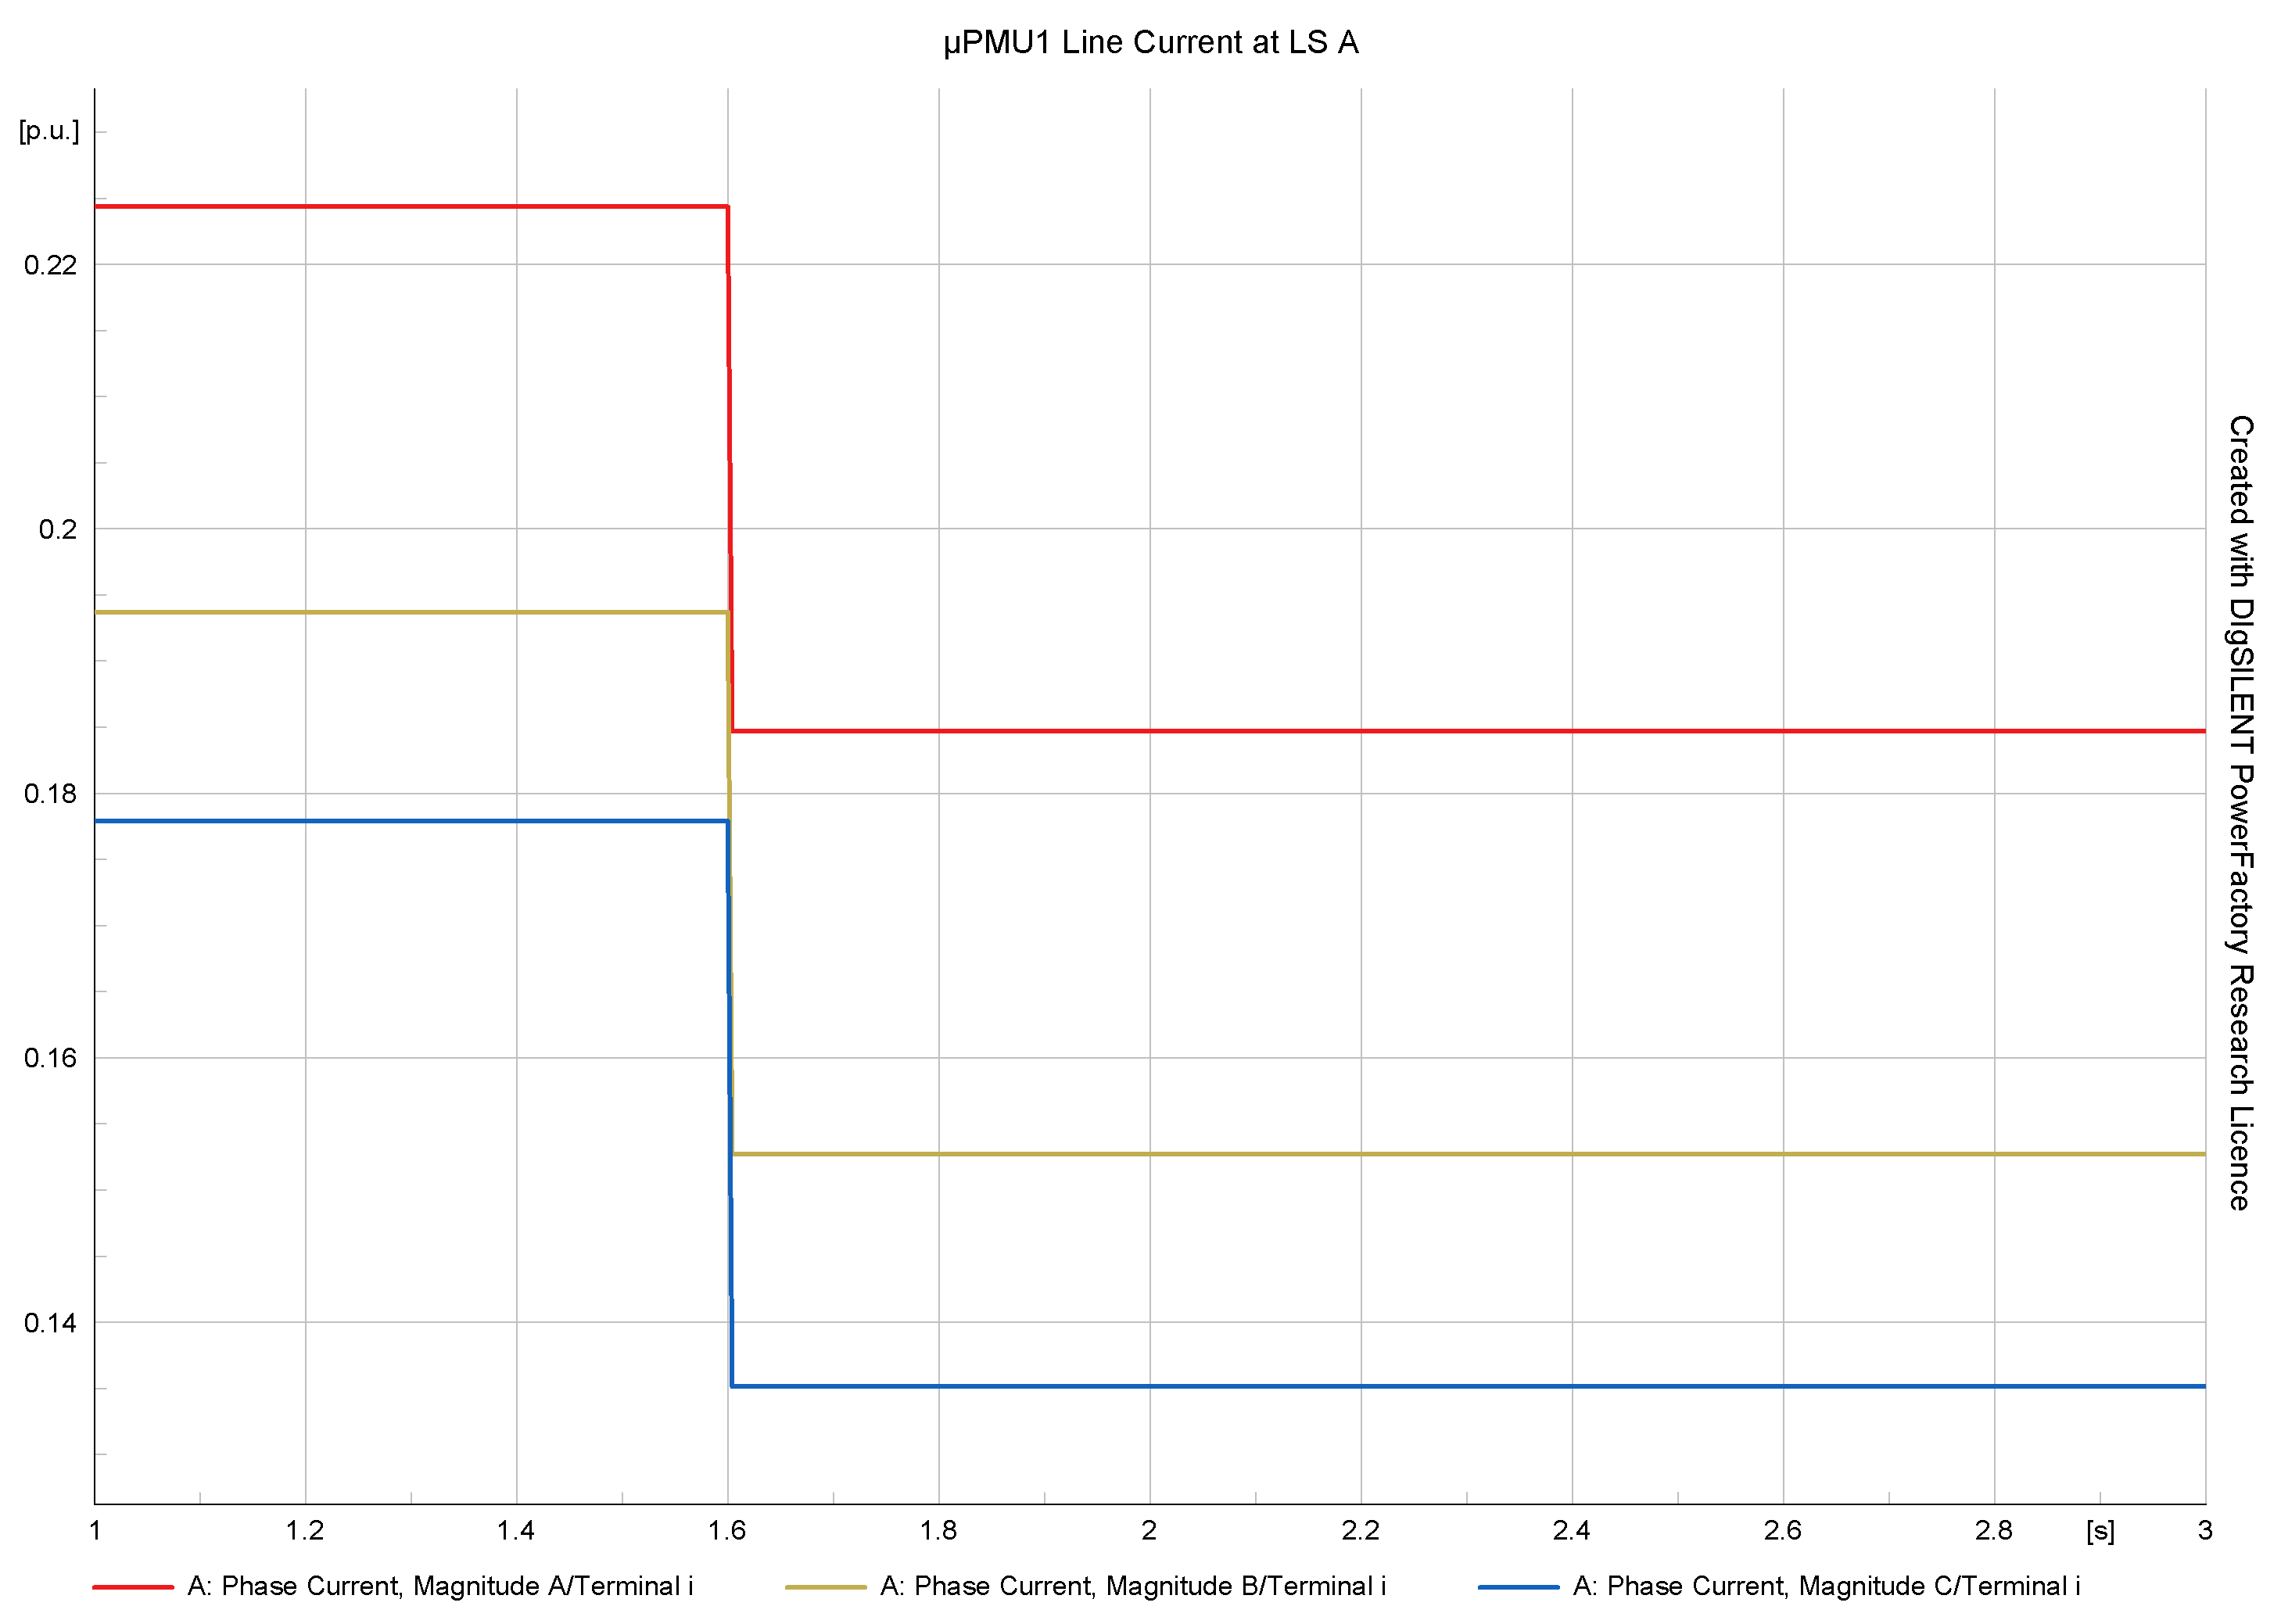
5.2.2. LL Fault
The line currents variations observed by the master
PMU and the nearest
PMU during the LL fault are shown in
Figure 16 and
Figure 17, respectively.
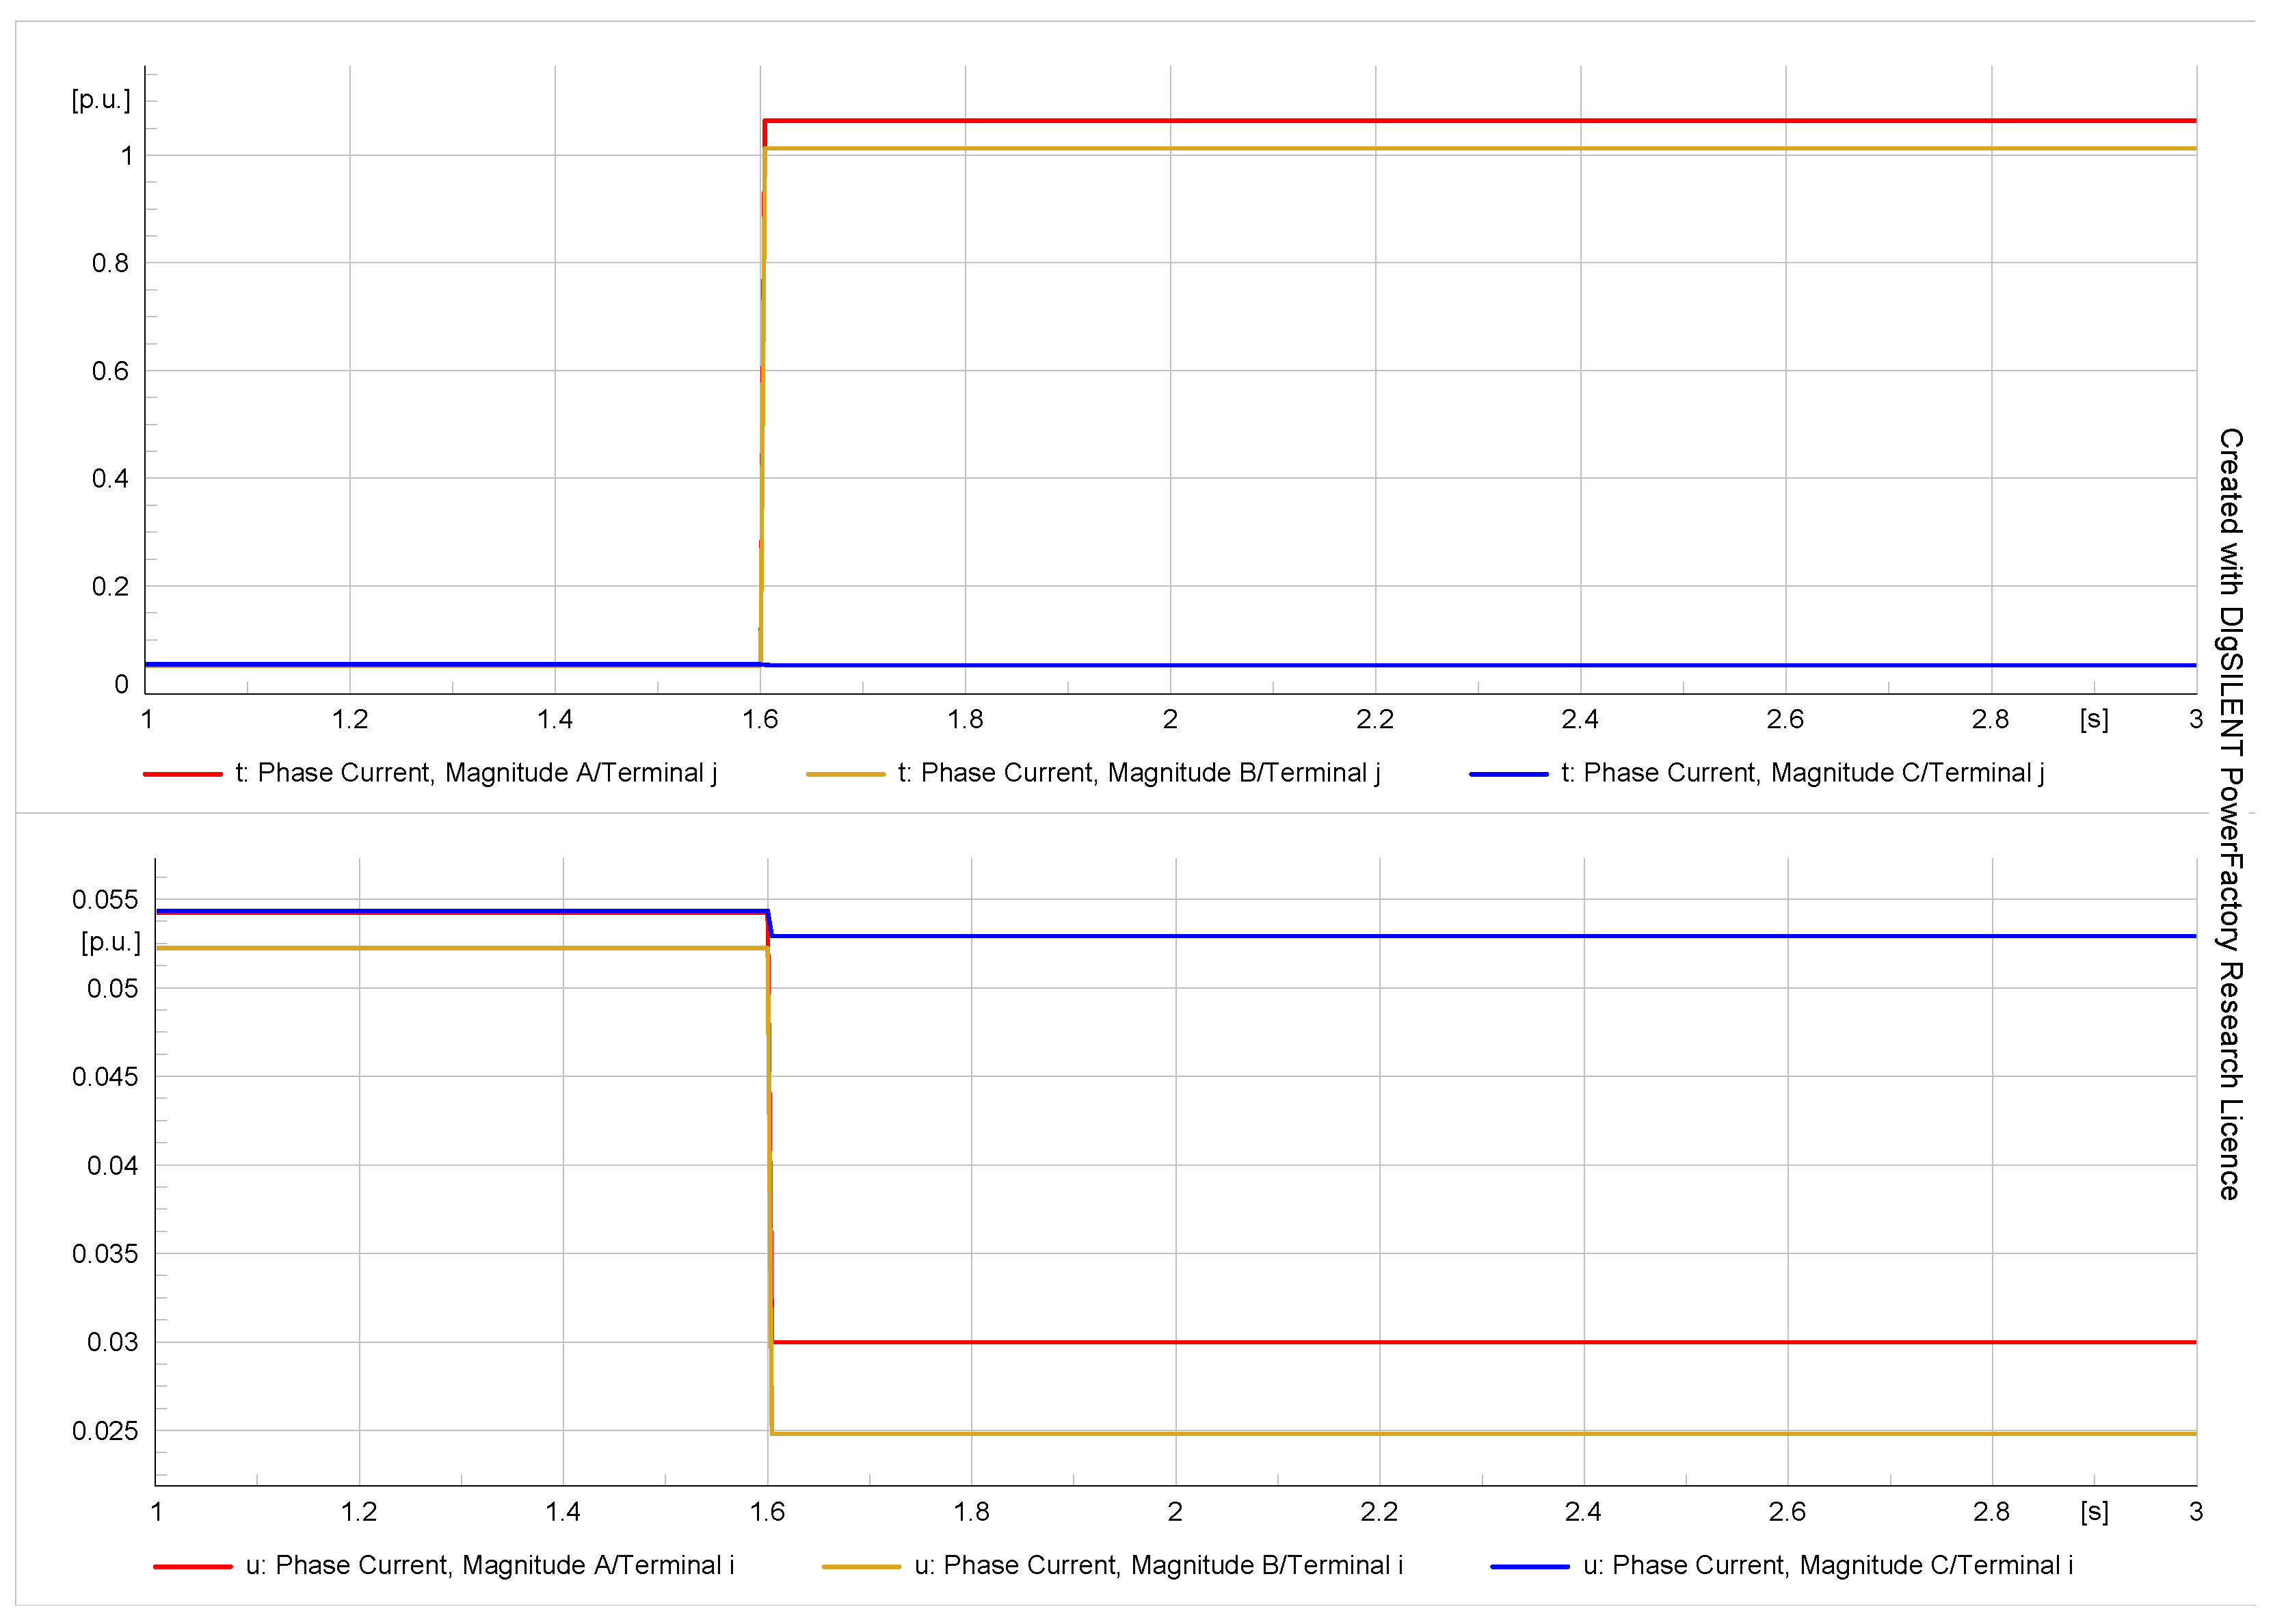
5.2.3. LLG Fault
The algorithm classified the LLG fault from the line current observations of master
PMU and the
PMU nearest to the fault location is shown in
Figure 18 and
Figure 19.
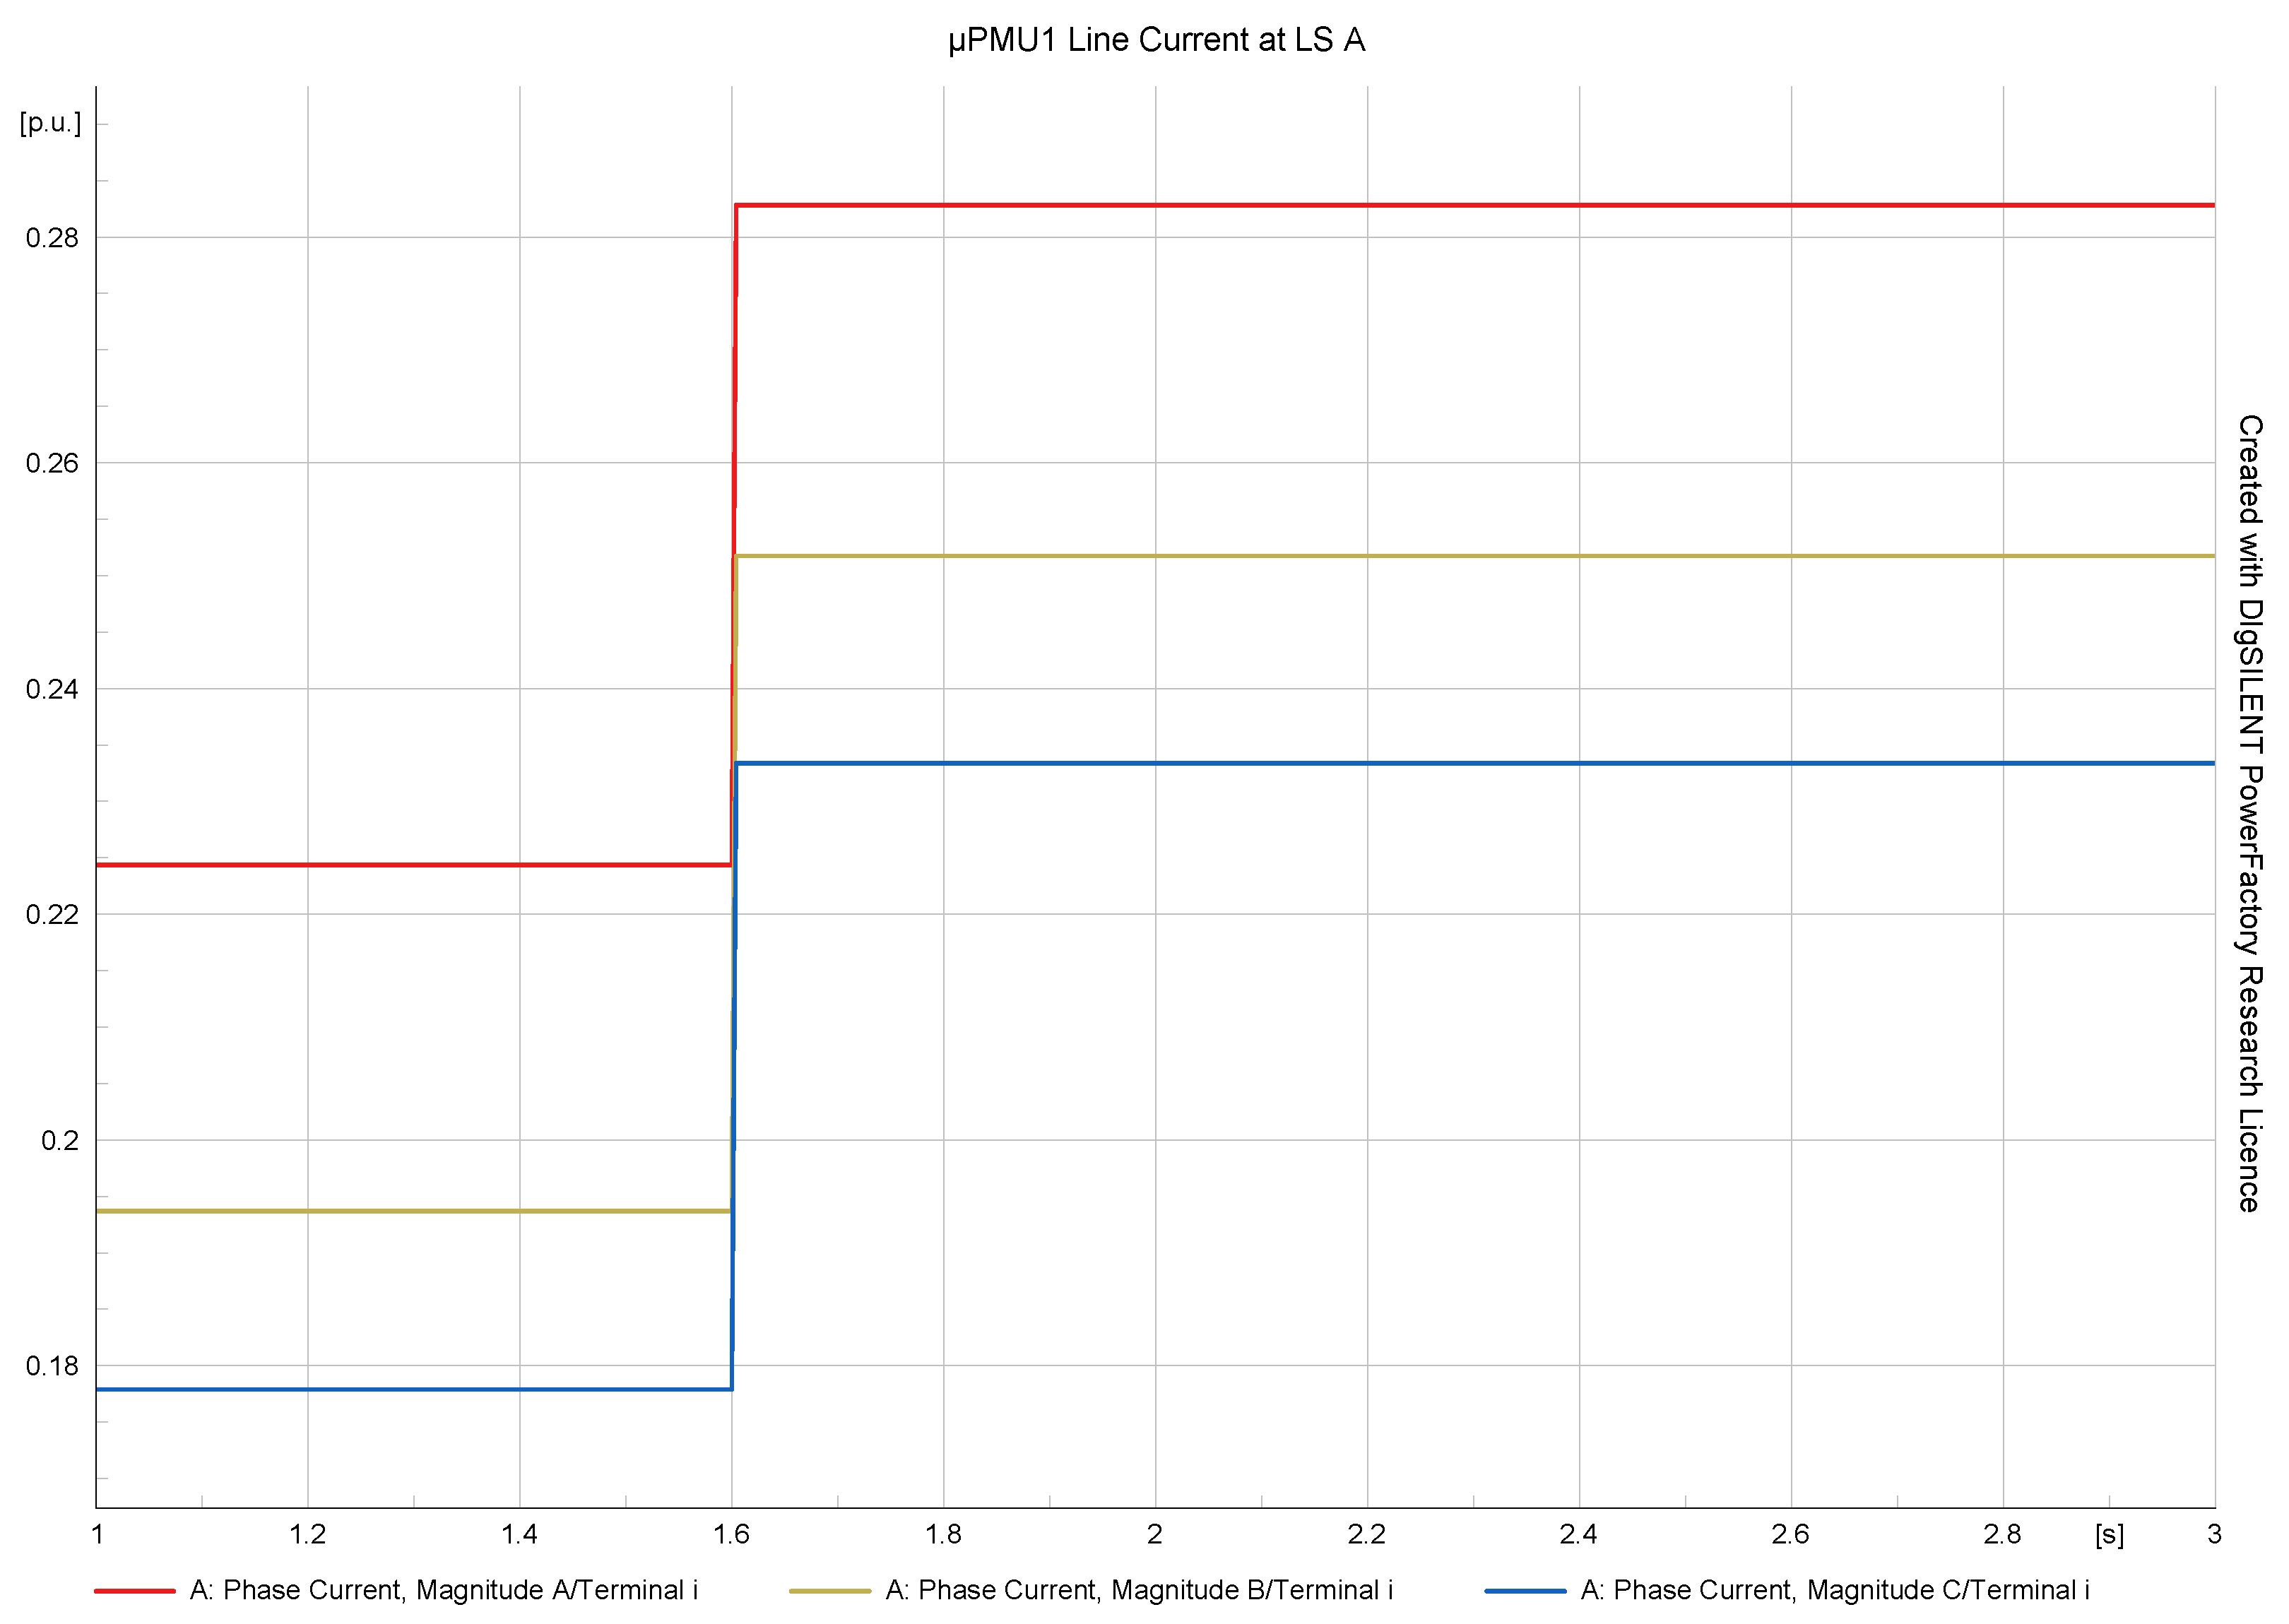
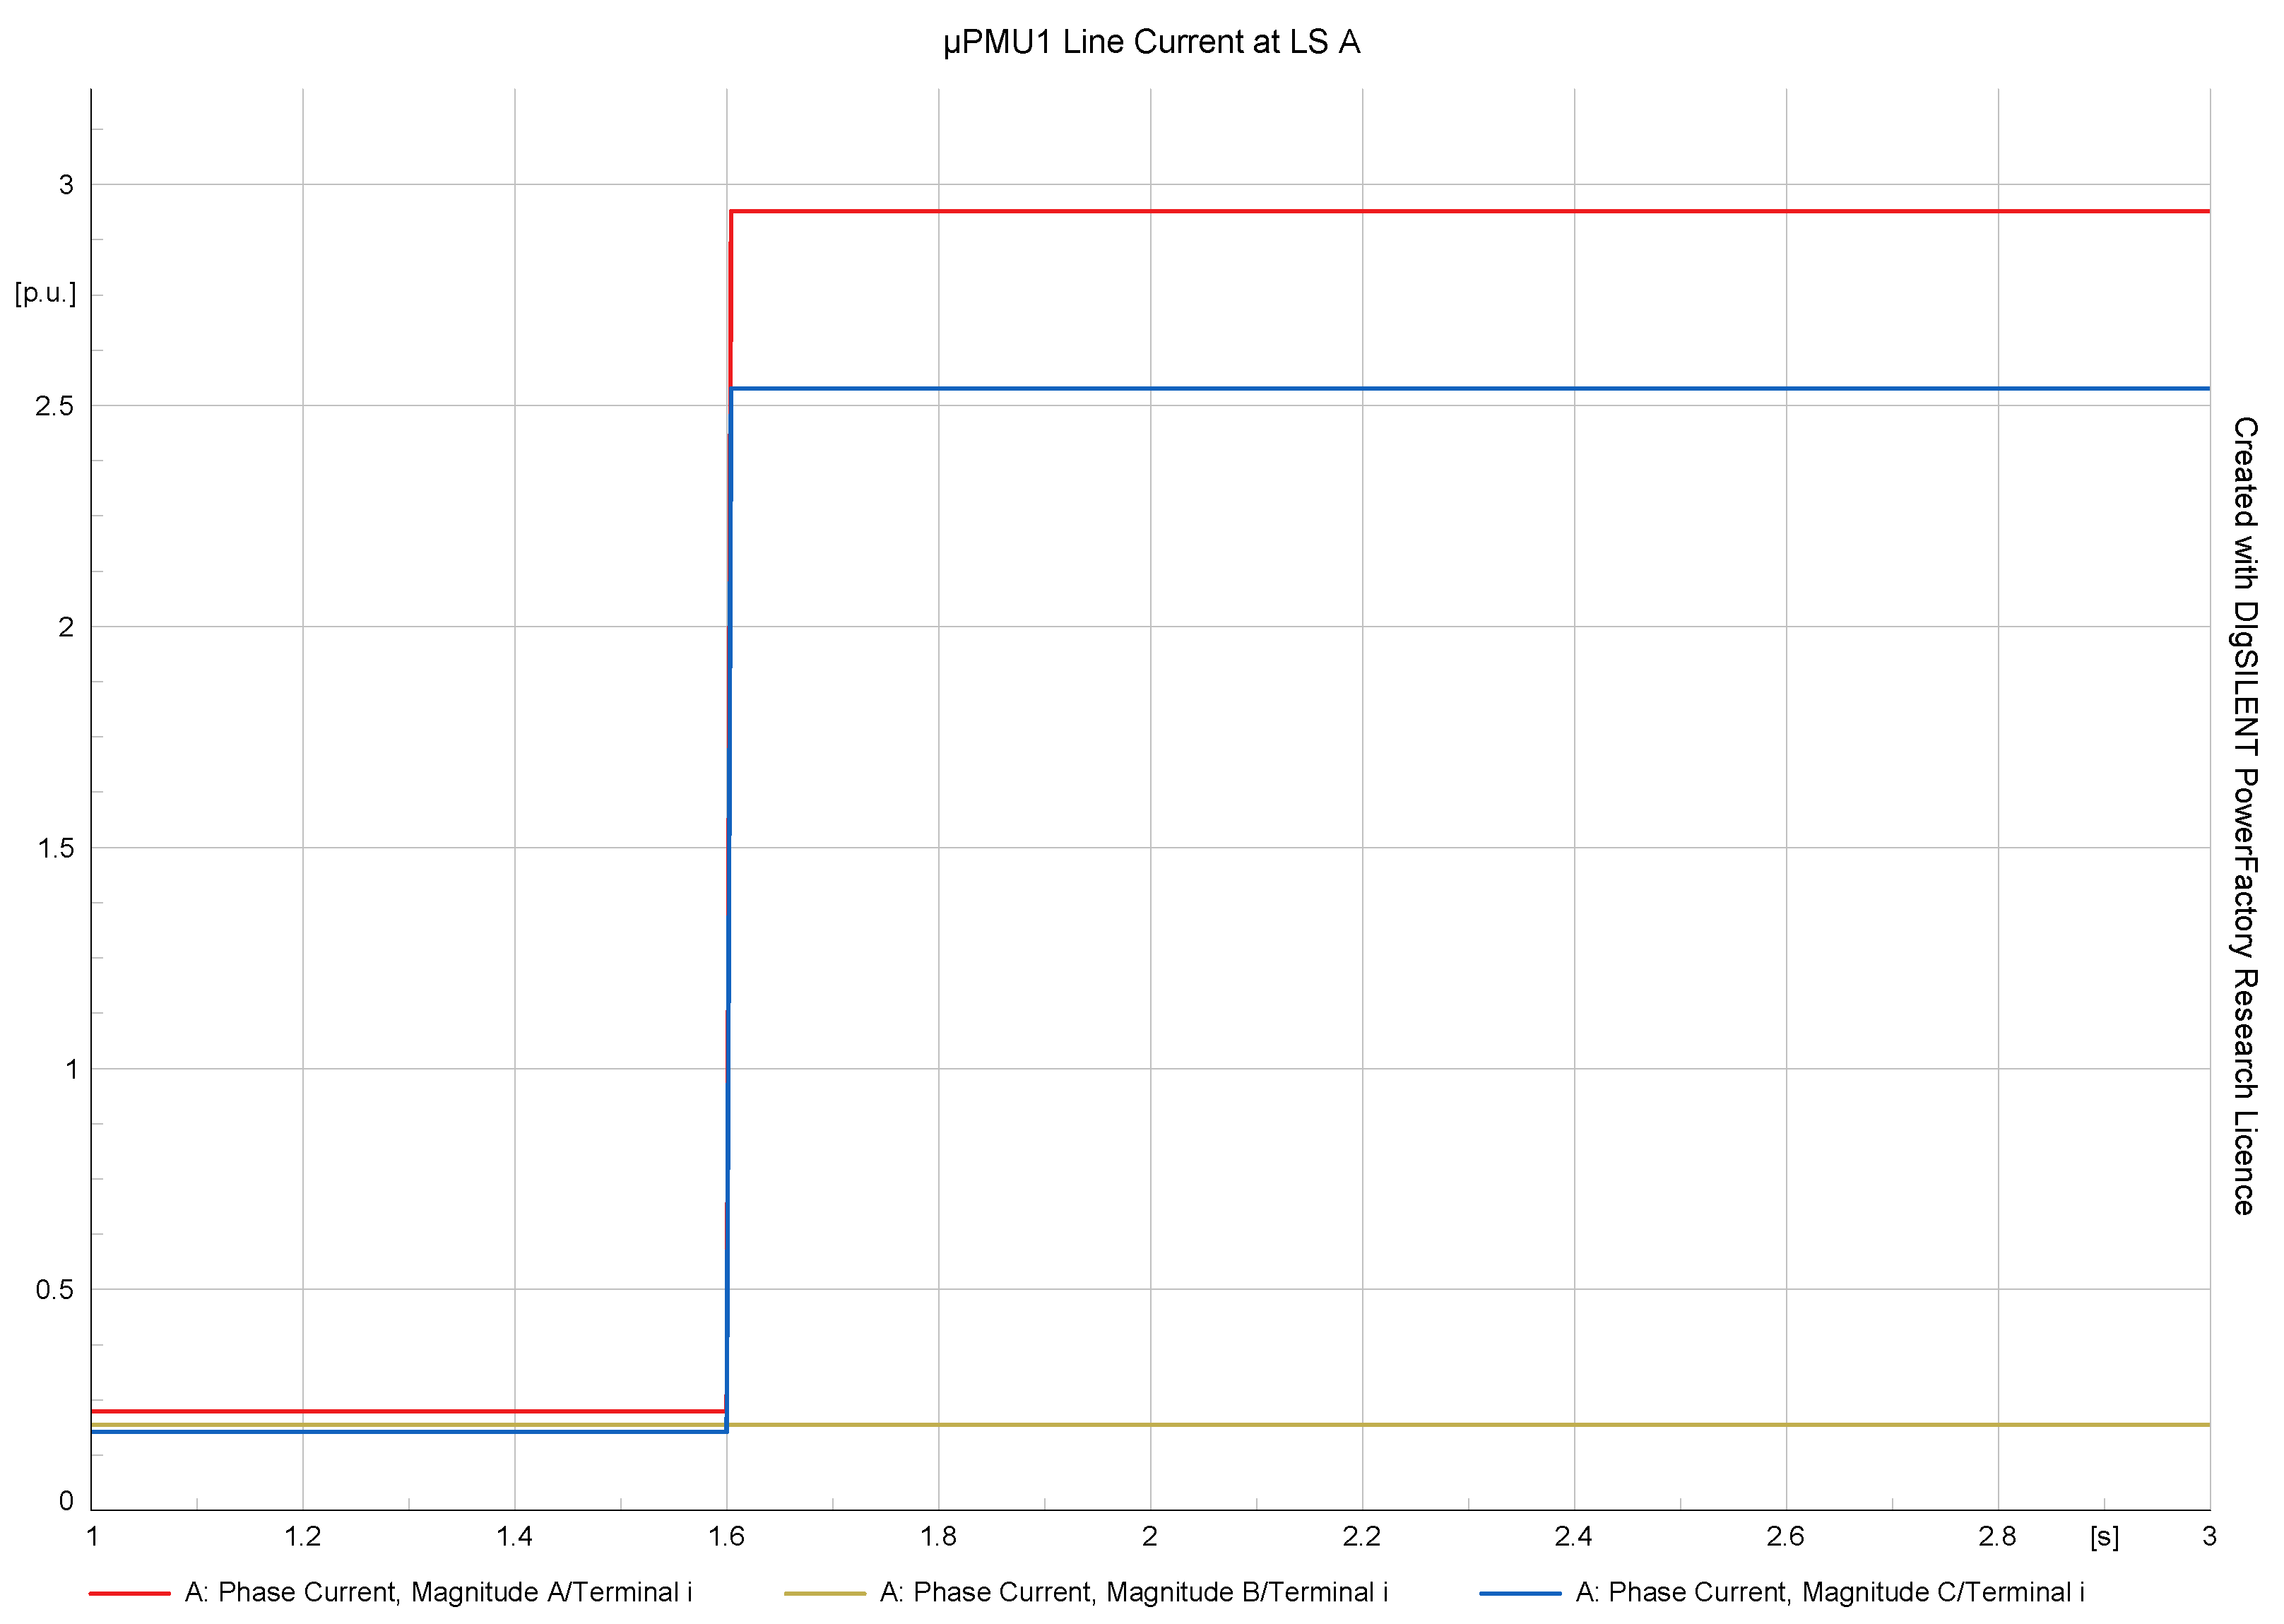
5.2.4. LLL Fault
Figure 20 shows the results of the classified LLL fault observed by the master
PMU and the line current values of different phases are different from each other compared to the line currents observed by the nearest
PMU as shown in
Figure 21.
The fault classification algorithm test was conducted for different scenarios and the results are shown the
Table 3.
5.3. Fault Section Identification Test
The developed algorithm was tested with different sections of the DN. During the test, all the modes of the network connections were investigated such as nodes with one US and one DS, one US and two DS and the fault section including the US, node and DS. A couple of FSI results are listed in
Table 4.
5.4. I-FDCSI Algorithm Test
The fault detection, classification and section identification algorithms were combined with steps and tested. The results show its applicability to further develop it as a supporting stand-alone application for DCC operators. A couple of results are recorded and shown in
Table 5.
Evaluation of the Method
The performance of the method is evaluated using two main measures such as percentage error and percentage accuracy.
Table 6 shows the statistical evaluation results of the 24,480 simulations carried out on the developed algorithms.
The results of the evaluation show highly accurate and reliable results to the simulations carried out up to a fault resistance of 20 ohms. This investigation and method evaluation paved the way for an important observation of high-impedance fault detection and multiple faults detection and localization that has been relevant to real-time DN. The developed algorithms are to be further fine-tuned with additional simulations on changing the fault resistance to a high value from 20 ohms and simulating the multiple-section faults. This sheds light on the future scope of this research work.
Comparative analysis of the rules-based I-FDCSI method with the existing methods in terms of key features and benefits:
Accuracy: the rules-based I-FDCSI method leverages expert knowledge and incorporates a set of rules to detect, classify, and identify faults. This knowledge-based approach enables accurate fault detection and classification, as it leverages the experience and expertise of power system experts. The rules are designed to capture diverse fault scenarios, making the method robust and reliable in different network conditions.
Real-time capability: the rules-based I-FDCSI method is designed to operate in real-time, making it suitable for time-critical applications such as service restoration. The utilization of micro-Phasor Measurement Units (PMUs) provides high-resolution synchronized data, enabling fast fault detection and reducing service restoration time.
Computational requirements: compared to data-driven methods, the rules-based I-FDCSI method has lower computational requirements. The rules are based on simple decision-making processes, requiring minimal computational resources. This makes the method computationally efficient and suitable for implementation in embedded systems or devices with limited processing capabilities.
Adaptability: the rules-based I-FDCSI method is adaptable and flexible to different distribution network configurations and fault scenarios. By incorporating expert knowledge into the rules, the method can handle various fault types, fault locations, and network topologies. This adaptability enhances the method’s applicability to diverse distribution network environments.
The comparative analysis highlights the advantages of the rules-based I-FDCSI method over other methods in the literature. Its accuracy, real-time capability, lower computational requirements, and adaptability make it a promising approach for fault detection and classification, and section identification in DN. The integration of expert knowledge and the utilization of PMUs contribute to the method’s effectiveness in achieving faster service restorations and enhancing the reliability of distribution networks. To ensure the compatibility of this method with high-impedance faults and multiple fault events, the algorithms need to be fine-tuned with further investigations.
6. Conclusions
In conclusion, this paper presents an I-FDCSI method for real distribution networks using PMUs. The proposed method is based on rules and uses current measurements from PMUs for fault detection, classification, and section identification. The performance of the I-FDCSI method was tested and validated on a real distribution network with different types of faults, and the results demonstrated that the proposed method achieved high accuracy and efficiency in fault detection, classification, and section identification. The I-FDCSI method can provide valuable information to distribution system operators for quick and accurate fault identification and restoration, which can improve the reliability and resiliency of distribution networks. The proposed method can also facilitate the integration of distributed energy resources and enable the development of smart distribution systems. Overall, the I-FDCSI method presented in this paper is a promising solution for fault management in real distribution networks using PMUs. Further research can be conducted to optimize the rule-based algorithm and to integrate other parameters such as voltage measurements for fault diagnosis in distribution systems. The authors would like to extend future studies in investigating high impedance faults detection and multiple fault location studies using PMUs.
Author Contributions
Conceptualization, A.H.M.I.; methodology, A.H.M.I.; software, A.H.M.I.; validation, A.H.M.I.; formal analysis, M.S.; investigation, A.H.M.I.; resources, V.S.R.; data curation, A.H.M.I.; writing—original draft preparation, A.H.M.I.; writing—review and editing, M.S. and V.S.R.; visualization, V.S.R.; supervision, M.S. and V.S.R.; project administration, M.S.; funding acquisition, V.S.R. All authors have read and agreed to the published version of the manuscript.
Funding
This research was funded by the Transnational Access program of the EU H2020 ERIGrid 2.0 project with grant agreement number 870620.
Data Availability Statement
Not applicable.
Acknowledgments
The researchers would like to acknowledge the Intelligent Electrical Power Grids Group at Technische Universiteit Delft in the Netherlands, as well as their technical and administrative staff, for their assistance and direction in remotely accessing the lab facilities.
Conflicts of Interest
The authors declare that there are no potential conflicts of interest in the research, authorship, or publication of this article.
Abbreviations
The following abbreviations are used in this manuscript
| I-FDCSI | integrated fault detection, classification and section identification |
| PMU | Micro-Phasor Measurement Unit |
| DER | Distributed Energy Resources |
| DN | Distribution Network |
| SCADA | Supervisory Control and Data Acquisition |
| DCC | Distribution Control Centre |
| DG | Distributed Generation |
| LVDB | Low Voltage Distribution Board |
| DT | Distribution Transformer |
| OHL | Overhead Lines |
| L-G | Line to Ground |
| L-L | Line to Line |
| L-L-G | Line to Line to Ground |
| L-L-L | Line to Line to Line |
| A | Phase A |
| B | Phase B |
| C | Phase C |
| G | Ground |
| CB | Circuit Breaker |
| US | Upstream |
| DS | Downstream |
| MinSCCR | Minimum Short Circuit Current Ratio |
| SAIFI | System Average Interruption Frequency Index |
| SAIDI | System Average Interruption Duration Index |
| FD | Fault detection |
| FC | Fault Classification |
| FSI | Fault Section Identification |
References
- Ghosh, S.S.; Gholami, A.; Kezunovic, M. Smart grid investments, control and management: Challenges, opportunities and research directions. IEEE Trans. Smart Grid 2014, 5, 724–739. [Google Scholar]
- Huang, H.; Liu, H.; Xia, Y.; Jiang, C. Power system fault location based on distributed micro-phasor measurement unit data. IEEE Trans. Power Syst. 2017, 32, 633–644. [Google Scholar]
- Li, T.; Li, L.; Li, J.; Zhang, Y.; Li, Y. Power system fault detection and classification based on unsupervised deep learning. IEEE Trans. Smart Grid 2017, 10, 839–850. [Google Scholar]
- Jayasinghe, K.; Jayaweera, S.K.; Ledwich, G. A Review of Fault Detection Techniques in Power Systems with Distributed Generation. In Proceedings of the 2021 IEEE PES GTD Grand International Conference and Exposition Asia (GTD Asia), Bangkok, Thailand, 19–23 March 2019; pp. 1–7. [Google Scholar]
- Amin, M.R.; Hossain, M.J.; Islam, S.S. Fault detection and classification in distribution network using μPMU and machine learning algorithms. IETGener. Transm. Distrib. 2021, 15, 1735–1744. [Google Scholar]
- Sabri, N.N.; Rahim, N.A.; Abdul-Rahman, N.A. Fault Classification and Section Identification in Distribution Network Using μPMU. In Proceedings of the 2020 IEEE International Conference on Power, Energy and Communication Systems (PECS), Jaipur, India, 16–19 December 2020; pp. 1–6. [Google Scholar]
- Medattil Ibrahim, A.H.; Sharma, M.; Subramaniam Rajkumar, V. Realistic μPMU Data Generation for Different Real-Time Events in an Unbalanced Distribution Network. Energies 2023, 16, 3842. [Google Scholar] [CrossRef]
- Zhang, J.; Guo, Y.; Zhu, Y.; Liu, X.; Zhang, J. A flexible scheduling method for distribution networks with automated switches based on real-time demand response. Energies 2020, 13, 3149. [Google Scholar]
- Wang, J.; Huang, Y.; Liu, M.; Wu, J. Distribution network reconfiguration using automated switches with multi-objective optimal planning. IETGener. Transm. Distrib. 2020, 14, 195–204. [Google Scholar]
- Khorramdel, H.; Moghaddam, M.P. Optimal placement of automated switches in distribution networks considering the uncertainties. Sustain. Energy Grids Netw. 2020, 24, 100395. [Google Scholar]
- Liu, Y.; Hossain, M.; Mahmud, M.A. State estimation of distribution networks under limited observability. Electr. Power Syst. Res. 2020, 189, 106755. [Google Scholar]
- Hassan, M.E.; Fahmy, H.M.; Abdel-Rahman, T.G. Probabilistic assessment of distribution network reconfiguration considering fault management and reliability improvement. Electr. Power Syst. Res. 2020, 182, 11–21. [Google Scholar]
- Fault Location, Isolation, and Service Restoration Technologies Reduce Outage Impact and Duration, Smart Grid Investment Grant Program. Available online: https://www.smartgrid.gov/files/B5_draft_report-12-18-2014.pdf (accessed on 25 January 2023).
- Smart Grid Investments Improve Grid Reliability, Resilience, and Storm Responses; The United States Department of Energy: Washington, DC, USA, 2014.
- Shahsavari, A. Autopsy on active distribution networks: A data-driven fault analysis using micro-μPMU data. In Proceedings of the 2017 North American Power Symposium (NAPS), Morgantown, WV, USA, 17–19 September 2017; pp. 1–7. [Google Scholar]
- Sujith, M.S.; Vijayakumar, K.; Lakshmi, P.R. Artificial intelligence-based fault detection and classification techniques for power systems: A review. J. Ambient. Intell. Humaniz. Comput. 2020, 11, 3699–3722. [Google Scholar]
- Mendes, J.A.G.A.; Pinto, L.P.S.; Masoum, M.A.S.; Pereira, L.M.F. Smart Grid Distribution Networks Fault Detection and Diagnosis: A Comprehensive Review. IEEE Trans. Ind. Electron. 2021, 68, 6125–6140. [Google Scholar]
- Sambariya, R.; Kumar, A.; Patel, R.N. Fault Detection and Classification in Smart Distribution Networks: A Review of Existing Techniques. IEEE Trans. Smart Grid 2020, 11, 1565–1574. [Google Scholar]
- Kumar, A.; Lal, A.K.; Garg, R. Fault detection in distribution networks: A review. Int. J. Electr. Power Energy Syst. 2020, 118, 105878. [Google Scholar]
- Qian, H.; Liu, Y.; Lu, C. A micro-PMU-based fault detection and classification method for distribution networks with distributed generation. Appl. Sci. 2018, 8, 937. [Google Scholar] [CrossRef]
- Shi, Y.; Yang, J.; Zhou, Z.; Xiang, X.; Wang, Y. A micro-PMU-based real-time fault location method for distribution networks. IEEE Trans. Power Deliv. 2018, 33, 251–259. [Google Scholar]
- Yang, Y.; Liu, J.; Jiang, H.; He, Z.; Wang, J.; Cao, Y. A novel fault section identification approach based on deep convolutional neural network and micro-PMU data. IEEE Trans. Smart Grid 2018, 9, 5937–5948. [Google Scholar]
- Zhao, C.; Wang, Y.; Liu, Y.; Chen, C. Fault section identification in distribution networks based on micro-PMU data and graph convolutional network. IEEE Trans. Power Syst. 2020, 36, 692–704. [Google Scholar]
- Cai, Y.; Huang, J.; Wang, J.; Zhang, X.; Chen, C. A novel fault section identification approach in distribution networks based on micro-PMU data and dynamic bayesian networks. IEEE Trans. Power Deliv. 2021, 36, 1701–1711. [Google Scholar]
- Li, J.; Li, S.; Li, Z.; Wang, H.; Li, F. A comprehensive fault section identification method for distribution networks based on micro-PMU data and deep learning. IEEE Trans. Power Syst. 2021, 36, 4242–4252. [Google Scholar]
- Guo, Y.; Liu, D.; Liu, Y.; Wang, Y. Fault section identification for distribution systems based on micro-PMU data and localizing features. IEEE Trans. Smart Grid 2019, 11, 1495–1504. [Google Scholar]
- Khan, M.R.; Hussain, S.; Khan, N. A Micro-PMU Based Approach for Distribution System Fault Section Identification. IEEE Access 2019, 7, 109502–109509. [Google Scholar]
- Wei, J.; Gu, Y.; Mao, Z. A Fault Section Identification Method for Distribution Systems Using Micro-PMUs and Pattern Recognition. IEEE Trans. Power Deliv. 2018, 33, 2335–2345. [Google Scholar]
- Rivas, A.E.L.; Abrao, T. Faults in smart grid systems: Monitoring, detection and classification. Electr. Power Syst. Res. 2020, 189, 106602. [Google Scholar] [CrossRef]
- Li, C.; Zhao, C.; Li, W. Distribution network fault section identification based on the voltage-time domain information from PMU. IEEE Trans. Power Deliv. 2019, 34, 72–82. [Google Scholar]
- Xue, Y.; Zeng, Y.; Gu, Y. A Micro-PMU Based Fault Section Identification Algorithm for Distribution Networks with DGs. IEEE Trans. Power Deliv. 2017, 32, 1899–1907. [Google Scholar]
- Li, Y.; Xu, T.; Xu, Y.; Zhang, B.; Tian, Y. Fault Isolation for Distribution Networks with Micro-PMU Data Based on Information Entropy. IEEE Trans. Power Deliv. 2019, 34, 1293–1303. [Google Scholar]
- Zhang, Y.; Liu, X.; Zhu, J. Analysis and evaluation of distribution system reliability indices based on Monte Carlo simulation. In Proceedings of the 2017 IEEE International Conference on Computational Electromagnetics (ICCEM), Kumamoto, Japan, 8–10 March 2017; pp. 254–257. [Google Scholar]
- Haleem, A.M.I.; Sharma, M.; Sajan, K.S.; Babu, K.N.D. A Comparative Review of Fault Location/Identification Methods in Distribution Networks. In Proceedings of the 2018 1st IEEE International Conference on Advanced Research in Engineering Sciences (ARES), Dubai, United Arab Emirates, 15 June 2018; pp. 1–6. [Google Scholar]
- Thapa, R.; Hu, G.; Wang, H.; Li, Y.; Giri, J. A Review of Synchrophasor Technology and Its Applications in Power Distribution Systems. Energies 2019, 12, 1728. [Google Scholar]
- Synchrophasor Monitoring for Distribution Systems: Technical Foundations and Applications. Available online: https://www.naspi.org/sites/default/files/reference_documents/naspi_distt_synchrophasor_monitoring_distribution_20180109.pdf (accessed on 24 January 2023).
- Phadke, A.; Thorp, J.; Chandrasekaran, S.; Schwartz, L. Synchronized Phasor Measurements for Power Systems. IEEE Comput. Appl. Power 1995, 8, 14–20. [Google Scholar] [CrossRef]
- Lasseter, R.H.; Widergren, S.C.; DeSteese, J.G. Real-Time Distribution Network Analysis and Control. IEEE Trans. Power Deliv. 2011, 26, 2286–2295. [Google Scholar]
- Khodaei, A. Phasor measurement unit placement in distribution systems. IEEE Trans. Power Syst. 2015, 30, 143–151. [Google Scholar]
- Pourmousavi, S.A. A Comprehensive Review of PMU Placement Methods in Smart Grids. IEEE Access 2019, 7, 37264–37283. [Google Scholar]
- Charles, A.A. Investigation of Methodologies for Fault Detection and Diagnosis in Electric Power System Protection (Thesis). Available online: https://etd.cput.ac.za/handle/20.500.11838/1273 (accessed on 1 December 2022).
Figure 1.
Block diagram of fault management process.
Figure 1.
Block diagram of fault management process.
Figure 2.
Block Diagram of I-FDCSI Algorithm.
Figure 2.
Block Diagram of I-FDCSI Algorithm.
Figure 3.
IEEE 34 node feeder modeled in DigSILENT PowerFactory with DGs and PMU locations.
Figure 3.
IEEE 34 node feeder modeled in DigSILENT PowerFactory with DGs and PMU locations.
Figure 4.
Fault detection flow chart.
Figure 4.
Fault detection flow chart.
Figure 5.
Fault classification flow chart.
Figure 5.
Fault classification flow chart.
Figure 6.
Fault section identification flow chart.
Figure 6.
Fault section identification flow chart.
Figure 7.
I-FDCSI Flow Chart.
Figure 7.
I-FDCSI Flow Chart.
Figure 8.
Load switching event results from master PMU.
Figure 8.
Load switching event results from master PMU.
Figure 9.
DG switching event simulation results from master PMU.
Figure 9.
DG switching event simulation results from master PMU.
Figure 10.
Tap change event simulation results from the master PMU.
Figure 10.
Tap change event simulation results from the master PMU.
Figure 11.
Capacitor switching simulation results from master PMU.
Figure 11.
Capacitor switching simulation results from master PMU.
Figure 12.
A-B-C fault detection simulation results from the master PMU.
Figure 12.
A-B-C fault detection simulation results from the master PMU.
Figure 13.
A-B-C fault detection simulation results from the nearest PMU.
Figure 13.
A-B-C fault detection simulation results from the nearest PMU.
Figure 14.
LG fault classification simulation results from the master PMU.
Figure 14.
LG fault classification simulation results from the master PMU.
Figure 15.
LG fault classification simulation results from the nearest PMU.
Figure 15.
LG fault classification simulation results from the nearest PMU.
Figure 16.
LL fault classification simulation results from the master PMU.
Figure 16.
LL fault classification simulation results from the master PMU.
Figure 17.
LL fault classification simulation results from the nearest PMU.
Figure 17.
LL fault classification simulation results from the nearest PMU.
Figure 18.
LLG fault classification simulation results from the master PMU.
Figure 18.
LLG fault classification simulation results from the master PMU.
Figure 19.
LLG fault classification simulation results from the nearest PMU.
Figure 19.
LLG fault classification simulation results from the nearest PMU.
Figure 20.
LLL fault classification simulation results from the master PMU.
Figure 20.
LLL fault classification simulation results from the master PMU.
Figure 21.
LLL fault classification simulation results from the nearest PMU.
Figure 21.
LLL fault classification simulation results from the nearest PMU.
Table 1.
Maximum short circuit currents that can be monitored by each PMU.
Table 1.
Maximum short circuit currents that can be monitored by each PMU.
| PMU No. | Ia_Max_SCC (p.u) | Ib_Max_SCC (p.u) | Ic_Max_SCC (p.u) |
|---|
| PMU 1 (Master PMU) | 89.63 | 93.76 | 86.48 |
| PMU 2 | 6.7 | 7.07 | 6.5 |
| PMU 3 | 2.81 | 3.09 | 2.84 |
| PMU 4 | 2.5 | 2.74 | 2.53 |
| PMU 5 | 2.04 | 2.22 | 2.05 |
| PMU 6 | 1.39 | 1.52 | 1.41 |
| PMU 7 | 1.35 | 1.47 | 1.36 |
| PMU 8 | 1.31 | 1.43 | 1.32 |
| PMU 9 | 0 | 1.02 | 0 |
| PMU 10 | 3.69 | 3.84 | 3.69 |
| PMU 11 | 1.31 | 1.42 | 1.32 |
| PMU 12 | 1.53 | NA | NA |
Table 2.
Fault detection algorithm test results.
Table 2.
Fault detection algorithm test results.
| Events Tested | Test Location | Event Description | Fault Detected as |
|---|
| Load switching | 844 | 3 Phase SL844 OFF | Not Detected |
| DG Switching | 850 | 20% DG850 ON | Not Detected |
| Tap Change event | VR1 | Tap lowered at VR1 | Not Detected |
| Capacitor switching | CAP848 | Cap 848 OFF | Not Detected |
| Fault | A | A-G at 0.001% (LS), 1 ohm | First stream fault |
| Fault | b | B-G at 50% (LS), 1 ohm | Fault |
| Fault | 846 | A-B at node 846, 20 ohm | Fault |
| Fault | 834 | C-G at node 834, 15 ohm | Fault |
| Fault | P | B-C at 75% (LS), 10 ohm | Fault |
| Fault | E | C-A at 99.99% (LS), 0.1 ohm | Fault |
| Fault | m | A-B-C at 99.99% (LS), 20 ohm | Fault |
| Fault | u | A-B-G at 30% (LS), 5 ohm | Fault |
| Fault | K | B-C-G at 75% (LS), 15 ohm | Fault |
| Fault | D | C-A-G at 50% (LS), 5 ohm | Fault |
Table 3.
Fault classification algorithm test results.
Table 3.
Fault classification algorithm test results.
| Events Tested | Test Location | Event Description | Fault Classified as |
|---|
| Fault | A | A-G at 0.001% (LS), 1 ohm | L-G Fault (A-G) |
| Fault | b | B-G at 50% (LS), 1 ohm | L-G Fault (B-G) |
| Fault | 846 | A-B at node 846, 20 ohm | L-L Fault (A-B) |
| Fault | 834 | C-G at node 834, 15 ohm | L-G Fault (C-G) |
| Fault | P | B-C at 75% (LS), 10 ohm | L-L Fault (B-C) |
| Fault | E | C-A at 99.99% (LS), 0.1 ohm | L-L Fault (C-A) |
| Fault | m | A-B-C at 99.99% (LS), 20 ohm | L-L -L Fault (A-B-C) |
| Fault | u | A-B-G at 30% (LS), 5 ohm | L-L -G Fault (A-B-G) |
| Fault | K | B-C-G at 75% (LS), 15 ohm | L-L -G Fault (B-C-G) |
| Fault | D | C-A-G at 50% (LS), 5 ohm | L-L -G Fault (C-A-G) |
Table 4.
Fault section identification algorithm test results.
Table 4.
Fault section identification algorithm test results.
| Events Tested | Test Location | Event Description | Fault Section Identified as |
|---|
| Fault | A | A-G at 0.001% (LS), 1 ohm | Line section ‘A’ |
| Fault | b | B-G at 50%(LS), 1 ohm | Line section ‘b-c’ |
| Fault | 846 | A-B at node 846, 20 ohm | node t-846-u |
| Fault | 834 | C-G at node 834, 15 ohm | Node U-834-V |
| Fault | P | B-C at 75% (LS), 10 ohm | Line section ‘P’ |
| Fault | E | C-A at 99.99% (LS), 5 ohm | Line section ‘E-F’ |
| Fault | m | A-B-C at 99.99% (LS), 20 ohm | Line section ‘m’ |
| Fault | u | A-B-G at 30% (LS), 5 ohm | Line section ‘u-v’ |
| Fault | K | B-C-G at 75% (LS), 15 ohm | Line section ‘K-L’ |
| Fault | D | C-A-G at 50% (LS), 5 ohm | Line section ‘C-D’ |
Table 5.
I-FDCSI algorithm test results.
Table 5.
I-FDCSI algorithm test results.
| Events Tested | Test Location | Event Description | Fault Classified as | Fault Section Identified as |
|---|
| Fault | A | A-G at 0.001% (LS), 1 ohm | L-G Fault (A-G) | Line section ‘A’ |
| Fault | b | B-G at 50% (LS), 1 ohm | L-G Fault (B-G) | Line section ‘b-c’ |
| Fault | 846 | A-B at node 846, 20 ohm | L-L Fault (A-B) | node t-846-u |
| Fault | 834 | C-G at node 834, 15 ohm | L-G Fault (C-G) | Node U-834-V |
| Fault | P | B-C at 75% (LS), 10 ohm | L-L Fault (B-C) | Line section ‘P’ |
| Fault | E | C-A at 99.99% (LS), 0.1 ohm | L-L Fault (C-A) | Line section ‘E-F’ |
| Fault | m | A-B-C at 99.99% (LS), 20 ohm | L-L -L Fault (A-B-C) | Line section ‘m’ |
| Fault | u | A-B-G at 30% (LS), 5 ohm | L-L -G Fault (A-B-G) | Line section ‘u-v’ |
| Fault | K | B-C-G at 75% (LS), 15 ohm | L-L -G Fault (B-C-G) | Line section ‘K-L’ |
| Fault | D | C-A-G at 50% (LS), 5 ohm | L-L -G Fault (C-A-G) | Line section ‘C-D’ |
Table 6.
Evalaution of results.
Table 6.
Evalaution of results.
| Algorithm | Error (%) | Accuracy (%) | Remarks |
|---|
| Fault Detection | 1.000816993 | 99.91836735 | upto 20 ohms fault resistance |
| Fault Classification | 1.045751634 | 95.625 | upto 20 ohms fault resistance |
| Fault Section Identification | 1.053921569 | 94.88372093 | upto 20 ohms fault resistance |
| IFDCSI | 1.033496732 | 96.80902943 | upto 20 ohms fault resistance |
| Disclaimer/Publisher’s Note: The statements, opinions and data contained in all publications are solely those of the individual author(s) and contributor(s) and not of MDPI and/or the editor(s). MDPI and/or the editor(s) disclaim responsibility for any injury to people or property resulting from any ideas, methods, instructions or products referred to in the content. |
© 2023 by the authors. Licensee MDPI, Basel, Switzerland. This article is an open access article distributed under the terms and conditions of the Creative Commons Attribution (CC BY) license (https://creativecommons.org/licenses/by/4.0/).


