Article

A Reinforcement Learning Approach for Ensemble Machine Learning Models in Peak Electricity Forecasting

by
Warut Pannakkong
,
Vu Thanh Vinh
,
Nguyen Ngoc Minh Tuyen
and
Jirachai Buddhakulsomsiri
*
School of Manufacturing Systems and Mechanical Engineering, Sirindhorn International Institute of Technology, Pathum Thani 12120, Thailand
*
Author to whom correspondence should be addressed.
Submission received: 6 June 2023 / Revised: 21 June 2023 / Accepted: 27 June 2023 / Published: 1 July 2023
(This article belongs to the Special Issue The Energy Consumption and Load Forecasting Challenges)

Abstract

:
Electricity peak load forecasting plays an important role in electricity generation capacity planning to ensure reliable power supplies. To achieve high forecast accuracy, multiple machine learning models have been implemented to forecast the monthly peak load in Thailand over the past few years, yielding promising results. One approach to further improve forecast accuracy is to effectively select the most accurate forecast value for each period from among the forecast values generated by these models. This article presents a novel reinforcement learning approach using the double deep Q-network (Double DQN), which acts as a model selector from a pool of available models. The monthly electricity peak load data of Thailand from 2004 to 2017 are used to demonstrate the effectiveness of the proposed method. A hyperparameter tuning methodology using a fractional factorial design is implemented to significantly reduce the number of required experimental runs. The results indicate that the proposed selection model using Double DQN outperforms all tested individual machine learning models in terms of mean square error.

1. Introduction

In the past two decades, global electricity consumption has witnessed a gradual increase almost every year according to the International Energy Agency (IEA) [1]. Electricity is crucial to both economic aspects and social service activities [2]. Notably, in Thailand, the annual electricity consumption grew by 190% from 100,000 GWh in 2002 to 190,000 GWh in 2021. Consequently, the nationwide peak electricity consumption also doubled, starting from around 16,000 MW in 2002 and reaching 30,000 MW in 2021 [3]. This surge in peak electricity consumption has a significant impact on the tactical and daily demand planning of electricity generators, necessitating the preparation of additional capacity and buffers to prevent shortages. Improving peak consumption forecasting to minimize redundancy can be an efficient approach to reducing electricity surcharges and resource expense investment [4,5].
Accurate demand prediction is a vital step in electricity planning, ensuring the careful allocation of additional capacity in response to increasing demand or reducing production when consumption declines. A well-planned approach not only assists in reducing generation costs but also prevents power interruptions. Consequently, utility companies have developed and implemented various methods to enhance their electricity forecasting accuracy. However, the fluctuating nature of electricity usage patterns significantly affects forecast accuracy, consequently impacting capacity planning and energy resource utilization.
Accurate forecasting is crucial not only in electricity planning but also in various other domains [6], including stock price prediction [7], equipment battery forecasting [8,9], and energy forecasting [10], among others. To improve forecast accuracy, several studies have employed various forecasting techniques, ranging from traditional methods to more sophisticated machine learning models and their ensembles [11,12,13,14]. However, each model has its own advantages and drawbacks, with some better suited for capturing sharp spikes in demand patterns but less accurate in handling common fluctuation patterns, and vice versa. Relying on a single forecast model or using multiple models independently is not as effective as incorporating the results from multiple models [15].
In tackling real-world problems, it is not uncommon to encounter complexities that surpass the capabilities of a single model to adequately describe and handle forecasting tasks. Recognizing this challenge, researchers and practitioners have turned to ensemble approaches as a viable alternative to conventional modeling techniques. By combining different sources of uncertainties, ensemble models offer a promising solution. The resulting ensemble models exhibit higher levels of accuracy and enhanced reliability [16,17].
In recent years, the application of reinforcement learning (RL) techniques in forecasting and optimization has attracted attention. Wang et al. [18] introduced deep reinforcement learning for driverless autonomous vehicle tasks and energy planning. Aljohani et al. [19,20] proposed a real-time, data-driven framework using the Double Deep Q-learning Network (Double DQN) and SARSA algorithm for optimizing electric vehicle (EV) routing to minimize energy consumption. Perera et al. [21] presented a data-driven approach using reinforcement learning to optimize the design of distributed energy systems. Ren et al. [22] proposed a new forecasting-based optimization method that incorporates a dueling-based deep reinforcement learning approach to enhance the accuracy of temperature prediction in household energy management systems. Dabbaghjamanesh et al. [23] utilized the Q-learning model to predict the charging station loads. The results show that the proposed method outperforms conventional artificial intelligence techniques and accurately forecasts the plug-in hybrid EV loads under different charging scenarios.
Reinforcement learning algorithms have proven their effectiveness in learning optimal decision-making policies through trial-and-error interactions and continuously receiving feedback from the environment to maximize long-term rewards. This makes reinforcement learning particularly well-suited for learning intricate patterns in dynamic environments. In the context of ensemble models, reinforcement learning excels in analyzing and integrating different forecasting models, capturing the strengths of each model to enhance overall outcomes. The utilization of reinforcement learning in combining existing forecasting approaches has been demonstrated in prior studies, such as Liu et al. [24] and Chien et al. [25], where deep reinforcement learning models were employed to achieve improved forecasting performance. By integrating reinforcement learning into the ensemble framework, the capabilities of existing forecasting methods can be harnessed, resulting in enhanced decision-making and more accurate predictions.
This article proposes an approach that utilizes reinforcement learning with the Double DQN to automatically select the most suitable model from a model pool, delivering the most accurate forecast each month. The proposed approach takes advantage of the strengths of individual models and offers superior forecasting performance. To illustrate the capability of the proposed approach, the real electricity peak load from the Electricity Generating Authority of Thailand (EGAT) is used as a case study. EGAT, a state-owned enterprise, is responsible for generating, procuring, selling, and transmitting electric energy to two electric energy distributors across the country. One of EGAT’s strategic decisions involves capacity planning for electricity generation, wherein accurate forecasting of the peak unit load on a monthly basis is essential for preparing the necessary capacity and resources to meet the growing demand for electric energy. Each month, EGAT determines the number of power plants to operate and the amount of electricity to reserve from privately owned power plants based on forecasts of the peak electricity demand for the following month.
In the field of electricity peak forecasting, there is a research gap regarding the exploration of advanced machine learning techniques, particularly the application of reinforcement learning, such as the Double DQN, in forecasting. While various machine learning methods have been employed in this field, the utilization of reinforcement learning techniques remains limited. Additionally, there is a scarcity of research that investigates the use of reinforcement learning as an ensemble model in electricity peak forecasting, as observed in the studies conducted by Pugliese [6]. Although reinforcement learning has been proposed since the 1950s, its practical application in electricity forecasting has not been widely explored until recently. However, with the development of deep learning, reinforcement learning has gained more attention. Given these circumstances, there is a significant opportunity to develop a novel ensemble model based on reinforcement learning to enhance the accuracy and effectiveness of electricity peak forecasting, bridging the gap between traditional forecasting methods and cutting-edge machine learning techniques.
Contributions of this article to the field of forecast selection and hyperparameter tuning can be summarized as follows. (1) A novel method based on the Double DQN is proposed for forecasting model selection. Since there is no single model that consistently performs the best in every period, this article addresses this challenge by proposing a model selection method for choosing the most accurate forecast value in each period from among multiple models. (2) This paper demonstrates the use of a fractional factorial design technique for hyperparameter tuning for the Double DQN. Traditional exhaustive methods, such as grid search, can be computationally expensive since they require a large number of runs to explore the hyperparameter space [25]. The implemented fractional factorial design can significantly reduce the number of required runs for hyperparameter tuning. This reduction in computational burden effectively reduces the overall computational time, making hyperparameter tuning more efficient and practical. (3) The effectiveness of the Double DQN is shown using real data of electricity peak load for the entire country of Thailand. The results illustrate that the utilization of the Double DQN outperforms individual models in terms of forecast accuracy. This empirical evidence underscores the practical significance and applicability of the Double DQN in the field of electricity peak load forecasting. In summary, this paper contributes novel methods for forecasting model selection and hyperparameter tuning utilizing the capabilities of the Double DQN. The proposed techniques offer improved forecast accuracy, reduced computation time, and present empirical evidence of their effectiveness using real-world data.
The remaining sections of this paper are organized as follows. Section 2 provides background information and discusses related works. Section 3 describes the machine learning methods utilized in this study and presents the framework of the proposed approach. Section 4 presents the computational experiments conducted for the case study and presents their results. Section 5 concludes the paper by summarizing the findings, discussing any limitations encountered, and proposing possible directions for future research.

2. Background and Related Works

2.1. Electricity Demand Forecating

Electricity consumption in Thailand has increased continually during the past few decades due to the growth of industrialization [26]. Therefore, electricity demand forecasting plays an essential role in utility companies as it provides insights into the requirements for operating power systems and facility planning. Utility companies have used a variety of approaches to estimate future electricity demand, such as linear and non-linear regression analysis, computer intelligence, and statistical analysis [27,28,29,30,31]. Statistical forecasting techniques usually involve building forecasting models that contain several economic and demographic factors [32]. Owing to the development of big data and computing advancements, traditional methods are gradually falling behind the favorable intelligence-based models in terms of prediction accuracy [33]. Recently, researchers have tried to harness the strength of various machine learning (ML) techniques by hybridizing different ML techniques or ML techniques with traditional forecasting techniques to improve model accuracy. Saxena et al. [34] developed a composite among the three models, artificial neural network (ANN), autoregressive integrated moving average (ARIMA), and logistic regression, to evaluate the peak load days in a billing period. Liao [35] proposed a concept of a wavelet neural network algorithm that promises a faster convergence and avoids local optimum. The output from the network is then amended by the fuzzy expert system to provide the final air-condition load forecasting. Fan et al. [36] introduced a novel method hybridizing several machine learning algorithms in estimating the short-term load of electricity consumption and suggested some regulations on economic development.

2.2. Reinforcement Learning

Reinforcement learning was studied by many scientists in the 1950s through various threads, mainly including trial and error, optimal control, and temporal difference. By the 1980s, influenced by Klopf’s work in combining trial-and-error learning and temporal-difference learning together, Sutton and Barton developed this idea further and laid the foundation for modern reinforcement learning [37].
A reinforcement learning system consists of an environment and an agent interacting inside a predefined space (see Figure 1). Environment represents the initial definitions of the problem: a set of actions and a set of states that together determine the space size of the environment, as well as a set of reward values: movement energy, an ultimate goal, and obstacles. The agent is either a learner, a mover, or a solver of the initial problem by taking action and receiving a reward. In reinforcement learning, given a predetermined environment, an agent inside interacts with the surroundings by choosing an action in accordance with a specific situation. An action that may provide a higher probability of achieving the specified final goal will grant the agent more rewards. On the other hand, actions that hinder the agent from its ultimate destination will be regarded as punishment or penalty. In this case, after a process of trial and error, the right actions accumulate more rewards whereas bad ones deduct those by penalties. In other words, various actions and scenarios should be tried to help the agent sense the environment and estimate a reliable reward.
The agent’s learning process will be driven based on a set of parameters: discount rate, learning rate, and explore decay rate. The discount rate, whose value is between zero and one, determines the agent’s interest in future rewards. If the discount rate is close to zero, the agent prefers those actions that bring a high, immediate reward. Conversely, when the discount rate moves toward one, the agent will evaluate the action based on the total potential reward it may receive by performing that action. The learning rate, in a relatively similar concept to that of a neural network, controls the magnitude of change in every estimation update on each state-action pair [38]. Another important parameter in reinforcement learning is the explore decay rate, which balances the exploration and exploitation phases.
The exploration period largely contributes to the agent’s environment comprehension through a sufficient trial and error process. From the accumulated experience, the agent manages to recognize actions with high long-term rewards by repeatedly choosing the correct actions in most of the states [37]. Learning without labeled data is also the mechanism that distinguishes reinforcement learning from supervised learning.
One of the most widely applicable reinforcement learning algorithms is conventional Q-learning, which is a well-known off-policy method proposed by Watkins (1989) [39]. In Q-learning, the discrete value of a state-action pair is stored in a matrix called Q-table that is updated during the training process. However, implementing Q-learning becomes more challenging due to the memory and computational complexity as the state-action dimension increases. To address this issue, the deep Q-network (DQN), which is a combination of conventional Q-learning and deep learning, was introduced by Mnih et al. [40] in 2013. Instead of filling Q-value in the Q-table, the DQN estimates the value by applying the stochastic gradient descent method (SGD) throughout its multi-perceptron layers. Due to its computational advantage, the DQN algorithm has been widely implemented in various applications, such as decoding text sequences [41], playing chess [42], and traffic light control [43]. Nevertheless, researchers soon realized that the DQN experienced a significant overestimation for the Q-value, hence, double Q-learning and the Double DQN were introduced [44,45]. The idea of both double Q-learning and the Double DQN was to separate the action selection and action evaluation, intended to reduce over-optimistic value estimation. While double Q-learning employs two independent neural networks simultaneously and calculates the average Q-value, the Double DQN trains mainly by one network and periodically updates weight and bias from this network to the second network. The train network is updated at every step and performs action selection, whereas the so-called target network remains unchanged during every certain period and is used to evaluate future estimation. The model using the Double DQN has a faster convergence than deep Q-learning, resulting in a more stable and reliable learning model [45].
Despite its early introduction in the 1950s, reinforcement learning was rarely applied to solve practical problems because of the massive calculation. Owing to the development of computational power and deep learning, more researchers have applied RL to improve their prediction models. Liu et al. [24] used three different neural network models to predict wind speeds and then applied the RL method to produce composite predicted values. In that study, RL adjusted the weights assigned to the outcomes from three deep networks, long short-term memory (LSTM), deep belief network (DBN), and echo state network (ESN), to achieve the final prediction result. However, an initial weight matrix of three methods is required, which, given a large number of data points, can result in excessive computational resource requirements when using RL. Meanwhile, Chien et al. [25] decided to build a selection framework to automatically choose a predictive model for diverse products of a semiconductor distributor. Similar to Liu et al. [24], historical data was analyzed to identify demand patterns, and then a variety of predictions from different methods were applied to the demand for each product. Finally, the results from those models and the inventory were input into the deep Q-network training to decide the appropriate forecasting model for each respective product.

3. Methods

This study presents a novel approach adapted from the study of Chien et al. [25], which proposed a reinforcement learning algorithm to select suitable forecasting models for semiconductor product forecasting. We employed a Double DQN to select an appropriate forecasting model from a pool of models for each time period, using the mean squared error (MSE) as the evaluation metric. To reduce computational efforts, the fractional factorial design technique was used to tune the hyperparameters of the RL algorithm. Initially, three machine learning models, the artificial neural network, support vector regression, and deep belief network, were developed to predict monthly peak electricity consumption. These models’ predictions serve as inputs for the Double DQN, where an agent learns to recommend an accurate prediction model for each time period. To demonstrate the efficiency of this approach, the models were trained and tested using a real-world dataset containing monthly peak electricity consumption in Thailand from 2004 to 2017. The empirical analysis aims to demonstrate the practical applicability and performance of the proposed methodology.

3.1. Forecasting Models

3.1.1. Artificial Neural Network (ANN)

An artificial neural network (ANN) is a machine learning algorithm that emulates the behavior of biological neural networks in receiving and transmitting information [46]. In this article, one of the simplest ANN models, called single hidden layer feedforward neural network (SLFN) [47], was used to predict the monthly peak electricity consumption in Thailand. The architecture of SLFN is formed by three types of layers: input layer, hidden layer, and output layer. Nodes between layers are fully connected with each other. The structure of SLFN is illustrated in Figure 2.
The mathematical equation of the SLFN is shown below:
y = j = 1 m β j f j i = 1 n w i j x i + b j
where x i is the input of input node i, w i j is the weight from input node i to hidden node j, and b j is the bias of the hidden node j. f j is the activation function of hidden node j. β j is the weight from the hidden node j to the output node. n and m are the numbers of input node and hidden node, respectively.

3.1.2. Support Vector Regression (SVR)

A support vector regression (SVR) [48], which is variant of support vector machine (SVM) [49], aims to find the narrowest ε-intensive tube while minimizing the prediction error for regression problems. SVR has a tolerance for data points inside the ε-intensive tube; thus, its advantages are robustness and generalization of the model while maintaining a high prediction accuracy. The hyperplane of SVR is formulated as seen in Equation (2):
y = f ( x ) = w T x + b
The input data are converted into the kernel space using a transformation function φ(x). The SVR problem is formulated as an optimization problem:
M i n 1 2 w 2 + C i = 1 N ξ i + ξ i *
subject to:
y i w T φ ( x i ) ε + ξ i * i = 1 , 2 , N w T φ ( x i ) y i ε + ξ i i = 1 , 2 , N ξ i , ξ i * 0 i = 1 , 2 , N
where w 2 is the modulus of vector w to the hyperplane surface; ξ i and ξ i * are the slack variables; C is a constant used to put the weight error minimization, which also indicates how many points can be tolerated outside the tube; and N is the total number of the data set [48].

3.1.3. Deep Belief Network (DBN)

A deep belief network (DBN) is a multi-layer perceptron (MLP) model composed of multiple restricted Boltzmann machines (RBM) [50]. The structure of a DBN is shown in Figure 3.
Each RBM includes two layers, called the visual layer and the hidden layer, which, respectively, act as the input and output layers in the conventional neuron network. The output layer of each RBM model performs as the input layer for the next model in sequence. The RBM is used to learn the pattern and recognize the probability distribution of the input value, which allows it to sample and generate new data. This feature is utilized in DBN, where RBM learns to initialize the weights and bias for each pair of layers in order to speed up the training process.
The RBM is derived from the Boltzmann distribution, which is an essential probability function used in statistical mechanics to determine the probability of a system in a particular state by an energy function, E(v,h). According to the Boltzmann distribution, states with lower energy have a higher probability of being taken. Training RBM is an optimization process to minimize the energy function [50]. At this point, the energy function in the Boltzmann distribution is analogous to a loss function in other machine learning algorithms, where a high loss function value indicates that the weights and bias vary widely, and the loss function value decreases as the values of weights and bias stabilize in certain ranges. For this reason, RBM is also called an energy-base model. The energy function is formulated below:
E ( v , h ) = i n j m w i j v i h j i n b i v i j m b j h j
where v i and h j are the values of visual nodes and hidden nodes, w i j is the weight between the visual node i and the hidden node j , b i is the bias of visual node i in the visible layer, b j is the bias of the visual node j in the hidden layer, n is the number of visible layers, and m is the number of hidden layers.
The connection between the energy function and the probability of visual layer v and hidden layer h, p v , h , are defined as follow [50]:
p v , h = Z 1 e E ( v , h )
where E ( v , h ) is the energy function and Z is the normalization constant so that the summation of the probabilities p v , h from all visual and hidden layers is one.
Z = v , h e E ( v , h )
The probability function in an RBM considers the energy function and is used to determine the weight updates during training. To calculate the probability of a particular set of weights between the visible layer and hidden layer, the value of each node in the visible layer and hidden layer are set to either 1 or 0. The probability that the value of a node h j in the hidden layer is equal to 1, given the value of the visible layer nodes, is computed as follows:
p ( h j = 1 | v ) = s i g m ( b j + i n w i j v i )
Similarly, given the hidden layer, the probability of node v i in the visual layer equal to 1 is computed as follows:
p ( v i = 1 | h ) = s i g m ( b i + j m w i j h j )
Given the values of all nodes in the visible layer, the probability of the hidden layer in Equation (6) can be computed, and vice versa for Equation (7). All of the units in one layer are simultaneously updated depending on the current states of the units in the other layer. This process is repeated until the model is stable with low energy, resulting in a high likelihood of specific weight and bias values. In general, DBN accelerates the training time and requires a small amount of label data, which makes it outperform other machine learning models.

3.2. Double Deep Q-Network in Model Selection

After the forecasting results are generated independently by the three ML models (i.e., ANN, SVR, and DBN), the Double DQN is used to choose an appropriate model among the three ML models for each month’s prediction. The entire process is illustrated in 
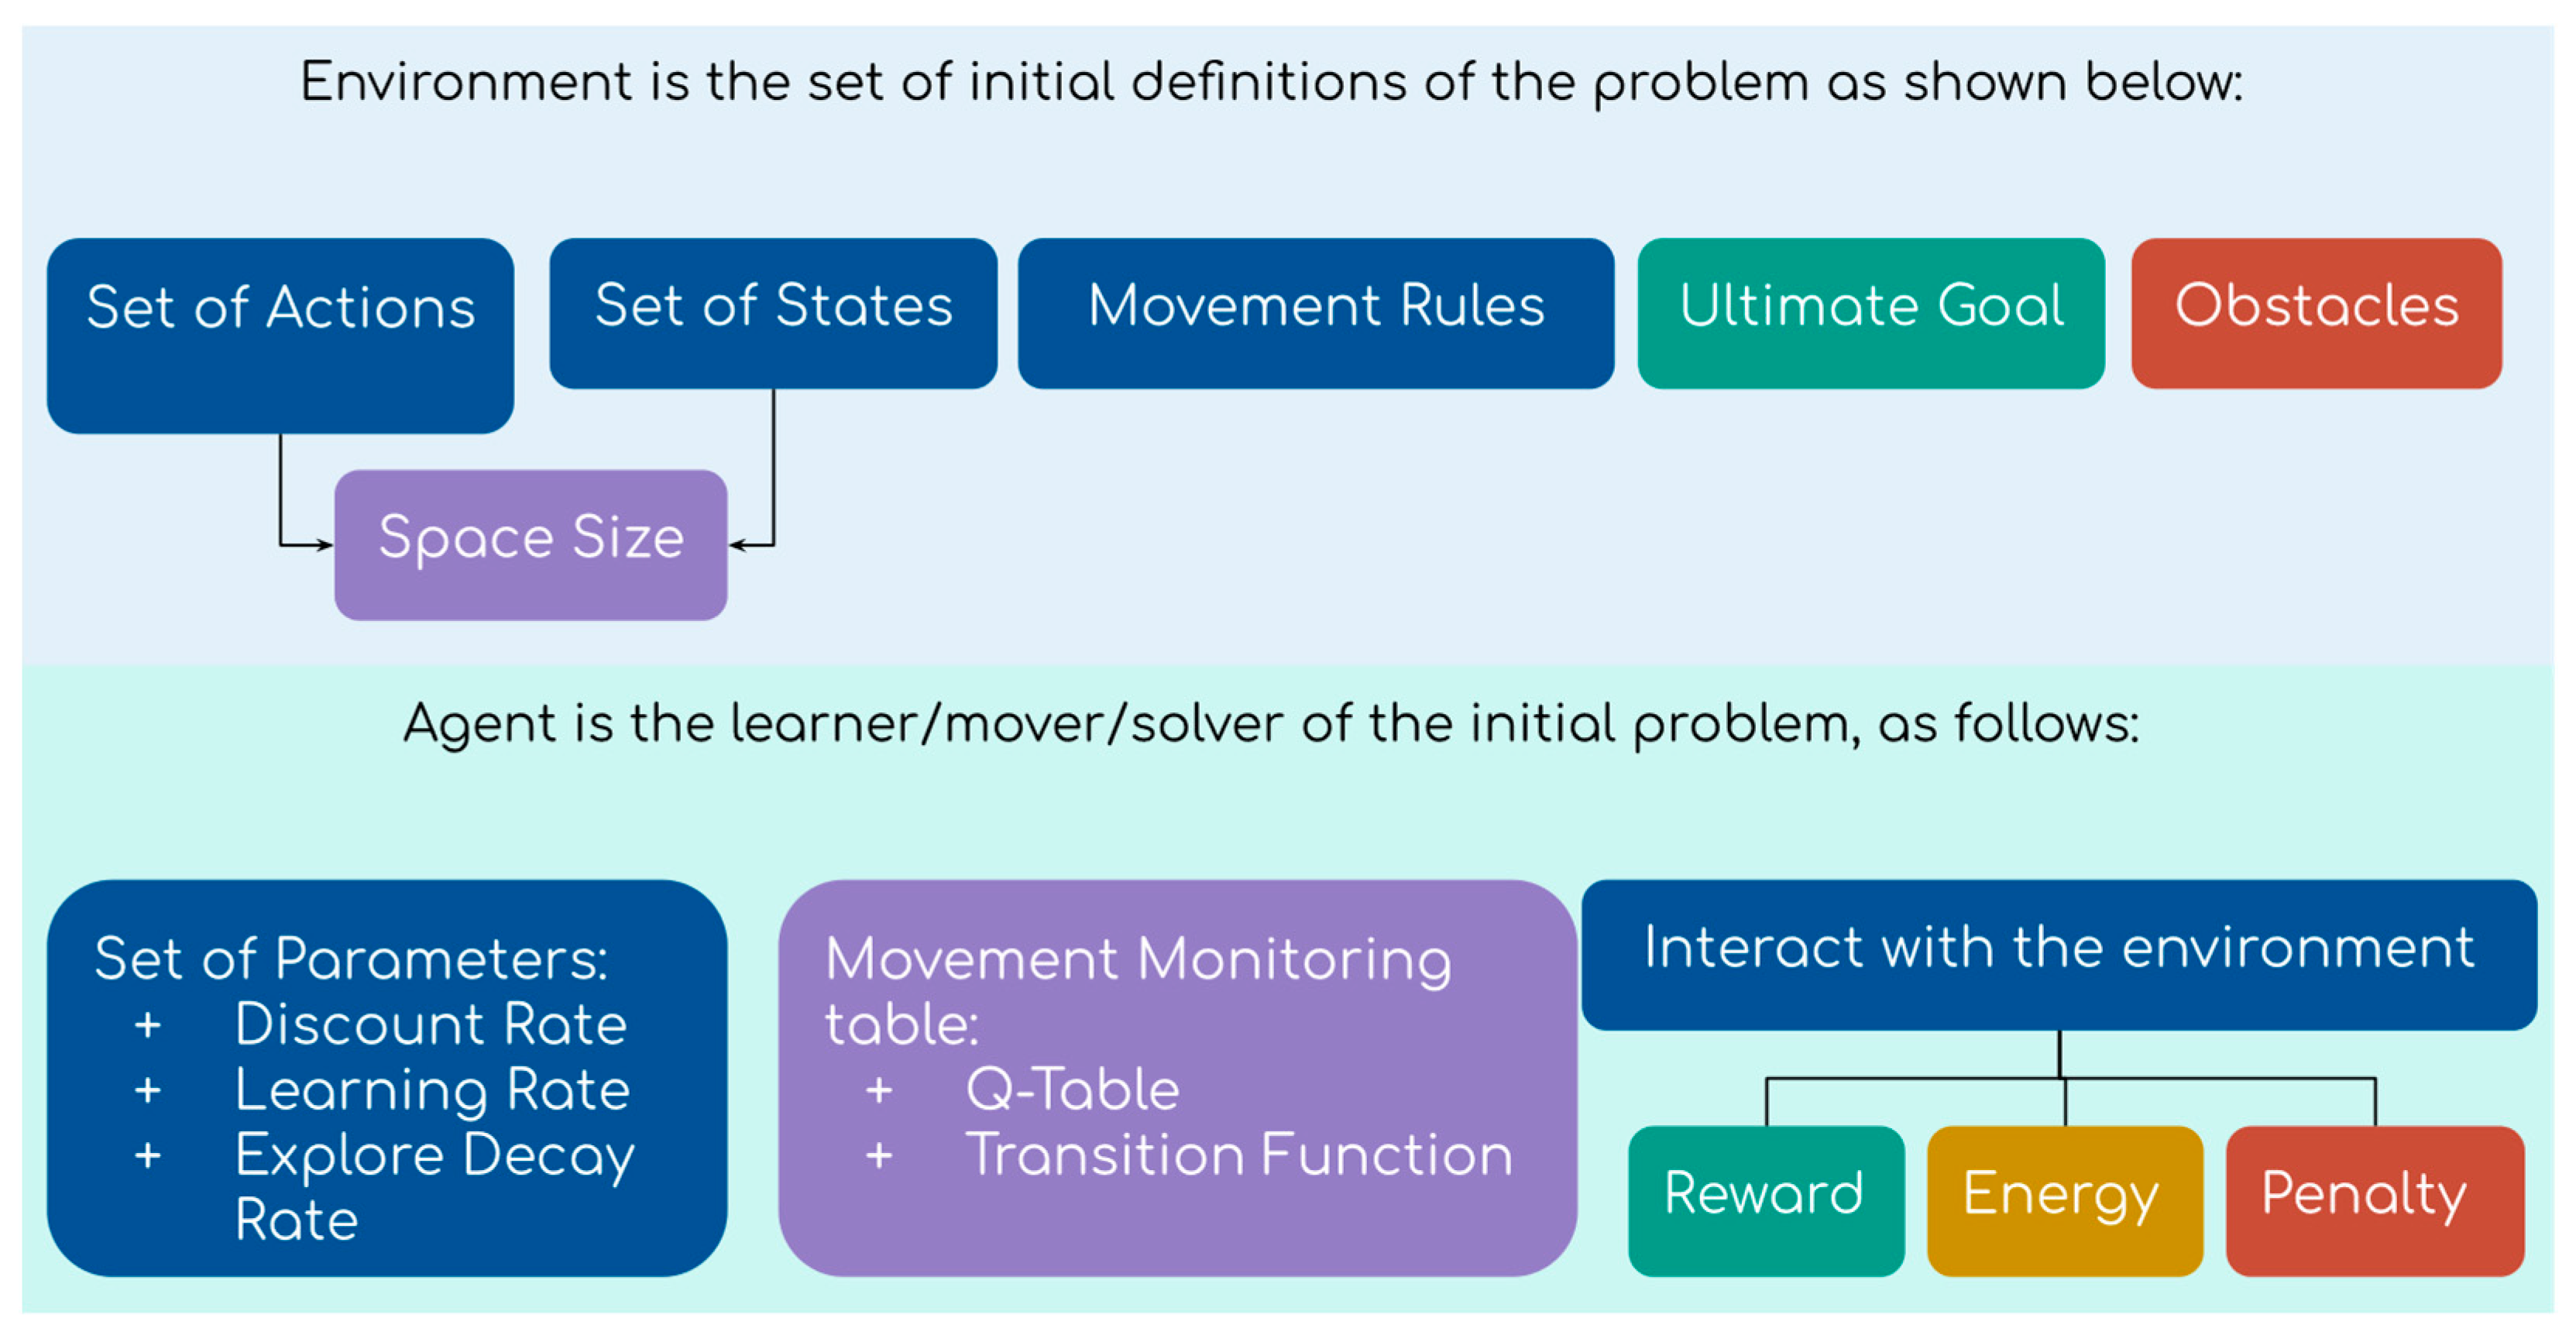
Figure 4. Each of the deep Q-networks in this article contains two hidden layers. The first hidden layer consists of ten neurons and the second hidden layer consists of nine neurons. The structure of the deep Q-networks is obtained from our preliminary testing. The goal of the Double DQN is to find the model that minimizes the error, measured in terms of mean squared error. For the Double DQN, the environment is defined as all data points in the training set and the state is the set of previous actual demand, seasonal index, month, year, number of days in a month, number of holidays, and demand trends of the previous three months.
A state S of the environment at time t is define as S t , which is associated with a data point in the data set and is described in the Training Set block in Figure 4:
S t = { d t 3 , d t 2 , d t 1 , S I t , m t , y t , k t , h t , l t 1 , l t 2 }
  • d t 1 : Actual demand in month t 1
  • d t 2 : Actual demand in month t 2
  • d t 3 : Actual demand in month t 3
  • d t : Actual demand
  • S I t : Seasonal index at month m t
  • m t : Month index
  • y t : Year index
  • k t : Number of days in month  m t
  • h t : Number of holidays in month  m t
  • l t : Demand trend , l t 1 = d t 2 d t 1
The set of actions A in each state contains choosing one of the three forecasting models. This set of actions is the same in every state in the environment.
A = { a i } = { a 1 , a 2 , a 3 }
  • a 1 : ANN model
  • a 2 : SVR model
  • a 3 : DBN model
After the selection, the agent takes one step forward to the next state, i.e., next month. When starting at a specific month, the agent has to follow the time direction; moving backward is not allowed.
By estimating a reasonable Q-value for each prediction method in different states using the online Q-network (Q), the agent aims to maximize its total reward. Specifically, the online Q-network (Q) is updated at every step and used to select the best forecasting model each month by comparing its Q-value. The target Q-network updates weight and bias from the online Q-network (Q) every pre-specified update target period. The update period is obtained by observing results from empirical experience. This process is illustrated in Figure 4, where the Q-network updates the weights and bias from the experience replay, then the target Q-network is periodically updated by the Q-network, while in the experience replay, the target Q-network is used to calculate the Q-value of the next state. The experience replay will be explained in the following paragraphs. The Q-value of the agent at the state s t taking action a t is iteratively updated by the formula from the Bellman equation [37]:
Q ( s t , a t ) r ( s t , a t ) + γ Q ^ ( s t + 1 , a r g m a x a Q ( s t + 1 , a , θ t ) , θ t )
  • γ : discounted rate for future rewards
  • r ( s , a ) : reward function taking action  a  at state  s
  • θ : weight and bias of online  Q network
  • θ : weight and bias of target  Q network
The reward function takes the navigation role in the agent’s learning path. Using a proper reward strategy reduces the probability of falling into a local optimum solution and quickens the convergence speed. In forecasting problems, it is common to give rewards based on prediction errors such as square error or absolute error. However, in the model selection problem, a reward function needs to consider all the predicted values of the three models. At a certain month, one forecasting model might substantially outperform others. The agent should receive more rewards in those critical selections. In this paper, the reward function based on the performance difference of the selected forecast values is presented as follows.
r ( s t , a t ) = [ e b ( t ) e a ( t ) ] [ e a ( t ) e w ( t ) ]
  • e a ( t ) : square error of choosing action a of timestep  t
  • e b ( t ) : minimum square error of timestep  t
  • e w ( t ) : maximum square error of timestep  t
From Equation (11), choosing the best prediction value from Model 3 results in a positive reward of e w t e b ( t ) . On the other hand, choosing the worst prediction value from Model 1, the agent obtains the negative reward of e b t e w ( t ) .
The experience replay is an important technique in the Double DQN. The functional purpose of this technique is to break the correlation of sequential data and ensure the sample is independent and identically distributed. In the experience replay, the agent’s experiences are saved as tuples and appended in the replay memory. Each tuple T t includes the environment state t, action taken at state t, reward from state-action pair t, and the environment of the next state.
T t = { s t , a t , r ( s t , a t ) , s t + 1 }
The experience replay also helps to justify the estimation of future value using the predicted values from the target Q-network, which prevents the agent from optimistic overestimation. It is required that the agent passes through at least a number of data points equal to a batch size to initialize the experience replay.
In this study, a stopping condition was added once the agent was eligible for the experience replay to reduce the training time. The prediction error from agent actions in each step is stored for accumulated MSE calculation. A threshold was set as the maximum MSE that can be accepted for this study. If the accumulated MSE is greater than the threshold, the results from the current online Q-network are used to compute the mean squared error for the whole training set to compare with the threshold again.
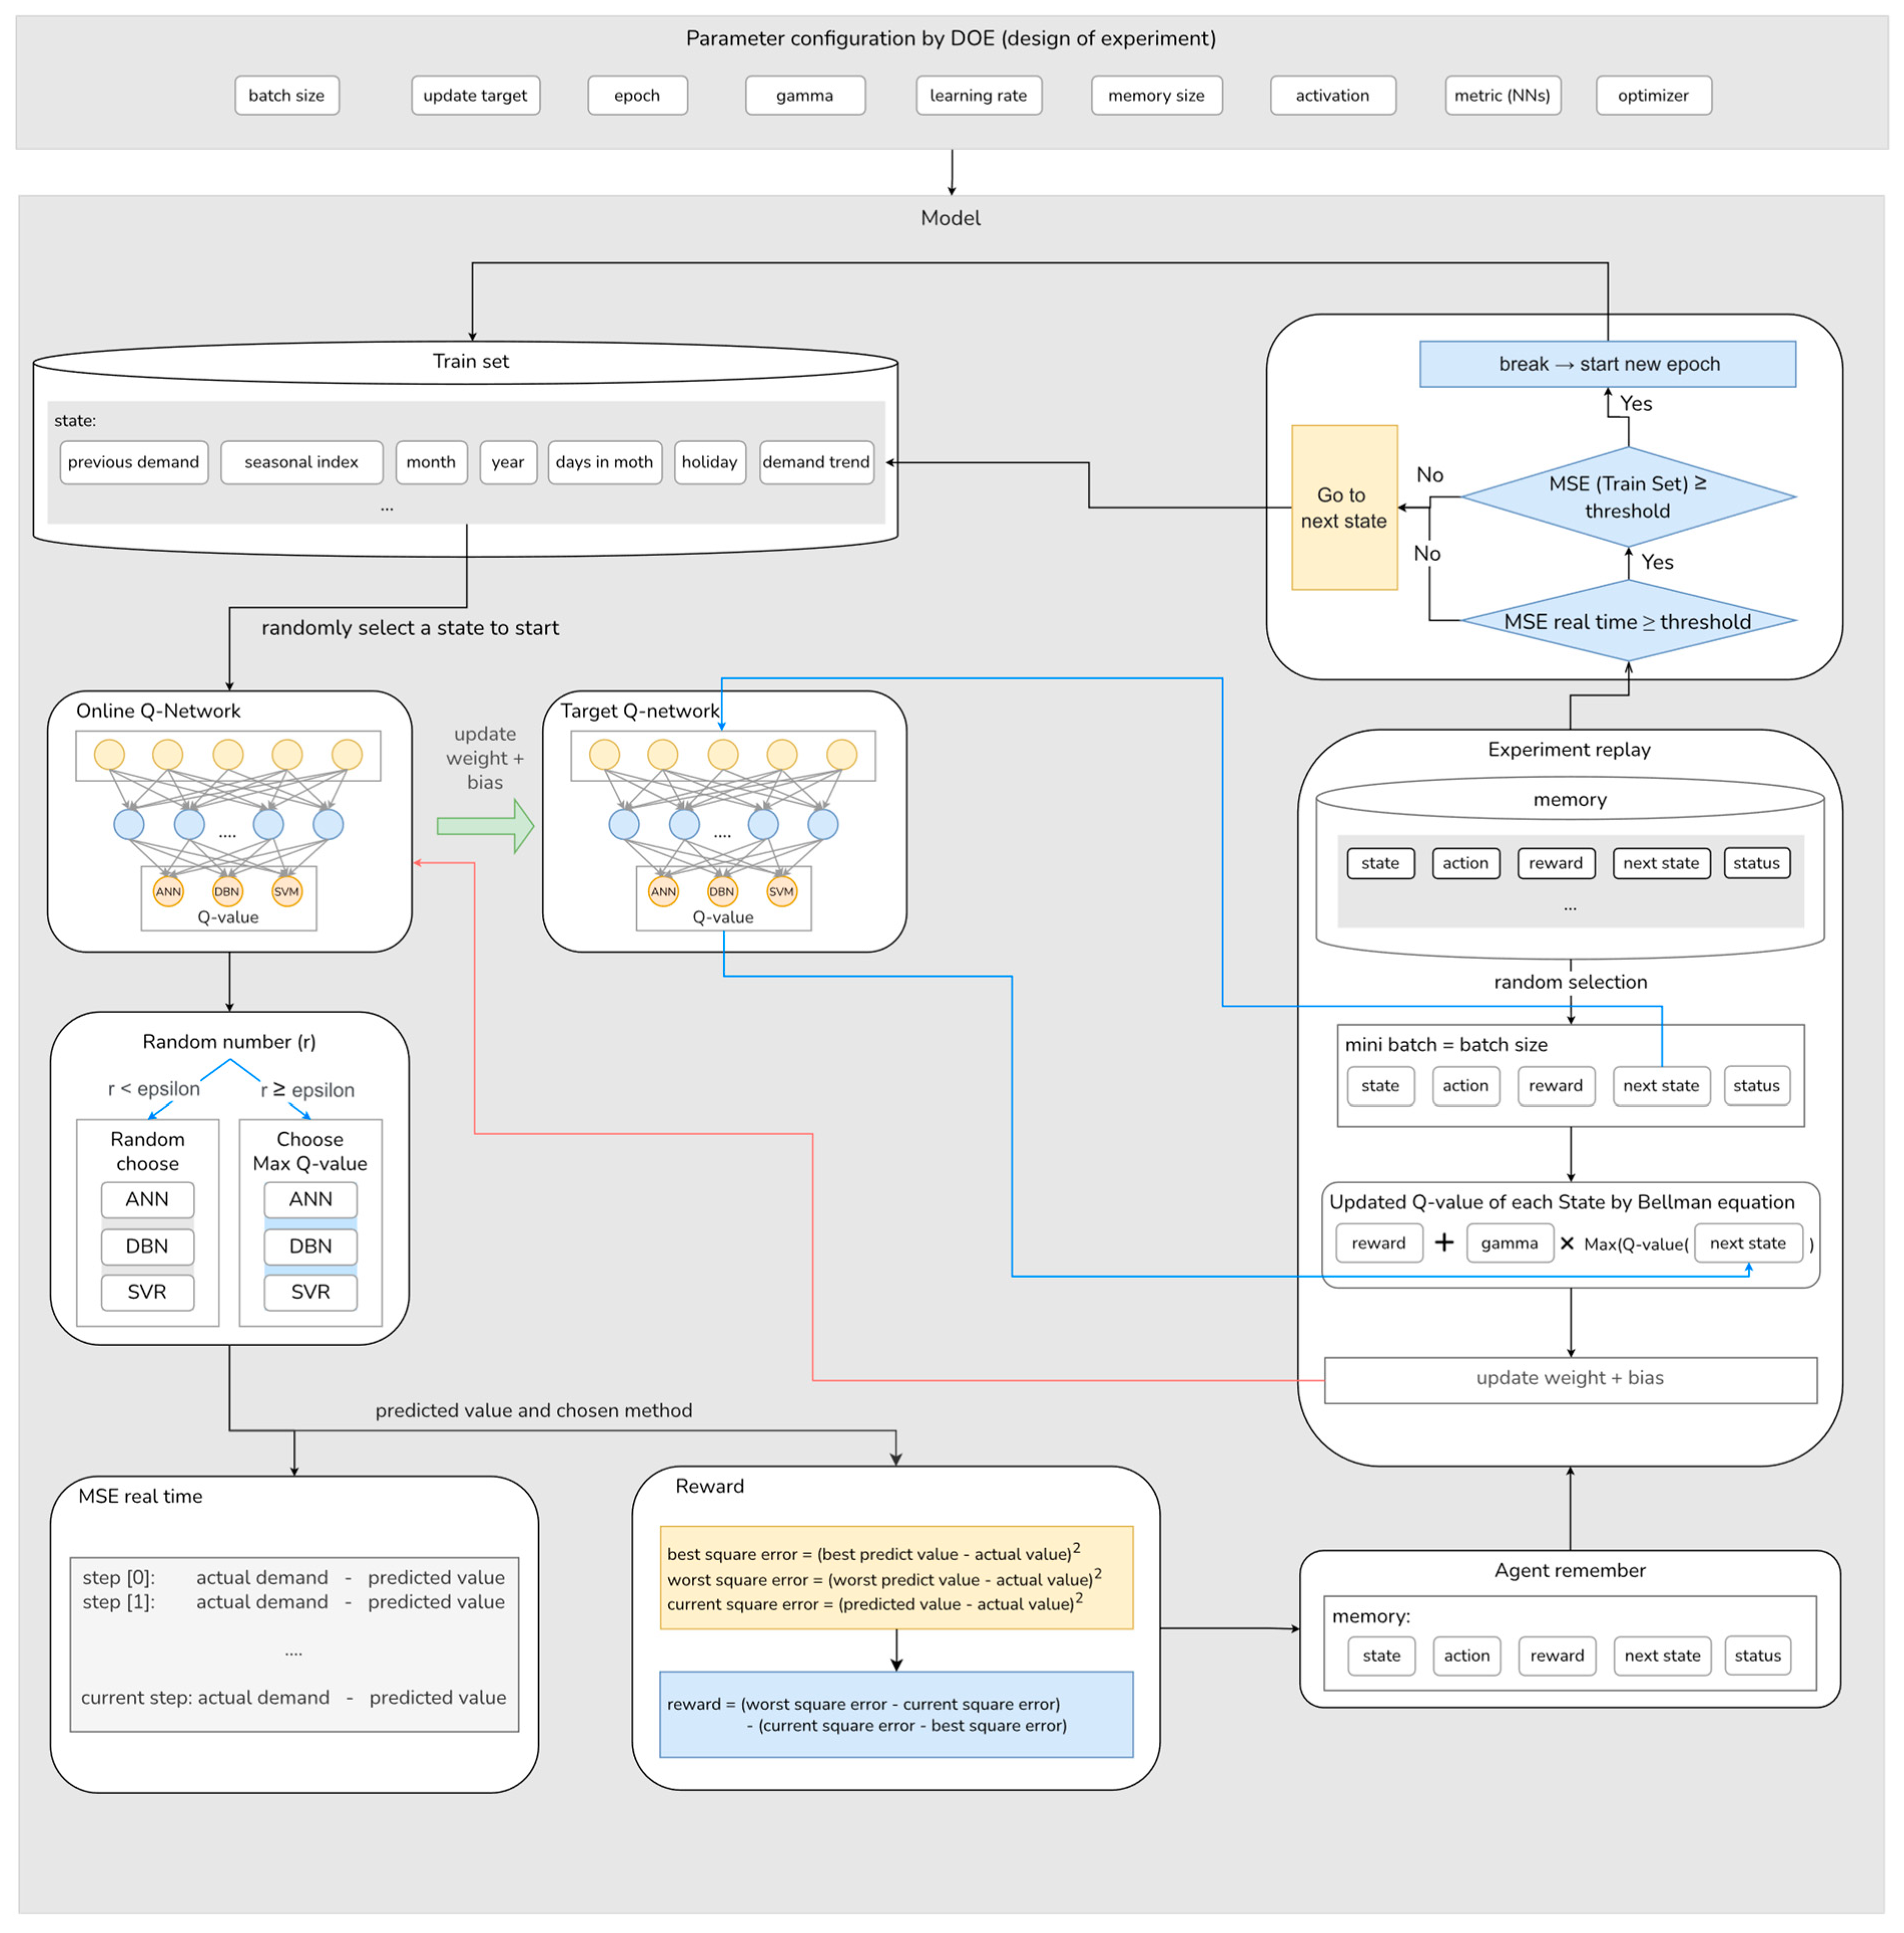
The diagram in Figure 4 illustrates the training process of the Double DQN, which involves tuning ten hyperparameters of reinforcement learning using the fractional factorial design technique. The training set consists of states, each of which contains various features, such as previous actual demand, seasonal index, month, year, number of days in a month, number of holidays, and demand trends of the previous three periods. To initiate training, the agent randomly selects a state and proceeds without the ability to go back to the previous period. At the beginning of the training process, when the exploration rate (epsilon) is high, the agent explores different forecasting models by randomly selecting from a pool of three machine learning models. As the agent gains experience and knowledge, a lower epsilon value promotes exploitation, focusing on actions that have yielded higher long-term rewards. The agent is more likely to choose the forecasting method with the maximum Q-value.
After taking an action, the real-time MSE between the predicted and actual values is calculated and stored. The reward for the chosen action is determined by comparing the squared error of the selected method with the most accurate and least accurate methods among the three forecasting models. The state, the chosen forecasting method, the reward, and the next state are recorded in a tuple ( T t ) and stored in the agent’s memory for experiment replay. The capacity of the agent’s memory is a hyperparameter, called “Memory size,” which is also tuned using the fractional factorial design technique.
During the training process, the agent randomly samples a mini-batch, equal to the batch size, from its memory. For each experience in the mini-batch, the Q-value is updated using the Bellman equation, and the weights and biases of the Q-network are updated accordingly. The Q-value of the next state is calculated using the target Q-network (a separate duplicate of the online Q-network), which is periodically updated based on the tuned “Update target” hyperparameter.
After the experiment replay process, both the real-time MSE and the MSE of the entire training set are compared to a threshold, which represents the specified maximum acceptable MSE. The MSE of the entire training set is calculated by using the current online Q-network to select forecasting models and compute the MSE. If both MSE values exceed the threshold, the agent proceeds to the next step in the training set. Otherwise, the agent starts a new epoch using the current weights and biases of the Q-network. After the final epoch, the weights and biases of the Q-network that result in the best MSE on the entire training set are saved as the final model of the training process.

3.3. Hyperparameter Tuning of the Double DQN

Hyperparameter tuning is crucial for machine learning techniques since it can improve model performance when changing the model structure is costly and time-consuming. There are different approaches to tuning hyperparameters. One of the most preferred by researchers is called grid search, which tries all possible combinations of hyperparameters [51]. However, this technique requires an exhaustive search operation if the number of hyperparameters is large. In this study, the fractional factorial design was used to tune a set of hyperparameters affecting the Double DQN model performance with an acceptable computational time required. The considered hyperparameters in this study include batch size, update target period, epoch, gamma, learning rate, memory size, activation function, metrics inside the neural network, and optimizer. The range of each hyperparameter of the Double DQN is shown in Table 1.
The batch size determines the number of data points fetched from memory during the experience replay. The range value of batch size is based on a trade-off between computational time and prediction accuracy, as a large batch size has faster training time but poor generalization, and vice versa [52]. The update target controls the relative length of the period, after which the target Q-network replicates the parameter configuration of the Q-network (Q). Memory size determines the number of tuples that can be stored in the replay memory with the rule that the newer memory replaces the oldest memory. In this study, two state-of-the-art activation functions, rectified linear unit 6 (ReLU6) and sigmoid-weighted linear units (dSiLU), are compared [53,54]. For optimizers, rectified Adam and stochastic gradient descent (SGD) were potential candidates. Rectified Adam inherits Adam’s performance speed while improving the robustness of the training phase, whereas SGD has the advantage in prediction quality, particularly the test set accuracy [55]. The metric (NNs) indicates the measurement of the accuracy of the neural network’s internal estimation, which does not refer to the prediction error between predicted and actual demand.
Using the fractional factorial design, a total of 2 k p runs with some center runs are generated, where k represent the number of hyperparameters as presented in Table 1 and p indicates the fraction of the full factorial. After the Double DQN model is trained with the generated hyperparameter settings according to the fractional factorial, a statistical analysis was carried out to identify the sets of hyperparameters that yield the best MSE. Based on the obtained set of hyperparameters, the Double DQN model is re-run five times for confirmation purposes. The final Double DQN model is selected based on the best performance in the test set.

4. Computational Experiment

4.1. Problem Definition and Data Description

As the state enterprise is responsible for electricity generation and procurement in Thailand, the Electricity Generating Authority of Thailand (EGAT) requires effective planning to efficiently supply the nation with electricity and utilize resources. In practice, the enterprise needs to forecast the peak unit load that occurs within each month. The purpose is to determine the number of power plants to operate and consider purchasing from other private utility companies to handle the surge in electricity demand. Therefore, the accurate estimation of future peak load requirements is crucial, particularly during the budgeting and capacity planning period for the entire year.
Initially, three individual machine learning (ML) models, ANN, SVR, and DBN, have been applied to forecast monthly peak load. The results from these models are compared in terms of MSE, as shown in Table 2. Note that the train set contains 13 years of monthly peak load data from 2004 to 2016, and the test set contains one year of data from 2017.
In addition, descriptive statistics of the input data for the Double DQN, including actual peak load and predictions from the three individual models ANN, SVR, and DBN, are presented in the Table 3. The range of prediction values from ANN is within that of the actual peak load. SVR provides a wider range of prediction values compared to ANN, yet remains mostly within the actual peak load’s range. DBN seems to have a similar range to the actual peak load, but with lower values.
The better forecasting performance of SVR in the training set did not yield the same level of performance for the test set, which could be due to overfitting issues during the training phase. Specifically, forecast values from SVR for the electricity peak in 2017 are farther away from the actual peak data compared to ANN or DBN. Conversely, ANN produced the forecast values closest to the actual peak in terms of MSE in the test set, while its training performance was not exceptional, which could be explained by the generalization during the training period. Overall, DBN maintained an average level of accuracy in both the training and test phases, which was preferable since the model seemed to effectively utilize the learning into practice.
Figure 5 illustrates the monthly peak load forecast values of the three ML models in 2017 as the test set. In addition, Table 4 shows the prediction performance in terms of square errors from the three ML models. From Figure 5 and Table 4, it can be seen that there is no individual ML model that consistently performs the best every month. Instead, different ML models take turns being the most accurate each month. Among the entire 12 months in the test set, ANN produces the best forecast values in five months (March, April, June, July, and November), SVR in three months (February, May, and September), and DBN in four months (January, August, October, and December). Hence, this result implies that selecting the best ML model each month can improve forecasting accuracy. On the other hand, selecting the wrong ML model may lead to either excessive resource allocation or unwanted shortage. For example, in March 2017, choosing DBN or SVR prediction values will result in a significant difference from the actual demand.
However, the forecasting accuracy of ML models is unknown for future prediction. In practicality, the selection of the best ML model requires knowledge of the characteristics of the electricity demand in each month, which is complex and uncertain throughout the entire year. Moreover, this knowledge should be revised in response to changes in the pattern of electricity demand. Therefore, this study attempts to achieve this task using the reinforcement learning algorithm.

4.2. Hyperparameter Setting

For a machine learning algorithm, its hyperparameters need to be properly set to obtain a good performance. A widely used approach is the grid search. With grid search, lower and upper bounds, as well as step size, are specified for each hyperparameter. Then, all possible combinations of hyperparameter values are tested. Nevertheless, using grid search is computationally time-consuming or even infeasible if there are too many hyperparameters to adjust. This is also the case for the RL algorithm implemented in this paper, which has nine hyperparameters.
To manage the number of runs for hyperparameter tuning, this study implements the fractional factorial design, a technique derived from the principles of experimental design.
One advantage of the fractional factorial design over grid search is that it requires a much smaller number of runs while still being reasonably effective in selecting the appropriate hyperparameter values. The fractional factorial design involves two levels for each hyperparameter. The nine hyperparameters of RL, along with their corresponding levels, are provided in Table 1.
Among the nine hyperparameters, which are treated as experimental factors, six of them are numerical factors, while the remaining three are categorical factors. A standard 29−5 resolution III design is generated for this study. The design encompasses 16 distinct hyperparameter settings, which is considered an acceptable number of experiments to conduct. In addition, eight runs at center points are included, where the numerical hyperparameters are set at the midpoint between their lower and upper bounds.
It is important to note that there are eight center points due to the presence of three categorical hyperparameters. Thus, the center points for the six numerical hyperparameters are tested for each of the eight (23) possible combinations of categorical hyperparameters. This yields a total of 24 experiments or hyperparameter settings to be run. Hyperparameter values of these experimental settings can be found in Table 5. Each setting is performed only once, and the MSE values of the test set are recorded as the performance measure for later optimization.

4.3. Result and Comparison

4.3.1. Result

The MSE of the electricity peak load forecast in 2017 was analyzed to evaluate the effectiveness of the RL algorithm. By comparing the MSEs of the test sets obtained from three individual ML models, ANN, DBN, and SVR, one can establish the performance boundaries for using the Double DQN to select monthly forecast values from these models. The worst possible performance of the Double DQN would involve selecting the worst forecast value (among the three values) each month, resulting in an MSE of 0.3427 for the test set. Conversely, the best possible performance would be achieved if the Double DQN selects the best forecast value in each month, resulting in an MSE of 0.1565 for the test set. Based on the MSE values of the individual models, a poorly tuned Double DQN would perform worse than SVR, with an MSE of 0.2793. On the other hand, a well-tuned DQN would outperform ANN, with an MSE of 0.2235. In other words, to demonstrate that the tuned DQN can outperform the individual models, the target MSE falls between 0.1565 and 0.2235. The performance boundaries of the Double DQN are presented in Table 6.
After conducting all 24 runs based on the fractional factorial design, promising results emerged, demonstrating improved forecast accuracy in certain settings. Consequently, the MSE values obtained from these 24 runs were analyzed using analysis of variance (ANOVA), with MSE serving as the response variable and the nine hyperparameters acting as experimental factors. The main effects and two-factor interactions of the hyperparameters were evaluated at the significant level of 5%. The resulting statistical model was further examined using a response optimizer to obtain an optimal hyperparameter configuration. The recommended hyperparameter setting from the response optimizer, as presented in Table 7, was then incorporated back into the Double DQN structure for an additional five confirmation runs, aiming to validate the performance of the tuned Double DQN. The results from these five confirmation runs are provided in Table 8.
Based on the data presented in Table 8, the tuned Double DQN demonstrates promising results, exhibiting an average MSE of 0.1750 in the test set, with the best MSE achieved at 0.1655. All five confirmation runs conducted with this hyperparameter setting showcase improved forecast accuracy compared to that of the ANN, which yields an MSE of 0.2235.

4.3.2. Performance Comparison of the Double DQN with Other Ensemble Models

To properly evaluate the performance of the proposed Double DQN model, an analysis was conducted to compare the MSE of the test set from the proposed model with those obtained from implementing two other ensemble models, adapted from Okoli et al. [56] and Liu et al. [24].
In Okoli et al. (2018), an averaging technique was implemented to incorporate multiple prediction models, treating each individual prediction equally. That is, each model in the pool was assigned the same weight of importance. Applying this method to the forecast values from ANN, SVR, and DBN, the MSE of the test set was 0.2289. Compared to individual models, the averaging technique outperforms the individual SVR and DBN in terms of MSE, yet performs worse than the individual ANN.
In addition, Liu et al. (2020) employed a weighted average ensemble model utilizing the conventional Q-learning method. The core concept behind this approach was to determine the optimal combination of weights for individual models that could be applied to predict all data points, whose similar concept can later be found in the research of Anand et al. [57] about brain tumor diagnosis. After implementing the weighted average approach to the test set of this article, this ensemble model achieves the best MSE, 0.2132, which outperforms all three individual models.
However, in comparison, the proposed Double DQN model, which achieves an MSE of 0.1750 in the test set, significantly outperformed both of the above approaches (Table 9). Additionally, the predictions from the proposed Double DQN are much closer to the best possible selection’s MSE at 0.1565. This significant improvement in performance underscores the effectiveness of the Double DQN model.

5. Conclusions

This article proposes a model selection method based on the Double DQN for electricity peak load forecasting. The purpose is to choose the most appropriate forecast values from individual machine learning models, ANN, SVR, and DBN, to achieve better forecast accuracy over individual models. The Double DQN contains 10 hyperparameters that need to be properly set. While traditional methods, such as grid search, are inefficient for this task, an efficient approach to hyperparameter tuning based on the fractional factorial design is implemented to reduce the computational effort required for tuning. The proposed Double DQN and fractional factorial design for hyperparameter tuning are tested using real data of an electricity peak load of Thailand. In addition, the model is compared with two other ensemble models from the literature. Empirical results indicate the effectiveness of the Double DQN in outperforming individual models and two other ensemble models in terms of MSE, affirming its practical significance in electricity peak load forecasting.
Future research directions include further modifications of the structure of the Double DQN model to speed up the training phase, developing a new reward strategy for the Double DQN that prioritizes selecting forecast values that are higher than the actual peak load to ensure sufficient power supply and applying the proposed method to forecast the total electricity consumption instead of peak load. Additionally, the findings regarding the performance of the Double DQN can be further strengthened by expanding the pool of forecasting models to include other time series forecasting models (e.g., ARIMA) and deep learning models (e.g., LSTM, GRU). Potentially, the Double DQN model can be applied to electricity peak load data for other countries or other datasets sharing similar characteristics.

Author Contributions

Conceptualization, W.P., V.T.V., N.N.M.T. and J.B.; Data curation, W.P. and J.B.; Formal analysis, W.P., V.T.V., N.N.M.T. and J.B.; Investigation, W.P., V.T.V., N.N.M.T. and J.B.; Methodology W.P., V.T.V., N.N.M.T. and J.B.; Software, V.T.V. and N.N.M.T.; Supervision, W.P. and J.B.; Validation, W.P. and J.B.; Writing—original draft, V.T.V. and N.N.M.T.; Writing—review and editing, W.P. and J.B. All authors have read and agreed to the published version of the manuscript.

Funding

This research received no external funding.

Data Availability Statement

The data are not publicly available due to project privacy issues.

Acknowledgments

The authors would like to extend their appreciation to the Electricity Generating Authority of Thailand (EGAT) for providing the data used in this research and the Center of Excellence in Logistics and Supply Chain Systems Engineering and Technology (LogEn), Sirindhorn International Institute of Technology (SIIT), Thammasat University for their support in carrying out this research.

Conflicts of Interest

The authors declare no conflict of interest.

References

  1. IEA. Electricity Information: Overview, IEA, Paris. 2021. Available online: https://www.iea.org/reports/electricity-information-overview (accessed on 4 June 2023).
  2. Steinbuks, J. Electricity Availability and Economic Activity: Lessons from Developing Countries. The World Bank Development Research Group, 22 September 2020. Available online: https://www.worldbank.org/en/news/video/2020/09/22/electricity-availability-and-economic-activity-lessons-from-developing-countries (accessed on 4 June 2023).
  3. Electricity Generating Authority of Thailand. Gross Energy Generation and Purchase (by Type of Fuel)” Electricity Generating Authority of Thailand, Gross Energy Generation and Purchase. 2021. Available online: https://www.egat.co.th/home/en/statistics-generation-annual/ (accessed on 4 June 2023).
  4. Kim, H.; Jeong, J.; Kim, C. Daily Peak-Electricity-Demand Forecasting Based on Residual Long Short-Term Network. Mathematics 2022, 10, 4486. [Google Scholar] [CrossRef]
  5. Rallapalli, S.R.; Ghosh, S. Forecasting monthly peak demand of electricity in India—A critique. Energy Policy 2012, 45, 516–520. [Google Scholar] [CrossRef]
  6. Pugliese, R.; Regondi, S.; Marini, R. Machine learning-based approach: Global trends, research directions, and regulatory standpoints. Data Sci. Manag. 2021, 4, 19–29. [Google Scholar] [CrossRef]
  7. Zhu, Q.; Che, J.; Li, Y.; Zuo, R. A new prediction NN framework design for individual stock based on the industry environment. Data Sci. Manag. 2022, 5, 199–211. [Google Scholar] [CrossRef]
  8. Zhang, M.; Yang, D.; Du, J.; Sun, H.; Li, L.; Wang, L.; Wang, K. A Review of SOH Prediction of Li-Ion Batteries Based on Data-Driven Algorithms. Energies 2023, 16, 3167. [Google Scholar] [CrossRef]
  9. Yu, X.; Li, Y.; Li, X.; Wang, L.; Wang, K. Research on outdoor mobile music speaker battery management algorithm based on dynamic redundancy. Technologies 2023, 11, 60. [Google Scholar] [CrossRef]
  10. Zhao, E.; Sun, S.; Wang, S. New developments in wind energy forecasting with artificial intelligence and big data: A scientometric insight. Data Sci. Manag. 2022, 5, 84–95. [Google Scholar] [CrossRef]
  11. Lv, S.X.; Peng, L.; Hu, H.; Wang, L. Effective machine learning model combination based on selective ensemble strategy for time series forecasting. Inf. Sci. 2022, 612, 994–1023. [Google Scholar] [CrossRef]
  12. Du, L.; Gao, R.; Suganthan, P.N.; Wang, D.Z. Bayesian optimization based dynamic ensemble for time series forecasting. Inf. Sci. 2022, 591, 155–175. [Google Scholar] [CrossRef]
  13. Sheffrin, A.; Yoshimura, H.; LaPlante, D.; Neenan, B. Harnessing the power of demand. Electr. J. 2008, 21, 39–50. [Google Scholar] [CrossRef]
  14. Espinoza, M.; Suykens, J.A.; Belmans, R.; De Moor, B. Electric load forecasting. IEEE Control Syst. Mag. 2007, 27, 43–57. [Google Scholar] [CrossRef]
  15. Al Mamun, A.; Sohel, M.; Mohammad, N.; Sunny, M.S.H.; Dipta, D.R.; Hossain, E. A comprehensive review of the load forecasting techniques using single and hybrid predictive models. IEEE Access 2020, 8, 134911–134939. [Google Scholar] [CrossRef]
  16. Wu, H.; Levinson, D. The ensemble approach to forecasting: A review and synthesis. Transp. Res. Part C Emerg. Technol. 2021, 132, 103357. [Google Scholar] [CrossRef]
  17. Tascikaraoglu, A.; Uzunoglu, M. A review of combined approaches for prediction of short-term wind speed and power. Renew. Sustain. Energy Rev. 2014, 34, 243–254. [Google Scholar] [CrossRef]
  18. Wang, D.; Hu, M.; Weir, J.D. Simultaneous task and energy planning using deep reinforcement learning. Inf. Sci. 2022, 607, 931–946. [Google Scholar] [CrossRef]
  19. Aljohani, T.M.; Ebrahim, A.; Mohammed, O. Real-Time metadata-driven routing optimization for electric vehicle energy consumption minimization using deep reinforcement learning and Markov chain model. Electr. Power Syst. Res. 2021, 192, 106962. [Google Scholar] [CrossRef]
  20. Aljohani, T.M.; Mohammed, O. A Real-Time Energy Consumption Minimization Framework for Electric Vehicles Routing Optimization Based on SARSA Reinforcement Learning. Vehicles 2022, 4, 1176–1194. [Google Scholar] [CrossRef]
  21. Perera, A.T.D.; Wickramasinghe, P.U.; Nik, V.M.; Scartezzini, J.L. Introducing reinforcement learning to the energy system design process. Appl. Energy 2020, 262, 114580. [Google Scholar] [CrossRef]
  22. Ren, M.; Liu, X.; Yang, Z.; Zhang, J.; Guo, Y.; Jia, Y. A novel forecasting based scheduling method for household energy management system based on deep reinforcement learning. Sustain. Cities Soc. 2022, 76, 103207. [Google Scholar] [CrossRef]
  23. Dabbaghjamanesh, M.; Moeini, A.; Kavousi-Fard, A. Reinforcement learning-based load forecasting of electric vehicle charging station using Q-learning technique. IEEE Trans. Ind. Inform. 2020, 17, 4229–4237. [Google Scholar] [CrossRef]
  24. Liu, H.; Yu, C.; Wu, H.; Duan, Z.; Yan, G. A new hybrid ensemble deep reinforcement learning model for wind speed short term forecasting. Energy 2020, 202, 117794. [Google Scholar] [CrossRef]
  25. Chien, C.-F.; Lin, Y.-S.; Lin, S.-K. Deep reinforcement learning for selecting demand forecast models to empower Industry 3.5 and an empirical study for a semiconductor component distributor. Int. J. Prod. Res. 2020, 58, 2784–2804. [Google Scholar] [CrossRef]
  26. Jaisumroum, N.; Teeravaraprug, J. Forecasting uncertainty of Thailand’s electricity consumption compared with using artificial neural networks and multiple linear regression methods. In Proceedings of the 2017 12th IEEE Conference on Industrial Electronics and Applications (ICIEA), Siem Reap, Cambodia, 18–20 June 2017; pp. 308–313. [Google Scholar] [CrossRef]
  27. Panklib, K.; Prakasvudhisarn, C.; Khummongkol, D. Electricity consumption forecasting in Thailand using an artificial neural network and multiple linear regression. Energy Sources Part B Econ. Plan. Policy 2015, 10, 427–434. [Google Scholar] [CrossRef]
  28. Kavaklioglu, K. Modeling and prediction of Turkey’s electricity consumption using Support Vector Regression. Appl. Energy 2011, 88, 368–375. [Google Scholar] [CrossRef]
  29. Tsekouras, G.J.; Dialynas, E.N.; Hatziargyriou, N.D.; Kavatza, S. A non-linear multivariable regression model for midterm energy forecasting of power systems. Electr. Power Syst. Res. 2007, 77, 1560–1568. [Google Scholar] [CrossRef]
  30. Fumo, N.; Biswas, M.R. Regression analysis for prediction of residential energy consumption. Renew. Sustain. Energy Rev. 2015, 47, 332–343. [Google Scholar] [CrossRef]
  31. Boulaire, F.; Higgins, A.; Foliente, G.; McNamara, C. Statistical modelling of district-level residential electricity use in NSW, Australia. Sustain. Sci. 2014, 9, 77–88. [Google Scholar] [CrossRef]
  32. Lee, Y.S.; Tong, L.I. Forecasting energy consumption using a grey model improved by incorporating genetic programming. Energy Convers. Manag. 2011, 52, 147–152. [Google Scholar] [CrossRef]
  33. Nti, I.K.; Teimeh, M.; Nyarko-Boateng, O.; Adekoya, A.F. Electricity load forecasting: A systematic review. J. Electr. Syst. Inf. Technol. 2020, 7, 13. [Google Scholar] [CrossRef]
  34. Saxena, H.; Aponte, O.; McConky, K.T. A hybrid machine learning model for forecasting a billing period’s peak electric load days. Int. J. Forecast. 2019, 35, 1288–1303. [Google Scholar] [CrossRef]
  35. Liao, G.C. Hybrid improved differential evolution and wavelet neural network with load forecasting problem of air conditioning. Int. J. Electr. Power Energy Syst. 2014, 61, 673–682. [Google Scholar] [CrossRef]
  36. Fan, G.F.; Wei, X.; Li, Y.T.; Hong, W.C. Forecasting electricity consumption using a novel hybrid model. Sustain. Cities Soc. 2020, 61, 102320. [Google Scholar] [CrossRef]
  37. Sutton, R.S.; Barto, A.G. Introduction to Reinforcement Learning; MIT Press: Cambridge, MA, USA, 1998. [Google Scholar]
  38. Even-Dar, E.; Mansour, Y.; Bartlett, P. Learning Rates for Q-learning. J. Mach. Learn. Res. 2003, 5, 1–25. [Google Scholar]
  39. Watkins, C.J.C.H. Learning from delayed rewards. Ph.D. Thesis, King’s College, London, UK, 1989. [Google Scholar]
  40. Mnih, V.; Kavukcuoglu, K.; Silver, D.; Graves, A.; Antonoglou, I.; Wierstra, D.; Riedmiller, M. Playing atari with deep reinforcement learning. arXiv 2013, arXiv:1312.5602. [Google Scholar] [CrossRef]
  41. Guo, H. Generating text with deep reinforcement learning. arXiv 2015. [Google Scholar] [CrossRef]
  42. Lai, M. Giraffe: Using deep reinforcement learning to play chess. arXiv 2015. [Google Scholar] [CrossRef]
  43. Van der Pol, E.; Oliehoek, F.A. Coordinated deep reinforcement learners for traffic light control. Proc. Learn. Inference Control. Multi-Agent Syst. 2016, 8, 21–38. [Google Scholar]
  44. Hasselt, H. Double Q-learning. In Advances in Neural Information Processing Systems; Curran Associates Inc.: Red Hook, NY, USA, 2010; Volume 23. [Google Scholar]
  45. Van Hasselt, H.; Guez, A.; Silver, D. Deep reinforcement learning with double q-learning. In Proceedings of the AAAI Conference on Artificial Intelligence, Phoenix, AZ, USA, 12–17 February 2016; Volume 30, p. 1. [Google Scholar] [CrossRef]
  46. Jain, A.K.; Mao, J.; Mohiuddin, K.M. Artificial neural networks: A tutorial. Computer 1996, 29, 31–44. [Google Scholar] [CrossRef] [Green Version]
  47. Man, Z.; Lee, K.; Wang, D.; Cao, Z.; Khoo, S. Robust single-hidden layer feedforward network-based pattern classifier. IEEE Trans. Neural Netw. Learn. Syst. 2012, 23, 1974–1986. [Google Scholar] [CrossRef]
  48. Awad, M.; Khanna, R. Support vector regression. In Efficient Learning Machines: Theories, Concepts, and Applications for Engineers and System Designers; Apress: Berkeley, CA, USA, 2015; pp. 67–80. [Google Scholar] [CrossRef]
  49. Cortes, C.; Vapnik, V. Support-vector networks. Mach. Learn. 1995, 20, 273–297. [Google Scholar] [CrossRef]
  50. Hinton, G.; Salakhutdinov, R. An Efficient Learning Procedure for Deep Boltzmann Machines. Neural Comput. 2012, 24, 1967–2006. [Google Scholar] [CrossRef] [Green Version]
  51. Bergstra, J.; Bengio, Y. Random search for hyper-parameter optimization. J. Mach. Learn. Res. 2012, 13, 281–305. [Google Scholar]
  52. Keskar, N.S.; Mudigere, D.; Nocedal, J.; Smelyanskiy, M.; Tang, P.T.P. On large-batch training for deep learning: Generalization gap and sharp minima. arXiv 2016, arXiv:1609.04836. [Google Scholar] [CrossRef]
  53. Elfwing, S.; Uchibe, E.; Doya, K. Sigmoid-weighted linear units for neural network function approximation in reinforcement learning. Neural Netw. 2018, 107, 3–11. [Google Scholar] [CrossRef] [PubMed]
  54. Lee, D. Comparison of reinforcement learning activation functions to improve the performance of the racing game learning agent. J. Inf. Process. Syst. 2020, 16, 1074–1082. [Google Scholar] [CrossRef]
  55. Liu, L.; Jiang, H.; He, P.; Chen, W.; Liu, X.; Gao, J.; Han, J. On the variance of the adaptive learning rate and beyond. arXiv 2019, arXiv:1908.03265. [Google Scholar] [CrossRef]
  56. Okoli, K.; Breinl, K.; Brandimarte, L.; Botto, A.; Volpi, E.; Di Baldassarre, G. Model averaging versus model selection: Estimating design floods with uncertain river flow data. Hydrol. Sci. J. 2018, 63, 1913–1926. [Google Scholar] [CrossRef] [Green Version]
  57. Anand, V.; Gupta, S.; Gupta, D.; Gulzar, Y.; Xin, Q.; Juneja, S.; Shah, A.; Shaikh, A. Weighted Average Ensemble Deep Learning Model for Stratification of Brain Tumor in MRI Images. Diagnostics 2023, 13, 1320. [Google Scholar] [CrossRef]
Figure 1. Components of environment and agent in reinforcement learning.
Energies 16 05099 g001
Figure 2. Structure of a single hidden layer feedforward neural network (SLFN) [47].
Energies 16 05099 g002
Figure 3. Structure of the deep belief network with multiple restricted Boltzmann machines.
Energies 16 05099 g003
Figure 4. Structure of Double DQN for model selection, including training process, reward function, experience replay, and network weight and bias updates.
Energies 16 05099 g004
Figure 5. Forecast values of the test set from individual models.
Energies 16 05099 g005
Table 1. Levels of hyperparameters of Double DQN for fractional factorial design.
HyperparameterLowHigh
Batch size1236
Update target50154
Epoch5001000
Gamma0.10.9
Learning rate0.0010.01
Memory size10,000100,000
ActivationdSiLUReLU6
Metric (NNs)mapemse
OptimizerSGDRectified Adam
Table 2. Individual models’ MSE of the train and test sets.
ModelTrain SetTest Set
ANN0.32340.2235
SVR0.20490.2793
DBN0.24330.2349
Table 3. Descriptive statistics of the monthly peak electricity load dataset.
StatisticsActualANNSVRDBN
Mean22.73022.75122.73322.716
Standard Deviation2.8412.7392.8052.833
Minimum16.83216.91116.02115.587
Maximum29.61927.75928.27828.223
Count166166166166
Table 4. Squared error matrix in test set period.
MonthANNDBNSVRBest
10.0773680.0203980.046541DBN
20.0331310.0835500.031629SVR
30.0034920.2029590.185422ANN
40.0080320.3060520.369696ANN
51.0134120.5512320.522766SVR
60.2272430.3458850.655994ANN
70.3659210.3679270.594713ANN
80.0776660.0202920.055713DBN
90.7394810.7029820.610702SVR
100.2729070.0671480.267841DBN
110.0000850.0136420.000499ANN
120.0002220.0002160.010544DBN
Best forecast5 times4 times3 times
Table 5. The 24 hyperparameter settings by fractional factorial design.
SettingBatch SizeUpdate TargetEpochGammaLearning RateMemory SizeActivation FunctionOptimizerMetric
124756000.50.005555,000ReLU6SGDMAPE
236507000.90.00110,000dSiLUSGDMSE
312507000.10.01100,000dSiLUSGDMSE
4121007000.10.00110,000dSiLURAdamMAPE
524756000.50.005555,000ReLU6RAdamMAPE
624756000.50.005555,000dSiLURAdamMAPE
736505000.90.01100,000ReLU6SGDMAPE
812507000.90.0110,000ReLU6RAdamMAPE
912505000.90.001100,000dSiLURAdamMSE
1036507000.10.001100,000ReLU6RAdamMAPE
1136505000.10.0110,000dSiLURAdamMSE
12361005000.90.00110,000ReLU6RAdamMSE
1324756000.50.005555,000ReLU6SGDMSE
1412505000.10.00110,000ReLU6SGDMAPE
1524756000.50.005555,000dSiLURAdamMSE
16361005000.10.001100,000dSiLUSGDMAPE
17361007000.90.01100,000dSiLURAdamMAPE
18121005000.90.0110,000dSiLUSGDMAPE
19361007000.10.0110,000ReLU6SGDMSE
2024756000.50.005555,000dSiLUSGDMAPE
2124756000.50.005555,000dSiLUSGDMSE
22121007000.90.001100,000ReLU6SGDMSE
23121005000.10.01100,000ReLU6RAdamMSE
2424756000.50.005555,000ReLU6RAdamMSE
Table 6. Performance boundary of Double DQN on the test set.
ApproachMSE
Worst possible selection0.3427
SVR0.2793
DBN0.2349
ANN0.2235
Target MSE of the Double DQN[0.1565, 0.2235]
Best possible selection0.1565
Table 7. Recommended settings from response optimization on MSE of the test set.
HyperparameterBest-Found MSE as Response
Batch size36
Update target50
Epoch700
Gamma0.9
Learning rate0.01
Memory size100,000
ActivationReLU6
Metric (NNs)MSE
OptimizerSGD
Table 8. MSE summary from five confirmation runs.
Confirmation RunBest-Found MSE as Response
10.1727
20.1849
30.1701
40.1819
50.1655
Average0.1750
Table 9. Performance comparison of the proposed Double DQN on the test set.
ApproachMSE
Worst possible selection0.3427
SVR0.2793
DBN0.2349
Model average0.2289
ANN0.2235
Weighted average0.2132
Double DQN0.1750
Best possible selection0.1565
Disclaimer/Publisher’s Note: The statements, opinions and data contained in all publications are solely those of the individual author(s) and contributor(s) and not of MDPI and/or the editor(s). MDPI and/or the editor(s) disclaim responsibility for any injury to people or property resulting from any ideas, methods, instructions or products referred to in the content.

