Article

The Architecture for Testing Central Heating Control Algorithms with Feedback from Wireless Temperature Sensors

1
Faculty of Mathematics and Computer Science, Jagiellonian University, ul. prof. Stanisława Łojasiewicza 6, 30-348 Cracow, Poland
2
Atner Sp. z o.o., ul. Podole 60, 30-394 Cracow, Poland
3
Faculty of Electrical Engineering, Automatics, Computer Science and Biomedical Engineering, AGH University of Kraków, al. Mickiewicza 30, 30-059 Cracow, Poland
4
Honeywell Sp. z o.o., ul. Domaniewska 39, 02-672 Warsaw, Poland
5
Chair of Applied Computer Science, Faculty of Electrical Engineering, Automation, Computer Science and Biomedical Engineering, AGH University of Kraków, 30-059 Cracow, Poland
*
Authors to whom correspondence should be addressed.
Submission received: 30 May 2023 / Revised: 20 July 2023 / Accepted: 21 July 2023 / Published: 24 July 2023

Abstract

:
The energy consumption of buildings is a significant contributor to overall energy consumption in developed countries. Therefore, there is great demand for intelligent buildings in which energy consumption is optimized. Online control is a crucial aspect of such optimization. The implementation of modern algorithms that take advantage of developments in information technology, artificial intelligence, machine learning, sensors, and the Internet of Things (IoT) is used in this context. In this paper, an architecture for testing central heating control algorithms as well as the control algorithms of the heating system of the building is presented. In particular, evaluation metrics, the method for seamless integration, and the mechanism for real-time performance monitoring and control are put forward. The proposed tools have been successfully tested in a residential building, and the conducted tests confirmed the efficiency of the proposed solution.

1. Introduction

Heating, ventilation, and air conditioning (HVAC) systems are responsible for thermal comfort and air quality. In the European Union, buildings consume around 40% of total energy [1,2]. The member states must ensure that new buildings, and also some existing buildings, will meet certain energy requirements [3]. This is one of the reasons for switching to renewable energy sources [4] and for the development of clean energy generation [5]. Moreover, rising energy prices and global discussions regarding the state of the environment are driving more interest in adapting central heating control systems in residential and office buildings to improve energy efficiency while maintaining the thermal comfort of their occupants. This modernization usually requires the replacement of actuators, sensors, and the local controller (the latter with one that has extended features and capabilities). Observation that every closed loop control system—including central heating systems—has a feedback mechanism led us to the conclusion that this can be exploited to pass some additional information to the existing control system, with minimum modifications. Improved control algorithms can be executed on a separate computing unit, exchanging only corrections of the parameters computed by a legacy local controller. This modular approach reduces the cost of the installation and also simplifies the evaluation of the modified system performance. Comparing the updated system with the legacy one involves turning off corrections provided by optimization algorithms. New algorithms, requiring more computing capabilities, access to external services like a weather forecast, and the capability to retrieve information from wireless temperature sensors installed in a building, can be further improved with the developments in information technology, artificial intelligence, and machine learning.
There are many challenges regarding the architecture of a test environment for the evaluation of various HVAC control algorithms [6,7] that go beyond computer simulation [8,9]. Despite the fact that full repeatability can be provided only in simulations, at this moment they cannot totally mimic the behavior of a physical building. On the other hand, executing various HVAC control algorithms in the real world requires a way to ensure the comparability of the algorithms’ performance. External environmental factors (insolation, outdoor temperature, etc.) as well as the thermal comfort of inhabitants and changes in the hydraulic and automation subsystems may influence the results. Local (low-level) HVAC controllers deployed in the field might be managed by a high-level (remote) controller or building management system (BMS). It is a challenge to embed sophisticated control algorithms into local HVAC controllers [10]. Our contribution will show experimentally how to seamlessly enhance legacy heating control systems with optimization algorithms and will provide metrics to evaluate their performance.
The article is organized as follows: In Section 2, we present a literature review regarding HVAC automatic control algorithms in both the context of the Internet of Things and maintaining thermal comfort. Section 3 contains a description of the equipment used in the case study and a description of the heating control system of the building where the tests were performed. In Section 4, we present the control hierarchy and metrics used for performance evaluation. In Section 5, we show the results of our experiments, followed by a discussion in Section 6. In Section 7, we conclude our work.

2. Literature Review

In the literature, many control methods have been proposed and developed for HVAC systems. These methods can be divided into classical control, hard control, soft control, hybrid control, and other control techniques. Details of these methods are compared and discussed in [11,12]. These methods can also be divided into traditional, advanced, and intelligent [12]. In [13,14], an overview of the advanced control strategies for HVAC is presented. A comprehensive review discussing computational intelligence techniques for HVAC systems is presented in [2]. It is worth mentioning that classical control methods, including on–off (bang-bang) and proportional–integral–derivative (PID), are still used in many HVAC systems because of their simplicity and low cost [11,12].
Nowadays, the concept of the Internet of Things is often used to improve control of HVAC systems. The term Internet of Things was first proposed by Kevin Ashton in [15] as a network of physical objects embedded with electronics, circuits, software, sensors, and network connectivity that enables these objects to collect and exchange data. This has found many applications in the control of the state of systems for which the state is dependent on many variables [16]. One of the applications of IoT is the identification of human thermal comfort, which can be approximated by the Predicted Mean Vote [17]. Environmental variables (temperature, air velocity, and relative humidity) are measured by sensors (within a greater system) that are able to determine what thermal sensations a person experiences. The calculated indicator can be used to automatically control air conditioning. This system can improve comfort and reduce the energy consumption at the same time [7].
While the Predictive Mean Vote approach relies on an aggregated comfort model, other models consider distinct preferences between unique individuals [18]. Data collected by a set of sensors, occupants’ feedback from wearables, an online survey that gathered occupant-related information about age, gender, and clothing level, allows for the development of personal comfort models. Personalized thermal comfort models are able to capture the distinct preferences of each individual to enable a better understanding of the specific comfort requirements inside a building. Occupant behavior, especially interactions with building systems like HVAC, impact the building energy performance [19]. Wireless technologies like Wi-Fi or Bluetooth, image recognition, sound detection, passive infrared detection systems, and sensor fusion might capture behavior patterns and provide information about thermal-zone-level occupant localization. Occupancy-based HVAC control strategies can be classified as either user-defined schedules or occupancy-based mechanisms. In the former, occupants use manual or programmable thermostats or other means of scheduled control. In the latter, occupancy detection and monitoring systems provide input to reactive or predictive control, which can either be defined by a set of rules or driven by optimal control algorithms [20,21]. Control algorithms can be divided into [22]: local control, responsible for adjusting actuators of the system according to the predefined set points (e.g., on-off, PID), and high-level control, where an additional layer of control determines set points of the local control (e.g., predictive control, machine learning, and other artificial intelligence algorithms). Development of IoT data-driven closed-loop control systems in residential buildings faces many challenges related to data acquisition, transfer, storage, aggregation, and processing to deliver useful information for an HVAC system [10].
In [23], metrics and examples of testing environments for HVAC systems are presented. In laboratory conditions, it is possible to simulate the test environment using an electrical circuit composed of resistors and capacitors, which corresponds to the resistance and heat capacity of elements of a room (mainly air and walls) [24]. In such a model, the change of natural conditions can be reproduced on demand. It means that the unpredictability of environmental conditions can be emulated and recreated when needed. The impact of weather changes and the human factor led to the invention of the feed-forward method, which changes its state based on prediction disturbances [25].
In [26], an IoT system was adopted to monitor an HVAC system for a Smart Factory. The system was based on temperature and humidity sensors and the energy meter of the air conditioning. However, Wi-Fi communication ruled out the use of battery power supply for sensors and therefore significantly limited the ability to collect data from multiple rooms with a single access point.
In [27], the architecture of a real-time control system for heating energy management is described, which combines a field-programmable gate array (FPGA) controller and a cloud backend. In [28], a central heating system with feedback from temperature measurements is described. In this paper, we propose a similar solution to one of the aforementioned examples that takes into account data from several sensors and is suitable for larger buildings, such as multi-family buildings, hotels, schools, offices, etc.
To simplify the evaluation of an HVAC system, some authors [6] limit measurements to a single room. This minimizes the number of controlled HVAC devices and allows for easily repeatable conditions. Some researchers assert that indoor changes are cyclical and that only user experience feedback should be used to determine the performance of the tested control strategy. If the satisfaction level is unchanged, the energy consumed by the HVAC equipment is used as a metric for evaluation [29]. When people feel discomfort, they override automatic settings and the energy consumption of the HVAC system increases. The satisfaction level could be related to the level of thermal discomfort. It is equal to zero if the temperature is within the limits, but out of the limits its value is equal to the quadratic function of temperature deviations. In the same article, the authors emphasize the importance of considering the relation to the outdoor temperature. The heating degree days (HDD) metric can be used for that purpose [30], optionally in combination with metered energy use [31]. Using only HDD is not sufficient to estimate user comfort [32]. However, it is very useful in combination with information of the energy consumed by an HVAC system and information about indoor temperature. Other performance criteria might be used as optimization goals in different HVAC control strategies, including energy consumption, thermal comfort, HVAC runtime, fossil fuel consumption, peak, cost, and CO2 emission [20].

3. Materials and Methods

The high-level design of the proposed architecture involves modification of a computer program run by a local heating controller. The modification involves adjusting the set point of central heating hot water temperature. It can be achieved by either running an optimization sub-procedure on a local low-level controller or with a remote procedure call—for sophisticated algorithms, using data sources such as temperature measurements inside thermal zones or weather forecast services. In this section, we explain in detail how the proposed architecture is applied to a study building to demonstrate its feasibility.

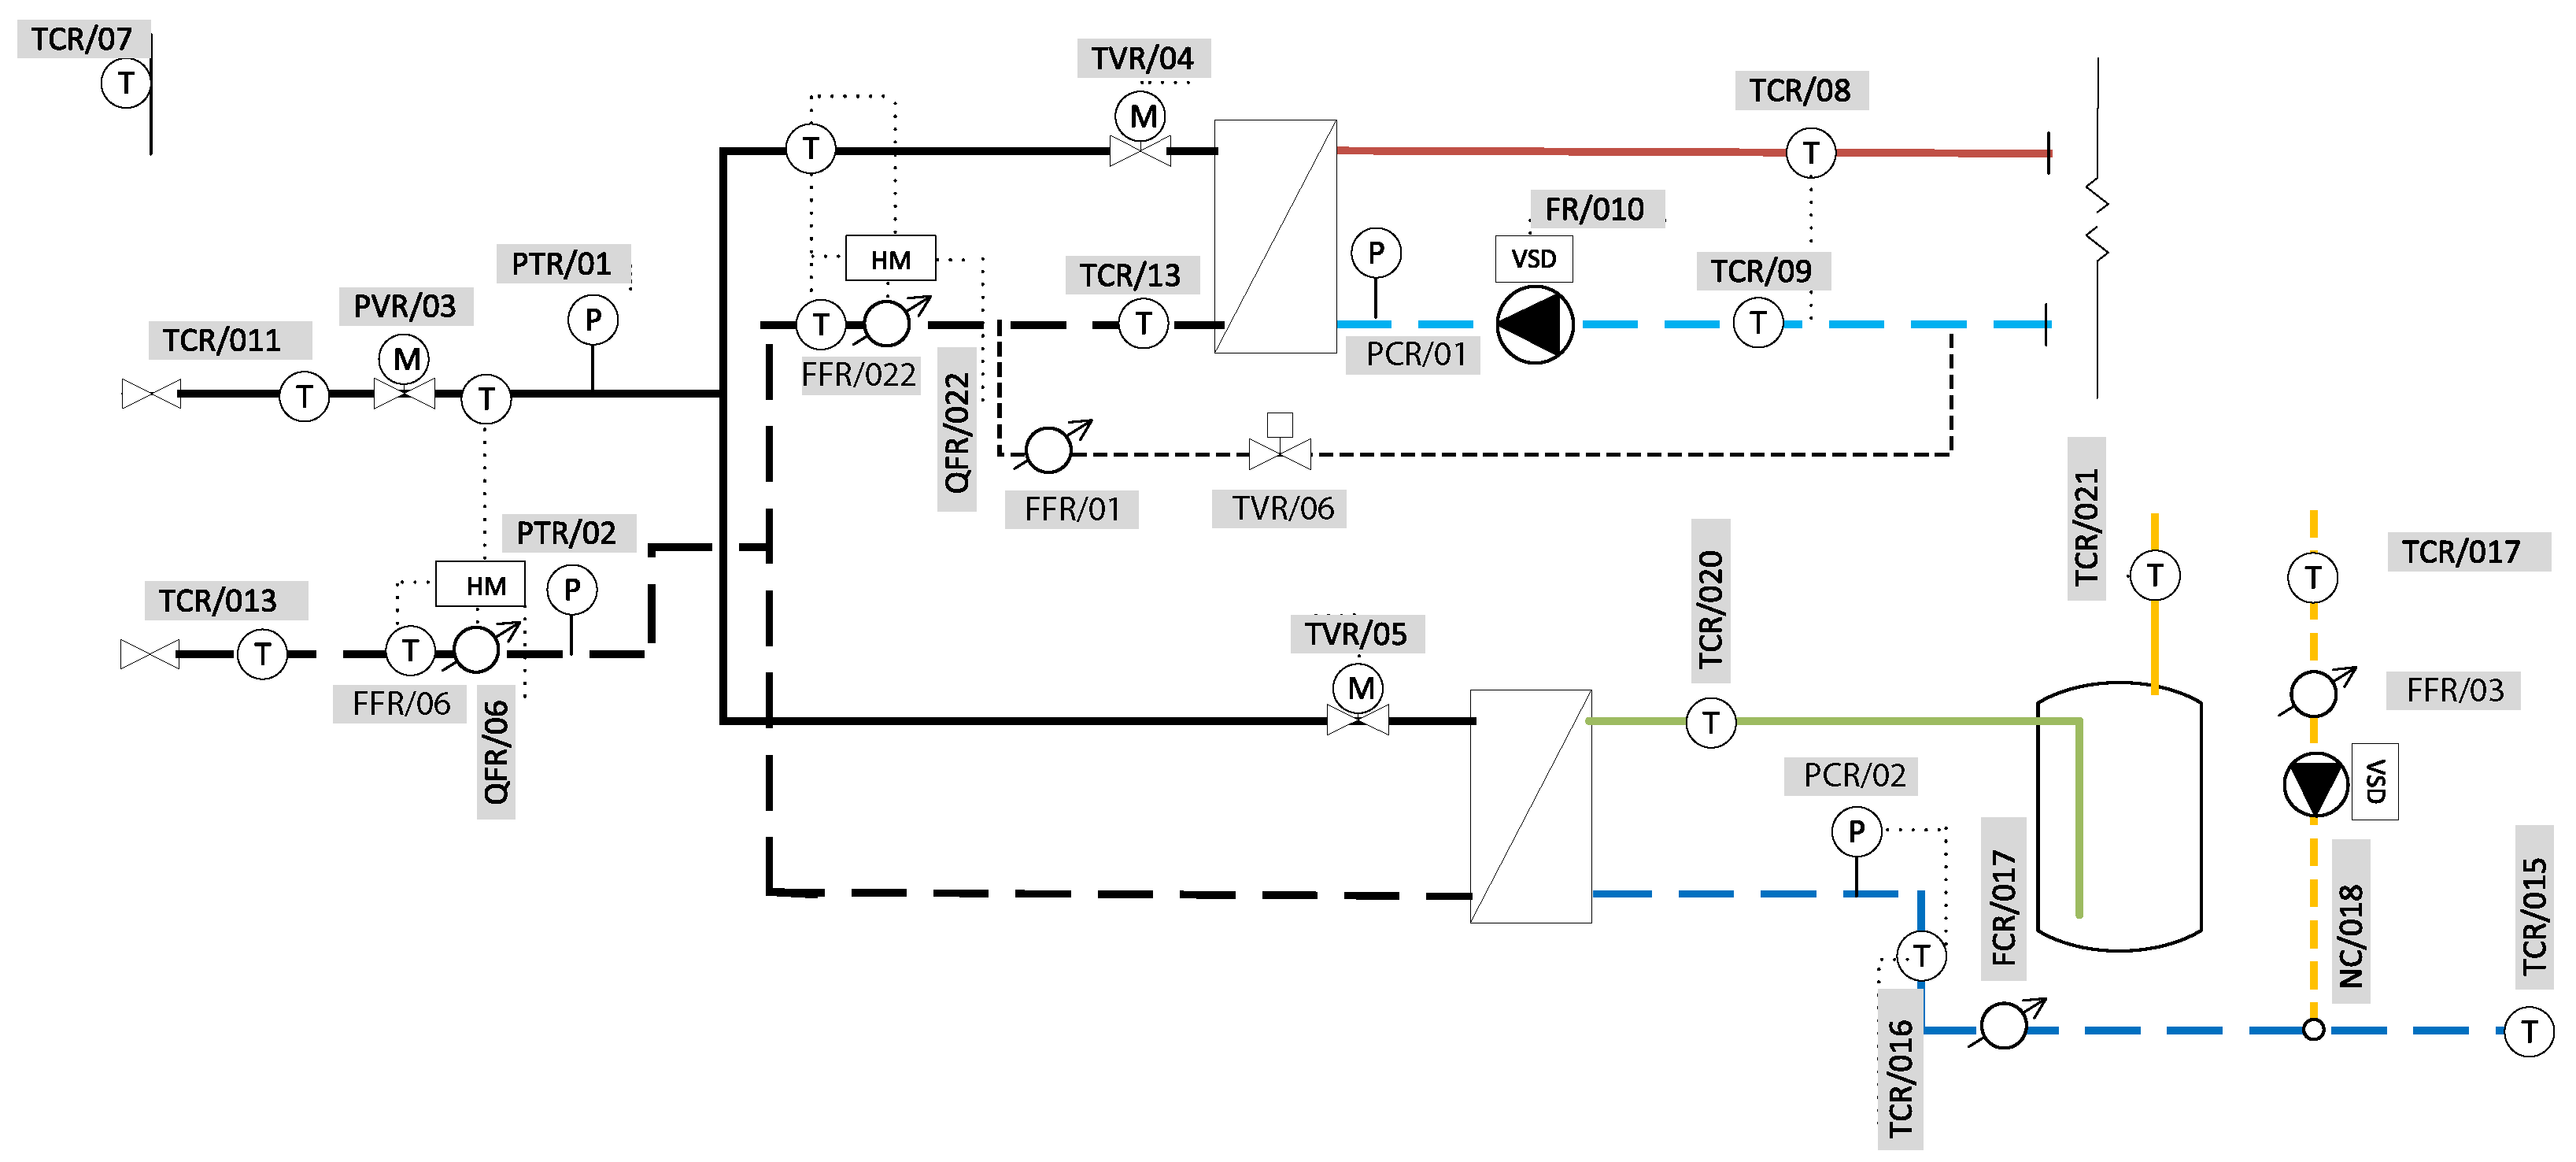
3.1. Integration with the Legacy Heating Control System

To verify the robustness of the proposed solution, we implemented it in a multi-family building located in Warsaw, Poland. The legacy control system schematic is shown in Figure 1. The system has central heating (CH) and domestic hot water (DHW) circuits. The output temperature (measured at TCR/08) of the CH circuit is managed by a PID controller acting on a TVR/04 valve. The output temperature (measured at TCR/020) of the DHW circuit is managed by another PID controller acting on a TVR/05 valve. Both tasks are performed by a local controller: Honeywell Excel Web Ethernet-based, freely-programmable building automation controller. The local controller was configured to automatically connect to a Message Queuing Telemetry Transport (MQTT, ISO/IEC 20922 [33]) broker and to subscribe to a topic where the data coming from optimization algorithms is published. The publisher is a computer program running on the edge router presented in Section 3.4. It aggregates the data received from wireless temperature sensors described in the next subsection. The hardware on which it is running is a custom built extension board for Raspberry Pi Compute Module, with Ethernet interface and LoRa radio interface. The interior of the control room, where the local controller and the edge router were installed, as well as all the hydraulics and controls, are shown in Figure 2.
The local controller has access to the following data sources shown in Figure 1:
TCR07 
Outdoor temperature sensor
TCR13 
Temperature of water returning from the central heating heat exchanger
TCR08 
Temperature of central heating circuit supply water
TCR09 
Temperature of central heating circuit return water
TCR011 
Temperature of supply water from heat plant
TCR013 
Temperature of return water to heat plant
TCR016 
Inlet temperature of domestic hot water after mixing with recirculation line
TCR017 
Temperature of domestic hot water recirculation system
TCR015 
Temperature of tap water flowing into the domestic hot water circuit
TCR020 
Domestic hot water heat exchanger outlet temperature
TCR021 
Temperature of supply domestic hot water
PCR01 
Central heating system pressure
PCR02 
Domestic hot water system pressure
PTR01 
Pressure of supply water from heat plant
PTR02 
Pressure of return water to heat plant
QFR06 
Heat consumed by central heating and domestic hot water
QFR022 
Heat consumed by central heating
FCR017 
Domestic hot water flow meter
FFR01 
Supply water injected into heating circuit water meter
FFR06 
Heat plant return water flow meter
FFR03 
Domestic hot water circulation water meter
FFR022 
Heat plant return water flow meter for central heating circuit
The local controller controls the following elements shown in Figure 1:
NC018 
Speed of the domestic hot water recirculation pump
FR010 
Speed of the central heating circulation pump
PVR03 
Valve controlling pressure difference between supply and return water
TVR04 
Valve controlling the central heating heat exchanger circuit
TVR05 
Valve controlling the domestic hot water heat exchanger
TVR06 
Valve controlling supply water injection into heating circuit

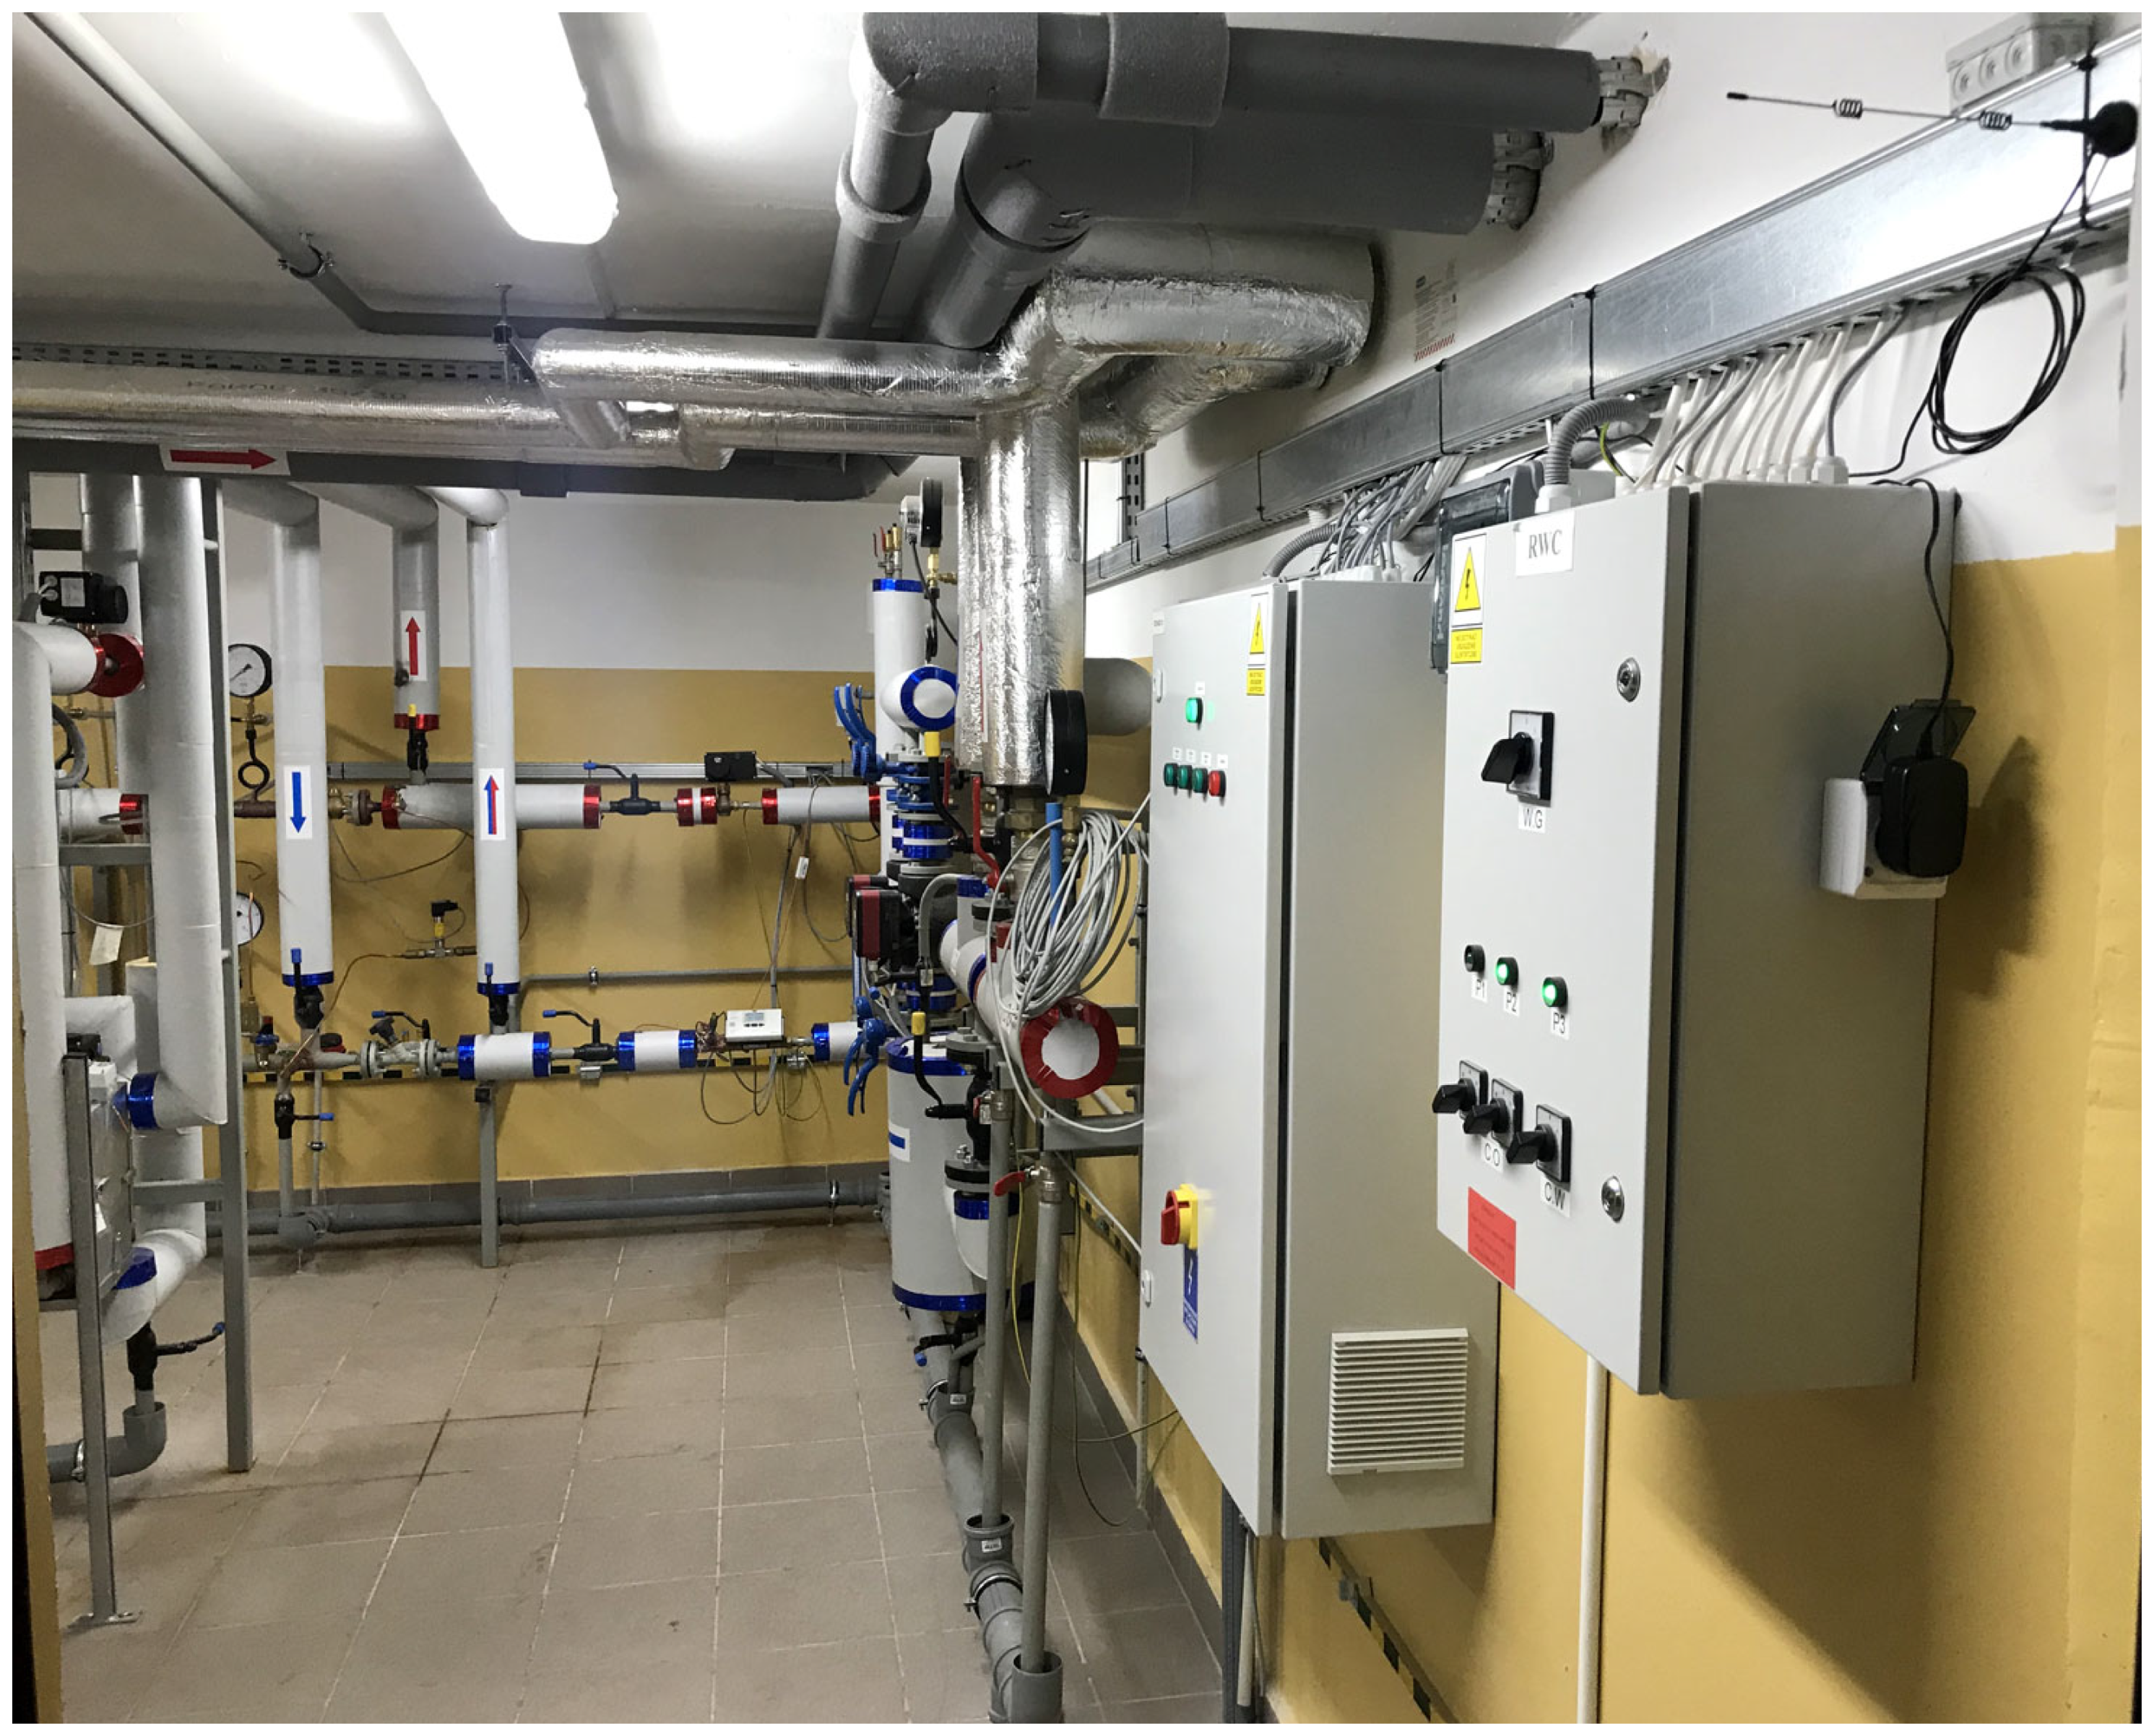
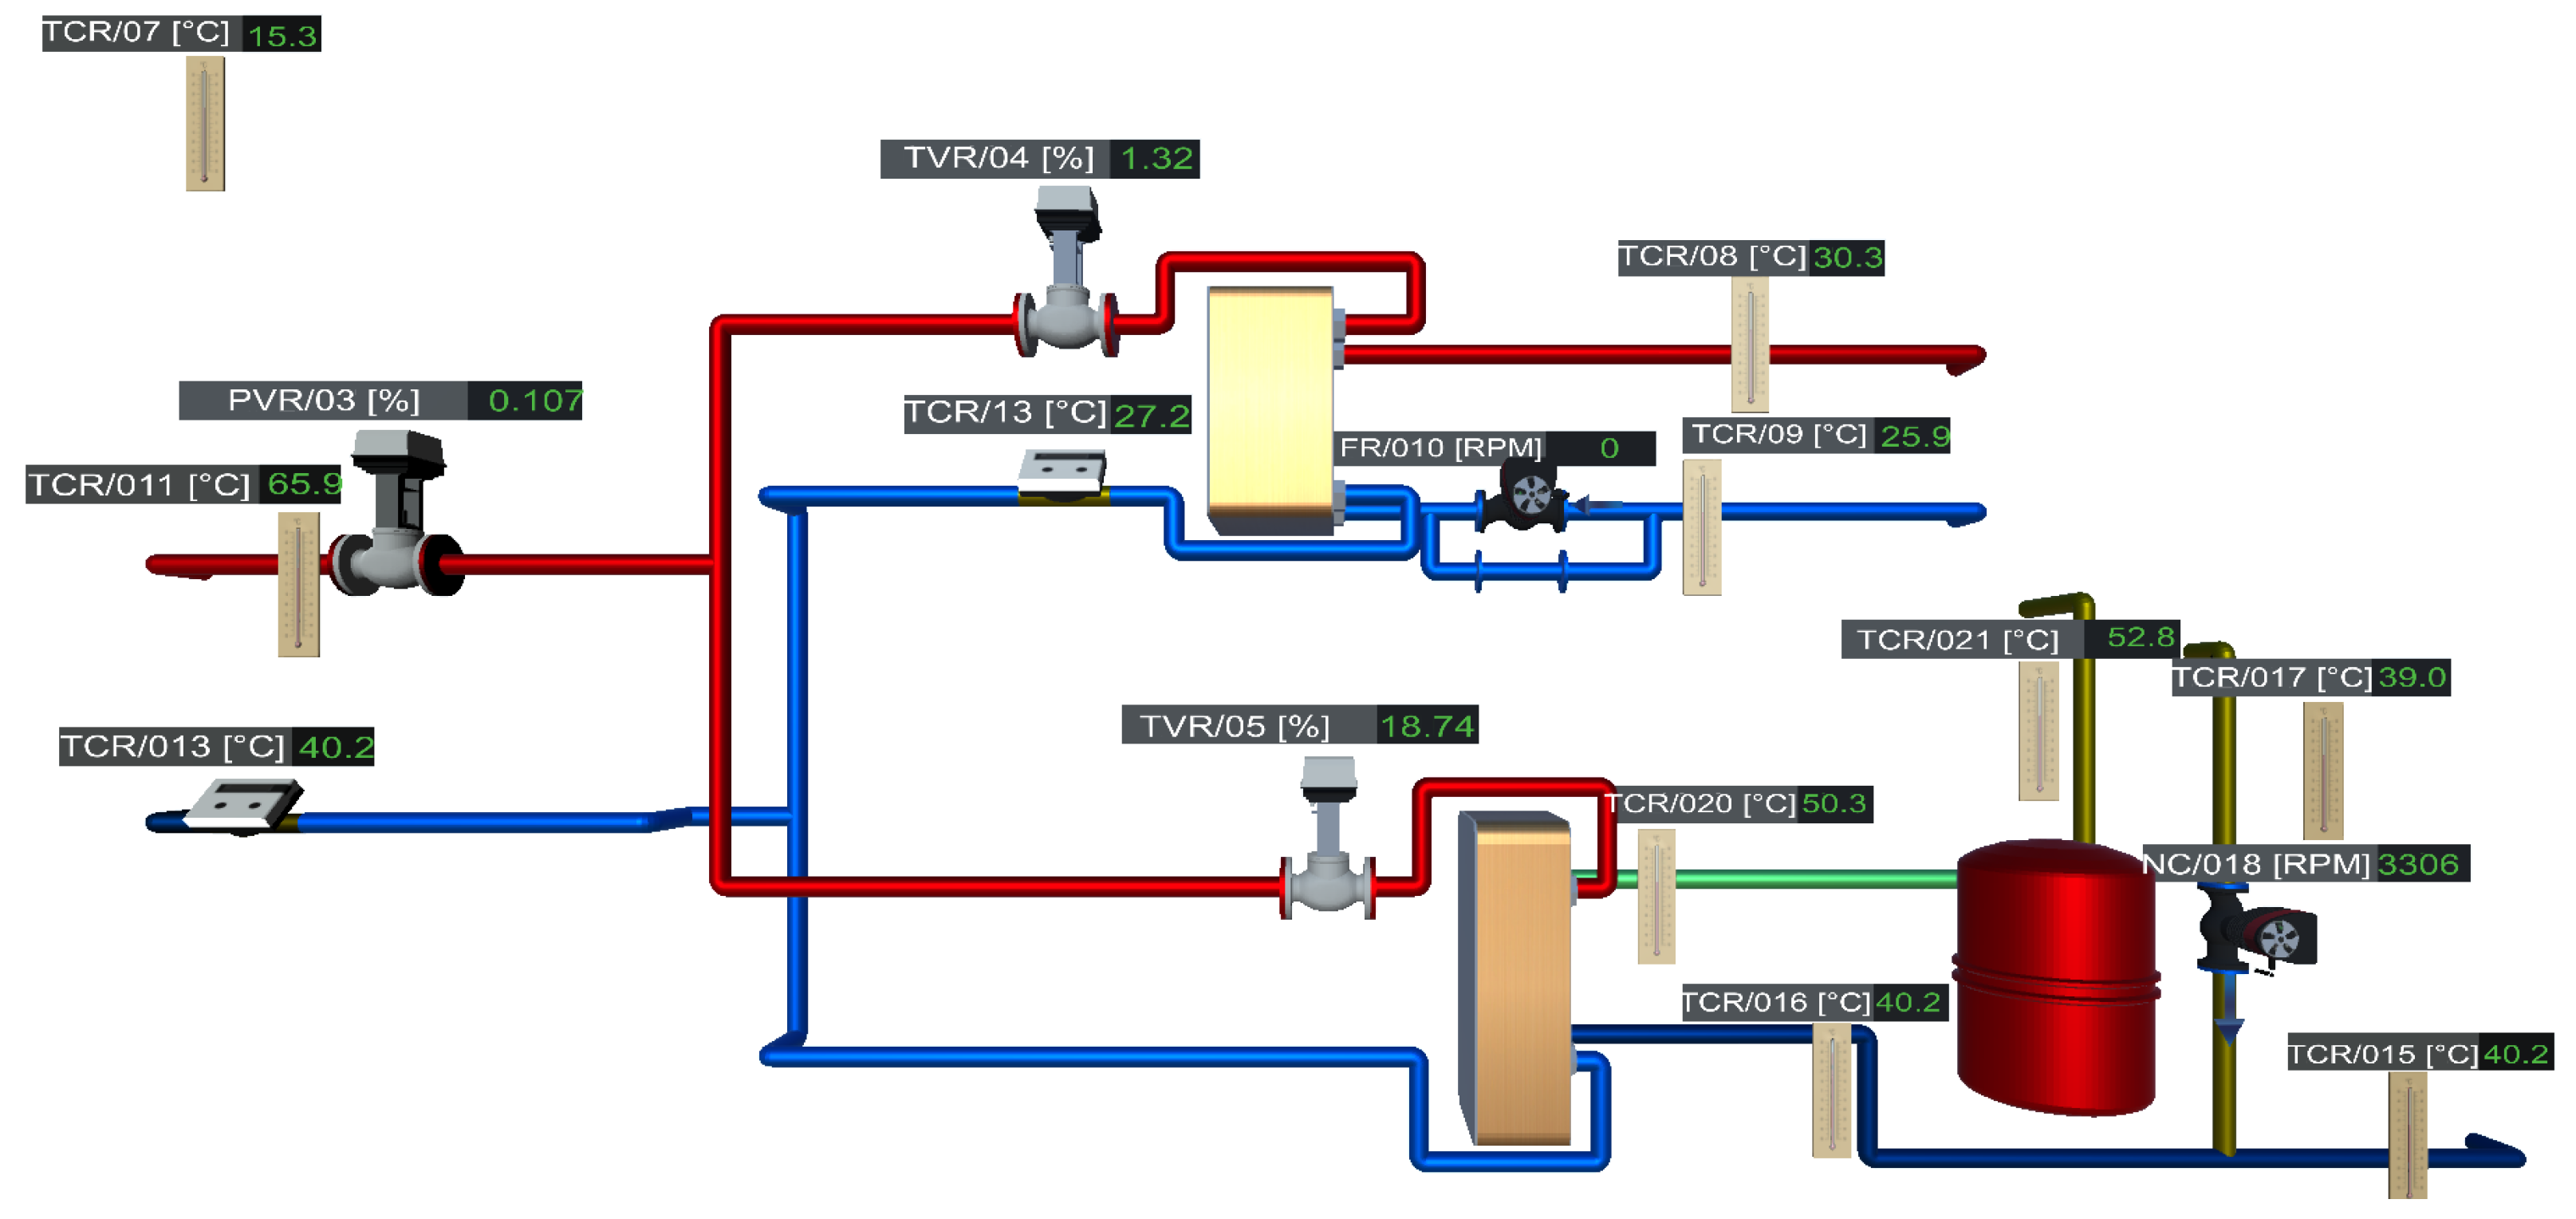
3.2. Process Monitoring

To monitor the behavior of the system, a virtual 3D representation was created. The model has been built in a way that reflects the physical appearance and layout of the equipment in the control room, as shown in Figure 3. Thanks to that, it is relatively easy to read. Every element of the system is represented by a miniature 3D model with an associated label showing its present value. For example, the variable speed pumps are shown as animated fans with speed indicators providing information about their revolutions per minute. All the data are provided in real time by the local controller using the MQTT protocol. The visualization was built with a Unity game engine and compiled with Web Graphics Library (WebGL), so it can be accessed via any modern web browser. It is possible to use a virtual reality set to explore the virtual control room and to inspect all sensors. In case of abnormal operation, a visual notification is shown so a technician can intervene and fix the potential issue.

3.3. Indoor Temperature Measurements

The legacy system lacked equipment to measure indoor temperature in thermal zones. We wanted optimization algorithms to make use of this information, so we installed wireless temperature sensors. The reason for wanting this was that apart from changes in outdoor temperature, insolation, wind speed and direction, humidity, etc., disturbances in heat flux may also be caused by other, less obvious sources, including [34]:
  • Temperature of hot water supplied from district heating;
  • Temperature of water supplied from renewable energy systems;
  • Inhabitants’ heat (60–80 W of heat power per person);
  • Power dissipation from electrical receivers installed in the building.
Disturbances in heat flux can be tracked by measuring the amount of heat transferred to the building. This approach is used in the legacy installation described in this case study. Additional information can be collected by temperature sensors placed in different heat zones inside the building. This gives quick and precise information regarding places where the temperature is changing. The optimization algorithms gain access to new data sources which respond quicker to disturbances in heat flux. With additional information from a weather forecast service, it opens new possibilities for heating-energy optimization algorithms.

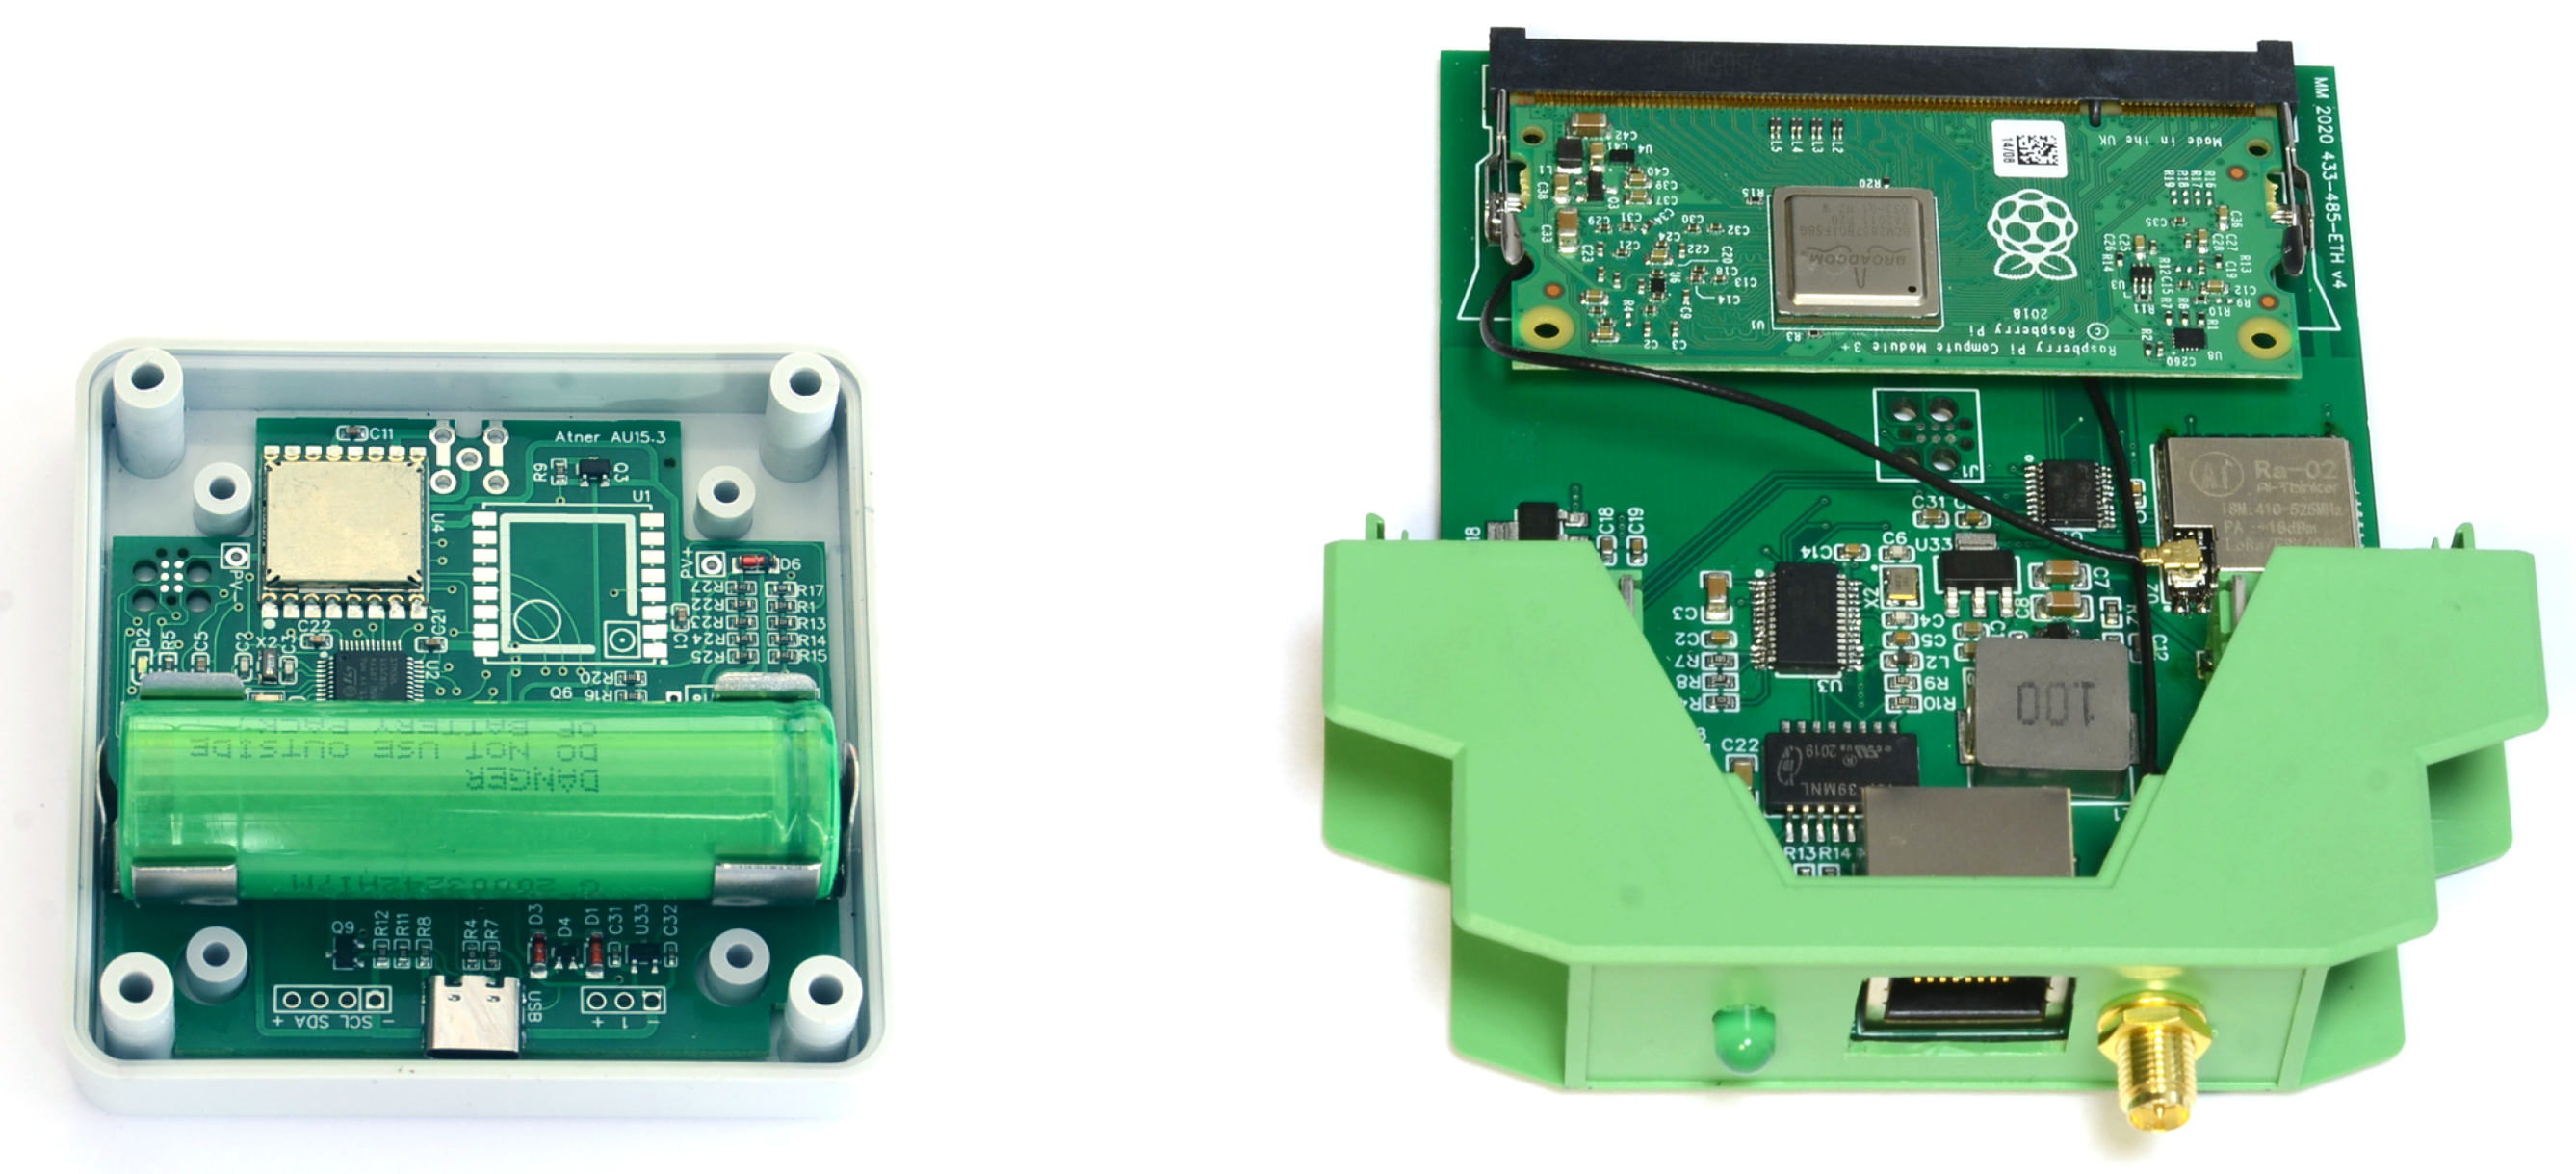
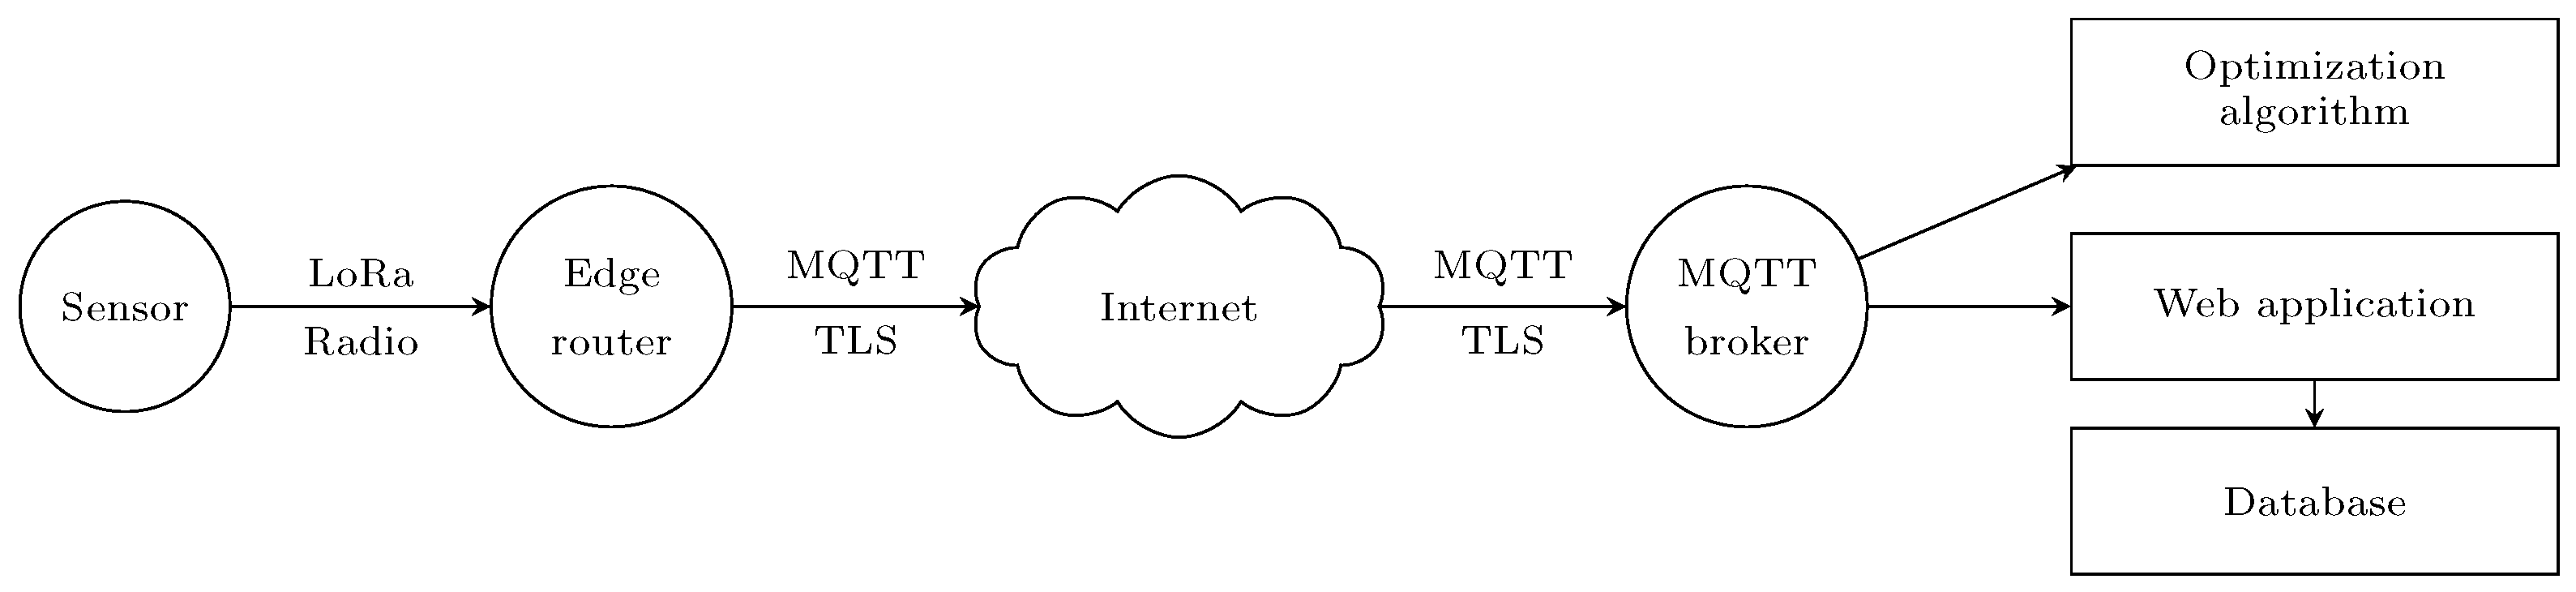
3.4. Wireless Temperature Sensors

To track temperature changes, we used custom-built wireless temperature sensors installed in selected places inside the building. Each sensor has the following subsystems [35]: sensing (temperature measurement), computing (data processing), communication (long-range radio communication), and power (providing system supply voltage). Temperature is measured by a Sensirion temperature sensor [36] which digitalizes readouts and transmits them using an Inter-Integrated Circuit (I2C) interface to a microcontroller. The selected microcontroller responsible for data processing belongs to the STM32L1 family of ultra-low-power System-On-Chips (SOC), which has the following features [37]:
  • Ultra-low-power 32-bit Arm-based Cortex-M0+;
  • 10 KB RAM, 32 KB Flash, 4 KB of data EEPROM;
  • 40 °C to 85 °C operating temperature range;
  • Supply current 1.2 μ A in stop mode with a real-time clock;
  • 1.65 V to 3.6 V supply voltage;
  • USB peripheral communication interface.
Communication is provided by a long-range (LoRa) radio module from Semtech [38] that operates in the 433 MHz band. The device is powered by a lithium battery. The detailed documentation of the devices, including schematics, PCBs, and source codes, is described in [39]. Several versions of the devices have been constructed and tested before installation in the building—one of them is shown in Figure 4.
The effort related to design and implementation of dedicated temperature sensors was justified by the ease of configuration of measurement intervals, full control over encryption mechanisms securing data transmission, and flexibility in adjusting radio transmission power.

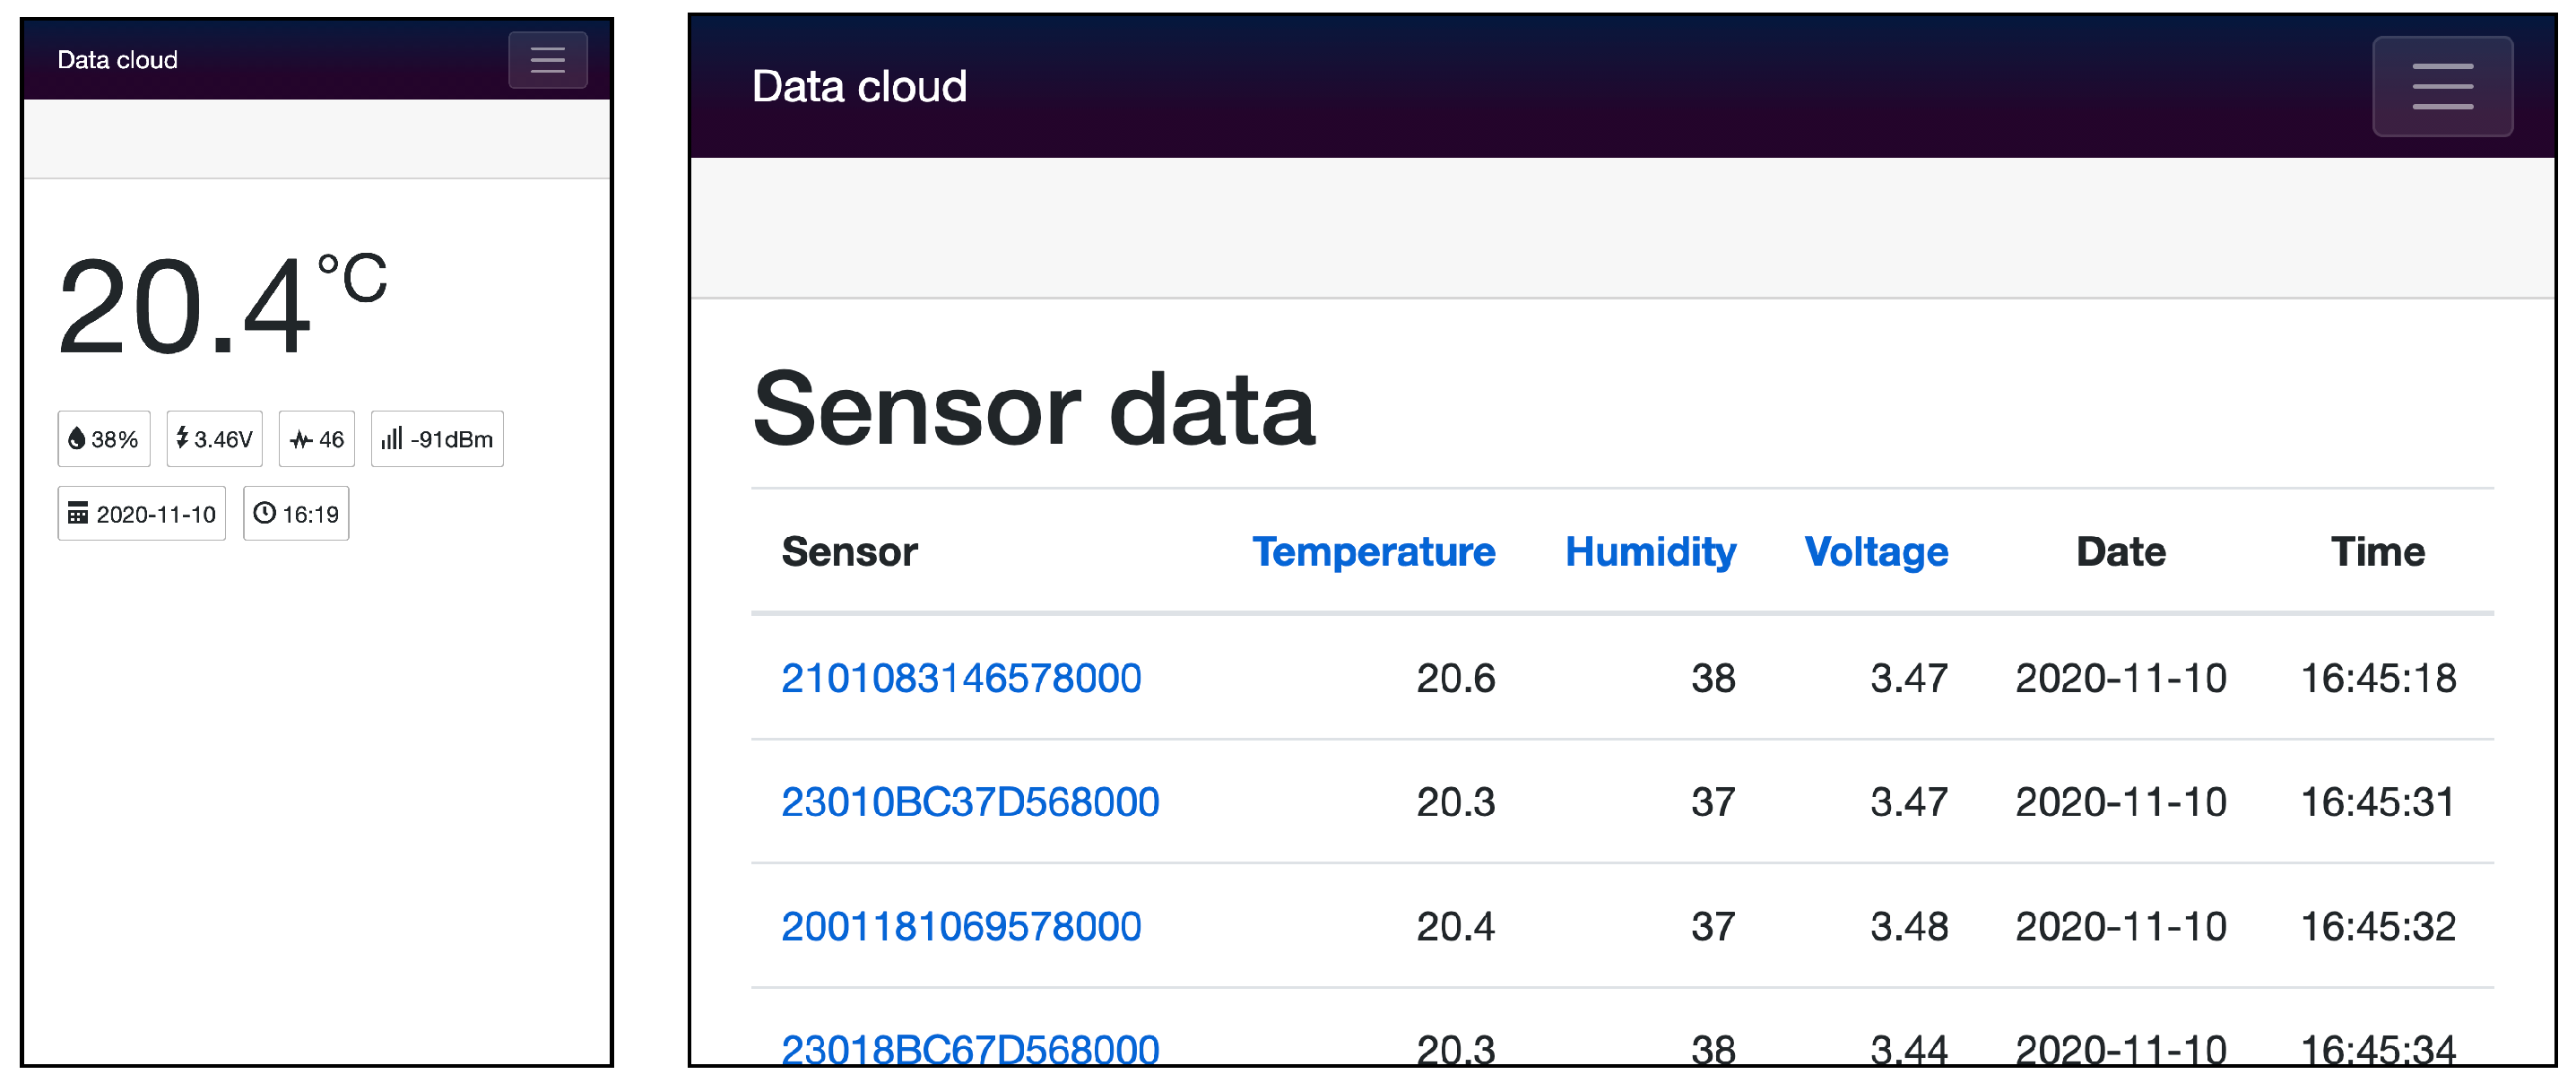
3.5. Temperature Information Collection

Temperature data from wireless sensors are wirelessly transmitted to the edge router using LoRa radio. We installed nine wireless sensors in the selected building. We were able to use only a single edge router due to an excellent radio link budget offered by LoRa radio working in the 433 MHz band. The edge router transmits the data to a Message Queuing Telemetry Transport (MQTT, ISO/IEC 20922) broker. The communication may be optionally encrypted by transport layer security (TLS). The data are then retrieved by a web application written in C# that stores them in a relational database, provides an application programming interface (API) to retrieve historical data, and provides a graphical user interface to read current values. The optimization algorithm described in the next part of this paper also receives the most up-to-date data from the MQTT broker to process it. The information flow is shown in Figure 5.
Any resident of a flat in which a sensor was installed could freely access the readouts by scanning a quick-response code (QR code) placed on the cover of the device. A list containing information about all installed sensors was also available via a web browser. Both screens are shown in Figure 6.

4. Methodology

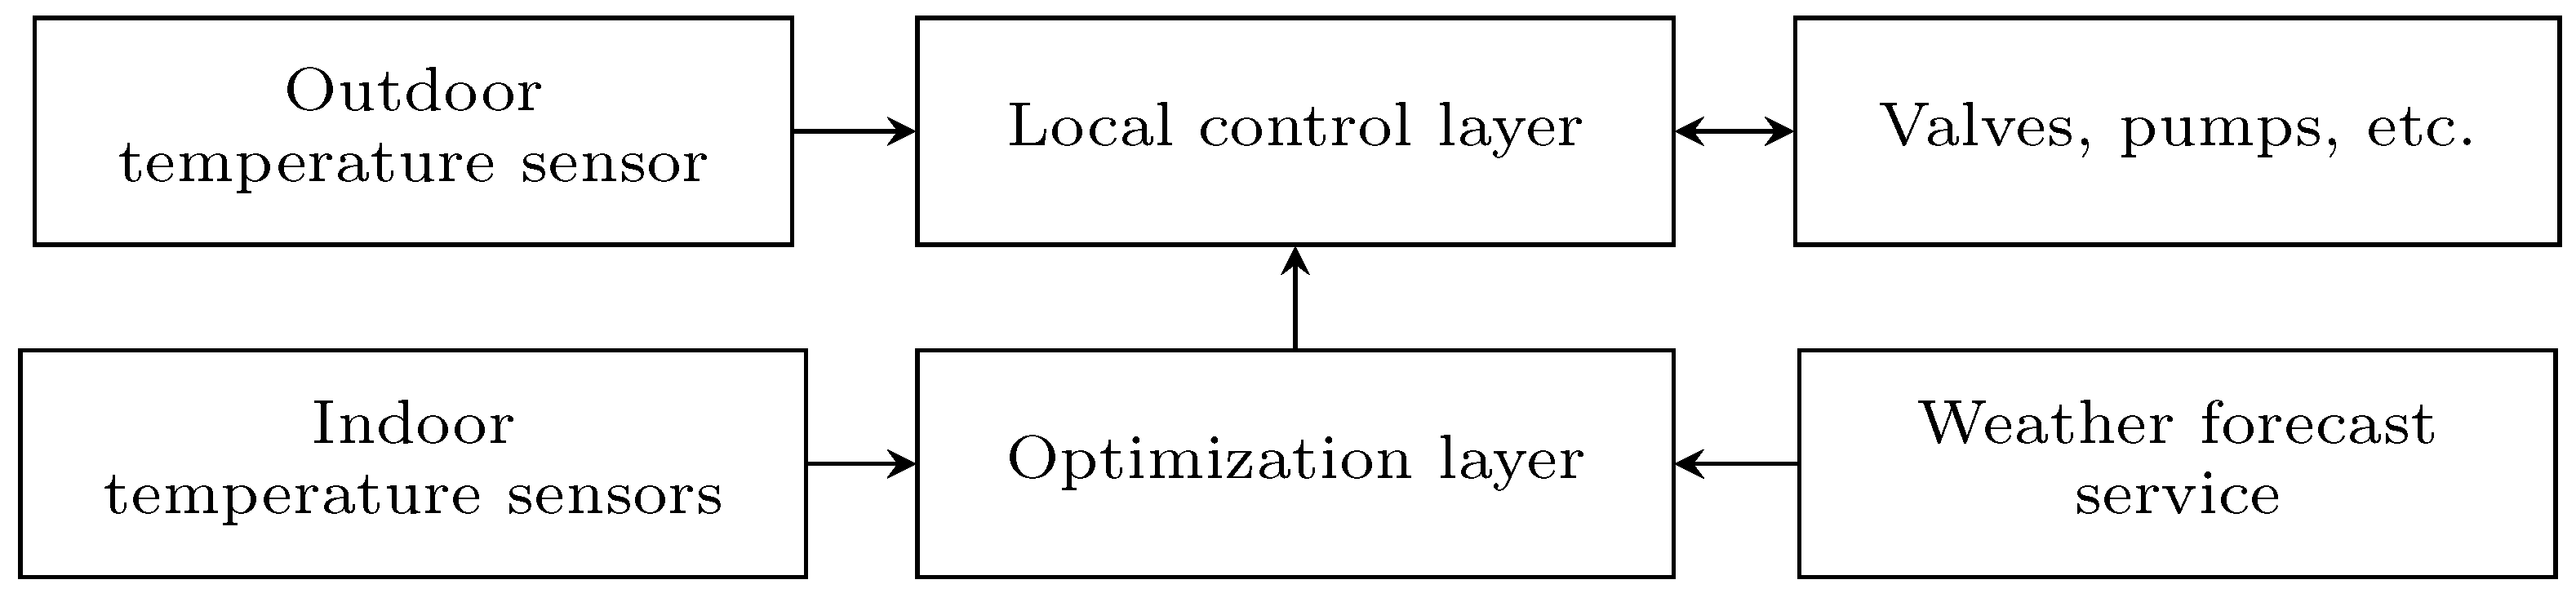
4.1. Control Hierarchy

We designed a two-layer algorithm for heating energy control inside a residential building. The topology of the proposed solution is shown in Figure 7. The basic control algorithm remains almost unchanged. It is executed on a Honeywell Excel Web Ethernet-based programmable building automation controller. It takes information from the outdoor temperature sensor, and using PID algorithms, controls appropriate valves in the building control room. The local controller is connected via MQTT protocol with the edge router (which publishes adjustments to the desired temperature of central heating circuit supply water (TCR/08)) computed by the local controller. In other words, the CH temperature set point computed by the algorithms executed on the legacy hardware is changed according to the value computed by the optimization layer, which also has access to measurements from wireless temperature sensors installed in the building and a weather forecast service.

4.2. Metric

To evaluate the performance of optimization algorithms, we measured the energy consumed by the central heating (CH) installation adjusted with outside temperature. For normalization, a degree days metric—the integral of a function of time that varies with outdoor temperature [40]—can be used (more specifically, heating degree day (HDD), which is designed to quantify the demand for energy required to heat a building [41]). In this study, we use more fine-grained metrics that make use of outdoor temperature measured every hour instead of a daily average. All temperature measurements were made by TCR/07 outdoor temperature sensors. Central heating energy consumption was measured by QFR022 energy meter. Having these values meant we were able to make a measurement and verification (M&V) report [42]. The main advantage of M&V is that it isolates the energy effect after modernization, which is often disturbed by other processes occurring in the facility.
We used the following equation to quantify CH energy consumption:
E 1 ( { t i } i = 1 n ) = i = 1 n Q ( t i ) i = 1 n T ( t i )
where { t i } i = 1 n denotes sequence of length n when the measurements took place. In other words, every element of this sequence is the time of measurement. Q ( t ) is heating power used by CH installation at time t. T ( t ) is defined as follows, similarly to definitions in [40,41]:
T ( t ) = 0 for temperature x in ° C at time t such as x > 18   ° C 18 x for temperature x in ° C at time t such as x 18   ° C
The metric defined by (1) quantifies the ratio of total energy consumption during a specific period to the difference between the temperature outside and 18 ° C (for all hours when the temperature was lower than 18 ° C ), summed over the same time period. A lower value of the metric means more effective usage of the thermal energy. The reference temperature of 18 ° C is the base temperature for European countries [43,44,45]. As a secondary metric, we used the following equation to quantify thermal discomfort related to underheating:
E 2 ( { t i } i = 1 n ) = 1 n i = 1 n D ( t i )
where { t i } i = 1 n denotes sequence of length n when the measurements took place. In other words, every element of this sequence is the time of measurement. D ( t ) is thermal discomfort at time t. D ( t ) is defined as follows, similarly to the definition in [29]:
D ( t ) = 0 for temperature x in ° C at time t such as x > 21   ° C ( 21 x ) 2 for temperature x in ° C at time t such as x 21   ° C
The reference temperature of 21 ° C is the recommended indoor temperature in living spaces of a residential building [40]. As a tertiary metric, we used the following equation to quantify overheating:
E 3 ( { t i } i = 1 n ) = 1 n i = 1 n O ( t i )
where { t i } i = 1 n denotes sequence of length n when the measurements took place, providing that on the day of the measurement the outdoor temperature was less than 21 ° C . In other words, every element of this sequence is the time of measurement. O ( t ) is overheating at time t. O ( t ) is defined as follows:
O ( t ) = x 21 for temperature x in ° C at time t such as x > 21   ° C 0 for temperature x in ° C at time t such as x 21   ° C
The reference temperature of 21 ° C is the recommended indoor temperature in living spaces of a residential building [40]. When the HVAC system causes the indoor temperature to exceed this threshold, it means that it works ineffectively.

4.3. Measurements

The measurements were made from April, 2021 to May, 2022. The data are publicly available in a form of comma-separated values (CSV) files [46]. We used R environment for statistical computing [47] to create a M&V report and calculate energy efficiency (1), as well as underheating (2) and overheating (3) indices for different optimization algorithms.
The control loop of the legacy local controller is presented in a simplified form as Algorithm 1. In an infinite loop, the outdoor temperature and the temperature of central heating circuit supply water are used to derive the set point of central heating circuit supply water (line 3). In the legacy system, it is immediately followed by the execution of control logic code responsible for setting valves and pumps in order to reach that set point (as shown in line 5). However, in the proposed solution, before execution, the value of the set point could be modified by a selected optimization algorithm (in line 4). From the software engineering point of view, it resembles a Strategy behavioral design pattern [48]. It simplifies the definition of a family of algorithms and makes them interchangeable. This way, the complexity and details of the optimization function are separated from the legacy system.
The performance of the new implementation was tested with different optimization algorithms, e.g., the function call in line 4 of Algorithm 1 was referring to various algorithms that were altering the set point of TCR08.
Algorithm 1 Central heating control loop
Input :   TCR07 Outdoor temperature Input :   TCR08    Present value of temperature of central heating circuit supply water 1 : while true do 2 : Update values of TCR07 and TCR08        Communicates with sensors to read present values 3 :    spTCR08 COMPUTE ( TCR07 , TCR08 )       Computes the set point using the legacy algorithm 4 :    spTCR08 OPTIMIZE ( spTCR08 ) Adjusts set point of temperature of central heating circuit supply water 5 : EXECUTE ( spTCR08 ) Executes control logic to set valves and pumps in order to reach spTCR08 . 6 : end while
Optimization algorithms do not control any specific actuators shown in Figure 1. They modify only the set point of TCR08—the temperature of central heating circuit supply water. For that reason, we were able to measure differences in their performance and directly compare them. Low-level control mechanisms, including control over all the valves and pumps, were preserved as the source code of the local controller and were left unchanged.

5. Results

Comparison of energy consumption of the central heating system controlled by different optimization algorithms is shown in Table 1. The recorded measurement data clearly show variations in the performance of the different algorithms. By calculating the ratio of consumed thermal energy to the degree-hours in a period when a specific optimization algorithm was running, we can directly compare them. We see that Algorithm I outperforms Algorithms II and III in terms of energy consumption. The proposed method of normalization of energy consumption in relation to the outdoor temperature seems to be working, because values computed by (1) provide consistent results for each algorithm independently from the time of the year when the test took place. In the last two months, various algorithms were tested, so we did not assign data from this period to any algorithm. Comparison of underheating and overheating indices for different algorithms is shown in Table 2. The lower the values of E 2 and E 3 , the better. Algorithms II and III are comparable. However, Algorithm II obviously overheats the building. The description of Algorithms I–III is a trade secret. For legal reasons, we cannot provide their description, nor can we provide the baseline energy consumption, i.e., what the performance of Algorithm 1 is, without adjusting the set point of the temperature of the central heating circuit supply water.
Apart from implementation details regarding computations made by optimization algorithms, we see that they indeed influence energy consumption while the system is still under supervision of the legacy controller, ensuring proper functioning of low-level mechanisms. The measurements show that there are differences in the algorithms’ performance. However, determining what difference is considered to be significant, and then deciding which algorithm is better, requires additional research.

6. Discussion

The presented results demonstrate that it is possible to significantly influence the performance of the legacy heating control system by algorithms that only adjust the set point of temperature of central heating circuit supply water. Details regarding the optimization algorithms’ implementation are outside the scope of this article, but the performance metric clearly shows differences in their effectiveness.
The main implication of the presented results for legacy central heating installations is that optimization algorithms using data from external sources (like wireless temperature sensors) can be seamlessly added, even if the legacy controller has no proper communication interfaces to establish direct communication. Existing communication protocols like TCP, or more specifically, MQTT, can be used to exchange the data with an external processing unit that carries out the necessary computations and is equipped with appropriate communication interfaces.
The split between the legacy controller specialized in orchestrating valves, pumps, etc., and the optimization unit responsible for adjusting the set point of the temperature of central heating circuit supply water is clearly defined. Another advantage of that solution is that software engineers can operate on a platform of their choice (in our case it was an edge router with Raspberry Pi Compute Module, shown in Figure 4), instead of learning the nuances of the legacy platform designed to perform much simpler operations without the capability of running, for example, Python or Matlab code. More advanced solutions involving artificial intelligence and machine learning can also be introduced in a similar way. In particular, we want to apply a reinforcement learning training method by rewarding central heating control strategies that minimize E 1 , E 2 , and E 3 indices. The learning agent should be able to find improved adjustments of the TCR08 set point by learning through trial and error.
The main disadvantage of the proposed solution is that it requires some modifications of the legacy controller control logic. The effect of scale is hard to achieve, as every modification of the existing CH installation requires spending time and resources on learning the legacy controller. For old installations, source codes might not be available, making modifications painful and time-consuming. Deeper analysis is required to learn when performance improvement, time and material costs, and system complexity justify modifications of the existing system instead of simply replacing it. The proposed architecture is very scalable—it can be used in any central heating system with a local controller capable of running injected programming code to communicate with an external optimization algorithm. Thus, it can be used in a single-family or a multi-family building as well as in an office. Algorithms can run either on local machines or in the cloud, which further increases system scalability and reliability.

7. Conclusions and Future Work

This paper presents the architecture for the evaluation of central heating control algorithms that enhance the local control layer with optimization algorithms that have access to additional information. This method lowers requirements regarding connectivity and computing capabilities of the local central heating control unit while offering a framework to implement and evaluate modern control algorithms. The optimization layer is affecting only a single control variable—the desired temperature of central heating circuit supply water. The communication between layers is provided by ISO-recommended MQTT protocol. It means that optimization algorithms, which have additional information from wireless indoor temperature sensors, a weather forecast service, or from other data sources, can run on either a locally installed edge router or on a powerful cloud-based backend, depending on memory and computational requirements. The empirical verification of the proposed architecture was carried out and successfully tested in a residential building in Warsaw, Poland.
In the future, we want to use the method described in this paper to evaluate a set of machine learning control algorithms and compare the obtained results with simulations provided by the whole-building energy modeling engine EnergyPlus and the Transient System Simulation Tool.

Author Contributions

Conceptualization, M.M. and A.S.; methodology, M.M. and A.S.; software, M.M. and S.J.; validation, M.M.; formal analysis, M.M. and A.B.; investigation, M.M., A.S., J.G., T.S., S.J., D.L. and K.B.; resources, M.M., S.J. and T.S.; data curation, M.M.; writing—original draft preparation, M.M. and S.J.; writing—review and editing, M.M. and A.B.; visualization, S.J. and M.M. All authors have read and agreed to the published version of the manuscript.

Funding

This research was funded by National Centre for Research and Development (NCBR) grant number POIR.01.02.00-00-0308/17.

Data Availability Statement

Data are available at GitHub [46].

Acknowledgments

The authors want to thank Jerzy Bagiński and Robert Gilewski for their technical expertise and Isabelle Thompson for proofreading. We would like to thank the reviewers for their thoughtful comments and efforts towards improving the article.

Conflicts of Interest

The authors declare no conflict of interest. The funders had no role in the design of the study; in the collection, analyses, or interpretation of data; in the writing of the manuscript; or in the decision to publish the results.

References

  1. Cheng, C.C.; Lee, D. Artificial Intelligence-Assisted Heating Ventilation and Air Conditioning Control and the Unmet Demand for Sensors: Part 1. Problem Formulation and the Hypotesis. Sensors 2019, 19, 1131. [Google Scholar] [CrossRef] [PubMed] [Green Version]
  2. Ahmad, M.W.; Mourshed, M.; Yuce, B.; Rezgui, Y. Computational intelligence techniques for HVAC systems: A review. Build. Simul. 2016, 9, 359–398. [Google Scholar] [CrossRef] [Green Version]
  3. European Parliament and of the Council. Directive 2002/91/EC of the European Parliament and of the Council of 16 December 2002 on the Energy Performance of Buildings. Available online: https://eur-lex.europa.eu/LexUriServ/LexUriServ.do?uri=OJ:L:2003:001:0065:0071:en:PDF (accessed on 20 July 2023).
  4. Bielecki, A.; Ernst, S.; Skrodzka, W.; Wojnicki, I. Concentrated Solar Power Plants with Molten Salt Storage: Economic Aspects and Perspectives in the European Union. Int. J. Photoenergy 2019, 2019, 8796814. [Google Scholar] [CrossRef] [Green Version]
  5. Bielecki, A.; Ernst, S.; Skrodzka, W.; Wojnicki, I. The externalities of energy production in the context of development of clean energy generation. Environ. Sci. Pollut. Res. 2020, 27, 11506–11530. [Google Scholar] [CrossRef] [PubMed] [Green Version]
  6. Prívara, S.; Cigler, J.; Váňa, Z.; Oldewurtel, F.; Sagerschnig, C.; Žáčeková, E. Building modeling as a crucial part for building predictive control. Energy Build. 2013, 56, 8–22. [Google Scholar] [CrossRef]
  7. Ku, K.L.; Liaw, J.S.; Tsai, M.Y.; Liu, T.S. Automatic Control System for Thermal Comfort Based on Predicted Mean Vote and Energy Saving. IEEE Trans. Autom. Sci. Eng. 2015, 12, 378–383. [Google Scholar] [CrossRef]
  8. Kardos, T.; Kutasi, D.N.; György, K. Control strategies for HVAC systems. In Proceedings of the 2019 IEEE 19th International Symposium on Computational Intelligence and Informatics and 7th IEEE International Conference on Recent Achievements in Mechatronics, Automation, Computer Sciences and Robotics (CINTI-MACRo), Szeged, Hungary, 14–16 November 2019; pp. 65–70. [Google Scholar] [CrossRef]
  9. Wani, M.; Swain, A.; Ukil, A. Control Strategies for Energy Optimization of HVAC Systems in Small Office Buildings using EnergyPlusTM. In Proceedings of the 2019 IEEE Innovative Smart Grid Technologies—Asia (ISGT Asia), Chengdu, China, 21–24 May 2019; pp. 2698–2703. [Google Scholar] [CrossRef]
  10. Peng, Y.; Lei, Y.; Tekler, Z.; Antanuri, N.; Lau, S.K.; Chong, A. Hybrid system controls of natural ventilation and HVAC in mixed-mode buildings: A comprehensive review. Energy Build. 2022, 276, 112509. [Google Scholar] [CrossRef]
  11. Afram, A.; Janabi-Sharifi, F. Theory and applications of HVAC control systems—A review of model predictive control (MPC). Build. Environ. 2014, 72, 343–355. [Google Scholar] [CrossRef]
  12. Behrooz, F.; Mariun, N.; Marhaban, M.H.; Radzi, M.A.M.; Ramli, A.R. Review of Control Techniques for HVAC Systems—Nonlinearity Approaches Based on Fuzzy Cognitive Maps. Energies 2018, 11, 495. [Google Scholar] [CrossRef] [Green Version]
  13. Naidu, D.S.; Rieger, C.G. Advanced control strategies for heating, ventilation, air-conditioning, andrefrigeration systems—An overview: Part I: Hard control. HVAC&R Res. 2011, 17, 2–21. [Google Scholar] [CrossRef]
  14. Naidu, D.S.; Rieger, C.G. Advanced control strategies for heating, ventilation, air-conditioning, andrefrigeration systems—An overview: Part II: Soft and fusion control. HVAC&R Res. 2011, 17, 144–158. [Google Scholar] [CrossRef]
  15. Gokhale, P.; Bhat, O.; Bhat, S. Introduction to IOT. Int. Adv. Res. J. Sci. Eng. Technol. 2018, 5, 41–44. [Google Scholar]
  16. McLeod, R.D.; Ferens, K.; Friesen, M.R. The IoT: Examples and Trends. In Proceedings of the 2015 International Conference on Computational Science and Computational Intelligence (CSCI), Las Vegas, NV, USA, 7–9 December 2015; pp. 336–339. [Google Scholar] [CrossRef]
  17. Izhar; Wang, X.; Xu, W.; Tavakkoli, H.; Yuen, Z.; Shan, X.; Lee, Y.K. Integrated Predicted Mean Vote Sensing System Using MEMS Multi-Sensors for Smart HVAC Systems. IEEE Sens. J. 2021, 21, 8400–8410. [Google Scholar] [CrossRef]
  18. Tekler, Z.D.; Lei, Y.; Peng, Y.; Miller, C.; Chong, A. A hybrid active learning framework for personal thermal comfort models. Build. Environ. 2023, 234, 110148. [Google Scholar] [CrossRef]
  19. Tekler, Z.; Low, R.; Gunay, B.; Andersen, R.; Blessing, L. A Scalable Bluetooth Low Energy Approach to Identify Occupancy Patterns and Profiles in Office Spaces. Build. Environ. 2020, 171, 106681. [Google Scholar] [CrossRef]
  20. Esrafilian-Najafabadi, M.; Haghighat, F. Occupancy-based HVAC control systems in buildings: A state-of-the-art review. Build. Environ. 2021, 197, 107810. [Google Scholar] [CrossRef]
  21. Markiewicz, M. An event-based language for simplified definition of home automation control routines. In Proceedings of the 2015 International Conference on Event-Based Control, Communication, and Signal Processing (EBCCSP), Kraków, Poland, 17–19 June 2015; pp. 1–6. [Google Scholar] [CrossRef]
  22. Ke, J.; Qin, Y.; Wang, B.; Shundong, Y.; Wu, H.; Yang, H.; Zhao, X. Data-Driven Predictive Control of Building Energy Consumption under the IoT Architecture. Wirel. Commun. Mob. Comput. 2020, 2020, 8849541. [Google Scholar] [CrossRef]
  23. Sugarman, S. Testing and Balancing HVAC Air and Water Systems; River Publishers: Aalborg, Denmark, 2022. [Google Scholar]
  24. Tian, G.; Sun, Q.Z.; Wang, W. Real-Time Flexibility Quantification of a Building HVAC System for Peak Demand Reduction. IEEE Trans. Power Syst. 2022, 37, 3862–3874. [Google Scholar] [CrossRef]
  25. Liu, Z.J.; Qi, W.H.; Jia, Z.; Huang, P. System integration control of HVAC in intelligent building. In Proceedings of the 2004 International Conference on Machine Learning and Cybernetics (IEEE Cat. No.04EX826), Shanghai, China, 26–29 August 2004; Volume 2, pp. 1125–1128. [Google Scholar] [CrossRef]
  26. Islam, F.B.; Ifeanyi Nwakanma, C.; Kim, D.S.; Lee, J.M. IoT-Based HVAC Monitoring System for Smart Factory. In Proceedings of the 2020 International Conference on Information and Communication Technology Convergence (ICTC), Jeju, Republic of Korea, 21–23 October 2020; pp. 701–704. [Google Scholar] [CrossRef]
  27. Prusak, D.; Karpiel, G.; Kułakowski, K. The Architecture of a Real-Time Control System for Heating Energy Management in the Intelligent Building. Energies 2021, 14, 5402. [Google Scholar] [CrossRef]
  28. Björsell, N. Control Strategies for Heating Systems. Available online: http://www.ibpsa.org/proceedings/bs1997/bs97_p061.pdf (accessed on 28 March 2023).
  29. Parshin, M.; Ryzhov, A.; Gryazina, E. Experimental Study of Control Strategies for HVAC Systems. In Proceedings of the 2019 International Youth Conference on Radio Electronics, Electrical and Power Engineering (REEPE), Moscow, Russia, 14–15 March 2019; pp. 1–6. [Google Scholar] [CrossRef]
  30. Ntsaluba, S.B.K.; Malatji, E.M. Energy Usage Modelling for Residences of a South African Academic Institution. In Proceedings of the 2018 International Conference on Intelligent and Innovative Computing Applications (ICONIC), Mon Tresor, Mauritius, 6–7 December 2018; pp. 1–5. [Google Scholar] [CrossRef]
  31. Corgnati, S.; Corrado, V.; Filippi, M. A method for heating consumption assessment in existing buildings: A field survey concerning 120 Italian schools. Energy Build. 2008, 40, 801–809. [Google Scholar] [CrossRef]
  32. Utkarsh, U.; Framewala, A.; Natarajan, M. Energy Consumption Prediction using Degree Days based on Comfort Temperature. In Proceedings of the 2021 8th International Conference on Future Internet of Things and Cloud (FiCloud), Rome, Italy, 23–25 August 2021; pp. 128–133. [Google Scholar] [CrossRef]
  33. ISO/IEC 20922:2016; Information Technology—Message Queuing Telemetry Transport (MQTT) v3.1.1. ISO: Geneva, Switzerland, 2016.
  34. Karmacharya, S.; Putrus, G.; Underwood, C.; Mahkamov, K. Thermal modelling of the building and its HVAC system using Matlab/Simulink. In Proceedings of the 2012 2nd International Symposium on Environment Friendly Energies and Applications, Newcastle Upon Tyne, UK, 25–27 June 2012; pp. 202–206. [Google Scholar] [CrossRef] [Green Version]
  35. Kuorilehto, M.; Kohvakka, M.; Suhonen, J.; Hamalainen, P.; Hannikainen, M.; Hamalainen, T.D. Ultra-Low Energy Wireless Sensor Networks in Practice: Theory, Realization and Deployment; Wiley Publishing: Chichester, UK, 2008. [Google Scholar]
  36. SHT3x-DIS Datasheet Humidity and Temperature Sensor. Available online: https://sensirion.com/media/documents/213E6A3B/63A5A569/Datasheet_SHT3x_DIS.pdf (accessed on 19 May 2023).
  37. STM32L151x6/8/B, STM32L152x6/8/B Datasheet. Available online: https://www.st.com/resource/en/datasheet/stm32l151c8.pdf (accessed on 4 November 2022).
  38. SX1276/77/78/79–137 MHz to 1020 MHz Low Power Long Range Transceiver Datasheet. Available online: https://semtech.file.force.com/sfc/dist/version/download/?oid=00DE0000000JelG&ids=0682R000006TQEPQA4&d=%2Fa%2F2R0000001Rbr%2F6EfVZUorrpoKFfvaF_Fkpgp5kzjiNyiAbqcpqh9qSjE&operationContext=DELIVERY&asPdf=true (accessed on 30 November 2022).
  39. Markiewicz, M. Ultra-Low Power Wireless Sensor with Lora Radio Transceiver. Available online: https://github.com/mmr01/iot/blob/5815f3527ea933dd1a9d4f07be548127bae65bf2/Markiewicz%20Ultra-low%20power%20wireless%20sensor%20with%20LoRa%20radio%20transceiver.pdf (accessed on 2 April 2023).
  40. EN 15251:2006; Indoor Environmental Input Parameters for Design and Assessment of Energy Performance of Buildings Addressing Indoor Air Quality, Thermal Environment, Lighting and Acoustics. European Committee For Standardization: Brussels, Belgium, 2006.
  41. Spinoni, J.; Vogt, J.; Barbosa, P. European degree-day climatologies and trends for the period 1951–2011. Int. J. Climatol. 2015, 35, 25–36. [Google Scholar] [CrossRef] [Green Version]
  42. U.S. Environmental Protection Agency. Guidebook for Energy Efficiency Evaluation, Measurement, and Verification. Available online: https://www.epa.gov/sites/default/files/2019-06/documents/guidebook_for_energy_efficiency_evaluation_measurement_verification.pdf (accessed on 2 April 2023).
  43. Golombek, R.; Kittelsen, S.; Haddeland, I. Climate change: Impacts on electricity markets in Western Europe. Clim. Change 2012, 113, 357–370. [Google Scholar] [CrossRef] [PubMed] [Green Version]
  44. Li, Y.; Wang, W.; Wang, Y.; Xin, Y.; He, T.; Zhao, G. A Review of Studies Involving the Effects of Climate Change on the Energy Consumption for Building Heating and Cooling. Int. J. Environ. Res. Public Health 2021, 18, 40. [Google Scholar] [CrossRef] [PubMed]
  45. Azevedo, J.A.; Chapman, L.; Muller, C.L. Critique and suggested modifications of the degree days methodology to enable long-term electricity consumption assessments: A case study in Birmingham, UK. Meteorol. Appl. 2015, 22, 789–796. [Google Scholar] [CrossRef]
  46. Markiewicz, M. Central Heating Data. Available online: https://github.com/mmr01/hvac (accessed on 22 March 2023).
  47. R Core Team. R: A Language and Environment for Statistical Computing. Available online: https://www.r-project.org/ (accessed on 4 April 2023).
  48. Gamma, E.; Helm, R.; Johnson, R.E.; Vlissides, J. Design Patterns: Elements of Reusable Object-Oriented Software; Addison-Wesley Professional: Boston, MA, USA, 1995. [Google Scholar]
Figure 1. Heating control system schematic of the building where tests were performed. The central heating control loop consists of a controller acting on TVR/04 according to central heating circuit supply water temperature measured at TCR/08. The domestic hot water controller acts on TVR/05 valve according to the domestic hot water heat exchanger outlet temperature measured at TCR/020. Legend: Ⓣ—temperature sensor, Ⓟ—pressure sensor, Ⓜ—control valve, Energies 16 05584 i001—variable speed drive, Energies 16 05584 i002—energy meter.
Energies 16 05584 g001
Figure 2. Control room in the building where tests were performed. On the right-hand side there are two control cabinets. The smaller one is a heat substation switchgear. The larger cabinet contains Honeywell Excel Web Ethernet-based programmable building automation controller, Weintek cMT-SVR-100 data logger, Ethernet switch, and an edge router for wireless sensors connected to an antenna visible in the upper right corner. In the background is the hydraulic installation: vertical pipes are for domestic hot water, horizontal pipes are for primary side district heating. A Kamstrup Multical 603 energy meter is visible straight ahead. On the right-hand side, behind the cabinets, there is a cylindrical strainer for secondary side central heating return water. Above it, there are two variable speed drive pumps.
Energies 16 05584 g002
Figure 3. Human–machine interface for monitoring the control system. Each numerical value associated with a sensor is updated according to messages from a telemetry queue (MQTT). Thermometer symbols designate temperature sensors. Red pipes are for district heating hot water. Blue pipes are for return water. Fans denote pumps with variable speed drives. This model is an interactive version of the heating control system schematic shown in Figure 1.
Energies 16 05584 g003
Figure 4. A battery-powered wireless temperature sensor and an edge router with Ethernet interface.
Energies 16 05584 g004
Figure 5. Information flow in the proposed solution.
Energies 16 05584 g005
Figure 6. Graphical user interface showing a specific sensor data and a list of all installed sensors.
Energies 16 05584 g006
Figure 7. A two-layer algorithm for heating energy control inside a residential building. The arrows mark the direction of information flow. The local control layer has bi-directional communication with valves, pumps, and other sensors and actuators, so it can read present values and send commands to achieve desired set points. The optimization layer has access to information from indoor temperature sensors and the weather forecast service. It can adjust set points of the local control layer to a certain degree in order to minimize energy consumption.
Energies 16 05584 g007
Table 1. Changes in energy consumption in the test building with different optimization algorithms. T ( t ) denotes degree-hours.
MonthSamplesEnergy [kWh] T ( t ) E1 (1)Algorithm
April, 2021398356537590.948I
May, 2021495702170690.993I
October, 2021485437341581.052II
November, 2021385550948181.143II
December, 202172716,54013,6531.211III
January, 202274415,14512,6381.198III
February, 202267211,41697891.166III
March, 202274211,86810,2761.154III
April, 2022720781571051.100Various
May, 2022743247926450.937Various
April–May, 202189310,58610,8280.978I
October–November, 2021870988389761.101II
December–March, 202228855497146,3571.186III
Table 2. Underheating and overheating indices in the test building during the test period.
MonthSamples t < 21 E2 (2) t > 21 E3 (3)Algorithm
April, 2021576005761.78I
May, 2021456310.024251.19I
October, 2021422004222.45II
November, 2021133001331.38II
December, 20216721706541.48III
January, 2022696006961.79III
Febuary, 20226331070.075251.5III
March, 2022671006711.69III
April–May, 2021516150.015011.52I
October–November, 2021278002782.19II
December–March, 2022668300.026381.62III
Disclaimer/Publisher’s Note: The statements, opinions and data contained in all publications are solely those of the individual author(s) and contributor(s) and not of MDPI and/or the editor(s). MDPI and/or the editor(s) disclaim responsibility for any injury to people or property resulting from any ideas, methods, instructions or products referred to in the content.

