Article

Adaptive Machine-Learning-Based Transmission Line Fault Detection and Classification Connected to Inverter-Based Generators

by
Khalfan Al Kharusi
*,
Abdelsalam El Haffar
and
Mostefa Mesbah
Electrical and Computer Engineering, Sultan Qaboos University, P.O. Box 33, Muscat 123, Oman
*
Author to whom correspondence should be addressed.
Submission received: 10 May 2023 / Revised: 13 July 2023 / Accepted: 21 July 2023 / Published: 2 August 2023

Abstract

:
Adaptive protection schemes have been developed to address the problem of behavior-changing power systems integrated with inverter-based generation (IBG). This paper proposes a machine-learning-based fault detection and classification technique using a setting-group-based adaptation approach. Multigroup settings were designed depending on the types of power generation (synchronous generator, PV plant, and type-3 wind farm) connected to a transmission line in the 39-Bus New England System. For each system topology, an optimized pretrained ensemble tree classifier was used. The adaptation process has two phases: an offline learning phase to tune the classifiers and select the optimum subset of features, and an online phase where the circuit breaker (CB) status and the active output power of the generators are continuously monitored to identify the current system topology and to select the appropriate setting group. The proposed system achieved an average accuracy of 99.4%, a 99.5% average precision, a 99.9% average specificity, and a 99.4% average sensitivity of classification. The robustness analysis was conducted by applying several fault scenarios not considered during training, which include different transmission network configurations and different penetration levels of IBGs. The case of incorrect selection of the appropriate setting group resulting from selecting the wrong topology is also considered. It was noticed that the performance of developed classifiers deteriorates when the transmission network is reconfigured and the incorrect setting group is selected.

1. Introduction

Adaptive protection schemes have emerged in the last few decades to address the problem of behavior-changing power systems with IBGs. Examples of system-changing problems include the fault level contribution, the fault characteristics of the IBGs, and system reconfigurations [1]. Analyzing the fault characteristics becomes difficult because the IBGs have unique electricity-generating principles due to the integration of power electronic converters [2]. Adaptive protection was suggested to automatically adjust protection functions to make them more attuned to prevailing power system conditions [3]. These adaptive protection schemes grant the power system protection the ability to identify, categorize, and localize faults in power systems that have been penetrated by inverter-based generators (IBGs), which cause ongoing changes in the direction of the power flow, the source impedance, and the system inertia.
Several adaptive protection methods were proposed in the literature to mitigate the issues of integrating renewable resources and changing system topologies. One of the more recent methods for creating adaptable protection systems is adaptation utilizing machine learning (ML) algorithms. As a substitute method for fault detection, classification, and localization, ML techniques for power system protection have emerged. The main advantages of ML techniques are accuracy, self-adaptiveness, and robustness to parameter variations [4]. Classical ML techniques face several challenges, such as updating the training dataset for newly discovered faults and continuously tuning the classifier’s parameters [5]. Adaptive ML algorithms have been introduced to address the power systems’ changing behavior. The adaptation may occur at feature extraction, feature selection, or classification levels. Continuous data streaming for training should be supported by the adaptive classifier, which should be able to adjust to the changing behavior of the power system thanks to integrated renewables. This process is known as incremental or online learning [6].
An adaptive microgrid protection strategy employing traditional protection relay settings and a machine learning classifier was proposed by Hengwei et al. [7]. The rule-based method was able to choose the appropriate setting group of overcurrent and distance relays relevant to the current system topology, while the ML classifier was utilized to detect the faults. A support vector machine (SVM) classifier was used in [8] to predict the remote CBs’ status, identify the circuit topology, and select the correct relay setting. Marín-Quintero et al. [9] developed an adaptive protection scheme for an active distribution network with distribution generators (DGs) using an ML algorithm. Different system topologies were considered, and each topology used a different ML classifier for fault detection. For each system topology, the relays in the network were equipped with the classifier that achieved the best classification accuracy during offline training. In this application, the different classifiers used a common set of features, which may not be an optimal subset. Yavuz et al. [10] proposed an adaptative algorithm that computes the optimum weights using particle swarm optimization for different ML classifiers to achieve a high performance independent of the system topology and the type of connected generators. The adaptation was made online using only the voltage, frequency, and phase angle signals obtained from the PMUs. Tang and Yang [11] developed an adaptive protection scheme by extracting features from the continuous wavelet transformation of the positive, negative, and zero sequences of voltage and current and the three-phase currents and voltages. Two system topologies were considered, namely fixed topology and changing topology. Features were selected using Pearson’s correlation coefficient. For the fixed topology case, the relay operation thresholds, obtained using the DT classifier, were embedded in the relays to enable fault detection. For the changing topology, a neural network was adopted.
This paper proposes an adaptive transmission line protection connected to three generations: synchronous generators, PV plants, and wind farm. The adaptation design depends on online system topology identification using a combination of the CBs’ status and real-time measurement of the active output power of the connected generating units behind the protected transmission line and the ML model for fault detection classification.
The combination of CB status and power measurement ensures more reliable topology identification. It is worth noting that the definition of the system topology in this paper differs from the definition in the literature. Our definition of the system topology is the generation mixture available in the busbar behind the protected line, whereas the topology defined by others was the lines or buses connected/disconnected in the power system network.
The fault detection and fault type classification for each system topology were designed using an ML model in the offline process. After appropriate topology identification, the designed ML model parameters were saved in the setting groups. The correct setting group is selected based on the relative topology in the online process. More specifically, the proposed method:
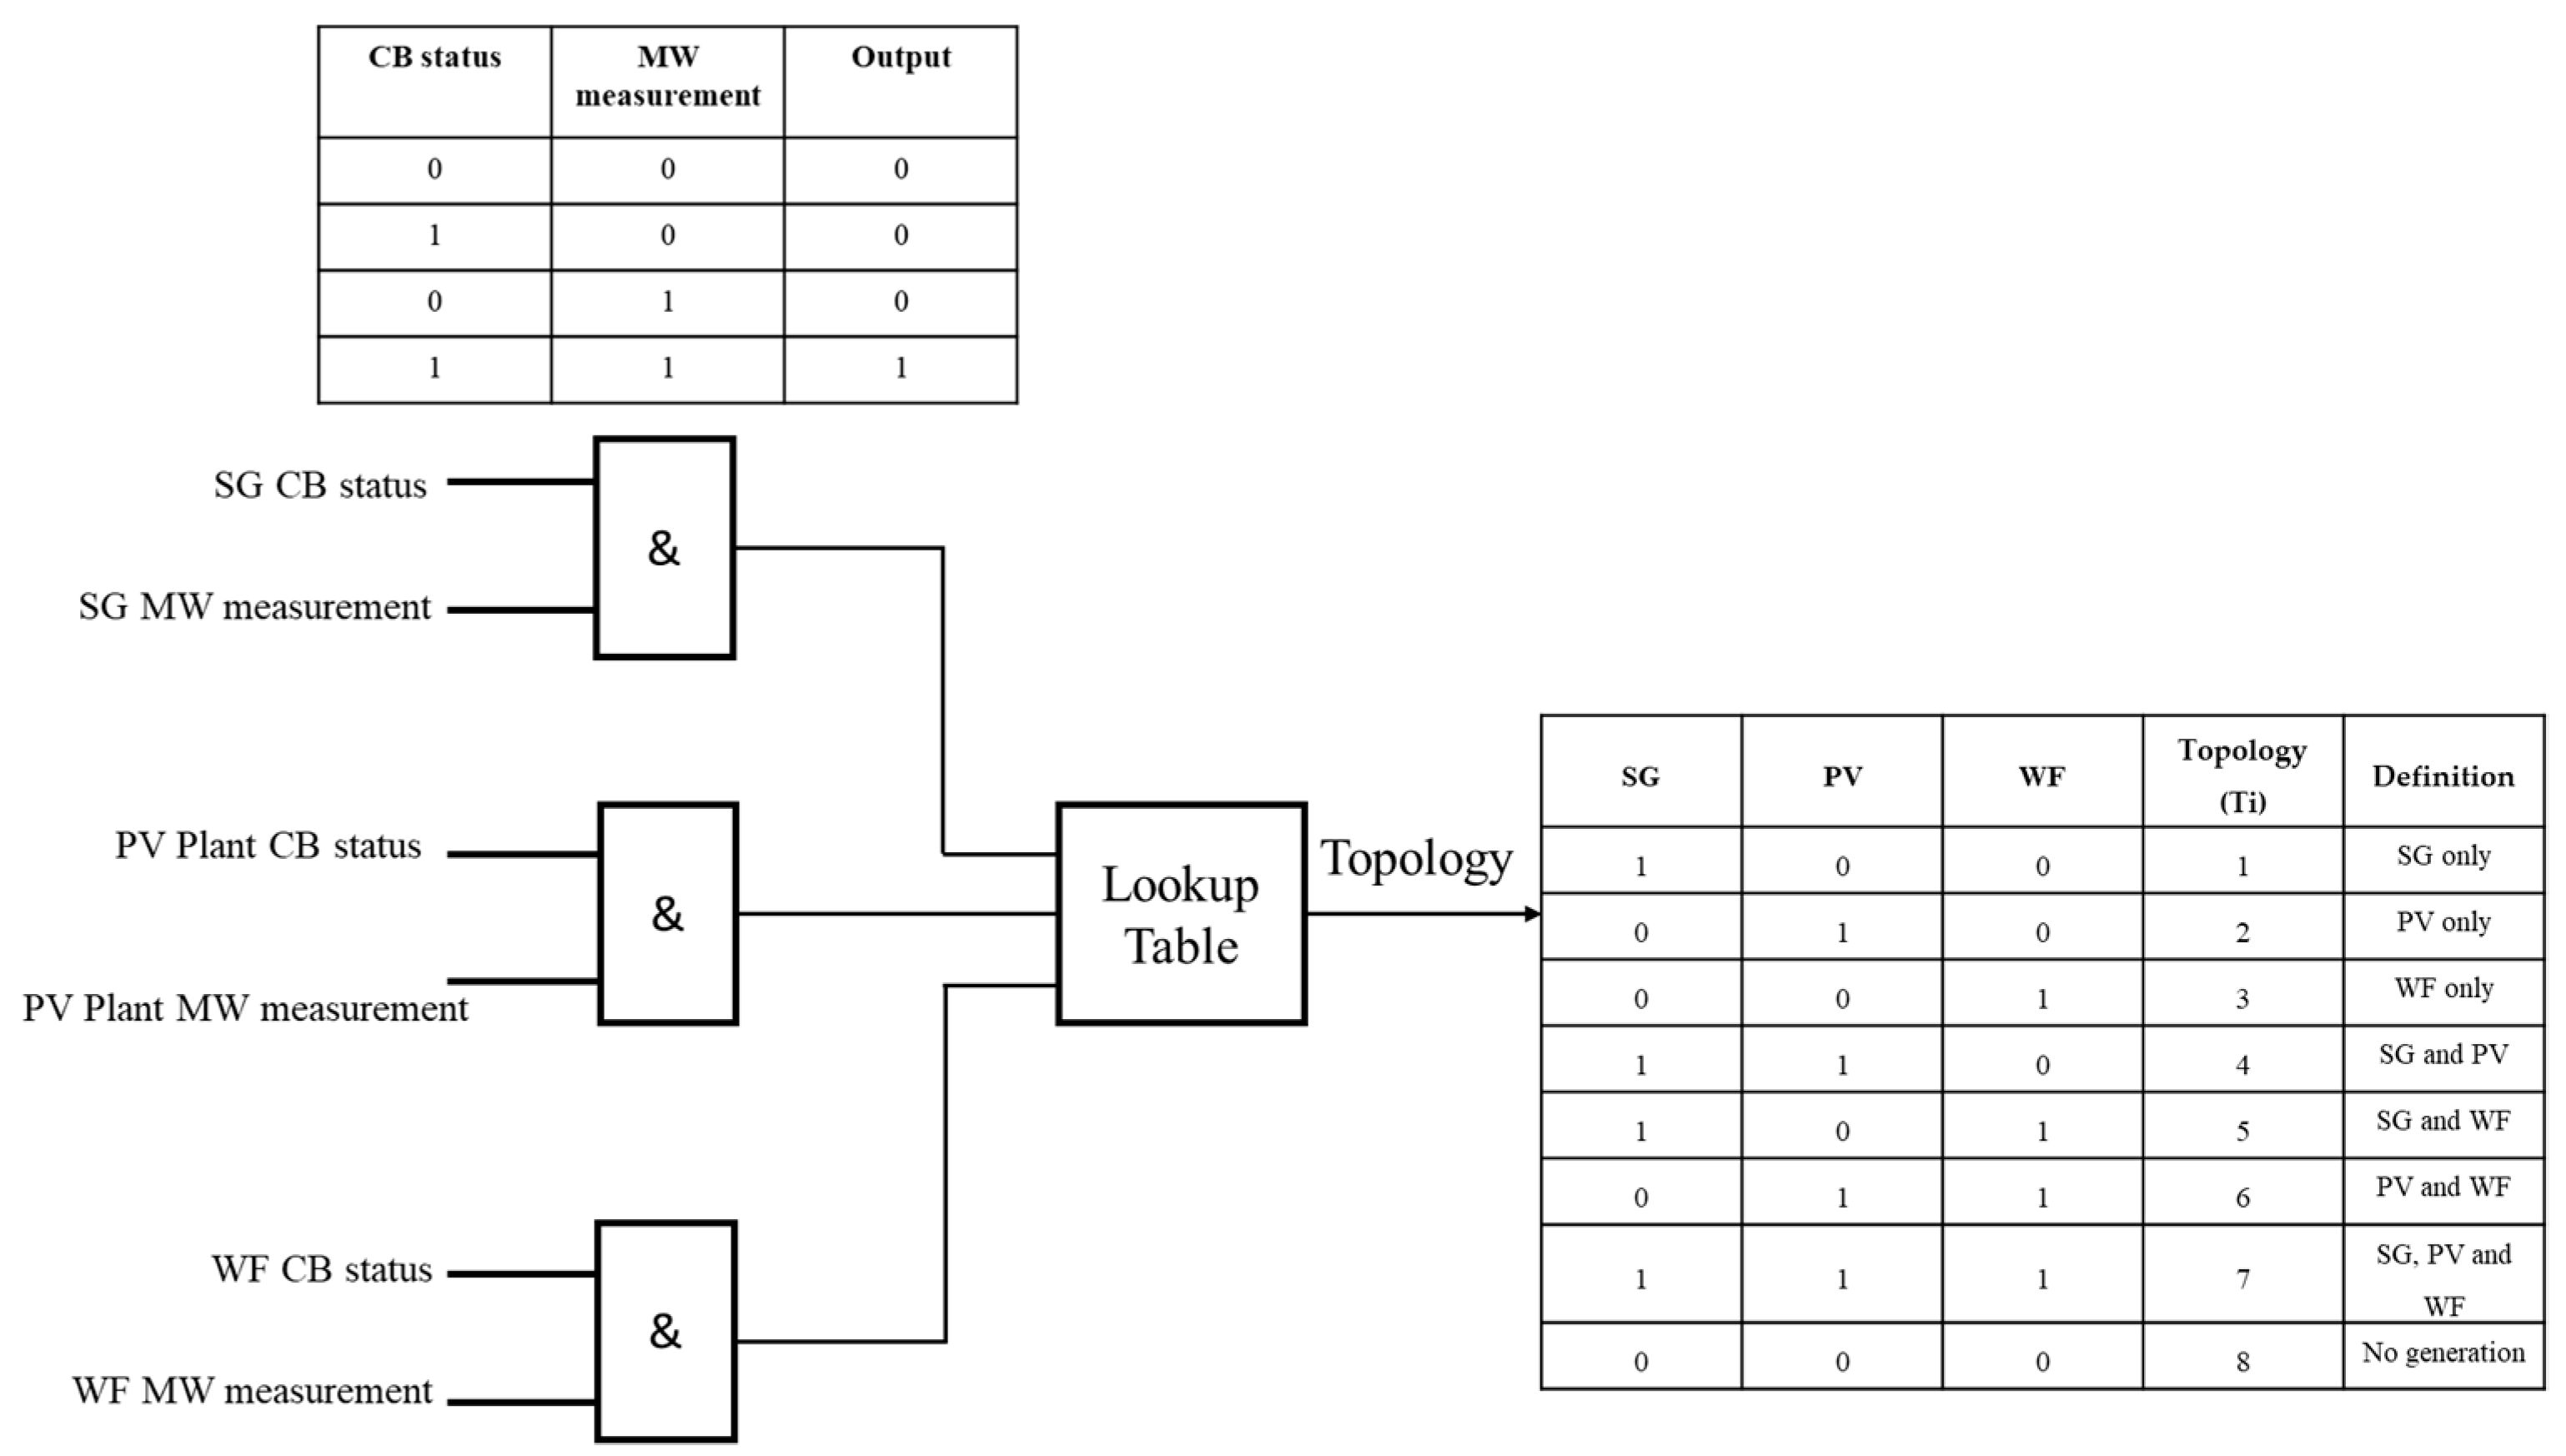
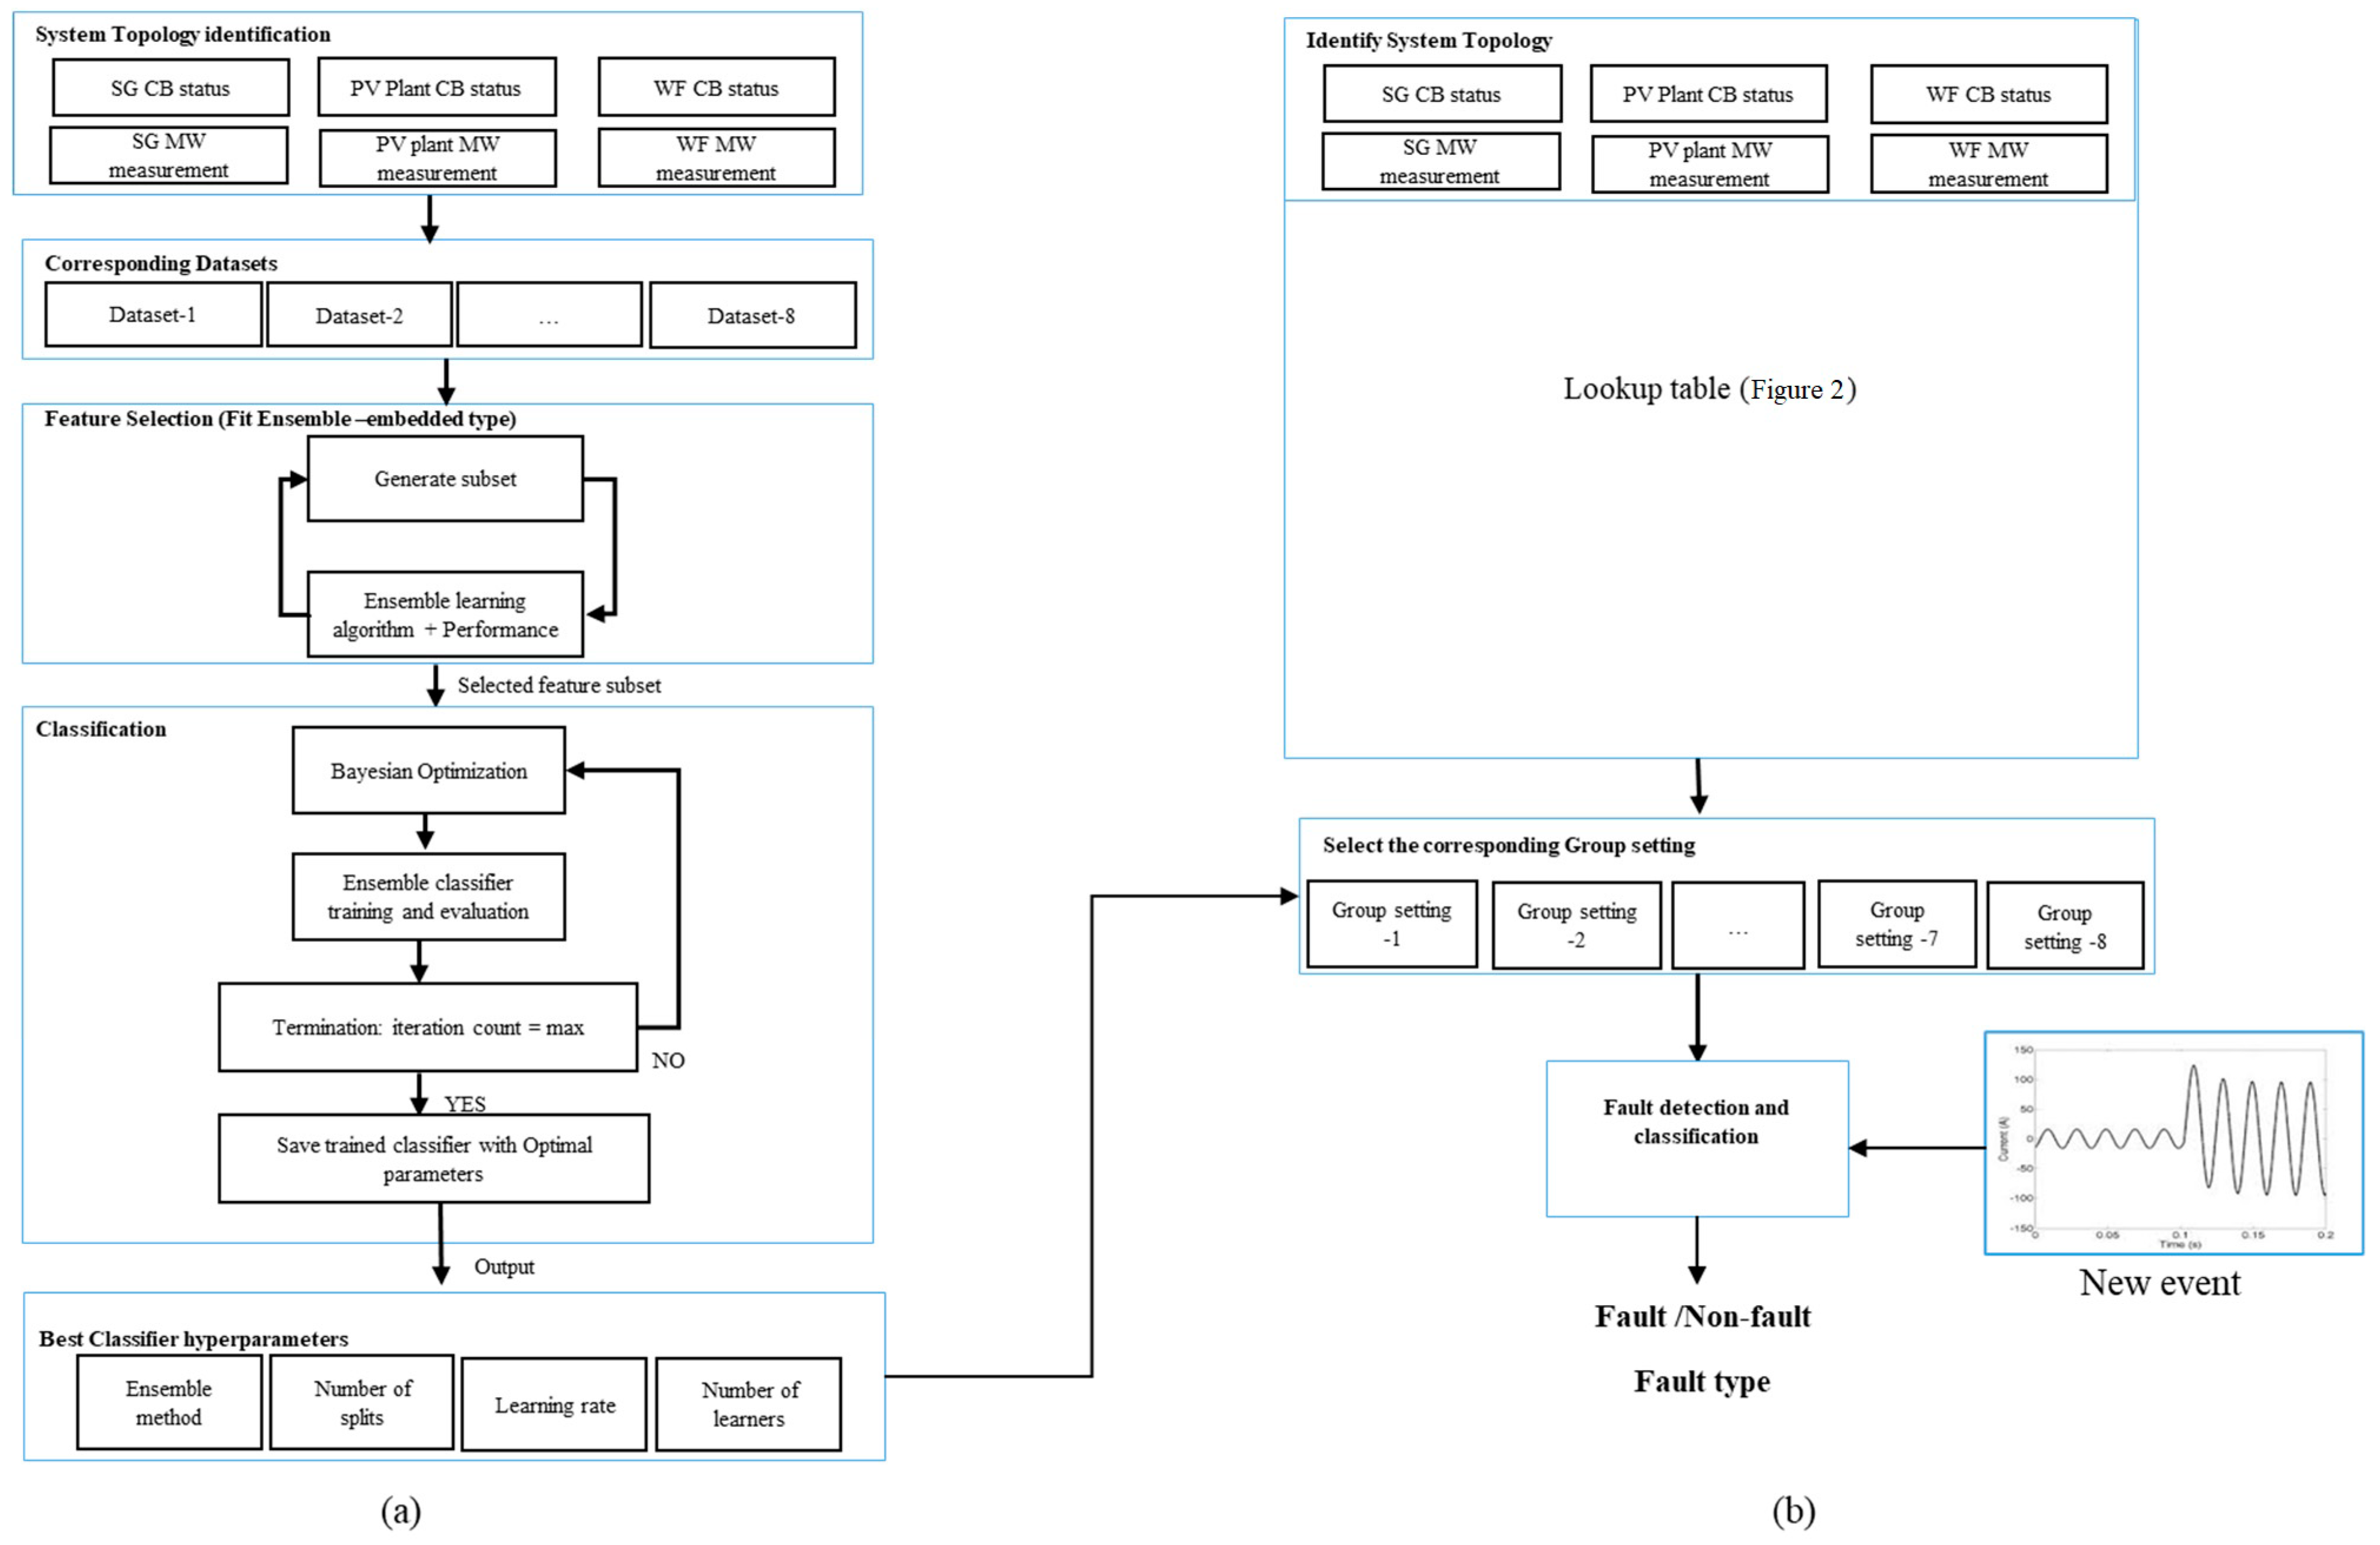
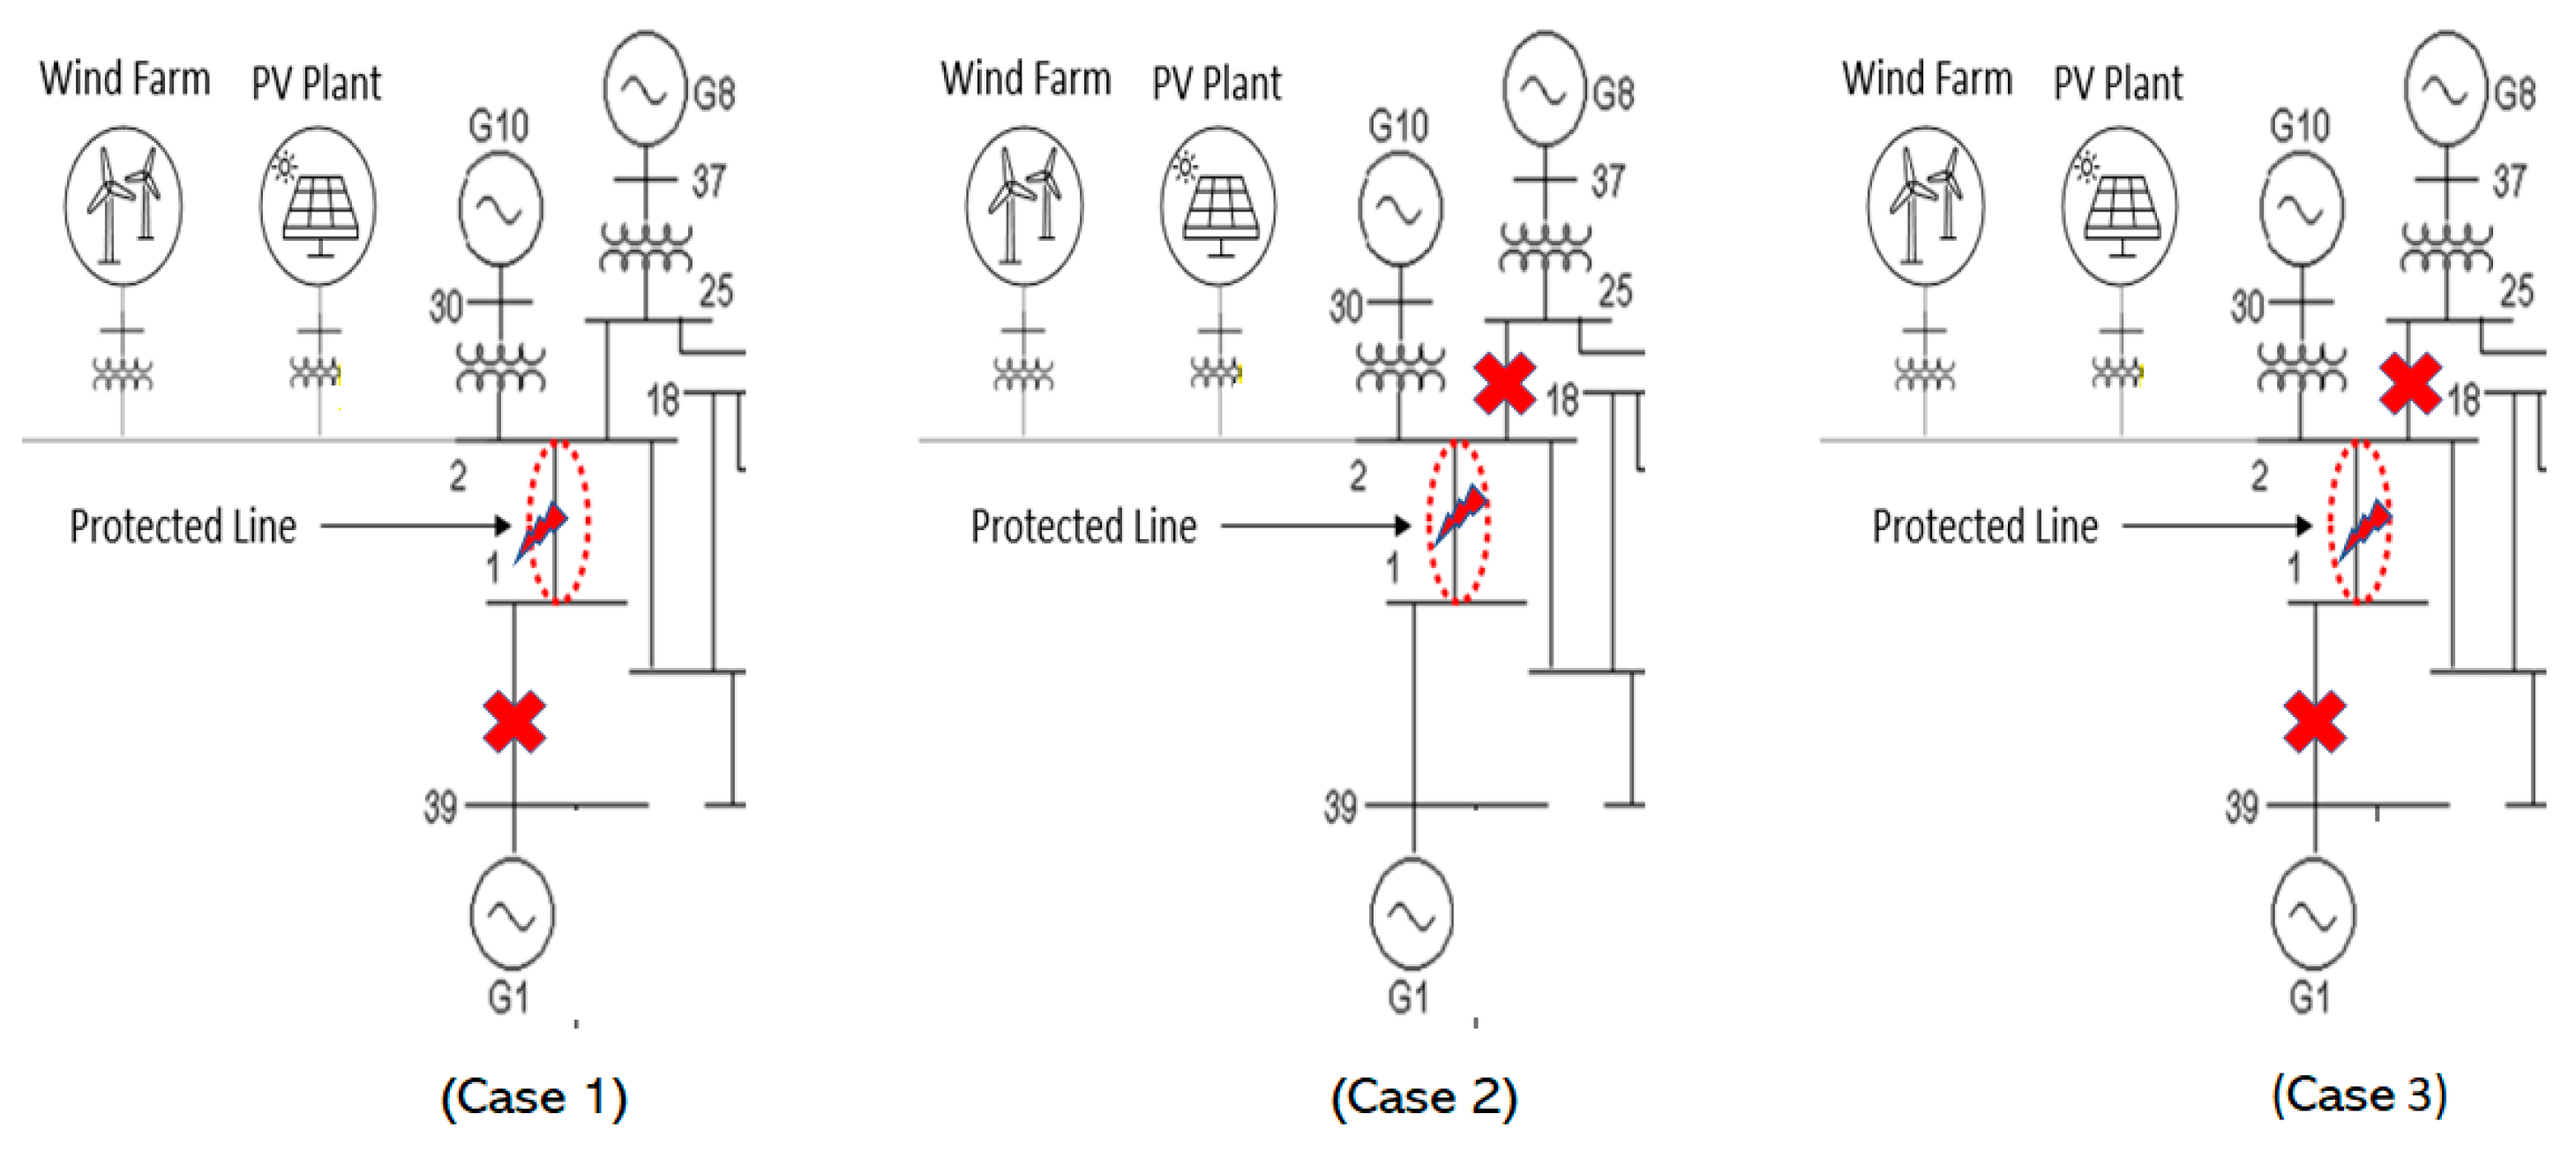
  • defines the system topology as the generation mixture available at the busbar behind the protected line;
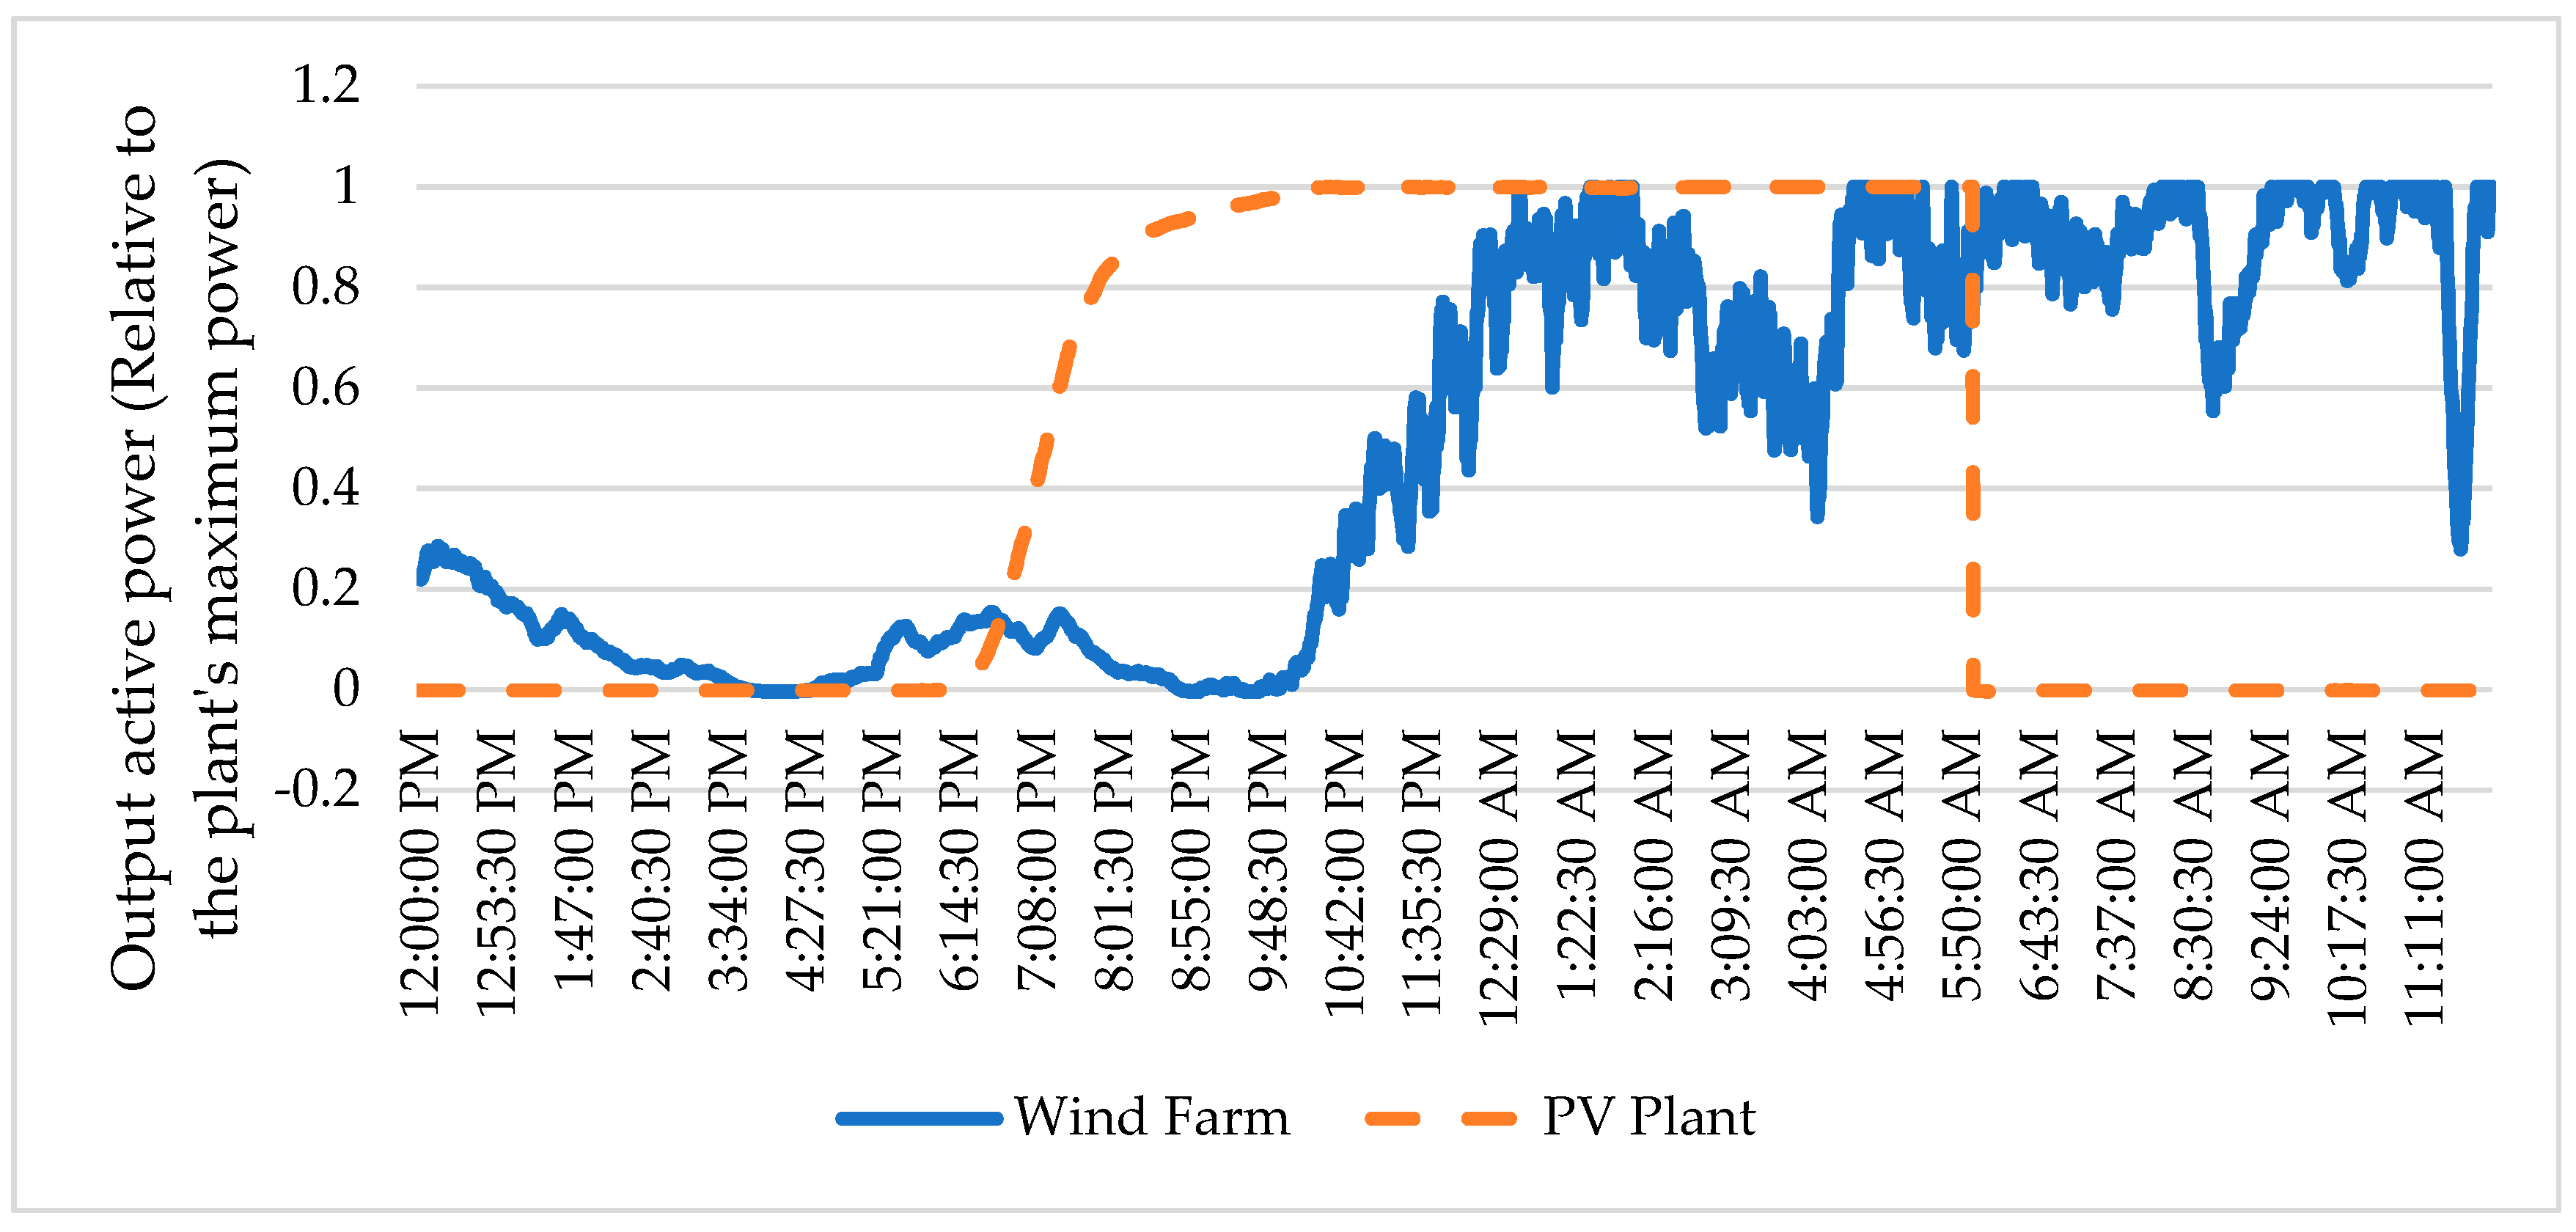
  • considers two types of IBGs, namely large-scale PV and DFIG wind farms (WF);
  • combines ML-based classifiers with setting group selection based on circuit breaker statuses and real-time active power measurements;
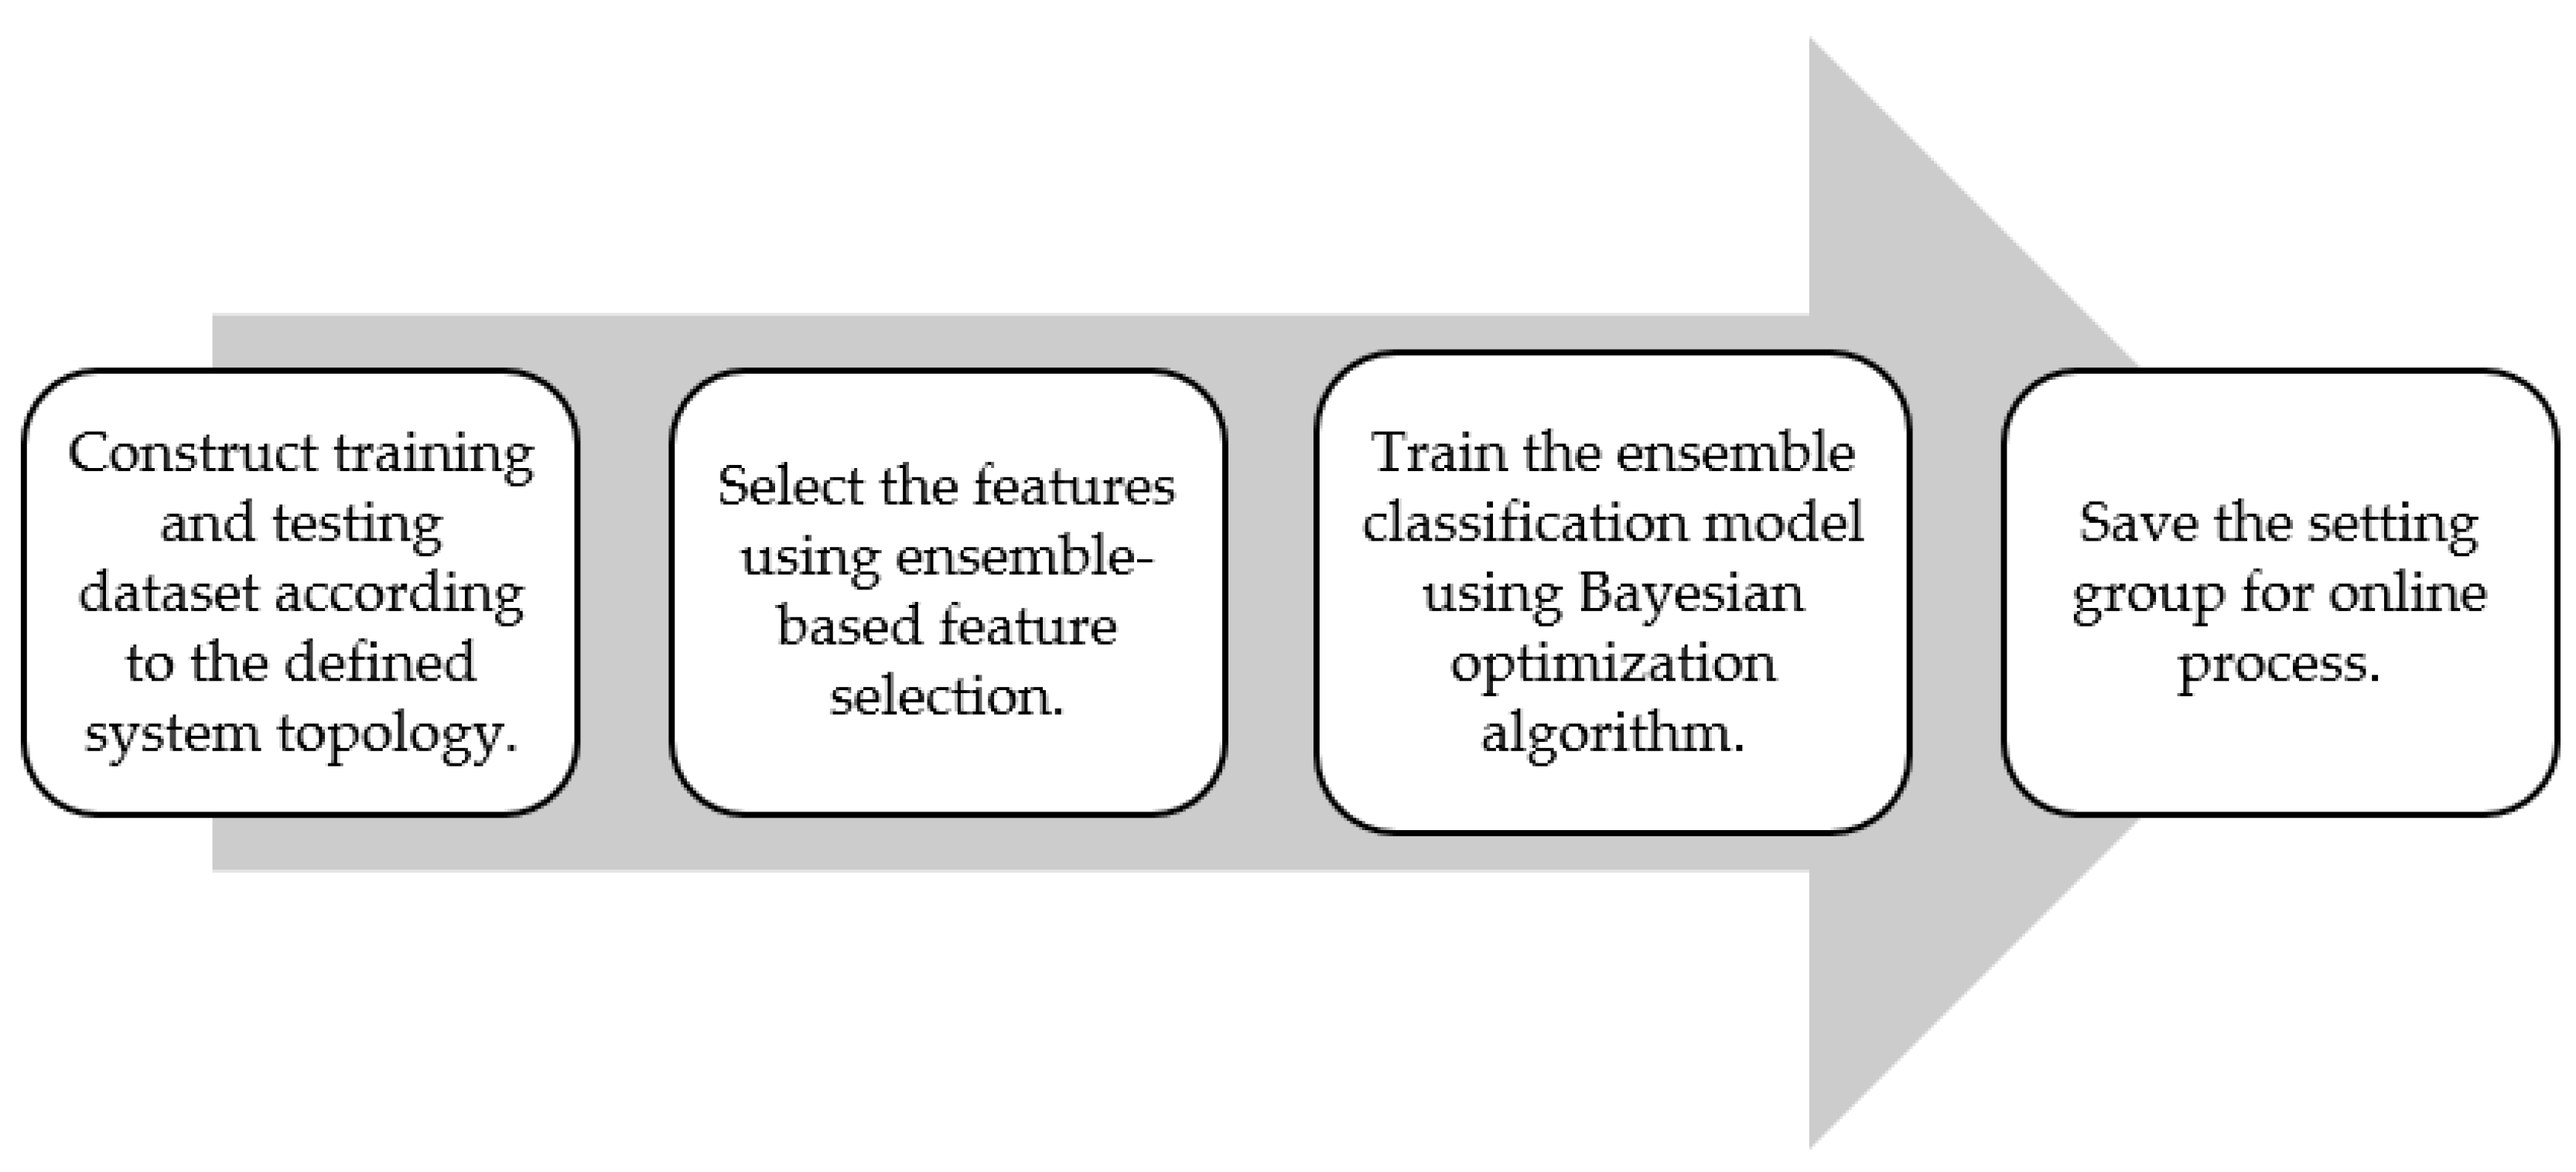
  • tunes the hyperparameters of the classifier associated with each system topology using the Bayesian optimization algorithm to achieve the best classification performance;
  • uses the ensemble feature method, an embedded-type feature selection method, to select the optimal feature subset associated with each system topology;
  • selects the appropriate setting group online according to the system topology obtained from the lookup table.
The adaptive scheme in this study refers to the online topology identification from CB states and active power measurements of the connected generating units, followed by the appropriate selection of the setting groups equipped with pretrained ML classification models to detect and classify the faults.
This paper is organized as follows. Section 2 identifies different system topology identification methods in the literature. Section 3 describes the methodology used to identify the generation topology and to build the datasets for the adaptive fault detection and classification technique. It also describes the ML protection setting method. Section 4 presents and discusses the obtained results. It evaluates the performance of the classification models using different classification metrics: accuracy, specificity, precision, and sensitivity. The performance of the proposed adaptive scheme system was evaluated using new fault events, different IBG penetration levels, and transmission system configurations. Section 5 provides the conclusion.

2. System Topology Identification Methods

Identifying or detecting system topology changes is crucial in selecting the appropriate adaptive protection scheme. Several topology identification approaches have been proposed in the literature.
Identification with CB status: The CB status approach has been widely used for adaptive protection scheme design. Poudel et al. [8] developed an adaptive protection scheme for medium-voltage feeders by collecting the CB status of that feeder in the substation computer, along with the statuses of the loads, DGs, and autoreclosers. The computer substation saves predefined settings corresponding to each system topology. An adaptive overcurrent was established and proposed in [12] to detect the faults in two different setting groups, the islanded mode and the grid-connected mode, by defining the CBs of the network circuits and the CB status of the distributed generators using the IEC61850 communication protocol. The setting groups were changed after loss of mains, loss of DG, or islanding. Lin et al. [13] proposed lookup tables for the circuit breaker (CB) and relay events. The protection settings for different states were calculated offline and stored in the settings table (action table).
Identification using dynamic state estimation (DSE): When the operating system point changes more frequently and quickly, it becomes crucial to keep track of the system’s dynamic state variables, including voltage and current magnitude and angle, current magnitude and angle, and real and reactive power [14]. The data were collected from PMUs, merging units (MUs), and digital fault recorders (FRs). The dynamic variables of the system equipment could be estimated using differential–algebraic equations [15]. Adaptive protection can be developed by estimating the dynamic states to identify the system topology. Korres et al. [16] utilized the state estimation algorithm to define the IEEE RTS-96 substation configuration via the circuit breaker status identification using the active and reactive power flows as continuous state variables. The authors in [16] tested two algorithms for topology identification: the recursive Bayesian estimation (RBE) and generalized state estimation (GSE). The GSE provided good model identification accuracy, even when the number of possible network configurations was increased. The state estimation approach, however, faces several challenges [17] such as dependency on the communication system to transfer the data from measuring devices, considering the network bandwidth and capacity, and limiting the accuracy and rate of data exchange. In addition, the higher penetration of renewable power resources introduces a higher level of uncertainty.
Identification using machine learning: ML can be used to detect and identify the system configuration changes by collecting measurements at different locations of the power system, such as lines, generators, and supplementary devices (fault current limiters, reactive power compensators, and others). The SVM classifier was used in [18], where the three-phase voltage and current, RMS values, and the zero-sequence current were the input features measured at different locations in the IEEE 123-node distribution test system. The authors in [19] proposed using several ML classifiers (SVM, k-NN, and ensemble algorithms) to identify the system configurations of a simulated standard power distribution system. The SVM outperformed the other classifiers by achieving 100% detection accuracy. Rajendra et al. [20] estimated the system configuration of the tie lines in the modified IEEE 123-bus distribution system using deep learning (CNN) and compared it with the SVM. The CNN outperformed the SVM.
Identification using data-driven approaches: The system topology can be identified by collecting data from different locations of the power system network and recognizing the available system components (lines, generators, and loads). The required data are voltage, current, real power, reactive power, or frequency signals and can also be extracted features from these signals. Razmi et al. [19] used transient voltage signals at different system-switching devices to identify the system topology and circuit status. The transient voltage was obtained from instantaneous voltage signals measured at each end of the distribution lines in an ANSI standard distribution system and extracted the maximum, minimum, and rate of change as features. The dataset was classified using SVM, k-NN, DT, and ensemble tree classifiers. The SVM classifier outperformed the others with its 100% achieved accuracy. In [8], The circuit status was identified according to the measurements of RMS voltage, current, real and reactive power collected from the lines of the modified IEEE 34-bus system and two-bus power system with the PV system. Then, the overcurrent protection settings were adopted for each circuit topology. The topology identification was achieved using the SVM classifier, and the results showed that using all measured signals resulted in a classification accuracy of 100%, whereas using current and voltage measurements only resulted in lower performance (98%). The authors in [21] designed an ML data-driven approach to identify the system topology by constructing a connectivity matrix that showed the status of switches with voltage and current phasors recorded by PMUs. The proposed method approximates network parameters using an ensemble-based deep learning model for a modified IEEE 33-bus network and real feeder in Queensland, Australia. Their design performance was a detection error rate of only 1.2%. For transmission system topology identification (IEEE 39-bus and 118-bus systems), the authors in [22] identified the line outage using the phasor angles at buses. Logistic regression (LR), random forest (RF), and graph convolutional network (GCN) were the models used for identification. The proposed classifiers were evaluated with two performance metrics (precision and recall). The results showed that logistic regression outperformed the others with 99% precision and recall.

3. Methodology

In this section, the proposed methodology is described in detail. It consists of three parts: topology identification procedure, machine learning design requirement, and the overall proposed adaptive scheme using ML-based protection setting approach.

3.1. Topology Identification Procedure

The proposed topology identification in this paper depends on the circuit breaker status of the generating units connected at one end of the protected transmission line and the active output power of these units. Depending on the circuit breaker status alone is not always reliable. The circuit breaker may fail due to mechanical or electrical reasons and the intermittency behavior of renewable resources where the output power ranges from zero to maximum, depending on weather conditions. There are cases where the output power is zero while the circuit breaker is in a closed position. Figure 1 shows a real case of PV plant and wind farm output power that varies from zero to maximum during the day’s hours. As a result, the circuit breaker status and the active power measurements are used for the reliability of topology identification. If the power measurement exceeds zero, the output is one; otherwise, it is set to zero. Considering the three generators connected at one bus (synchronous generator, PV plant, and wind farm), the topology lookup table is shown in Figure 2. Individual plant availability status is obtained using the AND gate between the CB status and the output power, and then the topology can be identified with the lookup table using the three statuses of the generating plants. The resulting number of topologies is eight, noting that the ‘No generation’ topology means that none of the three generation plants are in service. However, other generators connected at different system parts feed the faults incepted in the protected lines.

3.2. Machine Learning Design Requirement

This section explains the dataset construction phases, the feature selection method, the classification model, and the classification performance metrics.

3.2.1. Data Collection and Preparation

The datasets were simulated using the 39-Bus New England System model [23] shown in Figure 3. The data were simulated using the Power Factory DigSilent software package [24]. The details related to the parameters of the synchronous generators, transmission lines, power transformers, and loads can be found in [25]. The protected transmission line was line 1-2. The following signals were measured at bus -2: the instantaneous three-phase voltage, instantaneous three-phase current, and the angle between voltage and current. The signals included fault and nonfault events. The PV plant and wind farm, whose characteristics are shown in Table 1, were introduced at bus 2.
Swing conditions and normal system behavior make up the nonfault events. The swing conditions were incorporated into the nonfault class because they should prevent the protection device from operating during power swing situations. Different fault types, locations, and resistances were simulated as part of the fault events. Power swing was detected using the swing center voltage (SCV) signal, as suggested in [26]. The magnitude of the SCV changes between 0 and 1 per unit of system nominal voltage. The SCV’s magnitude remains constant under typical load situations. The voltage magnitude at the relay point is multiplied by the local voltage and current angle difference to determine it. The fault scenarios contain combinations of the following fault types: A-G, B-G, C-G, A-B, A-C, B-C, A-B-G, A-C-G, B-C-G, and A-B-C. They also feature fault resistances of 0 and 100 ohms, fault locations of 10%, 50%, and 90%, and three-phase faults occurring during power swing situations.
Eight datasets were created for this investigation that represented the generators attached to bus 2 behind the protected transmission line. Three different generator types might be coupled, as shown in Figure 3. (G10: synchronous generator, PV plant: connected to the system with inverters, and wind farm: doubly fed induction machines).
There are eight different system topologies: T1 (SG only), T2 (PV only), T3 (WF only), T4 (SG and PV), T5, T6, and T7 (SG, PV, and WF) (No generation). Seventy percent of the total observations were utilized in the training dataset to fine-tune the hyperparameters, and the remaining observations were used to test the ML classification model.
Eight balanced classes make up each dataset: “0” for normal and swing conditions, “1” for A-G fault events, “2” for B-G fault events, “3” for C-G fault events, “4” for A-B and A-B-G fault events, “5” for A-C and A-C-G fault events, “6” for B-C and B-C-G fault events, and “7” for three-phase fault events. The dataset’s balanced classes have an equal amount of observations for each class.

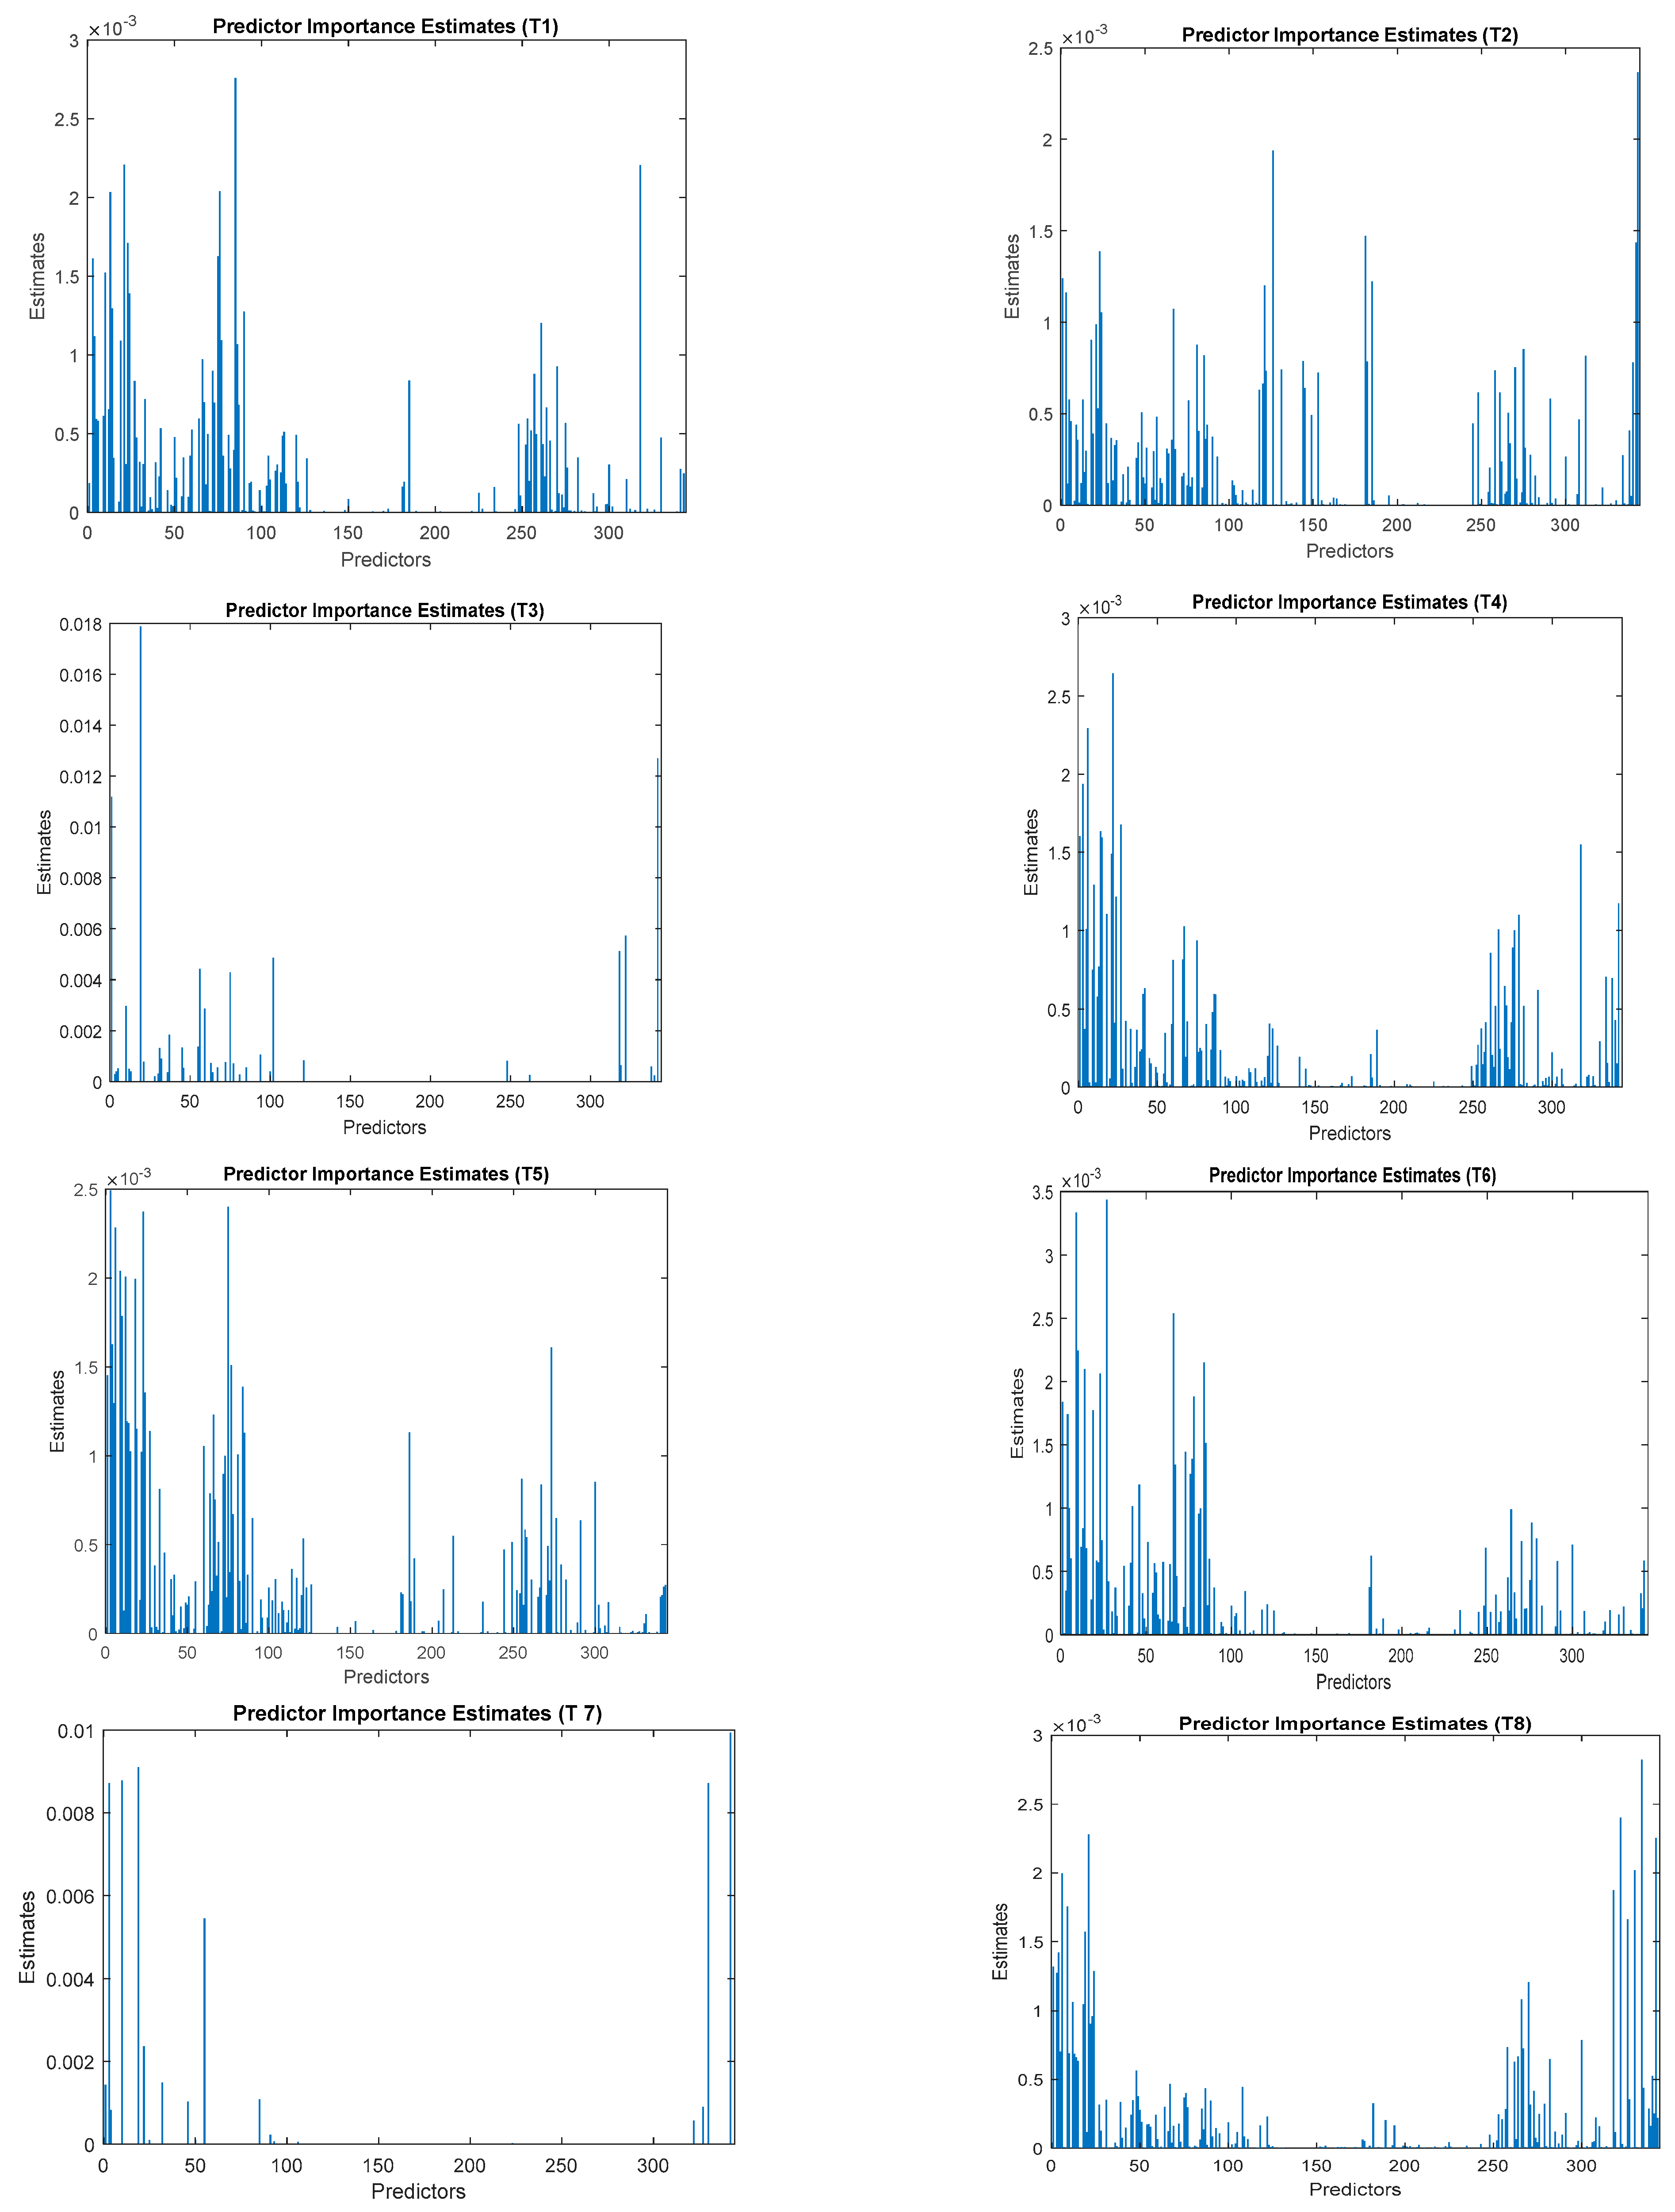
3.2.2. Feature Extraction and Selection

According to Table 2, the features were derived from three domains: time, frequency, and time–frequency. Each dataset contained 343 characteristics in total (7 Signals × 49 features). These elements were taken into account in our previously published research [27].
This research suggests using the ensemble-based feature selection strategy because it maximizes classification accuracy. For the same dataset, the ensemble tree classifier outperformed the k-nearest neighbor, support vector machine, and decision tree classification models, as described in [27]. The ensemble approach is a strategy for embedded feature selection that makes use of weak learners to choose the ideal subset of features that optimize classification accuracy and reduce error. The construction of a linear prediction model using embedded techniques aims to decrease the number of input features while simultaneously maximizing the goodness of fit of the model [32]. The rationale behind utilizing decision trees to assess the significance of a feature is that they perform splits that optimize impurity reduction. Calculating the mean reduction in impurity for each feature across all trees yields the feature significance [33]. Impurity-based feature importance is another name for this technique. The importance calculation follows the following procedure:
For each given feature
For each tree
  • Compute the impurity decrease (Gini or entropy)
  • Weight by the number of examples at that node
  • Average overall trees (i.e., average impurity decrease)
  • Normalize importance values so that the sum of feature importance values equals one
The feature that experiences a greater impurity reduction at each split is given more weight. This strategy’s mathematical model can be found in [34].

3.2.3. Classification Model

There are several ML-based classification models, each with advantages and limitations. In our study [27], the results demonstrated that the ensemble classifier outperformed decision trees, k-nearest neighbors, and support vector machines. The ensemble tree classification model is, therefore, adopted in this paper. Additionally, the ensemble tree was also used in feature selection. The classifier’s hyperparameters were tuned using the Bayesian optimization (BO) algorithm.

3.2.4. Classification Performance Metrics

The accuracy, sensitivity, specificity, and precision are used to describe classification performance indicators in this paper. Their mathematical definitions, derived from the confusion matrix, can be found in [27].

3.2.5. Machine Learning Protection Setting Method

As explained in Section 3.1, the suggested adaptive technique is based on gathering the CB statuses of these units (1: closed position, 0: open position) and the active power measurements of these units in order to track the availability of various generating types connected in bus 2.
Following the procedures shown in Figure 4, the ML classifier setting associated with each system topology was created offline. This graphic explains how to identify the ideal hyperparameters for each system topology using ensemble-based feature selection and an optimized ensemble classifier customized by Bayesian optimization. Each system topology’s setup group is made up of the classifier hyperparameters and the chosen subset of features. This procedure could be regarded as offline.
On the other hand, the online procedure was accomplished by performing the following steps: (1) checking the information pertaining to the current topology; (2) choosing the classifier associated with the current topology; and (3) identifying and classifying new fault events. Figure 5 depicts the offline and online processes.

4. Results and Discussion of Results

The offline settings in this part begin with creating the best classifiers and choosing the best collection of features for each preselected topology using the training data. The system is then tested using test data, and the results are presented in terms of the performance metrics indicated earlier. The system is then tested for robustness utilizing faults on the protected line, faults at various degrees of IBG penetration (10, 50, and 100 percent of their maximum output power), and faults at various transmission system configurations (line outages). Finally, the classifier’s performance under incorrect topology identification is assessed.

4.1. Offline Settings

In the offline settings, the system topologies are identified beforehand, the best feature subsets are chosen, and the various ensemble-based classifiers are trained and optimized. The number of features that were chosen, the ensemble classifier model hyperparameters for each system topology, and the performance metrics for validation and testing data are all displayed in Table 3. The training data represent 70% of the data (five cross-validation folds), and the testing data represent 30%. Figure 6 shows the importance estimation of the features for each system topology using the impurity-based feature importance.

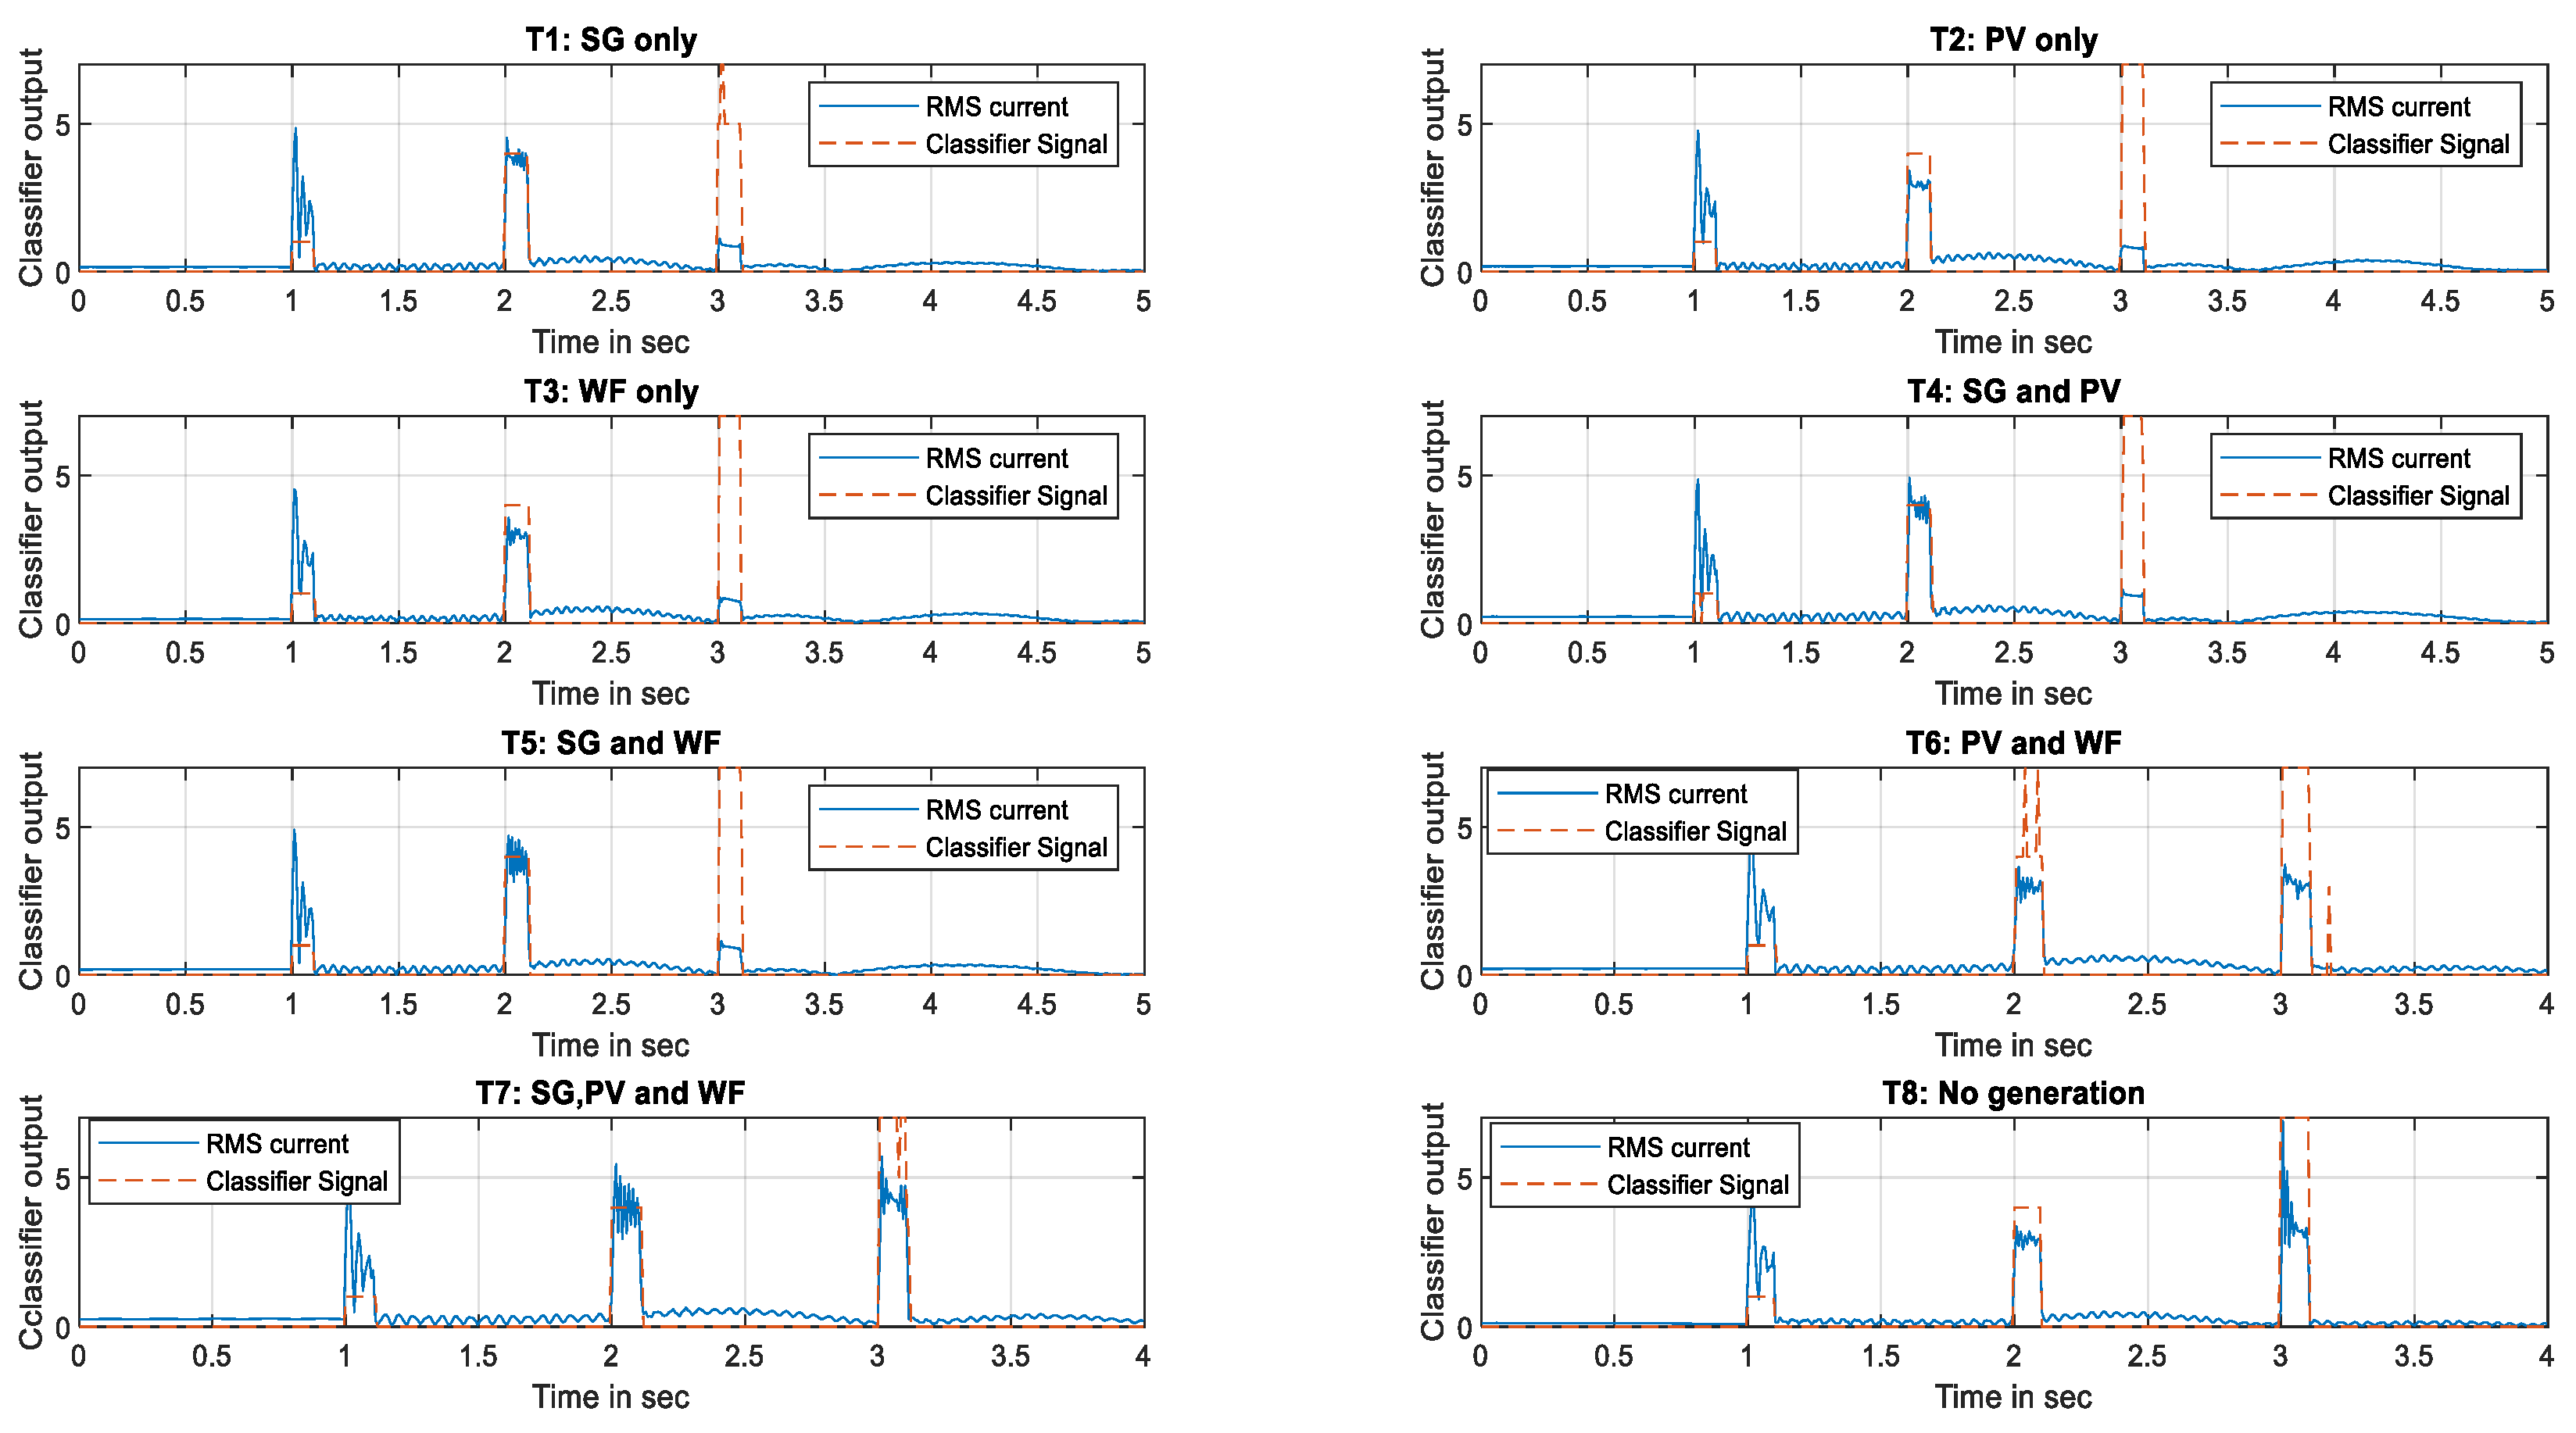
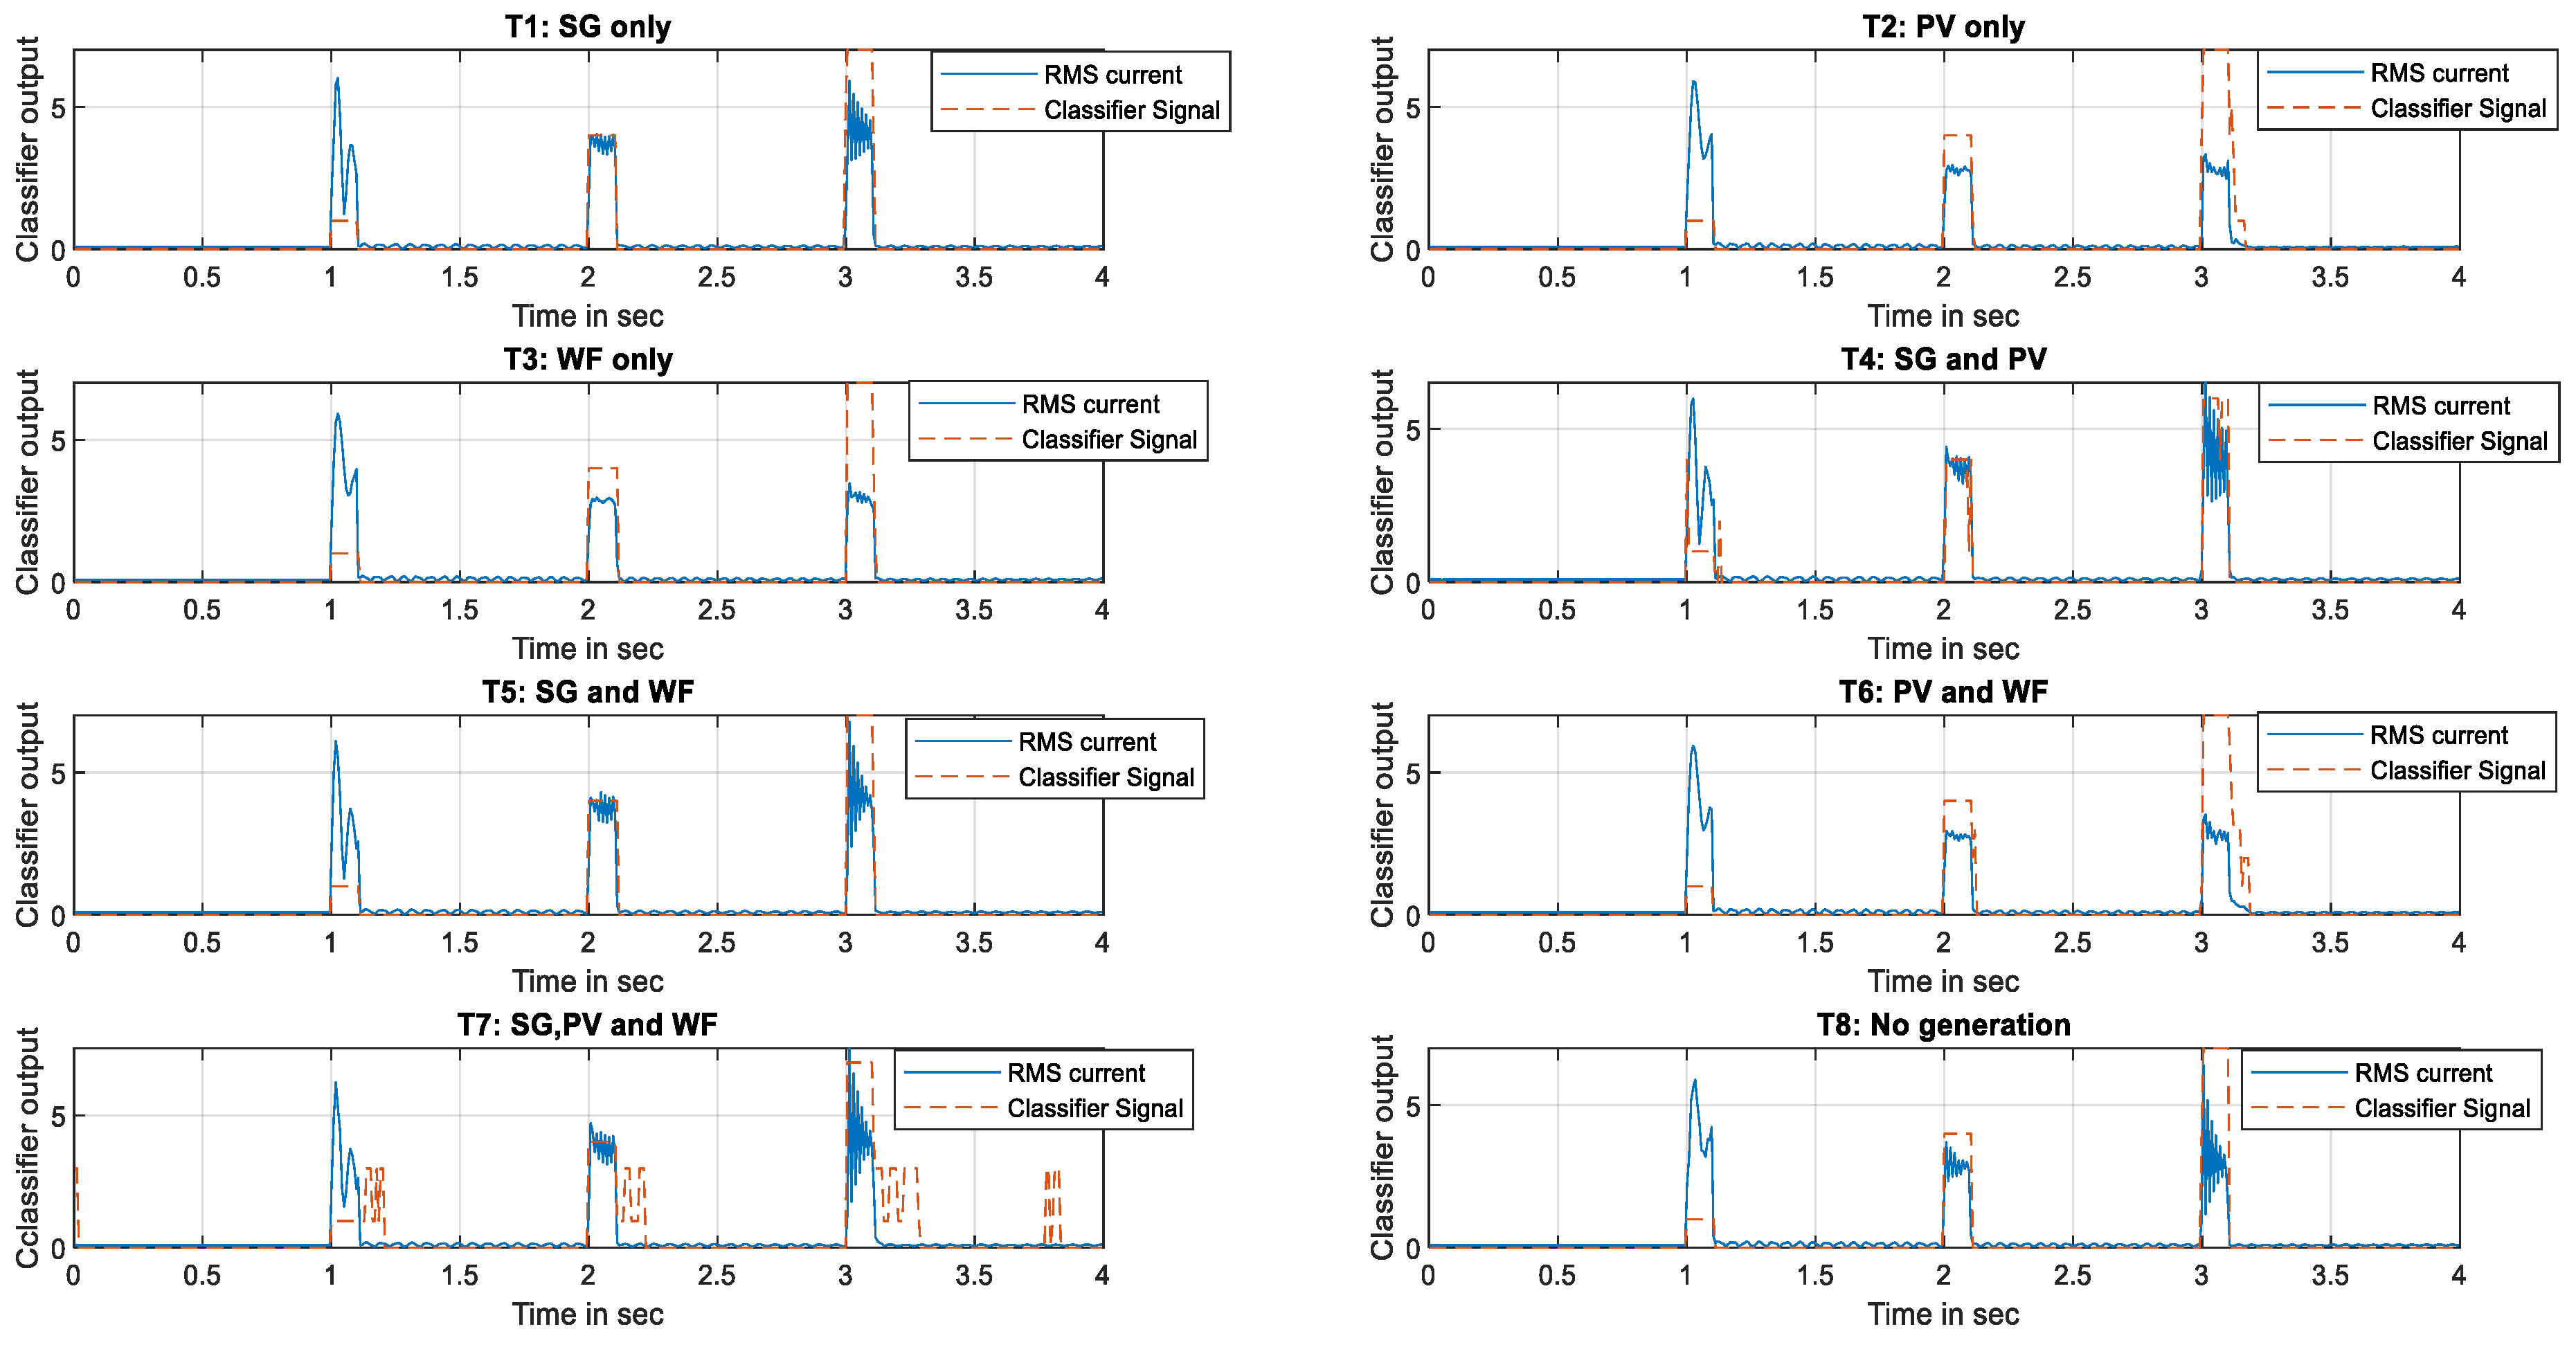
4.2. Performance Evaluation with New Fault Events

Applying new fault events could further assess the resulting classifiers’ performance. At 70 percent of the protected line (line 1-2) from the measurement point, three cascading within-the-line faults were simulated. A-G fault (class 1) was the first fault, followed by A-B fault (class 4) and A-B-C fault (class 7) at 1.0, 2.0, and 3.0 s, respectively. The fault durations were 100 msec. The faults were created for all previously defined generation topologies, each with hyperparameters and a subset of features.
As shown in Figure 7, the proposed classifiers for each generation topology were successful in precisely identifying and classifying the incepted faults. The proposed classifiers can detect and classify the faults accurately for each generation topology determined by the CB statuses and active power measurements, with the exception of a two-phase fault in topology T6 (PV and WF), where the classifier’s output was classified as class 7 (three-phase fault). In addition, after clearing the three-phase fault in T6, there was an output of fault detection as A-B fault. The misclassification occurred due to the percentage error of the classification model with this topology, which was reported as 0.81%.

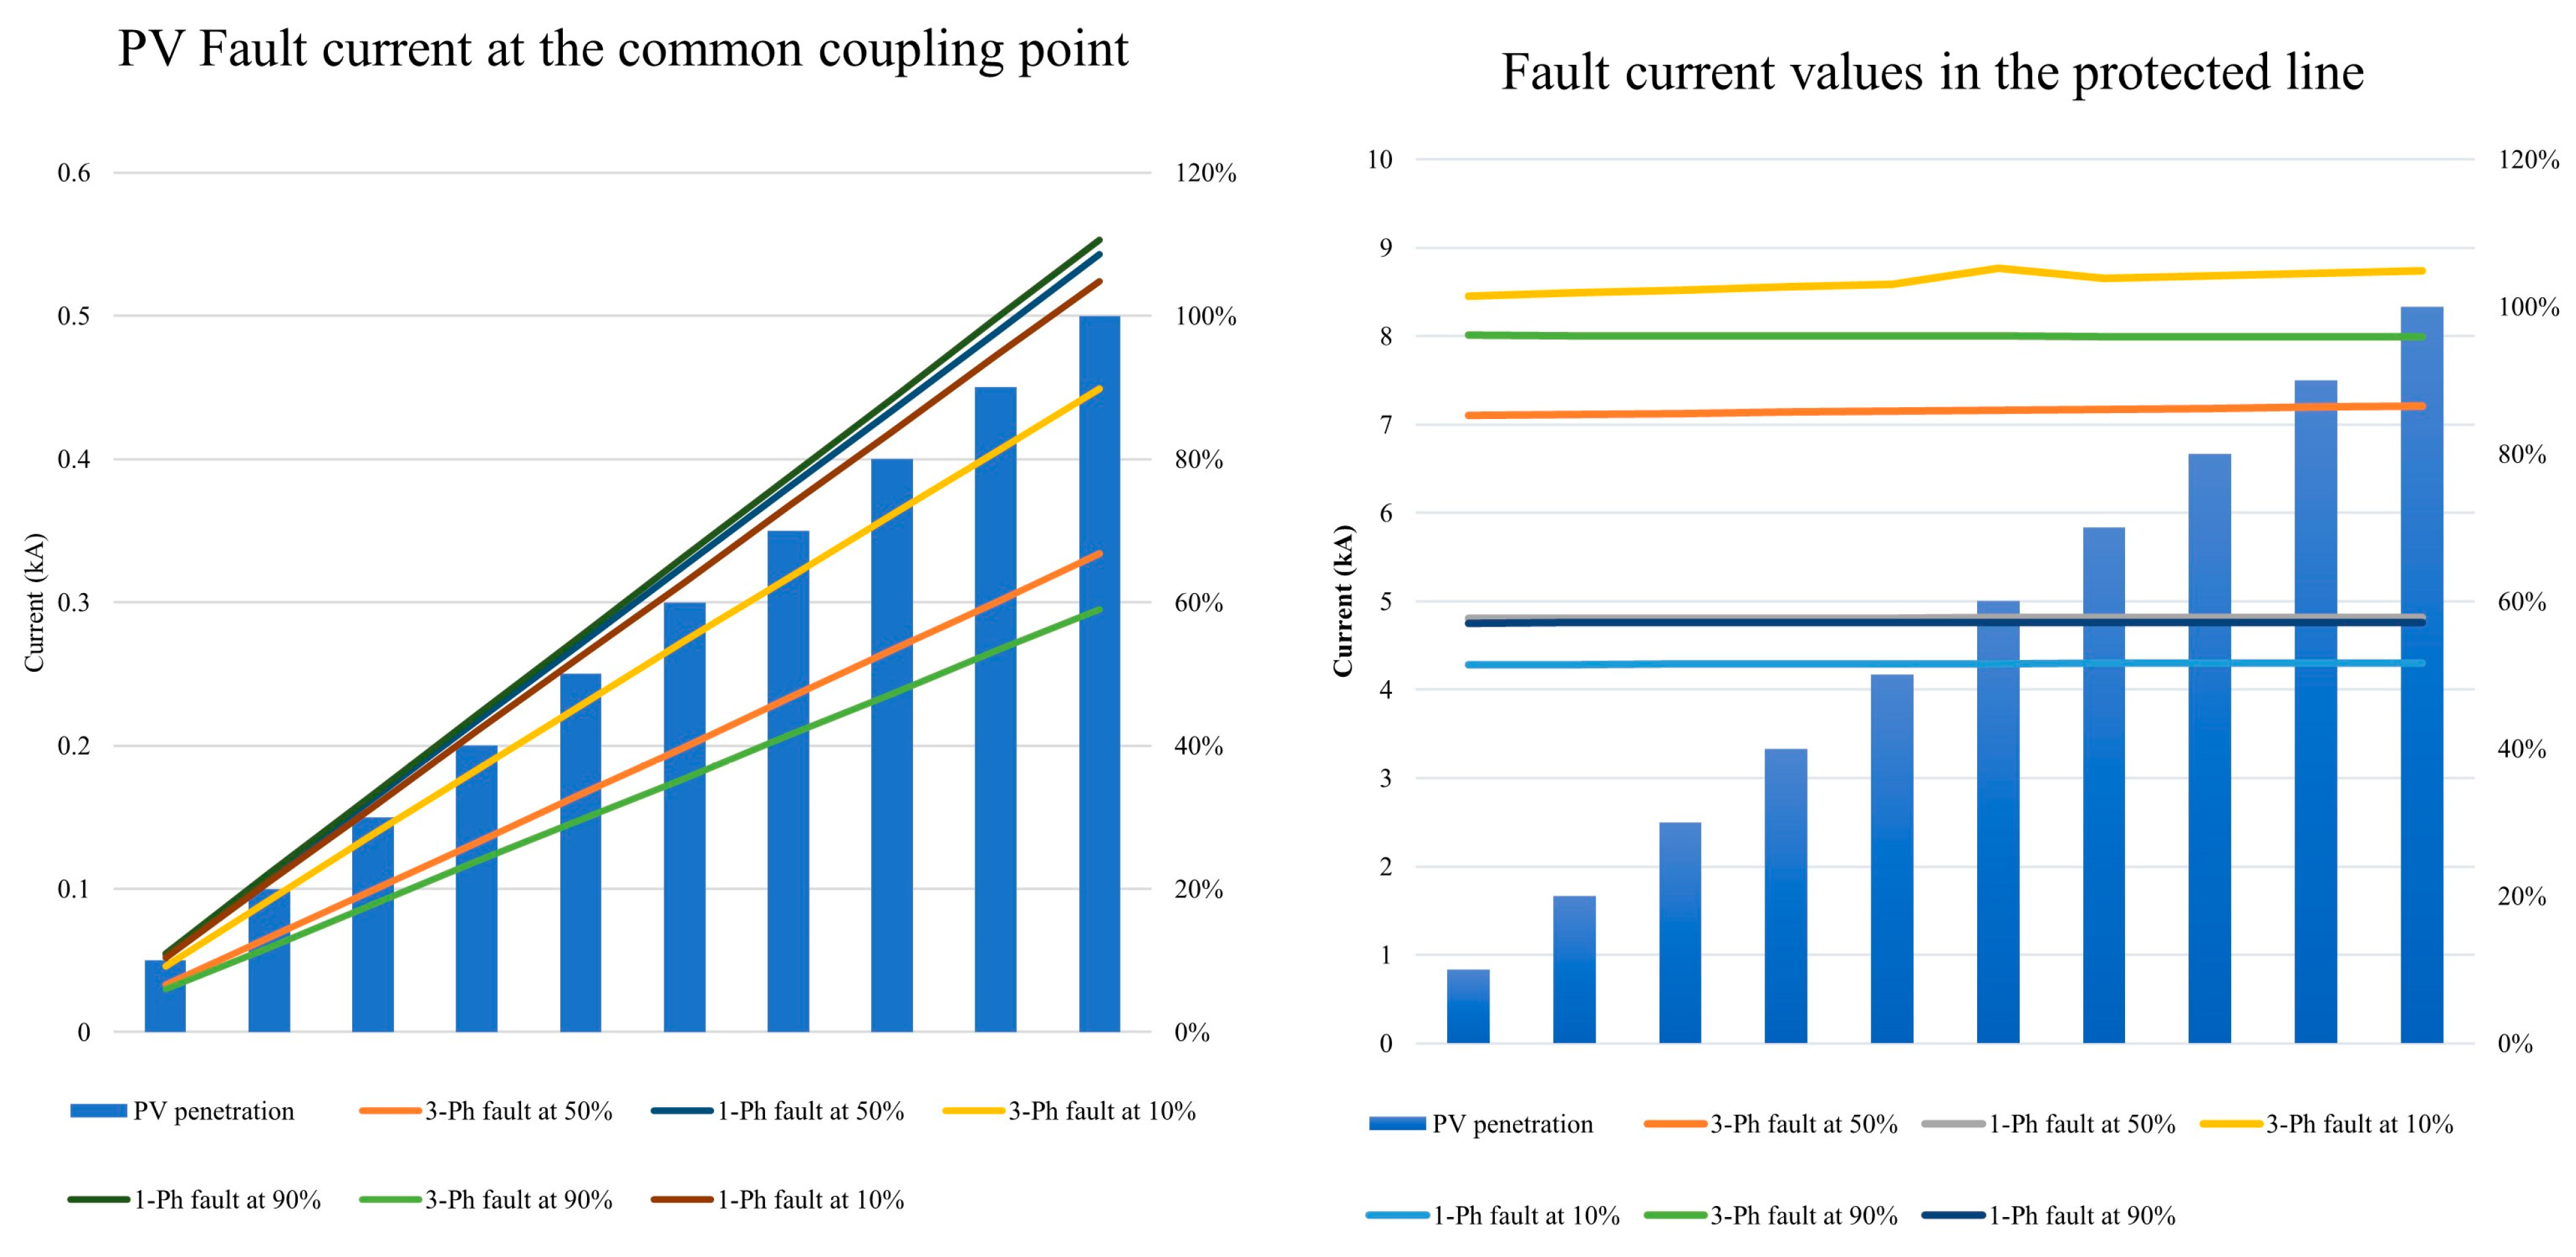
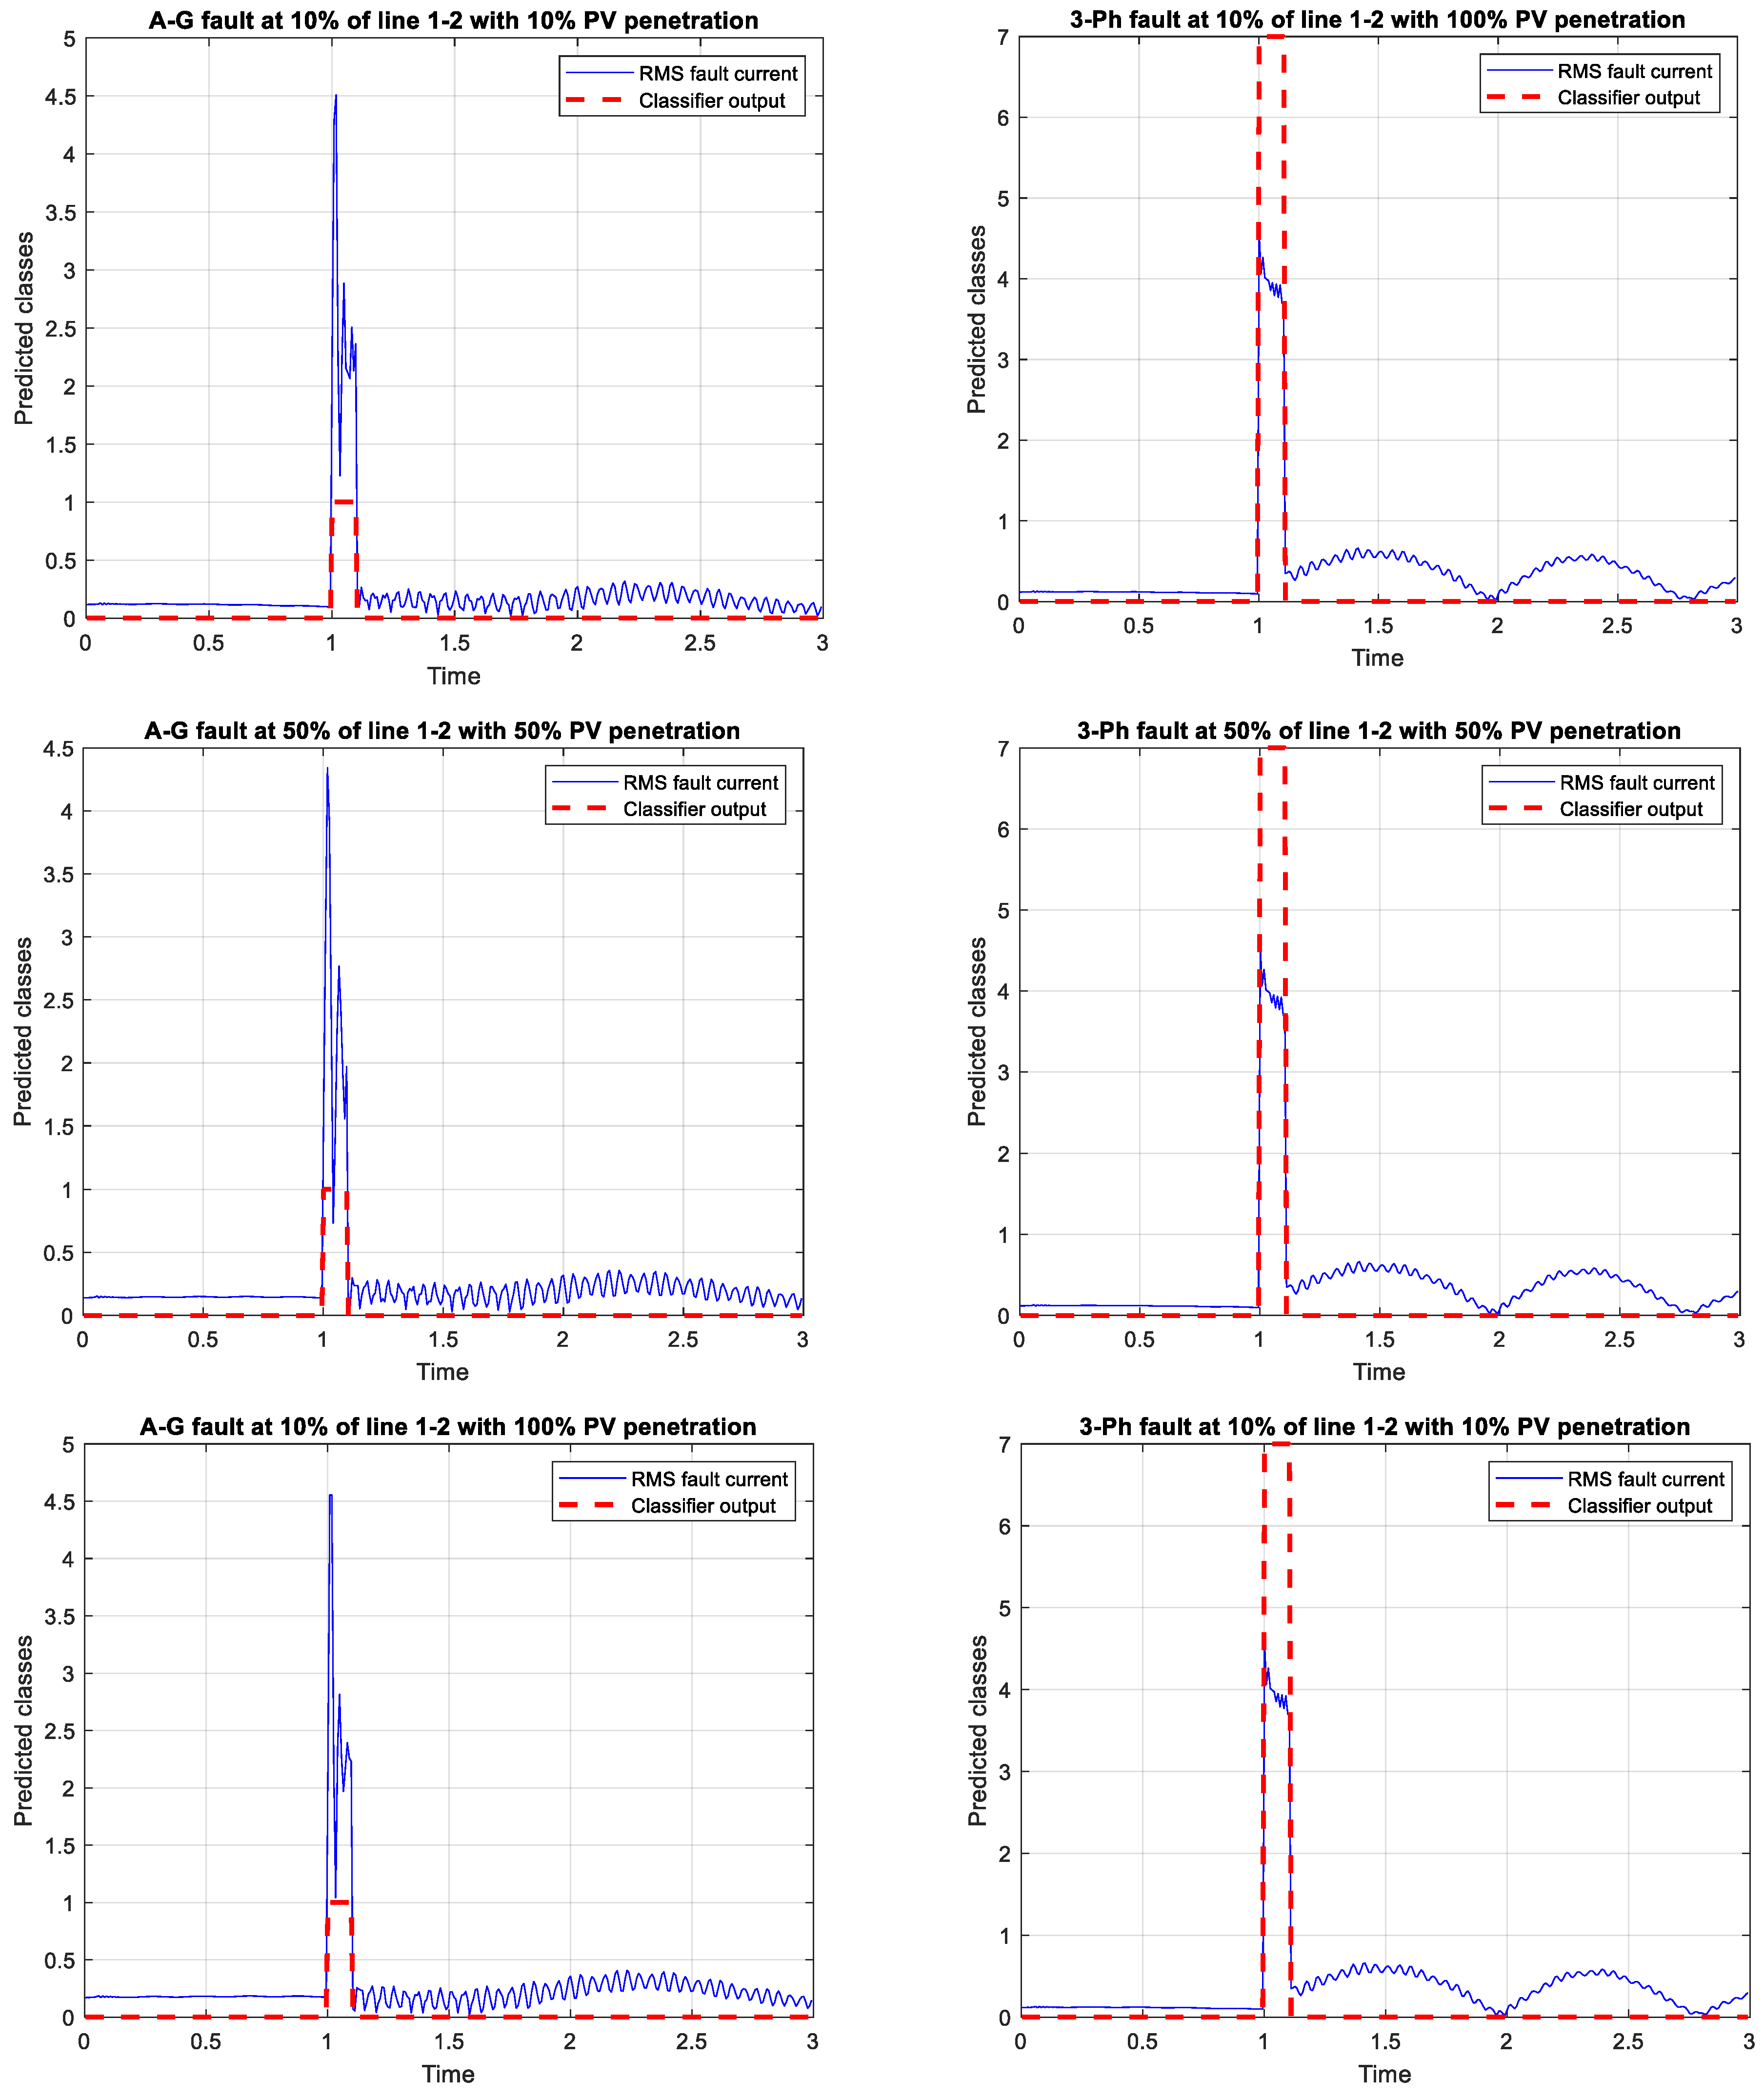
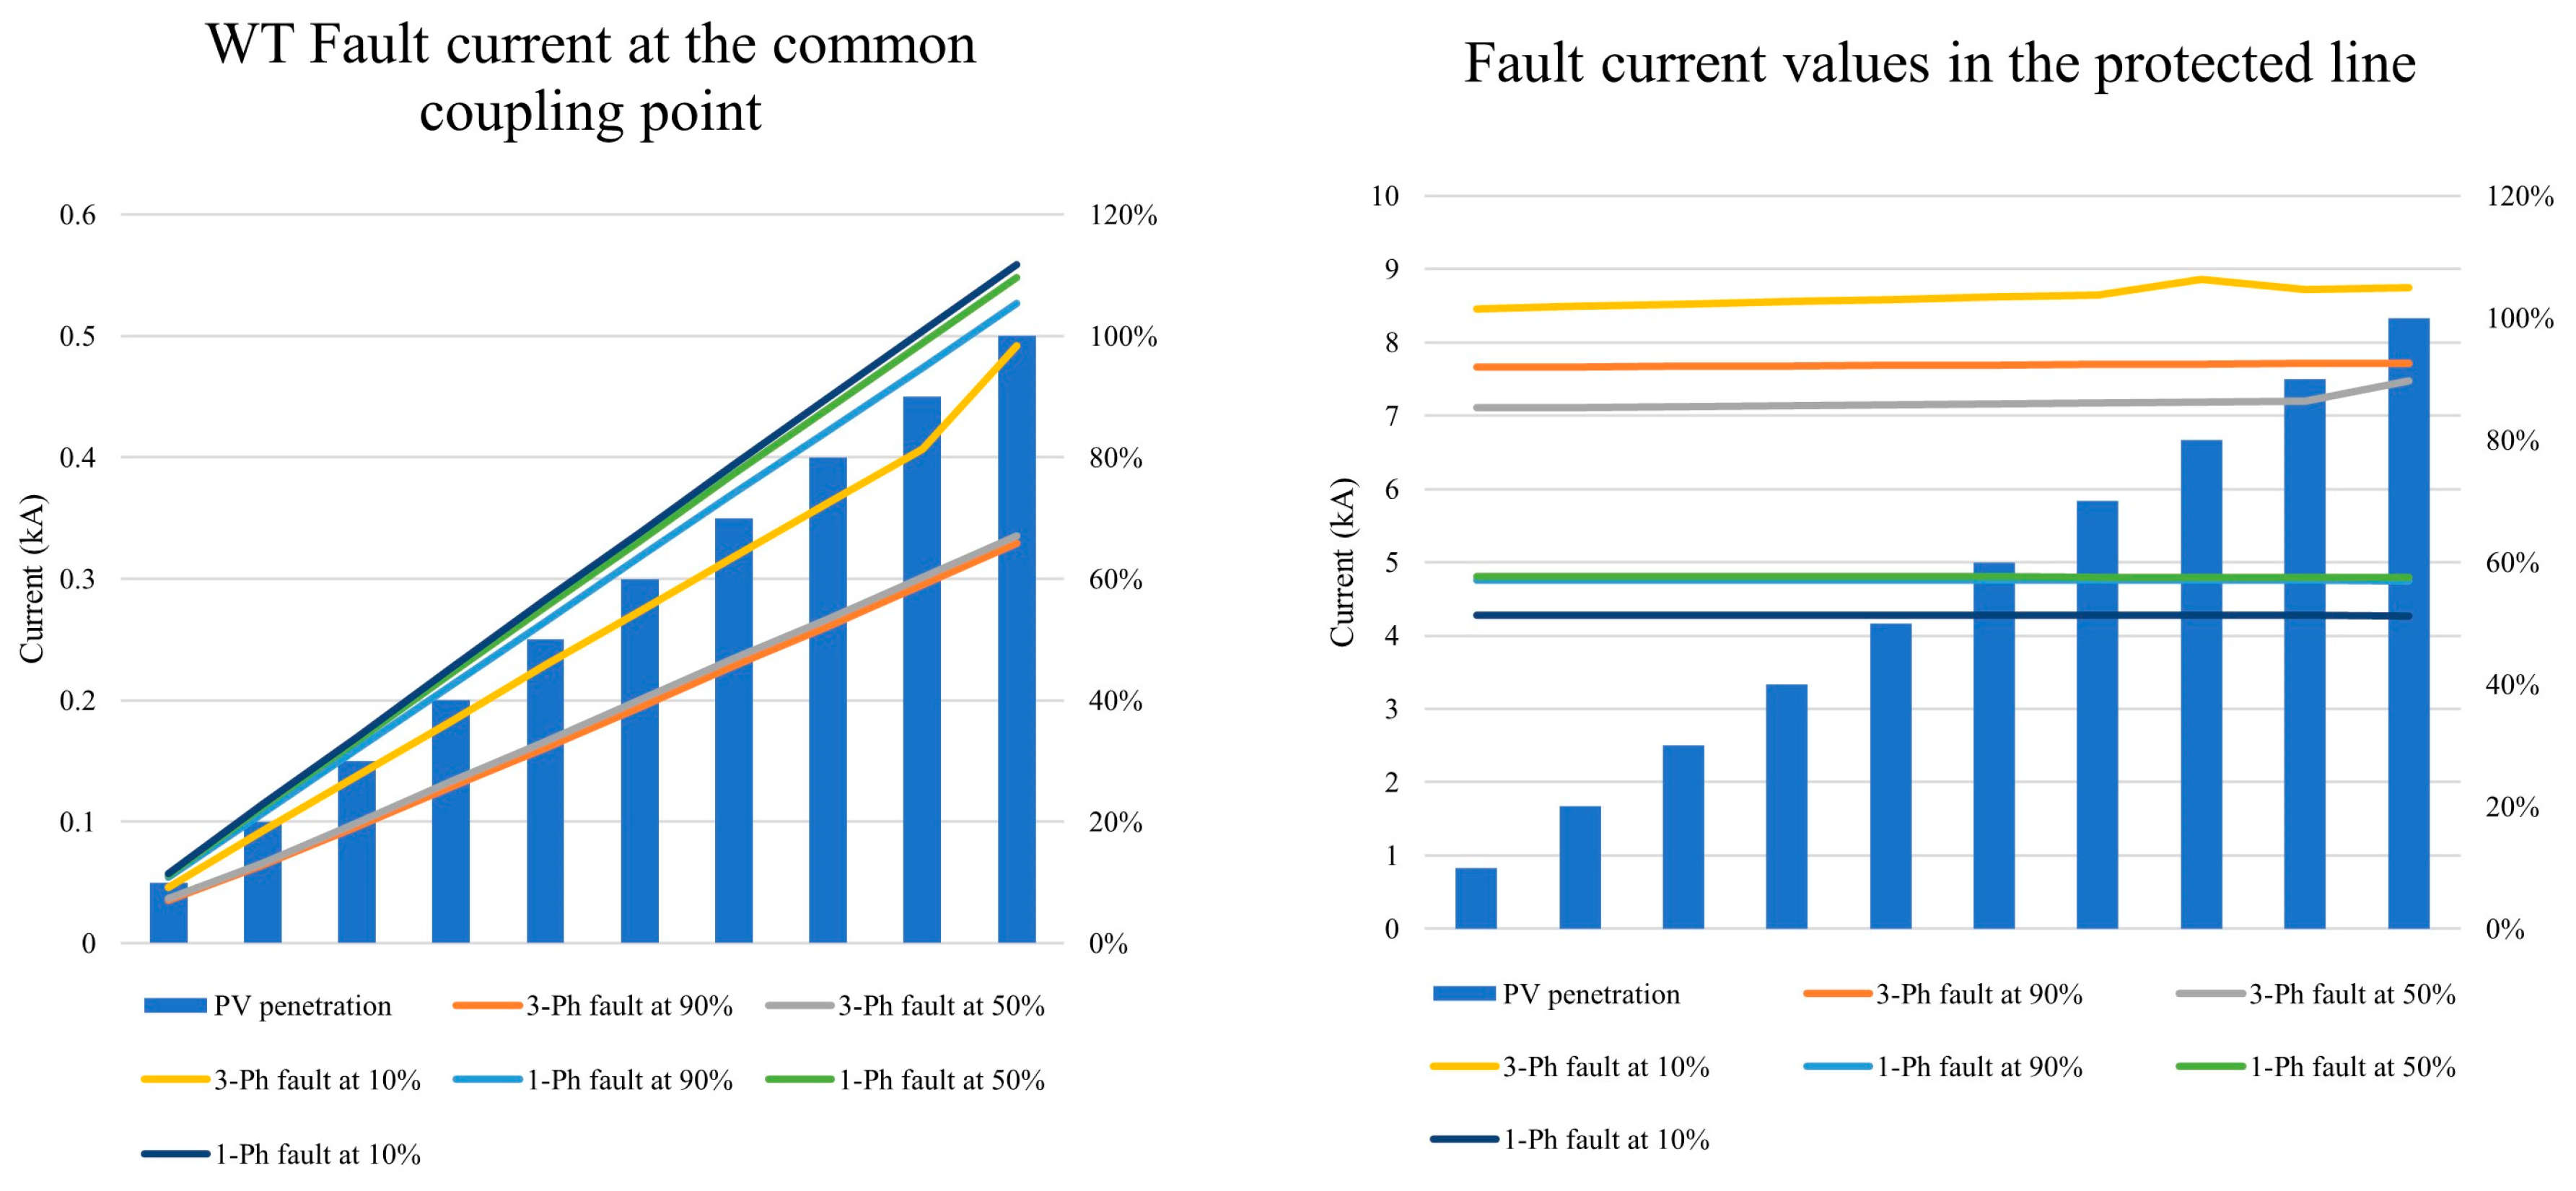
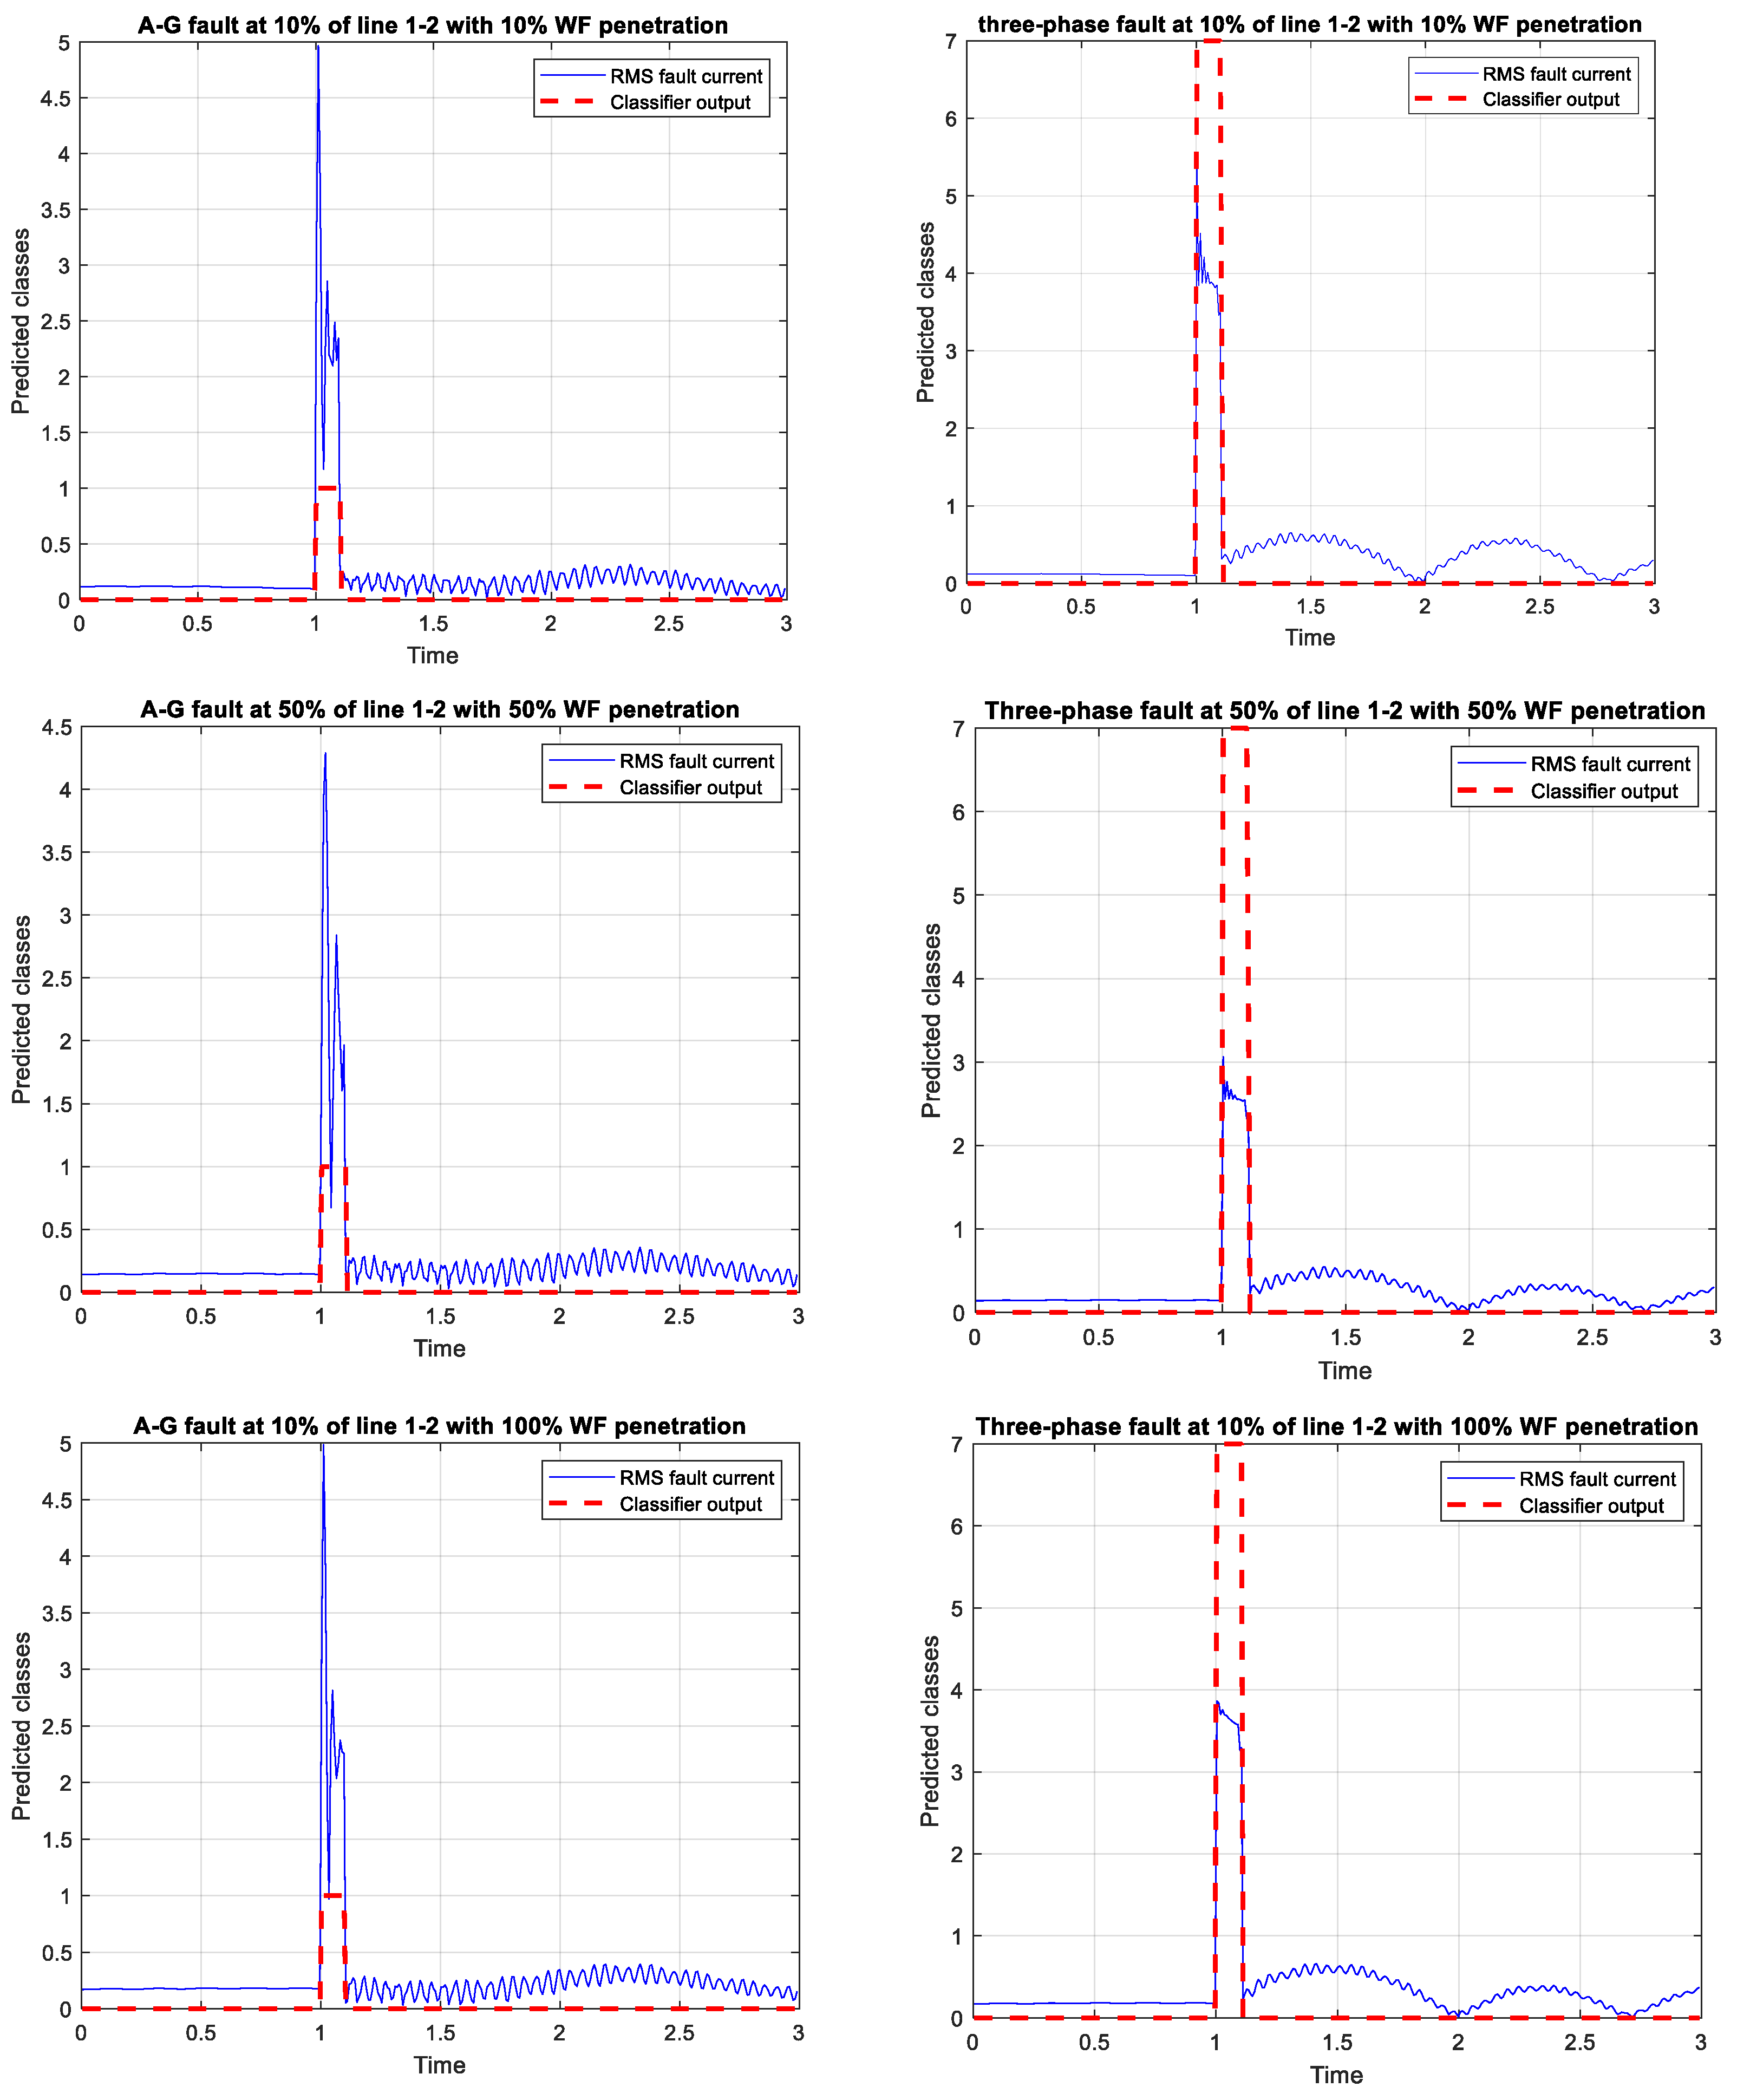
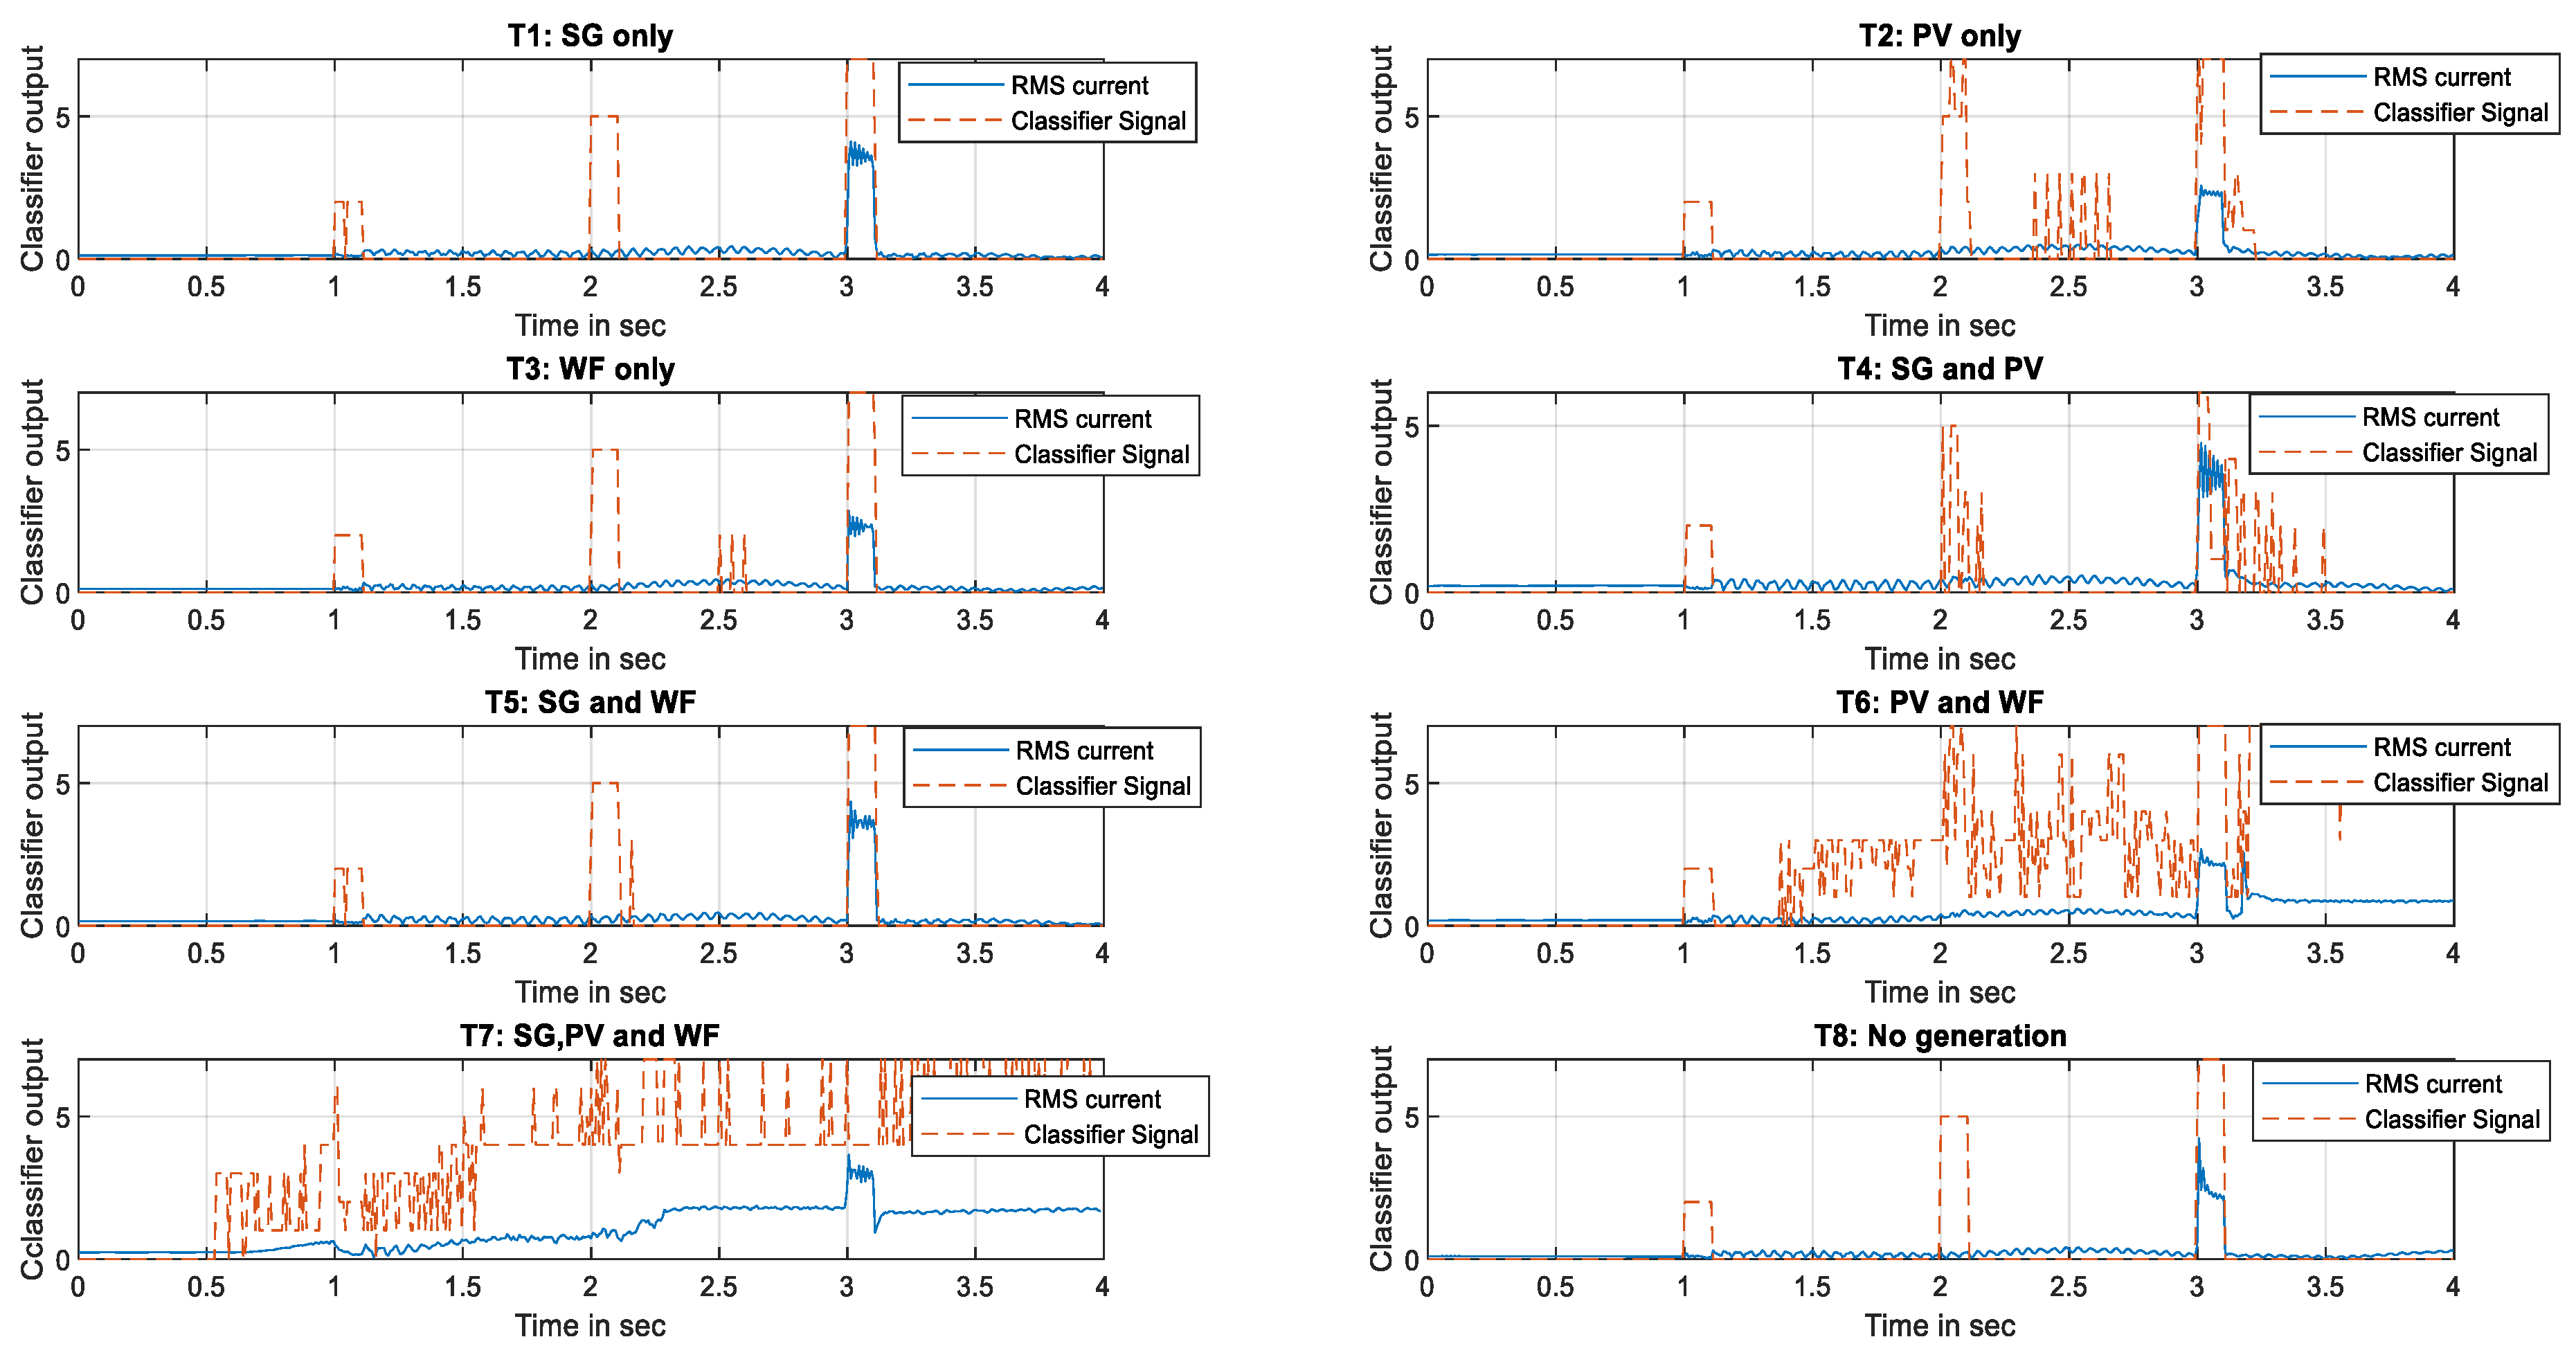
4.3. Performance Evaluation with Different IBG Penetration Levels

The training and testing datasets used to train the classifiers in the offline mode and the testing dataset were thus far simulated assuming either 0% penetration (not connected or zero output power) and 100% penetration of IBGs (wind farm and PV plant). The present section aims to evaluate the proposed classifiers’ performance at different penetration levels other than zero or 100% (i.e., 10% and 50%) for T2 and T3 generation topologies. Only these two topologies were taken into account because the synchronous generator’s (G10) fault contribution was frequently dominating and the IBGs’ (PV and wind turbines’) fault contributions were constrained by the controller parameters of the inverters.
The contributions of the PV plant and the wind farm for various faults and locations are given in Figure 8 and Figure 10, respectively, at each penetration level (10%, 50%, and 100%). The minimum fault current contribution provided by the PV plant was the three-phase fault at the end of the protected line (near bus 1), and the maximum was for a single-phase fault at the beginning of the protected line near the PV plant (Figure 8). This observation can also be made for the wind farm connected to bus 2 (Figure 10).
Figure 9 and Figure 10 display the topological performance of the T2 classification model for two distinct PV plant penetration levels and two different fault types (single- and three-phase faults) at the 10% and 50% fault locations. As can be seen, the classifier detected the faults accurately. For A–G and three-phase faults, the classifiers’ output was classes 4 and 7, respectively. The results can be generalized for other PV penetration levels and fault types.
Similarly, the classifier’s performance for the T3 setting topology was investigated for different wind farm penetration levels. Figure 11 shows that the classifier proposed for T3 could also detect all types of faults at different locations and for two levels of the wind farm output power (10% and 50%) of its maximum power. For A-G and three-phase faults, the classifiers’ output was classes 4 and 7, respectively. The results can be generalized for other wind farm penetration levels and fault types.

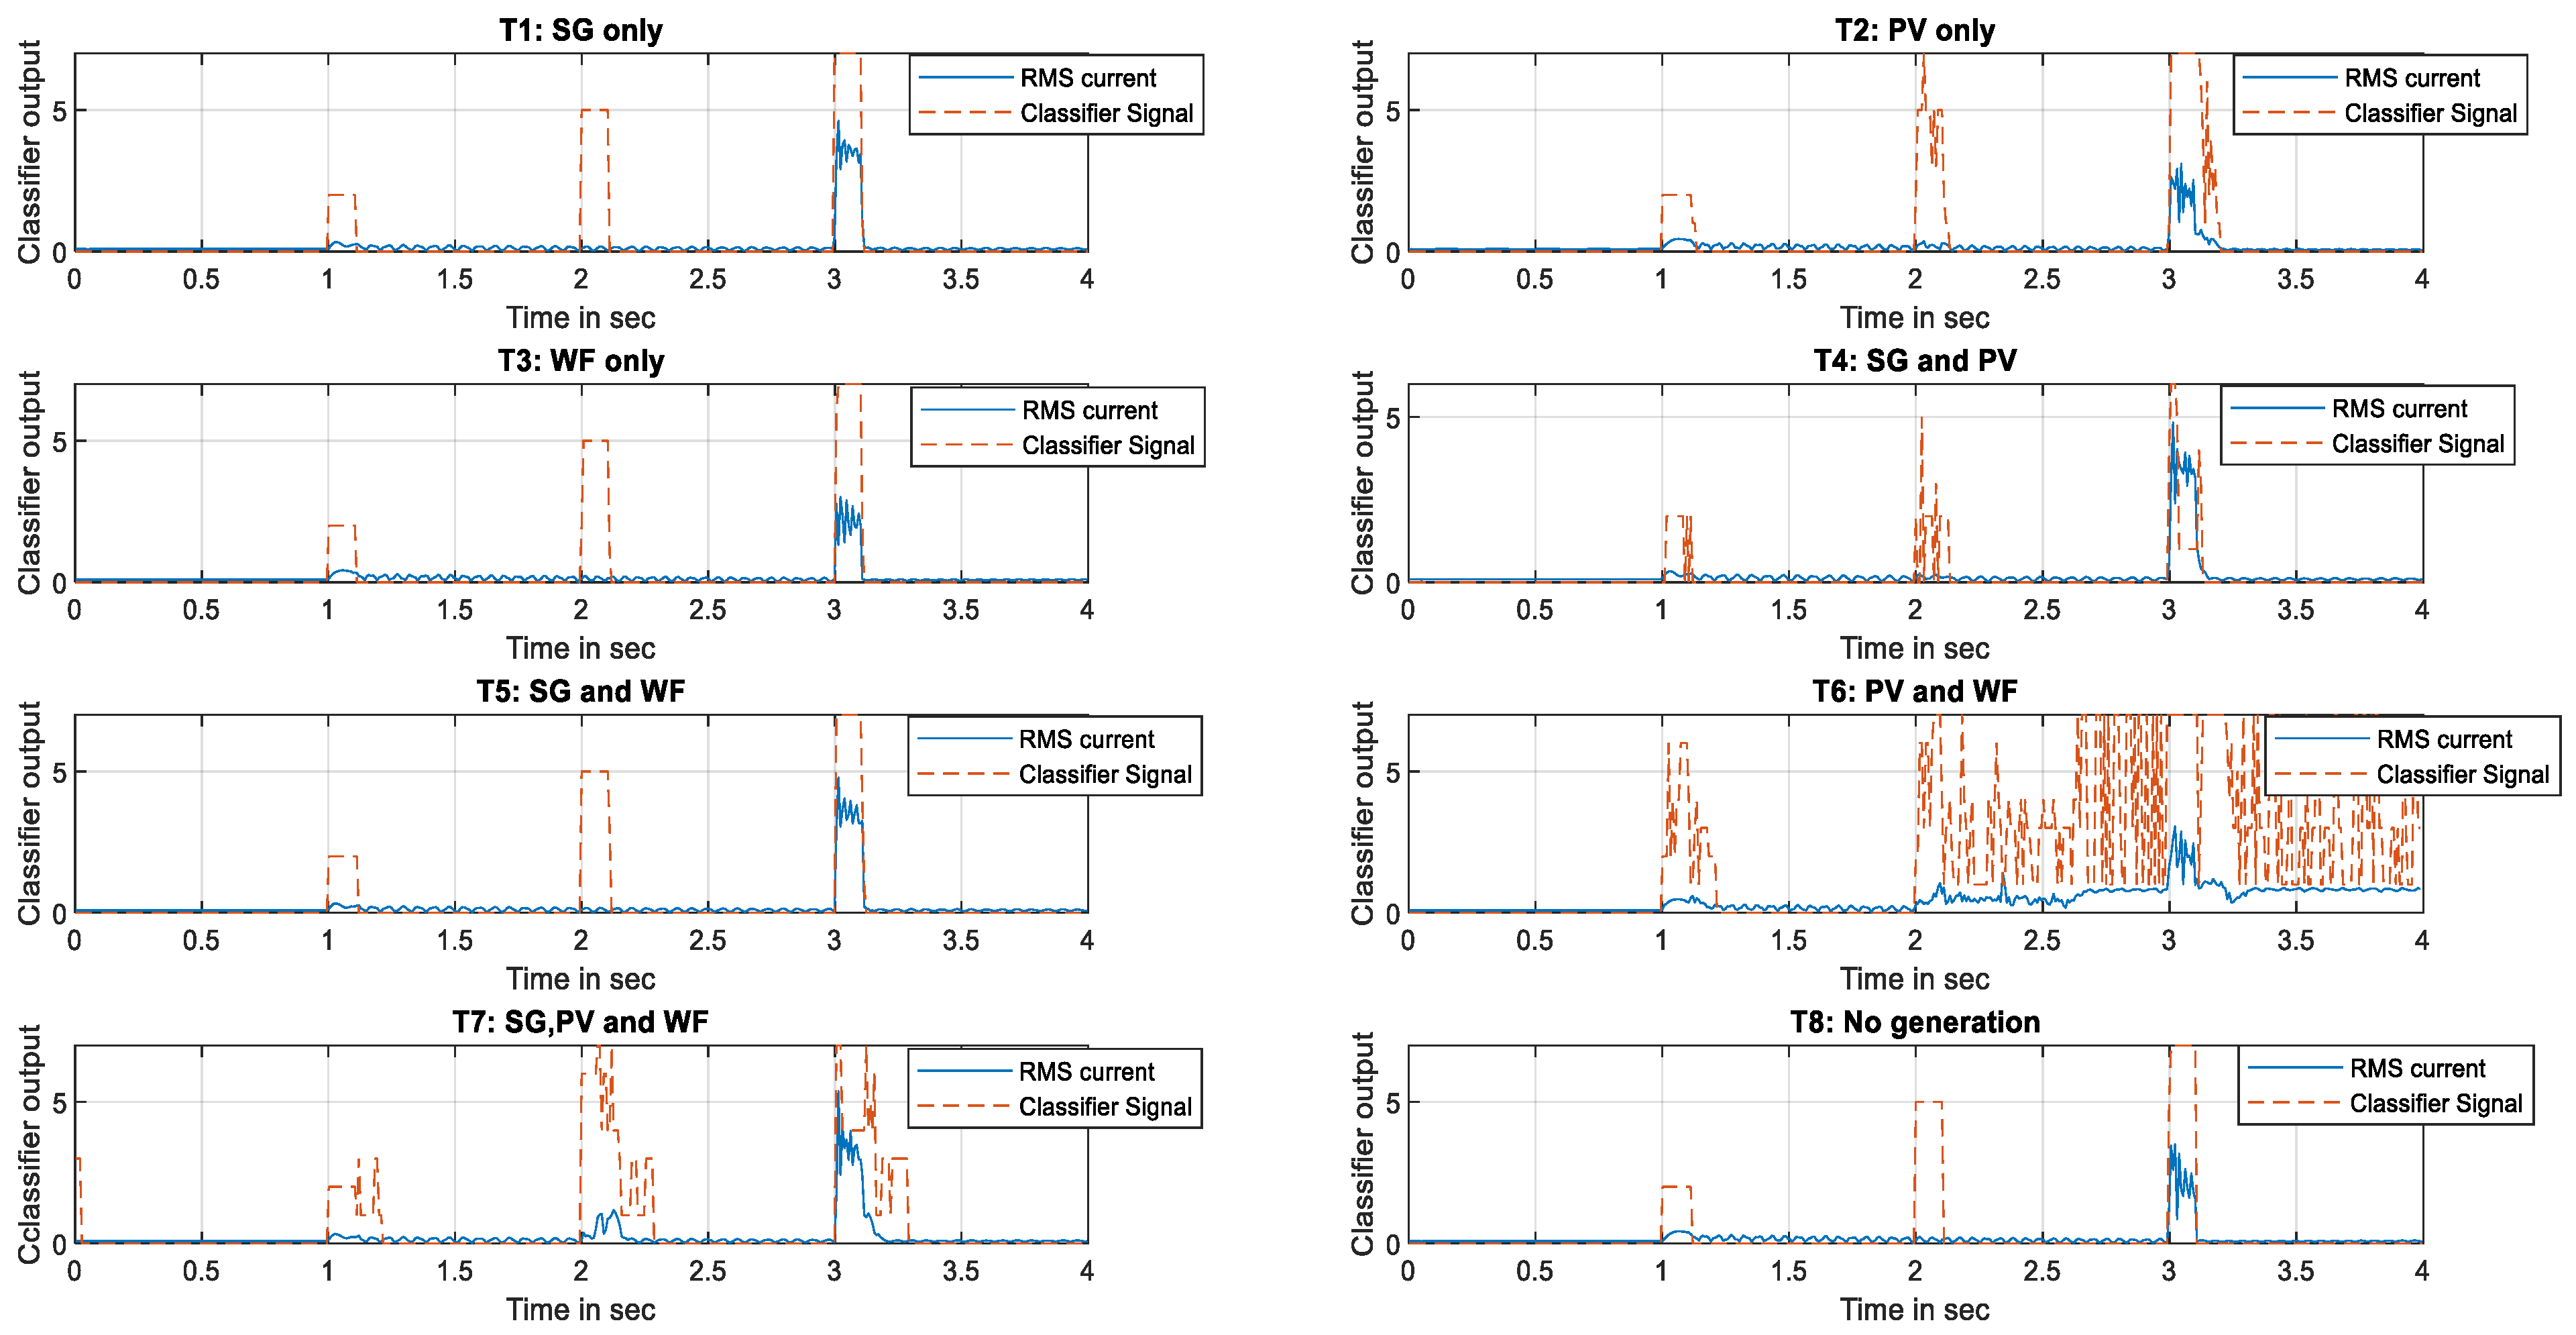
4.4. Performance Evaluation with New Transmission System Configurations

In the previous results, the investigation was achieved considering the same transmission system configuration with different generation topologies at bus 2. This section examines the performance of the developed classifiers at different transmission system configurations. Three scenarios are considered, which are shown in Figure 12. The first case is to cut off the supply from G1 by disconnecting the line 1-39. The second is to limit the contribution of G8 by switching the line 2-25 to the OFF position. The third is the disconnection of both lines. This line selection will impact different sources’ contribution to faults that occurred in the protected line (the line 1-2).
Case 1: line 1-39 outage
The outage of line 1-39 prevents the contribution of G1 to faults that occurred in line 1-2, but still, the faults are fed through bus 2 generators, line 2-25, and line 3-2. Figure 13 shows the outputs of the classifiers for each generation topology for the following faults Phase A fault (Class 1), A-B fault (Class 4), and three-phase fault (Class 7). Topologies 1, 2, 3, 4, 5, and 8 classifiers performed well in detecting and classifying these faults, which predicted them as classes 1, 4, and 7. However, the effect of line 1-39 outage was clear on topologies 6 and 7. For topology T6 (wind farm and PV plant were connected), the classifier still had outputs after a three-phase fault detection, although the fault was cleared. On the other hand, the T7 classifier detected faults after each clearing time, which should be reset to zero as the faults were cleared. By retraining them using these new batches of data, the classifier’s hyperparameters can be updated, which will enhance detection and classification performance.
Case 2: line 2-25 outage
The outage of line 2-25 prevents the contribution of G8 to faults in line 1-2, so that the faults were fed through bus 2 generators, line 1-39, and line 3-2. Figure 14 shows the outputs of the classifiers for each generation topology for the following faults: Phase B fault (Class 2), Phase B to C fault (Class 5), and three-phase fault (Class 7). It could be noted that although the magnitude of the RMS current for single- and two-phase faults was minimum, the classifiers were able to detect these faults in topologies 1, 2, 3, 4, 5, and 8. The misclassification rate was high in the case of topologies 6 and 7, where the PV plant and WF were connected to bus 2. Retraining the classifiers with this new dataset or taking into account the new setting group for each transmission network configuration could increase the detection and classification performance. The classifiers performed worse in this case than they did in the first.
Case 3: line 2-25 and line 1-39 outages
The combination outage of lines 2-25 and 1-39 allows the fault to be fed through bus 2 generators and lines 3-2. Figure 15 shows the outputs of the classifiers for each generation topology for the following faults: Phase B fault (Class 2), B-C fault (Class 5), and three-phase fault (Class 7). As in case 2, the magnitude of the RMS current of single-phase and phase-phase faults is low, but the classifiers were able to detect these two faults in most cases using other proposed features in different domains. The classifiers at each generation topology can efficiently detect the three types of faults, except for topologies 6 and 7. The misclassification events in topology 6 were more, and an update of the classifier’s hyperparameters was required to include this transmission topology with the PV system connection. Generation topology 7 had an issue with fault detection after each fault-clearing event, with misclassification between classes 5 and 7.
By implementing a new system topology and following the instructions in Figure 4 to identify the setting groups, as well as by converting the existing classifiers’ models into incremental learning to update hyperparameters by retraining them with any new data stream, the misclassification events in cases 2 and 3 can be reduced.

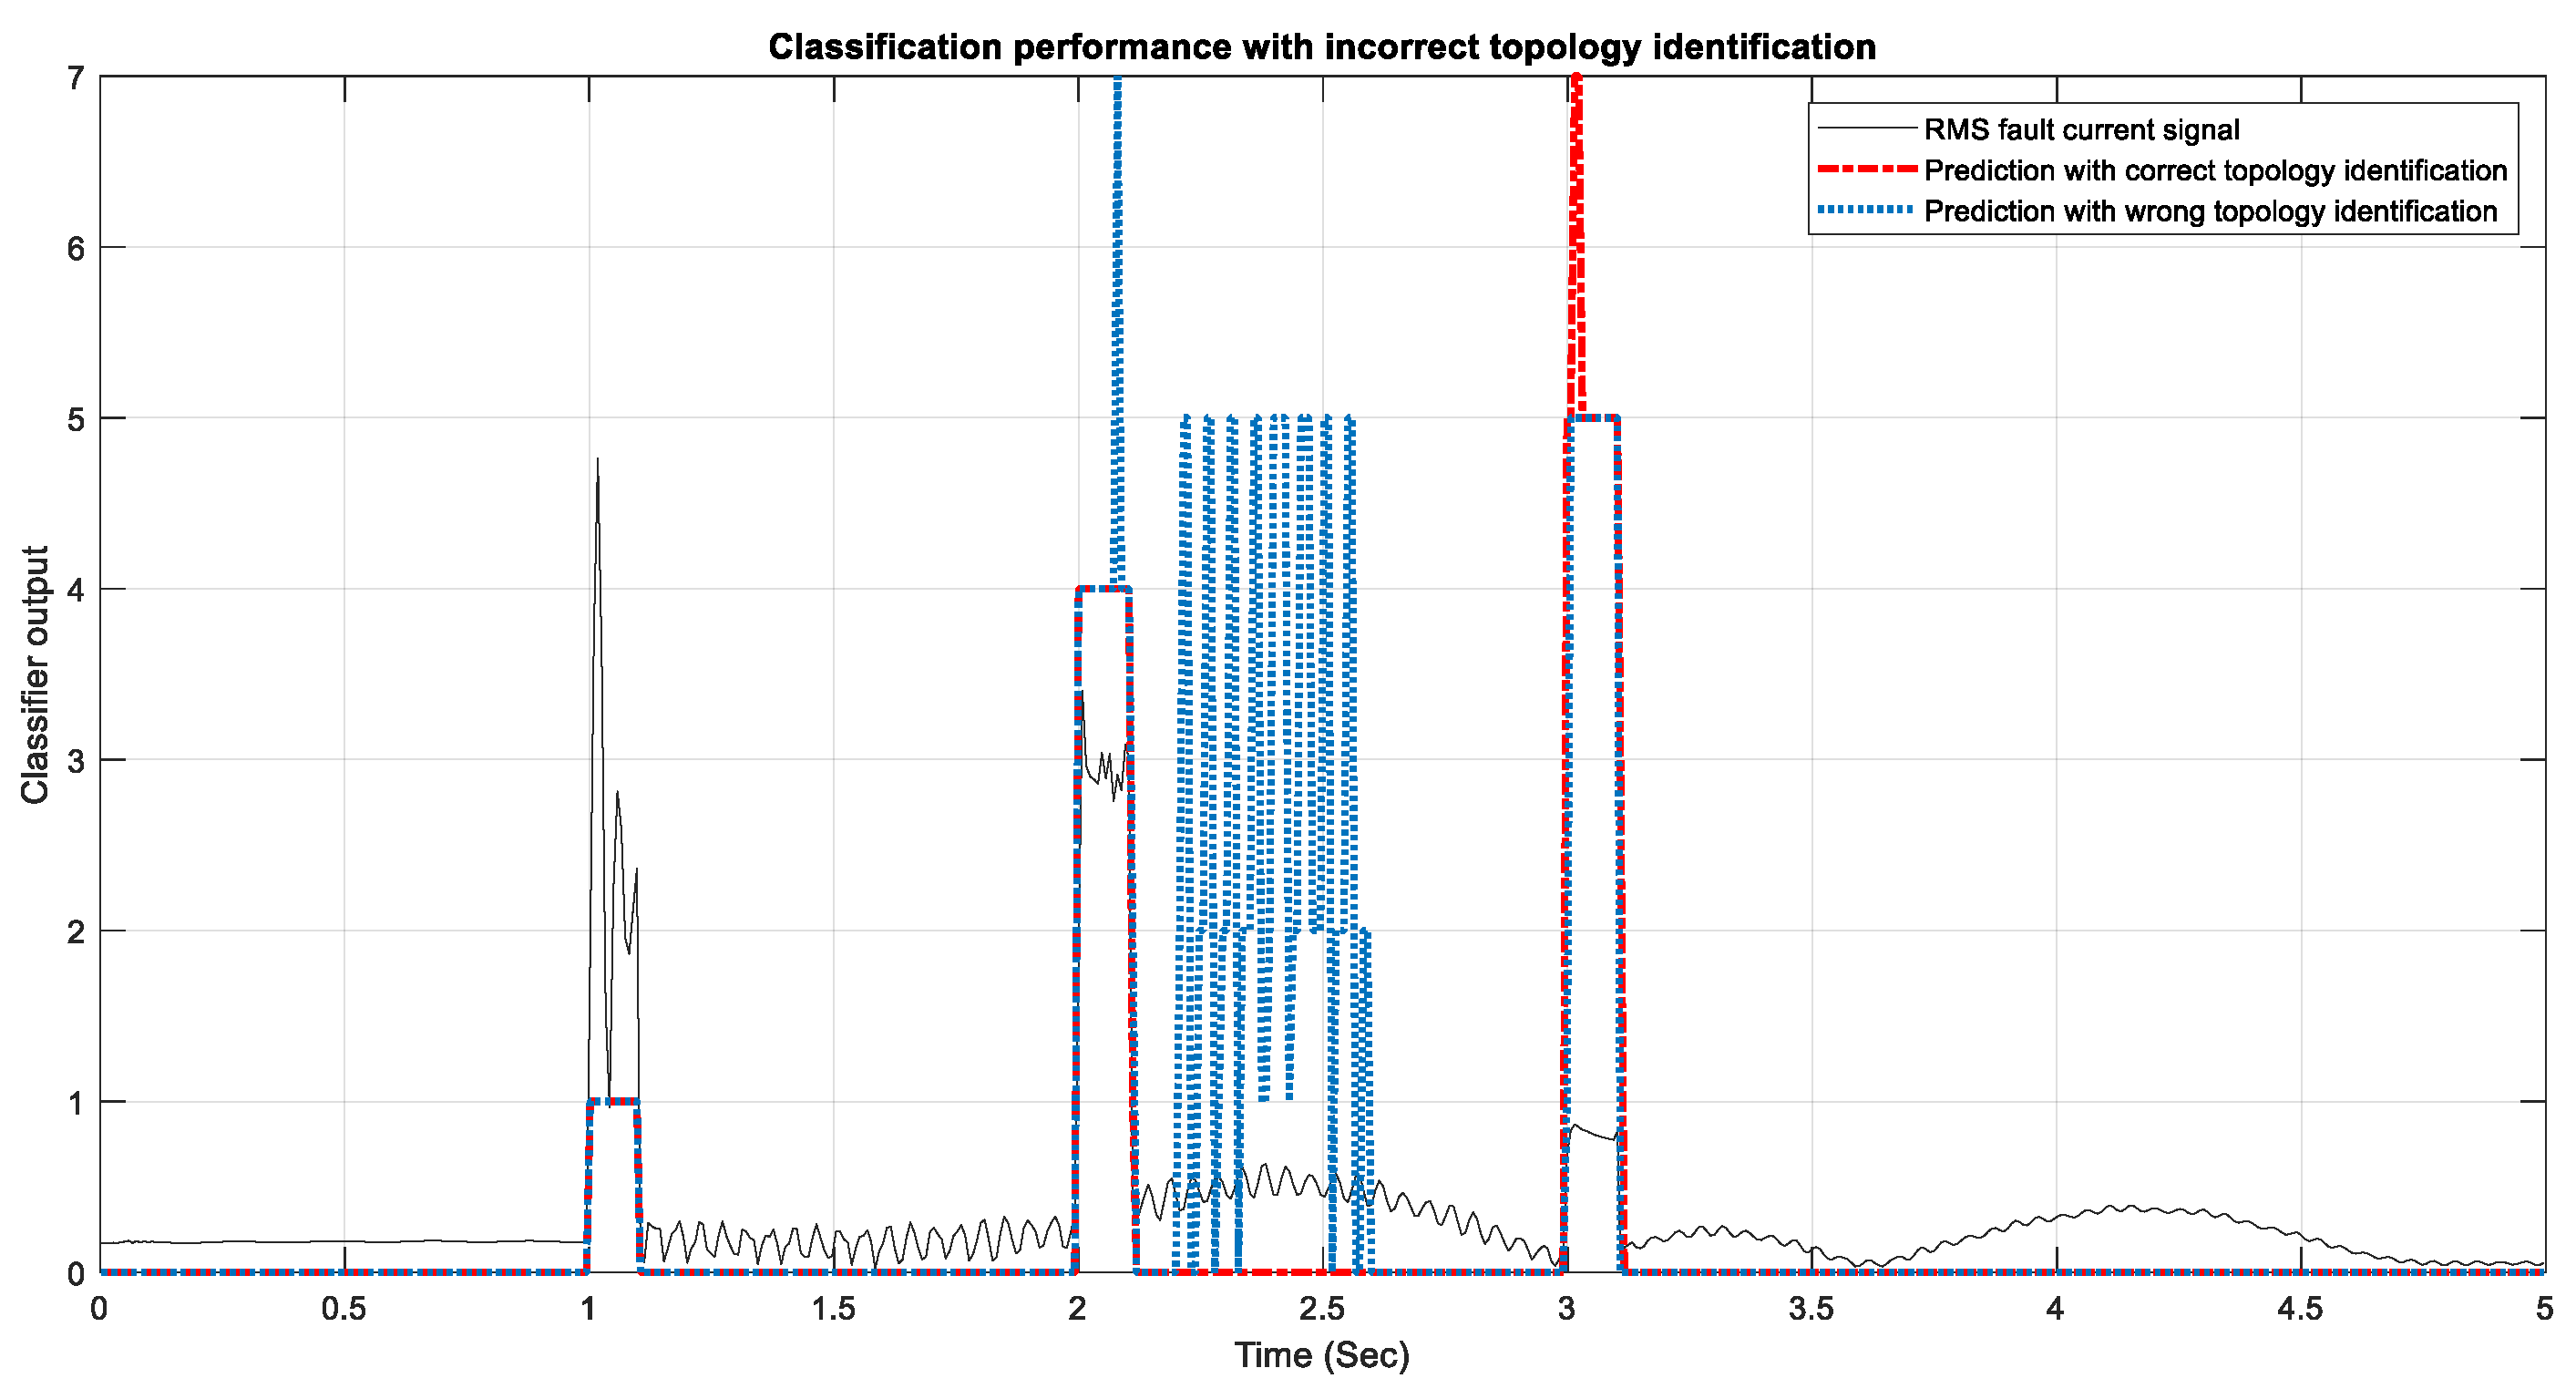
4.5. Performance Evaluation for Incorrect Topology Identification

The previous analysis assumes the correct identification of generation topology. However, there is a possibility of incorrect identification of the topology, and, hence, the setting group is inappropriately selected. To investigate this case, the performance of the classifiers is assessed by creating faults in the protected line at a specific generation topology with the different selected setting groups.
Fault scenario: Three cascaded in-zone faults at 70% of the protected line (Line 1-2) from the measurement point were simulated. The first fault was an A-G fault (class 1) at 1.0 s, the second was followed by an A-B fault (class 4) at 2.0 s, and the third was a three-phase fault (class 7) at 3.0 s. The fault durations were 100 ms. The faults were created when the PV plant was only connected to bus 2. This means that T2 should be selected as the setting group. The selected setting group (wrong selection): topology 1 (SG only).
Results: Figure 16 depicts the RMS current signal for each of the three faults: A-G fault (Class 1), A-B fault (Class 4), and three-phase fault (Class 7) and the prediction of the classifiers in setting group 1 (wrong selection) and setting group 2 (correct selection). It is evident that the prediction of a single-phase fault was correct in the case of correct and wrong topology identification, but the classifier of setting group 1 misclassified the two-phase fault (A-G fault), which was predicted as classes 4 and 7, and the three-phase fault, that was also predicted as classes 5 and 7. Moreover, there were incorrect predictions of normal events after clearing the second fault using the classification model of setting group 1. This result can be generalized for other setting groups. Correct identification of the generation topology resulted in the appropriate selection of the setting group and, hence, correct detection and classification of the faults. One way to mitigate this issue is to convert the classification models into incremental learning models where they are retrained and the hyperparameters are updated to fit the new system events.

4.6. Comparative Analysis of Different Methods in the Literature

The proposed adaptive scheme in this paper is compared with the previous methods of adaptive approaches using system topology identification and machine learning. Table 4 presents four research studies along with our proposed approach. It could be noticed that each method follows different approaches to define the topology, identify the system configuration, and utilize ML procedures. Our approach’s classification accuracy outperformed the approach in [7] for the 39-bus IEEE power system. This could be due to the dataset having more valuable features, including features from different domains, as well as the performance of the feature selection method, which selects features that maximize classification accuracy. The references [10,11] depend on deep learning techniques to identify the system topologies, which require lots of data gathered at different locations in the power system.
Moreover, it is evident that the definition of system topology in this research was specific to the types of generation units connected to one bus, while others were related to the connection and disconnection of lines, buses, and other system elements.
In comparison to [7], which used the PSO algorithm to optimize the hyperparameters of the classifier, the proposed approach used a Bayesian optimization algorithm, resulting in better performance.

5. Conclusions

This paper proposes an adaptive ML-based fault detection and classification approach for transmission lines connected to inverter-based renewables like PV plants and wind farms with type-3 wind turbines. The adaptative scheme tracked the availability of a synchronous generator, PV plant, and wind farm behind the protected transmission line. The generation topology was identified using two field data: circuit breaker status and active output power measurement.
The setting groups were selected for the eight system topologies, including optimized ensemble tree classification models’ hyperparameters for fault detection and classification. The reported averaged classifiers’ performance was 98.79% accuracy, 98.92% precision, 98.76% recall, and 99.82% specificity.
Several system events were evaluated for the robustness of the classifiers: fault events at the protected line, different IBG penetration levels, and new transmission system configurations. The proposed classifiers can efficiently detect and classify faults incepted in the protected lines and for different IBG penetration levels (10%, 50%, and 100%). Changing the transmission system configuration and incorrect selection of the setting group degraded the performance of the developed classifiers in several cases. One of two methods can be used to overcome this. The first is creating new setting groups, and the ML models are used for each one. This approach has limitations to the number of available setting groups equipped with protective devices and the difficulty of assuming all expected scenarios of the system topologies for large-scale power systems. The second is retraining the same classifiers with new system events or converting the existing classifiers into incremental models. Incremental learning updates the models without ignoring the previously accumulated knowledge, and adapts to any new system event at each topology. Incremental learning algorithms will be considered in future studies.
Furthermore, a practical implementation of the scheme is suggested for proof of concept (POC) using a real-time digital simulator. The scheme can also be improved by facilitating fault localization and fault direction. The improvement requires more data samples for fault localization and adding features to indicate the fault direction. In addition, the design framework of this research was limited to allocating protection at only one end of the transmission line in the power system. The scheme may be developed similarly to other transmission lines with appropriate coordination procedures. Moreover, advanced methods of incipient fault diagnosis analysis, such as [35,36], can be studied further to improve detectability and speed.

Author Contributions

Conceptualization, K.A.K.; methodology, K.A.K.; software, K.A.K.; validation, K.A.K., A.E.H. and M.M.; formal analysis, K.A.K., A.E.H. and M.M.; investigation, K.A.K.; resources, K.A.K.; data curation, K.A.K.; writing—original draft preparation, K.A.K.; writing—review and editing, A.E.H. and M.M.; supervision, A.E.H. and M.M. All authors have read and agreed to the published version of the manuscript.

Funding

This research received no external funding.

Acknowledgments

The authors are thankful to the Department of Electrical Engineering, Sultan Qaboos University, for providing facilities to conduct this research.

Conflicts of Interest

The authors declare no conflict of interest.

References

  1. Mukherjee, S.; Marshall, M.; Smith, T.; Piesciorvosky, E.; Snyder, I.; Sticht, C. Adaptive Protective Relay Settings—A Vision to the Future. In Proceedings of the 2022 IEEE Rural Electric Power Conference (REPC), Tulsa, OK, USA, 23–25 April 2022; pp. 25–30. [Google Scholar] [CrossRef]
  2. Liu, S.; Bi, T.; Liu, Y. Theoretical analysis on the short-circuit current of inverter-interfaced renewable energy generators with fault-ride-through capability. Sustainability 2017, 10, 15. [Google Scholar] [CrossRef] [Green Version]
  3. Voima, S.; Kauhaniemi, K. Adaptivity of Protection in Smart Grids. In Proceedings of the PAC World Conference, Budapest, Hungary, 25–28 June 2012; Available online: http://sgemfinalreport.fi/files/P024.pdf (accessed on 9 August 2022).
  4. Ray, P.; Mishra, D.P. Support vector machine based fault classification and location of a long transmission line. Eng. Sci. Technol. Int. J. 2016, 19, 1368–1380. [Google Scholar] [CrossRef] [Green Version]
  5. Ali, S.F.A.A.M.; Kumar, M.; Muthukaruppan, V. Utility Perspective Towards Machine Learning Techniques in Power System Protection. IRJET 2021, 8, 4140–4146. [Google Scholar]
  6. Lawal, I.A.; Abdulkarim, S.A. Adaptive SVM for data stream classification. S. Afr. Comput. J. 2017, 29, 27–42. [Google Scholar] [CrossRef] [Green Version]
  7. Lin, H.; Sun, K.; Tan, Z.H.; Liu, C.; Guerrero, J.M.; Vasquez, J.C. Adaptive protection combined with machine learning for microgrids. IET Gener. Transm. Distrib. 2019, 13, 770–779. [Google Scholar] [CrossRef]
  8. Poudel, B.; Garcia, D.R.; Bidram, A.; Reno, M.J.; Summers, A. Circuit Topology Estimation in an Adaptive Protection System. In Proceedings of the 2020 52nd North American Power Symposium, NAPS 2020, IEEE, Tempe, AZ, USA, 11–13 April 2021; pp. 1–6. [Google Scholar] [CrossRef]
  9. Marín-Quintero, J.; Orozco-Henao, C.; Percybrooks, W.S.; Vélez, J.C.; Montoya, O.D.; Gil-González, W. Toward an adaptive protection scheme in active distribution networks: Intelligent approach fault detector. Appl. Soft Comput. 2021, 98, 106839. [Google Scholar] [CrossRef]
  10. Yavuz, L.; Soran, A.; Önen, A.; Muyeen, S.M. An adaptive fault detection scheme using optimized self-healing ensemble machine learning algorithm. CSEE J. Power Energy Syst. 2021, 8, 1145–1156. [Google Scholar] [CrossRef]
  11. Tang, W.J.; Yang, H.T. Data Mining and Neural Networks Based Self-Adaptive Protection Strategies for Distribution Systems with DGs and FCLs. Energies 2018, 11, 426. [Google Scholar] [CrossRef] [Green Version]
  12. Memon, A.A.; Kauhaniemi, K. An adaptive protection for radial AC microgrid using IEC 61850 communication standard: Algorithm proposal using offline simulations. Energies 2020, 13, 5316. [Google Scholar] [CrossRef]
  13. Lin, H.; Guerrero, J.M.; Vasquez, J.C.; Liu, C. Adaptive distance protection for microgrids. In Proceedings of the IECON 2015—41st Annual Conference of the IEEE Industrial Electronics Society, Yokohama, Japan, 9–12 November 2015; pp. 725–730. [Google Scholar] [CrossRef] [Green Version]
  14. Zhao, J.; Netto, M.; Huang, Z.; Yu, S.S.; Gómez-Expósito, A.; Wang, S.; Kamwa, I.; Akhlaghi, S.; Mili, L.; Terzija, V.; et al. Roles of dynamic state estimation in power system modeling, monitoring and operation. IEEE Trans. Power Syst. 2021, 36, 2462–2472. [Google Scholar] [CrossRef]
  15. Eisa, S.A.; Stone, W.; Wedeward, K. Mathematical analysis of wind turbines dynamics under control limits: Boundedness, existence, uniqueness, and multi time scale simulations. Int. J. Dyn. Control 2018, 6, 929–949. [Google Scholar] [CrossRef]
  16. Korres, G.N.; Katsikas, P.J.; Chatzarakis, G.E. Substation topology identification in generalized state estimation. Int. J. Electr. Power Energy Syst. 2006, 28, 195–206. [Google Scholar] [CrossRef]
  17. Dehghanpour, K.; Wang, Z.; Wang, J.; Yuan, Y.; Bu, F. A survey on state estimation techniques and challenges in smart distribution systems. IEEE Trans. Smart Grid 2019, 10, 2312–2322. [Google Scholar] [CrossRef] [Green Version]
  18. Poudel, B.P.; Bidram, A.; Reno, M.J.; Summers, A. Zonal Machine Learning-based Protection for Distribution Systems. IEEE Access 2022, 10, 1–12. [Google Scholar] [CrossRef]
  19. Razmi, P.; Asl, M.G.; Canarella, G.; Emami, A.S. Topology identification in distribution system via machine learning algorithms. PLoS ONE 2021, 16, e0252436. [Google Scholar] [CrossRef] [PubMed]
  20. Kurup, A.R.; Martinez-Ramon, M.; Summers, A.; Bidram, A.; Reno, M.J. Deep learning based circuit topology estimation and fault classification in distribution systems. In Proceedings of the 2021 IEEE PES Innovative Smart Grid Technologies Europe: Smart Grids: Toward a Carbon-Free Future, ISGT Europe, Espoo, Finland, 18–21 October 2021. [Google Scholar] [CrossRef]
  21. Amoateng, D.O.; Yan, R.; Mosadeghy, M.; Saha, T.K. Topology Detection in Power Distribution Networks: A PMU Based Deep Learning Approach. IEEE Trans. Power Syst. 2022, 37, 2771–2782. [Google Scholar] [CrossRef]
  22. He, J.; Cheng, M.X. Machine learning methods for power line outage identification. Electr. J. 2021, 34, 106885. [Google Scholar] [CrossRef]
  23. DIgSILENT. GmbH 39 Bus New England System; DIgSILENT: Gomaringen, Germany, 2015; pp. 1–16. [Google Scholar]
  24. DIgSILENT GmbH. PowerFactory 2019, Manual, User; DIgSILENT: Gomaringen, Germany, 2019. [Google Scholar]
  25. González-Longatt, F.M. The P.M. Anderson Test System. Available online: https://www.fglongatt.org/Test_Systems/PM_Anderson_PF.html (accessed on 5 February 2019).
  26. ENTSO-E. System Protection Behavior and Settings during System Disturbances; ENTSO-E: Brussels, Belgium, 2018. [Google Scholar]
  27. Al Kharusi, K.; El Haffar, A.; Mesbah, M. Fault Detection and Classification in Transmission Lines Connected to Inverter—Based Generators Using Machine Learning. Energies 2022, 15, 5475. [Google Scholar] [CrossRef]
  28. Aliyu, I.; Lim, C.G. Selection of optimal wavelet features for epileptic EEG signal classification with LSTM. Neural Comput. Appl. 2021, 35, 1077–1097. [Google Scholar] [CrossRef]
  29. Taheri, B.; Salehimehr, S.; Razavi, F.; Parpaei, M. Detection of power swing and fault occurring simultaneously with power swing using instantaneous frequency. Energy Syst. 2020, 11, 491–514. [Google Scholar] [CrossRef]
  30. Kłosowski, G.; Rymarczyk, T.; Wójcik, D.; Skowron, S.; Cieplak, T.; Adamkiewicz, P. The use of time-frequency moments as inputs of lstm network for ecg signal classification. Electronics 2020, 9, 1452. [Google Scholar] [CrossRef]
  31. Phinyomark, A.; Thongpanja, S.; Hu, H.; Phukpattaranont, P.; Limsakul, C. The Usefulness of Mean and Median Frequencies in Electromyography Analysis. In Computational Intelligence in Electromyography Analysis—A Perspective on Current Applications and Future Challenges; IntechOpen: London, UK, 2012; pp. 195–220. [Google Scholar] [CrossRef] [Green Version]
  32. Liu, H.M.H. Computational Methods of Feature Selection; Taylor & Francis: Abingdon, UK, 2007. [Google Scholar]
  33. Kazemitabar, S.J.; Amini, A.A.; Bloniarz, A.; Talwalkar, A. Variable importance using decision trees. In Proceedings of the 31st Conference on Neural Information Processing Systems (NIPS 2017), Long Beach, CA, USA, 4–9 December 2017; pp. 426–435. [Google Scholar]
  34. Nembrini, S.; König, I.R.; Wright, M.N. The revival of the Gini importance? Bioinformatics 2018, 34, 3711–3718. [Google Scholar] [CrossRef] [PubMed] [Green Version]
  35. Wu, Y.; Liu, X.; Zhou, Y. Deep PCA-Based Incipient Fault Diagnosis and Diagnosability Analysis of High-Speed Railway Traction System via FNR Enhancement. Machines 2023, 11, 475. [Google Scholar] [CrossRef]
  36. Han, J.; Miao, S.; Li, Y.; Yang, W.; Yin, H. Fault Diagnosis of Power Systems Using Visualized Similarity Images and Improved Convolution Neural Networks. IEEE Syst. J. 2022, 16, 185–196. [Google Scholar] [CrossRef]
Figure 1. Measurements of the active power output of the PV plant and wind farm during the day hours.
Energies 16 05775 g001
Figure 2. Lookup table for topology identification.
Energies 16 05775 g002
Figure 3. The 39-Bus New England System.
Energies 16 05775 g003
Figure 4. Steps to find out the setting groups.
Energies 16 05775 g004
Figure 5. The proposed adaptive ML-based fault detection and classification workflow. (a) Offline process, (b) online process.
Energies 16 05775 g005
Figure 6. Feature importance estimation using ensemble tree feature selection algorithm for each system topology.
Energies 16 05775 g006
Figure 7. Classifiers’ outputs for different line faults at each generation topology.
Energies 16 05775 g007
Figure 8. PV plant fault contribution at different output power.
Energies 16 05775 g008
Figure 9. T2 classification model performance at different PV plant penetration levels.
Energies 16 05775 g009
Figure 10. Wind farm fault contribution at different output power.
Energies 16 05775 g010
Figure 11. T3 classification model performance at different wind farm penetration levels.
Energies 16 05775 g011
Figure 12. Transmission system configurations.
Energies 16 05775 g012
Figure 13. Classifiers’ outputs for different line 1-2 faults with the outage of line 01-39 (Case 1).
Energies 16 05775 g013
Figure 14. Classifiers’ outputs for different line 1-2 faults with the outage of line 2-25 (Case 2).
Energies 16 05775 g014
Figure 15. Classifiers’ outputs for different line 1-2 faults with the outage of lines 1-39 and 2-25 (Case 3).
Energies 16 05775 g015
Figure 16. Classification performance with incorrect topology identification.
Energies 16 05775 g016
Table 1. PV plant and wind farm characteristics.
IBGCharacteristicsDynamic Model Type
PV Plant10 kVA per inverter, local controller: constant Q, Short circuit model: Dynamic voltage support, Sub-transient short circuit: 1.21 kVA, R to X” ratio: 0.1, K Factor: 2, Max. current: 1.1 pu, Td’’= 0.03 s, Td’ = 1.2 sWECC Large-scale Photovoltaic Plant model
Wind Farm
(Type 3: Doubly fed induction generator)
2MVA, 1.0 power factor, local controller: constant Q, Short circuit model: Dynamic voltage support, Sub-transient short circuit: 2.39 MVA, R to X” ratio: 0.1, K Factor: 2, Max. current: 1.1 pu, Td’’= 0.03 s, Td’ = 1.2 sWECC Wind Turbine Model Type 3
Table 2. Extracted features.
DomainFeaturesNumber of
Features for Each Signal
TimeStatistical features of the squared signals9
Statistical features of first-order difference of the squared signals9
Time–frequencyStatistical features of spectrogram9
Statistical features of wavelet decomposition of first and second detail coefficients [28]18
Estimated instantaneous frequency [29]1
FrequencySpectral entropy [30]1
Mean and median frequency [31]2
Table 3. Results of the offline settings.
Topology (T)Classification Model
Hyperparameters
Number of
Selected Features
Performance Using Training Data (%)Performance Using Testing Data (%)
T1
SG only
Ensemble method: Adaboost
Maximum number of splits: 5
Number of learners: 13
Learner rate: 10
39Precision: 98.93
Recall: 98.84
Accuracy: 98.62
Specificity: 99.79
Precision: 97.56
Recall: 97.76
Accuracy: 96.77
Specificity: 99.51
T2
PV only
Ensemble method: Bag
Maximum number of splits: 128
Number of learners: 131
Number of predictors to sample: 79
190Precision: 99.17
Recall: 98.88
Accuracy: 98.8
Specificity: 99.82
Precision: 99.66
Recall: 99.46
Accuracy: 99.60
Specificity: 99.94
T3
WF only
Ensemble method: Bag
Maximum number of splits: 13
Number of learners: 18
Number of predictors to sample: 82
155Precision: 99.31
Recall: 98.80
Accuracy: 99.14
Specificity: 99.87
Precision: 99.34
Recall: 99.46
Accuracy: 99.60
Specificity: 99.95
T4
SG + PV
Ensemble method: RUSboost
Maximum number of splits: 159
Number of learners: 25
Learner rate: 0.873
20Precision: 98.35
Recall: 98.23
Accuracy: 97.58
Specificity: 99.63
Precision: 97.28
Recall: 97.12
Accuracy: 96.47
Specificity: 99.48
T5
SG + WF
Ensemble method: Bag
Maximum number of splits: 168
Number of learners: 45
Number of predictors to sample: 18
157Precision: 99.77
Recall: 99.57
Accuracy: 99.66
Specificity: 99.95
Precision: 99.31
Recall: 98.81
Accuracy: 99.20
Specificity: 99.88
T6
PV + WF
Ensemble method: Bag
Maximum number of splits: 46
Number of learners: 10
Number of predictors to sample: 10
204Precision: 99.52
Recall: 99.53
Accuracy: 99.65
Specificity: 99.95
Precision: 98.98
Recall: 99.17
Accuracy: 99.19
Specificity: 99.89
T7
SG + PV + WF
Ensemble method: Bag
Maximum number of splits: 28
Number of learners: 16
Number of predictors to sample: 10
163Precision: 99.89
Recall: 99.76
Accuracy: 99.90
Specificity: 99.99
Precision: 99.21
Recall: 99.02
Accuracy: 99.52
Specificity: 99.93
T8
No generation
Ensemble method: Bag
Maximum number of splits: 40
Number of learners: 10
Number of predictors to sample: 3
168Precision: 99.45
Recall: 98.74
Accuracy: 99.12
Specificity: 99.86
Precision: 100
Recall: 100
Accuracy: 100
Specificity: 100
Table 4. Comparative analysis of selected methodologies from the literature.
ReferencePower System NetworkTopology DefinitionTopology Change Identification MethodNumber of TopologiesML MethodPerformance
Feature Extraction MethodFeature SelectionClassifier
[11]Distribution network: modified IEEE 30-bus systemDG availability, FCL, and load varyingANNTwoCWTNilDTFailure rate = 0%
[7]Medium-voltage network:
Aalborg microgrid and transmission network: IEEE 9-bus model
Meshed or radial network configuration,
grid-connected or islanded modes, and
load variations.
ANN-SVM algorithmNot definedReal-time measurements
(no feature extraction)
NilSVM for fault locationThe error of ANN = 0%,
Average error of SVM = 0.215%
[10]Transmission networks: Standard IEEE 14-bus and standard IEEE 39-busAdd/drop new bus
or transmission lines
PSO detects structural changesUnlimitedMeasurements of frequency and phase values of all buses in the time domain (no feature extraction)NilPSO-based weighted ensemble
method of k-NN, LDA, LR,
NB, DT, boosting algorithm
Accuracy = 97.93% for the IEEE classical model.
Accuracy = 96.68% for the modified system (PV added)
Accuracy = 96.61% for the IEEE-39 bus model.
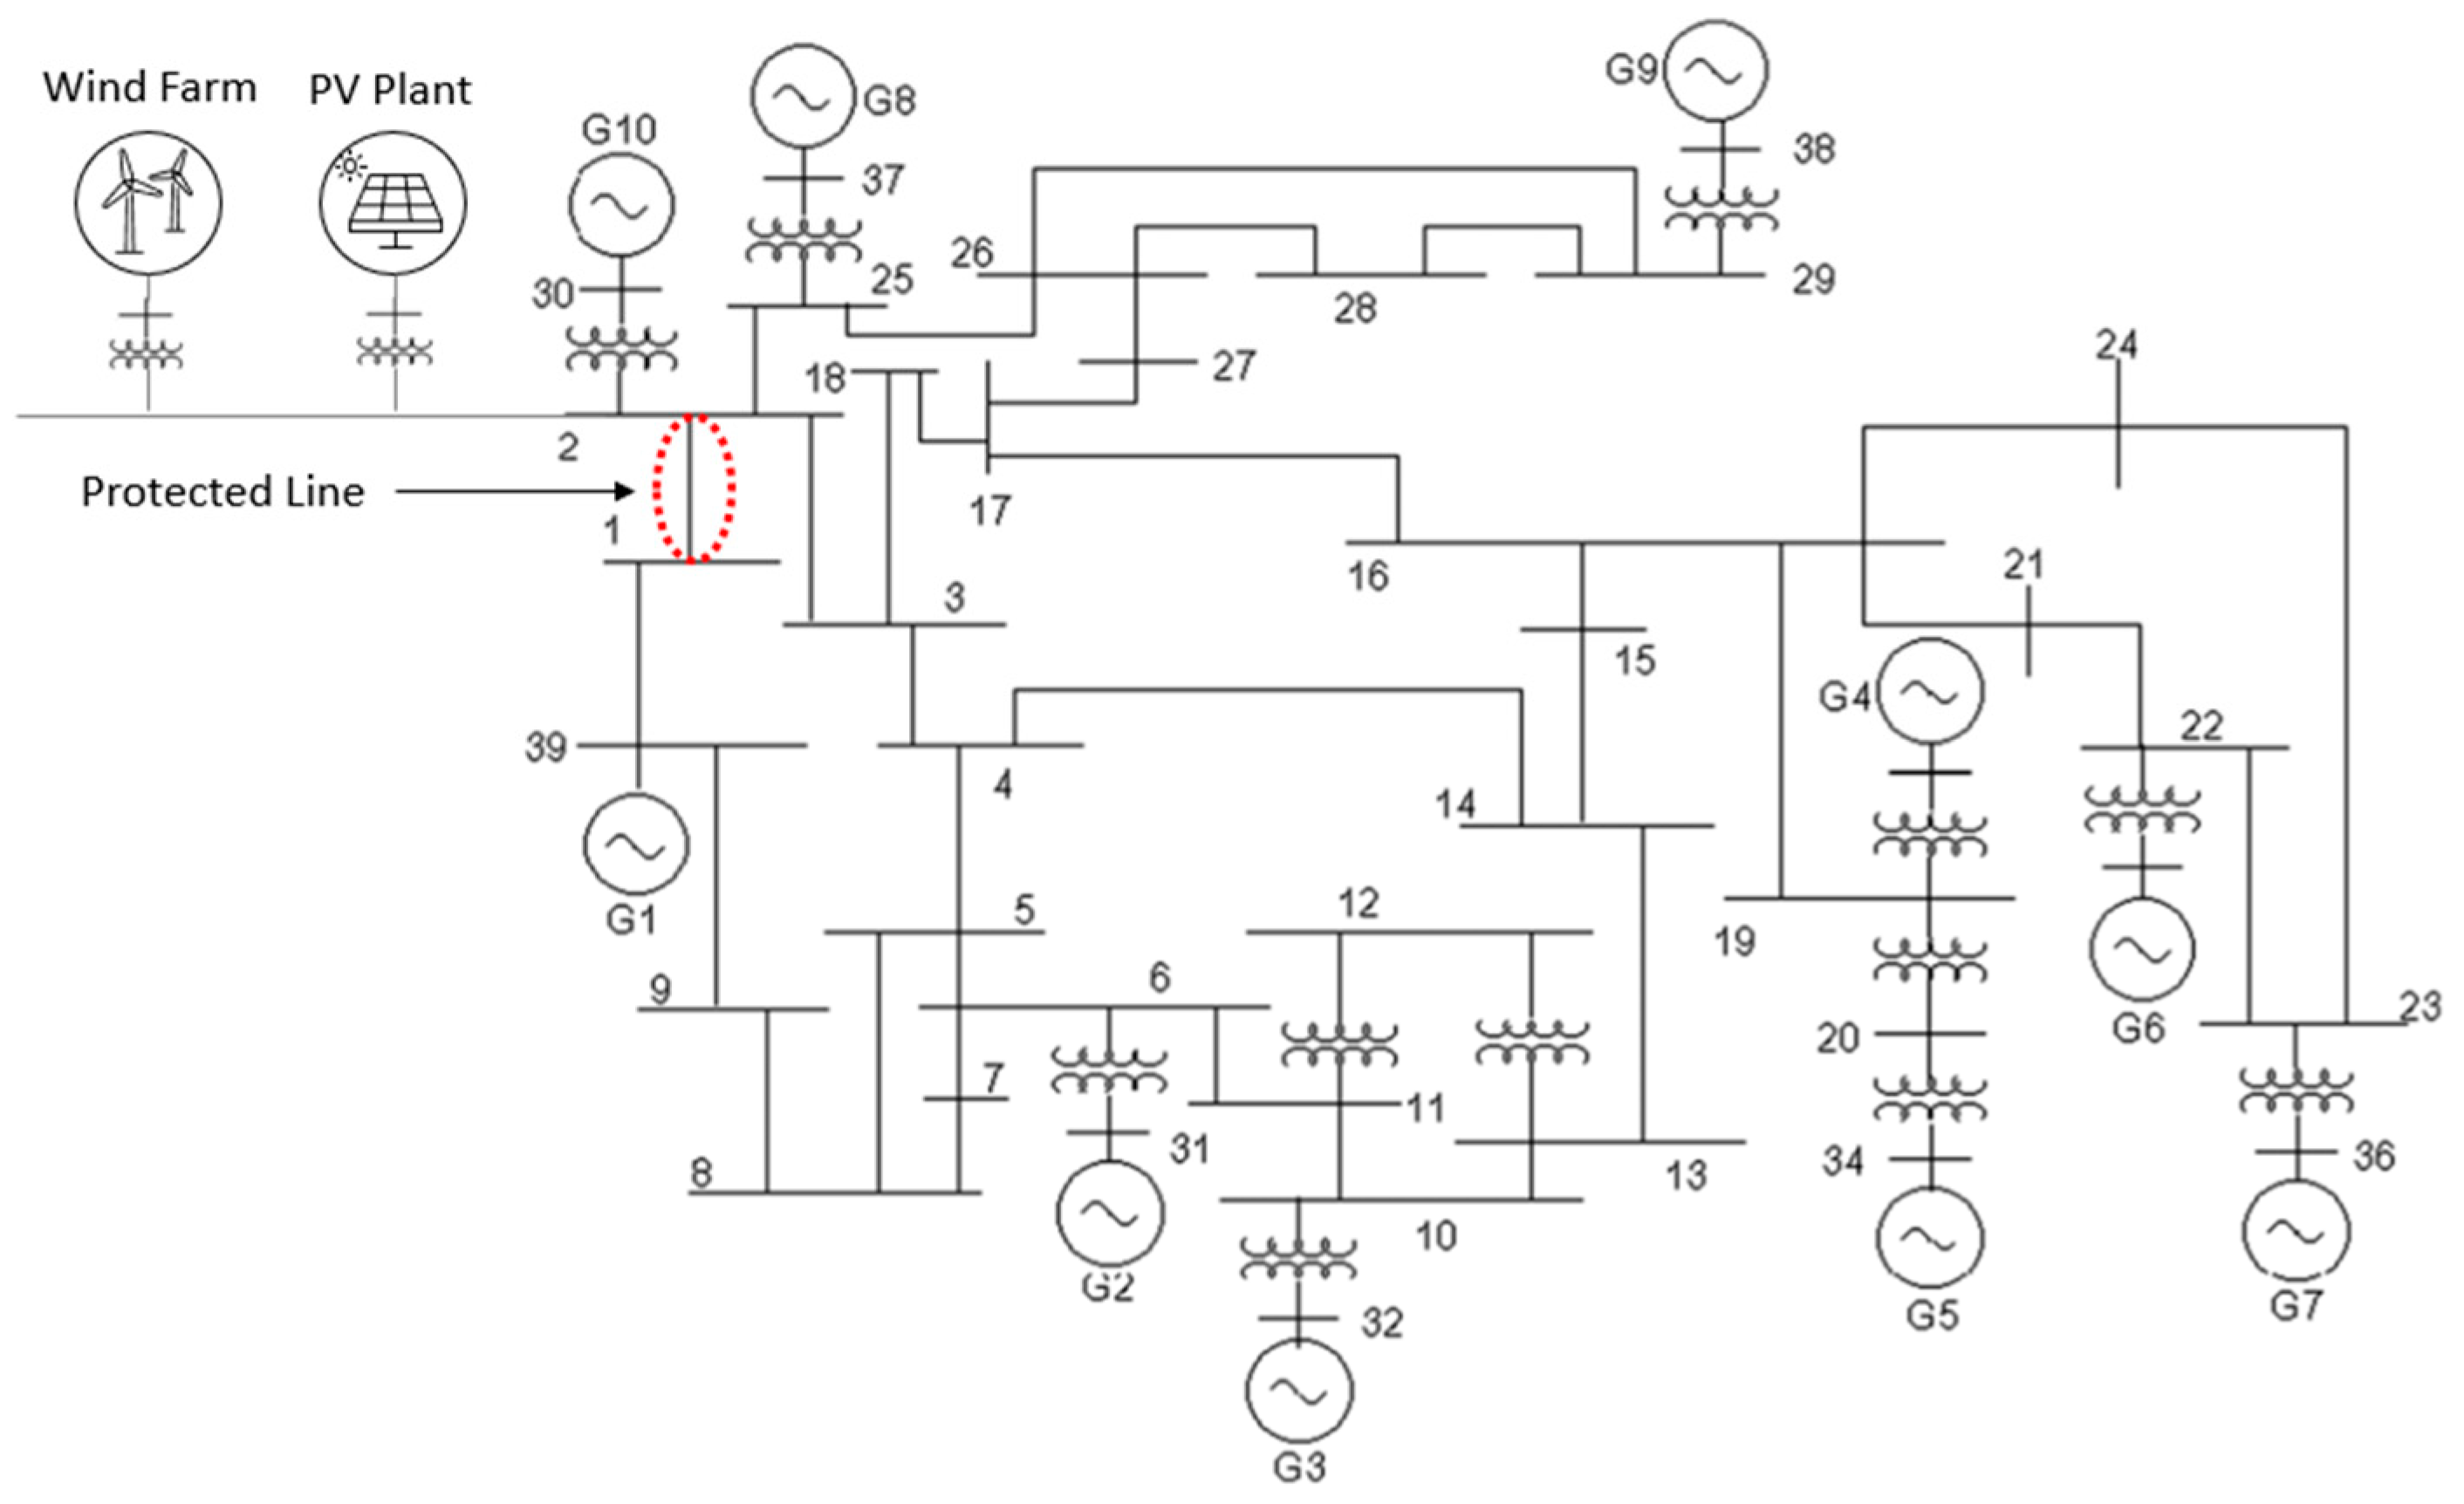
ProposedTransmission (39-Bus New England System)Type of generators connected behind the relay point (synchronous machine, PV plant, and DFIG wind farm)Circuit breaker statuses and the active power of these generating plantsEightTable 2Ensemble trees (embedded-type)Optimized ensemble trees using Bayesian optimization Average accuracy = 98.79%
Average precision = 98.92%
Average specificity = 98.76%
Average sensitivity = 99.82%
Disclaimer/Publisher’s Note: The statements, opinions and data contained in all publications are solely those of the individual author(s) and contributor(s) and not of MDPI and/or the editor(s). MDPI and/or the editor(s) disclaim responsibility for any injury to people or property resulting from any ideas, methods, instructions or products referred to in the content.

