
An Optimal Operation Strategy of Regenerative Electric Heating Considering the Difference in User Thermal Comfort

Abstract
:1. Introduction
1.1. Research on the Regulating Capability and Models of Regenerative Electric Heating
1.2. Research on Optimal Operation Strategy of Regenerative Electric Heating
1.3. Research on Optimization Algorithm of Regenerative Electric Heating
2. Working Principle and Mathematical Model of Regenerative Electric Heating
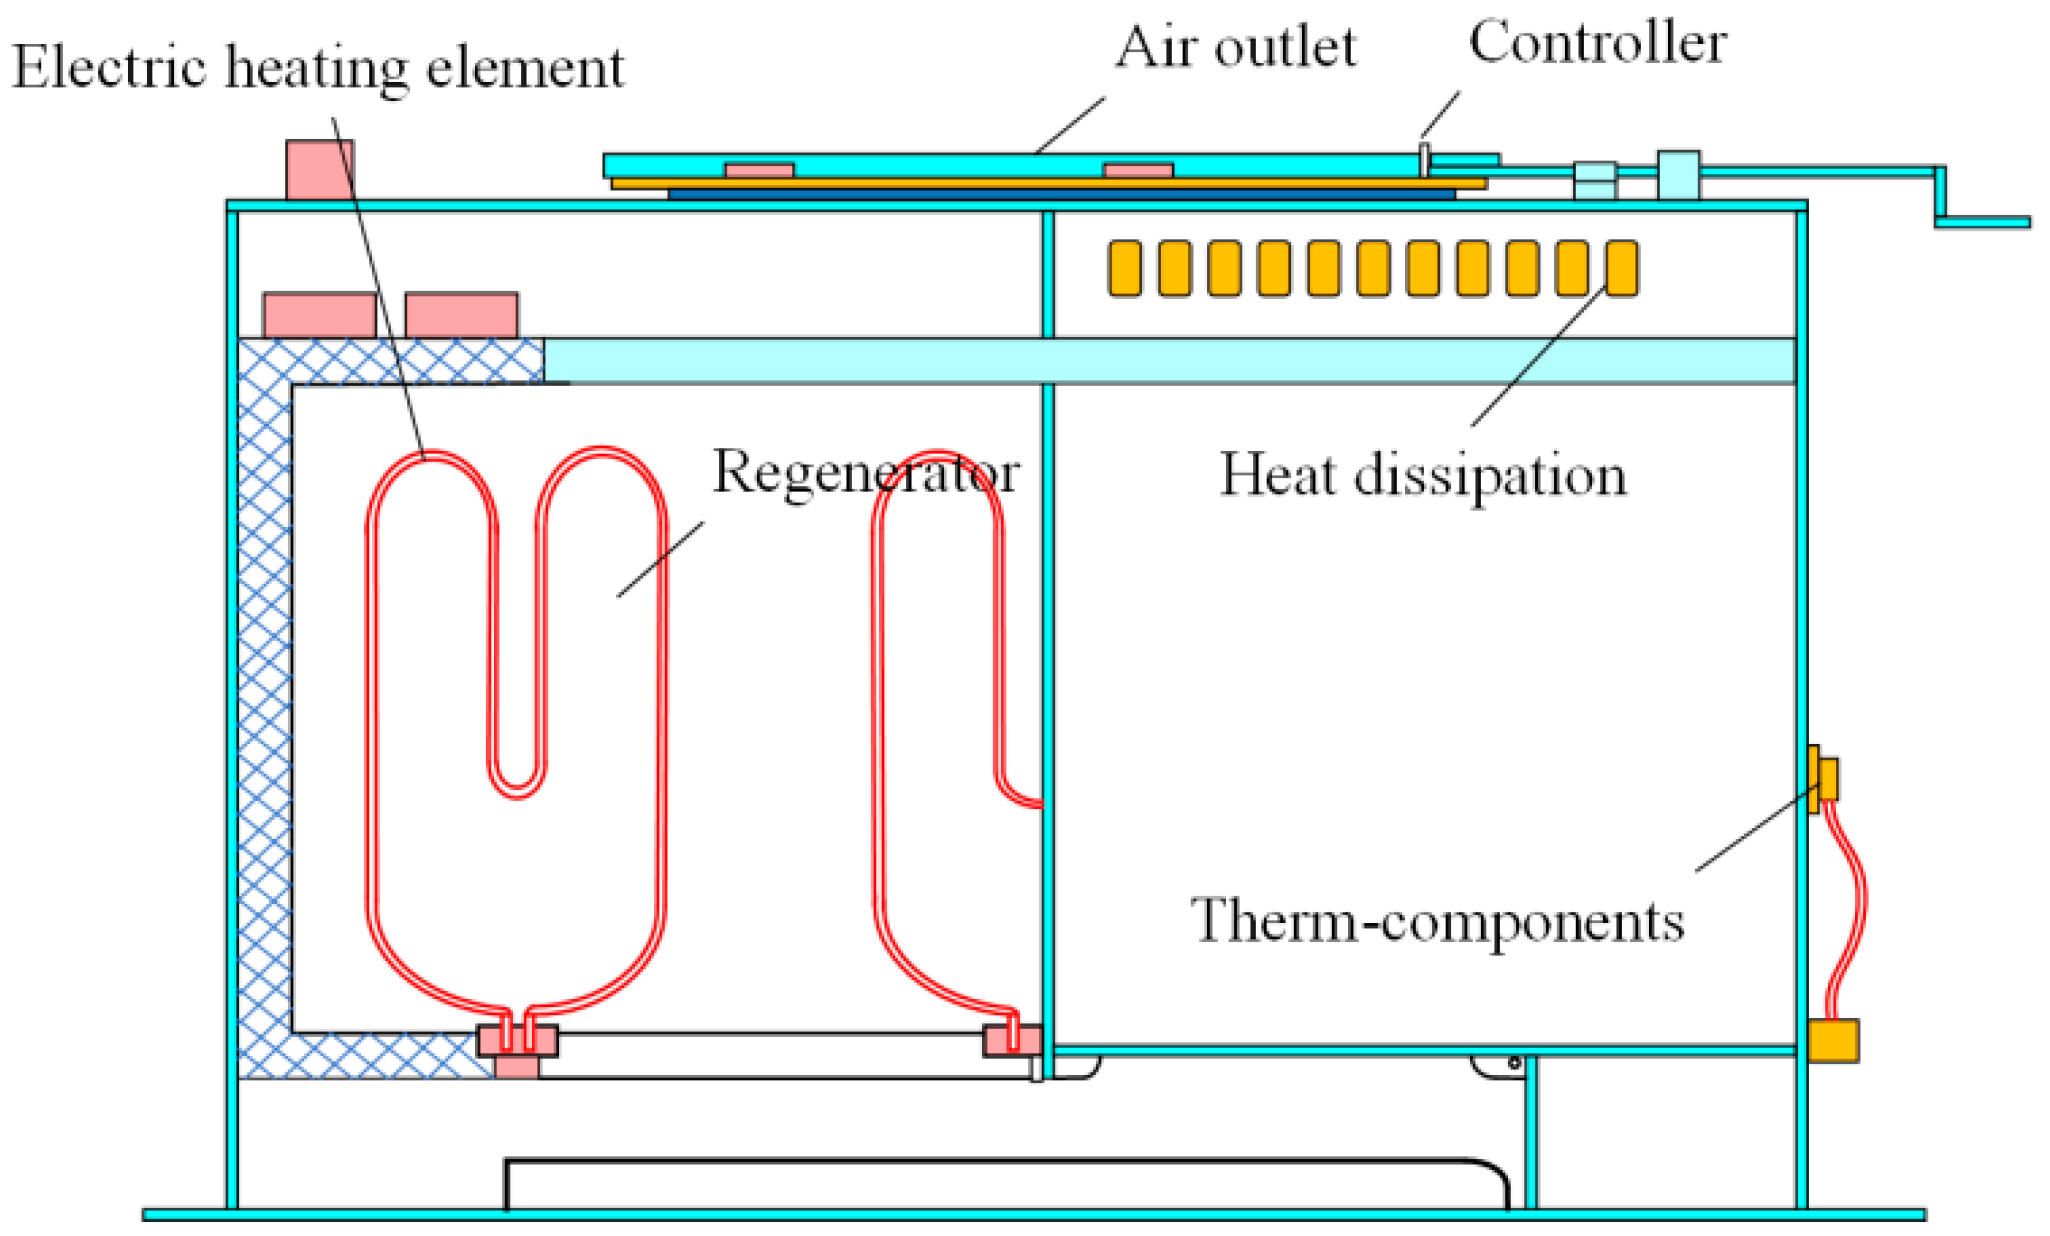
2.1. Structure and Working Principle of Regenerative Electric Heating Equipment
2.2. Modeling of Regenerative Electric Heating System
2.2.1. Direct Heating Equipment
2.2.2. Heat Storage Equipment
2.2.3. Regenerative Electric Heating System Model
3. Analysis of User Thermal Comfort Differences
3.1. Analysis of Thermal Comfort Differences among Users
3.2. Solution of Thermal Comfort Demand Preference with Multiple Features
3.3. User Thermal Comfort Design Scheme
4. Optimization and Regulation Indicators for Regenerative Electric Heating
4.1. Comfort Indicators
4.2. Economic Indicators
5. Dynamic Optimal Regulation Model and Calculation Method
5.1. Dynamic Optimal Regulation Model
- a
- Objective function
- b
- Thermal energy supply and demand balance constraint:
- c
- Direct heating equipment operation constraint:where: is the rated electric power of the selected regenerative electric heating equipment.
- d
- Operating constraints of heat storage equipment
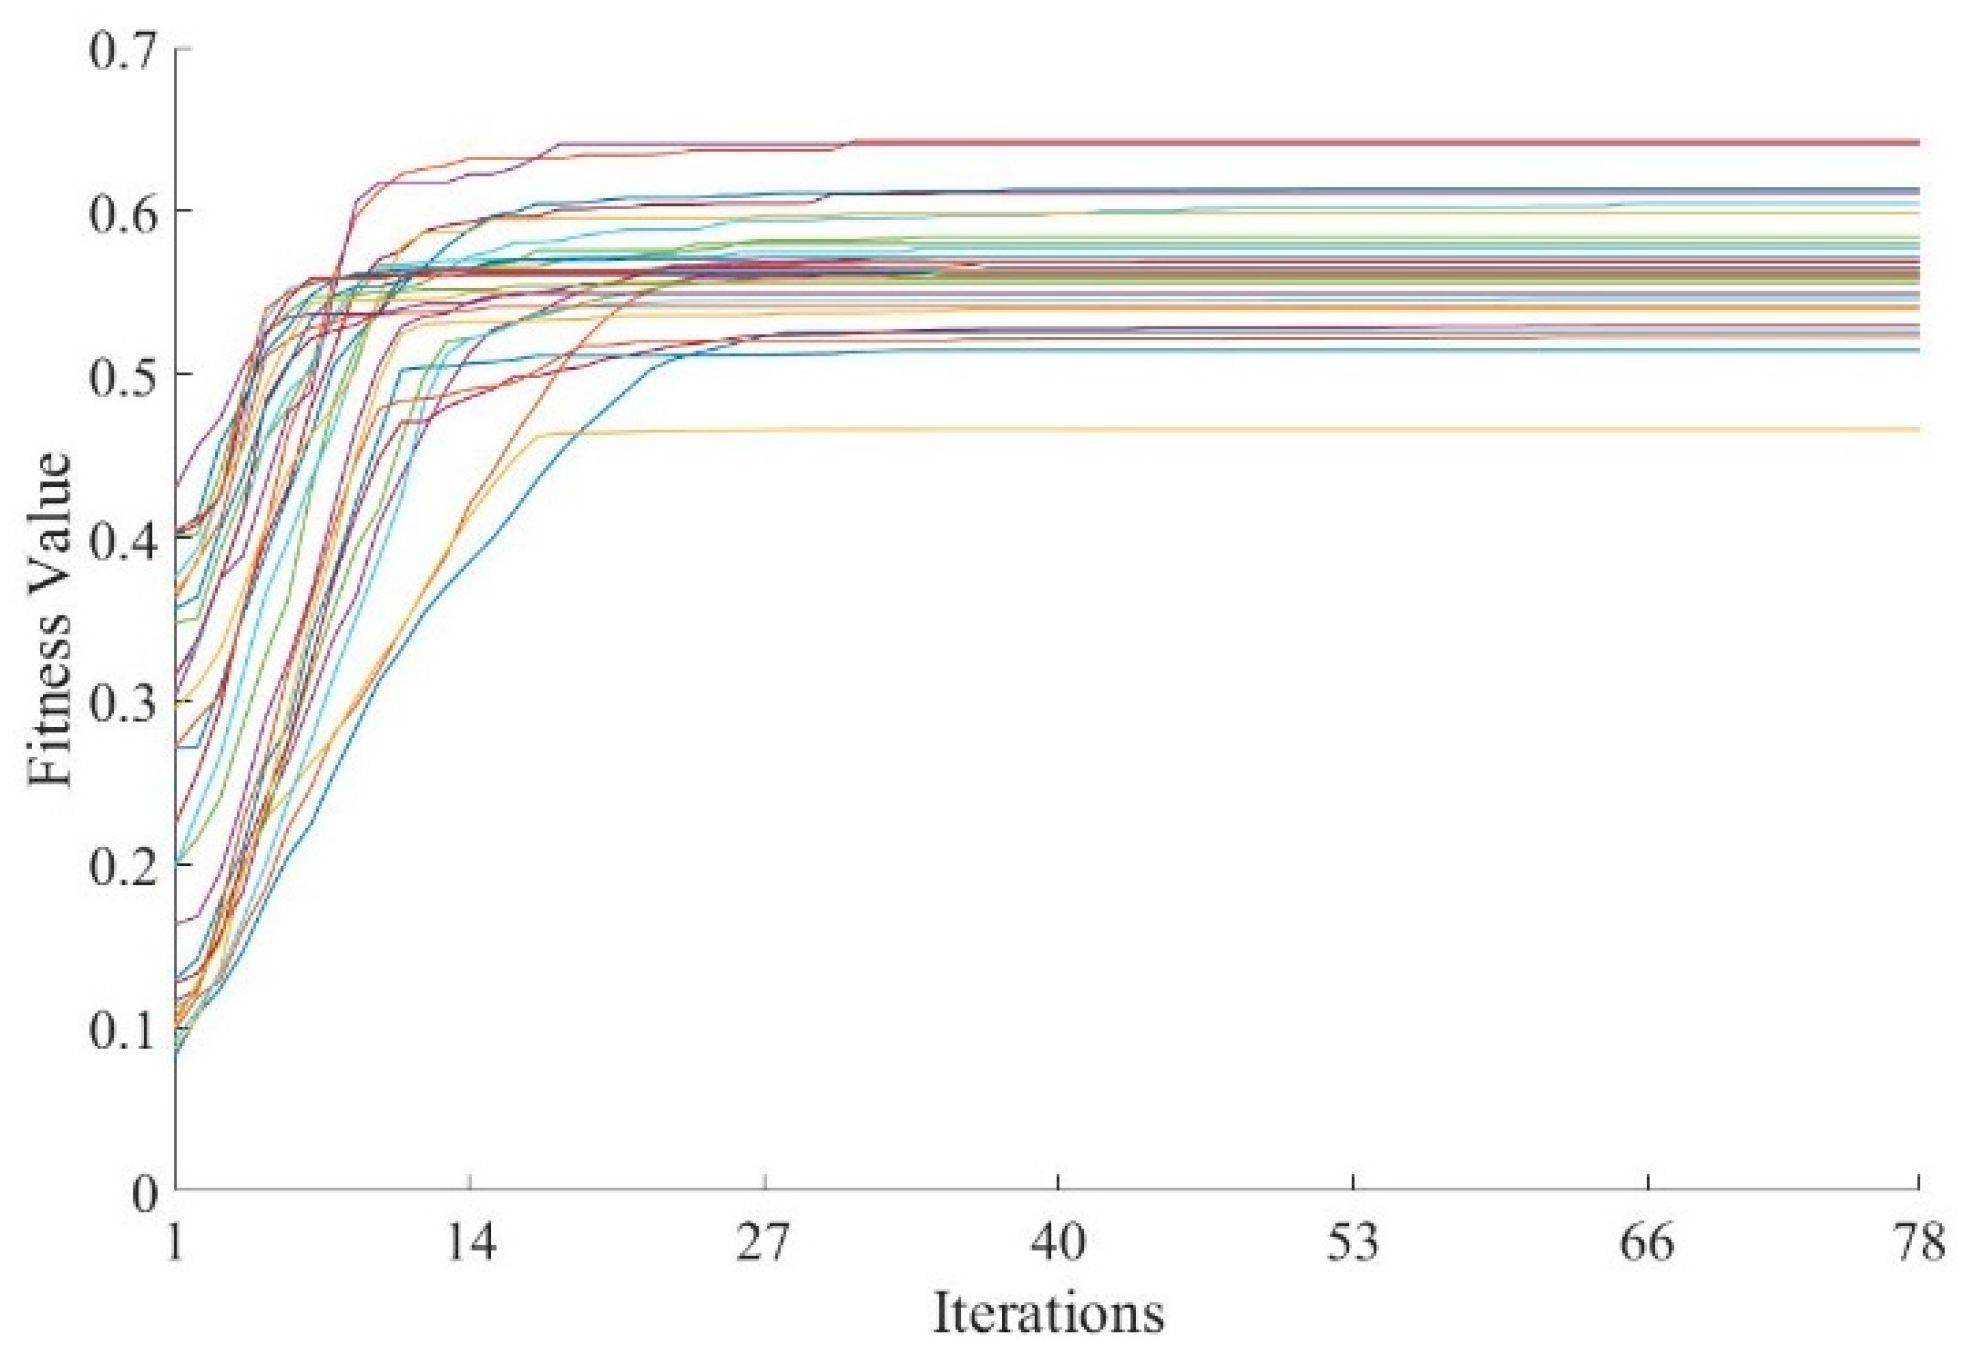
5.2. Quantum Genetic Algorithm
5.3. Dynamic Optimal Regulation Model Solving Process
6. Example Analysis
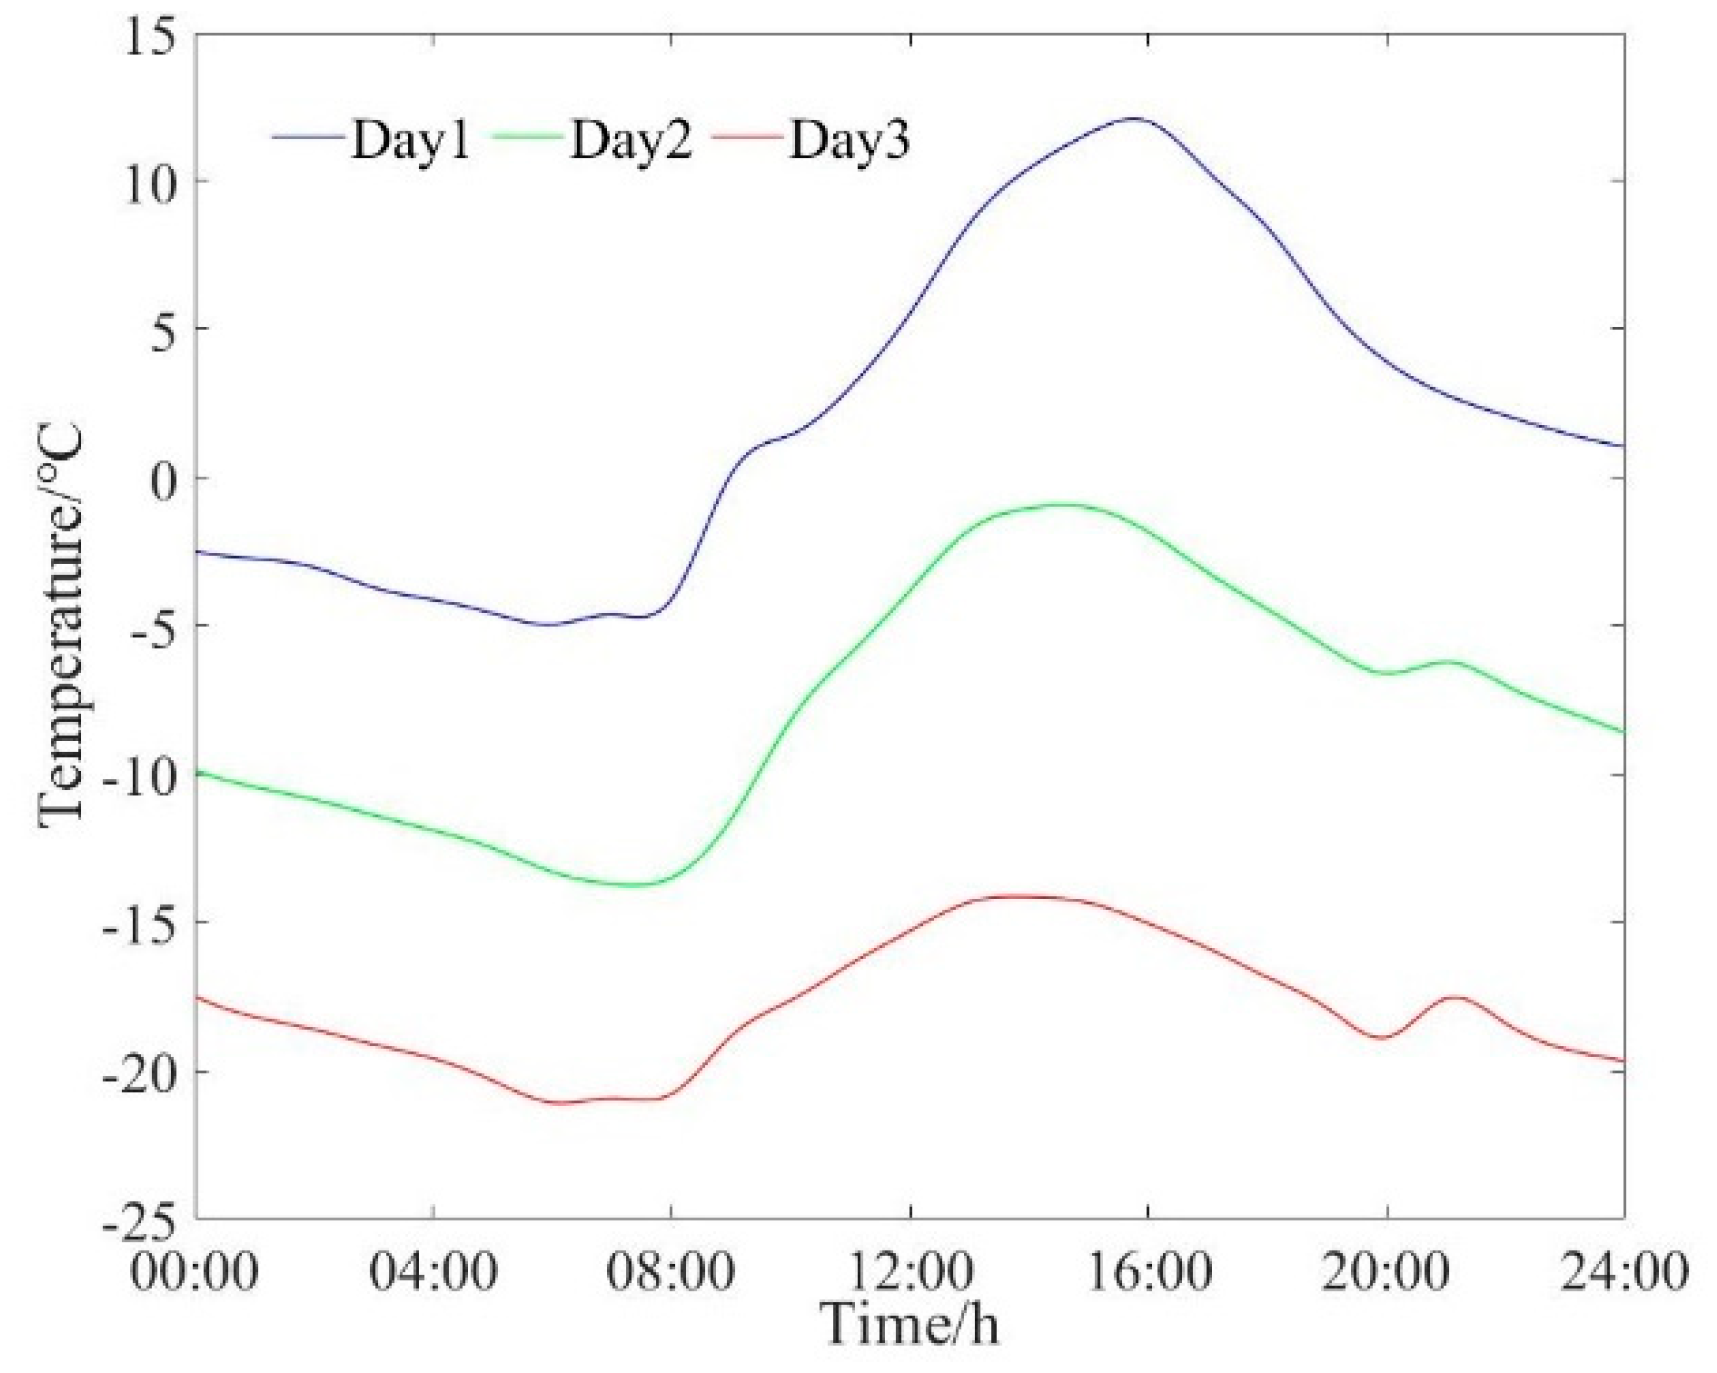
6.1. Example Data
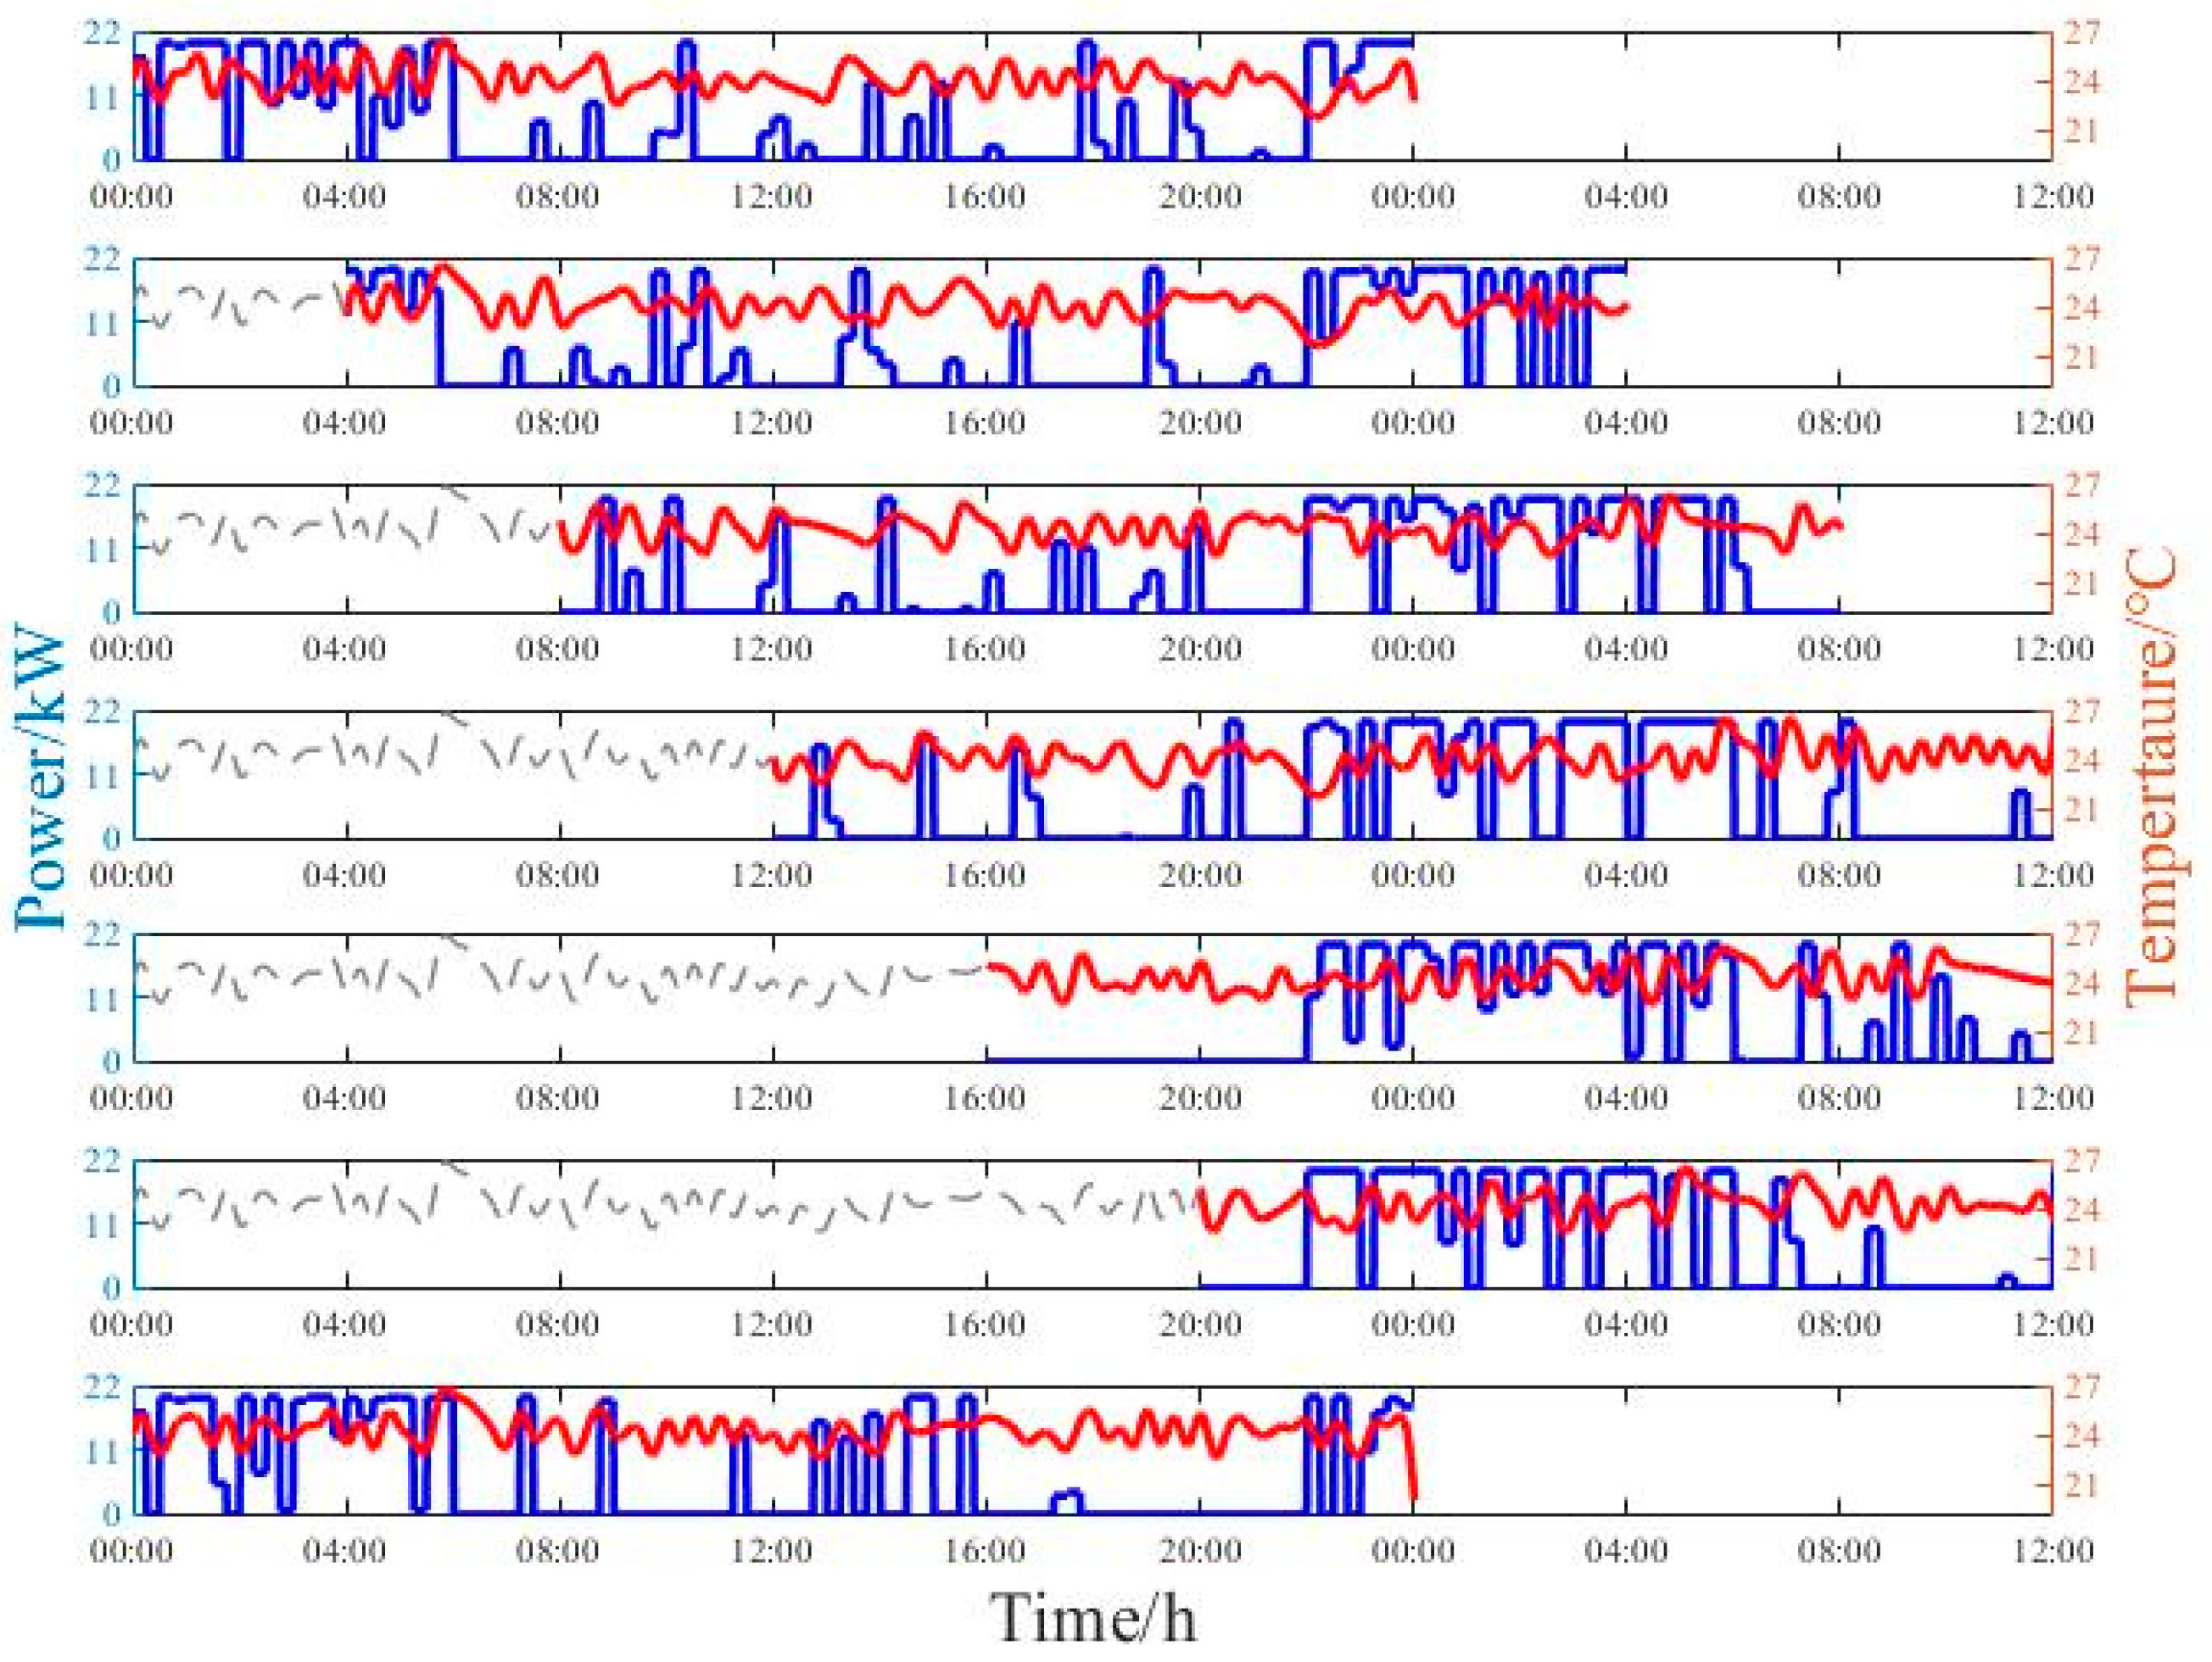
6.2. Calculation Analysis
7. Conclusions
- In order to refine the differentiated behavior of user participation in demand response, the differentiated preference factors are calculated based on the maximum likelihood estimation method to design differentiated heating schemes. Additionally, the thermal comfort scheme was designed based on multiple characteristics of users’ thermal comfort preferences.
- The regenerative electric heating optimal control index was intended to achieve a balanced decision between user comfort and economy during the heating duration. Preference criteria are utilized to define different user groups. The QGA was used to solve the dynamic optimal regulation model with the different thermal comfort, and the optimal power of regenerative electric heating was solved for each time period in the scheduling cycle.
- The research results show that the strategy proposed in this paper can take into account the comfort of customers and the economy of peak and low load shifting compared with the traditional operation method, so that the operation of regenerative electric heating can respond to the different needs of different customer groups and achieve flexible regulation at all times of the day.
Author Contributions
Funding
Data Availability Statement
Conflicts of Interest
References
- Li, H.; Liu, D.; Yao, D.Y. Analysis and reflection on the development of power system towards the goal of carbon emission peak and carbon neutrality. Proc. CSEE 2021, 41, 6245–6259. [Google Scholar]
- Liu, X.H.; Han, J.; Zhang, N.; Wang, J.J. Status of decentralized civil heating technology in China. Bull. Chin. Acad. Sci. 2019, 34, 401–408. [Google Scholar]
- Dong, Y.T.; Wang, Y.S.; Ni, C.B.; Yi, J.B. Dispatch of a combined heat-power system considering elasticity with thermal comfort. Power Syst. Prot. Control 2021, 49, 26–34. [Google Scholar]
- Lu, N. An Evaluation of the HVAC Load Potential for Providing Load Balancing Service. IEEE Trans. Smart Grid 2012, 3, 1263–1270. [Google Scholar] [CrossRef]
- Kondoh, J.; Lu, N.; Hammerstrom, D.J. An Evaluation of the Water Heater Load Potential for Providing Regulation Service. IEEE Trans. Power Syst. 2011, 26, 1309–1316. [Google Scholar] [CrossRef]
- Wang, Z.Q.; Wang, S.; Zhang, X.Y.; Liu, W.X.; Gong, Q.; Chen, Q.F. Load characteristics modeling of regional electric heating system considering difference of users response behaviors. Autom. Electr. Power Syst. 2019, 43, 67–73. [Google Scholar]
- Shao, S.; Pipattanasomporn, M.; Rahman, S. Development of physical-based demand response-enabled residential load models. IEEE Trans. Power Syst. 2013, 28, 607–614. [Google Scholar] [CrossRef]
- Zhang, R.; Liu, H.M.; Chen, W. Regenerative Electric Heating Load Modeling Considering Users’ Response Behavior Biases. In Proceedings of the 2020 IEEE 3rd Student Conference on Electrical Machines and Systems (SCEMS), Jinan, China, 4 December 2020. [Google Scholar]
- Zhang, H.L.; Yan, G.G.; Shi, J.; Deng, B.Y.; Yang, Y.L.; Liu, W. Research on the characteristics modeling and adjustable potential of regenerative electric heating flexible load. High Volt. Eng. 2022, 48, 2108–2116. [Google Scholar]
- Fan, S.; Jia, K.Q.; Guo, B.Q.; Jiang, L.M.; Wang, Z.H.; He, G.Y. Collaborative optimal operation strategy for decentralized electric heating loads. Autom. Electr. Power Syst. 2017, 41, 20–29. [Google Scholar]
- Kilkki, O.; Alahaivala, A.; Seilonen, I. Optimized Control of Price-Based Demand Response With Electric Storage Space Heating. Ind. Inform. IEEE Trans. 2015, 11, 281–288. [Google Scholar] [CrossRef]
- Zhang, J.R.; Mu, Y.F.; Jia, H.J.; Huo, X.X.; Li, S.P.; Fan, R.Q. Day-ahead Optimal Dispatch method for regenerative electric heating considering thermal demand of users during power outage. Autom. Electr. Power Syst. 2020, 44, 15–22. [Google Scholar]
- Fan, D.C.; Wang, R.Z.; Qi, H.N.; Deng, X.Y.; Chen, Y.D.; Liu, T.J.; Liu, Y.B. Edge intelligence enabled optimal scheduling with distributed price-responsive load for regenerative electric boilers. Front. Energy Res. 2022, 10, 976294. [Google Scholar] [CrossRef]
- Su, Z.; Pan, F.; Li, Y.; Liu, L.; Liu, H. Optimal Operation Study of Residential Regenerative Electric Heating Group Load. In Proceedings of the 2020 Asia Energy and Electrical Engineering Symposium (AEEES), Chengdu, China, 23–26 March 2020. [Google Scholar]
- Cheng, M.L.; Cheng, T.L.; Fu, X.X.; Xu, Y.R.; Chen, W.Q.; Guo, M.X. Optimal dispatching method for regenerative electric heating considering the heating reliability and capacity of distribution network. Electr. Meas. Instrum. 2023, 1–10. [Google Scholar]
- Shang, X.J.; Li, S.P.; Huo, X.X.; Song, J.; Zhang, W.G. Research on optimal dispatching strategy of regenerative electric eating in critical safety state of power grid. In Proceedings of the IET International Conference on AC and DC Power Transmission, Online, 2–3 July 2020. [Google Scholar]
- Hong, Y.Y.; Lin, J.K.; Wu, C.P.; Chuang, C.C. Multi-Objective Air-Conditioning Control Considering Fuzzy Parameters Using Immune Clonal Selection Programming. IEEE Trans. Smart Grid 2012, 3, 1603–1610. [Google Scholar] [CrossRef]
- Shi, Z.; Jin, Y.F.; Wang, Y.; Zhang, X.T.; Yang, B.; Zhou, M. Optimal operation of an electric heating region integrated energy system based on a user comfort interval constraint. Power Syst. Prot. Control 2022, 50, 168–177. [Google Scholar]
- Jin, G.F.; Xing, J.S.; Zhang, L.; Zhang, X.L.; Zhao, L.J.; Liu, Z.F.; Cong, B. Multi-objective optimization of wind power accommodation with regenerative electric heating considering user comfort. Electr. Power Constr. 2022, 43, 12–21. [Google Scholar]
- Fang, J.Y.; Song, Z.Q.; Han, X.J.; Xiu, X.Q. Study on Wind Power Consumption Method Using Energy Storage Technology to Coordinate Heat Storage Electric Boilers. Electr. Energy Manag. Technol. 2017, 526, 16–21. [Google Scholar]
- Shen, R.D.; Zhong, S.Y.; Zheng, R.F.; Yang, D.F.; Xu, B.Q.; Li, Y.; Zhao, J. Advanced control framework of regenerative electric heating with renewable energy based on multi-agent cooperation. Energy Build. 2023, 281, 112779. [Google Scholar] [CrossRef]
- Zhang, J.R.; Chen, W.Q.; Zhang, Y.Q.; Mu, Y.F.; Li, S.P.; Yu, J.C. Bi-level Optimal Planning Method for Park Regenerative Electric Heating Considering Capacity of Distribution Network and Reliable Heating. J. Glob. Energy Interconnect. 2021, 4, 142–152. [Google Scholar]
- Shi, L.B.; Zhou, Y.H.; Song, D.J.; Chen, A.J.; Li, W. Multi-objective Optimal Configuration of Regenerative Electric Heating Considering the Safe and Stable Operation of Distribution Network. Sci. Technol. Eng. 2022, 22, 12883–12891. [Google Scholar]
- Suo, J.W.; Gu, L.; Pan, Y.; Yang, S.J.; Hu, X.Y. Quantum Inspired Genetic Algorithm for Double Digest Problem. IEEE Access 2020, 8, 72910–72916. [Google Scholar] [CrossRef]
- Li, Y.; Bai, E.; Xu, J.; Liu, J.; Liu, S.; Ren, P.; Yuan, P. Dynamic Reactive Power Allocation Strategy for AC/DC System Based on Quantum Genetic Algorithm. In Proceedings of the 2020 Chinese Automation Congress: Chinese Automation Congress, Shanghai, China, 6–8 November 2020. [Google Scholar]
- Wang, J.L.; Xia, L. Fault Diagnosis Method of Shipboard Power System Using Quantum Genetic Algorithm. Proc. CSU-EPSA 2013, 25, 35–39. [Google Scholar]
- Zhao, X.L.; He, G.Y. Power utility evaluation of residential electrical appliances. Autom. Electr. Power 2016, 40, 53–59. [Google Scholar]


| Influencing Factor | Specific Classification | Number | Proportion |
|---|---|---|---|
| Family structure | Office worker | 90 | 0.383 |
| Need to support parents, children | 130 | 0.553 | |
| Vacant house | 15 | 0.064 | |
| Income | High income (>rmb 150,000 ¥/year) | 60 | 0.255 |
| Middle income (50,000–150,000 ¥ year) | 55 | 0.234 | |
| Low income (<50,000 ¥/year) | 120 | 0.511 | |
| Housing area | Small size (<60 m2) | 120 | 0.511 |
| Medium size (60 m2~80 m2) | 55 | 0.234 | |
| large unit size (>80 m2) | 60 | 0.255 | |
| Clothes thermal resistance | 0.5Clo | 76 | 0.323 |
| 1.0Clo | 130 | 0.553 | |
| 1.5Clo | 29 | 0.123 |
| User Category | Clothes Thermal Resistance/Clo Value | A | B | C | Thermal Comfort Temperature/°C |
|---|---|---|---|---|---|
| Youth group | 0.5 | 0.262 | 0.446 | 6.586 | 24 |
| 0.268 | 0.378 | 6.234 | 22 | ||
| 1.0 | 0.137 | −0.137 | 2.923 | 22 | |
| 0.116 | −0.131 | 2.201 | 20 | ||
| Elderly group | 1.0 | 0.125 | −0.207 | 3.148 | 26 |
| 0.151 | −0.203 | 2.822 | 22 | ||
| 1.5 | 0.149 | −0.129 | 2.642 | 26 | |
| 0.144 | −0.139 | 2.573 | 24 |
| User Category | Economy Preference Coefficient | Comfort Preference Coefficient | |
|---|---|---|---|
| 1. Family structure | Youth | 0.53 | 0.53 |
| Elderly | 0.43 | 0.82 | |
| 2. Income status | High-income | 0.21 | 0.84 |
| Middle-income | 0.58 | 0.69 | |
| Low-income | 0.83 | 0.35 |
| User Category | Economy Preference Coefficient | Comfort Preference Coefficient | Thermal Comfort Temperature | Thermal Comfort Temperature Interval | Percentage |
|---|---|---|---|---|---|
| High-income youth group | 0.31 | 0.82 | 26 | [24.8, 27.3] | 8% |
| Middle-income youth group | 0.52 | 0.60 | 24 | [22.8, 25.2] | 37% |
| Low-income youth group | 0.75 | 0.33 | 22 | [19.4, 23.2] | 26% |
| Middle-income elderly group | 0.51 | 0.71 | 24 | [22.8, 26.5] | 16% |
| Low-income elderly group | 0.54 | 0.54 | 22 | [20.8, 24.4] | 13% |
| Time Period | Thermal Comfort Temperature Fluctuation Interval | ||||
|---|---|---|---|---|---|
| High-Income Youth Group | Middle-Income Youth Group | Low-Income Youth Group | Middle-Income Elderly Group | Low-Income Elderly Group | |
| 00:00–08:00 | [24.8, 27.3] | [22.8, 25.2] | [19.4, 23.2] | [22.8, 26.5] | [20.8, 24.4] |
| 08:00–13:00 | [23.8, 26.3] | [20.8, 23.2] | [17.4, 21.2] | [20.8, 24.5] | [19.8, 22.4] |
| 13:00–16:00 | [23.8, 26.3] | [20.8, 23.2] | [17.4, 21.2] | [20.8, 25.5] | [18.8, 23.4] |
| 16:00–19:00 | [23.8, 26.3] | [20.8, 23.2] | [17.4, 21.2] | [20.8, 24.5] | [19.8, 22.4] |
| 19:00–22:00 | [24.8, 27.3] | [22.8, 25.2] | [17.4, 21.2] | [22.8, 26.5] | [19.8, 23.4] |
| 22:00–24:00 | [24.8, 27.3] | [22.8, 25.2] | [19.4, 23.2] | [22.8, 26.5] | [20.8, 24.4] |
| Type | Parameter | Numerical Value |
|---|---|---|
| user parameter | ||
| 06:00–22:00 | ||
| 22:00 until 6:00 the next day | ||
| plant parameter | 97% | |
| 97% | ||
| 0.001 | ||
| Typical Day | Peak Electricity Consumption | Valley Electricity Consumption | Average Room Temperature for the Whole Day | |
|---|---|---|---|---|
| Day1 | 17.6460 | 92.7120 | 21.766 | 0.6156 |
| Day2 | 38.6378 | 123.2022 | 21.643 | 0.6065 |
| Day3 | 83.0723 | 132.1208 | 22.4303 | 0.6323 |
Disclaimer/Publisher’s Note: The statements, opinions and data contained in all publications are solely those of the individual author(s) and contributor(s) and not of MDPI and/or the editor(s). MDPI and/or the editor(s) disclaim responsibility for any injury to people or property resulting from any ideas, methods, instructions or products referred to in the content. |
© 2023 by the authors. Licensee MDPI, Basel, Switzerland. This article is an open access article distributed under the terms and conditions of the Creative Commons Attribution (CC BY) license (https://creativecommons.org/licenses/by/4.0/).
Share and Cite
Guan, D.; Feng, Z.; Song, L.; Hu, K.; Li, Z.; Ye, P. An Optimal Operation Strategy of Regenerative Electric Heating Considering the Difference in User Thermal Comfort. Energies 2023, 16, 5821. https://0-doi-org.brum.beds.ac.uk/10.3390/en16155821
Guan D, Feng Z, Song L, Hu K, Li Z, Ye P. An Optimal Operation Strategy of Regenerative Electric Heating Considering the Difference in User Thermal Comfort. Energies. 2023; 16(15):5821. https://0-doi-org.brum.beds.ac.uk/10.3390/en16155821
Chicago/Turabian StyleGuan, Duojiao, Zhongnan Feng, Li Song, Kun Hu, Zhenjia Li, and Peng Ye. 2023. "An Optimal Operation Strategy of Regenerative Electric Heating Considering the Difference in User Thermal Comfort" Energies 16, no. 15: 5821. https://0-doi-org.brum.beds.ac.uk/10.3390/en16155821