Article

Assessment of the Potential to Use the Expelled Heat Energy from a Typical Data Centre in Ireland for Alternative Farming Methods

1
School of Biosystems and Food Engineering, University College Dublin, D04 V1W8 Dublin, Ireland
2
School of Agriculture and Food Science, University College Dublin, D04 V1W8 Dublin, Ireland
*
Author to whom correspondence should be addressed.
Submission received: 15 August 2023 / Revised: 5 September 2023 / Accepted: 15 September 2023 / Published: 19 September 2023
(This article belongs to the Special Issue Climate Change and Sustainable Energy Transition)

Abstract

:
Data centres, though a necessary part of modern society, are being stigmatised for consuming vast amounts of electricity for their operational and cooling needs. Due to Ireland’s reliance on fossil fuels to meet the increased energy demand of data centres, the data centres are contributing significantly to Ireland’s total carbon emissions. As much of this energy is expelled from data centres as waste heat energy, the potential for recycling some of this wasted heat energy was explored using environmentally friendly systems from recent publications. The recovered waste heat energy was applied in a vertical farming system, and the benefits of this waste heat to the vertical farm were analysed and quantified in two scenarios. Using conservative estimates, it was predicted that each vertical farm could be between 5–23% the size of the data centre and produce enough food to feed between 14–61 adults their daily calorie needs, and between 13–58 people their daily fresh produce requirements, depending on the scenario applied. For a more accurate prediction, each vertical farm would have to be assessed on a case-by-case basis, as there is no current research in this area. However, there was not enough data available on Irish data centres to perform these calculations.

1. Introduction

Data centres have become an integral part of modern society enabling fast communications for e-mail and social media, the storage of public and networked data remotely, and robust networking, in order to have almost instant access to any of this data from an internet/intranet connection [1]. A data centre can vary in size depending on the amount of data that it has to store or transfer, from micro data centres (1–100 kW) that can be portable and used for environmental or construction projects [2], to hyper-scale data centres (100+ MW) that could maintain telecommunications of entire countries [3]. The ever-increasing use of server-dependant technologies like smartphones [4], online gaming [5] and media streaming [6] is increasing the demand for data centres. This is also accelerated by increased use of data, the continuous need for faster download speeds [7], and higher resolution images that increase the volume of data that needs to be processed and transferred [8].
Data centres are estimated to consume 3% of the global electricity supply and are predicted to consume more than 20% by 2025 [9]. Compared to pre-COVID-19 lockdown levels, internet services have increased by 40–80% [10], further increasing their energy demands. At least 40% of this energy is dedicated to cooling the servers [11,12], making the cooling systems of data centres accountable for 1.6% of global greenhouse gas emissions [9]. Many countries are falling short on their carbon emission targets [13]. If the world keeps increasing its dependency on data centres without further consideration of the energy use and energy source, there could be significant ramifications for total greenhouse gas emissions.
Water is often used in cooling data centres, and there is a general lack of transparency on water usage, with less than a third of data centres measuring water consumption [14]. Google has been steadily increasing its water usage by an average of ~19.7% year-on-year since 2018 to 23.8 billion litres in 2021, though it has reduced its rate of increase to ~10.5% in 2020 & 2021 [15,16]. Microsoft has also had a steady rate of increase in water usage, increasing by an average of ~10.4% year-on-year since 2018 to 7.6 billion litres of water in 2021, though it has managed to reduce its rate of increased water usage significantly more to an average of 1% in 2020 and 2021 [17].
Ireland’s data centres currently draw more energy than the entire country’s rural dwellings combined [18], and concerns about energy security and their environmental impact are causing a growing stigma about the sustainability of their energy demand and the associated greenhouse gas emissions [19,20]. In 2021 data centres required 11% of Ireland’s total annual energy consumption (3019 GWh); this is expected to increase to 29% by 2028 [21,22], resulting in over 300 Mt of CO2eq annually from the cooling systems alone [23,24]. Even though Ireland has continuously failed to reach emission targets [25,26,27], there is an increase in the number of data centres being constructed, with Dublin becoming the largest data centre hub in Europe and the operation of Dublin’s data centres currently contributing significantly (1.9%) to Ireland’s total carbon emissions [28].
The global electricity demand grew by 6% in 2021 with coal being used to meet more than half of this extra demand. As a result, the global CO2 emissions from electricity rose by 7% [29]. Due to this increased global demand for energy, and increased energy insecurity from the Russo–Ukrainian war [30], there has been a drastic increase in the price of electricity and non-renewable energy sources [31]. The increase in fuel prices is one of the factors driving global inflation, which in turn is affecting the cost of food and food security [32]. Prior to the Russian invasion, Ukraine was a key exporter producing 16% of the maize, 10% of the barley, 9% of the wheat, and 42% of the sunflower oil for the global market [33]. With other factors like soil degradation reducing yields, climate change-induced weather events destroying crops, and the economic consequences of the COVID-19 pandemic, there are more than 193 million people in 53 countries at crisis levels of food insecurity [34,35].
Approximately 38% of the global land surface is dedicated to agriculture, and about one-third of this is used as cropland with the rest for grazing livestock [36]. Though meat and associated products (milk, eggs etc.) are calorie-dense, and a good source of High Biological Value (HBV) protein and minerals like calcium and iron [37], meat only provides 11% of global food energy [38]. A study by Ritchie and Roser [39] investigated the environmental impact of food production and found that meat requires significantly more resources than vegetables or grains, resulting in a greater environmental impact of production. To produce 1000 kilocalories of food, beef requires 119.49 m2 land area, peas require 2.16 m2, and maize requires 0.65 m2; for 100 g of protein, beef requires 163.6 m2 land area, peas require 3.4 m2, and grains require 4.6 m2, resulting in large amounts of CO2eq being released, as beef produces 99.48 kg CO2eq per kilogram of product compared with peas producing 0.98 kg and maize producing 1.7 kg.
A study by Abbade [40] concluded that the world’s food production is sufficient to meet the world population’s nutritional demands, but there is much waste in supply chain efficiency, and the end users waste up to 30% of food purchased [41]. The centralisation of food production is more cost-effective [42], but it increases dependency on logistics and requires a more efficient and comprehensive supply chain [43]. A breakdown in the supply chain can have repercussions for the global market, like the blockage of the Suez Canal that impacted 12% of global trade [44], the delays caused by the breakdown in logistics affecting China’s distribution [45], or the effects of political decisions and national emergencies, like Brexit and COVID-19 [46].
Many innovations in farming and food production have increased production yields and improved post-harvest quality, such as implementing new crop rotation methods that increase the sustainability and profitability of soybean production [47]. Other innovations include experimentation with breeding technologies to develop safe-to-eat genetic variations of lettuce with improved post-harvest quality [48]. However, further research is still needed into drought-tolerant varieties, pest and disease resistance, and reducing the environmental impact of production [49]. Droughts were found to statistically significantly and negatively impact household nutrition due to the effect on crop yields; their frequency and severity are expected to increase worldwide in the coming years [50,51]. Pests and pathogens were accountable for 4.84–16.29% of the wheat loss in China between 2000 and 2018 [52]. Increased global temperatures are facilitating the growth and reproduction of insects, and this increased pest density is causing additional crop damage [53]. Alternative innovative methods of food production are being developed to reduce environmental impact, such as the development of meat alternatives [54], the use of microalgae as animal feed and water purification/waste management [55], or the use of biological agents, like tadpoles, fish, ducks, geese and pigs, as weed control instead of chemical herbicides [56].

Potential Solutions

Vertical farming is one method of food production growing in popularity for domestic and commercial food production [57]. The global vertical farming market is expected to increase by an average of 23.86% year on year to a value of $20 billion by 2026 [58]. The world’s largest vertical farm has recently opened in Dubai with more than 300,000 m2 of production space and with the capacity to produce one million kgs of leafy greens annually for Emirates Flight Catering [59]. There are many advantages to this farming method: the plants are arranged to support high crop yield production per unit area, enabling annual crop cultivation with less space, which is less labour intensive [60]; the absence of soil and indoor controlled environments reduce water loss through drainage and evaporation resulting in hydroponic methods using as little as 8% of the water compared to conventional methods [61], which also drastically reduce the risk of diseases or pests damaging the crop, eliminating the use of pesticides and herbicides in vertical farm facilities [62]. The decentralisation of food production would reduce emissions from transportation of food while increasing access to fresh produce [63]. There is, however, a major disadvantage to vertical farms in that their increased energy consumption uses on average 38.8 kWh per kg (139.7 MJ/kg) of produce compared to unheated greenhouses, which use on average 5.4 kWh per kg (19.4 MJ/kg) [64].
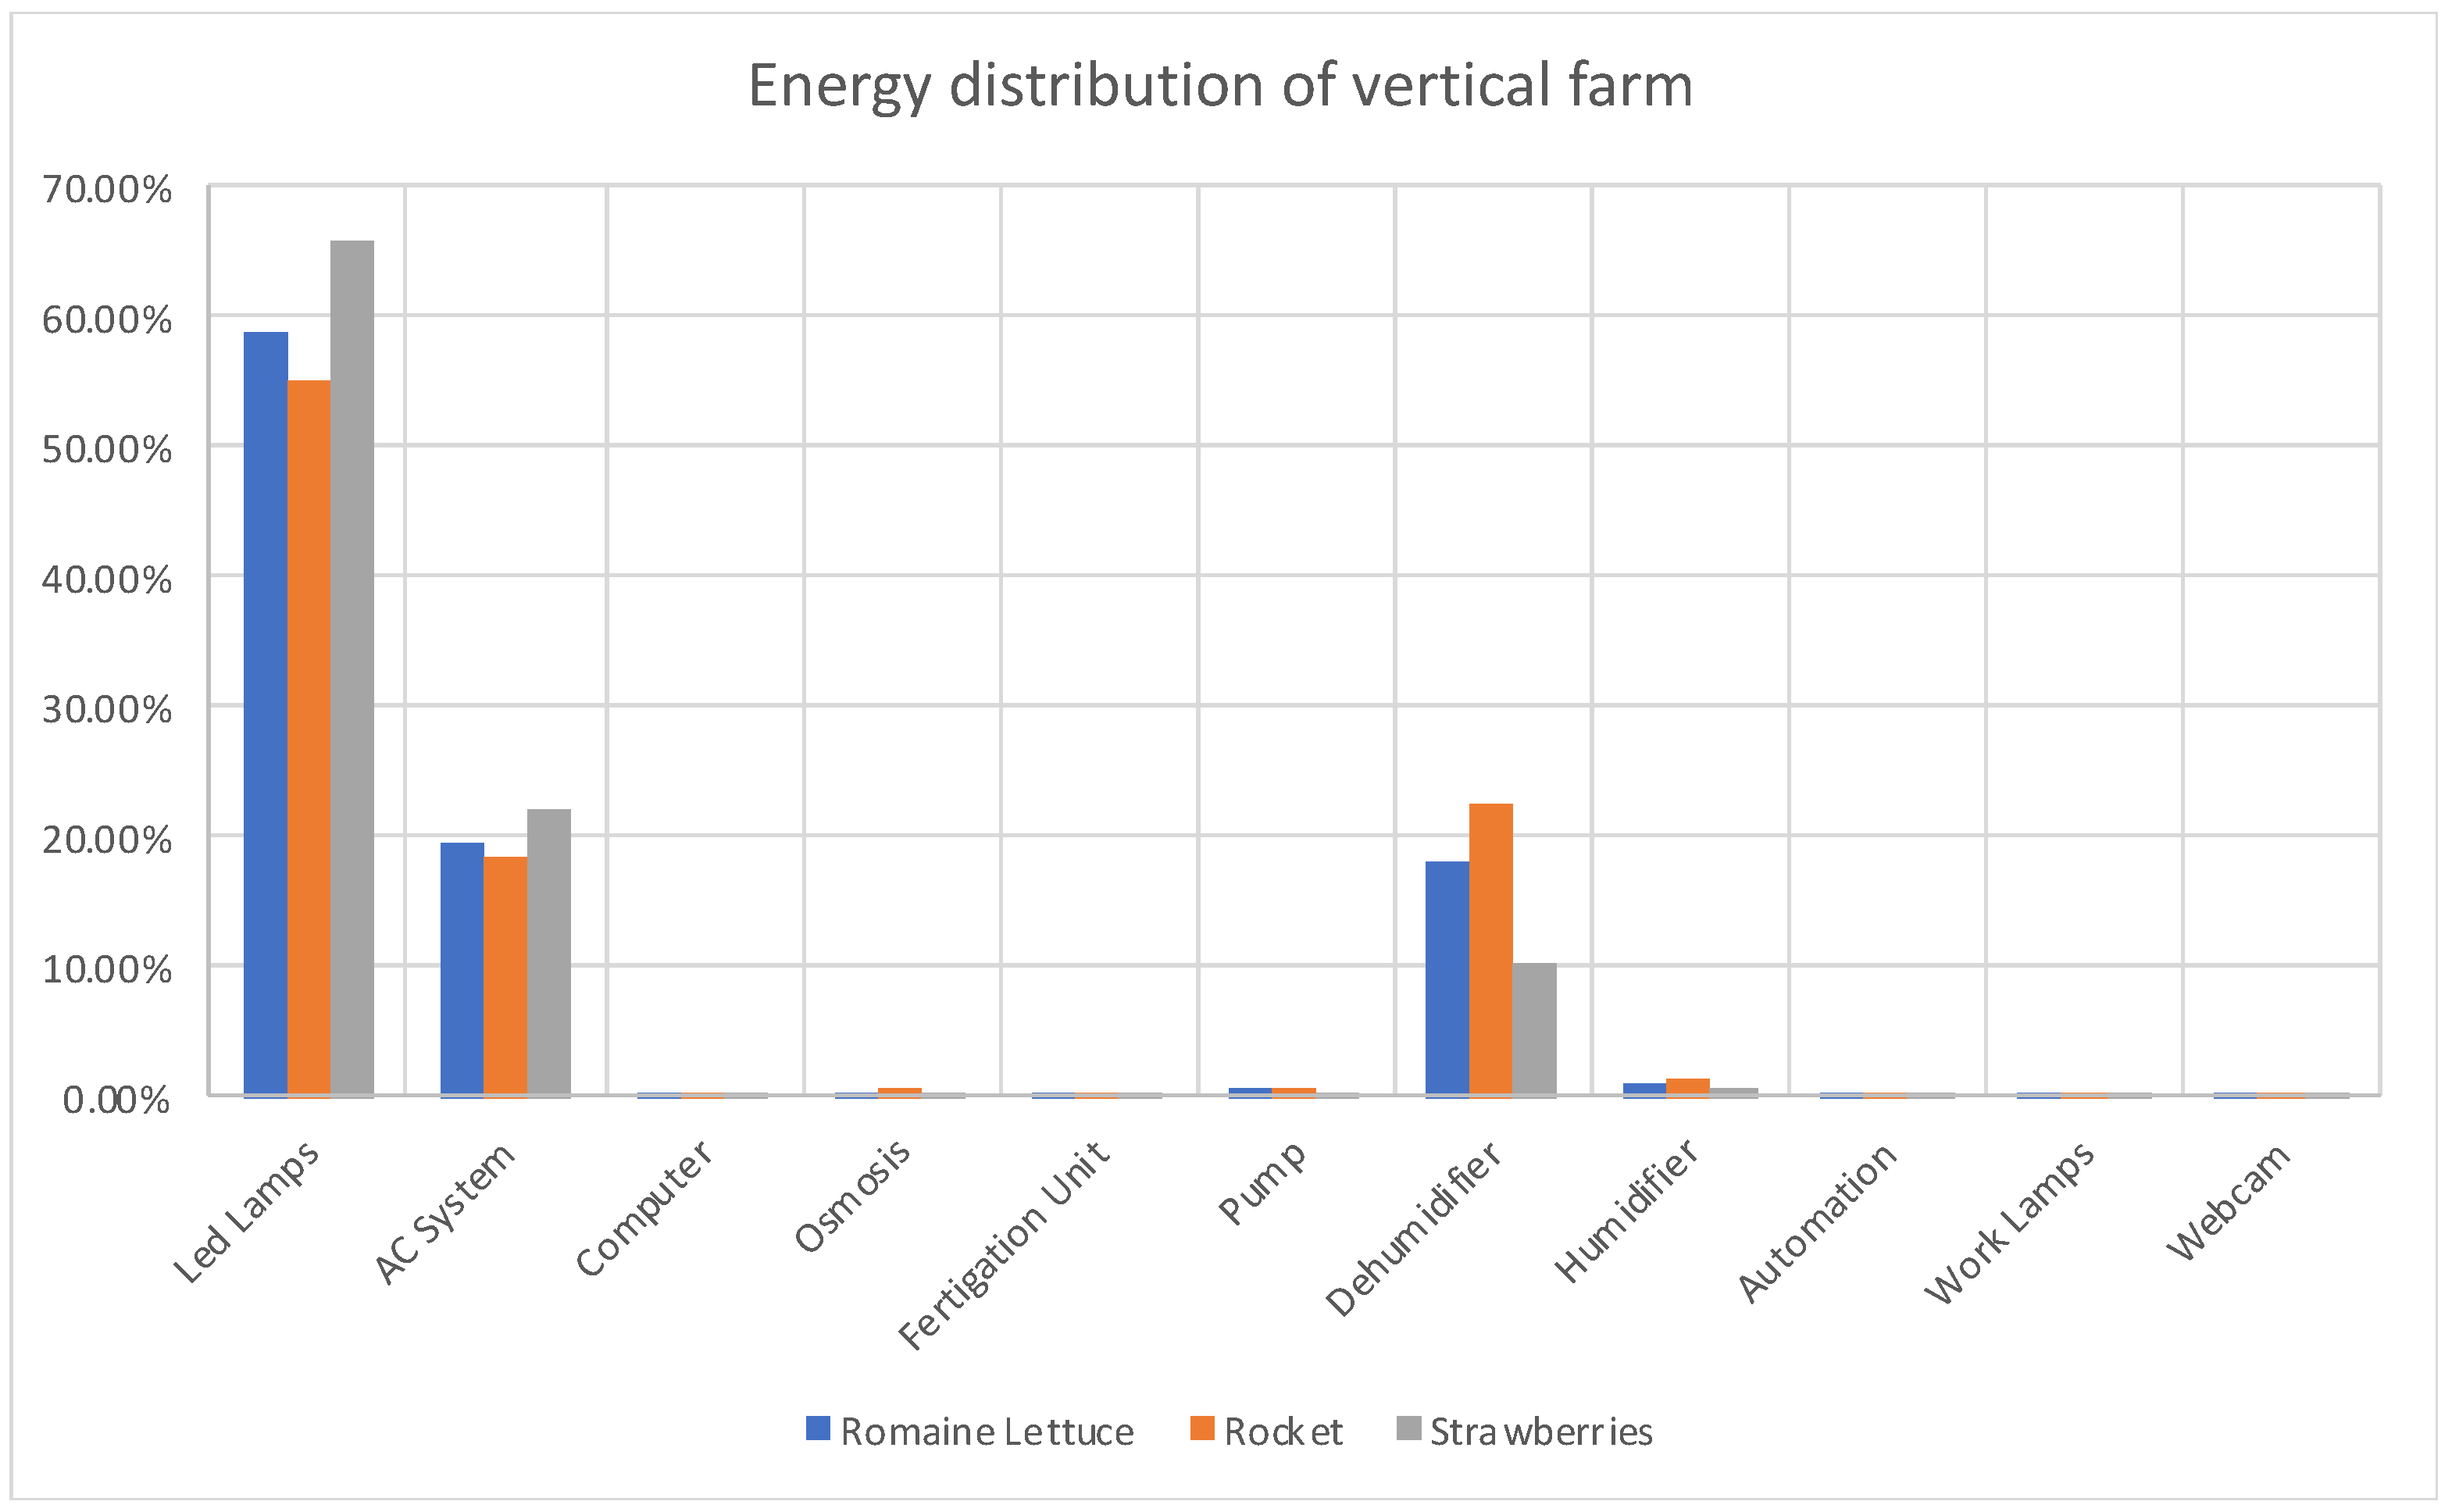
Depending on the crop being grown, the air conditioning system uses 18–23% of a vertical farm’s total energy in temperate climates [65]. However, fluctuations in the temperature (23–34 °C) of the external environment can increase this energy demand by up to 50% [66]. The average annual temperature of the Dublin region over the past three years is 10.1 °C [67]. This is one of the reasons why Dublin is home to 25% of all data centres in Europe, the relatively cool climate reducing the workload and cost of running the air conditioning units [68]. Most of the electricity consumed in Information Technology (IT) installations is converted into waste heat, forming a large and stable low-temperature heat source [69]. Much research has been conducted into novel methods of utilising the wasted heat energy from data centres for heating homes and office space [70], but not much into using the waste heat energy in a vertical farm setup. It has been shown that an increase in ambient temperature increases the growth rate of plants by up to 100% [71,72], so some of the low-grade heat energy can be utilised by a vertical farm to increase yields. This paper attempts to determine if there could be a potential symbiotic relationship in energy usage between data centres and vertical farms and to quantify any reduction in overall energy consumption and carbon emissions.

2. Materials and Methods

2.1. Research Methodology

This research will be a data-driven feasibility analysis to determine if it is possible to reduce the environmental impact of a data centre by recycling the waste heat produced to supply energy to a vertical farm. This paper will consult available data on Irish data centres and supplement any gaps in the literature with data from data centres operating in similar climate regions to determine a range for how much waste heat energy is produced. There will be consideration of energy losses through waste heat transportation. These losses will be quantified to determine the preferred method of heat transfer to maintain the maximum amount of heat energy available to a vertical farm. The magnitude of heat energy available will influence the size of the vertical farm and the types of produce that can be grown in the facility, and the geographical location of the data centre will also be a factor to consider in the calculations. Using public data on the environmental impact and cost of energy production in Ireland, the advantages and disadvantages of combining a data centre and a vertical farm will be explored to determine if the proposed system is feasible.

2.2. Data Collection and Analysis

Data on the energy use of Irish data centres was compiled from public online data resources [21,73,74].This data was found to be insufficient, so it was supplemented with comparable data from London data centres [75]. The quantification of waste heat recovery rates could not be determined from current research available on Irish data centres, therefore figures provided by [9] were used. The variations in weather conditions used in calculations were provided by the Irish Meteorological Service [67,76]. There was very little research into the energy requirements of a vertical farm in Ireland as the first large-scale vertical farm only started producing in 2021 [77], so data from a manufacturer of vertical farms [65] was used. Electric Ireland and the Environmental Protection Agency provided the data used to calculate the financial and environmental costs of electricity production in Ireland [24,78].

2.3. Determining the Energy Usage of Irish Data Centres

The available data on energy use in Irish data centres [73,74] was compiled in a spreadsheet. However, the only figures available were the size of the data centres (ft2) and the power consumption (MW) of the whole building, as much of the data from Data Centres and Baxtel were incomplete, with only 33.3% and 45.7% of the respective sources having data on both size and power consumption of data centres in Ireland. To obtain more data, London data centres were considered, as the climate is relatively comparable to Ireland, though an average of ~5.65 °C warmer [79].Therefore, the cooling systems of data centres will likely require slightly more energy in London than in Ireland. There was a slightly higher level of reporting (52.83%) on London data centres [75], hence this data will be used to assist in research but will be kept separate for calculations. The unit used to compare the data centres will be power used per area of data centre (kW m−2).

2.4. Quantification of Usable Wasted Heat Energy Produced in Data Centres

Research by Wang et al. [80], stated that the average total energy distribution of a data centre is IT equipment (44%), cooling (40%), transportation and distribution losses (7%), site power system losses (6%), and miscellaneous (lighting, security etc.) (3%). Up to 90% of a data centre’s electricity is converted to low grade waste heat [81]. To calculate the viable waste heat, the miscellaneous energy use and the transportation losses will not be considered as they are unlikely to expel their waste heat in the server room with the heat recovery system. Similarly, the cooling system is unlikely to add recoverable heat to the system. Therefore, the maximum potential waste heat will be calculated based on the IT equipment and the site power system loss, assuming 90% of this energy is converted into recoverable heat. The average rate of waste heat energy ( Q w ˙ ) produced by a data was calculated using these estimates.
Q w ˙ = 0.9 ( Q ˙ ) × 0.44 + 0.06 = 0.45 ( Q ˙ )
The amount of this energy that can be recovered varies from system to system, with up to 68% of the waste heat being recoverable when the servers are submerged in a dielectric coolant [82]. The value of 55% recoverable energy using in a district heating water-side economiser system [9] was chosen to calculate the maximum usable waste heat energy per second ( Q w u ˙ ), as it was considered to be the most efficient viable system to adopt.
Q w u ˙ = 0.55 ( Q w ˙ ) = 0.2475 ( Q ˙ )

2.5. Energy Requirements of a Vertical Farm

Data from producers of vertical farms [65] was tabulated to determine the energy breakdown for each piece of necessary equipment used. All electric powered devices will produce some waste heat energy; though LED lights are much more efficient than other light sources, they still emit between 70–80% of their energy usage as waste heat [83]. This will be assumed to be a constant 75% for ease of calculations. The desired temperature of the vertical farm is 20 °C [65], but due to the amount of waste heat available from the data centre and the LED lights, plants more suited to a warmer climate will also be considered [84].

2.6. Feasibility Analysis of Combining the Two Systems

There are many factors to consider when retrofitting a vertical farm to a data centre and each of these variables will likely be different for every data centre. Without available data, it is impossible to design an ‘off the shelf’ solution that will suit all data centre configurations. This paper will assume that there is space adjacent to the data centre in order to retrofit the vertical farm or that the vertical farm and data centre are being constructed simultaneously. This study will focus on the energy balance between a data centre and a vertical farm to determine the ideal size of a vertical farm based on the available amount of waste heat generated and crops produced. The potential system will be analysed in two separate scenarios:

2.7. Scenario 1—Integrated System

The data centre and vertical farm are one combined system. The waste heat is pumped directly into the vertical farm, where it is circulated. The air expelled from the data centre is dry and warm [85]. It will be used to heat the vertical farm and assist in the transpiration of the plants [86], and this cooler, more humid air is passed back to the computer room air handler (CRAH) unit to complete the cycle.

2.8. Scenario 2—Heat Exchange System

The data centre and vertical farm are two separate buildings adjacent to each other. The waste heat energy is transferred from the data centre to the vertical farm through heat exchangers, as described by Zhang et al. [87]. There is no air mixing between the data centre and the vertical farm in this system, but there is some heat energy lost through a heat exchanger. The volumetric flow rate of the air circulating in the data centre (Figure 1. (top)), will depend on the quantity of waste heat energy a data centre produces. This in turn will affect the flow rate of the ambient Irish air (Figure 1 [bottom]), to provide the vertical farm with its desired operating conditions.

2.9. Quantification of Energy Savings

The waste energy from the data centre will offset some of the energy requirements of a vertical farm by providing a stable climate and eliminating the need for a dedicated a/c system, humidifiers, and dehumidifiers. The energy savings will be determined using the ideal size of the vertical farm based on the available waste heat energy in each scenario.

2.10. Potential Effect on Food Security and Healthy Eating in the Locality

Using the ideal size of the vertical farm from each scenario and available data on the yields of different food products grown in vertical farms compared to a similar area of arable land [88], the calorific potential of the vertical farms will be determined. Using the healthy eating guidelines [37], it will then be determined how many people (2000 calories or seven portions a day) can be nourished by the vertical farm versus the same area of land using traditional farming methods.

2.11. Potential Environmental and Economic Benefits

The energy saving implications of each scenario will incur economic savings through a reduced energy bill and a reduction in greenhouse gas emissions through this energy saving and the fuel saving in the transportation of goods. These reductions will be calculated using the average values from the Irish grid [24,78,89]. Food miles can account for up to a fifth of total food system emissions [90]. Using recent data on emission factors for transporting food [91], the average reduction in carbon emissions was tabulated to estimate the carbon emissions.

3. Results

3.1. Determining the Energy Usage of Reported Irish Data Centres

Many variations were observed (Table 1) in the size (621–86,000 m2), power consumption (0.46–108 MW), and power consumption per unit area of the data centres in Ireland (0.2–3 kW m−2). Microsoft Dub 07 (part of Microsoft Dublin Grange Castle data centres) was found to correlate the closest to the average values from reported data.
Although there was also a lot of variation (Table 2) in the size (809–84,542 m2), power consumption (0.5–29 MW), and power consumption per unit area of the data centres in London (0.05–10 kW m−2), the average size of London data centres tended to be smaller than that of Irish data centres (9576 vs. 17,734 m2). On average, they consumed less power (7.66 vs. 23.71 MW) but have overall higher average levels of power consumption per unit area (1.49 vs. 1.32 kW m−2).

3.2. Quantification of Usable Wasted Heat Energy Produced in Data Centres

The amount of recoverable waste energy being produced was calculated (Equation (2)) based on the heat recovery system (Figure 2) described by [9], and available data from Irish and London-based data centres.
On average, Irish data centres produce more waste heat energy (5.87 MJ) than London-based data centres (1.9 MJ). However, when their areas are considered, there is more waste energy produced per square meter on average in London data centres (369.68 J m−2) than in Ireland (326.75 J m−2). The potentially recoverable minimum & maximum usable waste heat energy from Irish data centres and usable waste heat energy per square meter for Irish data centres were 0.11–26.73 MJ and 50.64–742.51 J m−2, respectively.

3.3. Energy Requirements of a Vertical Farm

It was found (Figure 3) that the energy demand for different plants fluctuates depending on the species and whether it produces a flower or fruit. Energy demand per annum: romaine lettuce 783 kWh m−2 (2.81 GJ m−2); rocket 630 kWh m−2 (2.26 GJ m−2); strawberries 1405 kWh m−2 (5.06 GJ m−2). The LED lights require the most energy (55.2–66%), with more light energy required by strawberries to produce the fruit. Between 18.2% & 22% of the total energy demand comes from the air conditioning (AC) unit, and between 10.2% and 22.5% is used to power dehumidifiers. The operating temperature of the vertical farm was assumed to be 20 °C.

3.4. Effect of Waste Heat on Plant Growth

Data centres are advised to operate in the range of 18–27 °C, but are permitted to go as high as 32 °C [92]. Many foods (Table 3) can grow comfortably above the temperatures of a data centre, and some plants have increased growth rates at these temperatures.
The vertical farm has the potential to utilise some or all of the waste heat from a data centre to optimise the potential growth rates in the vertical farm, but without causing thermal harm to the plants. However, there are many variables to consider, such as the amount of waste heat recoverable from a data centre, the load of the data centre, the size of the vertical farm facility, its ambient temperature, and the type of crops being grown.

3.5. Feasibility Analysis of Combining the Two Systems

Though some rural Irish data centres, like that in Clonee, have ample space around the data centre to construct a vertical farm, many inner-city data centres, like in Finglas, are surrounded by streets or buildings. This paper will not consider the size constraints in each individual scenario and assume that the vertical farm can be built directly adjacent to the data centres for the scenario analysis. For all scenarios, it was assumed that the exhaust air ( θ e ) of the data centre is between 25–35 °C [101]; the inlet ( θ i ) of the data centre is between 18–23 °C [102]; and the ideal operating conditions for the data centre is 21.5 °C (45.5% RH) [103]. The external climate conditions assessed will be the average Irish temperature ( θ a v ) of 10.1 °C and the London average of 15.8 °C [67,76,79].The ideal conditions of the vertical farm ( θ v f ) will vary depending on the variety of plant being grown; most plants are comfortable at 20 °C, but different plants will be considered in each scenario.
According to Naranjani et al. [104], a horizontal air speed of 0.3–0.5 m s−1 boosts photosynthesis, and 0.4 m s−1 will be used as the desired air speed of the vertical farm ( v ˙ i d ) , in order to calculate its ideal area ( A i d ) . The psychrometric properties of all the conditions to be analysed are summarised in Table 4. The energy of the system will be analysed using psychometric charts and systems as recommended by Callahan et al. [105].

3.6. Scenario 1—Integrated System

As the waste heat air is pumped directly into the vertical farm, there is no heat energy lost from using a heat exchanger. The waste heat energy and its flow rate can vary depending on the size and energy use of the data centre. The CRAH system was assumed to have an air intake temperature of 20.5 °C and an exhaust temperature of 30 °C. The mass flow rate of the exhaust air was calculated according to Equation (3).
m ˙ = Q w ˙ h e h i
Though many plants can comfortably grow at the average data centre exhaust air temperature, it is too hot for the average vertical farm and must be mixed with some external air to maintain the temperature at 20 °C. The mixing ratio is calculated using the mass–energy balance of the flow rate and the airflows’ respective entropies according to Equation (4).
m e ˙ h e + m ˙ a v h a v = m ˙ v f h v f b u t   m ˙ v f = m ˙ e + m ˙ a v m ˙ a v = m e ˙ h e h v f h v f h a v
It was found (Equation (5)) that the volumetric flow rate of air into the vertical farm ranged between 31.8–7467.1 m3 s−1 (average 1639.34 m3 s−1); for every square meter of data centre, the volumetric flow rate range was between 0.014–0.207 m3 s−1 m−2data centre (average 0.091 m3 s−1 m−2data centre). For every m3 of data centre exhaust air, on average 0.7895 m3 of air from the external environment is required to achieve the ideal temperature for the vertical farm.
V ˙ v f = Q w . V i d h e h i 1 + h e h v f h v f h a v
Therefore, the ideal size of a vertical farm (Equation (6)) ranged between 80–18,667 m2 (average 4098.4 m2). Assuming that the data centre and the vertical farm have the same height, the area of a vertical farm should be on average 23% the size of a data centre (range of 3–52%) to utilise the waste heat effectively.
A i d = V ˙ v f v ˙ i d
The range of values for Irish and London based data centres are presented in Table 5 and Table 6, showing their calculated air flow rates and the resulting area of the vertical farm that could be built to utilise the waste heat energies in each scenario.
As the vertical farm also produces some waste heat from the lights and other electrical equipment, the air will be heated further before being recirculated into the data centre’s CRAH unit. The plants in the vertical farm will contribute a slight evaporative cooling effect from the transpiration of water through the leaves. According to Qingjuan et al. [106], the maximum cooling effect of transpiration is 2.4 °C/1000 m3, causing a humidity increase of 6.43%. The waste energy provided by the electrical equipment in the vertical farm (Table 7) ranges from 124 kW/1000 m3 (rocket) to 218 kW/1000 m3 (strawberries); assuming that the air mixing eliminates the need for humidity and heating control, the average value of 94.418 kW/1000 m3 was used to calculate the heating effect of the vertical farm’s electronics.
The cooling effect of transpiration ranged from 101–23,668 kW (average 5196.17 kW) (Equation (7)), and the heating effect from the waste heat produced by a vertical farm’s electronics ranged from 7.5–1762.6 kW (average 387 kW). When combined, it was found (Equation (8)) that the net negative energy of the system produced a vertical farm exhaust temperature ( θ v f e ) , of 15.2 °C. The range of values for the energy savings of vertical farms built adjacent to Irish and London-based data centres are presented in Table 8.
Q ˙ t = V ˙ v f h v v f h v t Q ˙ w v f = A i d ( 94.418   W . m 2 )  
θ v f e = θ v f + Q ˙ w v f Q ˙ t V ˙ v f × C v a i r
The above calculations assumed average temperatures for the air exhausted from the data centre (30 °C), keeping all other temperature parameters constant. If the exhaust was operating at its upper limit (35 °C), the vertical farm would be, on average, 19.27% smaller for Irish data centres and 9.42% smaller for London’s data centres; if operating at its lower limit (25 °C), it would increase the size of the vertical farm by 66.6% in Irish data centres and by 32.5% in London’s data centres.

3.7. Scenario 2—Heat Exchange System

The waste heat energy from the vertical farm is transferred through a heat exchanger and loses some energy in the process. The usable waste heat energy ( Q w u ) is diverted to the vertical farm, which is assumed to be built adjacent to the data centre to prevent further heat loss. The usable heat energy (Table 9) will then be transferred to the air from the external environment to create the ideal vertical farm conditions. The volumetric flow rate of the air in the vertical farm (Equation (9)) varied between 7.29–1712.68 m3 s−1 (average 376.01 m3 s−1); for every square meter of the data centre, the volumetric flow rate range was between 0.003–0.048 m3 s−1 m−2data centre (average 0.021 m3 s−1 m−2data centre).
V ˙ v f = V v f ( Q ˙ w u h v f h a v )
In this scenario, the ideal size of a vertical farm ranged between 18.2–4281.7 m2 (average 940 m2), and the ideal area of the vertical farm would be 5% of the size of the data centre (range 0.8–11.9%). A breakdown of Irish and London data centres is given in Table 9 and Table 10.

3.8. Quantification of Energy Savings

Using the energy requirements of the vertical farm (Table 7), it was determined that every square meter of the vertical farm would require, on average, 58.7 W less energy if the energy demands of the vertical farm can be compensated by the waste heat of a data centre. Using the data from Irish data centres in Scenario 1, it was determined (Table 8) that the calculated ideal-sized vertical farm would save between 4.7–1095.8 kW (average 240.6 kW) by utilising the data centres’ waste heat. In Scenario 2, the energy savings (Table 9) were between 1.1–251.3 kW (average 55.2 kW) for Irish data centres.

3.9. Potential Effect on Food Security and Healthy Eating of Locality

From the sample of foods analysed (Table 11), the vertical farm produces on average 7.23 kg of produce per square meter of growing space, with tomatoes having the greatest mass of yield. However, as potatoes are very calorie dense, they would be able to feed more than twice the people with the same growing area (52,350 kcal m−2).
Using the average values (Table 12), the ideal vertical farm from Scenario 1 could provide enough calories to feed between 1–280 people (average 61) their recommended 2000 kcal per day and provide between 1–264 people, (average 58) people with all seven portions of fruit and vegetables. Using the same area of vertical farm as arable land, the land area would feed an average of 19 people their daily calories and an average of 22 people their fruit and vegetables. A complete list of values for Ireland and London are presented in Table 12 and Table 13.
In Scenario 2, the ideal vertical farm could provide between 0–64 people (average 14) with their daily calorie intake and 0–61 people (average 13) with their recommended fruit and vegetables. The same area of arable land could produce on average enough food to provide the calories to sustain four people and provide the fruit and vegetables for five people per day. A complete list of values for Ireland and London are presented in Table 14 and Table 15.

3.10. Potential Environmental and Economic Benefits

Current data [89] shows that the cost of electricity in Ireland during the day-time and night-time are €0.3344/kWh (€92.88/GJ) and €0.165/kWh (€45.83/GJ), respectively. Assuming a constant energy demand, the total annual energy cost is €2374.44/kWannum. According to the Environmental Protection Agency [78], there was an increase in coal and oil as a fuel source for the Irish electricity grid in 2021, causing an increase in the emission intensity of power generation in 2021 (331 g CO2eq/kWh) compared to 2020 (296 g CO2eq/kWh). The average of these values (2748 kg CO2eq/kWannum) will be used for calculations.
In Scenario 1, the energy savings of the ideal vertical farm ranged between €11,082–2,601,895/annum (average €571,227); the range of carbon emissions offset by the system was 12.8–3011.3 tonnes of CO2eq per annum (average 661.1 tonnes of CO2eq per annum).
In Scenario 2, the energy savings of the ideal vertical farm ranged between €2542–596,781/annum (average €131,019); the range of carbon emissions offset by the system was 2.9–660.7 tonnes of CO2eq per annum (average 151.6 tonnes of CO2eq per annum).
Depending on whether the food product requires ambient or cooled conditions, there is a different energy demand and associated carbon emissions. Assuming that there is 100 km of distance from farm to port and from port to shop, the average carbon impact of importing a tonne of product was assessed (Table 16). Using the average values, the carbon emissions per tonne of product imported were calculated to be 190 kg CO2e/tonne. Using the expected yields of the vertical farms, the annual carbon emission reductions by the proposed system ranged from 109–25,655 kg CO2eq (average 5632 kg CO2e) in Scenario 1 and 106–6128 kg CO2eq (average 1619 kg CO2e) in Scenario 2 for Irish data centres (Table 17). The data shows that London data centres (Table 18) are better suited to Scenario 2 and Irish data centres are better suited to Scenario 1.

4. Discussion

4.1. Summary of Key Findings

This study has shown that there is a lack of data on Irish data centres. There is little transparency regarding the accuracy of the available data and the comparability of data noted by many researchers investigating the energy use of data centres [14,108,109]. Less than half of Irish data centres have readily available information; since writing this paper, some of the information is no longer freely available [73], further decreasing the accessibility to data. As a result, other recent research into the energy use of Irish data centres [110], cooling techniques applied in Irish data centres [111], and the sustainability of cooling methods in Irish data centres [112] had to make many assumptions regarding the energy uses, operating temperatures and applied technologies of Irish data centres. The data centre market is ever-growing and changing, with a further three data centres approved for construction in Ireland (August 2022), one in Ennis [113], and two in Dublin [114]. These newer data centres are likely to be more energy efficient than older data centres in compliance with energy and emission targets set by the countries they are being built in [115] and the companies that operate them [116,117]. Therefore, direct comparisons between all data centres are impossible without considerations to the specifications of the cooling systems implemented in each system and their respective efficiencies.
Many variables are involved in determining a data centre’s waste heat. This paper has shown that all data centres produce waste heat energy that can be recovered to some degree. However, the accurate quantification of this energy must be assessed on a case-by-case basis. Conservative estimates and average values from the literature were used when required, causing the values obtained for the ideal vertical farm size and the associated energy and environmental savings to be likely underestimated. This paper has calculated the average ideal size of a vertical farm to incur maximum savings in energy, based on available data in two separate scenarios. The proposed systems can be implemented to supplement the energy of a non-ideal sized vertical farm and still reduce the overall energy demand. There is also little research into the optimisation of operating a vertical farm in Ireland, as Ireland’s first commercial vertical farm only started producing in 2021. It was built by retrofitting an existing mushroom farm into a hydroponic farm [118], and, therefore, may not be optimally designed for maximum yields and resource usage. However, after less than a year of operation, it is expanding its capacity by 20% [77], implying that there is a market gap for fresh produce from a vertical farm in Ireland and that the business model is profitable, even with the relatively high set-up costs and energy costs of operation. By building a vertical farm adjacent to a data centre, this paper has shown that there are guaranteed energy savings and carbon emission reductions, when compared to a stand-alone vertical farming system.
The research and calculations of this paper focused on creating the optimum operating conditions (20 °C) of a vertical farm [65]. To create these conditions, some of the heat energy was lost through heat exchangers or the temperature was decreased by mixing the exhaust air with air from the external environment to maintain these conditions. However, research has shown (Table 3) that many food-producing plants can grow in a wide range of temperatures (18–35 °C). Suppose a data centre has more or less space for a vertical farm than suggested by calculations in the scenario analysis, or the average waste energy values are different than reported figures from primary research. By being creative with the selection of produce, the vertical farm could support a range of plants that can utilise most, if not all, of the available waste heat energy from a data centre.
The temperature of the external environment is one of the key variables that drive the energy demand of the cooling system in a data centre [119]. By comparing the total energy consumption per unit area of Irish versus London based data centres (Table 1 and Table 2), we can see that London data centres on average use 12.8% more energy per unit area. This is at least partially due to the increased temperature of the ambient environment, but the relatively small size and energy use of London data centres versus Irish data centres, 46% and 67%, respectively, and the accuracy of reporting, could also play a role in the discrepancy. Though this extra heat could support larger vertical farms in London versus Ireland in both scenarios compared to the size of the data centre provided, due to the scale of Irish data centres larger vertical farms could be built in Ireland.
The waste heat energy provided by the data centre has been shown to eliminate the need for a dedicated heating system in the vertical farm. There was an average energy saving of 36.6% versus a vertical farm relying entirely on its own climate control system. The energy costs associated with operating a vertical farm are a commonly referenced risk associated with the profitability of a vertical farm [120,121]. The direct impact on energy costs incurred by utilising the waste heat of a data centre would therefore help make vertical farms a more profitable enterprise. These energy savings will also directly impact the carbon emissions produced by the vertical farm. In 2021, the agriculture sector was directly responsible for 37.5% of Ireland’s total greenhouse gas emissions [122]. The Irish government has set a target of a 25% reduction in agricultural emissions by 2030 [115]. Vertical farming has already been shown to emit up to 70% less carbon emissions than traditional agricultural methods [123]. By reducing the energy needs of a vertical farm using the waste heat of a data centre, these carbon emissions can be further reduced, which would help Ireland reach its 2030 target.
Currently, the only produce grown in a vertical farm in Ireland are salad leaves and herbs such as basil [77]. By utilising the waste heat energy from a data centre in a vertical farm, it would be possible to grow some of the produce which cannot be grown or has low yields in the Irish climate, like rice [99], or cherry tomatoes [94]. Using the average temperatures provided by the data centre, each Irish vertical farm could produce enough food to feed an average of 61 people per day their daily calorie needs or an average of 58 people their recommended seven portions of fruit and vegetables.
The amount of waste energy an average data centre uses was quantified based on available data and recent research. The amount of this energy available to a vertical farm was calculated using two different scenarios to further investigate the proposed system’s feasibility. The energy, and subsequently the environmental and economic savings, were quantified in both scenarios. Both systems had quantifiable benefits to the communities surrounding the data centre by providing fresh produce and reducing carbon emissions from transportation. Although both scenarios incurred savings, initial results indicate that Scenario 1 is the better system to implement in Ireland. However, both systems have advantages and disadvantages that must be considered before determining which system is better to implement in a specific data centre.

4.2. Scenario 1

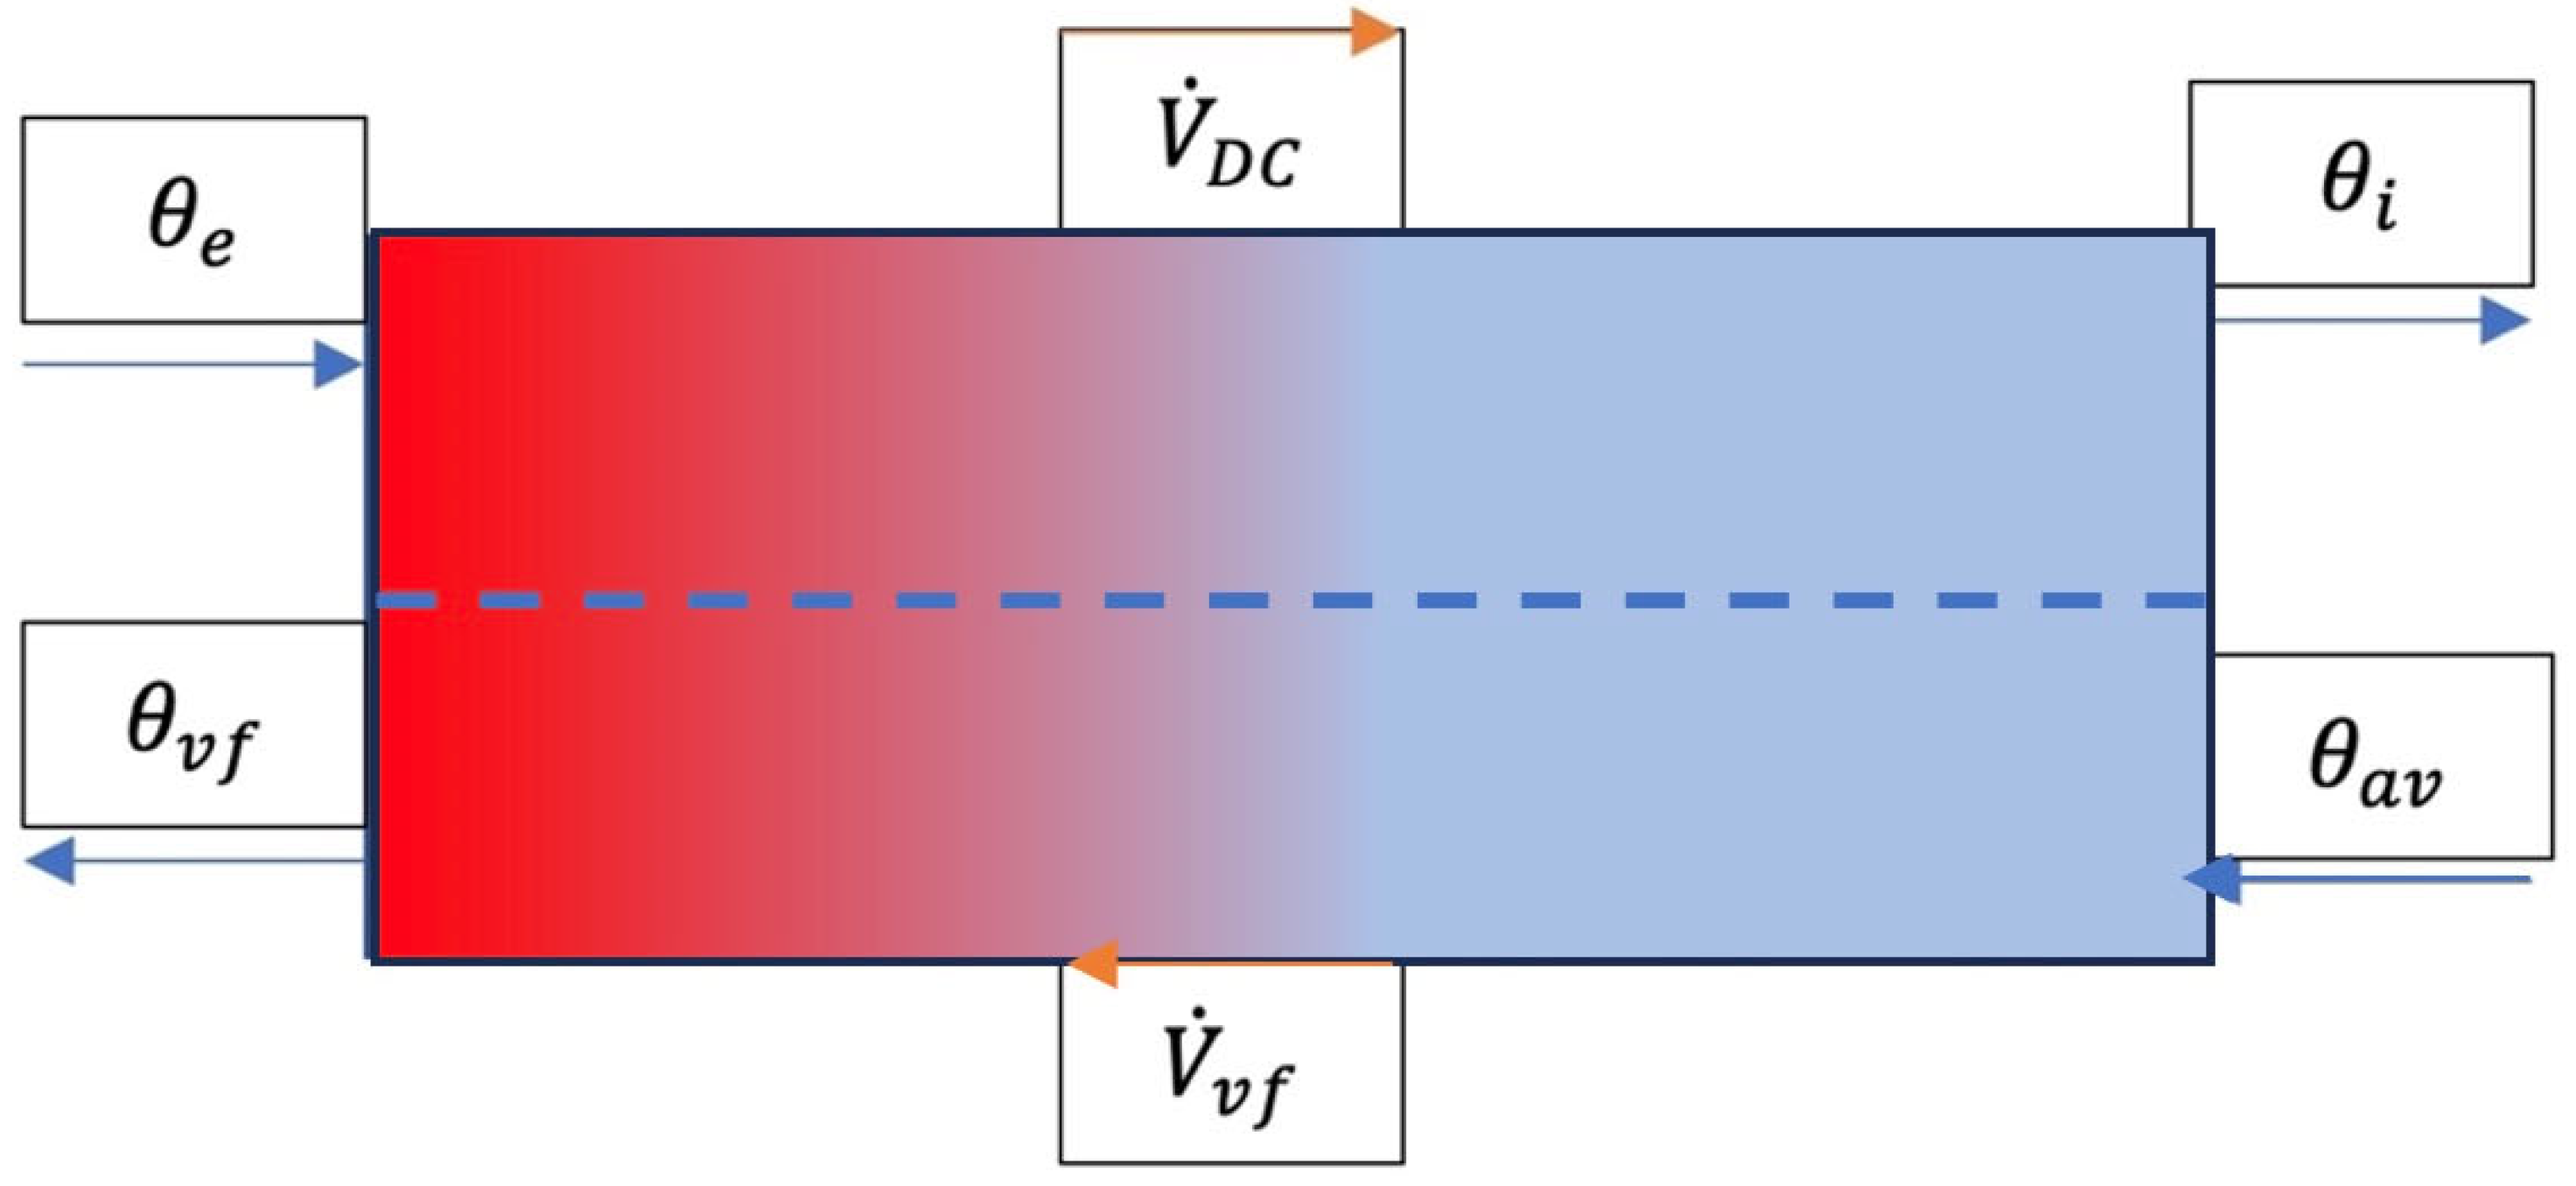
The waste heat energy from the data centre was mixed with air from the external environment to achieve the ideal temperatures of the vertical farm. The flow rate of this air was used to determine the ideal size of the vertical farm. Based on the size of the vertical farm, the energy savings that could be incurred were calculated assuming the absence of a dedicated air handling system. The effect of transpiration cooled the air, low enough to be circulated back into the data centre, though some air must be vented to decrease the airflow speed to its original specifications. A summary of the main findings is presented in Table 19.
Due to the average temperature of London (15.8 °C) being closer to the average temperature of a vertical farm (20 °C) than that of Ireland (10.1 °C), less energy was required to increase the ambient air to the ideal conditions of a vertical farm in London. As a result, the system applied to London data centres could support a vertical farm more than twice the size of one in Ireland. However, due to the scale of Irish data centres, there would be greater savings in energy and more people could be fed and nourished with more significant environmental benefits if the model was introduced in Ireland.

4.3. Scenario 2

The waste heat energy from the data centre was transferred to the vertical farm using a water-based heat exchanger. The heat energy from the data centre was cooled from the average exhaust (30 °C) to the average inlet temperature (20.5 °C) to be re-circulated back into the data centre. Using the heat exchanger, this energy was transferred to air from the external environment to produce the ideal conditions of a vertical farm. The ideal size of the vertical farm was determined by the amount of heat that could be transferred to supply external air with the conditions necessary for the vertical farm. The energy saving was calculated using the same means in Scenario 1. A summary of the main findings is presented in Table 20.
As in Scenario 1, the increased temperature of London caused the size of the vertical farms to be larger in London than in Ireland. However, the energy lost in the heat exchange system also caused the London vertical farms to be more efficient than Irish vertical farms in maintaining temperatures that are closer to the ambient conditions. A consequence of this is that the system would be able to incur greater energy savings, sustain more people, and have a greater benefit to the environment if constructed in London rather than Ireland.

4.4. Scenario Comparison

Both scenarios utilised the waste heat of the data centres to supplement the growth of plants in a vertical farm. However, each scenario needs to be compared further to distinguish which vertical farming system would better suit Irish data centres. The main difference between the two scenarios is that Scenario 1 mixes air from the external environment into the air of the data centre–vertical farm system while Scenario 2 contains all the air in the data centre and transfers its energy via a heat exchanger. Data centres are primarily designed to circulate air and transfer the waste heat through a heat exchanger in a closed system [80], similar to Scenario 2. However, the data have shown (Table 21) that a heat exchange system can drastically decrease the energy available to the vertical farm, reducing its potential size. This in turn would reduce the food production capacity and diminish the potential energy-savings that could be achieved, and hence reduce the cost savings and the carbon emission reductions of the system when compared to the results from Scenario 1.
Though the energy savings in Scenario 1 are greater, the introduction of air from the external environment poses a risk to data centres [85], and would likely require additional filtration steps [124] before the air can be passed back into the data centre. In order to determine which scenario is best suited to a particular data centre, there are many other factors to consider that could further influence the decision. If a data centre has no land area directly adjacent to the building, or the data centre is operating in strict sterile conditions, then the heat exchange system in Scenario 2 might be the better solution. If the data centre has ample space but its CRAH systems are at separate sides of the building, then the system in Scenario 1 might be the better solution as the vertical farm is more efficient; it can be easily split to two separate growing sites to fully utilise the waste heat, while some of this energy would be lost the transportation of this energy in Scenario 2.

4.5. Implications

The research has shown that the data centre market is growing rapidly [125], with three further data centres proposed in Ireland since writing this paper [113,114]. The research topic is popular: 383,308 papers were published in 2021, and 324,639 papers were published between January and August of 2022 relating to data centres [126]. Many of these papers are forced to make assumptions surrounding the energy use of data centres due to the secrecy regarding their energy usage or lack of reporting [14,109,112], causing the values produced in many of the papers surrounding data centres to have unknown margins of error. The ever-expanding data centre market and the lack of transparency surrounding the energy usage have hindered research and innovation in the area [127]. Even though some research has estimated energy use and carbon emissions [128], it is the author’s opinion that the problem cannot truly be tackled unless data centres are forced to become publicly researchable.
Data centres currently consume more than 3% of the global electricity supply, and are predicted to consume more than 20% by 2025 [9]. The associated carbon emissions are currently responsible for 3.7% of global emissions [129]. Without the implementation of energy-saving methods, this figure will also rise. Data centres’ high energy use and environmental impact continuously cause objections to their construction [113,130,131]. Many global companies, such as Amazon and Google, use carbon offsets to claim their companies are operating renewably [132]. However, the use of purchased carbon offsets is causing more environmental harm than good, resulting in more emissions being released [133]. There is a lack of accountability for bought carbon offsets, as many of the forests the companies selling carbon offsets claim to protect or plant were never at risk, or do not get planted [134]. The proposed methods in this paper would utilise the waste energy of the data centres to reduce their energy demand and provide emission reductions instead of carbon offset to reduce the company’s environmental impact, while tangibly benefitting the communities of the surrounding areas through accessibility to fresh produce. Increasing, the relationship with the communities surrounding the data centre would likely reduce the stigma associated with their construction and energy demand, provided there is transparency throughout the process [135]. Even if the relationship with the public did not improve, the public would still benefit from the nutritional value of the fresh produce [136], and the data centres would be truly dealing with their environmental impact.
Research has shown that vertical farms are more beneficial to the environment than traditional farming methods by reducing the area required for production [137], increasing yields of produce through efficient layouts that protect the crop from harsh environmental conditions [138], reducing water consumption [139], and optimising nutrient delivery [66]. Though the Irish climate is beneficial to cooling a data centre, it hinders the heating of a vertical farm due to the ever-increasing cost of energy [140,141]. The increased energy required to heat a vertical farm in Irish conditions could be a deterrent for the construction of commercial vertical farms in Ireland. Climate control is a vertical farm’s second highest energy demand after lighting [65]. Using the proposed models will require less electricity to control the facility’s climate and, hence, a further reduction in environmental impact of vertical farming versus traditional farming methods.
If all the data centres that have reported data in Ireland were to adopt the proposed method in Scenario 1, there would be enough food produced to feed 1966 adults daily, diverting 180 tonnes of CO2eq from Ireland’s annual emissions by the transport of this food alone. There would be up to 0.021 M tonnes of CO2eq from Ireland’s annual agricultural emissions, reducing the total annual agricultural emissions by 0.09%, contributing to 0.36% of Ireland’s 2030 agricultural emission reduction targets. Ireland’s agricultural emissions rose by 3% in 2021 versus 2020 [142]. If the Irish government, and the companies building data centres plan on taking their environmental commitments seriously [115,116,117], then resources must be allocated to further experiment in ways to increase the sustainability of Irish agriculture and reduce the environmental impact of data centres.
According to Ireland’s energy plan for data centres [143], the government has a preference for data centre developments: (1) that are associated with strong economic activity and employment; (2) that make efficient use of the national electricity grid, using available capacity and alleviating constraints; (3) that can demonstrate the additionality of their renewable energy use in Ireland; (4) that are in locations where there is the potential to co-locate a renewable generation facility or advanced storage along with the data centre, supported by a CPPA (corporate power purchase agreement), private wire or other arrangement; (5) that can demonstrate a clear pathway to decarbonise and ultimately provide net zero data services; (6) and that can provide opportunities for community engagement and assist SMEs, both at the construction phase and throughout the data centre lifecycle. The above methods would help data centres satisfy many of the government’s current requirements, particularly 1,3,4,5 & 6. Alternatively, the government could intervene to impose stricter policies on data centre energy consumption and usage while encouraging experimental and innovative solutions to assist with energy management.
This paper has shown the theoretical energy and environmental savings of using a data centre’s waste heat in a vertical farm, but the model must be tested in a real-life application to better quantify these savings. It is the author’s opinion that Ireland has the resources to design a hybrid vertical farm-data centre system. Designing such a system could help Ireland lead the way in creating a more environmentally friendly system that could be adopted in areas with energy and food insecurities.

4.6. Further Applications

This study serves as a proof-of-concept analysis that there can be energy savings for a vertical farm if it is built adjacent to a data centre. By integrating a vertical farm into a data centre as part of the initial planning process, further optimisations and energy-saving techniques could be implemented [144]. The load of a data centre directly influences the power consumption and hence the waste heat generated [145]. The heat energy from the servers with the highest energy demand could be diverted to a smaller vertical farm that produces crops that prefer a warmer climate, while the remaining waste heat energy is diverted to one or more vertical farms of different sizes operating at different temperatures. Similarly, the construction of a vertical farm could have a data centre built into the design to gain extra revenue and help with operating costs. According to Sajid et al. [146], by using block-chain decentralisation workload management for geographically distributed data centres to migrate the workload, there would be a minimum of 46% reduction in time. This would mean that smaller data centres could be located throughout the country to increase the data transfer speeds of the end user while supplementing the heating needs and profitability of a vertical farm.
The proposed systems could be applied to other industries that produce a constant or predictable supply of waste heat, such as the iron and steel industry, which produce waste heat from molten slag or exhaust gasses [147,148,149], or the petrochemical industry, which produces waste heat through flue gasses [150,151]. Though the waste heat from these sources is far greater than from a data centre, the energy could be stored and transferred to a vertical farm using the model described in Scenario 2. Some of the energy will be lost as the heat energy is transferred from the industrial site to the vertical farm. However, as long as the energy source is predictable and quantifiable, the ideal vertical farm size should be computable.
There could also be applications closer to the end user. Cruise ships are at sea for 7–10 days at a time [152] and are constantly preparing meals. Baldi et al. [153] determined that a waste heat recovery system could save approximately 22% of the energy on a cruise ship. However, the energy demand varies seasonally (more energy is used in winter) and, depending on the ship’s speed, some of the waste heat energy could be diverted to a vertical farm to provide fresh produce for passengers at sea. There has been more recent research into heat recovery methods of cargo ships than cruise ships [154,155], but many of the heat sources are very similar. For cargo ships, the cargo being carried is likely to be more economical than vertical farming; however, there could be a small vertical farm to provide some fresh produce for the workers, as these ships are at sea for an average of 40–50 days at a time [156].
Many buildings produce waste heat, such as hotels that need to have a readily available supply of hot water and have the rooms and public spaces at comfortable temperatures [157], or large kitchens and food production sites that would be producing waste heat from cooking [158,159]. These sources may not produce much waste heat when compared to the petrochemical industry or a constant and predictable heat supply like a data centre; however, these businesses focus on feeding fresh food to their patrons, and the novelty of producing their own ingredients on site could create a symbiotic relationship between the vertical farming business and the catering business supplying the waste heat and using the produce [160].

4.7. Limitations

One of the major limitations of this research is the lack of available and reliable data. Less than half of Irish data centres reported enough data to be included in the study. Therefore, the paper could not fully assess all data centres in Ireland. Though there was unknown reliability surrounding this data, the values were used in calculations due to a lack of alternatives. The energy demands of a data centre change due to weather variations [161], the load of a data centre [145], or the time of day [162]. The operating temperature, and hence the available waste energy, would constantly fluctuate. However, there was insufficient data to perform the calculations required to factor in these energy changes in Ireland.
The paper only considered the environmental impacts of electric energy and transport for calculations. Other factors that could have environmental implications were not considered. There would be carbon emissions in both scenarios due to the construction of the vertical farms [163] and the food waste that may incur post-harvest [164]. In Scenario 1, the system uses air from the external environment, which would need a filtration step before being circulated back into the data centre [165]. The filters used cannot be recycled and must be disposed of in landfill [166]. In Scenario 2, the volume of water being pumped would change depending on the size of the data centre and vertical farm. The volume of water that the system needs to pump directly affects the energy demand of the heat exchanger [167]; however, the energy of the pump was not considered in the calculations.
The energy loss of the heat exchanger in Scenario 2 was assumed to have a constant value of 45% based on the literature [9]. The distance between the vertical farm and the data centre greatly influences this figure. If the data centre was built closer to the vertical farm, the transferrable energy would likely be greater [168], increasing the possible size of the vertical farm to utilise this extra energy. All the estimates used were conservative in lieu of real-life data. If the research were conducted using more accurate data from an operational data centre, it would likely yield higher energy transfer values.
Though London’s data centres were considered and yielded positive results for utilising the waste heat of a data centre in a vertical farm in both scenarios, the increased energy consumption of the cooling system of London-based data centres and their environmental impact were not considered in this study. The primary focus of the work undertaken was to assess the viability of the systems in Irish data centres and countries with similar climates. Though the system may be applied in other regions, the application of this research will require an examination of each data centre on a case-by-case basis to maximise the size of the vertical farm that can be built and to maximise the subsequent energy savings and reduction in carbon emissions.
The vertical farm was assumed to operate at a constant temperature. However, the temperature requirements of plants can change throughout the day and night cycles, with a 5–15 °C difference between the ideal day and night conditions [169]. Plants require more heat during the daytime, and data centres are at their highest load, creating the greatest amount of waste heat during the daytime, and in the summer [170]. However, to use these calculations with the information available from Irish data centres, the already sparce data on Irish data centres would have to be extrapolated to accommodate the temperature ranges, exaggerating any errors in accuracy. A full year of the hourly temperature variations of a data centre would have to be compared to the energy readings of that data centre, ideally monitored at multiple points, to confidently perform these calculations, which was deemed beyond the scope of this study.

4.8. Recommendations

Further research is required to determine the daily variations in the temperature and energy use of a data centre in Ireland to design a heat transfer system that can more efficiently fulfil the varying climate needs of a vertical farm. Access to more data will enable more accurate calculations of the ideal size of a vertical farm that can be built onto a particular data centre. It will also help in choosing the most efficient and economical heat transfer methods to accommodate the current waste heat management system.
This paper has demonstrated proof of concept that a data centre currently operating in Ireland could retrofit one of its facilities to accommodate a vertical farming system and provide data to benefit further research and optimisation of the system. There are currently data centres in development in Ireland, and integrating a vertical farm into the waste heat management system could easily be tested on a small scale to provide staff lunches or as office decoration. Without test building a hybrid data centre–vertical farm system, the research can only go so far as to determine the possible energy savings.

5. Conclusions

The aim of this study was to assess the feasibility of incorporating a vertical farm into a data centre’s air conditioning system and to quantify any potential reduction in both energy consumption and CO2eq emissions. Through a thorough review of the literature and quantitative analysis of the available data on Irish data centres, this research concluded that all the data centres in Ireland produce waste heat that can be recovered for use in a vertical farm system. The use of this heat energy was found to decrease the energy demand of the air control systems in vertical farms. For each Irish data centre, a range of energy and carbon emission savings were quantified in both scenarios.
Scenario analysis concluded that the heat transfer method (one with heat loss using a heat exchanger and the other without any heat loss), along with the ambient climate conditions, can impact the amount of waste heat that can be recovered, affecting the size of the vertical farm that it is possible to build. By comparing the two systems, we can see that the average sizes of vertical farms that an Irish data centre can support through waste heat recovery methods are between 940–4100 m2, with larger data centres being able to accommodate larger vertical farms (4282–18,668 m2). In both systems analysed, the size of vertical farms directly related to the energy savings that could be made (average 55–240 kW), with larger vertical farms saving up to 1.1 MW of energy when fully utilising the waste heat energy of a large data centre.
The potential carbon reduction of the system was analysed with respect to the electricity savings incurred versus a stand-alone vertical farm and the fuel saved in the transportation of the produce versus importation in both scenarios. By introducing food production closer to cities, it was found that there were average savings of 1.3–5.6 tonnes CO2eq/annum per vertical farm from the transport of produce alone. This, however, was dwarfed by the average vertical farm’s potential reduction in carbon emissions based on the electricity savings in each scenario, 151–661 tonnes CO2eq/annum. This paper has concluded that there can be substantial carbon reductions by recovering the waste heat of a data centre for use in a vertical farm.
Though the Irish climate benefits the cooling of a data centre, the air is too cold to be used directly in a vertical farm and must be heated to accommodate the plant’s needs. The vertical farms in the proposed system could each feed an average of 14–61 people their daily calories and provide 13–58 people their daily portions of fruit and vegetables without any source of heating other than the data centre. The guaranteed energy supply from the data centre would relieve some of the financial burdens of operation, increasing their size, yield, profitability, and likelihood of introduction in Ireland. Vertical farms are not used much in Ireland, but their introduction would increase Irish food security and benefit the health of the local communities. This paper has concluded that using waste heat from data centres to supplement the energy needs of a vertical farm is feasible and would be socially, economically, and environmentally beneficial to Ireland.

Supplementary Materials

The following supporting information can be downloaded at: https://0-www-mdpi-com.brum.beds.ac.uk/article/10.3390/en16186704/s1, Table S1: List of Irish data centres calculated mass flow rate of circulating air, the resulting volumetric flow rate of air available to a vertical farm at ideal temperatures, and the ideal size of the vertical farm depending on this flow rate; Table S2: List of London data centres calculated mass flow rate of circulating air, the resulting volumetric flow rate of air available to a vertical farm at ideal temperatures, and the ideal size of the vertical farm depending on this flow rate; Table S3: Irish [left] and London [right] based data centres’ potential cooling effect of transpiration, and heating effect of the electronics of vertical farm contributing a net negative amount of energy, cooling the vertical farm to 15.19 °C; Table S4: Scenario 2 data for Irish data centres to predict ideal size of vertical farm; Table S5: Scenario 2 data for London data centres to predict ideal size of vertical farm; Table S6: The number of calories and portions of fruit or vegetables a vertical farm can provide compared to the same land area using traditional farming methods for Irish data centres in Scenario 1; Table S7: The number of calories and portions of fruit or vegetables a vertical farm can provide compared to the same land area using traditional farming methods for London data centres in Scenario 1; Table S8: The number of calories and portions of fruit or vegetables a vertical farm can provide compared to the same land area using traditional farming methods for Irish data centres in Scenario 2; Table S9: The number of calories and portions of fruit or vegetables a vertical farm can provide compared to the same land area using traditional farming methods for London data centres in Scenario 2.

Author Contributions

Writing—original draft, P.L.B.; Supervision, K.M. and M.H. All authors have read and agreed to the published version of the manuscript.

Funding

This research received no external funding.

Data Availability Statement

No new data were created or analyzed in this study. Data sharing is not applicable to this article.

Conflicts of Interest

The authors declare no conflict of interest.

References

  1. Thornton, G. A Study of the Economic Benefits of Cata Centre Investment in Ireland. Available online: https://www.idaireland.com/newsroom/publications/ida-ireland-economic-benefits-of-data-centre-inves (accessed on 30 January 2022).
  2. Bilal, K.; Khalid, O.; Erbad, A.; Khan, S.U. Potentials, trends, and prospects in edge technologies: Fog, cloudlet, mobile edge, and micro data centers. Comput. Netw. 2018, 130, 94–120. [Google Scholar] [CrossRef]
  3. Chen, X.; Jiang, S.; Chen, Y.; Zou, Z.; Shen, B.; Lei, Y.; Zhang, D.; Zhang, M.; Gou, H. Energy-saving superconducting power delivery from renewable energy source to a 100-MW-class data center. Appl. Energy 2022, 310, 118602. [Google Scholar] [CrossRef]
  4. Kastanaki, E.; Giannis, A. Forecasting quantities of critical raw materials in obsolete feature and smart phones in Greece: A path to circular economy. J. Environ. Manag. 2022, 307, 114566. [Google Scholar] [CrossRef] [PubMed]
  5. Teng, C.-I.; Shiau, W.-L.; Cheng, T.C.E.; Huang, H.-Y. Drawing goals nearer: Using the goal-gradient perspective to increase online game usage. Int. J. Inf. Manag. 2022, 66, 102522. [Google Scholar] [CrossRef]
  6. Wongkitrungrueng, A.; Assarut, N. The role of live streaming in building consumer trust and engagement with social commerce sellers. J. Bus. Res. 2020, 117, 543–556. [Google Scholar] [CrossRef]
  7. Baig, E. Faster download speeds coming soon: New 5G promises to be like having a fiber- optic device ‘in your pocket anywhere you go’. USA Today, 2017. Available online: https://eu.usatoday.com/story/tech/columnist/baig/2018/02/28/5-g-hype-hot-but-get-ready-wait/380558002/(accessed on 12 March 2022).
  8. Cao, J.; Yu, P.; Ma, M.; Gao, W. Fast Authentication and Data Transfer Scheme for Massive NB-IoT Devices in 3GPP 5G Network. IEEE Internet Things J. 2019, 6, 1561–1575. [Google Scholar] [CrossRef]
  9. Huang, P.; Copertaro, B.; Zhang, X.; Shen, J.; Löfgren, I.; Rönnelid, M.; Fahlen, J.; Andersson, D.; Svanfeldt, M. A review of data centers as prosumers in district energy systems: Renewable energy integration and waste heat reuse for district heating. Appl. Energy 2020, 258, 114109. [Google Scholar] [CrossRef]
  10. Karimi, L.; Yacuel, L.; Johnson, J.D.; Ashby, J.; Green, M.; Renner, M.; Bergman, A.; Norwood, R.; Hickenbottom, K.L. Water-energy tradeoffs in data centers: A case study in hot-arid climates. Resour. Conserv. Recycl. 2022, 181, 106194. [Google Scholar] [CrossRef]
  11. Luo, Y.; Andresen, J.; Clarke, H.; Rajendra, M.; Maroto-Valer, M. A framework for waste heat energy recovery within data centre. Energy Procedia 2019, 158, 3788–3794. [Google Scholar] [CrossRef]
  12. Masanet, E.; Lei, N. How Much Energy Do Data Centres Really Use? Available online: https://energyinnovation.org/2020/03/17/how-much-energy-do-data-centers-really-use/ (accessed on 30 January 2022).
  13. Mulvaney, K. The world is Still Falling Short of Meeting its Climate Goals. Available online: https://www.nationalgeographic.com/environment/article/the-world-is-still-falling-short-of-meeting-its-climate-goals (accessed on 26 July 2022).
  14. Mytton, D. Data centre water consumption. NPJ Clean Water 2021, 4, 11. [Google Scholar] [CrossRef]
  15. Google. Google Environmental Report 2019. 2019. Available online: https://sustainability.google/reports/environmental-report-2019/#data-centers (accessed on 25 February 2022).
  16. Google. Google Environmental Report 2022. 2022. Available online: https://sustainability.google/reports/google-2022-climate-action-progress-update (accessed on 28 January 2022).
  17. Microsoft. 2021 Environmental Sustainability Report. 2022. Available online: https://query.prod.cms.rt.microsoft.com/cms/api/am/binary/RW15mgm (accessed on 28 January 2022).
  18. Short, E. Data Centre Energy Use in Ireland Increased 32% Last Year. Available online: https://www.businesspost.ie/news/data-centre-energy-use-in-ireland-increased-32-last-year/ (accessed on 26 July 2022).
  19. Healy, C. ‘We Have to Think Hard about Prioritisation’: The Environmental Impact of Ireland’s Data Centres. Available online: https://www.thejournal.ie/data-centres-2-5693974-Feb2022/?utm_source=email (accessed on 8 March 2022).
  20. Boland, L. Data Centres’ Electricity Consumption Has More than Doubled Since 2015. Available online: https://www.thejournal.ie/data-centres-electricity-use-5659789-Jan2022/?utm_source=email (accessed on 29 January 2022).
  21. CSO. Data Centres Metered Electricity Consumption 2020. Available online: https://www.cso.ie/en/releasesandpublications/ep/p-dcmec/datacentresmeteredelectricityconsumption2020/keyfindings/ (accessed on 29 January 2022).
  22. Eirgrid. All-Island Generation Capacity Statement. Available online: https://www.eirgridgroup.com/site-files/library/EirGrid/EirGrid-Group-All-Island-Generation-Capacity-Statement-2019-2028.pdf (accessed on 8 March 2022).
  23. SEAL. Renewable Energy Targets. Available online: https://www.seai.ie/data-and-insights/seai-statistics/key-statistics/renewables/ (accessed on 30 January 2022).
  24. ElectricIreland. Electric Ireland Fuel Mix Disclosure Label. 2020. Available online: https://www.electricireland.ie/residential/help/billing/fuel-mix-disclosure (accessed on 29 January 2022).
  25. Oireachtas. Committee of Public Accounts (PAC) Criticises State’s Failure to Meet Greenhouse Gas Emissions and Renewable Energy Targets at Cost of €50m to Taxpayer in 2020. 2022. Available online: https://www.oireachtas.ie/en/press-centre/press-releases/20220405-committee-of-public-accounts-pac-criticises-state-s-failure-to-meet-greenhouse-gas-emissions-and-renewable-energy-targets-at-cost-of-50m-to-taxpayer-in-2020/ (accessed on 8 March 2022).
  26. EPA. Ireland Will not Meet its 2020 Greenhouse Gas Emissions Reduction Targets. Action is Needed Now to Meet 2030 EU Targets. 2021. Available online: https://www.epa.ie/news-releases/news-releases-2021/ireland-will-not-meet-its-2020-greenhouse-gas-emissions-reduction-targets-action-is-needed-now-to-meet-2030-eu-targets.php (accessed on 8 March 2022).
  27. O’Sullivan, K. Q&A: Why is Ireland failing to meet its environmental targets? The Irish Times, 2019. Available online: https://www.irishtimes.com/news/environment/q-a-why-is-ireland-failing-to-meet-its-environmental-targets-1.4062886(accessed on 3 January 2022).
  28. O’Sullivan, K. Number of operational data centres in Ireland up by quarter, report finds. The Irish Times, 2021. Available online: https://www.irishtimes.com/business/energy-and-resources/number-of-operational-data-centres-in-ireland-up-by-quarter-report-finds-1.4562274(accessed on 3 January 2022).
  29. IEA. Electricity Market Report—January 2022. 2022. Available online: https://www.iea.org/reports/electricity-market-report-january-2022 (accessed on 3 March 2022).
  30. Lo, G.D.; Marcelin, I.; Bassène, T.; Sène, B. The Russo-Ukrainian war and financial markets: The role of dependence on Russian commodities. Financ. Res. Lett. 2022, 50, 103194. [Google Scholar] [CrossRef]
  31. Alsaleh, M.; Abdul-Rahim, A.S.; Abdulwakil, M.M. The importance of worldwide governance indicators for transitions toward sustainable bioenergy industry. J. Environ. Manag. 2021, 294, 112960. [Google Scholar] [CrossRef] [PubMed]
  32. Kpodar, K.; Liu, B. The distributional implications of the impact of fuel price increases on inflation. Energy Econ. 2022, 108, 105909. [Google Scholar] [CrossRef]
  33. Hegarty, S. How Can Ukraine Export Its Harvest to the World? 2022. Available online: https://www.bbc.com/news/world-europe-61583492 (accessed on 4 June 2022).
  34. FAO. Global Report on Food Crises: Acute Food Insecurity Hits New Highs. 2022. Available online: https://reliefweb.int/report/world/global-report-food-crises-acute-food-insecurity-hits-new-highs-enarruzh?gclid=EAIaIQobChMIke_9noaugQMVENEWBR1eYAgTEAAYASAAEgKz5_D_BwE (accessed on 2 July 2022).
  35. Mehrabi, Z.; Delzeit, R.; Ignaciuk, A.; Levers, C.; Braich, G.; Bajaj, K.; Amo-Aidoo, A.; Anderson, W.; Balgah, R.A.; Benton, T.G.; et al. Research priorities for global food security under extreme events. One Earth 2022, 5, 756–766. [Google Scholar] [CrossRef]
  36. FAO. Land Use in Agriculture by the Numbers. Available online: https://www.fao.org/sustainability/news/detail/en/c/1274219/ (accessed on 26 July 2022).
  37. FSAI. Healthy Eating Guidelines to Improve Nations Diet. Available online: https://www.fsai.ie/news_centre/press_releases/healthy_eating_guidelines_28012019.html (accessed on 26 July 2022).
  38. Smith, N.W.; Fletcher, A.J.; Hill, J.P.; McCabb, W.C. Modeling the Contribution of Meat to Global Nutrient Availability. Front. Nutr. 2022, 9, 766796. [Google Scholar] [CrossRef]
  39. Ritchie, H.; Roser, M. Environmental Impacts of Food Production. 2021. Available online: https://ourworldindata.org/environmental-impacts-of-food (accessed on 2 July 2022).
  40. Abbade, E.B. Estimating the nutritional loss and the feeding potential derived from food losses worldwide. World Dev. 2020, 134, 105038. [Google Scholar] [CrossRef]
  41. Ananda, J.; Gayana Karunasena, G.; Pearson, D. Identifying interventions to reduce household food waste based on food categories. Food Policy 2022, 111, 102324. [Google Scholar] [CrossRef]
  42. Almena, A.; Fryer, P.J.; Bakalis, S.; Lopez-Quiroga, E. Centralized and distributed food manufacture: A modeling platform for technological, environmental and economic assessment at different production scales. Sustain. Prod. Consum. 2019, 19, 181–193. [Google Scholar] [CrossRef]
  43. Trienekens, J.H.; van der Vorst, J.G.A.J.; Verdouw, C.N. Global Food Supply Chains. In Encyclopedia of Agriculture and Food Systems; Van Alfen, N.K., Ed.; Academic Press: Oxford, UK, 2014; pp. 499–517. [Google Scholar]
  44. Russon, M.-A. The Cost of the Suez Canal Blockage. Available online: https://www.bbc.com/news/business-56559073 (accessed on 27 July 2022).
  45. Murray, B.; Koh, A.; Varley, K. Global Supply Chain Crisis Flares Up Again Where It All Began. Available online: https://www.bloomberg.com/news/features/2022-04-25/china-s-covid-crisis-threatens-global-supply-chain-chaos-for-summer-2022 (accessed on 4 August 2022).
  46. Garnett, P.; Doherty, B.; Heron, T. Vulnerability of the United Kingdom’s food supply chains exposed by COVID-19. Nature Food 2020, 1, 315–318. [Google Scholar] [CrossRef]
  47. Garbelini, L.G.; Debiasi, H.; Junior, A.A.B.; Franchini, J.C.; Coelho, A.E.; Telles, T.S. Diversified crop rotations increase the yield and economic efficiency of grain production systems. Eur. J. Agron. 2022, 137, 126528. [Google Scholar] [CrossRef]
  48. Damerum, A.; Chapman, M.A.; Taylor, G. Innovative breeding technologies in lettuce for improved post-harvest quality. Postharvest Biol. Technol. 2020, 168, 111266. [Google Scholar] [CrossRef] [PubMed]
  49. Caira, S.; Ferranti, P. Innovation for Sustainable Agriculture and Food Production. In Reference Module in Food Science; Elsevier: Amsterdam, The Netherlands, 2023. [Google Scholar]
  50. Carpena, F. How do droughts impact household food consumption and nutritional intake? A study of rural India. World Dev. 2019, 122, 349–369. [Google Scholar] [CrossRef]
  51. Kogan, F.; Guo, W.; Yang, W. Drought and food security prediction from NOAA new generation of operational satellites. Geomat. Nat. Hazards Risk 2019, 10, 651–666. [Google Scholar] [CrossRef]
  52. Zhang, Q.; Men, X.; Hui, C.; Ge, F.; Ouyang, F. Wheat yield losses from pests and pathogens in China. Agric. Ecosyst. Environ. 2022, 326, 107821. [Google Scholar] [CrossRef]
  53. Tonnang, H.E.Z.; Sokame, B.M.; Abdel-Rahman, E.M.; Dubois, T. Measuring and modelling crop yield losses due to invasive insect pests under climate change. Curr. Opin. Insect Sci. 2022, 50, 100873. [Google Scholar] [CrossRef] [PubMed]
  54. Coucke, N.; Vermeir, I.; Slabbinck, H.; Geuens, M.; Choueiki, Z. How to reduce agri-environmental impacts on ecosystem services: The role of nudging techniques to increase purchase of plant-based meat substitutes. Ecosyst. Serv. 2022, 56, 101444. [Google Scholar] [CrossRef]
  55. Weinrich, R.; Busch, G. Consumer knowledge about protein sources and consumers’ openness to feeding micro-algae and insects to pigs and poultry. Future Foods 2021, 4, 100100. [Google Scholar] [CrossRef]
  56. Fahad, S.; Saud, S.; Akhter, A.; Bajwa, A.A.; Hassan, S.; Battaglia, M.; Adnan, M.; Wahid, F.; Datta, R.; Babur, E.; et al. Bio-based integrated pest management in rice: An agro-ecosystems friendly approach for agricultural sustainability. J. Saudi Soc. Agric. Sci. 2021, 20, 94–102. [Google Scholar] [CrossRef]
  57. Vangorp, K. Vertical Farming Gaining Popularity among Traditional Growers. Available online: https://www.hortidaily.com/article/9308753/vertical-farming-gaining-popularity-among-traditional-growers/ (accessed on 27 July 2022).
  58. Shahbandeh, M. Global Vertical Farming Market Projection 2019 & 2025. 2022. Available online: https://www.globenewswire.com/news-release/2019/04/24/1808562/0/en/Global-Vertical-Farming-Market-Outlook-2019-2025-BrightFarms-Everlight-Electronics-and-Green-Sense-Farms-are-the-Key-Players.html (accessed on 4 August 2022).
  59. Hall, C. Crop One, Emirate Open ‘World’s Largest Vertical Farm’ in Dubai. Available online: https://techcrunch.com/2022/07/19/crop-one-emirate-worlds-largest-vertical-farm-in-dubai/?guccounter=1&guce_referrer=aHR0cHM6Ly93d3cuZ29vZ2xlLmNvbS8&guce_referrer_sig=AQAAAI_R6DGpihYDG9N5-D_YPfUVfUhE1scF5vRjQq14IKKXK6Fb76bLJS1_thV32e2rA0bjDJRQ4WF5a_gFI9ovHn-2jfW3C9qeJ0DwD5LNBb2QiLNX_U553Rzt26drr92jy4hib1x-fI-jqakeZSnXvs6Myee3Ccxufyiu4KpxHwWC (accessed on 4 August 2022).
  60. Gumisiriza, M.S.; Ndakidemi, P.; Nalunga, A.; Mbega, E.R. Building sustainable societies through vertical soilless farming: A cost-effectiveness analysis on a small-scale non-greenhouse hydroponic system. Sustain. Cities Soc. 2022, 83, 103923. [Google Scholar] [CrossRef]
  61. Wang, L.; Iddio, E. Energy performance evaluation and modeling for an indoor farming facility. Sustain. Energy Technol. Assess. 2022, 52, 102240. [Google Scholar] [CrossRef]
  62. Yap, L. Converting Urban Areas into Indoor Pesticide-Free Farms for Year-Round Food. Available online: https://www.azocleantech.com/article.aspx?ArticleID=1275 (accessed on 27 July 2022).
  63. Delorme, M.; Santini, A. Energy-efficient automated vertical farms. Omega 2022, 109, 102611. [Google Scholar] [CrossRef]
  64. McDonald, J. Vertical Farms Have the Vision, but Do They Have the Energy? Available online: https://www.emergingtechbrew.com/stories/2022/04/21/vertical-farms-have-the-vision-but-do-they-have-the-energy (accessed on 27 July 2022).
  65. iFarm. How Much Electricity Does a Vertical Farm Use. Available online: https://ifarm.fi/blog/2020/12/how-much-electricity-does-a-vertical-farm-consume (accessed on 4 August 2022).
  66. Haitsma Mulier, M.C.G.; Van de Ven, F.H.M.; Kirshen, P. Quantification of the local water energy nutrient food nexus for three urban farms in Amsterdam & Boston. Energy Nexus 2022, 6, 100078. [Google Scholar] [CrossRef]
  67. MET. Monthly Data—Dublin Airport; Phoenix Park; Casement Aerodrome. Available online: https://www.met.ie/climate/available-data/monthly-data (accessed on 28 July 2022).
  68. Keena, C. Usage could outpace grid’s capacity to generate more electricity, report likely to say. The Irish Times, 2021. Available online: https://www.irishtimes.com/news/ireland/irish-news/warning-on-data-centres-increasing-energy-consumption-expected-in-report-1.4684190(accessed on 6 October 2021).
  69. Chen, X.; Pan, M.; Li, X.; Zhang, K. Multi-mode operation and thermo-economic analyses of combined cooling and power systems for recovering waste heat from data centers. Energy Convers. Manag. 2022, 266, 115820. [Google Scholar] [CrossRef]
  70. Li, J.; Yang, Z.; Li, H.; Hu, S.; Duan, Y.; Yan, J. Optimal schemes and benefits of recovering waste heat from data center for district heating by CO2 transcritical heat pumps. Energy Convers. Manag. 2021, 245, 114591. [Google Scholar] [CrossRef]
  71. Yamaura, H.; Kanno, K.; Takano, N.; Isozaki, M.; Iwasaki, Y. Supra-optimal daily mean temperature stimulates plant growth and carbohydrate use in tomato. Sci. Hortic. 2021, 276, 109780. [Google Scholar] [CrossRef]
  72. Ras, M.; Steyer, J.-P.; Bernard, O. Temperature effect on microalgae: A crucial factor for outdoor production. Rev. Environ. Sci. Bio/Technol. 2013, 12, 153–164. [Google Scholar] [CrossRef]
  73. Baxtel. Republic of Ireland Data Centre Market. Available online: https://baxtel.com/data-center/republic-of-ireland (accessed on 13 April 2022).
  74. DataCenters. Ireland Data Centre Market. Available online: https://www.datacenters.com/locations/ireland (accessed on 31 July 2022).
  75. DataCenters. London Data Centre Market. Available online: https://www.datacenters.com/locations?page=2&per_page=40&query=&withProducts=false&showHidden=false&nearby=false&cities%5B%5D%5Bcity%5D=London&cities%5B%5D%5Bstate%5D=England&cities%5B%5D%5Bcountry%5D=United%20Kingdom&radius=0&bounds=&circleBounds=&polygonPath= (accessed on 5 April 2022).
  76. MET. Irish Meteorological Service: Dublin Airport 1981–2010 Averages. Available online: https://www.met.ie/climate-ireland/1981-2010/dublin.html (accessed on 1 April 2022).
  77. Emeraldgreens. Emerald Greens to Increase Capacity by 20% in New Deal. 2021. Available online: https://www.irishtimes.com/business/agribusiness-and-food/emerald-greens-to-increase-capacity-by-20-in-new-deal-1.4697082 (accessed on 3 February 2022).
  78. EPA. EPA data shows Ireland’s 2021 Greenhouse Gas Emissions above pre-COVID levels. Annual, 2022. Available online: https://www.epa.ie/news-releases/news-releases-2022/epa-data-shows-irelands-2021-greenhouse-gas-emissions-above-pre-covid-levels.php(accessed on 5 July 2022).
  79. METUK. Met Office UK: Greenwich Park Average Graphs. Available online: https://www.metoffice.gov.uk/research/climate/maps-and-data/uk-climate-averages/u10hb54gm (accessed on 5 August 2022).
  80. Wang, X.; Wen, Q.; Yang, J.; Xiang, J.; Wang, Z.; Weng, C.; Chen, F.; Zheng, S. A review on data centre cooling system using heat pipe technology. Sustain. Comput. Inform. Syst. 2022, 35, 100774. [Google Scholar] [CrossRef]
  81. Luo, Y.; Andresen, J.; Clarke, H.; Rajendra, M.; Maroto-Valer, M. A decision support system for waste heat recovery and energy efficiency improvement in data centres. Appl. Energy 2019, 250, 1217–1224. [Google Scholar] [CrossRef]
  82. Pambudi, N.A.; Sarifudin, A.; Firdaus, R.A.; Ulfa, D.K.; Gandidi, I.M.; Romadhon, R. The immersion cooling technology: Current and future development in energy saving. Alex. Eng. J. 2022, 61, 9509–9527. [Google Scholar] [CrossRef]
  83. Cen, J.; Li, Z.; Wang, Y.; Jiang, F.; Liao, S.; Liang, F. Heat Pump-Based Novel Energy System for High-Power LED Lamp Cooling and Waste Heat Recovery; Intechopen: London, UK, 2018. [Google Scholar]
  84. Engler, N.; Krarti, M. Review of energy efficiency in controlled environment agriculture. Renew. Sustain. Energy Rev. 2021, 141, 110786. [Google Scholar] [CrossRef]
  85. Chu, J.; Huang, X. Research status and development trends of evaporative cooling air-conditioning technology in data centers. Energy Built Environ. 2021, 4, 86–110. [Google Scholar] [CrossRef]
  86. Zhu, Y.; Cheng, Z.; Feng, K.; Chen, Z.; Cao, C.; Huang, J.; Ye, H.; Gao, Y. Influencing factors for transpiration rate: A numerical simulation of an individual leaf system. Therm. Sci. Eng. Prog. 2022, 27, 101110. [Google Scholar] [CrossRef]
  87. Zhang, C.; Luo, H.; Wang, Z. An economic analysis of waste heat recovery and utilization in data centers considering environmental benefits. Sustain. Prod. Consum. 2022, 31, 127–138. [Google Scholar] [CrossRef]
  88. Adenaeuer, L. Up, Up and Away! The Economics of Vertical Farming. J. Agric. Stud. 2014, 2, 40–60. [Google Scholar] [CrossRef]
  89. ElectricIreland. Electricity Prices. Available online: https://www.electricireland.ie/switch/new-customer/price-plans?priceType=E (accessed on 16 August 2022).
  90. Tandon, A. ‘Food Miles’ Have Larger Climate Impact than Thought, Study Suggests. Available online: https://www.carbonbrief.org/food-miles-have-larger-climate-impact-than-thought-study-suggests/ (accessed on 18 August 2022).
  91. Statista. Emission Factors for Transporting Food Worldwide as of 2018, by Selected Modes of Transport. Available online: https://0-www-statista-com.brum.beds.ac.uk/statistics/1253773/food-freight-transport-emission-factors-by-mode/ (accessed on 8 August 2022).
  92. ASHRAE. 2021 Equipment Thermal Guidelines for Data Processing Environments. In Thermal Guidelines for Data Processing Environments, 5th ed.; ASHRAE: Peachtree Corners, GA, USA, 2021; Available online: https://www.ashrae.org/File%20Library/Technical%20Resources/Bookstore/Supplemental%20Files/ReferenceCard_2021ThermalGuidelines.pdf (accessed on 30 November 2022).
  93. Barickman, T.C.; Olorunwa, O.J.; Sehgal, A.; Walne, C.H.; Reddy, K.R.; Gao, W. Yield, Physiological Performance, and Phytochemistry of Basil (Ocimum basilicum L.) under Temperature Stress and Elevated CO2 Concentrations. Plants 2021, 10, 1072. [Google Scholar] [CrossRef]
  94. He, Z.; Su, C.; Cai, Z.; Wang, Z.; Li, R.; Liu, J.; He, J.; Zhang, Z. Multi-factor coupling regulation of greenhouse environment based on comprehensive growth of cherry tomato seedlings. Sci. Hortic. 2022, 297, 110960. [Google Scholar] [CrossRef]
  95. Johnson, A.J.; Meyerson, E.; de la Parra, J.; Savas, T.L.; Miikkulainen, R.; Harper, C.B. Flavor-cyber-agriculture: Optimization of plant metabolites in an open-source control environment through surrogate modeling. PLoS ONE 2019, 14, e0213918. [Google Scholar] [CrossRef]
  96. Walters, K.J.; Lopez, R.G. Modeling growth and development of hydroponically grown dill, parsley, and watercress in response to photosynthetic daily light integral and mean daily temperature. PLoS ONE 2021, 16, e0248662. [Google Scholar] [CrossRef]
  97. Yamori, N.; Levine, C.P.; Mattson, N.S.; Yamori, W. Optimum root zone temperature of photosynthesis and plant growth depends on air temperature in lettuce plants. Plant Mol. Biol. 2022, 16, e0248662. [Google Scholar] [CrossRef]
  98. Xu, J.; Henry, A.; Sreenivasulu, N. Rice yield formation under high day and night temperatures—A prerequisite to ensure future food security. Plant Cell Environ. 2020, 43, 1595–1608. [Google Scholar] [CrossRef]
  99. Rai, S.K.; Ghosh, P.K.; Kumar, S.; Singh, J.B. Research in Agrometeorolgy on Fodder Crops in Central India—An Overview. Atmos. Clim. Sci. 2014, 4, 1595–1608. [Google Scholar] [CrossRef]
  100. Khammayom, N.; Maruyama, N.; Chaichana, C.; Hirota, M. Impact of environmental factors on energy balance of greenhouse for strawberry cultivation. Case Stud. Therm. Eng. 2022, 33, 101945. [Google Scholar] [CrossRef]
  101. Kuzay, M.; Dogan, A.; Yilmaz, S.; Herkiloglu, O.; Atalay, A.S.; Cemberci, A.; Yilmaz, C.; Demirel, E. Retrofitting of an air-cooled data center for energy efficiency. Case Stud. Therm. Eng. 2022, 36, 102228. [Google Scholar] [CrossRef]
  102. Ham, S.-W.; Park, J.-S.; Jeong, J.-W. Optimum supply air temperature ranges of various air-side economizers in a modular data center. Appl. Therm. Eng. 2015, 77, 163–179. [Google Scholar] [CrossRef]
  103. Cho, J.; Park, B.; Jeong, Y. Thermal Performance Evaluation of a Data Center Cooling System under Fault Conditions. Energies 2019, 12, 2996. [Google Scholar] [CrossRef]
  104. Naranjani, B.; Najafianashrafi, Z.; Pascual, C.; Agulto, I.; Chuang, P.-Y.A. Computational analysis of the environment in an indoor vertical farming system. Int. J. Heat Mass Transf. 2022, 186, 122460. [Google Scholar] [CrossRef]
  105. Callahan, C.W.; Elansari, A.M.; Fenton, D.L. Chapter 8—Psychrometrics. In Postharvest Technology of Perishable Horticultural Commodities, Yahia, E.M., Ed.; Woodhead Publishing: Sawston, UK, 2019; pp. 271–310. [Google Scholar]
  106. Qingjuan, Y.; Wanyi, S.; Ziqi, L. A microclimate model for plant transpiration effects. Urban Clim. 2022, 45, 101240. [Google Scholar] [CrossRef]
  107. CSO. Ireland’s Trade in Goods 2020. Available online: https://www.cso.ie/en/releasesandpublications/ep/p-ti/irelandstradeingoods2020/food/ (accessed on 8 August 2022).
  108. Whitehead, B.; Andrews, D.; Shah, A. The life cycle assessment of a UK data centre. Int. J. Life Cycle Assess. 2015, 20, 332–349. [Google Scholar] [CrossRef]
  109. Zhou, F.; Shen, C.; Ma, G.; Yan, X. Power usage effectiveness analysis of a liquid-pump-driven hybrid cooling system for data centers in subclimate zones. Sustain. Energy Technol. Assess. 2022, 52, 102277. [Google Scholar] [CrossRef]
  110. Coyne, B.; Denny, E. An Economic Evaluation of Future Electricity Uses in Irish Data Centres. Available online: https://www.econstor.eu/bitstream/10419/226784/1/TRiSS-WPS-2018-02.pdf (accessed on 18 August 2022).
  111. Gibbons, L.; Coyne, B.; Kennedy, D.; Alimohammadi, S. A Techno-Economic Analysis of Current Cooling Techniques in Irish Data Centres. In Proceedings of the 2019 25th International Workshop on Thermal Investigations of ICs and Systems (THERMINIC), Lecco, Italy, 25–27 September 2019; pp. 1–6. [Google Scholar]
  112. Gibbons, L.; Persoons, T.; Alimohammadi, S. Techno-Economic and Sustainability Analysis of Potential Cooling Methods in Irish Data Centres. J. Electron. Cool. Therm. Control 2021, 10, 103003. [Google Scholar] [CrossRef]
  113. Burke, C. €450 Million Ennis Data Centre Granted Planning Permission Despite Local Opposition. The Journal, 2022. Available online: https://www.thejournal.ie/ennis-data-centre-granted-planning-permission-5837261-Aug2022/#:~:text=Aug%209th%202022%2C%208%3A07%20PM%20CLARE%20COUNTY%20COUNCIL,moving%20through%20various%20stages%20of%20the%20planning%20process(accessed on 10 August 2022).
  114. McCárthaigh, S. Amazon gets planning permission for two new data centres in north Dublin. Independent, 2022. Available online: https://www.independent.ie/irish-news/amazon-gets-planning-permission-for-two-new-data-centres-in-north-dublin/41911199.html(accessed on 16 August 2022).
  115. Martin, M. Government Announces Sectoral Emissions Ceilings, Setting Ireland on a Pathway to Turn the Tide on Climate Change. 2022. Available online: https://www.gov.ie/en/press-release/dab6d-government-announces-sectoral-emissions-ceilings-setting-ireland-on-a-pathway-to-turn-the-tide-on-climate-change (accessed on 10 August 2022).
  116. Amazon. Sustainability in the Cloud. Available online: https://sustainability.aboutamazon.com/environment/the-cloud?energyType=true (accessed on 18 August 2022).
  117. Microsoft. An Update on Microsoft’s Sustainability Commitments: Building a Foundation for 2030. Available online: https://blogs.microsoft.com/blog/2022/03/10/an-update-on-microsofts-sustainability-commitments-building-a-foundation-for-2030/ (accessed on 18 August 2022).
  118. Harney, C. Dublin Brothers Become Ireland’s first Commercial Vertical Farmers. Available online: https://www.farmersjournal.ie/dublin-brothers-become-ireland-s-first-commercial-vertical-farmers-653493 (accessed on 18 August 2022).
  119. Lei, N.; Masanet, E. Climate- and technology-specific PUE and WUE estimations for U.S. data centers using a hybrid statistical and thermodynamics-based approach. Resour. Conserv. Recycl. 2022, 182, 106323. [Google Scholar] [CrossRef]
  120. Davidson, O.; Lorimer, P.; Tomson, F. How Can Vertical Farmers Power through the Energy Crisis? Available online: https://www.lettusgrow.com/blog/vertical-farming-energy-crisis (accessed on 18 August 2022).
  121. Lane, P.; Boekhout, R. Will Rising Electricity Prices Kill off Vertical Farming? Available online: https://www.hortidaily.com/article/9404736/will-rising-electricity-prices-kill-off-vertical-farming/ (accessed on 18 August 2022).
  122. EPA. Agriculture Sector Emission Share 2021. Available online: https://www.epa.ie/our-services/monitoring--assessment/climate-change/ghg/agriculture/ (accessed on 9 August 2022).
  123. Magilo, N. How Different Types of Agriculture Impact CO2 Emissions. Available online: https://www.greenforges.com/blog/how-different-types-of-agriculture-impact-co2-emissions (accessed on 18 August 2022).
  124. Shehabi, A.; Ganguly, S.; Gundel, L.A.; Horvath, A.; Kirchstetter, T.W.; Lunden, M.M.; Tschudi, W.; Gadgil, A.J.; Nazaroff, W.W. Can combining economizers with improved filtration save energy and protect equipment in data centers? Build. Environ. 2010, 45, 718–726. [Google Scholar] [CrossRef]
  125. Kathoke, K.; Jangra, H.; Kumar, V. Data Center Market by Component. Available online: https://www.alliedmarketresearch.com/data-center-market-A13117 (accessed on 21 August 2022).
  126. ScienceDirect. Search Results: ”Data Centre”. Available online: https://0-www-sciencedirect-com.brum.beds.ac.uk/search?qs=data%20centre&years=2023%2C2022%2C2021&lastSelectedFacet=years (accessed on 21 August 2022).
  127. Bahari, H.; Mohamed Shariff, S. Review on Data Center Issues and Challenges: Towards the Green Data Center; IEEE: Piscataway, MA, USA, 2016; pp. 129–134. [Google Scholar]
  128. Mytton, D.; Ashtine, M. Sources of data center energy estimates: A comprehensive review. Joule 2022, 6, 2032–2056. [Google Scholar] [CrossRef]
  129. Lavi, H. Measuring Greenhouse Gas Emissions in Data Centres: The Environmental Impact of Cloud Computing. Available online: https://www.climatiq.io/blog/measure-greenhouse-gas-emissions-carbon-data-centres-cloud-computing (accessed on 18 August 2022).
  130. Hamilton, T.B. In a Small Dutch Town, a Fight with Meta over a Massive Data Center. Available online: https://www.washingtonpost.com/climate-environment/2022/05/28/meta-data-center-zeewolde-netherlands/ (accessed on 21 August 2022).
  131. Goodbody, W. Planning Permission Extension for Apple’s Galway Data Centre Quashed by High Court. Available online: https://www.rte.ie/news/business/2022/0607/1303435-planning-extension-for-apple-galway-data-centre-quashed/ (accessed on 21 August 2022).
  132. Meredith, S. World’s Biggest Companies Accused of Exaggerating Their Climate Actions. Available online: https://www.cnbc.com/2022/02/07/study-worlds-biggest-firms-seen-exaggerating-their-climate-actions.html (accessed on 12 August 2022).
  133. Monbiot, G. Carbon Offsetting Is Not Warding off Environmental Collapse—It’s Accelerating It. Available online: https://www.theguardian.com/commentisfree/2022/jan/26/carbon-offsetting-environmental-collapse-carbon-land-grab (accessed on 18 August 2022).
  134. Oliver, J. Carbon Offsets: Last Week Tonight with John Oliver (HBO). 2022. Available online: https://ch.linkedin.com/posts/justina-balnaite_carbon-offsets-last-week-tonight-with-john-activity-6968461553943629825-xFJ1 (accessed on 10 August 2022).
  135. Park, H.; Blenkinsopp, J. The roles of transparency and trust in the relationship between corruption and citizen satisfaction. Int. Rev. Adm. Sci. 2011, 77, 254–274. [Google Scholar] [CrossRef]
  136. Dou, H.; Niu, G.; Gu, M.; Masabni, J.G. Responses of Sweet Basil to Different Daily Light Integrals in Photosynthesis, Morphology, Yield, and Nutritional Quality. HortScience Horts 2018, 53, 496–503. [Google Scholar] [CrossRef]
  137. Puigdueta, I.; Aguilera, E.; Cruz, J.L.; Iglesias, A.; Sanz-Cobena, A. Urban agriculture may change food consumption towards low carbon diets. Glob. Food Secur. 2021, 28, 100507. [Google Scholar] [CrossRef]
  138. Van Gerrewey, T.; Boon, N.; Geelen, D. Vertical Farming: The Only Way Is Up? Agronomy 2022, 12, 2. [Google Scholar] [CrossRef]
  139. Engler, N.; Krarti, M. Optimal designs for net zero energy controlled environment agriculture facilities. Energy Build. 2022, 272, 112364. [Google Scholar] [CrossRef]
  140. EPA. Electric Ireland Announces Energy Price Increases Effective from August 1st. 2022. Available online: https://www.esb.ie/media-centre-news/press-releases/article/2022/07/01/electric-ireland-announces-energy-price-increases-effective-from-august-1st-2022 (accessed on 21 August 2022).
  141. Hennessy, M. Taoiseach Affirms Growing Energy Demand as Electricity Cost Rises 86%. Available online: https://www.thejournal.ie/electricity-prices-5846255-Aug2022/ (accessed on 24 August 2022).
  142. EPA. Latest Emissions Data. Available online: https://www.epa.ie/our-services/monitoring--assessment/climate-change/ghg/latest-emissions-data/ (accessed on 18 August 2022).
  143. Department of Enterprise, T.a.E. New Statement on the Role of Data Centres in Ireland’s Enterprise Strategy Published. 2022. Available online: https://enterprise.gov.ie/en/news-and-events/department-news/2022/july/new-statement-on-the-role-of-data-centres-in-irelands-enterprise-strategy-published.html (accessed on 10 August 2022).
  144. Hinkle, L.E.; Wang, J.; Brown, N.C. Quantifying potential dynamic façade energy savings in early design using constrained optimization. Build. Environ. 2022, 221, 109265. [Google Scholar] [CrossRef]
  145. Jin, C.; Bai, X. The study of servers’ arrangement and air distribution strategy under partial load in data centers. Sustain. Cities Soc. 2019, 49, 101617. [Google Scholar] [CrossRef]
  146. Sajid, S.; Jawad, M.; Hamid, K.; Khan, M.U.S.; Ali, S.M.; Abbas, A.; Khan, S.U. Blockchain-based decentralized workload and energy management of geo-distributed data centers. Sustain. Comput. Inform. Syst. 2021, 29, 100461. [Google Scholar] [CrossRef]
  147. Ozcan, H.; Kayabasi, E. Thermodynamic and economic analysis of a synthetic fuel production plant via CO2 hydrogenation using waste heat from an iron-steel facility. Energy Convers. Manag. 2021, 236, 114074. [Google Scholar] [CrossRef]
  148. Ma, G.; Cai, J.; Zeng, W.; Dong, H. Analytical Research on Waste Heat Recovery and Utilization of China’s Iron & Steel Industry. Energy Procedia 2012, 14, 1022–1028. [Google Scholar] [CrossRef]
  149. Chen, J.; Xing, Y.; Wang, Y.; Zhang, W.; Guo, Z.; Su, W. Application of iron and steel slags in mitigating greenhouse gas emissions: A review. Sci. Total Environ. 2022, 844, 157041. [Google Scholar] [CrossRef] [PubMed]
  150. Rahimi, B.; Marvi, Z.; Alamolhoda, A.A.; Abbaspour, M.; Chua, H.T. An industrial application of low-grade sensible waste heat driven seawater desalination: A case study. Desalination 2019, 470, 114055. [Google Scholar] [CrossRef]
  151. Larrinaga, P.; Campos-Celador, Á.; Legarreta, J.; Diarce, G. Evaluation of the theoretical, technical and economic potential of industrial waste heat recovery in the Basque Country. J. Clean. Prod. 2021, 312, 127494. [Google Scholar] [CrossRef]
  152. Teace, E.L. How Long Can a Cruise Ship Stay out at Sea For? Available online: https://emmacruises.com/cruise-ship-stay-at-sea/ (accessed on 18 August 2022).
  153. Baldi, F.; Ahlgren, F.; Nguyen, T.-V.; Thern, M.; Andersson, K. Energy and Exergy Analysis of a Cruise Ship. Energies 2018, 11, 2508. [Google Scholar] [CrossRef]
  154. Konur, O.; Yuksel, O.; Korkmaz, S.A.; Colpan, C.O.; Saatcioglu, O.Y.; Muslu, I. Thermal design and analysis of an organic rankine cycle system utilizing the main engine and cargo oil pump turbine based waste heats in a large tanker ship. J. Clean. Prod. 2022, 368, 133230. [Google Scholar] [CrossRef]
  155. Kosmadakis, G.; Neofytou, P. Reversible high-temperature heat pump/ORC for waste heat recovery in various ships: A techno-economic assessment. Energy 2022, 256, 124634. [Google Scholar] [CrossRef]
  156. Ahern, R.F. Travel by Cargo Ship: What You Should Know about Freighter Travel. Available online: https://www.gonomad.com/1560-freighter-travel-faqs (accessed on 18 August 2022).
  157. Wang, S.; Liu, Z.; Liu, C.; Wang, X. Thermodynamic analysis of operating strategies for waste heat recovery of combined heating and power systems. Energy 2022, 258, 124803. [Google Scholar] [CrossRef]
  158. Sakdanuphab, R.; Sakulkalavek, A. Design, empirical modelling and analysis of a waste-heat recovery system coupled to a traditional cooking stove. Energy Convers. Manag. 2017, 139, 182–193. [Google Scholar] [CrossRef]
  159. Abdoulla-Latiwish, K.O.A.; Mao, X.; Jaworski, A.J. Thermoacoustic micro-electricity generator for rural dwellings in developing countries driven by waste heat from cooking activities. Energy 2017, 134, 1107–1120. [Google Scholar] [CrossRef]
  160. Lamperti, G. Vertical Farms Inside Restaurants? How Hydroponics is Creating a Natural Farming Future—Indoors. Available online: https://geneticliteracyproject.org/2021/09/07/vertical-farms-inside-restaurants-how-hydroponics-is-creating-a-natural-farming-future-indoors/ (accessed on 18 August 2022).
  161. Fang, L.; Xu, Q.; Yin, T.; Fang, J.; Shi, Y. Numerical analysis of layout of air conditioning in data center considering seasonal factors. Energy Rep. 2022, 8, 1365–1371. [Google Scholar] [CrossRef]
  162. Rahman, M.; Nguyen, V.T.V. A statistical approach to multisite downscaling of daily extreme temperature series: A case study using data in Bangladesh. J. Hydro-Environ. Res. 2022, 44, 77–87. [Google Scholar] [CrossRef]
  163. Ustaoglu, A.; Yaras, A.; Sutcu, M.; Gencel, O. Investigation of the residential building having novel environment-friendly construction materials with enhanced energy performance in diverse climate regions: Cost-efficient, low-energy and low-carbon emission. J. Build. Eng. 2021, 43, 102617. [Google Scholar] [CrossRef]
  164. Zhang, X.; Ma, D.; Lv, J.; Feng, Q.; Liang, Z.; Chen, H.; Feng, J. Food waste composting based on patented compost bins: Carbon dioxide and nitrous oxide emissions and the denitrifying community analysis. Bioresour. Technol. 2022, 346, 126643. [Google Scholar] [CrossRef] [PubMed]
  165. Jahangir, M.H.; Mokhtari, R.; Mousavi, S.A. Performance evaluation and financial analysis of applying hybrid renewable systems in cooling unit of data centers—A case study. Sustain. Energy Technol. Assess. 2021, 46, 101220. [Google Scholar] [CrossRef]
  166. Bennert, A. Are Air Purifiers Good for the Environment? Available online: https://www.airoasis.com/blogs/articles/are-air-purifiers-good-for-environment (accessed on 24 August 2022).
  167. Jung, Y.; Kim, J.; Kim, H.; Nam, Y.; Cho, H.; Lee, H. Comprehensive multi-criteria evaluation of water source heat pump systems in terms of building type, water source, and water intake distance. Energy Build. 2021, 236, 110765. [Google Scholar] [CrossRef]
  168. Pattanaik, M.S.; Cheekati, S.K.; Varma, V.B.; Ramanujan, R.V. A novel magnetic cooling device for long distance heat transfer. Appl. Therm. Eng. 2022, 201, 117777. [Google Scholar] [CrossRef]
  169. Ahmed, H.A.; Tong, Y.; Yang, Q. Optimal control of environmental conditions affecting lettuce plant growth in a controlled environment with artificial lighting: A review. South Afr. J. Bot. 2020, 130, 75–89. [Google Scholar] [CrossRef]
  170. Khosravi, A.; Laukkanen, T.; Vuorinen, V.; Syri, S. Waste heat recovery from a data centre and 5G smart poles for low-temperature district heating network. Energy 2021, 218, 119468. [Google Scholar] [CrossRef]
Figure 1. Heat exchange system that transfers the energy from the heated air (red) from the exhaust of the data centre ( θ e ) to the cooler (blue) ambient air ( θ a v ) . The ambient air transfers this heat energy to the vertical farm ( θ v f ) , the cooled exhaust air is recycled into the data centre ( θ i ) .   V ˙ D C and V ˙ v f represent the volumetric flow rate of the air in the data centre and vertical farm, respectively, arrows represent the direction of air flow.
Energies 16 06704 g001
Figure 2. Schematic diagram of one-bore field model as described by [9].
Energies 16 06704 g002
Figure 3. Energy distribution of vertical farm for romaine lettuce, rocket, and strawberries [65].
Energies 16 06704 g003
Table 1. Available information on data centres in Ireland [73,74].
CodeSite NameArea (m2)Power (MW)kW m−2
I1Amazon Dublin Mulhuddart Campus20,71735.001.69
I2Blanchardstown Dublin-Digital Realty11,1488.000.72
I3BT Citywest Ireland Dublin10,2193.200.31
I4CyrusOne Dublin Grange Castle11,14818.001.61
I5Digital Profile Park Dublin836111.501.38
I6DUB10 Blanchardstown Dublin Data Centre11,14810.000.90
I7DUB12 Clonshaugh Dublin Data Centre800010.001.25
I8Echelon Arklow14,40035.002.43
I9EdgeConnex DUB0412,7977.000.55
I10Edgeconnex Dublin600018.003.00
I11Equinix Dublin DB111,1364.720.42
I12Equinix Dublin DB3 & DB410,55210.080.96
I13Equinix: DB3 Ballycoolin Data Centre10,55210.080.96
I14Facebook Clonee Ireland86,000108.001.26
I15Google Dublin Grange Castle28,80080.002.78
I16Interxion Dublin DUB323204.601.98
I17K2 Dublin 111,79918.001.53
I18Keppel DC Dublin163288.001.26
I19Microsoft DUB 0621,55320.000.93
I20Microsoft DUB 0716,25824.001.48
I21Microsoft DUB 0815,97924.001.50
I22Microsoft DUB 0915,97924.001.50
I23Microsoft DUB 1015,97924.001.50
I24Microsoft DUB 1215,97924.001.50
I25Microsoft DUB 1315,97924.001.50
I26Microsoft DUB 1428,06632.001.14
I27Microsoft DUB 1528,16832.001.14
I28Microsoft Dublin DB3 Grange51,09747.000.92
I29Microsoft Dublin Grange Castle28,15023.400.83
I30Sungard: Dublin-Park West-DC2 Data Centre22480.460.20
I31Sungard: Dublin-Profile Park-DC3 Data Centre6210.701.13
I32T5 Data Centres: @Ireland Data Centre30,00860.002.00
IavAverage17,73423.711.32
Table 2. Available information on data centres in London [75].
CodeSite NameArea (m2)Power (MW)kW m−2
L1Cyxtera: LHR1 Slough Data Centre Campus557413.502.42
L2Cyxtera: LHR1 Slough Data Centre Campus557413.502.42
L3Cyxtera: LHR2 Docklands Data Centre Campus55742.700.48
L4DataBank: Heathrow Data Centre11,1483.000.27
L5Digital Realty: LHR18 Oliver’s Yard London Data Centre24504.001.63
L6Digital Realty: LHR19 Cloud House West, 47 Millharbour 17712.501.41
L7Digital Realty: LHR20 Sovereign House 227 Marsh Wall886512.001.35
L8Digital Realty: LON1 London Data Centre46458.001.72
L9Digital Realty: LON2 London Data Centre18584.002.15
L10e-shelter: London 1 Data Centre24,0008.000.33
L11Equinix: LD1 London Data Centre8090.540.67
L12Equinix: LD3 Park Royal Data Centre39003.961.02
L13Equinix: LD8 London Data Centre12,76912.000.94
L14Equinix: LD9 London Data Centre26,34521.000.80
L15Global Switch: London North Data Centre290029.0010.00
L16INAP: London 2 Data Centre8361.501.79
L17IP House: IP House Data Centre14862.001.35
L18Netwise: Harbour Exchange Data Centre55740.500.09
L19Netwise: London Central Data Centre10220.500.49
L20Netwise: Telehouse North Data Centre92900.500.05
L21Server Farm: Lon-1 Data Centre11,14810.500.94
L22Sungard Availability Services: TC2-Docklands UK616913.502.19
L23Sungard Availability Services: Woking-TC3 UK Data Centre495110.002.02
L24Sungard Availability Services: Woking-TC3 UK Data Centre495110.002.02
L25Volta Data Centres: Great Sutton Street84549.601.14
L26Volta Data Centres: Great Sutton Street84,5429.600.11
L27Voxility: Digital Realty Memaco House in London19431.000.51
LAVAverage95767.661.49
Table 3. Ideal growing temperatures of common produce.
ProductIdeal Growing TemperatureNoted by
Basil25–30 °C[93]
Cherry tomato 27.6 °C[94]
Cotton18–35 °C depending on stage of growth[95]
Dill22.5 °C[96]
Lettuce30 °C (Day); 25 °C (Night)[97]
Maize32–35 °C[98]
Oat25 °C[99]
Parsley28 °C[96]
Rice30–32 °C[99]
Strawberries 23–28 °C[100]
Table 4. Psychrometric properties of ideal data centre conditions, exhaust air of data centre, inlet air of data centre, and average Irish weather conditions.
ParameterSymbolUnitData Centre Ideal ConditionsExhaust AverageInlet AverageIrish AverageLondon AverageVertical Farm ConditionsVertical Farm Transpiration Effect Per 1000 m2
Dry bulb temperatureTdb°C21.5030.0020.5010.1015.7520.0017.60
Wet bulb temperatureTwb°C14.3517.4213.918.2212.3813.7112.56
Dew pointTd°C9.289.289.166.499.909.158.73
Relative HumidityRH%45.5027.5048.0078.1568.0049.5055.93
EnthalpyhkJ/kgdry air40.0548.7138.8825.2534.9838.3635.40
Specific VolumeVm3/kgdry air0.840.870.840.810.830.840.83
Partial Vapour PressurePpPa116711671158966121711571125
Saturated Vapor PressurePsPa2565424624121236179023392013
Humidity RatioHRkgwater/kgdry air0.00720.00720.00720.00600.00760.00720.0070
Absolute HumidityWkgwater/m3dry air0.00850.00830.00860.00740.00920.00860.0084
Specific Heat of airCairkJ kgdry air−1 K−11.01851.01851.01851.01631.01931.01851.0182
Volumetric EnthalpyhVkJ m−347.4556.0546.2331.1742.2545.6742.50
Volumetric specific heat of airCvairkJ m−3 K−11.211.171.211.251.231.211.22
Table 5. List of Irish data centres calculated mass flow rate of circulating air, the resulting volumetric flow rate of air available to a vertical farm at ideal temperatures, and the ideal size of the vertical farm depending on this flow rate. Full data available in Table S1.
CodeWaste Heat Energy (kJ)Waste Heat Energy Per Area (J m−2)Mass Flow Rate (kg s−1)Volumetric Flow Rate of Air in Data Centre (m3 s−1)Ideal Size of Vertical Farm (m2)
Min20792.0721.3917.7779.51
Max48,6001350.015022.694172.7818,667.69
IAV10,670594.101102.70916.104098.36
Table 6. List of London data centres calculated mass flow rate of circulating air, the resulting volumetric flow rate of air available to a vertical farm at ideal temperatures, and the ideal size of the vertical farm depending on this flow rate. Full data available in Table S2.
CodeWaste Heat Energy (kJ)Waste Heat Energy Per Area (J m−2)Mass Flow Rate (kg s−1)Volumetric Flow Rate of Air in Data Centre (m3 s−1)Ideal Size of Vertical Farm (m2)
Min22524.2223.2519.32196.18
Max13,0504500.001348.681120.4711,378.72
LAV3448.33672.15356.38296.073006.71
Table 7. Energy requirements of romaine lettuce, rocket and strawberries grown in a vertical farm setup, based on a 1000 m3 vertical farm as described by [65]. * Excluding use of AC systems, humidifier, and dehumidifier.
Romaine LettuceRocketStrawberries
Energy Source(W/m2)Waste Energy Produced (W/m2)30 Days (W/m2)(W/m2)Waste Energy Produced (W/m2)30 Days (W/m2)(W/m2)Waste Energy Produced (W/m2)30 Days (W/m2)
Led Lamps9067.538,880685129,37618013577,760
AC System302712,96022.520.259720605425,920
Computer0.20.181440.20.181440.20.18144
Osmosis1.51.352701.51.352701.51.35270
Fertigation1.21.082161.21.082161.21.08216
Pump7.46.664447.46.664447.46.66444
Dehumidifier201812,000201812,000201812,000
Humidifier1.21.087201.21.087201.21.08720
Automation0.30.272160.30.272160.30.27216
Work Lamps0.40.361200.40.361200.40.36120
Webcam0.020.01814.40.020.01814.40.020.01814.4
Total kW per 1000 m3152.22123.5065,984122.72100.2553,240272.22218.00117,824
Total kW per 1000 m3 *101.0277.41840,304.479.0260.91830,800.4191.02144.91879,184.4
Table 8. Irish [left] and London [right] based data centres’ potential cooling effect of transpiration, and heating effect of the electronics of vertical farm contributing a net negative amount of energy, cooling the vertical farm to 15.19 °C. Full data available in Table S3.
Net Energy Savings of Irish Data CentresNet Energy Savings of London-Based Data Centres
CodeCooling Energy of Transpiration (kW)Heating Effect of Vertical Farm Waste Energy (kW)Energy Savings (kW)CodeCooling Energy of Transpiration (kW)Heating Effect of Vertical Farm Waste Energy (kW)Energy Savings (kW)
Min100.817.514.67Min248.7418.5211.52
Max23,668.11762.571095.79Max14,426.71074.36667.93
IAV5196.17386.96240.57LAV3812.11283.89176.49
Table 9. Scenario 2 data for Irish data centres to predict ideal size of vertical farm. Full data available in Table S4.
CodeUsable Waste Heat Energy (kJ)Mass Flow Rate (kg s−1)Mass Flow Rate of External Air into Vertical Farm (kg s−1)Volumetric Flow Rate of Air into Vertical Farm (m3 s−1)Volumetric Flow Rate of Air into Vertical Farm Per Square Meter of Data Centre (m3 s−1 m−2)Ideal Size of Vertical Farm (m2)Energy Savings (kW)
Min11421.398.687.290.00318.241.07
Max26,7305022.692038.901712.680.0484281.69251.34
IAV58681102.70447.626376.010.021940.01555.179
Table 10. Scenario 2 data for London data centres to predict ideal size of vertical farm. Full data available in Table S5.
CodeUsable Waste Heat Energy (kJ)Mass Flow Rate (kg s−1)Mass Flow Rate of External Air into Vertical Farm (kg s−1)Volumetric Flow Rate of Air into Vertical Farm (m3 s−1)Volumetric Flow Rate of Air into Vertical Farm Per Square Meter of Data Centre (m3 s−1 m−2)Ideal Size of Vertical Farm (m2)Energy Savings (kW)
Min123.7523.2536.6130.750.00376.894.51
Max7177.501348.682123.521783.760.6154459.39261.77
LAV1896.58356.38561.12471.340.091178.3569.17
Table 11. Comparison of crop yields per annum of different food products grown in a vertical farm versus traditional farming methods [37,88].
CropVertical Farm Yield (tons/ha)Field Yield (tons/ha)Vertical Farm Yield (kg m−2)Field Yield (kg m−2)Energy of Food (kcal/kg)Energy Produced in Vertical Farm (kcal m−2)Energy Produced in Field (kcal m−2)Portions Per m2 of Vertical FarmPortions Per m2 of Field
Radish23152.31.5490112773511.57.5
Spinach22122.21.26901518828116
Lettuce37253.72.54801776120018.512.5
Peas960.90.63440309620644.53
Cabbage67506.7510807236540033.525
Carrots58305.831250725037502915
Strawberries69306.9312608694378034.515
Peppers1333013.3389011,837267066.515
Tomatoes1554515.54.594014,570423077.522.5
Potatoes15028152.8349052,35097727514
Average72.327.17.232.71140110,945.43442.936.1513.55
Table 12. The number of calories and portions of fruit or vegetables a vertical farm can provide compared to the same land area using traditional farming methods for Irish data centres in Scenario 1. Full data available in Table S6.
CodePeople Who Can obtain Daily Calories (Vertical Farm)People Who Can Obtain Daily Calories (Field)People Who Can Obtain 7 Portions of Fruit or Veg (Vertical Farm)People Who Can Obtain 7 Portions of Fruit or Veg (Field)
Min1010
Max2808826499
IAV61195822
Table 13. The number of calories and portions of fruit or vegetables a vertical farm can provide compared to the same land area using traditional farming methods for London data centres in Scenario 1. Full data available in Table S7.
CodePeople Who Can Obtain Daily Calories (Vertical Farm)People Who Can Obtain Daily Calories (Field)People Who Can Obtain 7 Portions of Fruit or Veg (Vertical Farm)People Who Can Obtain 7 Portions of Fruit or Veg (Field)
Min3131
Max1715416160
LAV45144316
Table 14. The number of calories and portions of fruit or vegetables a vertical farm can provide compared to the same land area using traditional farming methods for Irish data centres in Scenario 2. Full data available in Table S8.
CodePeople Who Can Obtain Daily Calories (Vertical Farm)People Who Can Obtain Daily Calories (Field)People Who Can Obtain 7 Portions of Fruit or Veg (Vertical Farm)People Who Can Obtain 7 Portions of Fruit or Veg (Field)
Min0000
Max64206123
IAV144135
Table 15. The number of calories and portions of fruit or vegetables a vertical farm can provide compared to the same land area using traditional farming methods for London data centres in Scenario 2. Full data available in Table S9.
CodePeople Who Can Obtain Daily Calories (Vertical Farm)People Who Can Obtain Daily Calories (Field)People Who Can Obtain 7 Portions of Fruit or Veg (Vertical Farm)People Who Can Obtain 7 Portions of Fruit or Veg (Field)
Min1010
Max67216324
LAV186176
Table 16. Carbon impact of importing goods from various countries in either chilled or ambient storage. Costa Rica 277.4 kg CO2e/tonne; South Africa 297.2 kg CO2e/tonne; Spain 100.1 kg CO2e/tonne; and UK 85.6 kg CO2e/tonne [91,107].
kg of CO2e Per Tonne Transported Per km Using Different Transportation Methods and ConditionsCosta Rica to Dublin (kg of CO2e Per tonne)Spain to Dublin (kg of CO2e Per Tonne)South Africa to Dublin (kg of CO2e Per Tonne)UK to Dublin (kg of CO2e Per Tonne)
Road ambient0.240404040
Road cooled0.6120120120120
Ship ambient0.01131.603113.3714144.82643.75
Ship cooled0.02263.206226.7428289.65287.5
Total ambient emissions171.6053.37184.8343.75
Total cooled emissions383.21146.74409.65127.5
Average277.40465100.0571297.239685.625
Table 17. Comparison of the reduction in cost of operations and environmental impact in Scenario 1 & 2 for Irish data centres and vertical farm systems.
Scenario 1Scenario 2
CodeAnnual Cost Savings (€)Annual Reduction in CO2 Emissions from Energy (kg)Annual Reduction in CO2 Emissions from Transport (kg)Total Annual Reduction in CO2 Emissions (kg)Annual Cost Savings (€)Annual Reduction in CO2 Emissions from Energy (kg)Annual Reduction in CO2 Emissions from Transport (kg)Total Annual Reduction in CO2 Emissions (kg)
I1843,207975,8938314984,207193,401223,8351907225,742
I2192,733223,0611900224,96244,20651,16243651,598
I377,09389,22576089,98517,68220,46517420,639
I4433,649501,8884276506,16499,463115,115981116,096
I5277,054320,6512732323,38263,54673,54662774,172
I6240,916278,8272375281,20255,25763,95354564,498
I7240,916278,8272375281,20255,25763,95354564,498
I8843,207975,8938314984,207193,401223,8351907225,742
I9168,641195,1791663196,84138,68044,76738145,148
I10433,649501,8884276506,16499,463115,115981116,096
I11113,712131,6061121132,72726,08230,18625730,443
I12242,844281,0572394283,45255,70064,46454965,014
I13242,844281,0572394283,45255,70064,46454965,014
I142601,8953,011,32825,6553,036,982596,781690,6905884696,574
I151927,3302,230,61319,0042,249,617442,060511,6224359515,981
I16110,821128,2601093129,35325,41829,41825129,669
I17433,649501,8884276506,16499,463115,115981116,096
I18192,733223,0611900224,96244,20651,16243651,598
I19481,832557,6534751562,404110,515127,9061090128,995
I20–25578,199669,1845701674,885132,618153,4871308154,794
I26770,932892,2457601899,847176,824204,6491743206,392
I27770,932892,2457601899,847176,824204,6491743206,392
I281,132,3061,310,48511,1651,321,650259,710300,5782561303,139
I29563,744652,4545559658,013129,303149,6491275150,924
I3011,08212,82610912,93525422942252967
I3116,86419,51816619,68438684477384515
I321,445,4971,672,96014,2531,687,212331,545383,7173269386,986
Min11,08212,82610912,93525422942252967
Max2,601,8953,011,32825,6553,036,982596,781690,6905884696,574
IAV571,227661,1155632666,748131,019151,6361292152,928
Table 18. Comparison of the reduction in cost of operations and environmental impact in Scenario 1 & 2 for London data centres and vertical farm systems.
Scenario 1Scenario 2
CodeAnnual Cost Savings (€)Annual reduction in CO2 Emissions from Energy (kg)Annual Reduction in CO2 Emissions from Transport (kg)Total Annual Reduction in CO2 Emissions (kg)Annual Cost Savings (€)Annual Reduction in CO2 Emissions from Energy (kg)Annual Reduction in CO2 Emissions from Transport (kg)Total Annual Reduction in CO2 Emissions (kg)
L1738,292854,4697280861,749289,342334,8722853337,725
L2738,292854,4697280861,749289,342334,8722853337,725
L3147,658170,8941456172,35057,86866,97457167,545
L4164,065189,8821618191,50064,29874,41663475,050
L5218,753253,1762157255,33385,73199,221845100,067
L6136,721158,2351348159,58353,58262,01352862,542
L7656,260759,5286471765,999257,193297,6642536300,200
L8437,507506,3524314510,666171,462198,4431691200,133
L9218,753253,1762157255,33385,73199,221845100,067
L10437,507506,3524314510,666171,462198,4431691200,133
L1129,53234,17929134,47011,57413,39511413,509
L12216,566250,6442135252,78084,87498,22983799,066
L13656,260759,5286471765,999257,193297,6642536300,200
L141148,4551,329,17511,3241,340,498450,087520,9124438525,350
L151,585,9611,835,52715,6381,851,165621,549719,3556128725,484
L1682,03294,94180995,75032,14937,20831737,525
L17109,377126,5881078127,66742,86549,61142350,033
L1827,34431,64727031,91710,71612,40310612,508
L1927,34431,64727031,91710,71612,40310612,508
L2027,34431,64727031,91710,71612,40310612,508
L21574,227664,5875662670,249225,043260,4562219262,675
L22738,292854,4697280861,749289,342334,8722853337,725
L23546,883632,9405392638,333214,327248,0532113250,167
L24546,883632,9405392638,333214,327248,0532113250,167
L25525,008607,6235177612,799205,754238,1312029240,160
L26525,008607,6235177612,799205,754238,1312029240,160
L2754,68863,29453963,83321,43324,80521125,017
Min27,34431,64727031,91710,71612,40310612,508
Max1,585,9611,835,52715,6381,851,165621,549719,3556128725,484
LAV419,075485,0204132489,152164,238190,0821619191,702
Table 19. Summary of main findings of a vertical farm situated in Ireland versus London based on the proposed system of Scenario 1.
ParameterIrish MinIrish MaxIrish AverageLondon MinLondon MaxLondon Average
Ideal size of vertical farm (m2)79.518,667.74098.4196.211,378.73006.7
Area of vertical farm compared to data centre0.040.520.230.023.920.59
Energy savings (kW)4.671095.79240.5711.52667.93176.49
People who can obtain daily calories128061317145
People who can obtain 7 portions of fruit or veg126458316143
Annual cost savings (€)11,0822,601,895571,22727,3441,585,961419,075
Total Annual Reduction in CO2 emissions (kg)12,9353,036,982666,74831,9171,851,165489,152
Table 20. Summary of main findings of a vertical farm situated in Ireland versus London based on the proposed system of Scenario 2.
ParameterIrish MinIrish MaxIrish AverageLondon MinLondon MaxLondon Average
Ideal size of vertical farm (m2)62186,00017,73480984,5429576
Area of vertical farm compared to data centre0.46108.0023.710.5029.007.66
Energy savings (kW)20748,60010,670225.0013,050.003448.33
People who can obtain daily calories11426,7305868123.757177.501896.58
People who can obtain 7 portions of fruit or veg18.24281.7940.076.94459.41178.4
Annual cost savings (€)0.0080.1190.0520.0081.5380.23
Total Annual Reduction in CO2 emissions (kg)1.07251.3455.184.51261.7769.17
Table 21. Summary of all scenarios.
ParameterIrish Average Scenario 1Irish Average Scenario 2London Average Scenario 1London Average Scenario 2
Ideal size of vertical farm (m2)4098.4940.03006.71178.4
Area of vertical farm compared to data centre0.230.0520.590.23
Energy savings (kW)240.5755.18176.4969.17
People who can obtain daily calories61144518
People who can obtain 7 portions of fruit or veg58134317
Annual cost savings (€)571,227131,019419,075164,238
Total Annual Reduction in CO2 emissions (kg)666,748152,928489,152191,702
Disclaimer/Publisher’s Note: The statements, opinions and data contained in all publications are solely those of the individual author(s) and contributor(s) and not of MDPI and/or the editor(s). MDPI and/or the editor(s) disclaim responsibility for any injury to people or property resulting from any ideas, methods, instructions or products referred to in the content.

