Article

Metal Hydrides for High-Temperature Power Generation

by
Ewa C. E. Rönnebro
1,*,†,
Greg Whyatt
1,†,
Michael Powell
1,†,
Matthew Westman
1,
Feng (Richard) Zheng
1 and
Zhigang Zak Fang
2
1
Pacific Northwest National Laboratory, Richland, WA 99352, USA
2
Department of Metallurgical Engineering, University of Utah, 135 S. 1460 E., Room 412, Salt Lake City, UT 84112, USA
*
Author to whom correspondence should be addressed.
Energies 2015, 8(8), 8406-8430; https://0-doi-org.brum.beds.ac.uk/10.3390/en8088406
Submission received: 7 May 2015 / Accepted: 4 August 2015 / Published: 10 August 2015
(This article belongs to the Special Issue Hydrides: Fundamentals and Applications)

Abstract

:
Metal hydrides can be utilized for hydrogen storage and for thermal energy storage (TES) applications. By using TES with solar technologies, heat can be stored from sun energy to be used later, which enables continuous power generation. We are developing a TES technology based on a dual-bed metal hydride system, which has a high-temperature (HT) metal hydride operating reversibly at 600–800 °C to generate heat, as well as a low-temperature (LT) hydride near room temperature that is used for hydrogen storage during sun hours until there is the need to produce electricity, such as during night time, a cloudy day or during peak hours. We proceeded from selecting a high-energy density HT-hydride based on performance characterization on gram-sized samples scaled up to kilogram quantities with retained performance. COMSOL Multiphysics was used to make performance predictions for cylindrical hydride beds with varying diameters and thermal conductivities. Based on experimental and modeling results, a ~200-kWh/m3 bench-scale prototype was designed and fabricated, and we demonstrated the ability to meet or exceed all performance targets.

Graphical Abstract

1. Introduction

To reduce energy consumption and greenhouse gas emissions, we need more efficient ways to utilize energy. In the International Energy Agency (IEA) technology roadmap from 2014 [1,2,3], energy storage technologies are categorized by output: electricity and thermal (heat or cold). Broadly speaking, energy storage is a system integration technology that allows for the improved management of energy supply and demand. Energy storage is utilized in various areas and for various applications and includes batteries, flywheels, electrochemical capacitors, superconducting magnetic energy storage (SMES), power electronics and control systems. Thermal energy storage (TES) technologies operate with the goal of storing energy for later use as heating or cooling capacity and are contributing to improved energy efficiency.
Thermal energy storage (TES) is a key technology for implementing renewable energies, enabling grid applications and for efficiently utilizing energy for various applications within the areas of buildings and transportation; however, cost reduction is necessary [4]. It is an emerging technology market, which recently has been identified as a key enabling storage method for more efficient energy use in heating and cooling applications. The key challenge is that the materials currently used are not efficient enough and of too high a cost. Materials development programs are needed to improve performance, but materials research needs to go hand in hand with systems engineering to design the most efficient systems.
Thermal energy storage can be stored as a change in internal energy of a material as sensible heat, latent heat and thermochemical or a combination of these. Sensible heat storage is storage that occurs with a temperature change when heat is added or removed. The storage capacity is fairly low. Latent heat storage is typically phase change materials (PCM) that have a phase change that occurs at constant temperature. The storage capacity is 3–5-times higher than for sensible heat storage. Thermochemical heat storage has the potential for much higher energy density, above 10–20-times sensible heat storage, and energy is reversibly stored in chemical exothermic/endothermic reactions, such as in metal hydrides.
During recent years, solar technologies have been strongly emerging, and photovoltaics (PV) has become significantly cheaper. Furthermore, several concentrating solar power (CSP) plants have been built, in Spain and in the USA. However, both PV and CSP technologies are currently not used with storage (except for two CSP plants), which limits the use to when the Sun is shining. It has recently been emphasized how thermal energy storage can provide continuous usage and dispatchability and enable renewable energies for various applications and grid implementation.
The state-of-the-art thermal energy storage for concentrating solar power (CSP) and solar dishes is molten salt storage (mix of nitrates, also called solar salt), using sensible energy storage. The energy storage density if low (153 kJ/kg), which necessitates enormous storage tanks. The salt is fluid at elevated temperatures and pumped up to the receiver in the solar power tower, where it is heated. It is thereafter pumped into a hot tank at 565 °C for heat generation. When the salt comes back from the power block, it is stored in a cold tank at 285 °C until it is pumped back up to the receiver for the next cycle. The main benefit of using molten salt storage is the low cost of nitrates. The main challenge is the high freezing point of the salt (222 °C), which results in having to re-heat the molten salt, which is energy consuming. There are also issues with the corrosion of containers and pipes. Moreover, this system has expensive parts, i.e., heat exchangers and pumps, which results in a high system cost.
There are currently no advanced materials commercially available for thermal energy storage (TES) of ≥600 °C. Common shortcomings with TES materials are low energy densities and limited capacity and life cycle due to irreversible side reactions. Metal hydrides have among the highest practical energy densities among known materials, and some metal hydrides have eight-times higher energy density than molten salts [5,6,7,8], i.e., >700 kJ/kg and >150 kWh/m3, so an metal hydride (MH) system can be at least eight-times smaller, far exceeding the U.S. DOE target of 25 kWh/m3. We can reach higher energy efficiencies by operating at higher temperatures (the molten salts store latent heat at about 400–550 °C). This technology is simple, straight forward, without moving parts, and we believe that we can lower the cost relative to other technologies to meet the DOE cost target of $15/kWh. Metal hydrides do not freeze at the anticipated temperatures, so they will not need any energy to re-heat, like molten salts, and they are known to achieve a long life cycles, so we expect that they can meet the 30-year lifetime target.
We have chosen metal hydrides that are low cost, readily abundant and non-toxic, based on titanium. By using titanium hydride for the high-temperature (HT) bed, we believe we can exceed DOE performance targets as indicated from our results presented here.
Table 1. Comparison of titanium hydride with other heat storage technologies. TES, thermal energy storage.
TES MaterialT and P RangeHeat of ReactionGravimetric Energy Density **Materials Features
Titanium hydride650–700 °C 1–3 bar150 kJ/mol778 kJ/kg (practical) 3190 kJ/kg (theo)
High exergetic efficiency
Long life cycle expected
T, P allow simple, stainless steel construction
Magnesium hydride450–500 °C 40–100 bar75 kJ/mol2814 kJ/kg (theo)
Lower exergetic efficiency due to lower temperature
Oxidation of MgH2 to MgO limits the life cycle
High pressures require high-cost tank materials
Calcium hydride1100–1400 °C 1–5 bar186 kJ/mol4426 kJ/kg (theo)
High exergetic efficiencies
Oxidation of CaH2 to CaO limits the life cycle
Expensive tank materials needed at >1100 °C
Solar salt/molten salt (NaNO3/KNO3 60:40 mixture)300–550 °C N/A15 kJ/mol153 kJ/kg
Lower exergetic efficiency due to lower temperature
Lower volumetric energy densities; 8 times larger space requirements than for TiH
Note: ** Gravimetric energy density for materials (not the system). Theo = theoretical. Titanium hydride is given as the practically-obtained kJ/kg for cycling on the plateau pressure. Theoretical is 3190 kJ/kg. The kJ/kg given for MgH2 and CaH2 is theoretical for full capacities, not practical.
Table 1 compares titanium hydride with a molten salt system and two other metal hydrides that are being considered by other teams. Metal hydrides have been investigated for TES; MgH2 requires operation at a lower temperature and much higher pressure, which results in lower exergetic efficiency while increasing structural requirements [9]. CaH2 operates at very high temperatures, which necessitates the use of expensive nickel-based alloys for the container. Both MgH2 and CaH2 have issues with oxidation that can limit the life cycle. The challenge is to avoid irreversible losses due to chemical side reactions and to maintain capacity during cycling. Titanium is less prone to oxidation after a thin, nanosized oxide shell of titanium oxide has formed, which protects from further oxidation while allowing for hydrogen diffusion. The state-of-the-art molten salt NaNO3/KNO3 technology operates at a lower temperature, which reduces the exergetic efficiency and has a low heat of reaction that leads to a low energy storage density.

2. Results and Discussion

2.1. Operating Principle of Dual Bed Metal Hydride Thermochemical Energy Storage

To accelerate the development and deployment of high-temperature thermal energy storage for renewable energies, we are developing a thermochemical energy storage (TCES) system with superior energy densities and lower cost than the current state-of-the-art. The system consists of two connected metal hydride (MH) beds: a high-temperature (HT) bed operating at ≥650 °C and a low temperature (LT) bed operating near ambient temperature (~40 °C). When heat is added to the HT-reservoir, such as by solar energy, H2 is released in an endothermic reaction that absorbs ~150 kJ per mol H2 [10,11,12]. The hydrogen moves to the LT-reservoir, where it forms a hydride at near ambient temperature and releases ~25–35 kJ/mol H2 of heat to the environment. When heat is retrieved from storage, hydrogen returns to the HT hydride bed and undergoes a reaction that releases ~150 kJ/mol H2, which can be utilized to generate power. Our operation is expected to occur between H:Ti ratios of 0.88 and 1.55 in a range of ~650–700 °C. The reaction enthalpy is assumed constant with respect to temperature in extrapolating the reaction enthalpy to the operating temperature range of 650–700 °C. The HT hydride isotherm and cycling behavior were demonstrated and will be discussed further below. In the region of operation for the HT bed, significant hydrogen loading changes occur with little change in pressure. As a result, the temperature at which heat is stored is very close to the temperature at which it is returned. This makes it possible to achieve high exergetic efficiency, since, unlike sensible heat storage, the source heat temperature is sustained as heat is withdrawn from the reservoir. Sensible heat associated with the hydrogen released is recovered from waste heat before H2 storage.
To validate the ability of utilizing the identified candidate for high-temperature TES, we: (1) demonstrate the life cycle at >600 °C; (2) measure the thermal diffusivity; (3) scale up with retained performance; and (4) demonstrate a bench-scale unit with ~200 kWh/m3, <6 h charging time.

2.2. Performance of High-Temperature Metal Hydride

We investigated several titanium-based alloys to optimize the pressure and temperature operation range with maximum capacity; however, the best performing material is titanium, and we will in the following subsections report the characterization of titanium hydride.

2.2.1. Isotherms of Titanium Hydride

We measured absorption and desorption isotherms using our custom-built Sievert’s system at various temperatures between 630 and 680 °C. To obtain accurate data, we used the criteria for reaching steady state at a stable temperature and pressure condition below 0.075 °C and 0.075 psia. The pressure-composition isotherms are similar to the literature [13,14]. We compared ITP (International Titanium Powder)-Ti-powder with Ti-sponge, which, after screening, had been selected as the two best candidates based on the plateau pressure and the capacity in the plateau region and found that the plateau pressure of the ITP-Ti powder is significantly sloping, while the Ti-sponge plateau pressure is flat and well defined, which is beneficial for reversibly cycling the Ti-powder between higher and lower hydrogen content. Figure 1 shows the isotherms of Ti-sponge at ~640 °C.
Figure 1. Isotherms of 2.5 grams of Ti-sponge (raw data): (a) absorption at 638 °C; plateau pressure = 15 psi (1.03 bar); (b) desorption at 638 °C: plateau pressure = 9 psi (0.62 bar). The Y-axis is pressure in psia and the X-axis is bound H2 in mol.
Energies 08 08406 g001
A summary of the isotherms at various temperatures is shown in Figure 2. It appears that at 638 °C, the plateau pressure is close to one bar. For thermal energy storage applications, we aim at operation near atmospheric pressure to avoid expensive high-pressure tank materials.
These measured data were used to create a model that predicts isotherm behavior. The model predictions are shown in Figure 3. The dashed lines in Figure 3 illustrate that at 2.4 bar, a swing in the H:Ti ratio between 0.88 and 1.55 can be achieved between 700 °C and 650 °C, which corresponds to a swing of 1.4 wt% with respect to titanium mass.
Figure 2. Absorption (Abs) and desorption (Des) isotherms of Ti-sponge at various temperatures. H/M is ratio of moles hydrogen per moles titanium.
Energies 08 08406 g002
Figure 3. Model isotherms in the region of interest. Equilibrium loading is predicted to swing from 0.88 mol H:mol Ti at 700 °C to 1.55 mol H:mol Ti at 650 °C for a swing of 0.67 mol Hmol Ti. Actual loading swings achieved in the model depend on local temperatures reached during the loading/unloading cycle.
Energies 08 08406 g003

2.2.2. Life Cycle of Ti-Sponge

We performed a life cycle test to show 60 charging and discharging cycles without capacity drop, executed by inserting and releasing hydrogen gas at about 650 °C and one bar H2 pressure. To our knowledge, the life cycle of titanium hydride has previously not been shown. The life cycle target for TES is ~10,000 cycles (30 years). As can be seen in Figure 4, we showed 60 cycles without capacity drop.
Figure 4. Life cycle of 2.55-gram Ti-sponge at 650 °C showing 60 cycles over 70 h (60 absorption/60 desorption) without a capacity drop in hydrogen pressure (psia).
Energies 08 08406 g004

2.2.3. Thermal Diffusivity of Titanium and Titanium Hydride

To design and build a TES prototype with optimized thermal heat management, it is important to know the thermal diffusivity in the Ti bed with and without hydrogen. It is crucial to have sufficient heat and mass transfer to obtain a long life cycle. To assess the need for thermal enhancement for the bench-scale prototype, we estimated the thermal diffusivity of a series of Ti-based pellets using a commercial instrument to collect data in argon during heating. We chose to focus on key parameters, i.e., temperature dependence, powder compaction, thermal enhancement with graphite and the impact of life cycle, to study trends as a guide to design the first generation prototype. In the future, we will report thermal conductivity measurements using a custom-built device with a larger hydride bed, collecting data during absorption and desorption cycles in a hydrogen atmosphere.
The thermal conductivity as calculated from the measured diffusivity of titanium is about 4–7 W/(mK) at 400 °C, as can be since in Figure 5. The increase after 400 °C is likely because of oxidation, forming titanium oxides on the surface of the pellet. Interestingly, the TiH2 (−325 mesh) sample had a thermal conductivity of about 12 W/(mK) at 400–500 °C, and the plot is represented in Figure 6. Ito et al. [15] studied the electrical and thermal properties of titanium hydrides of TiHx (x = 1.53–1.75). They found that the thermal conductivity of the hydride was the same as that of the metal and increased slightly with increasing temperature. At 323 K, the thermal conductivity was measured to be 21.8 W/(mK) for Ti and 19.7 W/(mK) for TiH1.75, which are significantly higher than what we obtained. The reason is likely due to difficulties with measuring thermal diffusivity on porous samples with our currently-employed instrument (described in the Experimental Section). However, we could obtain data to study the trends. In the future, we will design a device for thermal diffusivity measurements during hydrogen absorption and desorption.
It is worthwhile to note that thermal conductivity in argon is lower than in hydrogen atmosphere. The better the thermal diffusivity, the longer the life cycle that can be achieved. We also studied thermal enhancers to optimize the heat management on a materials level.
Figure 5. Thermal conductivity up to 500 °C of three different titanium samples; Ti from University of Utah, Ti-sponge and ITP- Ti (International Titanium Powder).
Energies 08 08406 g005
Figure 6. Thermal conductivity of titanium hydride, −325 mesh.
Energies 08 08406 g006

2.2.4. Thermal Enhancement with Graphite

We investigated solutions to enhance thermal conductivity by adding a thermal enhancer, leveraging results from recent studies on other metal hydrides. We prioritized two options: (1) adding a conductive powder as a thermal enhancer, i.e., graphite; or (2) incorporating the Ti-powder in a conductive foam, i.e., copper. Based on our experimental results, we chose the option of using a copper foam as an internal structure of the container for the high-temperature TES prototype bed, as will be discussed below.
A recently-explored metal hydride for TES and hydrogen storage is magnesium hydride. Magnesium has a very low thermal conductivity of less than 1 W/(mK). It has been shown in the literature that if adding 10% expanded natural graphite (ENG), the thermal conductivity is increased to 8 W/(mK) [16]. Therefore, we decided to add graphite to titanium hydride to assess the increase in thermal conductivity. As can be seen in Figure 7, the conductivity of titanium hydride with 10% graphite is two-times the conductivity of titanium hydride, i.e., 20 W/(mK) at 500 °C.
Figure 7. Thermal conductivity of (a) titanium hydride and (b) titanium hydride with 10% graphite showing thermal enhancement of two times.
Energies 08 08406 g007

2.2.5. Impact of Compaction on Thermal Diffusivity

We performed a study of the level of compaction of titanium hydride powder and, not surprisingly, found that with higher static pressure applied to increase compaction, the thermal diffusivity is enhanced up to about three times, as can be seen in Figure 8.
Figure 8. Thermal diffusivity of titanium hydride at various levels of compaction (pressure in MPa), (Avg= average).
Energies 08 08406 g008

2.2.6. Impact of Life Cycle on Thermal Diffusivity

We measured the thermal diffusivity of titanium hydride after multiple cycles of hydrogenation and dehydrogenation had been performed. Interestingly, the thermal diffusivity relative to the original titanium hydride powder remained the same, as can be seen in Figure 9. Most metal hydride materials undergo a decrease in particles size during cycling, but Ti-powder particles appear to sinter together, thus not affecting the thermal diffusivity significantly, at least in the range of dozens of cycles. The effect of hundreds of cycles is beyond the scope of the current project, but will be reported in the future.
Figure 9. Thermal diffusivity of titanium hydride after multiple cycles compared to original titanium hydride.
Energies 08 08406 g009

2.3. Scale-Up to Kilogram Quantities

The scale-up to kilogram quantities of selected titanium hydride was performed using titanium sponge powders. One of the objectives was to increase both the packing density and specific surface area of the powder to optimize performance. Both the surface area and the packing density of Ti-sponge powders, however, depend on particle sizes. The finer the particle size, the lower the packing density and the higher the specific area. One of the ways to maximize both is to use a custom-designed blend of different particle sizes. “As received” powders were sieved, and the particle size distributions were analyzed. Different blends of powders were mixed and blended using a tumbler mixer. The results showed that a blend of 2:4 powder with 66.67% of −325 mesh powder is the best blend so far with 1.84 g/cm3. About 15 kilograms of Ti-hydride powder with retained performance based on studying isotherms were prepared for inclusion in the container with Cu-foam.

2.4. Numerical Modeling of Hydrogen Uptake and Release for Candidate Prototype Designs

Physical property and hydrogen uptake data for titanium powder were used in a numerical model to predict hydrogen uptake and release rates for several candidate prototype designs. COMSOL Multiphysics was used to make performance predictions for cylindrical hydride beds with varying diameters and thermal conductivities. The modeling results imply that 3 kWh of thermal storage per day can be achieved using two 12.7-cm (5 in) diameter, 29 cm (11.5 in)-long cylinders filled with titanium hydride powder and 8% dense, reticulated copper foam. The basis for this conclusion is provided in the subsections that follow.

2.4.1. Numerical Model Development

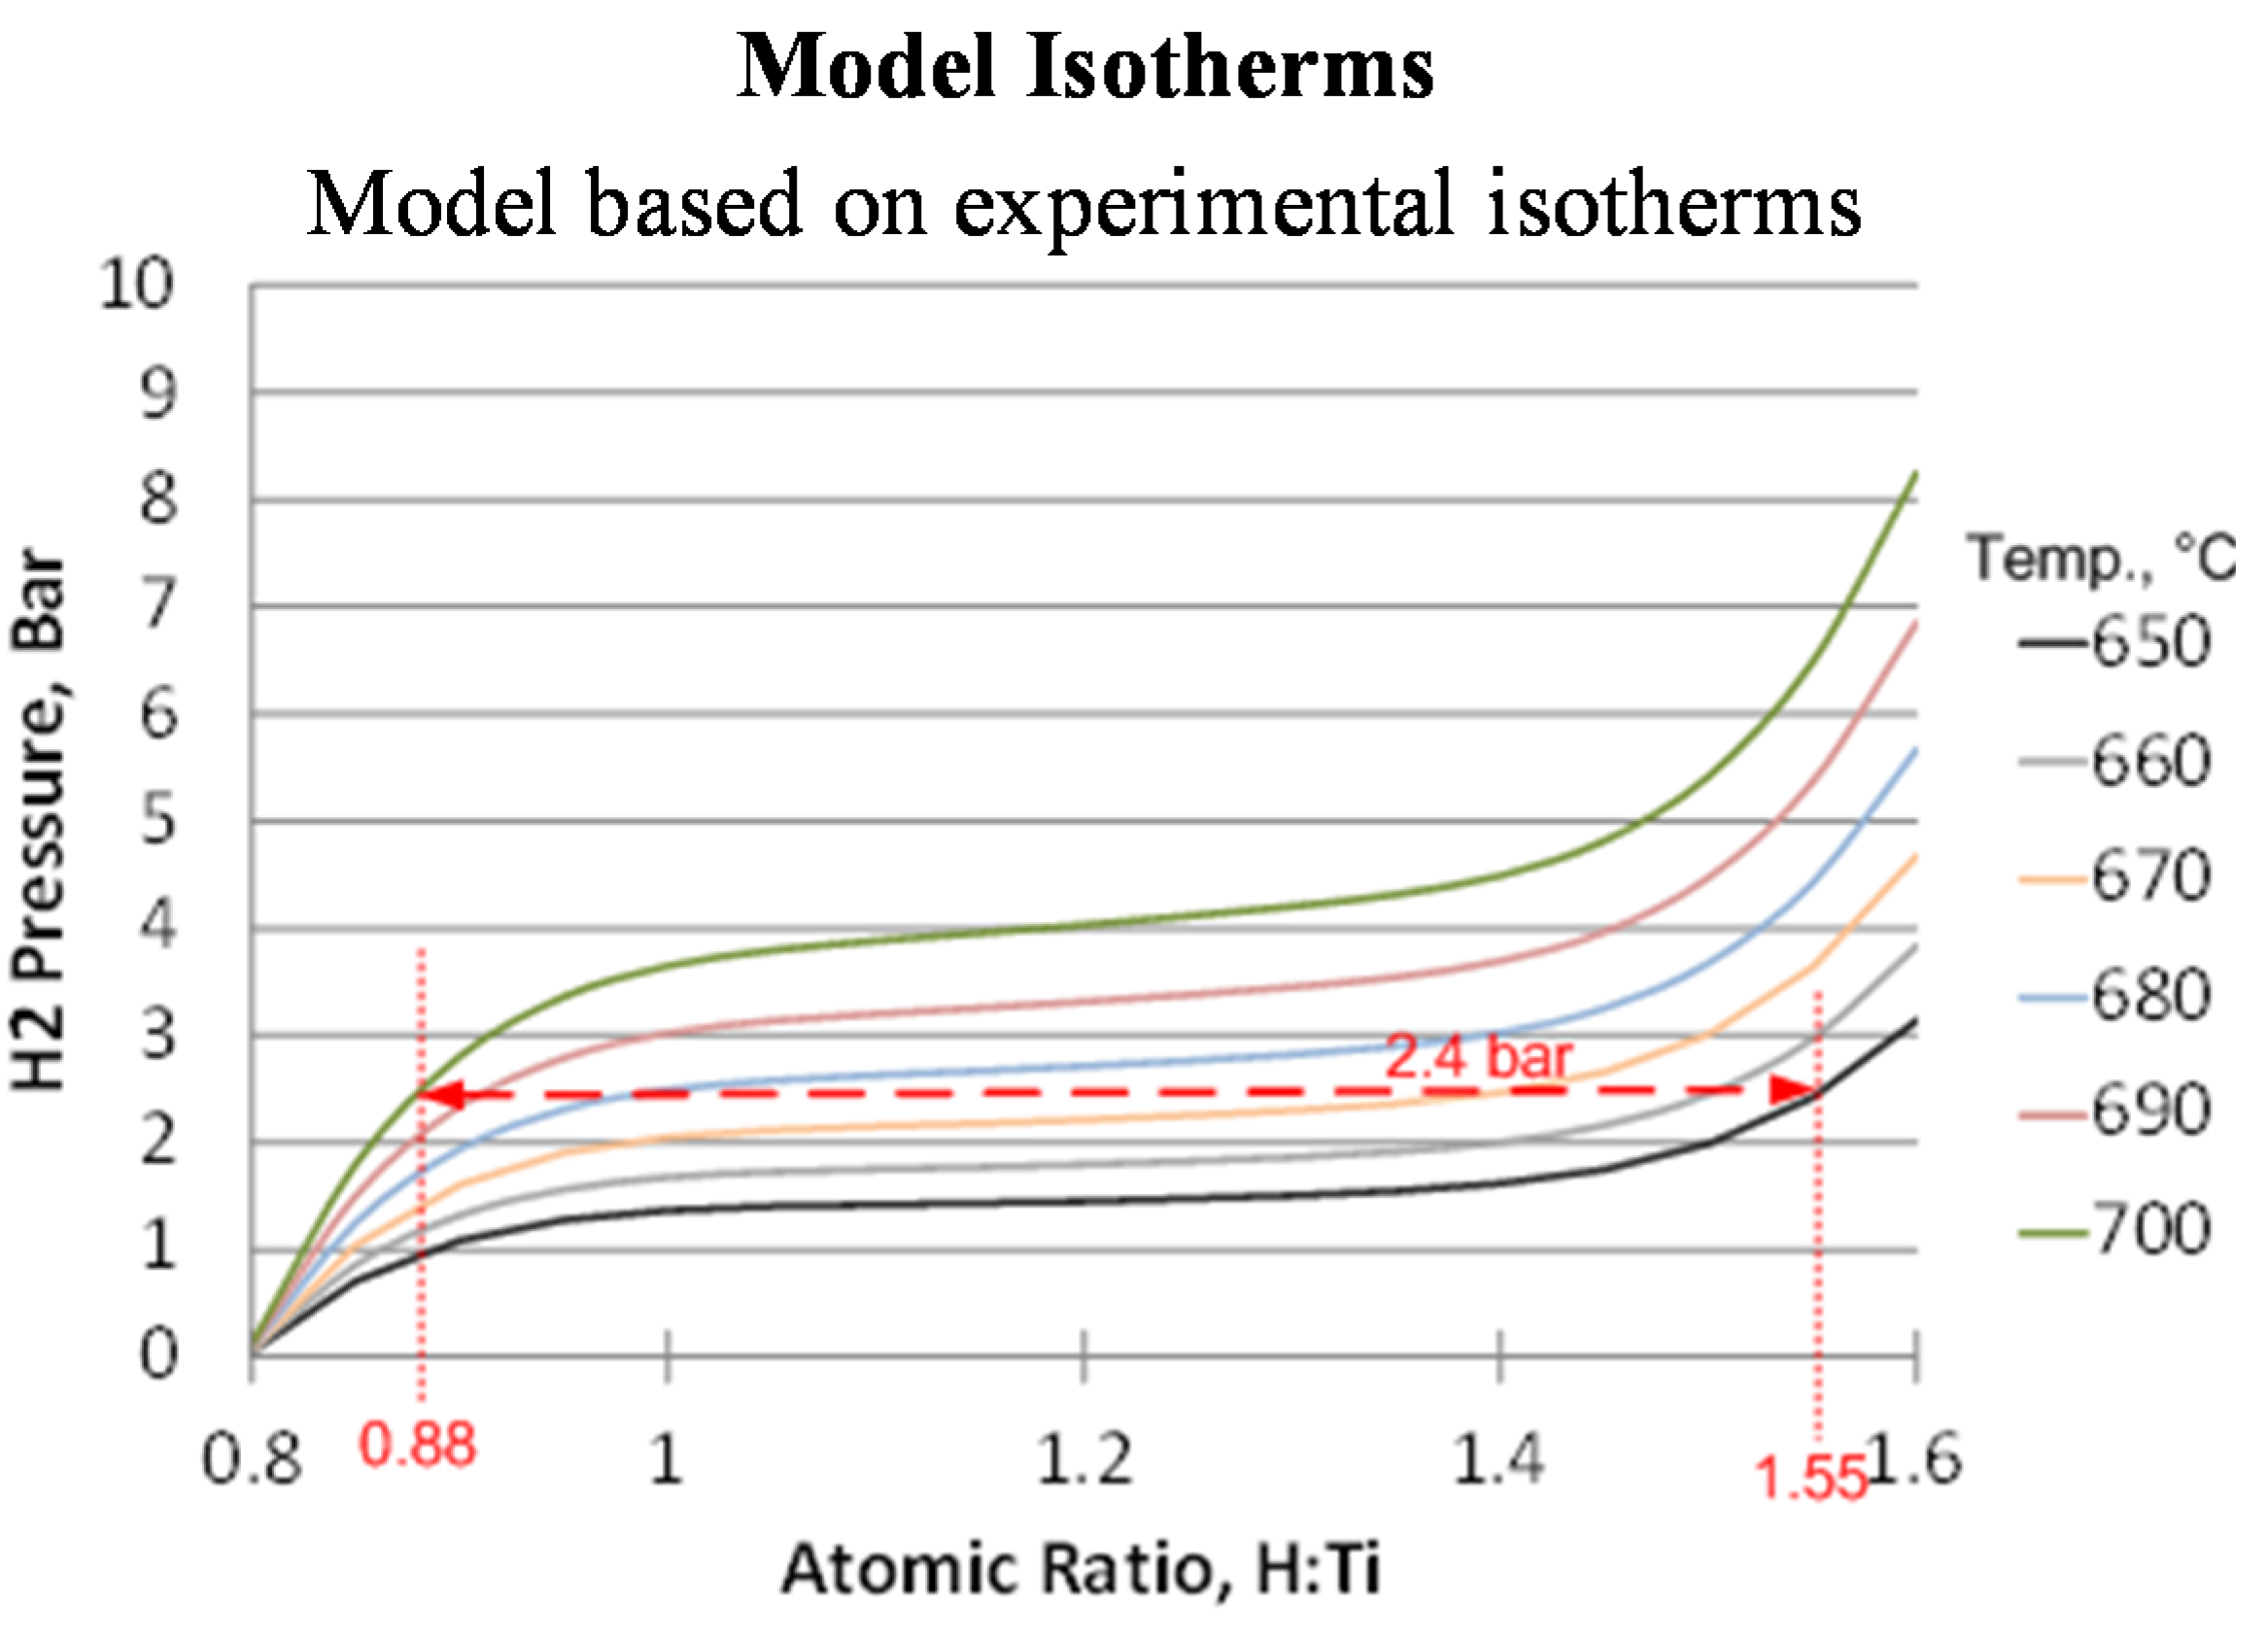
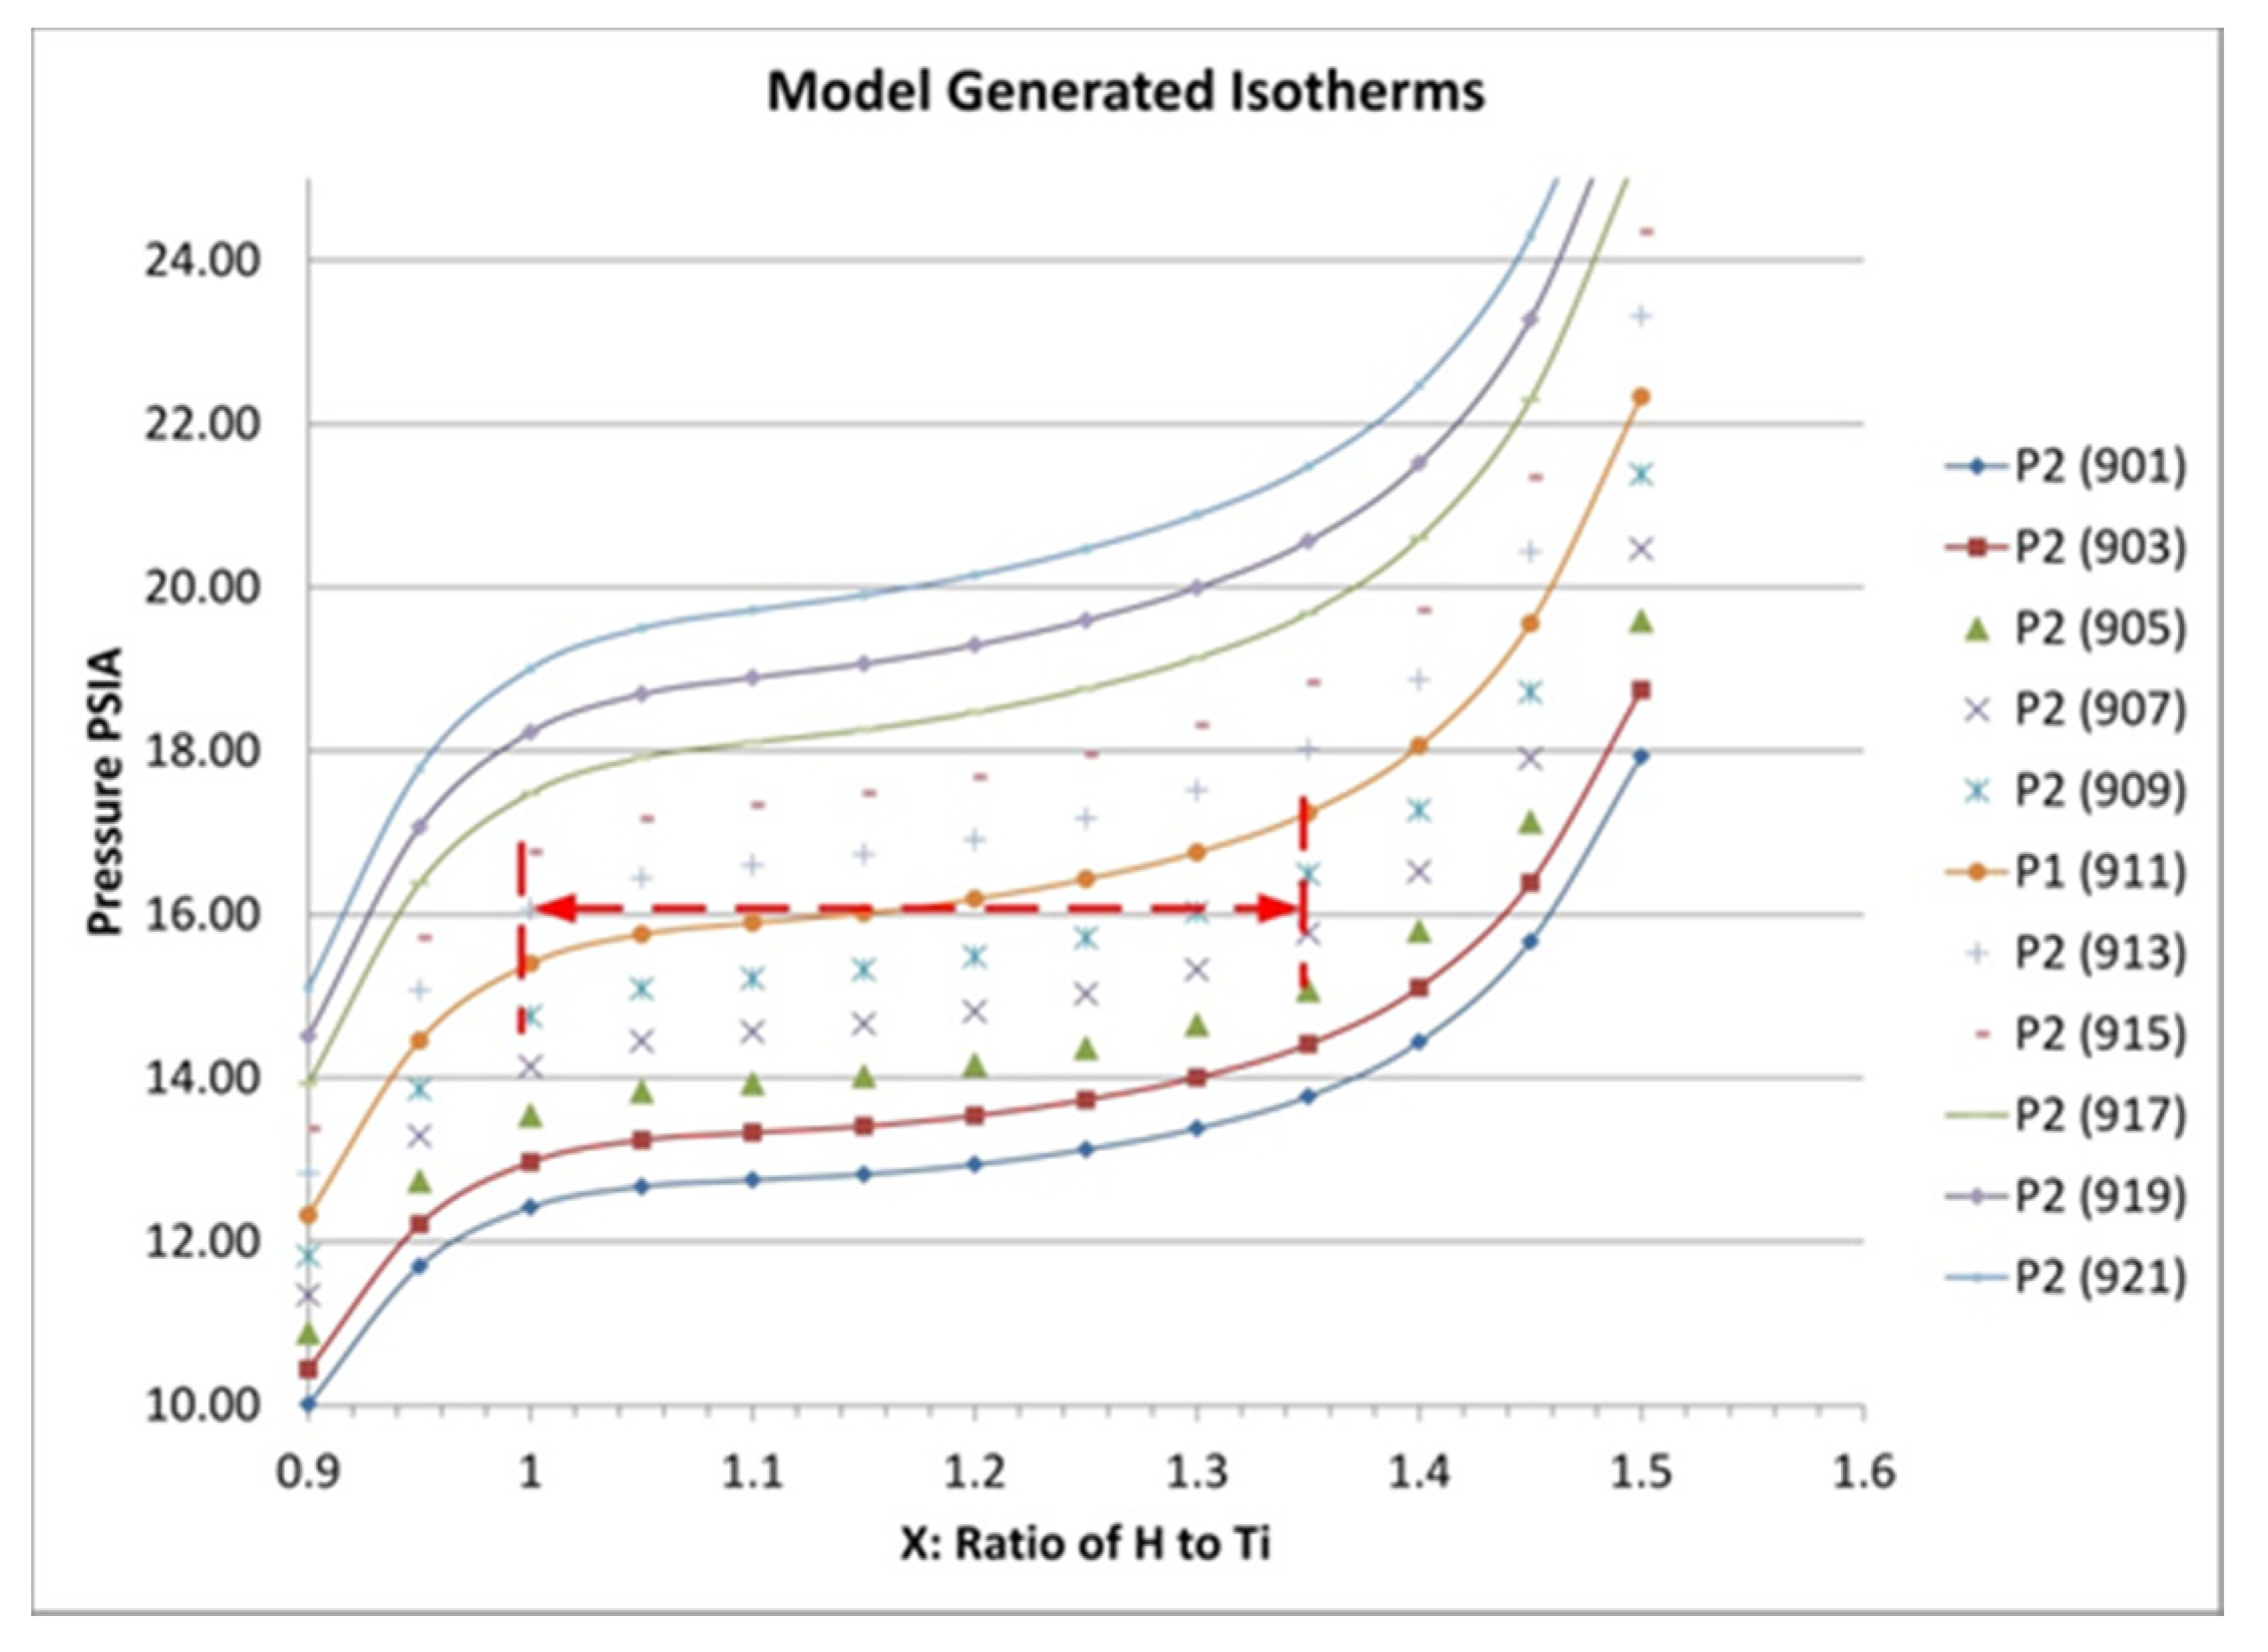
The prototype energy storage system is intended to operate at near-constant pressure and to use a temperature swing of ±10 °C to drive the uptake and subsequent release of hydrogen. As the temperature in the bed changes, the concentration of stored hydrogen responds accordingly. The relationship between stored hydrogen equilibrium pressure, temperature and the heat of reaction can be determined based on a Clausius-Clapeyron expression of the form:
Q =   R [ ln P ( 1 T ) ]
where T is absolute temperature in Kelvin, R is the gas constant (8.314 J/mol K), Q is the heat of adsorption in J/mol and P is pressure. This can be rearranged to yield pressure P2 at a temperature T2 if the values P1 and T1 are known from an isotherm:
P 2 = e [ Q R ( 1 T 2 1 T 1 ) + ln ( P 1 ) ]
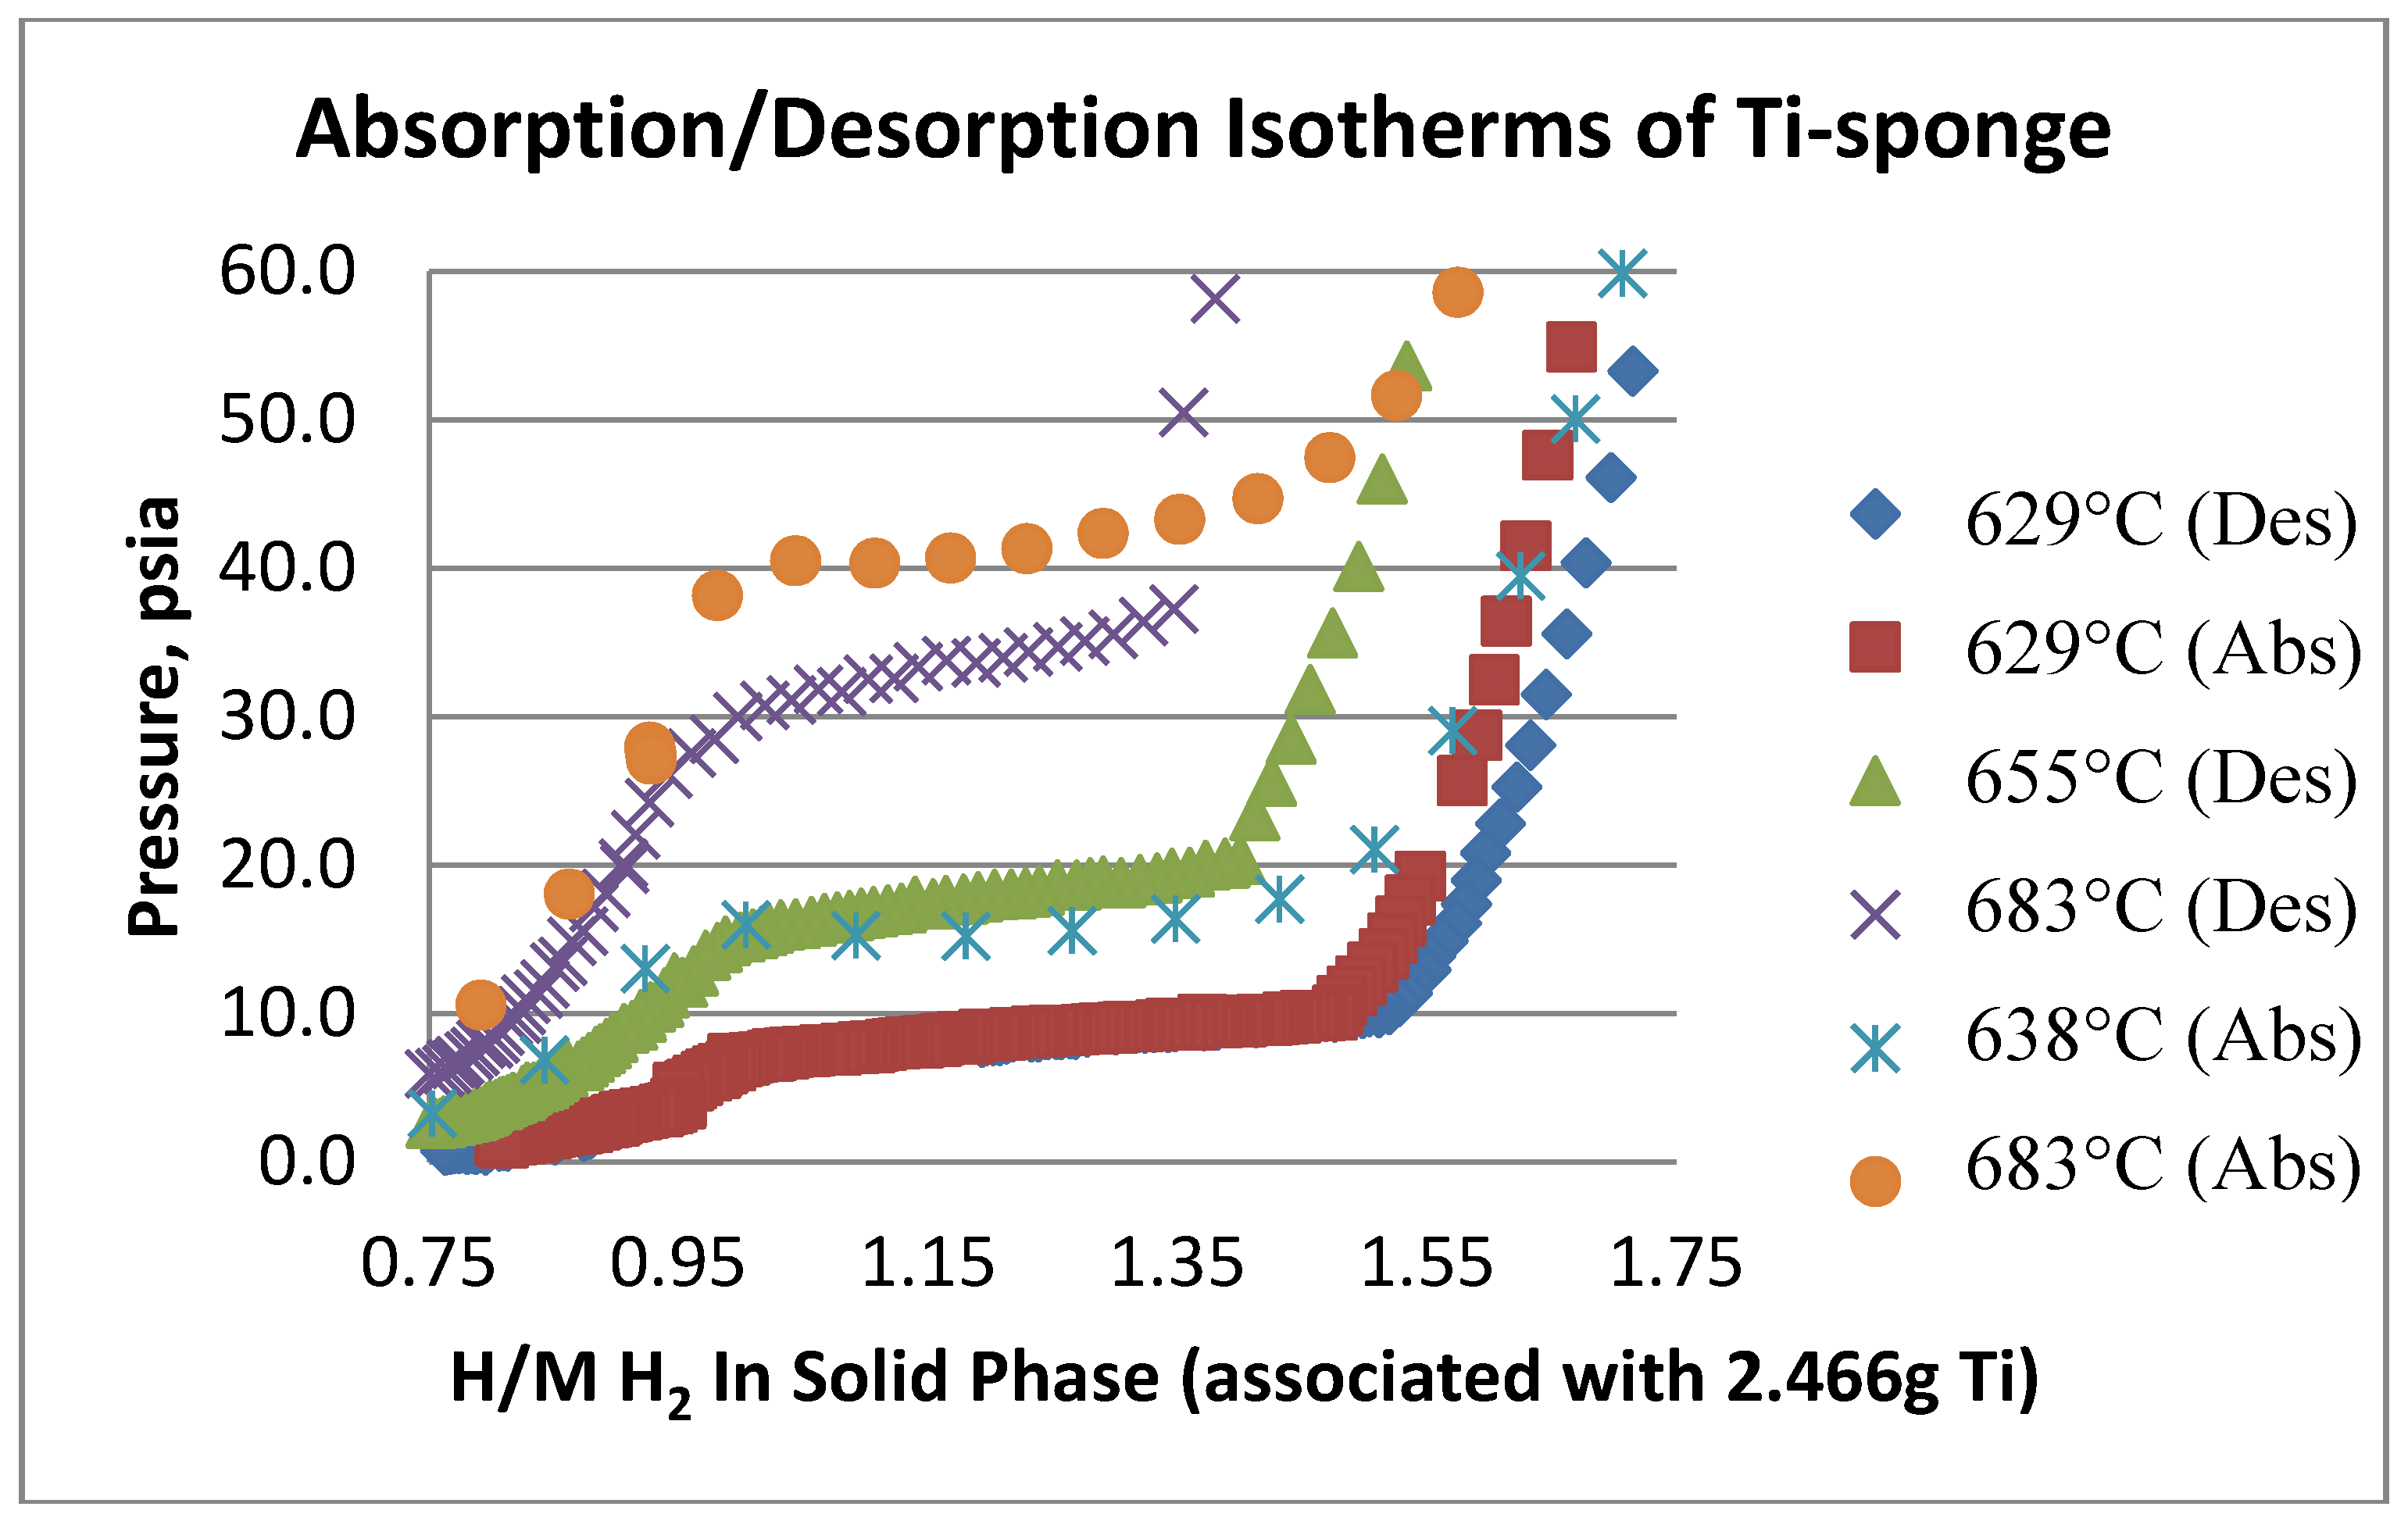
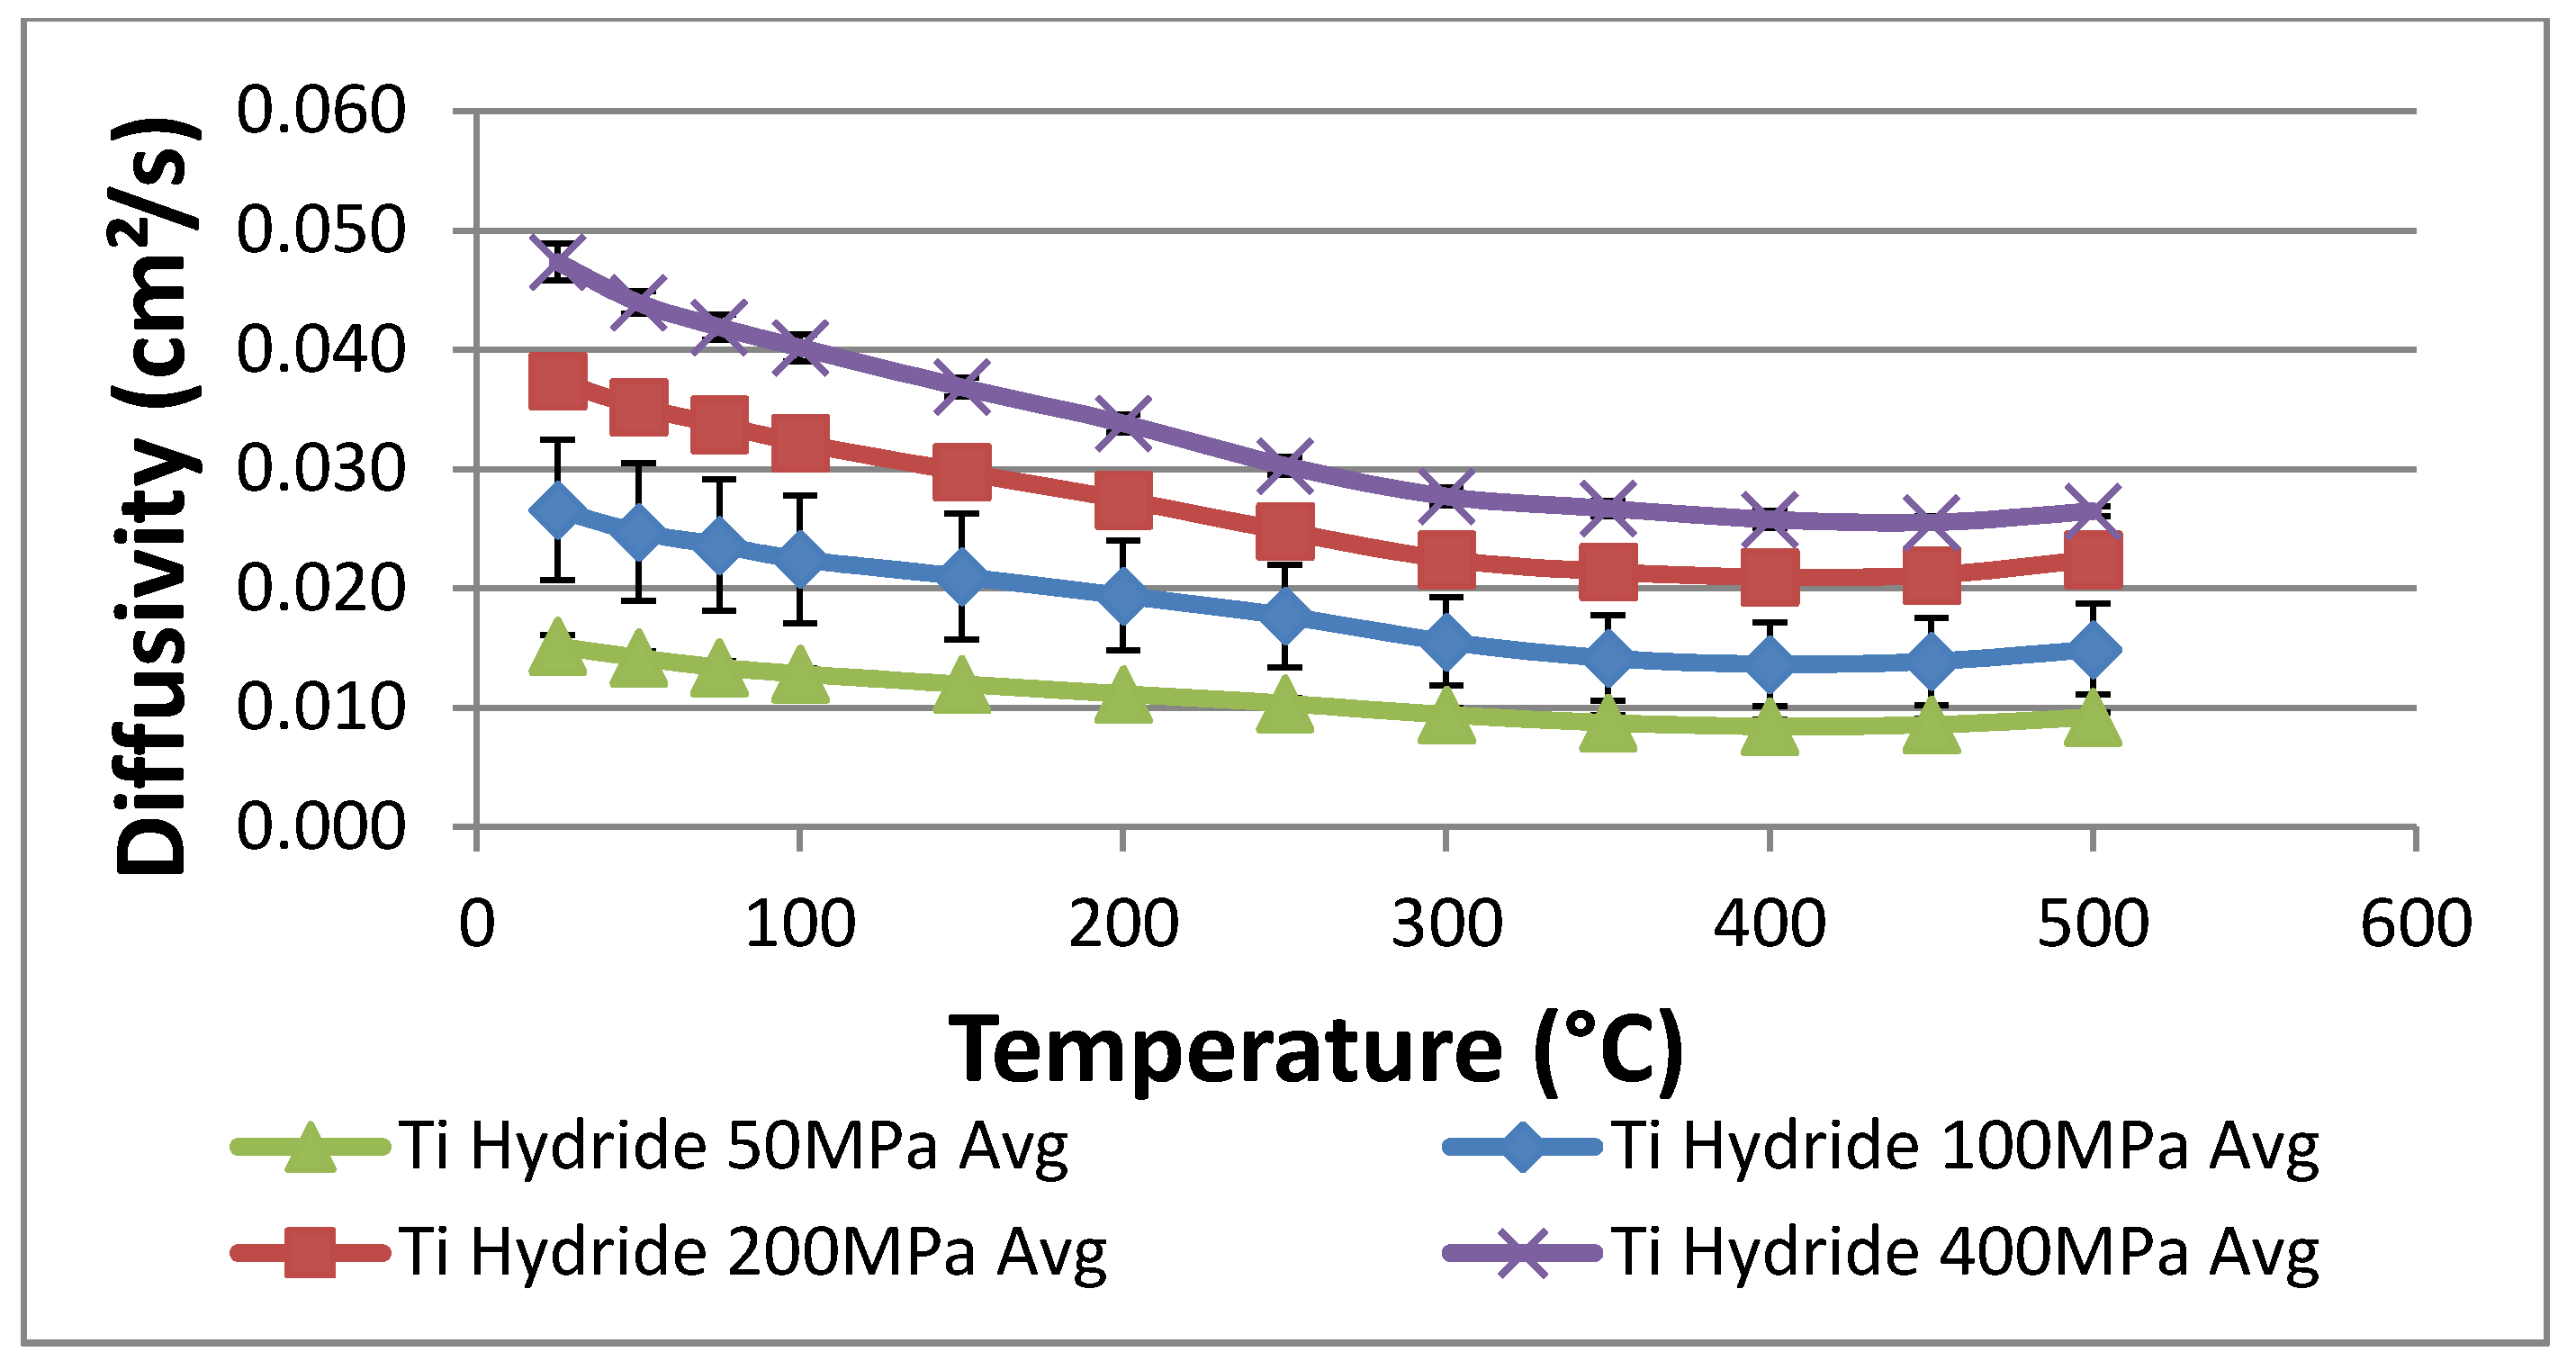
This expression requires an isotherm from which to extrapolate. For our modeling, we measured an isotherm for titanium hydride at 638 °C and then used these data to predict the variation with temperature of the hydrogen concentration in the hydride bed at a constant pressure of 1.10 atm (16.13 psia; 1.1 bar). This relationship was used in the subsequent modeling of the hydride beds. In addition to the uptake/release dependence on temperature, modeling of the hydride beds requires estimates for the hydride bulk density, thermal conductivity, heat capacity and the heat of reaction between hydrogen and titanium.
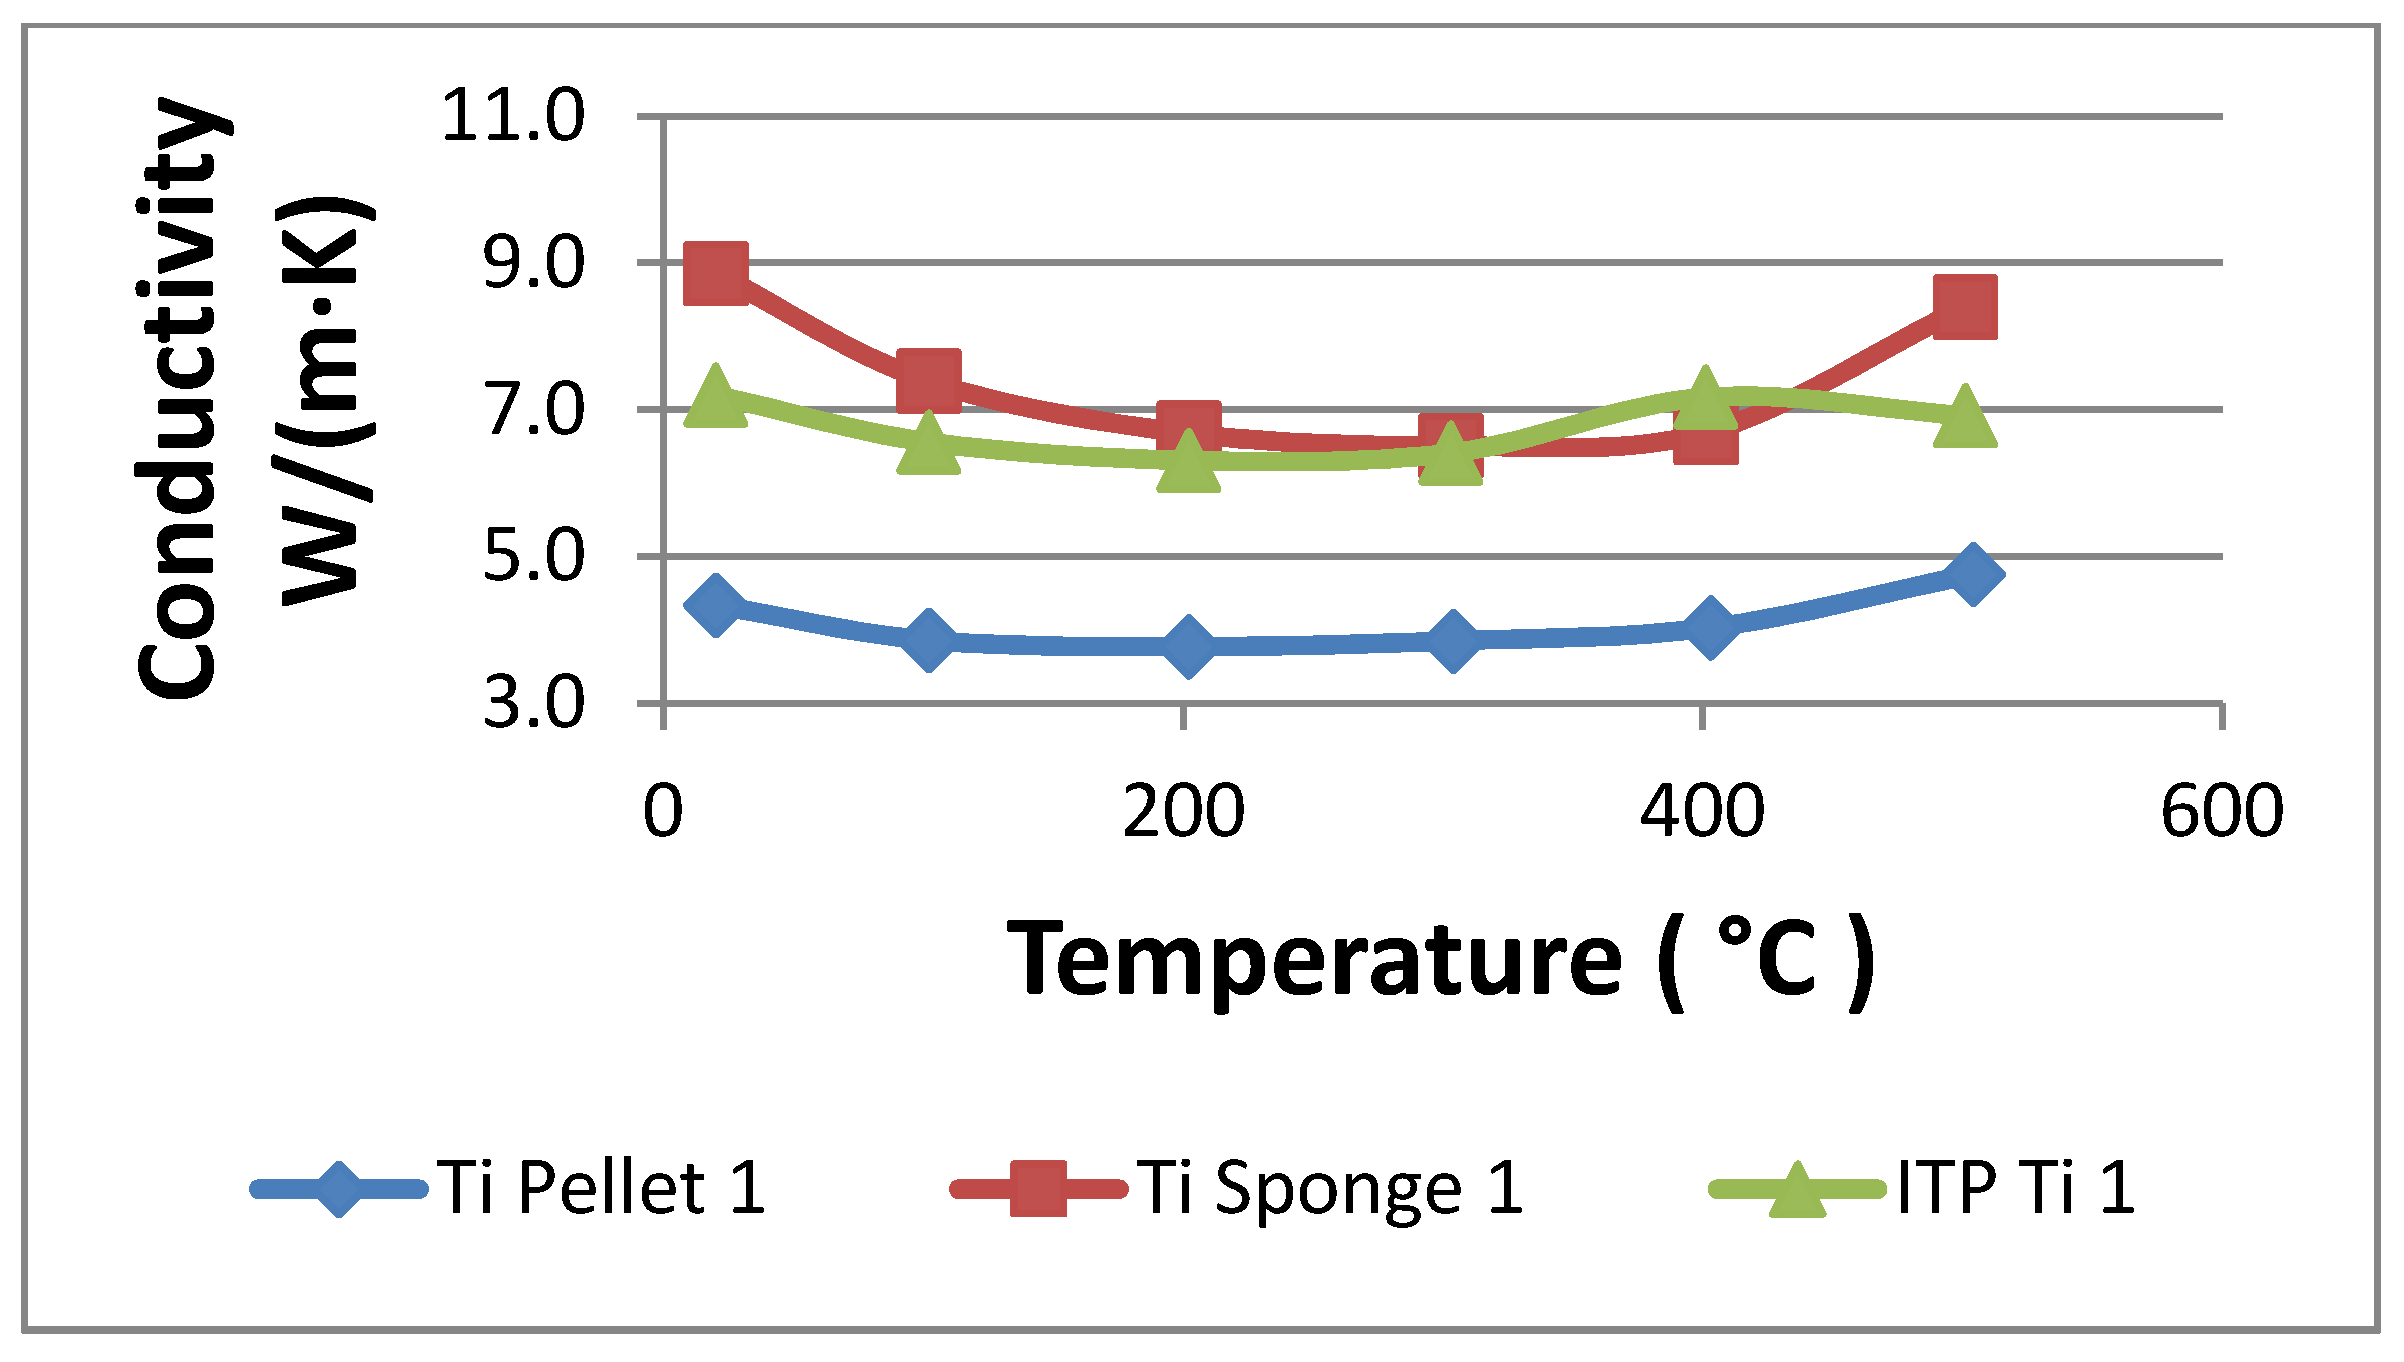
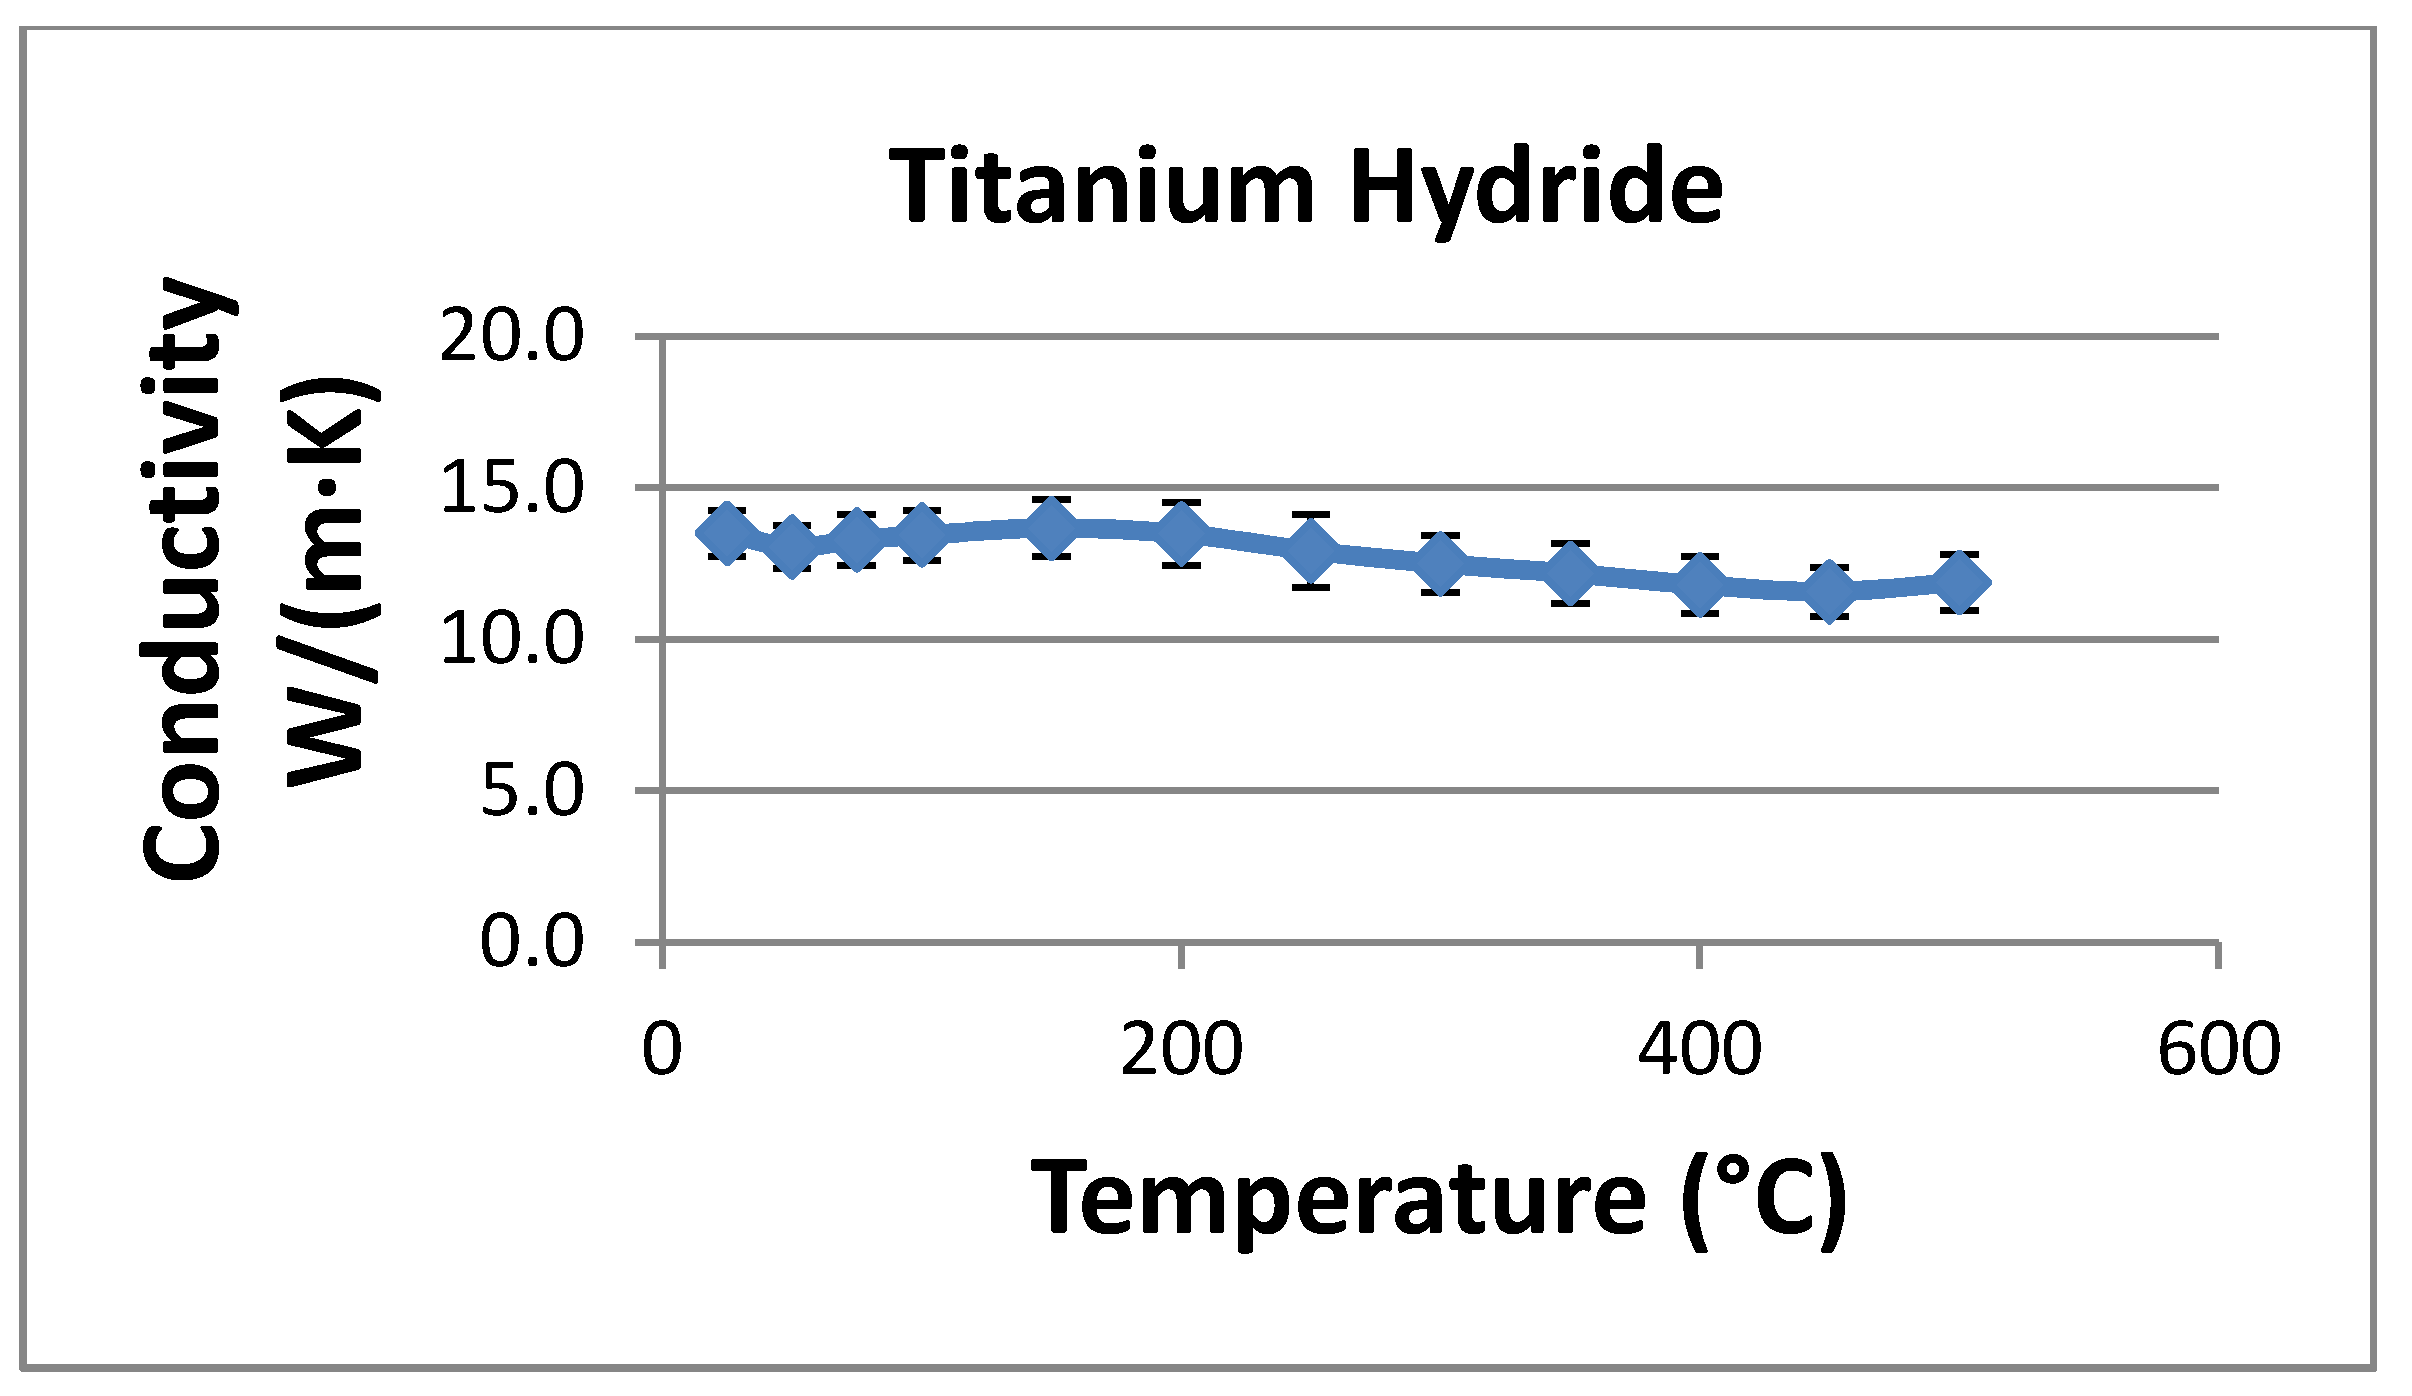
The powder density was taken to be 3038 kg/m3 based on the average measured density of the titanium pellets used in the laser flash experiments described previously. Heat capacity was set equal to 600 J/kgK based on literature values for titanium in the temperature range of interest (roughly 638 °C).
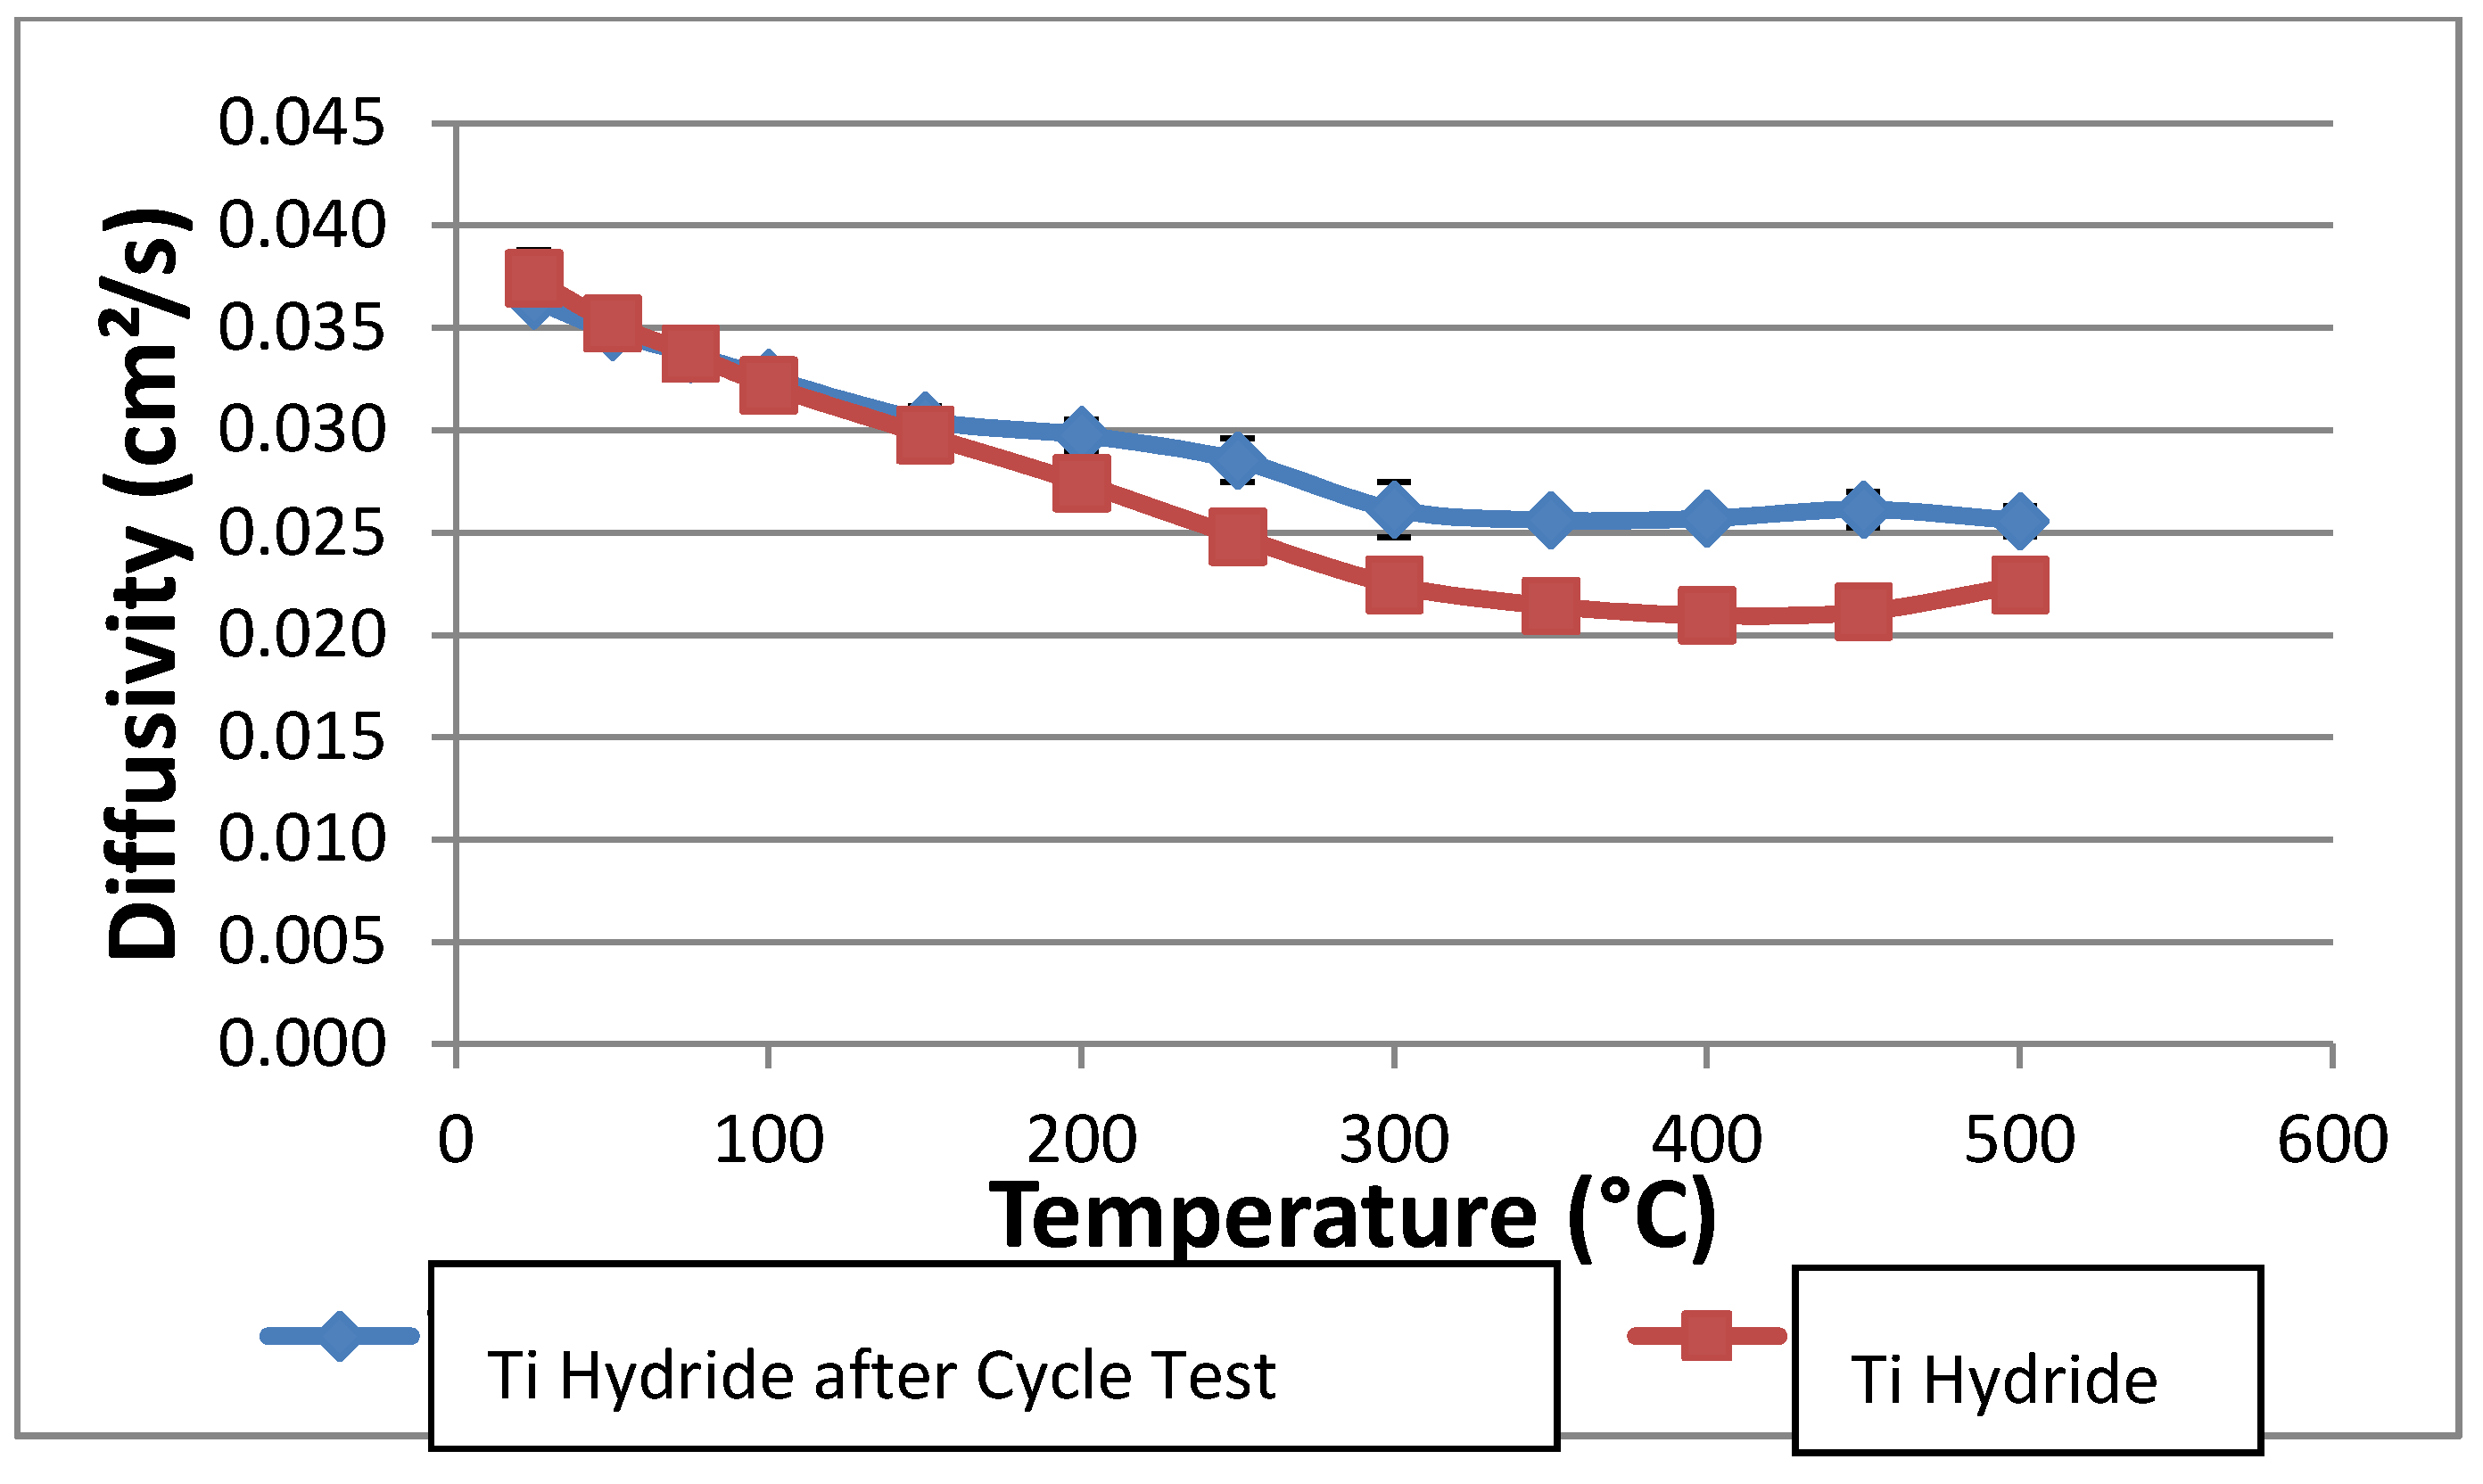
The thermal conductivity of the powder was set to 0.2 W/mK. This value is significantly lower than measured in the laser-flash experiments, but it is expected to reflect the reduced conductivity of a hydride bed after many thermal cycles. Repeated cycling may break up the hydride into relatively small (~2–20 microns) particles, and this effect will reduce the bulk thermal conductivity to between 0.1 and 0.4 W/mK. We measured the thermal conductivity after several cycles as described above without seeing a particle size reduction; however, the thermal conductivity reduction may not be pronounced until after several hundreds or thousands of cycles. Rather than rely on the higher thermal conductivities measured in the laser flash experiments, we chose to use a conservatively low bed thermal conductivity to ensure that the prototype system will meet the design objectives. The heat of reaction for hydrogen and titanium hydride varies somewhat with the fraction of hydrogen stored in the hydride. Data for the reaction enthalpy were correlated with stored hydrogen concentration and entered into the numerical model. Over the concentration range of interest, the heat of reaction varies between about 140 and 155 kJ per mole of H2 reacted.
The COMSOL models for the heat-storage prototypes were set up assuming radial symmetry within the device. COMSOL was used to solve the dynamic heat conduction equation with a simultaneous chemical reaction:
T/∂t = k/(ρCp) ((∂^2 T)/(∂r^2) + 1/rT/∂r) + 1/(ρCp) q(r,t)
where T is the local temperature, q is the heat generation rate from the hydride reaction, r is radial direction, t is time, k is the hydride powder thermal conductivity, r is the hydride bulk density and Cp is the hydride heat capacity.
The relevant boundary conditions for the model are: (1) no heat loss or gain from the ends of the cylinder; and (2) temperature changes of the outside cylindrical surface are specified numerically as a function of time as described in the text of the next section. The concentration of hydrogen bound in the hydride material was tracked as a function of radial position and time. At time = 0, the hydride was assumed to be fully saturated with hydrogen at the specified starting temperature and pressure. An outside wall temperature change was then applied sigmoidally over a 30-s duration, and the changes in radial temperature and hydrogen concentration profiles were tracked over time thereafter. Reaction kinetics were assumed fast compared to the relatively slow process of heat conduction through the hydride powder, so in the model, the local bound hydrogen concentration was set equal to its equilibrium value based on the local temperature and specified hydrogen gas pressure.

2.4.2. Modeling Results

Initial modeling efforts focused on predicting the rate of hydrogen release from cylindrical beds of hydride powder. For these calculations, the bed was initially assumed to be at 635 °C and loaded to 1.35 moles hydrogen per mole of titanium. At time = 0, the outside wall of the cylinder is rapidly heated to 645 °C, and hydrogen is released as progressively more of the bed is heated. With each mole of hydrogen released, however, approximately 150 kJ of heat is required to drive the reaction, so heating the bed proceeds much more slowly than it would if there were no reaction taking place. 
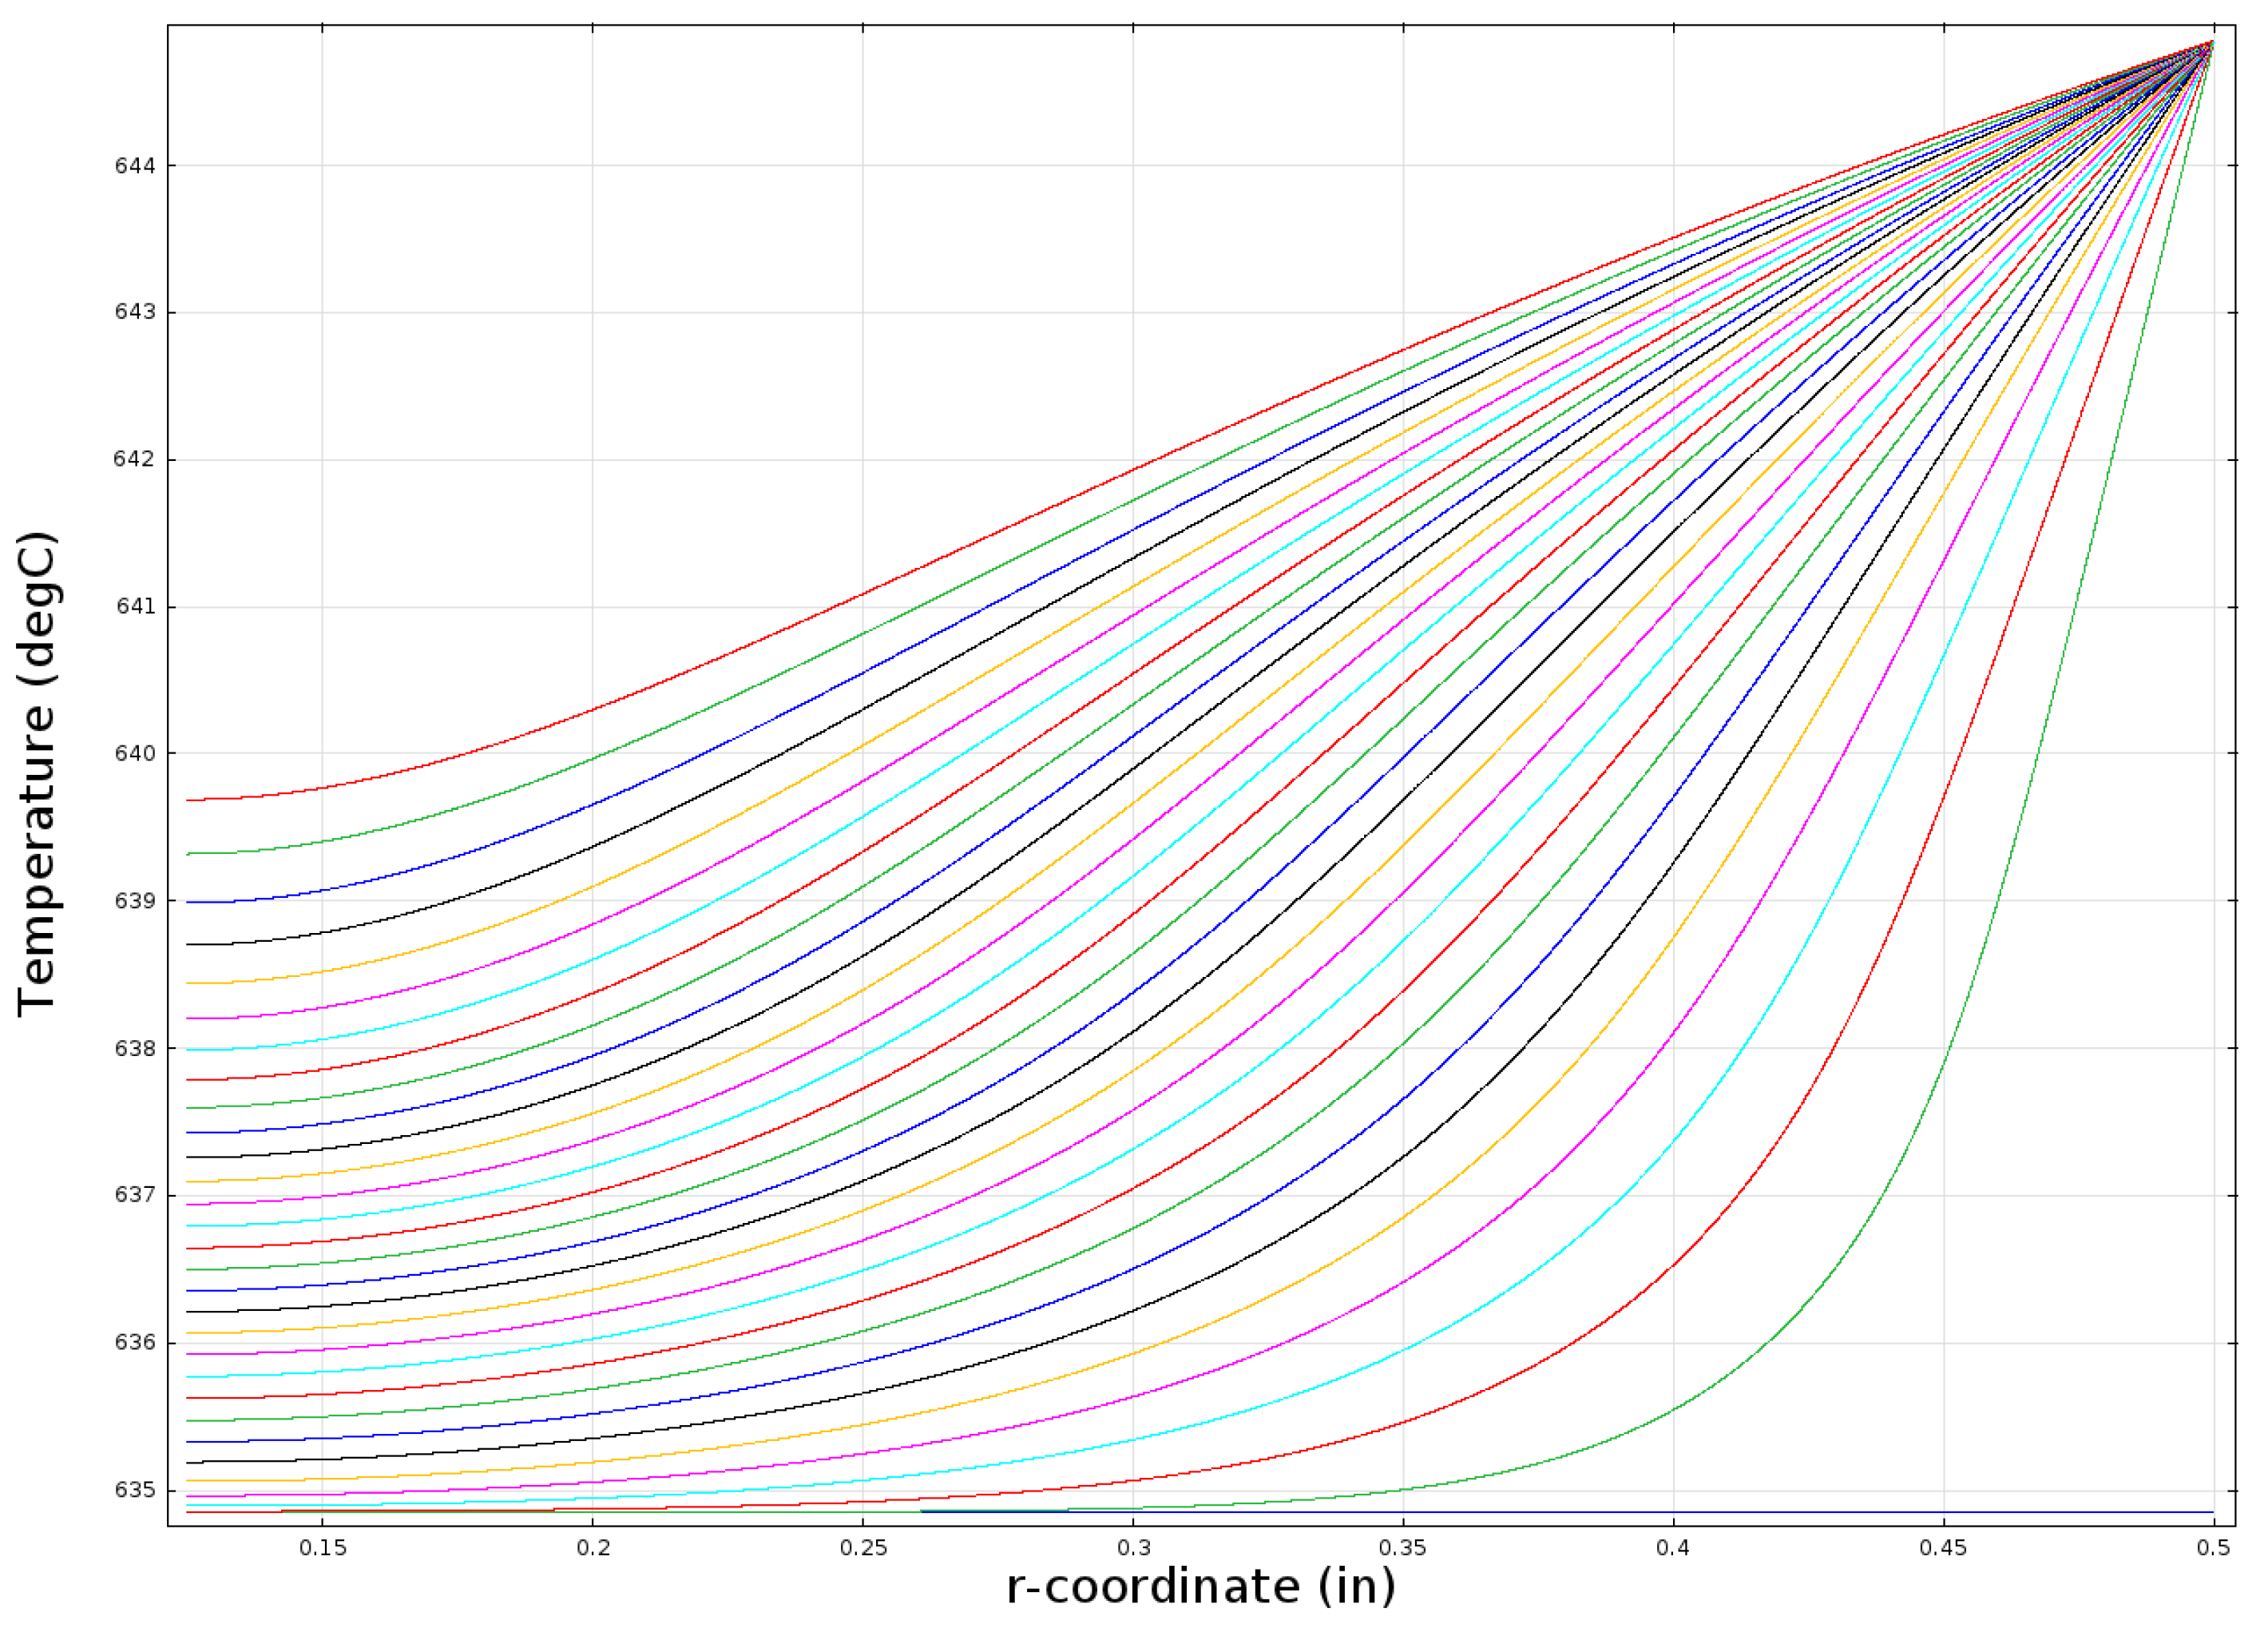
Figure 10 shows a series of radial temperature profiles within a one inch-diameter bed starting with the blue line at the bottom for time = 0 (Tinit = 634.85 °C = 908 K) and then moving from right to left with each successive line representing 20 min of elapsed time. The left-most line (colored red) indicates the temperature profile after 10 h. The r-coordinate in the graph starts at 3.2 mm because the bed geometry is assumed to include a 6.4-mm (0.25-in) outside diameter, porous metal tube that is included to facilitate the addition and removal of hydrogen. 
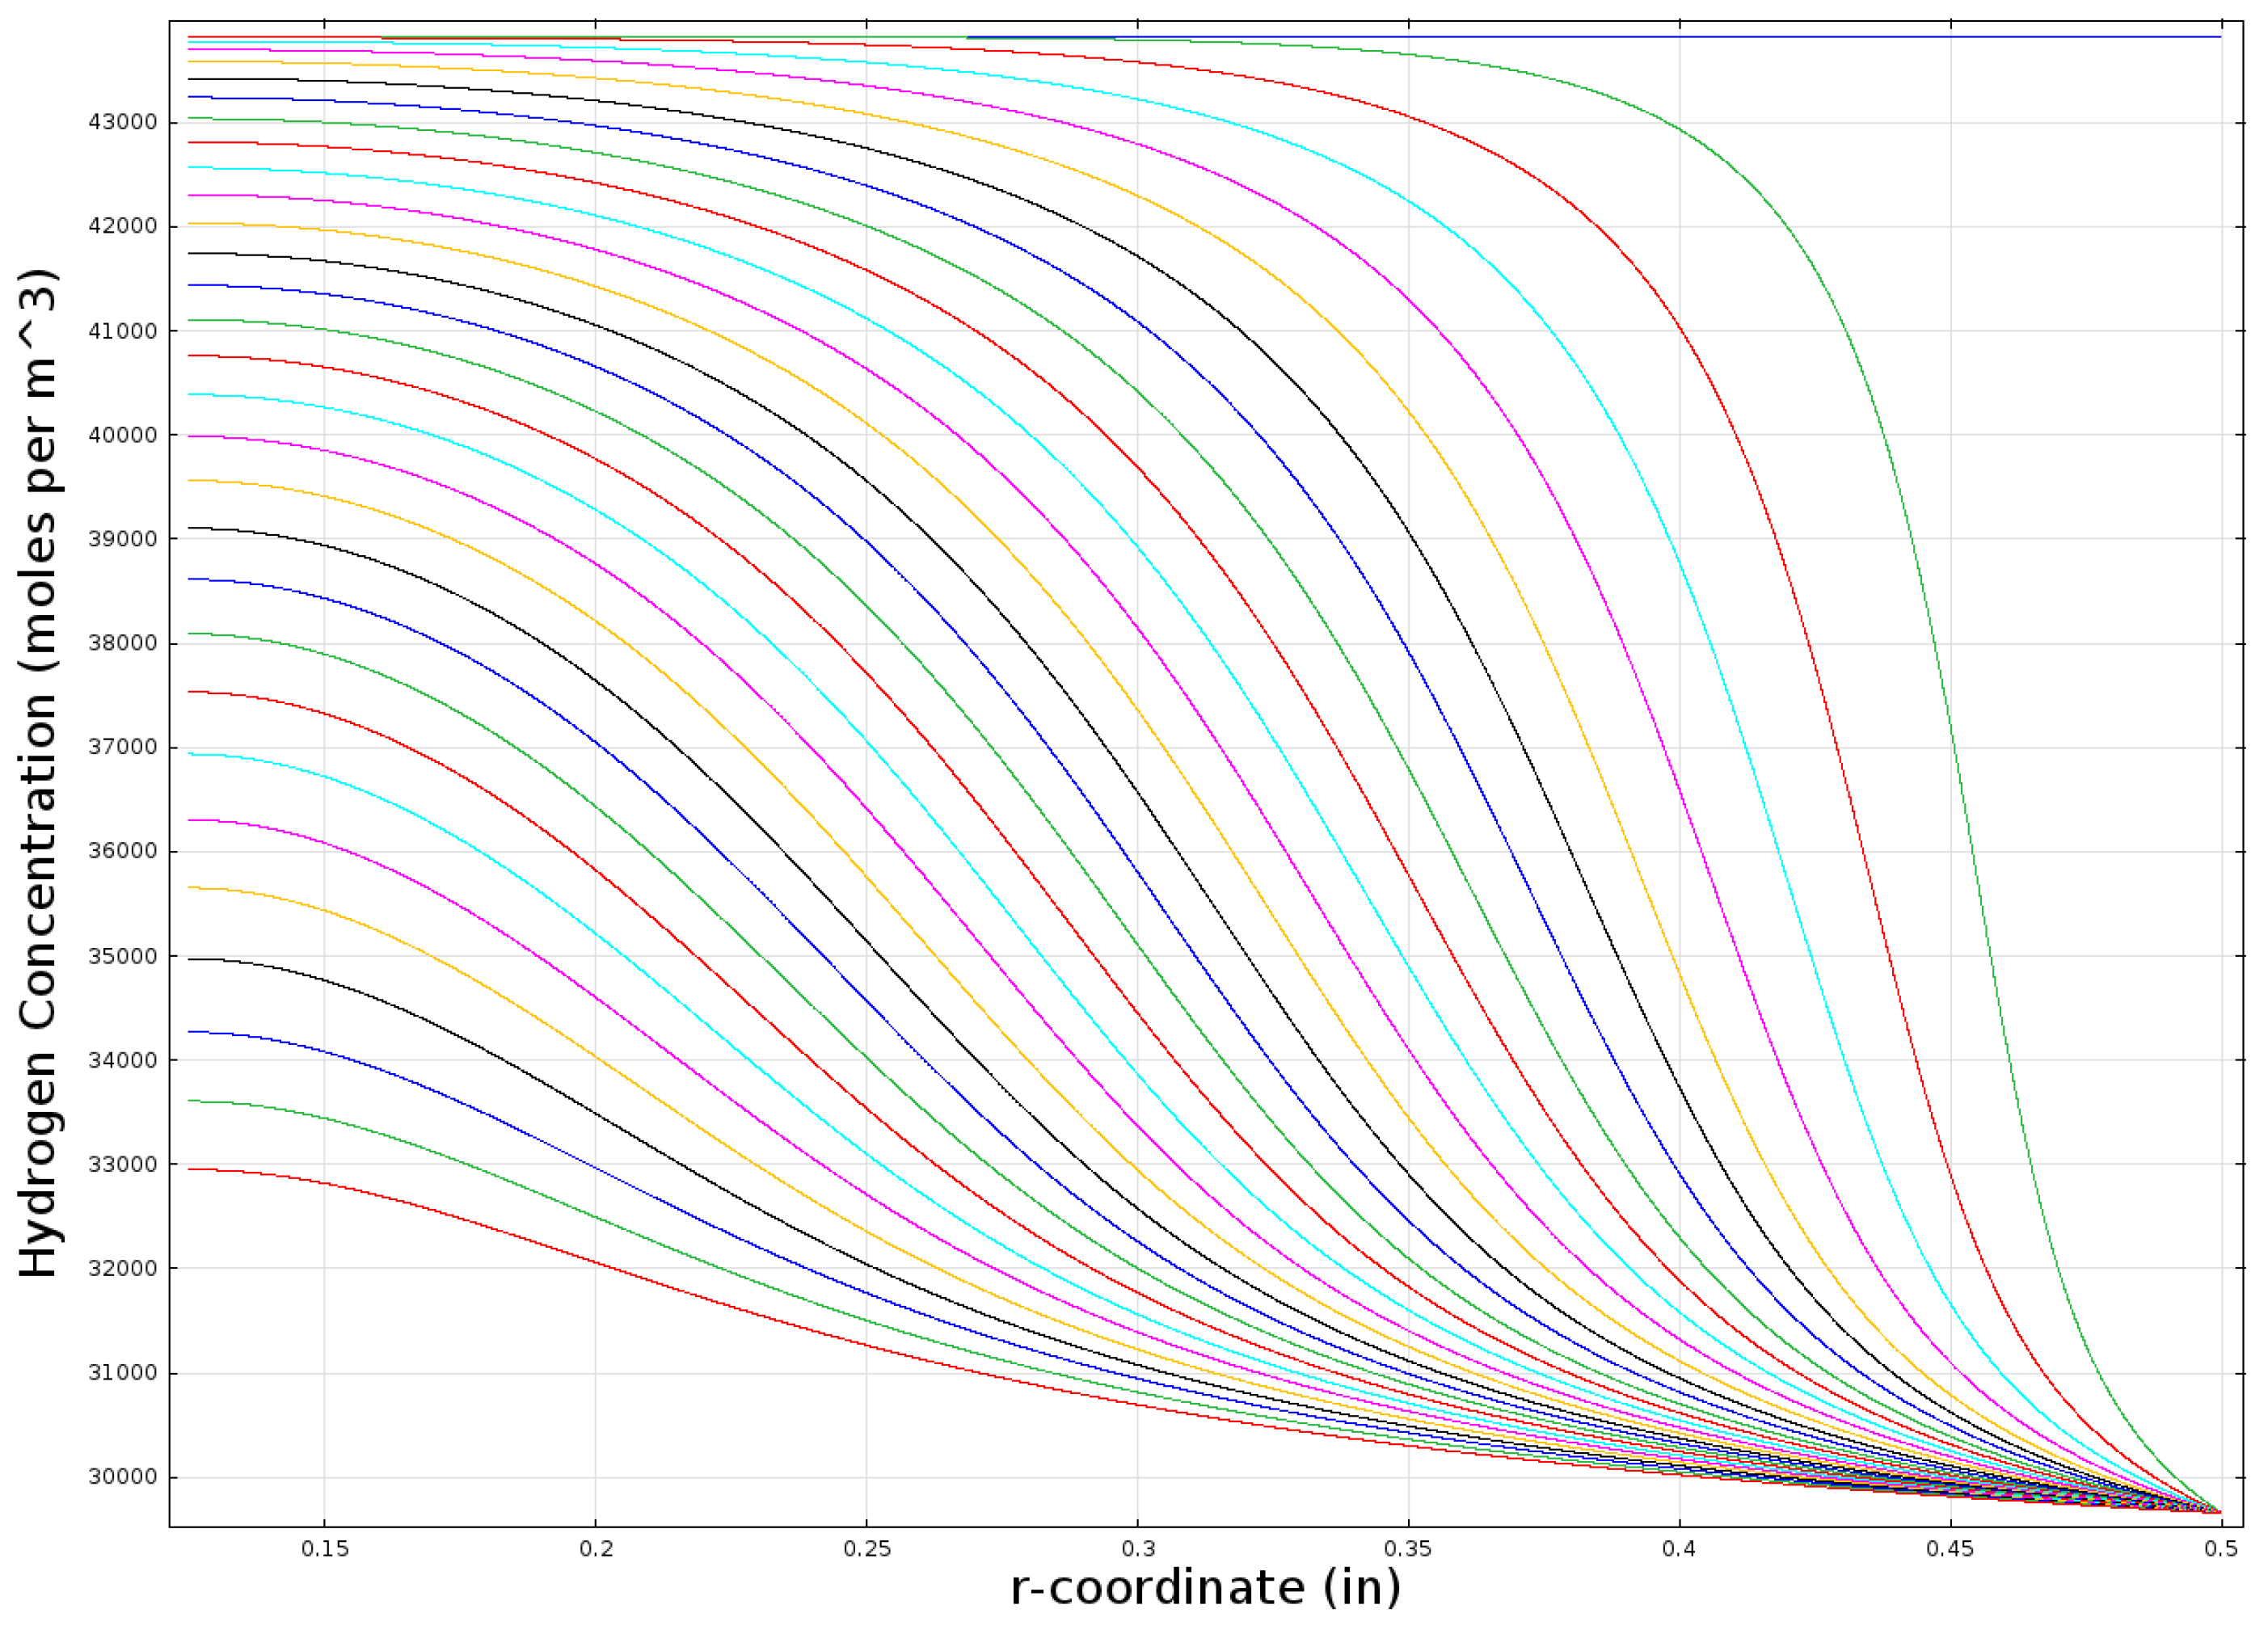
Figure 11 shows a similar plot for the hydrogen concentration within the bed.
Figure 10. Modeled temperature profile in a one inch-diameter cylindrical bed (k = 0.2 W/mK).
Energies 08 08406 g010
Figure 11. Modeled hydrogen concentration profile in a one inch-diameter cylindrical bed (k = 0.2 W/mK).
Energies 08 08406 g011
The heat-storage prototype is designed with the assumption that the bed is cycled once per day with approximately 6 h of hydrogen loading, 6 h of thermal equilibration, 6 h of unloading and, then, six more hours of thermal equilibration. The one inch-diameter bed still contains a substantial fraction of its loaded hydrogen after 6 h of heating, so the one inch diameter is likely a bit larger than we desire for our prototype system. 
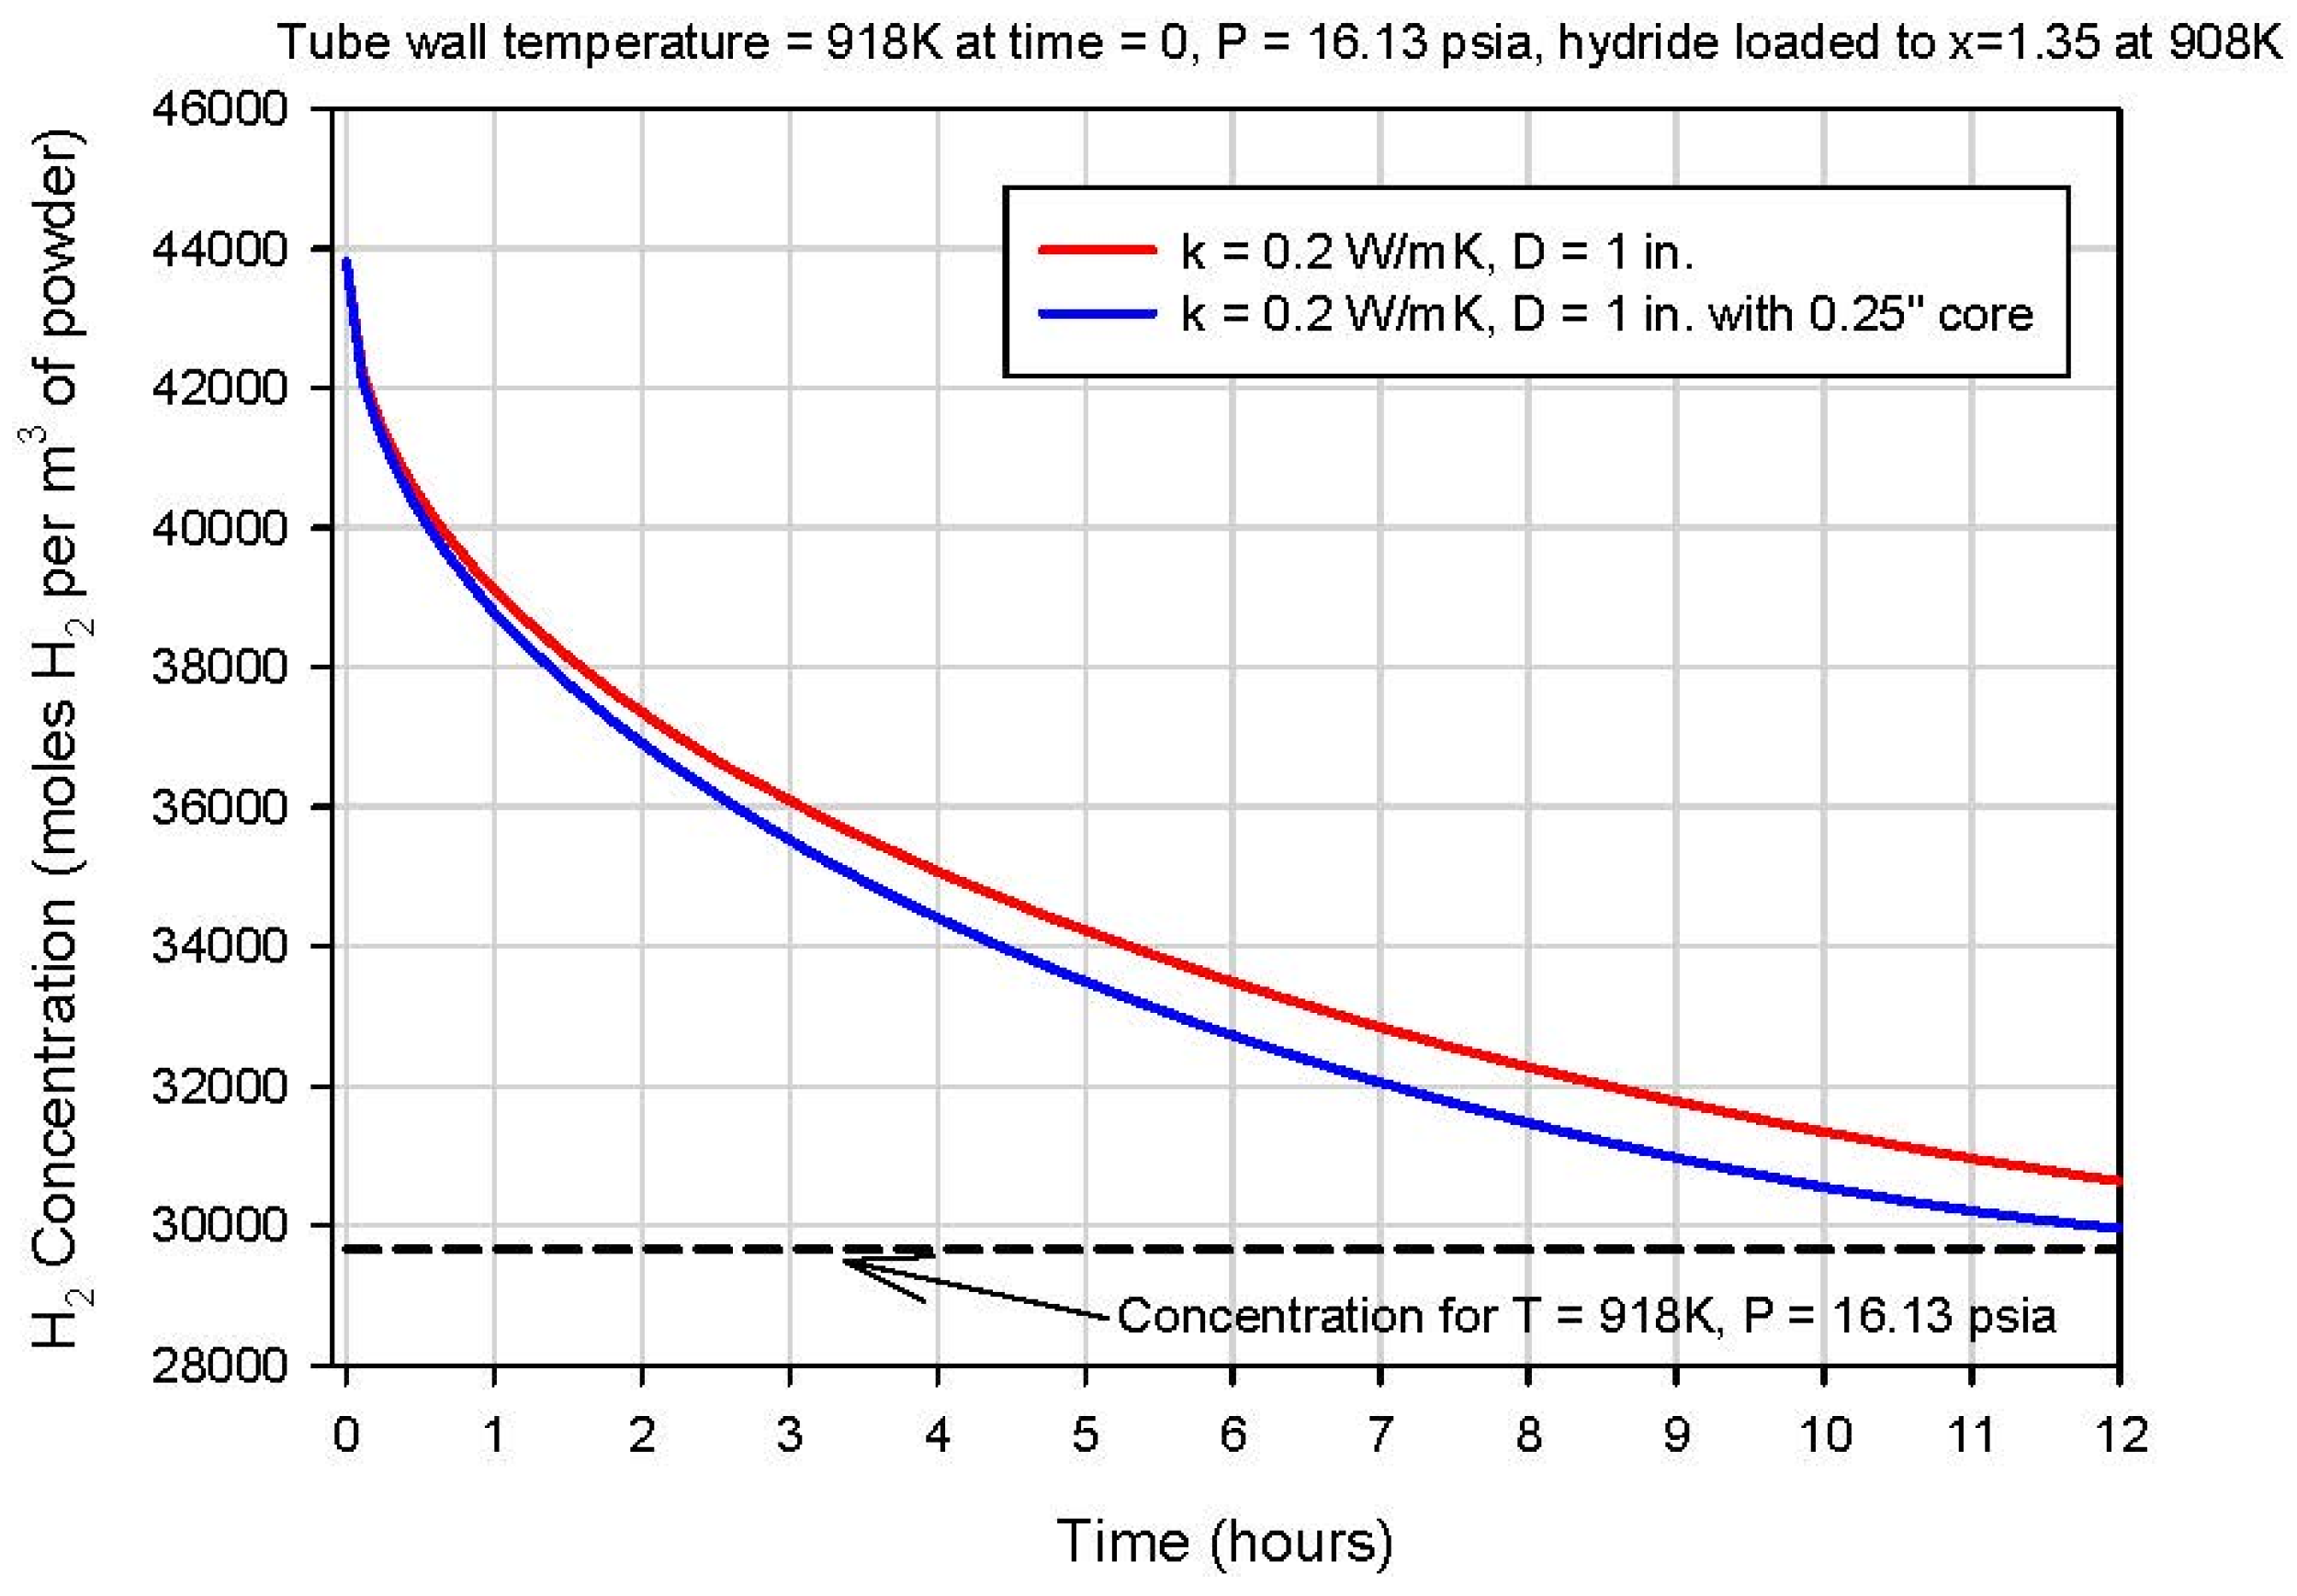
Figure 12 shows the averaged hydrogen concentration within the bed as a function of time for a bed with and without the central 6.4 mm (0.25 in)-diameter porous metal core. Roughly 10 h is required to reduce the hydrogen concentration to about 10% of its initial value. Similar simulations were run for alternative tube diameters, and the hydrogen-release time was found to scale approximately with the square of the tube diameter. A bed diameter of approximately 1.9 cm (0.75 in) yields a hydrogen release time of about 6 h, which is the nominal target for the demonstration system.
Figure 12. Modeled average hydrogen concentration in the hydride bed vs. time for a one-inch diameter.
Energies 08 08406 g012
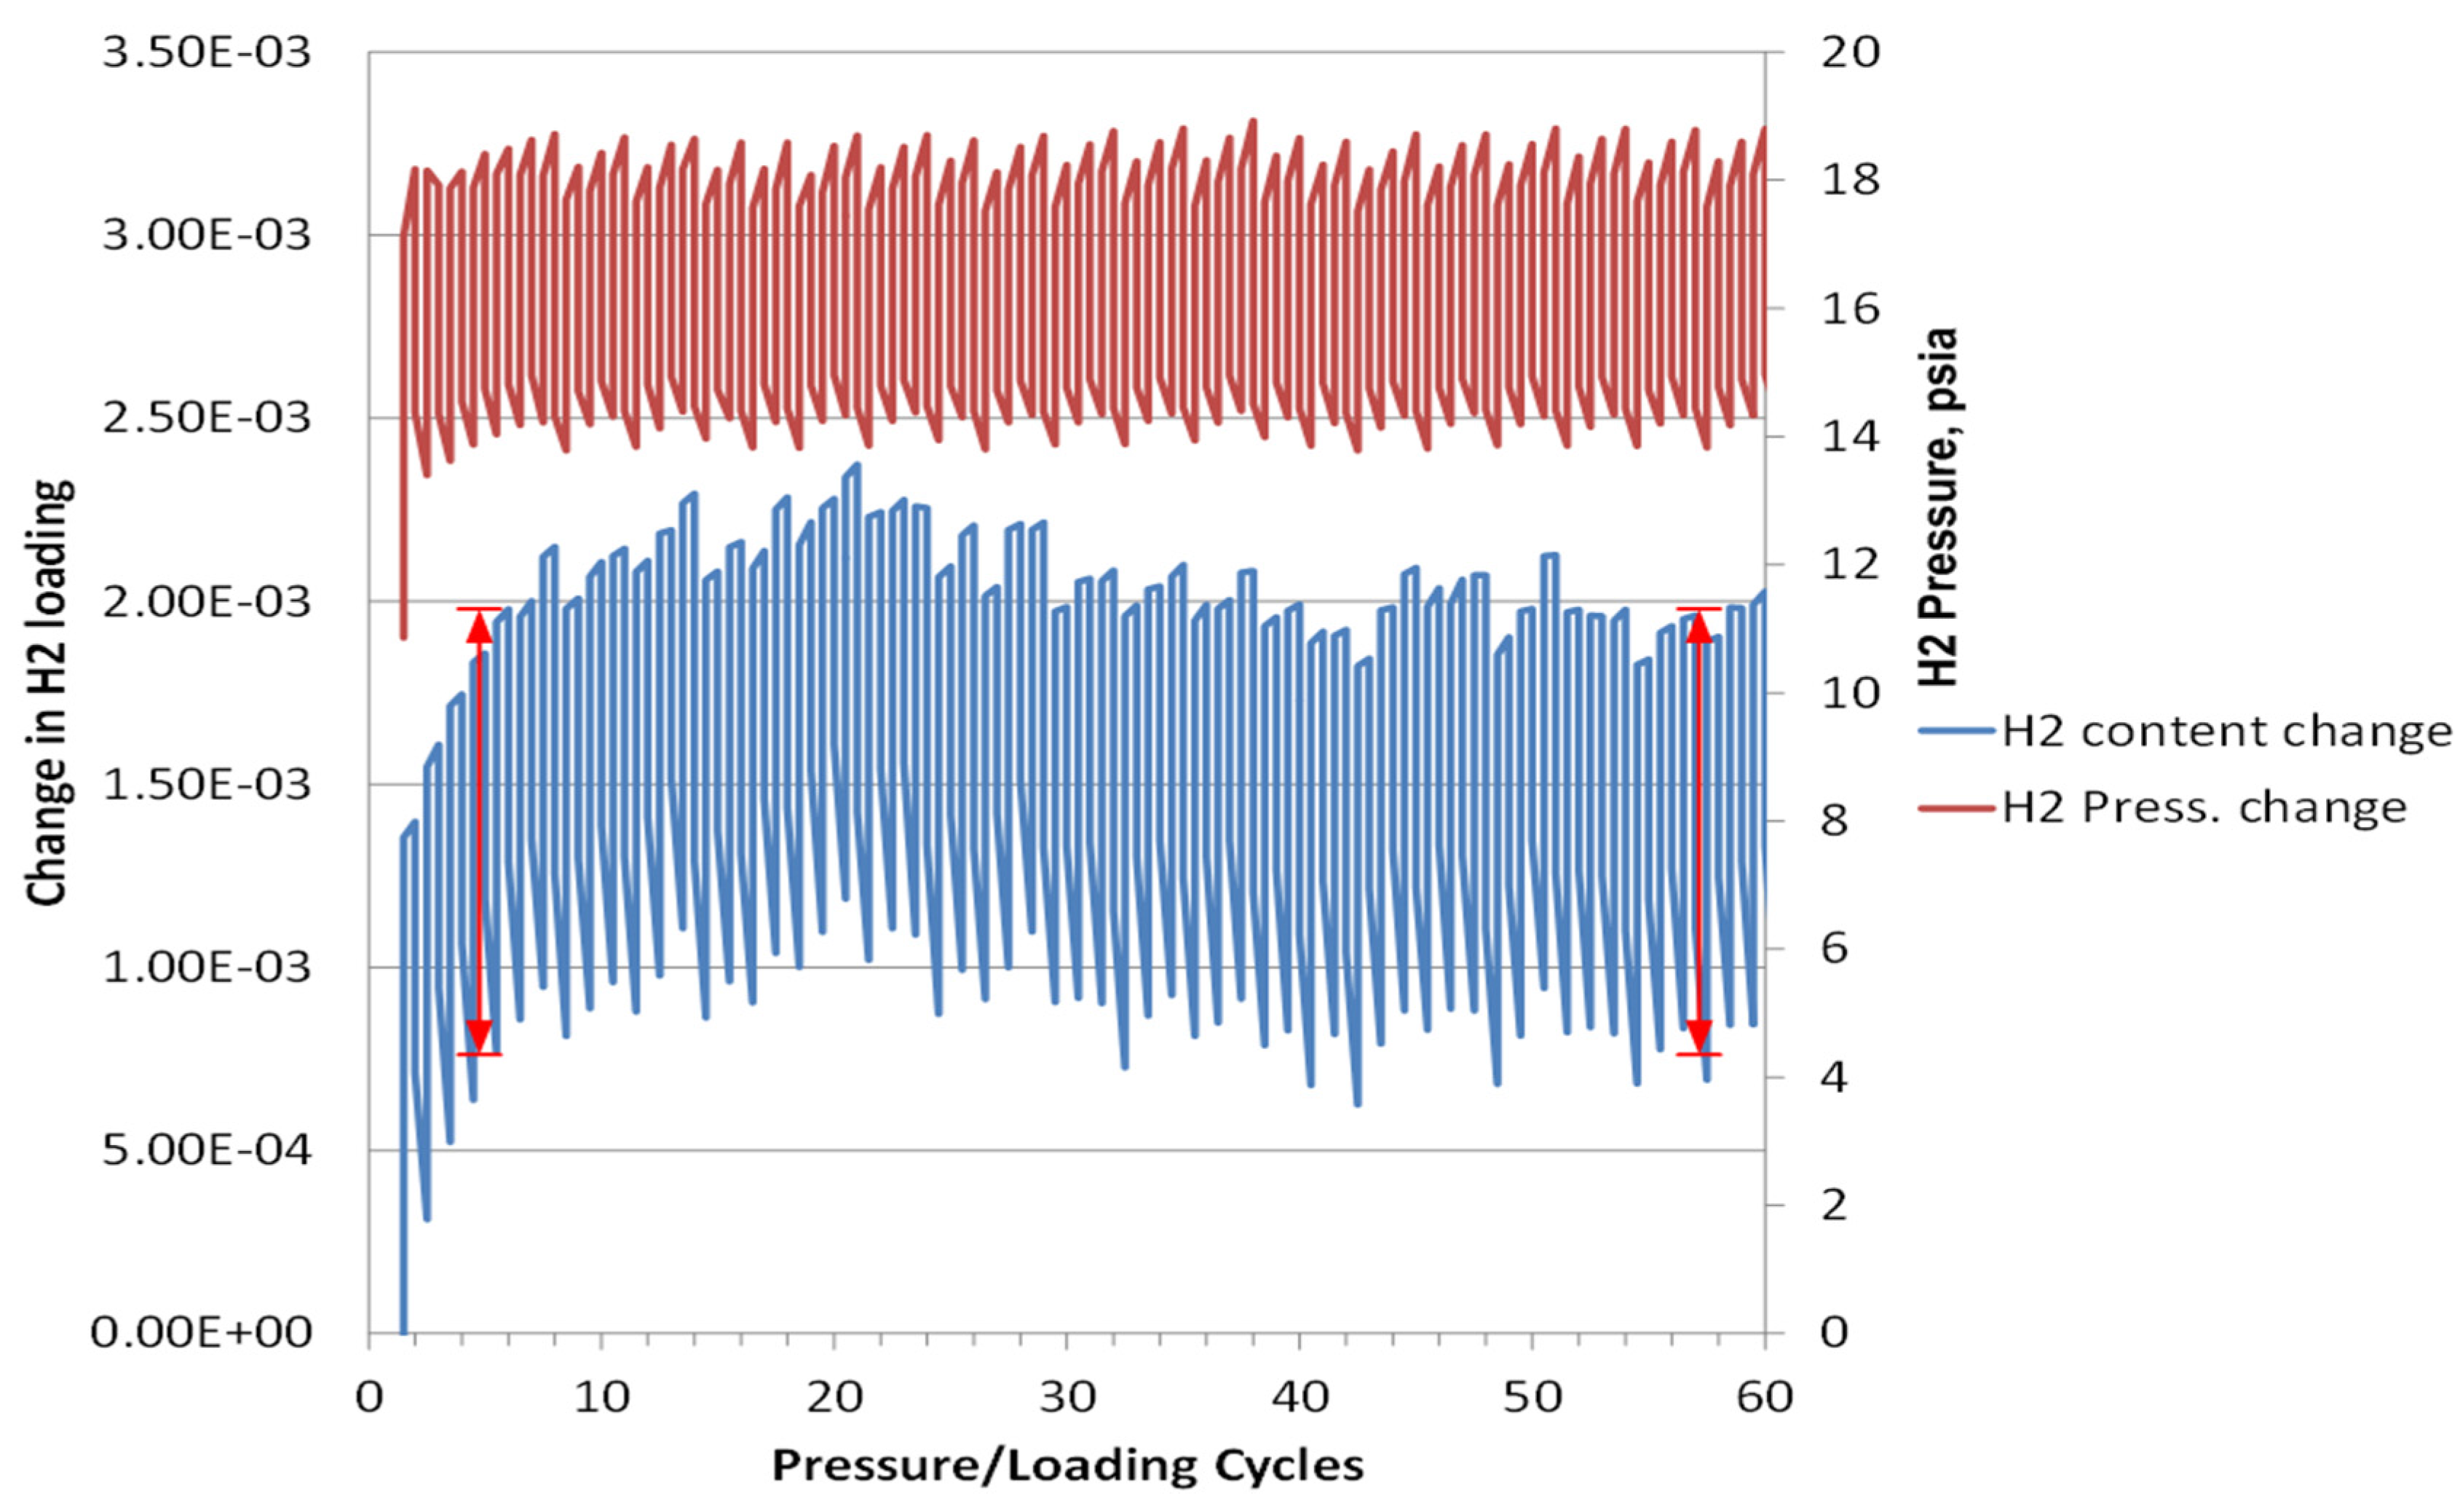
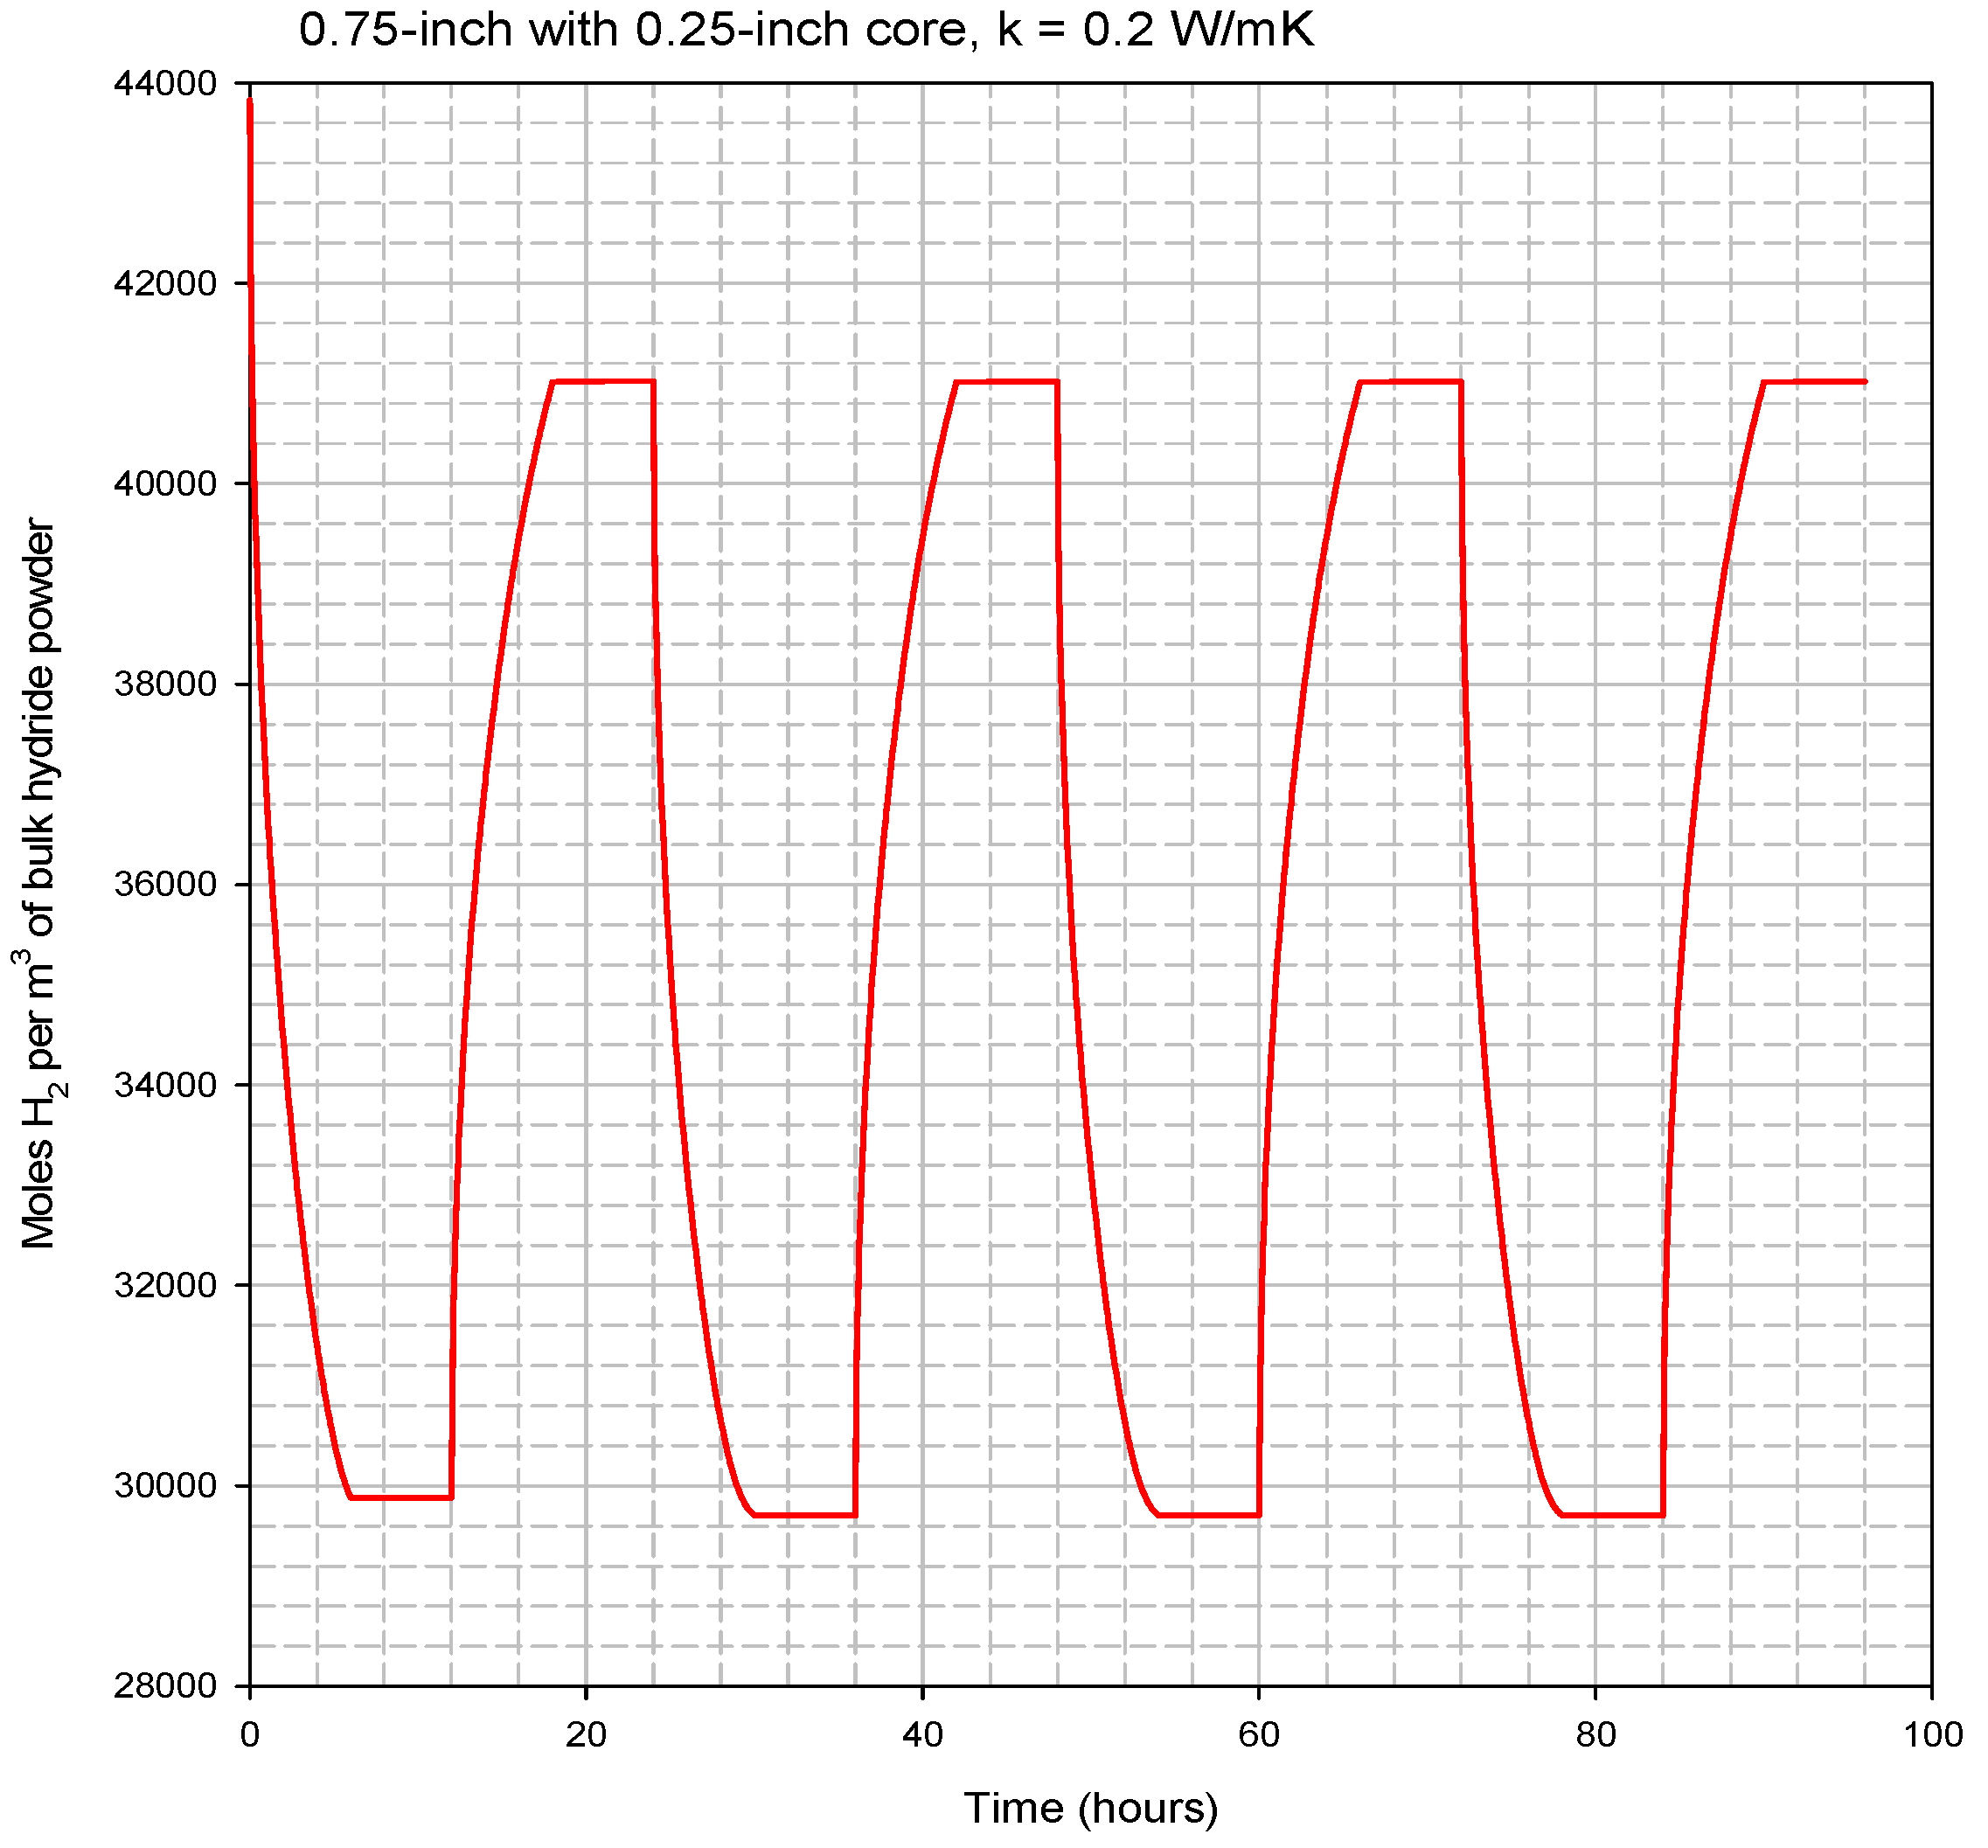
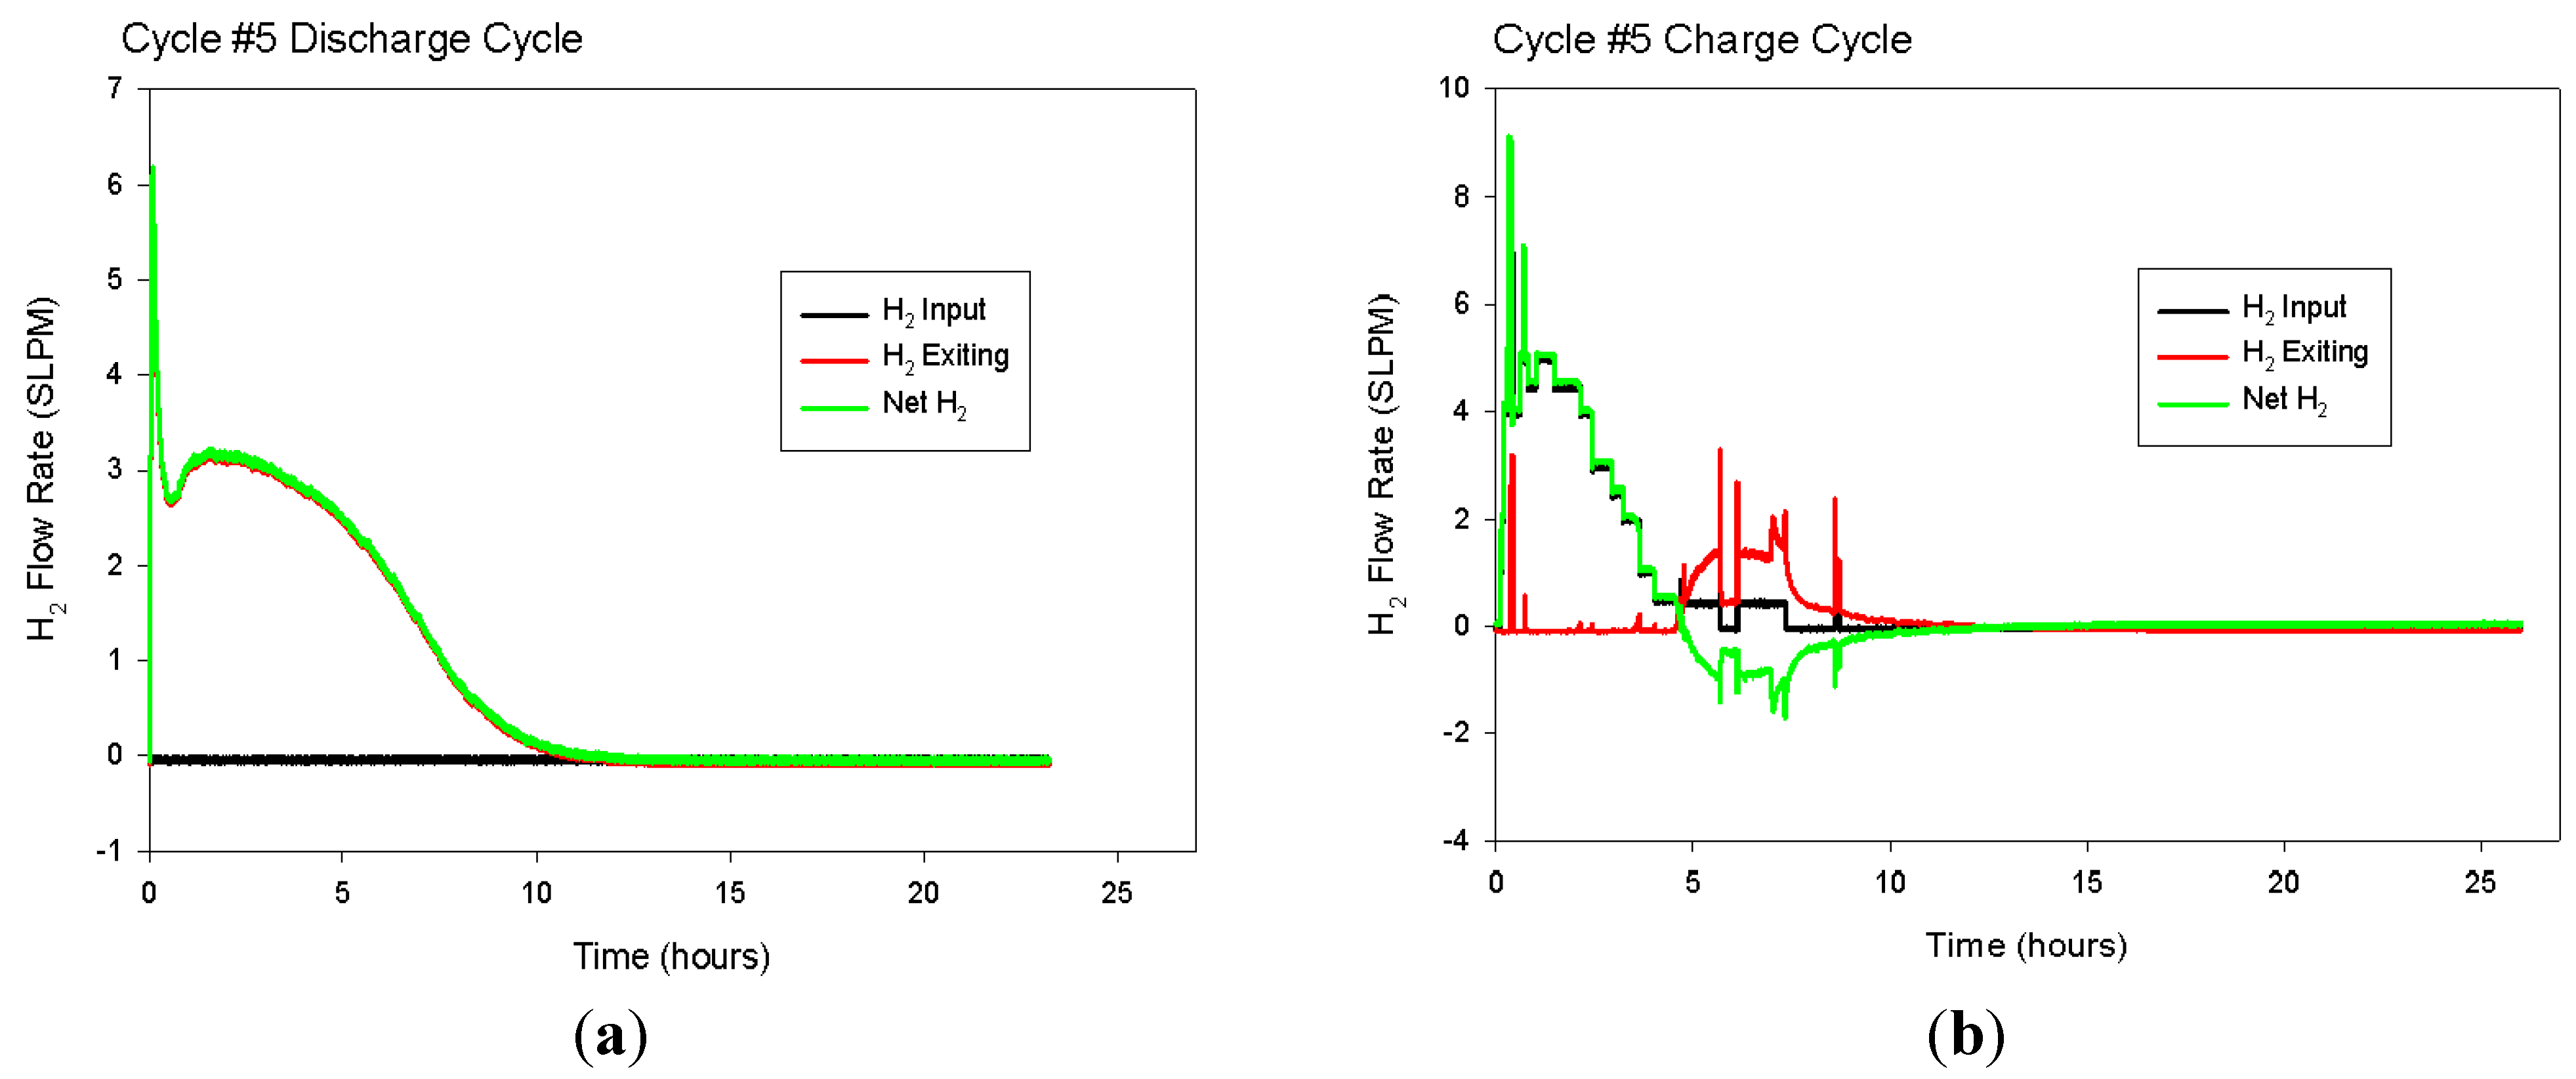
Multiple load/unload cycles were simulated for the 1.9 cm (0.75 in)-diameter hydride bed with a 0.63 cm (0.25 in)-diameter porous tube along its axis. The hydride was assumed to be loaded to 1.35 moles of hydrogen atoms per mole of titanium atoms. This condition represents the maximum expected loading at 635 °C and 16.13 psia. At time = 0, the exterior wall of the cylinder is assumed to be heated to 645 °C and held constant for the next 6 h, while hydrogen is released and the gas pressure in the bed is held constant at 1.1 atm (16.13 psia). At time = 6 h, the heat flow into the bed is stopped, and the bed is allowed to come to thermal equilibrium until time = 12 h. At time = 12 h, the exterior wall of the cylinder is decreased back to 635 °C. Between time = 12 h and time = 18 h, the hydrogen concentration in the bed increases as the bed is cooled as it delivers stored heat and hydrogen gas is supplied from an external source at 1.1 atm. Finally, between time = 18 h and time = 24 h, the heat flow out of the bed is stopped, and the bed is allowed to come to thermal equilibrium. The cycle is then repeated starting at time = 24 h, when the exterior wall is again heated to 645 °C.
During each 24-h cycle, the applied exterior-wall temperature swings between 635 °C and 645 °C. This 10-degree temperature swing is only half of the 20-degree swing available for the prototype system. We limited the temperature swing in the model to 10 degrees to ensure that there is adequate temperature driving force available between the heating/cooling fluid and the exterior surface of the hydride bed. The 10-degree driving force should be sufficient for gas-phase convective heating/cooling of the hydride bed. Figure 11 shows the results for cylinders ranging in size from 10 cm (4 in)–15 cm (6 in). In all cases, we assumed that there is a 1.3-cm (0.5 in) porous-metal tube in the center of the bed to facilitate the addition and removal of hydrogen gas.
The 12.7 cm (5 in)-diameter cylinder is predicted to yield roughly 90% hydrogen release after the targeted 6 h of heating, so the performance of a cylinder with this diameter was simulated for four complete 24-h cycles. Figure 12 shows the predicted volume-averaged hydrogen concentration inside the bed during all four cycles. Then, much less than a 10-degree temperature driving force will be needed, and the hydride bed performance will be better than predicted by our modeling results.
Figure 13 shows the volume-averaged concentration of hydrogen in the bed for four complete load/unload cycles. After the first couple of cycles, the high and low bed concentrations stabilize for all subsequent cycles at 41.02 and 29.71 moles H2 per liter of bed volume. To store 3 kWh of heat during every 24-h cycle, about 72 moles of H2 must be loaded and unloaded. Each mole of H2 represents roughly 150 kJ (41.7 Wh) of heat, because the heat of reaction is 150 kJ/mole. The total required bed volume can be estimated by dividing the required 72 moles of H2 by the difference between high and low bed H2 concentrations (41.02 − 29.71 = 11.31 moles per liter). The result is an estimated required hydride volume of 6.36 liters. If each hydride bed is 46 cm (18 in) long and 1.9 cm (0.75 in) in diameter with a 0.63 cm (0.25 in)-diameter porous tube along the axis, then a total of 55 such tubes will be required to achieve the targeted 3 kWh of heat storage per cycle.
Figure 13. Modeled four complete cycles for the 1.9 cm (0.75 in)-diameter hydride bed.
Energies 08 08406 g013
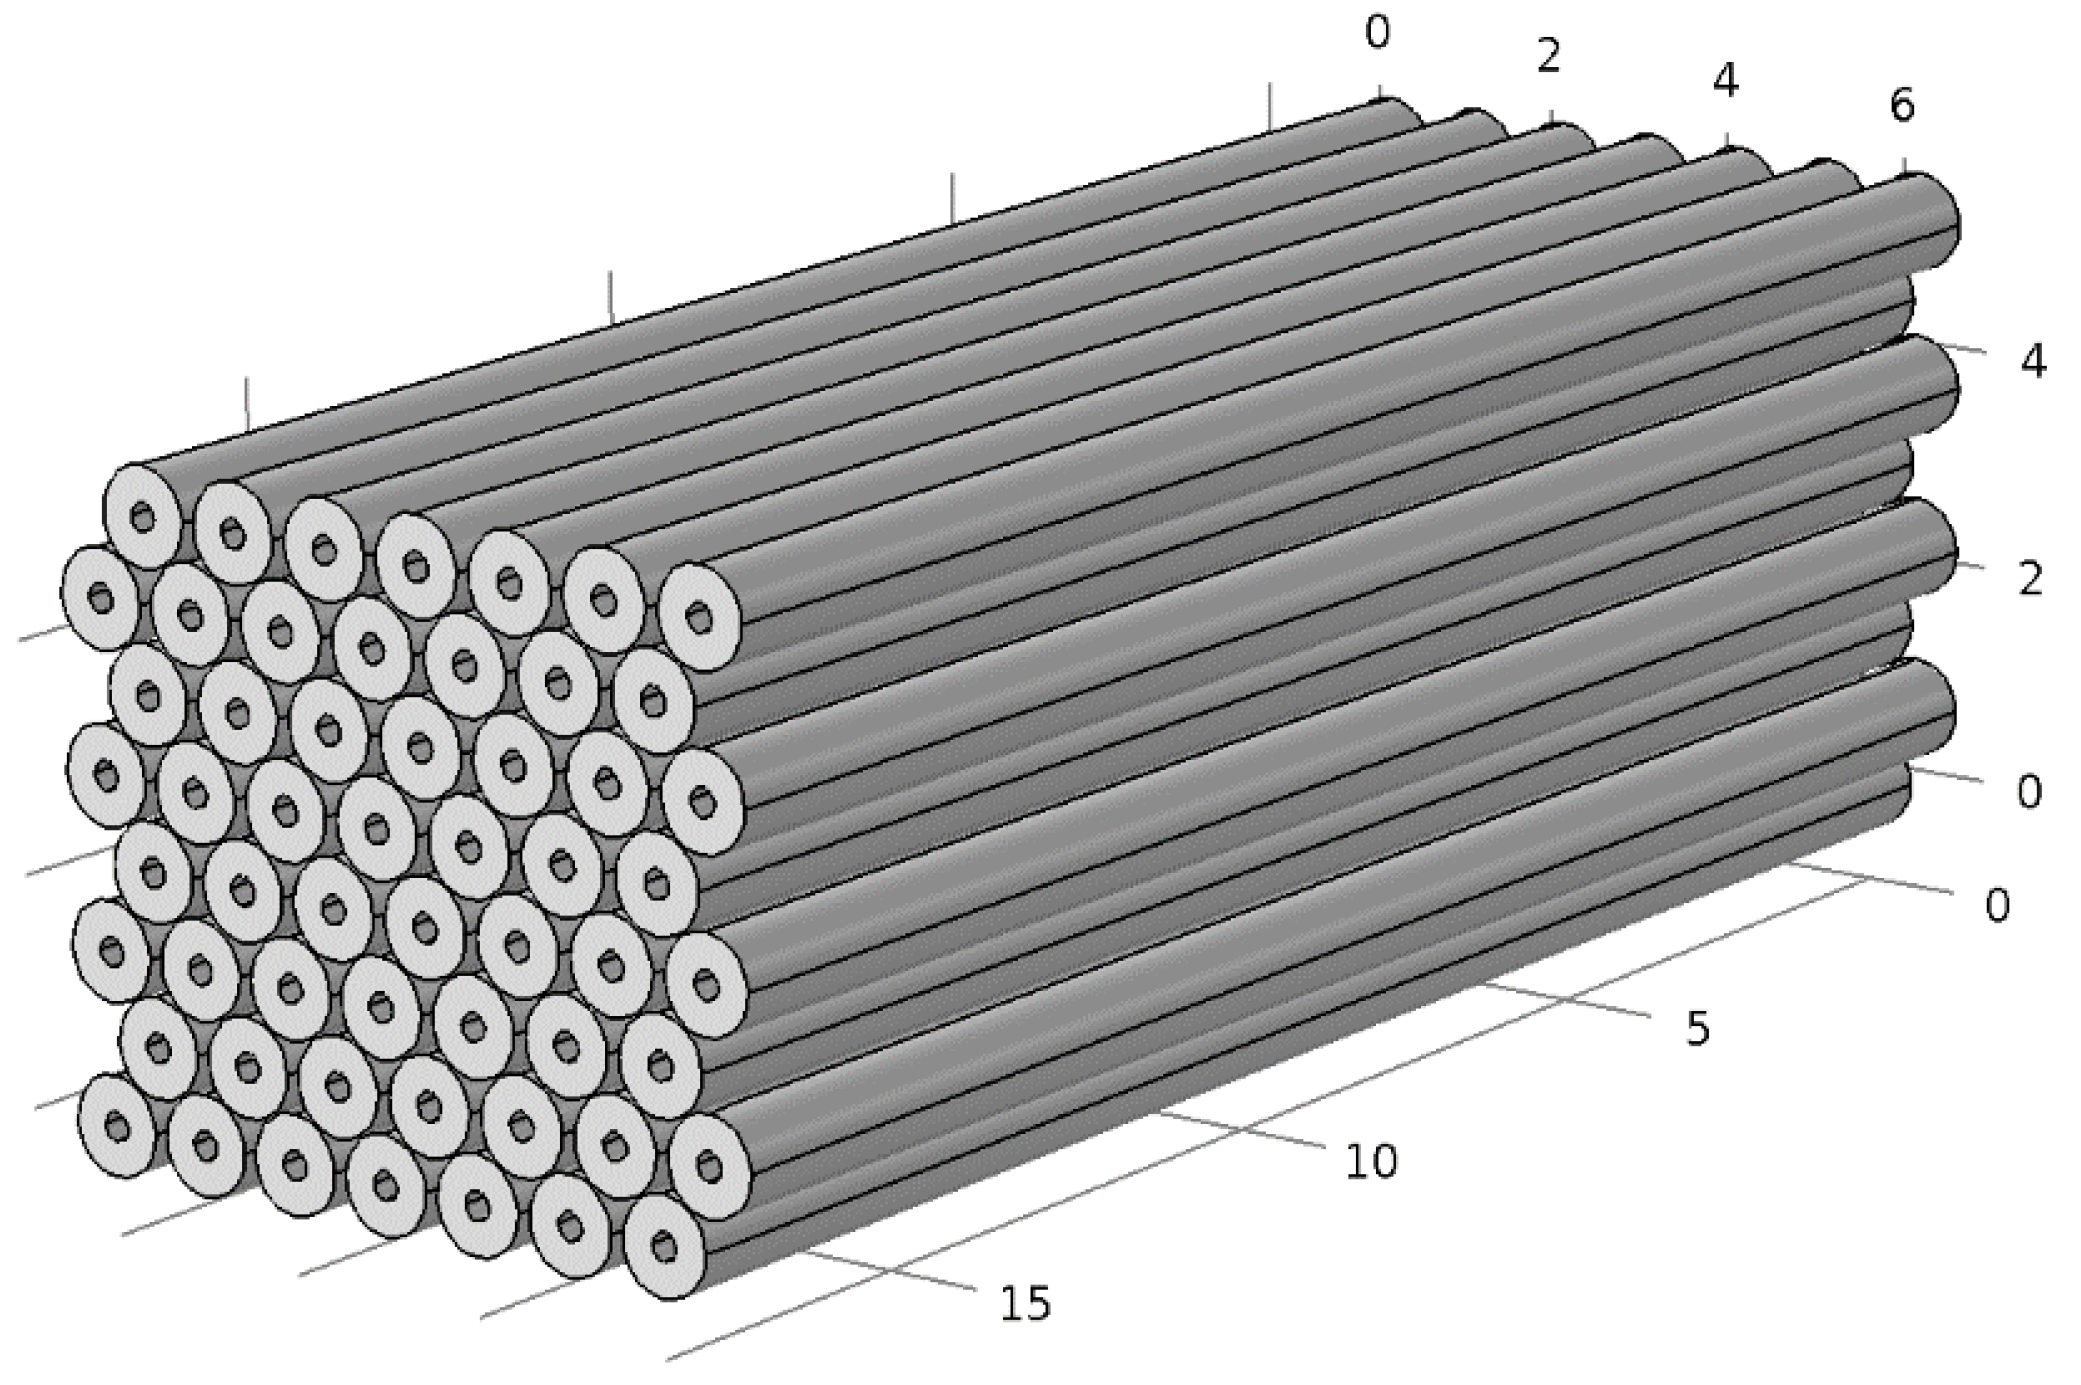
The 55 tubes can be arranged in an array roughly 19 cm (7.5 in) wide, 16.5 cm (6.5 in) high and 46 cm (18 in) long, as shown in Figure 14. Each tube has an inside diameter of 1.9 cm (0.75 in) and an outside diameter of 2.22 cm (0.875 in). The total volume occupied by the array of tubes is 14.4 liters.
Figure 14. Close-packed array of 56 tubes, each 2.2 cm (0.875 in) in diameter and 46 cm (18 in) long. The dimensions shown on the background grid are inches.
Energies 08 08406 g014
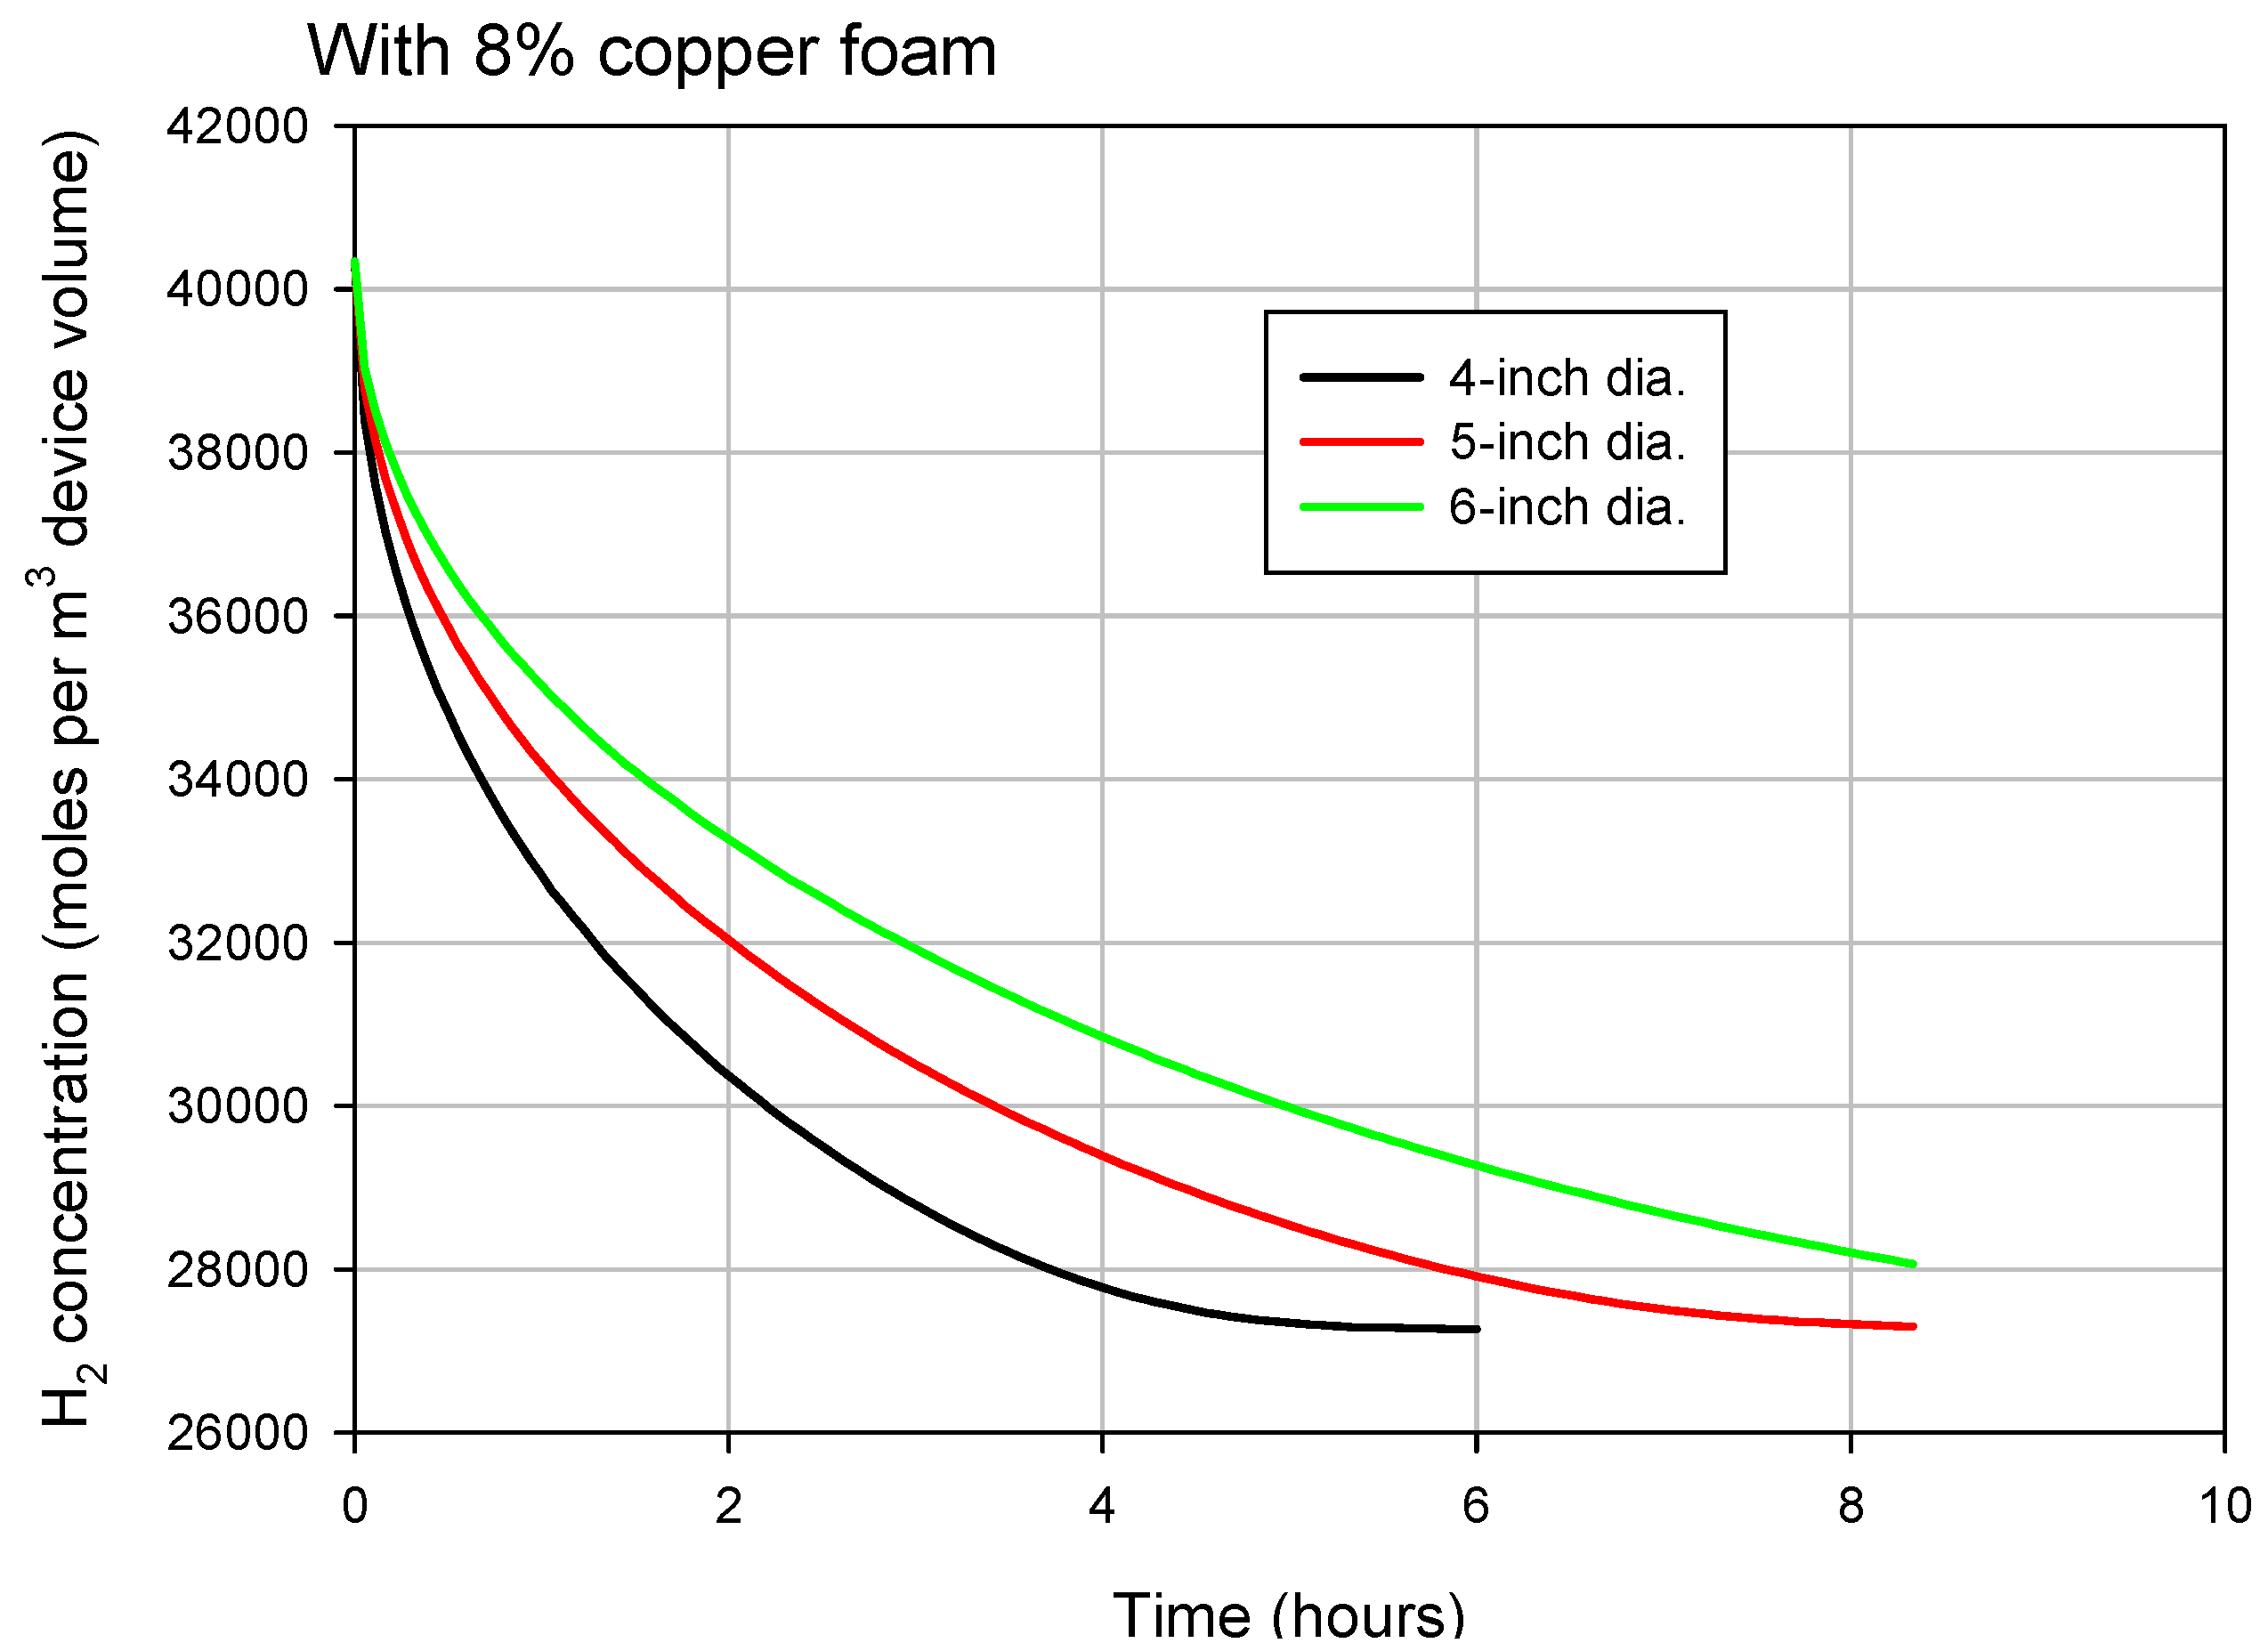
To reduce the volume occupied by the bed and allow for better heat transfer and more design flexibility, we considered a second geometry in which the hydride powder is loaded into a single, larger-diameter cylinder that includes 8% dense (92% void space) reticulated copper foam with an estimated thermal conductivity of 9.3 W/mk. Simulations were performed for multiple cylinder diameters to determine the diameter that yields the desired hydrogen release time of approximately 6 h; when the cycles stabilize, the hydrogen concentration shifts between a high of 37.35 moles per liter and a low of 27.49 moles per liter. The modeled hydrogen release from cylinders with various inside diameters containing copper foam is shown in Figure 15. Using the same calculation method described earlier for the 1.9-cm tubes, we determine that a total of 7.3 liters of bed volume is required for 3 kWh of heat storage per cycle. For the 12.7-cm (5 in) cylinder diameter, a total cylinder length of 58 cm (23 in) is required for 7.3 liters of bed volume, and the external volume of the device is just under 7.7 liters. The cylinder containing copper foam, then, has a volume just over half that of the array of 55 tubes (14.4 liters).
Figure 15. Modeled hydrogen release from cylinders with various inside diameters containing copper foam.
Energies 08 08406 g015

2.4.3. First Generation Metal Hydride Thermal Energy Storage Prototype Size

Based on the modeled bed performance, we recommended the demonstration system to use a 12.7 cm (5 in)-diameter bed containing copper foam for enhanced heat transfer. Use of a single cylinder rather than an array of 55 cylinders will facilitate testing of the demonstration system by simplifying the test arrangement and reducing assembly costs. Further, the performance of the demonstration system with the copper foam will not be susceptible to changes in the thermal conductivity of the hydride powder that might occur with successive cycles.
To allow for the use of an existing high-temperature furnace, the demonstration system comprised a single, 29 cm-long cylinder with a 12.7-cm diameter to show high-efficiency heat storage of at least 1.5 kWh per 24 h cycle. The cylinder has a 1.3-cm (0.5 in) porous metal tube down the axis.

2.4.4. Copper Foam Fill for Hydride Cylinder

Since the thermal conductivity of Ti/TiH is anticipated to not be sufficient for efficient thermal heat management, our bench-scale prototype was constructed with an internal copper foam to show the proof of concept. We chose to use an open cell 10 ppi Duocel copper foam with interstitial spaces that were filled with hydride powder. Using a copper foam allows for a simple construction of the first generation test cylinder, and it is easy to fill with hydride powder. The foam enhances conductivity in both radial and axial directions.

2.4.5. Hydride Test Bed Design Details

For the design of the hydride test bed, we used a column made from a 5” S40 pipe, 24-inch long cylindrical section. The pipes dimensions are pipe with an inner diameter ID = 5.047” and pipe with outer diameter OD = 5.563”, with pipe caps welded onto each end. Screens at the ends of the straight cylinder maintain powder in copper foam, with the space in the caps unutilized. The bed consists of 8% dense, 10 ppi Duocel copper foam, filled with titanium powder. The cylindrical section is wrapped with a Ni-80 heater insulated with ceramic “Salamander” beads. The heater is covered by controlled thickness insulation layer with the ends well insulated. A porous metal, ½” OD tube at the bed centerline will add/remove H2 from the bed. The structure of the container is shown in detail in Figure 16.

2.5. Prototype Installation

The prototype was fabricated in 306 L stainless steel, and the copper foam was filled with titanium powder. Portions of about 200 grams of the titanium powder were inserted into the 8% dense copper foam of 10 ppi by vibrating the test tube to facilitate homogenous compaction until the foam was filled up to the brim. Argon was flowed through the test tube during filling, and the setup was contained in a hood with protective Plexiglas. Due to the powder having a lower density by a factor of ~2 compared to a compacted pellet, we were not able to load as much as we initially had planned. We loaded 9.44 kilograms in total.
Figure 16. Internal structure of the hydride test bed.
Energies 08 08406 g016
The stainless steel tube was wrapped with a Ni-80 heater and insulated with ceramic “Salamander” beads for heating. The prototype was installed on our custom-built hydrogenation system and equipped with a mass flow controller (MFC) to regulate hydrogen flow in and a mass flow meter (MFM) to measure the hydrogen flow out. The system was also equipped with a back pressure regulator (BPR) to prevent back flow. The temperature controller was set up to control the center thermocouple near the wall (TC2). A LabVIEW program was programmed to operate the system and to collect and save data, including TC readings, pressures and mass flow rate. The test tube was leak tested with helium, and the MFC was calibrated with helium. Before starting the experiment, the test tube was purged with hydrogen gas, using the vacuum pump to evacuate.
To monitor the temperature throughout the bed, we equipped the test tube with three thermocouples: three near the wall at the ends and in the center and one thermocouple throughout the core of the bed, as can be seen in Figure 17. We installed a mass flow controller (MFC) to enable the control of hydrogen flow into the bed. It was calibrated with hydrogen gas. We also installed a wet test meter to monitor the flow of hydrogen out of the bed. By monitoring the temperature profile and measuring the hydrogen content in and out of the test bed to learn the heat diffusion and energy density capacity, which is in the hydrogen content, we can calculate efficiencies.
Since we have a cooler side of the prototype where room temperature hydrogen gas enters the hot bed, we anticipated the need for insulation to reduce the temperature gradient throughout the bed. We placed the test tube within a box of insulation boards, wrapped the top with a layer of fiberfrax and covered the ends with aluminum tape. This significantly improved the temperature differences. The hydrogen inlet end (TC3) was about 40–60 °C cooler than the center during operation, and the opposite end (TC1) was about 15–25 °C cooler than the center during operation. The core temperature (TC4) was about 10–25 °C cooler than the center wall temperature (TC2).
Figure 17. Stainless steel test tube filled with titanium powder and attached to the hydrogenation system. The tube was equipped with thermocouples (TC).
Energies 08 08406 g017

2.6. Showing the Proof of Concept of the Bench-Scale Prototype

The first time that the titanium bed was charged with hydrogen gas, the temperature was slowly increased on the temperature controller to avoid a potential thermal runaway reaction. The pressure of the hydrogen gas was set to 16.1 psia and the temperature controller to 350 °C. Hydrogen started to be absorbed by titanium at about 320–330 °C. The exotherm was significant and allowed the reaction to occur slowly under monitoring. Thereafter, the bed was discharged followed by performing five full cycles. The temperature was set to 645 °C for discharging and to 635 °C for charging, while maintaining pressure as close to 16.1 psia (one bar) as possible.
Since we do not have an LT hydride bed, the mass flow controller (MFC) was continuously adjusted to maintain the hydrogen pressure as close to 16.1 psia as possible to be in accordance with the model. With an LT hydride desorbing at the same rate as the HT hydride is absorbing, the pressure will be able to remain at a constant pressure, regulated by the hydrogen diffusion rate for absorption and desorption. Therefore, it is important to identify a LT-hydride with the same hydrogen diffusion rate for charging and discharging.

2.7. Model Predictions of Charge and Discharge Cycles

The models had predicted that the cycles would occur upon a forced 10 °C shift in wall temperature to keep pressure constant. To operate at 16.1 psia, a temperature swing between 635 and 645 °C was predicted as described above. The experiments were performance at constant pressure in accordance with the model predictions, i.e., repeating cycles of 6 h heat, 6 h rest, 6 h return heat and 6 h rest.
The COMSOL model predicts that the H2 storage (in standard liters) for a 10-degree swing of the exterior wall varies, as shown below in Figure 18. Once the temperature drops below about 638 °C, the amount of H2 stored drops quickly.
Figure 18. COMSOL model predicts the H2 storage (in liters) for a 10-degree swing of the exterior wall.
Energies 08 08406 g018

2.8. Experimental Validation of Models

By performing cycles with a 10 °C shift in wall temperature, we were indeed able to operate the test bed at 635–645 °C at a constant pressure close to 16.1 psia (up to 17 psia). As mentioned above, since we are using a hydrogen gas bottle instead of an LT hydride without an automated pressure control, the flow rate of hydrogen into the bed had to be manually controlled and adjusted to keep a constant pressure. During discharging, we did not have any means of controlling the flow rate out during operation. Similar to when charging, this will be self-regulated when the HT bed is paired up with an LT bed that has the same hydrogen diffusion rates.
The experimental test data from Cycle 5 are shown in Figure 19, Figure 20 and Figure 21 below for charging and discharging of hydrogen.
Figure 19. Wall temperatures for three thermocouples TC1, 2 and 3 with time for (a) discharging and (b) charging for the fifth cycle (#5).
Energies 08 08406 g019
Figure 19 shows the three wall thermocouples (TC1, 2 and 3) with time. The temperature is fairly constant for TC2 (center wall TC) at 635 °C for charging and 645 °C for discharging, but it is obvious that the test bed has a temperature gradient. As mentioned, hydrogen comes in at room temperature to the end with TC1, and therefore, the bed is cooler at that end. For future large-scale prototypes, a heat transfer fluid will pre-heat the hydrogen gas.
Figure 20 shows the hydrogen content during charging. As can be seen in the plot for the charging cycle, the absorbed amount of hydrogen was about 700 L. The predicted amount was 400 L, so we are absorbing more than expected by a factor of 1.75, indicating that the prototype performed better than predicted. The reason could however be that the temperature profile is different than in the models. The wet test meter recorded about 640 L desorbed, which indicates that our flow rate recording needs to be improved for our second generation prototype that will be tested with an LT hydride bed for follow-on funding. Figure 20 also tells us that the pressure was fairly constant, but swinging between 16 and 17 psia during charging. Since the diffusion rate during charging is controlled manually by regulating the flow rate on the MFC, it is difficult to keep it constant, but it is possible to improve on it by adjusting the flow rate more often. During discharging, the pressure was constant at 17 psia, which is a little higher than in the models.
Figure 20. (a) Hydrogen loading with time and (b) hydrogen pressure with time for the fifth charge cycle (cycle #5).
Energies 08 08406 g020
Studying Figure 21, it can be seen that the hydrogen flow rate upon charging is considerably faster than discharging. The flow rate was regulated to keep the pressure as close to the model value as possible. The test bed absorbed most of the hydrogen within 5 h; thereafter, the bed discharged an amount before reaching equilibrium. The test bed desorbed within 10 h.

2.9. Summary of Experimental Results from Prototype Testing

Table 2 below summarizes the obtained preliminary data relative to the targets. It is important to take into account that due to the lower density of the titanium powder by a factor of 2.22 compared to the assumed density, we cannot meet the predicted energy density target at this point; however, as mentioned, in the future, we will use compacted disks of titanium powder in order to increase the density by at least two times. The model predicts that we should store/release about 400 liters of H2 for each 10-degree swing, assuming that the internal temperatures vary linearly between the center temperature (TC2 = 645 °C) and the temperatures near the ends (TC1 = 630 °C, TC3 = 610 °C). For the next prototype, the temperature profile needs to be improved. The actual quantity of H2 stored appears to be about 600–700 liters, so the prototype is performing better than expected based on the model with the linear temperature assumption; it is likely that the temperature assumption is overly conservative.
Figure 21. (a) Hydrogen flow rate during discharging and (b) charging towards time for cycle #5.
Energies 08 08406 g021
Table 2. Summary of measured parameters compared to metrics. Note that the assumed density changed from 3.068 g/mL to 1.384 g/mL achieved, which impacts the volumetric storage by a factor of two.
Metric GoalChargeDischarge
>600 °C635 °C645 °C
<5 bar/72.5 psi H2~16.5 psia~17 psia
Charging time 6 h5 h10 h
700 kJ/kg305300
400 kWh/m3 on system178200
For the exergy calculation, we need to accurately know how much was adsorbed and desorbed and at what wall temperature. Both the flowmeter discrepancy and the uneven temperature profile make this difficult. At this point, we have not seen anything that leads us to believe that the original exergy predictions are not achievable, but we cannot really validate the predictions until we have accurately measured data, which will be collected during the testing of a future prototype.
The planned operating line was to go from TiH1.0–TiH1.35 (see Figure 22 below). If all of the material were cycling on this plateau, we would obtain 0.35/2 = 0.175 mol H2 adsorbed per mol TiH1.0, which works out to ~0.175 × 150 kJ/((47.90 + 1.01)/1000) = (26.25)/(0.0489 kg) = 536.7 kJ/kg. Hence, our theoretical limit if we hit our plateau is 536.7 kJ/kg.
Figure 22. Model isotherms for a swing from TiH1.0–TiH1.35 at 650 °C and 16.1 psia (1.1 atm).
Energies 08 08406 g022

3. Experimental Section

For the evaluation of the performance of the titanium powders, we utilized a custom-built hydrogenation system to perform high-temperature cycling experiments at 600–800 °C of selected metal hydrides. We designed and fabricated a reactor for gram-sized samples and purchased an autoclave/stainless steel tube rated for 800 °C with the necessary high-temperature fittings. The reactor was installed on PNNL’s custom built Sievert’s system, shown in Figure 23. Thereafter, we proceeded with volume calibration with helium to be able to accurately calculate hydrogen pressure differences for determining reversible hydrogen content.
We established a program in LabVIEW to be able to easily operate and monitor experimental sequences, including measuring kinetics, life cycle, hydrogen storage content and pressure-temperature-concentration (PCT) experiments automatically.
Figure 23. High-temperature reactor installed on PNNL’s Sievert’s system for measuring isotherms and for life cycle testing of metal hydride thermal energy storage materials.
Energies 08 08406 g023
To assess the need for thermal enhancement, we explored the thermal diffusivity of a series of Ti-based pellets. We utilized an (Anter FlashLine™) [XP][S2] Thermal Properties Analyzer, xenon flash pulse source. We have an add-on furnace module for operation from room temperature (RT) to 500 °C that allows for three 0.5”-diameter specimens. The detector is an liquid nitrogen (LN2)-cooled IR detector. The Windows™ operating and data analysis software also include specific heat capacity testing software and thermal conductivity calculation software. The thermophysical property of the rate of conductive heat propagation is measured at various temperatures over time. Thermal diffusivity is given as: L α = λ/ρCp, where α is thermal diffusivity, λ is conductivity, ρ density and Cp is specific heat.
We calibrated our instrument with standards provided by Anter. Powders of titanium and titanium hydride were compressed into pellets in our argon-filled glove box to protect samples from oxidation. The density of the pellets was 3.2–3.4 kg/m3. The samples were heated up to 500 °C, and the thermal diffusivity was measured in intervals of every 50 or 100 °C under the flow through of argon.

4. Conclusions

The goal was to show the proof of concept of a thermal energy storage prototype to operate at >600 °C, <5 bar H2-pressure, with feasibility for 95% efficiency. We demonstrated the ability to meet or exceed the DOE targets by demonstrating the prototype to reversibly operate at 635–645 °C under one bar H2-pressure for at least 60 cycles with a practical gravimetrical energy density of about 800 kJ/kg and a volumetric energy density of ~200 kWh/m3 on the HT bed (neglecting the 2.2 factor lower density than assumed). Our metal hydride thermal energy storage exceeds the DOE energy density target by eight times. A future bench-scale prototype will include a low-temperature bed for hydrogen storage.

Acknowledgments

We acknowledge the U.S. Department of Energy ARPA-E HEATS program for financially supporting this research under Award 0471-1554. We acknowledge Heavystone Lab LLC and Ronald White, CEO, for support. Kevin Simmons (formerly of PNNL) is appreciated for valuable discussions. Gary Maupin, PNNL, provided valuable help with the Sievert’s system. Ben Roberts, PNNL, provided valuable help with installing the prototype and setting up the LabVIEW-based program to operate it.

Author Contributions

Ewa Rönnebro conceived of, designed and performed all experiments, performed all materials characterization on the Sievert’s system and tested the prototype. Greg Whyatt and Mike Powell performed the modeling, designed the prototype and evaluated the experimental data compared to the models. Matthew Westman performed the measurements on the thermal diffusivity instrument. Feng (Richard) Zheng made the LabVIEW software program for the Sievert’s system. Rönnebro wrote most of the paper with input from Whyatt and Powell. Zhigang Zak Fang provided materials for characterization and performed the materials scale up.

Conflicts of Interest

The authors declare no conflict of interest.

References

  1. International Energy Agency (IEA). Technology Roadmap—Energy Storage; Report; IEA: Paris, France, 19 March 2014. [Google Scholar]
  2. International Energy Agency (IEA). Technology Roadmap—Solar Thermal Electricity; Report; IEA: Paris, France, September 2014. [Google Scholar]
  3. Hauer, A.; Simbolotti, G.; Tosato, G.; Gielen, D. Thermal Energy Storage. IEA-ETSAP and IRENA© Technology Policy Brief E17; International Renewable Energy Agency: Abu Dhabi, UAE, January 2012. [Google Scholar]
  4. Chu, S.; Majumdar, A. Opportunities and challenges for a sustainable energy future. Nature 2012, 488, 294–303. [Google Scholar]
  5. Rönnebro, E.; Majzoub, E. Recent advances in metal hydrides for clean energy applications. MRS Bull. 2013, 38, 452–461. [Google Scholar]
  6. Meng, X.; Yang, F.; Bao, Z.; Deng, J.; Serge, N.N.; Zhang, Z. Theoretical study of a novel solar trigeneration system based on metal hydrides. Appl. Energy 2010, 87, 2050–2061. [Google Scholar]
  7. Muthukumar, P.; Groll, M. Metal hydride based heating and cooling systems: A review. Int. J. Hydrog. Energy 2010, 35, 3817–3831. [Google Scholar]
  8. Satesh, A.; Muthukumar, P. Performance investigations of a single-stage metal hydride heat pump. Int. J. Hydrog. Energy 2010, 35, 6950–6958. [Google Scholar]
  9. Felderhoff, M.; Bogdanović, B. High Temperature Metal Hydrides as Heat Storage Materials for Solar and Related Applications. Int. J. Mol. Sci. 2009, 10, 325–344. [Google Scholar] [PubMed]
  10. Wang, W.-E. Thermodynamic evaluation of the titanium-hydrogen system. J. Alloys Compd. 1996, 238, 6–12. [Google Scholar]
  11. Borchers, C.; Khomenko, T.I.; Leonov, A.V.; Morozova, O.S. Interrupted thermal desorption of TiH2. Thermochim. Acta 2009, 493, 80. [Google Scholar]
  12. Ershova, O.G.; Dobrovolsky, V.D.; Solonin, Yu.M.; Khyzhun, O.Yu. Hydrogen-sorption and thermodynamic characteristics of mechanically grinded TiH1.9 as studied using thermal desorption spectroscopy. J. Alloys Compd. 2011, 509, 128–133. [Google Scholar]
  13. San-Martin, A.; Manchester, F.D. The H-Ti (hydrogen-titanium) system. Bull Alloy Phase Diagr. 1987, 8, 863–873. [Google Scholar]
  14. Dantzer, P. High temperature thermodynamics of H2 and D2 in titanium, and in dilute titanium oxygen solid solutions. Phys. Chem. Solids 1983, 44, 913–923. [Google Scholar] [CrossRef]
  15. Ito, M.; Setoyama, D.; Matsunaga, J.; Muta, H.; Kurosaki, K.; Uno, M.; Yamanaka, S. Electrical and Thermal properties of Titanium Hydrides. J. Alloys Compd. 2006, 420, 25–28. [Google Scholar] [CrossRef]
  16. Chaise, A.; de Rango, P.; Marty, Ph.; Fruchart, D.; Miraglia, S.; Olives, R.; Garrier, S. Enhancement of hydrogen sorption in magnesium hydride using expanded natural graphite. Int. J. Hydrog. Energy 2009, 34, 8589–8596. [Google Scholar] [CrossRef]

