1. Introduction
Attention to power grids’ resilience has increased after significant power outages were observed due to recent notable disasters in the U.S. and other developed nations. This increased focus on resilience does not only originate in the relatively poor performance of power grids—extensive power outages were observed even in areas with little damage [
1]—but also because of the sociological context in which these extensive power grid outages occur: presently, in order to support the operation of other critical infrastructures, such as communication networks, and key social systems, such as financial transactions, developed countries are more dependent on power grids than in the past. However, this recent increased interest in improving electric power grid resilience has not been formalized on a framework with simple metrics that would allow practical applications for improving electric power supply performance at a distribution level and that can also be suitable to support technological choice selection by customers. Moreover, there is no consensus about the definition of resilience and how it could be measured and applied to improve electric power grids’ performance during extreme events or other events, as it relates to its relevance within the aforementioned sociological context and, thus, applicable to customers in particular.
Although many recent publications identify the field of resilience engineering as a relatively young field [
2,
3], there exists already a relatively large body of literature on this topic, and although the conventional analytic approach has used graph theory as a way of studying systems with a networked topology, newer works, such as [
4], indicate the value of alternative newer approaches, such as axiomatic design, for studying resilience, even for network-based systems. Many of the recent works identify the need for a way of quantifying resilience as an important current challenge [
3,
4,
5,
6,
7]. This challenge is, ultimately, related to how resilience is defined. Although some of these works, such as [
6,
8], rely on a traditional definition that has been used in electrical engineering for power systems or in civil engineering for transportation networks based on the concept of “bouncing back” or recovery speed, the inclusion of a broader perspective is acknowledged in [
8]. Broader definitions may consider different aspects, views or approaches. As a first approach, the definition of resilience is expanded by also considering withstanding capability to the event-causing disruptions, as is considered in [
4,
9,
10]. Other works on resilience of systems in general consider other aspects, such as [
2], which indicates that resilience includes at least two of the following three characteristics: avoidance, survival and recovery; or [
6], which considers robustness, rebound, adaptation and graceful extensibility as the four characteristics of resilience. From a mathematical perspective, some works consider resilience as an area under a curve representing some performance characteristic, such as quality in [
8] or the difference between targeted performance and observed performance in [
11]. However, such an approach may not be applicable to power grids, particularly when considering individual loads. In addition to [
6], other works also recognize the importance of adaptation as part of a resilient system [
2,
12] or the influence of humans operating such systems [
3,
5,
7,
13], which are aspects later discussed in the herein proposed framework. The notion of cycles affecting resilience is another concept considered in this paper that has been explored in other works focusing on systems’ resilience. In [
13], short- and long-term resilience is distinguished. Life cycles and the influence of learning processes were also discussed in [
2,
4,
12]. Such learning processes are one aspect in which the effect of human participation affects resilience. Other past works considering the influence of humans on resilience are [
3,
4,
5,
7,
13], which is also an aspect included in the proposed resilience framework. Several of these works, such as [
8,
9,
11,
12,
14], also discuss the effect of dependencies, but none of these papers identify two key notions presented herein: the important role of storage as interface buffers limiting the propagation of failures and a mathematical relationship that explicitly shows and measures how dependencies affect resilience. Other potential concerns in these past works are that some, e.g., [
3,
7], still lack a quantitative approach or have models that are extremely complicated or abstract, which are difficult to apply in a real setting [
4]. In addition, most of these past works do not focus on power grids and, thus, do not consider their particular characteristics that may affect resilience; although a few of them [
4,
13] use power systems as examples, their concept of these systems is a conventional one that does not seem to consider the implications on the resilience of power grids’ evolution into more distributed systems in which customers, and not utilities, are primarily at the center of the technology development vision. Such a conventional view leads to also omitting other important aspects when evaluating power grids’ resilience, such as the role of dependencies. Instead, such an alternative vision, as well as the conventional notion of power grids are considered in the proposed framework here. This paper deals in particular with power grids’ resilience and not necessarily with the resilience of a generic system. Recently, [
15] presented a survey about the research of power grids’ resilience under natural disasters. The focus on these surveyed papers is on modeling and describing power system damage, outage duration and restoration after natural disasters, as well as on exploring technological approaches to improve power systems’ performance. However, most of these works omit defining resilience or linking resilience to power grids’ performance. In some cases, resilience seems to be confused with other concepts, such as that of resistance [
16,
17,
18,
19], or resilience is considered with a limited view, for example based only on service restoration speed [
20,
21]. Moreover, there are limited suggested approaches on how to measure power grids’ resilience and related attributes. Such a quantitative approach is important, because a resilience metric enables objective planning and operations activities for increased resilience. For example, a metric for resilience allows not only to design a system for increased resilience, but also to identify by how much resilience is improved for different design approaches. Hence, a resilience metric could help to determine numerically-optimal design approaches. Nevertheless, considering resilience in power grids finds complexities beyond the task of identifying suitable metrics. Power grids are seeing a major paradigm change in which the traditional view of a communal system centered on electric power utilities is shifting towards a more distributed customer-focused system. Some of the technologies representing this paradigm change include microgrids, local energy storage and power generation and smart grid technologies [
22]. Hence, resilience studies and definitions need to consider this paradigmatic shift in reality and include metrics that can be applied both by electric power grids and by individual customers. Another complexity found in resilience analysis includes considering the effect of power grids on loads and other infrastructure systems and,
viceversa, the effect of other infrastructure systems on power grids,
i.e., dependencies and interdependencies. Yet another complexity involved in understanding power grids’ resilience is representing the effect and influence of humans in power systems’ performance, such as the role of restoration crews and logistical management after a natural disaster. All of these aspects influencing power grids’ resilience are not generally considered in the works surveyed in [
15].
Most of the relatively few already proposed resilience metrics originate in government agencies or utilities and tend to follow a traditional electric utility-centric view of power systems, which often find difficulties with established performance standards, such as IEEE 1366, because major event days,
i.e., days under the effect of natural disasters, are excluded from those metrics. This is the case of [
23,
24], although the latter proposes an approach to address the limitations created by excluding the major event days when evaluating power grids’ resilience. Still, [
23] does not address human aspects influencing power grids’ resiliency, nor does it consider the impact of interdependencies among infrastructures. Both of these aspects are considered in [
25], which proposes a metric analogous to IEEE 1366’s Average Service Availability Index (ASAI). Some alternative approaches to assess resilience that also consider the influence of humans are found in [
26], but its approach is qualitative. The work presented in [
25] also provides a view of power systems more in line with the aforementioned customer-oriented paradigm change. A similar view is also considered in [
27], which suggests the need for customer-driven resilience metrics. Other metric approaches have been suggested by academia, such as [
28], but as [
20,
21], these works have a partial view of resilience by focusing primarily on service restoration. Moreover, [
20,
21,
28] have a mostly theoretical approach that may be difficult to implement by utilities or electricity customers. Another study presenting the same application difficulties based on their primarily theoretical basis is [
29], which, however, has a relevant approach to resilience metrics by considering three components: resistance, absorption and recovery. However, the complexity of these metrics make it difficult to have them also adopted and applied by electric power utilities. The approach presented in [
30] is also based on defining resilience based on three attributes: robustness, resourcefulness and rapid recovery. However, the practical application of [
30] is difficult because it relies on questions and answers from stakeholders in order to adjust a weight factor. It is possible to find a much larger group of publications represented by [
31,
32] that considers a particular power grid’s technological aspect, such as the effect of cyber-security on resilience, but their application is narrowed to that particular technological aspect under consideration.
This paper presents the main concepts, definitions and associated metrics of a proposed quantitative framework for characterizing electric power grids’ resilience. Although some discussion is included about how this framework could be applied to support certain design or technology selection processes, the focus of this paper is on the modeling and simulation and on resilience metrics development and not on particular design efforts. Even when this framework is presented within the context of natural disasters, it is widely applicable to other events that could cause disruptions in electric power grids or be used as a basis for normal conditions planning. In particular, the novel contributions of this paper include:
(1) the identification of a definition of resilience for power grids based on a notion increasingly being accepted based on four main characteristics, withstanding capability, restoration speed, preparation/planning capacity and adaptation capability, that expands the traditional concept of resilience as merely an “elasticity” property;
(2) the presentation of a simple metric for resilience that directly represents the withstanding and recover speed capabilities and that is indirectly influenced by the other two indicated characteristics; these metrics can be used on different time scales or at different sections of a power grid from an individual load level to a given area with multiple loads and is able to be used with modern views of power systems, such as microgrids;
(3) the inclusion of physical, human (through processes implementation) and cybernetic components as influencing factors of power grids’ resilience;
(4) the presentation of a way of quantifying the degree of dependency by describing the role of energy storage as buffers regulating dependencies;
(5) the mathematical demonstration of how resilience and dependence relate, which can be used to measure how dependencies affect resilience;
(6) the characterization of dependencies in a dynamic way (in contrast to most existing studies based on a static approach) by considering the effect of energy storage in delaying failure propagation; it is shown how the inverse of repair rates affects changes in resilience when using local energy storage;
(7) the description of additional complementary analytic metrics that allow one to use the presented framework as an advisory tool to assist in making physical asset deployment or process modification decisions.
The proposed framework is intended to be applied to power grids, particularly to power distribution portions, so the study of its application to other systems in general is not within this paper’s scope. Nor is it the goal of this paper to provide a complete literature survey, so only the past works most relevant to this paper are cited. This paper is not necessarily aimed at performing a technological analysis of whether power grids’ original basic design from more than a century ago was intended or not to provide the levels of continuous operations needed by modern societies. Neither is it the goal of this paper to perform a technical study or detailed design analysis of particular components or sections of power grids. Instead, the goal of this paper is to present a simple, yet representative enough, quantitative framework for resilience that could eventually be used to characterize power supply performance planning, design, management and operation. Hence, the presented framework could be used to support the study of resilience of a particular technology, process or topological design; all topics that in themselves merit at least a separate independent paper and, hence, are not discussed in particular detail here. In this document,
Section 2 provides some context for this framework by summarizing practical observations of typical effects of natural disasters on power grids. Then,
Section 3 presents the basic definitions and metrics that form the proposed framework. In addition to resilience,
Section 3 also define attributes, such as brittleness, dependence and resistance.
Section 4 discusses the application of the proposed framework and validates its metrics using data, information and observed field records of the performance of power grids during recent natural disasters.
Section 5 connects
Section 2 to
Section 4 by explaining how the resilience metrics could be affected in successive cycles of extreme events as a result of the influence of continuous learning from direct and indirect effects of those events or expected situations. Such a learning process may lead to an infrastructure adaptation process that could influence resilience metrics in subsequent events. Finally, the conclusion in
Section 6 summarizes the discussion and highlights the contributions of this work.
3. Resilience Definitions, Metrics and Model
This proposed framework is built on fundamental concepts that serve to quantitatively represent power grids’ performance during natural disasters and other extreme events. This section defines next these fundamental concepts, which include two characterizing notions and five power grid attributes, and presents metrics presented for these fundamental attributes. These fundamental concepts forming the foundation of the proposed framework are:
- (1)
Extreme and stress event cycle and phases.
- (2)
Performance metrics.
- (3)
Resilience.
- (4)
Resistance.
- (5)
Brittleness.
- (6)
Dependency.
- (7)
Interdependency.
Next, these concepts are discussed in more detail.
(1) Extreme and stress events cycle and phases: As was detailed in [
25], power grids in a given area may be subject to extreme events that could affect their operation by damaging or destroying infrastructure components or facilities or by affecting personnel health or the working environment. These extreme events include natural disasters, accidents or attacks. Power grids could also see their operation affected by less severe events that could also influence their operations by creating stress conditions, such as economic crisis or particular electricity market conditions that could lead to aging infrastructure components due to reduced capital investment plans. Although the focus in this paper is on extreme events and, in particular, natural disasters, the proposed framework can be applied to all of these events, including less extreme stress events. Both extreme and stress events can be considered as hazards for the operation of power grids, whereas hazards can be defined based on [
35] and within the context of power grids as “a potentially damaging physical event, phenomenon and/or human activity, which may cause operations or service disruptions.”
In general, it is possible to observe that extreme or stress events tend to follow cycles with an event influencing power grids’ performance in subsequent events in various ways. These ways include the potential for weakened infrastructure or, on the contrary, stronger infrastructure based on lessons obtained from previous events that affect infrastructure planning and operation decisions. Moreover, extreme or stress events not only affect power grids’ operations when these events are active, but also in their aftermath. Extreme or stress events may affect a given portion of a power grid directly or indirectly. Power grids portions are affected directly when the event’s affecting actions are observed in the area where such a power grid portion is located. Power grid portions are affected indirectly when the event is directly affecting another area, but grid operations in the area under consideration are still affected due to, for example, power grid stability concerns caused by loss of generators or loads in the area directly affected by the event, or reduced physical or human resources caused by the relocation of resources into the directly affected area.
As
Figure 1 represents, the period of time from one extreme or stress event and the immediate next one can be divided into four phases. These phases are [
25]:
- -
Phase 1 (during the event): This phase typically lasts from a few minutes to a few days. The focus in this phase is to reduce the damage and loss of service. For some disasters, such as aftershocks following an earthquake, the main event may repeat itself. This phase starts when the first signs of the event are being noticed, lasts for a time given by ∆t1 and concludes when the first repairs are made.
- -
Phase 2 (immediate aftermath): This phase usually lasts from a few days to a few weeks. The focus during this phase is to initiate restoration and repair activities, such as performing damage assessments to evaluate system status, followed by infrastructure restoration, repair and reconstruction activities. This phase lasts for a period of time indicated by ∆t2 and concludes when these activities are mostly completed. The main goal during this phase is to reduce service disruptions as quickly as possible.
- -
Phase 3 (intermediate aftermath): This phase typically lasts from a few weeks to several months. Although this phase overlaps with Phase 3 as recovery and repair activities wind down, the focus during this phase transitions into studying the effect of the event on a given portion of the power grid by documenting damage and performance metrics evolution and by, possibly, conducting some form of forensic analysis. That is, in Phase 3, attention transitions from responding to the given event into Phase 4 in which the focus is to prepare for the next event.
- -
Phase 4 (long-term aftermath): This phase may last from a few months to several years. The activities focus on preparing for the next event by planning and implementing mitigation actions, modifying relevant operating processes and modifying the existing infrastructure at the conclusion of Phase 3. Preparations and resource prepositioning for a following event that can be anticipated typically occurs at the end of Phase 3. Phase 4 concludes when the immediate next event happens.
Figure 1.
Representation of the phases of an extreme event. Both axes are not to scale.
Figure 1.
Representation of the phases of an extreme event. Both axes are not to scale.
(2) Performance metrics: The effect of extreme or stress events on power grids can be characterized based on some performance metrics. In the particular context of this paper focused on extreme events, such as natural disasters, power outages are considered the main performance indicator. Metrics associated with power outages include, for example, the duration and percentage of customers affected in a given area. As
Figure 1 exemplifies, these metrics can be related to the phases of an extreme event indicated above. In other contexts also applicable in this proposed framework, performance could be characterized based on the quality of service. Power grids’ quality of service metrics could include, for example, the number of events in which voltage levels fall outside a predetermined range. Once the desired performance metrics are identified, it is possible to define a hazard’s impact based on [
35] as “the expected effect in terms of performance disruption or degradation that a given hazard of a given intensity produces to a power grid or a portion of a power grid under study when it is constructed, operated, or configured in a standard way.” Hence, performance metrics serve to measure a hazard’s impact or to characterize potential impacts.
(3) Resilience: In this framework, resilience is considered based on the U.S. Presidential Policy Directive 21 (PPD21) [
36] that defines resilience as “the ability to prepare for and adapt to changing conditions and withstand and recover rapidly from disruptions.” That is, resilience is an attribute with four components:
- -
Withstanding capability; i.e., the capacity to sustain operation amid some hazard, such as a natural disaster.
- -
Recovery speed; i.e., how long it takes to recover with respect to a given level of disruption. In the case of natural disasters, such disruption is typically considered to be power outages.
- -
Preparation/planning capacity; i.e., the ability of organizations to implement measures to reduce the effect of future potential hazards on power grids’ performance.
- -
Adaptation capability; i.e., the ability of organizations operating and managing power grids to react to conditions that could affect power grids’ performance. Such conditions can be external, such as actions from a hazard, or internal, such as naturally-aging infrastructure components or business management decisions.
This definition is chosen here because it is currently being adopted by several key U.S. agencies involved with power grids’ regulation and technology and with infrastructure resilience in general, such as the Department of Homeland Security (DHS) [
37], the National Institute of Standards and Technology (NIST) [
38] and, to some extent, the Department of Energy (DOE) and its associated national laboratories [
39] with the clarification of differences between the PPD21 definition and reliability metrics, which are also later commented on in this paper. A very similar definition is also being considered by the U.K. Cabinet office [
13] and is also being proposed in recent studies on systems’ resilience, such as [
12].
Based on this definition for resilience, the herein proposed framework further expands the metric for resilience based on an analogous availability measurement presented in [
25] and defines individual resiliency,
RI, for a single load as:
This equation establishes a suitable measure of resiliency within the context of the PPD21 through the dependence on the up and down times,
TU and
TD, respectively. As it is detailed later, service recovery speed is represented by the down time
TD, which is mostly influenced by both hardware-related aspects and by human-driven processes and activities, such as maintenance policies and logistical and repairs management. Up time
TU is directly related to the withstanding capability of a power grid to a given event. Its value is mostly related to asset/hardware characteristics and grid design. The sum of
TU and
TD is the total resilience evaluating time
T. As is detailed in
Section 5, preparation capacity and adaptation capability also influence this resilience metric, but in an indirect way. It is relevant to indicate in here that the analogous relationship between resilience and availability has been previously identified for different systems or contexts in recognized publications. For example, [
40] identifies availability as a suitable measurement for communication sites’ resilience; [
41] proposed to use availability as a measurement for supply networks; and [
42] suggests using an analogous measure of availability for the social dimension of resilience of urban infrastructure systems. In a broader sense, it is also possible to define power supply base resiliency,
RB, for
N loads as:
where
T is the period of time under consideration,
TU,i is the part of
T when a load
i is able to receive electric power,
i.e., the “up” time, and
TD,i is the remaining portion of
T when load
i may not able to receive electric power,
i.e., a “down” time. The loads considered in Equation (2) depend on what particular portion of the power grid is considered. For example,
N can represent the loads in a particular lateral or feeder or the loads served by a given substation or loads in a given area, such as a county or town. The choice of
N can, then, even serve for narrowing the analysis to an individual customer as part of some evaluation of a technology solution or topological alternative [
35]. Notice that not all of the
N loads in a given area may experience an outage. The share of electricity customers experiencing an outage at a given time is defined as the outage incidence,
θ, which can, then, be calculated as:
where
no is the number of customers experiencing an outage. The maximum outage incidence
θmax is observed when
no equals the peak number of outages
No observed during
T. The choice for considering
θ as a reference parameter was made in part because it is equivalent to the System Average Interruption Frequency Index (SAIFI) in IEEE Standard 1366, which is a conventional metric of reporting power outages and included in a well-accepted and widely-applied standard, with the caveat discussed below about the differences between the herein proposed framework and IEEE Standard 1366, which excludes major event days from reliability index calculations. In addition,
θ is a common way of reporting power outages during natural disasters by electric utilities and regulatory agencies in countries that recently experienced such extreme events. It should also be noted that although
θ also includes customers that have their businesses or homes destroyed, in most natural disasters, the number of destroyed homes and business is less than 5% of the total customers experiencing power outages, and as indicated in
Section 2, most of the destroyed homes and business are usually found in relatively small areas and constrained areas; the only exception to the aforementioned percentage of destroyed homes and businesses is observed in some of New Orleans neighborhoods with Hurricane Katrina; however, even these were small areas compared to the total area experiencing power outages after Hurricane Katrina. Additionally, it is common practice for electric power distribution utilities that infrastructure components and capacity are in general restored to capacity levels similar to those found before the natural disaster, even in areas that experienced significant dwelling damage, such as in several neighborhoods in New Orleans with Hurricane Katrina or in the Bolivar Peninsula with Hurricane Ike. Such restoration practice is done both in order to simplify restoration activities (because no new calculations or studies need to be performed) and in anticipation of having those areas eventually repopulated as they were before the damaging event. As a result of this restoration practice, electric utilities could still account for a potential number of customers after an extreme event similar to those existing before such an event. Evidently, destroyed dwellings or businesses is not an issue in the much larger area and the large majority of customers that typically experience moderate to no damage.
Although the resilience metrics proposed in this paper in Equations (1) and (2) seem equivalent to that of availability in reliability theory (as suggested by [
25]), there is a subtle difference between the two. While availability measurements are defined based on an infinite number of failure and repair cycles, the resilience metrics in Equations (1) and (2) can be based on a single cycle of duration
T, which is a parameter that allows not only to assess performance during an extreme event, but also to evaluate the other two components of the aforementioned resilience definition: adaptation capability and planning capacity. That is,
T relates Equations (1) and (2) to the four phases of an event. For example, consider
Figure 1 representing the four phases of a natural disaster cycle. In the particular case of a performance assessment for a given hazard, such as an earthquake,
T is measured from the time the first effects of the hazard act on the area under evaluation until the end of the short-term aftermath when the restoration and repair processes are completed. That is, from
Figure 1,
T equals the sum of
∆t1 and
∆t2. This measurement can be repeated for subsequent occurrences of a similar extreme event or it can be used as a basis for comparison, as described in
Section 5, in order to evaluate adaptation capability. This example also hints at an implicit parametric dependence in Equations (1) and (2), because the up and down times depend on the hazard characteristics, such as its intensity. If the goal is to calculate resilience in its broader sense by accounting for all of its four components, then
T can be taken equal to one full disaster cycle.
The definition in Equation (2) is both analogous to a resilience metric based on availability presented in [
25] and also suggested in [
42] and to the Average Service Availability Index (ASAI) in IEEE 1366 (although ASAI does not consider major event days). Such a relationship with an already existing and accepted reliability index reduces the possibility of issues found with a somewhat arbitrary metric for power grids’ resiliency suggested in the past [
43,
44] and provides a context with respect to existing practices in which the scope is broadened to consider major event days as part of the metric. It also agrees with the discussion in [
23]. However, as [
23] also points out, the main difference between Equation (2) and the definition of ASAI in IEEE 1366 is that this index is evaluated excluding major event days,
i.e., extreme events, such as natural disasters, whereas Equation (2) is intended to include such periods of time in the calculations. It is also worth mentioning that an earlier similar definition of resilience is found in the PPD8 [
45], which defined resilience as “the ability to adapt to changing conditions and withstand and rapidly recover from disruption due to emergencies.” However, this definition omitted the important influence of planning processes on resilience, and thus, the more complete definition in the PPD21 is considered here. It is also worth noting that the National Academy of Sciences (NAS) [
46] defined resilience in a similar way to the PPD21 as the “ability to prepare and plan for, recover from, and more successfully adapt to adverse events.” However, this definition includes the withstanding capabilities only in an implicit way.
In general, the recovery or restoration speed,
vr, for a group of
N customers is defined as:
where
t is a time considered from the time when
θ peaks. It is also possible to define an individual recovery speed,
Vr,i, for each load. If the case of natural disasters is still considered, then the potential disruption is a power outage. Then, in Equation (3) for
N = 1, at any given point in time,
no can be zero or one. That is, in the non-trivial case in which an individual customer experiences an outage,
dθ in Equation (4) equals one,
i.e., all customers under consideration experiencing an outage, and
dtr can be taken equal to
TD, so
vr,i can then be defined as:
That is, since
Vr,i is the inverse of a down time, it can be said based on conventional reliability theory that
Vr,i is analogous to a repair rate,
µ. In some cases, it is also possible to use Equation (4) in order to define some specific recovery speeds, such as average restoration speed, or recovery speed to reach a given level of restoration, such as those defined based on the time to restore service to 95% or 98% of the customers that lost power and used in [
1].
It is also possible to define a disruption speed,
vd, as:
which for an individual customer becomes
Vd,i defined as:
which is analogous to the concept of failure rate
λ in reliability theory.
(4) Resistance: Thisis defined here as the capacity of withstanding the disruptive effects of a given event. For a single customer, individual resistance
φI is calculated as:
where
σ is the measure of the disruptive action under consideration and
T1,U is the time interval during
∆t1 when the individual load under consideration is receiving power (see
Figure 2). As shown in
Figure 2,
T is considered in this case to be equal to the sum of
∆t1 and
∆t2, which are the durations of Phases 1 and 2 of a disruptive event, respectively, as previously defined in this section and represented in
Figure 1. It is expected that
σ is defined depending on the context in which the resistance of the power supply for the considered load is evaluated. In absolute terms,
σ can be considered a non-negative function of the disruptive intensity of the event, such as the
LTCIIMOI index in [
1]. Ideally, it is most useful to identify such functions for different types of hazards, which relate their intensities to the same disruption level, so that the resistance can be characterized independently of the type of hazard under consideration. However, such extremely extensive analysis is out of the scope of this paper and would likely require several separate years-long studies.
Figure 2.
Relevant time intervals for the first two phases of an extreme event.
Figure 2.
Relevant time intervals for the first two phases of an extreme event.
In the case of multiple loads, it is also important to consider not only for how long these loads can remain operational under the effects of the extreme event, but also what is the maximum share of electricity for which customers experience a loss of service. That is, from a broader perspective of several electricity customers, a system withstands an extreme event better and, hence, has a higher resistance if it can keep its loads operating longer, and when they fail, the portion of electricity customers experiencing as a loss of service is as low as possible. Hence, resistance
φ for
N loads can be calculated as:
Notice with Equations (1), (2), (8) and (9) that resilience and resistance are related, but although these concepts seem to be sometimes considered in an indistinct way [
16,
17,
18,
19], they are not equal. As it was indicated, resistance is intended to evaluate the withstanding capability of a power grid, and thus, it does not account for the other components of resilience, such as restoration time. Still, in general, more resistant systems tend to also be more resilient, because more resistant systems may have fewer failures and fewer loads experiencing an outage, which, in turn, will free up resources that could be used to address the fewer failures in a faster way and, thus, achieve lower
TD values; thus, achieving higher resilience values. However, it is still possible to anticipate cases of high resistance with low resilience, because long down times may cause low resilience values even with relatively low
θmax values and long up times during the first phase of a disaster. This situation may be observed with underground power cabling, which although it could enable relatively high resistances to storms, it may not necessarily produce higher resilience values, as repairs of buried cables typically require more time than repairs to overhead lines.
(5) Brittleness: Brittleness relates the level of disruption with respect to the damage suffered by the power grid in a given location. Although brittleness and fragility are similar concepts, they should not be confused, because fragility represents the failure probability, which can be associated with
θmax, as explain in [
1], with respect to the intensity of the hazard [
47]. That is, a possible fragility curve when the hazard under consideration is a tropical cyclone is the curve given by Equation (3) of
O%max vs. ln(LTCIIMOI) in [
1], in which
LTCIIMOI represents the storm intensity and
O%max is equivalent to 100-times
θmax. Here, in the case of natural disasters in which the considered disruption is power outages, brittleness,
B, is measured for
N customers as:
where
D is the percentage of infrastructure damage in the area under evaluation. In general, the way in which
D is defined varies depending on the infrastructure characteristics in the area under evaluation. If the power infrastructure is primarily made of aerial lines,
D can be measured based on poles damaged with respect to total poles or cable spans with damage over total spans (usually, the number of spans and the number of poles are related). For example, in the case of primarily aerial infrastructure,
D = 3 if 3% of the poles in an area are expected or are observed to be damaged. If, instead, the area has most of the power infrastructure underground, then
D would represent the number of damage sections, which usually can be conventionally considered to be equal to 100 m long, with respect to the total number of buried cable sections. For larger areas and in some particular cases in which the interest is in substations’ infrastructure, it is also possible to consider
D as the total number of damaged substations in the area under consideration over the total number of substations. Still, the most common approach for considering
D is based on damage poles or spans in areas with aerial infrastructure or based on damaged cable sections in areas with buried infrastructures. Equation (10) presents a first order definition of
B as a value. However, it is expected that
θmax and
D are related and that they are also related to
σ. Hence,
B is in general a function. However, finding such a function is a very complex task that would likely require extensive research outside of the scope of this paper. For example, some of these difficulties were already identified in [
1], as a broad range of
θmax is observed with very low values of
D and relatively constant values for the
LTCIIMOI, which can be taken as an indication of
σ. Still, the analysis in [
1,
48] and various damage assessments indicate based on Equation (10) that power grids are relatively brittle systems in which very little damage,
i.e.,
D ≤1, can yield relatively high values of
θmax over 0.5. It is possible to define the inverse of brittleness as toughness.
(6) Dependency: In the context of this work, the dependency of one dependent infrastructure from another infrastructure, called its lifeline, is derived from [
49] as “a linkage or connection between two infrastructures, through which the state of one infrastructure influences or is correlated to the state of the other.” From this definition, it is possible to establish in general two types of dependencies. In one type of dependency, the connection between infrastructures is established based on a physical or topological relationship; in the other type of dependency, the connection is established based on the transfer of a “thing” representing a service or function necessary for the dependent infrastructure operation. In the particular case of power grids, a physical dependency exists if power grids’ infrastructure uses assets of another infrastructure, such as a bridge used to lay out cables to cross an obstacle. However, in the framework presented here, the relevant type of dependency for power grids is functional dependencies. In the case of power grids acting as lifelines, a functional dependency is established between loads and a power grid because loads require electric energy for their operation. Thus, in this case, the “thing” being transferred from the power grid to the loads establishing a functional dependency is electric energy. Moreover, since the dependent system on a power grid may be a node of another infrastructure or may be some load or loads, dependency on power grids is defined as the realization of a load’s need of electrical energy for its operation provided at least in part by a power grid.
When the dependent loads are nodes of another infrastructure system, it is possible to find cases in which power grids are, in turn, also dependent on these infrastructures. Hence, in these cases, an interdependency can be established because there exists a mutual dependency. Power grids’ physical dependency on other infrastructures, such as the aforementioned case of a transportation network, can be represented as a functional dependency by the appropriate definition of the dependency based on the function that provides the common physical asset to both infrastructures. For example, if it is considered that the exchanged “thing” or “function” from the transportation network to the power grid is physical connectivity because this is the function that a bridge provides, then the established dependency is of the functional type. Another example of power grids’ interdependence is with communication networks. In these cases, the function or service provided by the communication network necessary for the electric power grid operation is data or information connectivity. The concept of interdependency will be further discussed in detail in the next portion of this section, while the focus in this section is on loads’ dependence on power grids.
A key attribute associated with a power grid as seen by its loads is their degree of dependence. As was discussed in [
49], it is possible to quantitatively characterize the degree of dependence of each load from a power grid by measuring the amount of energy storage needed in order to reach a given target resilience. Since from Equation (1), the resilience of a power grid as seen by a load is analogous to an availability measurement, then based on the analysis presented in [
49], the degree of dependency of such a load from the electric power grid can be measured based on a dependent resilience
RL given by [
49]:
where
TS is the energy capacity of locally-stored energy at the load, e.g., in batteries, measured with respect to the autonomy such stored energy provides during a power grid outage and
µ is the equivalent repair rate of the load electric power supply. From (5) and the discussion that follows (5),
µ is the inverse of
TD. In Equation (11), the exponential factor represents the self-sufficiency component of the local resilience, which modifies the resilience that the customer would measure at its connection point with the electric grid if no local energy storage we represent. Equation (11) indicates that the concepts of lifeline resiliency and dependence are inherently integrated and confirm the intuitive notion that dependencies can reduce the resilience of dependent loads. However, from Equation (11), local energy storage (e.g., batteries or stored diesel fuel) can contribute to addressing this issue and in general make electric service at that particular site more resistant to disruptions. That is, local energy storage can be used to manage the effect of dependencies on resilience. In order to justify this statement, consider the following two extreme cases: a customer with no energy storage and a customer with infinite energy storage. In the former case, the local resilience equals the individual resilience provided by such customer, and hence, the customer will be completely dependent on the power grid to meet his or her electric power supply needs. The performance of the electric supply in this customer facility will, then, be identical to that provided by the electric power distribution tie. In the latter case, the customer could ideally power his or her facility indefinitely without the need for receiving power from the electric grid. Hence, the customer facility would not depend on the electric power grid. Evidently, this latter case will never be found in reality, but it serves to exemplify that changing the capacity of the locally-stored energy allows a customer to be from fully dependent to being independent and fully self-sufficient from an electric grid. Hence, in real applications, controlling the stored local energy will allow a customer to manage his or her level of dependency and, thus, the effect of dependencies on local resilience;
i.e., increasing locally-stored energy allows one to change dependency levels from full dependence to some reduced level of dependence. Thus, the presence of energy storage yields a dynamic notion of dependency because a failure in the power grid may be propagated into a load after a delay or it may not be propagated if
TS is sufficiently long. That is, energy storage acts as a buffer that regulates the propagation of disruptions from a power grid into the load equipped with such energy storage. Therefore, dependencies from a power grid can be managed and controlled with local energy storage. The type of energy storage used may also rise to the concept of conditional dependency, because replenishment of the energy storage device, such as a diesel fuel tank, may lead to a dependency on another infrastructure when the power grid is experiencing an outage (in the case of diesel, the conditional dependency is on transportation networks to deliver the fuel). However, since the lifeline whose function is required in a conditional dependency is not a power grid, further discussion of this notion is considered to be out of the scope of this paper and left for future work. It is also important to point out that the presence of renewable energy, e.g., wind turbines or PV modules, usually in combination with energy storage in order to address their partially-stochastic output nature, has a similar self-sufficiency effect as that represented by the exponential factor in Equation (11). However, calculation of the contribution of renewable energy sources on local resilience is much more complex than calculating the exponential form in Equation (11). One approach using Markov chains as the basis modeling tool is discussed in detail in [
50]. Based on this work, the combined effect of renewable energy sources and local energy storage to ensure that the renewable energy sources can be operated as dispatchable power generation units can be represented in the local resilience by replacing the exponential form in Equation (11) by a factor obtained by subtracting
πE in Equation (13) of [
50] from one. Additional details of how the use of local energy storage and renewable energy contributes to self-sufficient operation can be found in [
48,
51].
The notion of dependency and its inherent relationship with the concept of resilience and how outages in a power grid may or may not lead to a loss of power for customers with local energy storage can be highlighted by considering from Equation (11) that:
In this equation,
TD = 1/
µ represents how much opposition there is locally for a change in local resilience by adding locally-stored energy storage. That is, 1/
µ provides an indication of how much more or less energy storage is needed for the same local resilience. That is, the opposition to a change in resilience by using energy storage to manage the local effects of dependencies is primarily influenced by the down time of the grid at that local load,
i.e., this observation challenges the notion that underground cabling in electric power grids is necessarily better than overhead lines. Although observations from Hurricane Sandy discussed in [
1] seem to support the notion that underground electric power facilities are more resistant to storms, the same observations also agree with the fact that buried cables and underground infrastructure takes longer to repair than overhead cables and above-ground infrastructure. Thus, from the customers’ perspective, for the same load, more local energy storage and/or additional local power generation from renewable sources will be needed when fed with a mostly underground power distribution grid than from an above-ground power distribution system in order to achieve the same resilience in both design approaches. Hence, underground power distribution facilities imply higher costs for both the electric power utility and its customers and may not necessarily yield improved resilience.
(7) Interdependency: As was mentioned above in a general sense, interdependency is a mutual dependency between two or more infrastructures [
49]. In the particular case of power grids, interdependency is a mutual dependency between an electric power system and another infrastructure system, such as communication networks. This is a common example given as an interdependency, which, however, requires some clarification that will lead to some key observations within this resilience framework. Usually, interdependency between power grids and communication networks is said to be established because communication facilities require electric power from power grids and because electric power grids need data and information connectivity to support management and control functions. Although this is true, it is relevant to indicate that electric power grids only use public communication networks—those networks used by the general public to communicate—on a very limited basis, such as a documented case in Chile [
52]. In general, most electric power grids rely on separate dedicated communication networks that are part of the electric power infrastructure and do not require public communication networks to operate. Nevertheless, it can be argued that increased deployment of smart grid technologies at the power distribution level may lead to increased future dependence of power grids on public communication networks because deployment of dedicated communication networks with sufficient bandwidth may likely require a significant investment that may make the use of public communication networks by electric power distribution utilities an undesirable, but practically unavoidable necessity. Still, in the present, dedicated communication networks used by power grids require electric power and use locally-stored energy primarily in batteries located at substations to limit the effect that loss of power could have on the communication network nodes.
Still, power grids’ dependence on public communication networks is observed in a different way than the one indicated above. Electric power utilities may rely on public communication networks to transmit information to coordinate and prioritize resource allocation and to manage and control service restoration and infrastructure repair processes. Additionally, these processes are supported by financial services that rely heavily on public communication networks. It is, then, possible to distinguish two types of dependencies. That is, whereas communication networks or, generally, loads, exemplify a case in which the functional need is directly transferred from a lifeline to its dependent infrastructure or load, the case of power grids’ dependence on communication networks represents the case in which the functional need is transferred indirectly from one system to its dependent system by having humans transmitting information through a public communications network and acting based on such information on power grids. That is, the former represents a case of direct functional dependency, whereas the latter exemplifies cases of indirect functional dependencies. Notice that in the latter case, humans participate as interfaces between power grids and their lifeline systems, because in the cases of information transmission to manage operational processes and to manage financial resources, humans need to intervene for the transfer of the functional need to occur, e.g., in the case of financial resources, humans are typically needed in practice at least in order to approve transactions. Still, it is possible to find ways to represent the level of these dependencies with the use of local buffering or holding functions. In the case of dependence on communication networks for information transmission, [
53] presents an exponentially decreasing function similar to Equation (11) in order to represent the probability that a user will still hold a call after an interruption, or lower than required signal quality, that lasted for a given holding time. Similarly, data buffers can be sized so they store information at a reduced rate compared to the minimum required one to be understandable and then output all of the information together at the required rate. Likewise, locally-stored financial assets could help to address temporary disruptions in communication networks affecting the normal flow of financial assets that are essential for the operation of power grids. Notice that in the case of indirect dependencies, it is possible to characterize the state of the lifeline system,
i.e., communication networks, based on the quality of service references. In these cases, it is possible to define a minimum quality of service level that will be required in order to meet the dependent infrastructure,
i.e., power grids, operational needs and that can be used in order to determine up and down times. This discussion suggest a common issue affecting practical application of buffers—energy, financial or others—in order to manage dependencies that can have a severe effect on resilience during extreme events. All of these forms of buffers have a considerable cost, which, in practice, are mostly needed only during extreme events. However, in practical applications at the time of deciding on investing in these buffers, there is no certainty that such disasters would occur. For example, the hurricane return period for the southern coast of east Florida is about seven years. Yet, at the time of writing these lines, the last hurricane that affected this portion of Florida was Hurricane Katrina 10 years ago. That is, investment in extended battery backup for communication facilities made immediately after Hurricane Katrina in order to manage dependencies with the power grid in anticipation of a future hurricane would have not seen an adequate pay off because the typical battery lifetime is 10 years, a period when no hurricane affected this area. Still, although it is relevant in this paper to put into context practical aspects involved in managing dependencies and risk, the complexities of evaluating these types of investments is not within the scope of this work.
The influence of humans as participants in indirect dependence relationships hints at one important aspect of this framework. Even when power restoration crews may not always use public communication networks for coordinated restoration activities and use, instead, private communication systems based on radios or satellite phones, and even when the participation of administrative personnel in financial processes could be reduced, humans will still be involved in the operation and management of power grids. For example, restoration crews will still be necessary after disasters in order to repair damaged infrastructure components even if they use a private communication system. Humans will also be essential in planning networks and designing mitigation strategies based on lessons from previous extreme events. Hence, humans are fundamental parts of infrastructure systems, such as power grids, based on their participation in all processes involved in maintaining such infrastructures’ operations. Therefore, although infrastructures are traditionally defined based on an arrangement of physical assets, the proposed framework here implicitly considers humans as an equally important part of infrastructure systems, including power grids. Such a notion was practically acknowledged by Mr. William Smith, CTO of Bellsouth Inc., who in his testimony to the U.S. Senate on 6 February 2006 explained that there were two “integral pieces” of how Bellsouth responded to Hurricane Katrina: “the people, and the network” and that “without our people, we would have no company and no network.” In the framework presented here, human influence on power grids’ resilience metrics is considered through the influence on the management and implementation of restoration, repairs, logistics and other processes. In turn, such influence is accounted through the down time
TD in Equations (1), (2), (11) and other metrics. This integral nature of infrastructure operators and resilience was also highlighted when Mr. Smith indicated that “immediately prior to Katrina making landfall, we also took steps to ensure adequate supplies and services were on hand, sending non-perishable food to strategic areas where employees could be stationed, setting up structural materials including tents, showers, toilets, tables and chairs, and engaging janitorial and guard services. Our experience with prior hurricanes taught us that our employees will be called upon to work round the clock, and they can best perform the extraordinary tasks expected of them if their basic needs for food, shelter, and the safety of their family are addressed.” Hence, industry processes related to logistics and to assets and human resources management are essential components of infrastructure systems. Moreover, modern infrastructure systems, including power grids, will also include a cybernetic component associated with data and information processing and storage. Hence, as
Figure 3 represents, power grids are integrated human-cyber-physical systems. All of these three components affect power grids’ resilience, and for this reason, all three of them are considered in this framework. However, in the same way that power grids are made of an integral combination of three such components, their consideration in the proposed framework is made in an integral, implicit way that does not necessarily allow one to differentiate the specific contributions of each of these three components towards resilience.
Figure 3.
The three main components of a power grid as a human-cyber-physical system.
Figure 3.
The three main components of a power grid as a human-cyber-physical system.
4. Application and Validation of the Resilience Model Based on Field Data
The proposed metrics can be used to evaluate power grids’ performance during natural disasters and draw some lessons that could serve to influence mitigation efforts and preparation for future events. In order to place these lessons into a practical context,
Table 1 presents some basic resilience metrics for recent natural disasters: the 27 February 2010 earthquake and tsunami in Chile, the 11 March 2011 earthquake and tsunami in Japan, the 22 February 2011 earthquake in Christchurch, New Zealand, and the following hurricanes: Isaac (2012), Sandy (2012) and Ike (2008). These metrics are calculated using actual data collected during these events. In this case,
T is considered from the time the first effects of the disaster were noticed until restoration work was completed. That is,
T =
∆t1 +
∆t2. Average up and down times for each area are also indicated in
Table 1. In the last two columns,
Table 1 shows the calculated values for
RB and for
RL when one day of equivalent energy storage is used locally to reduce dependency on the power grid. The choice for one day was selected in order to provide a simple normalized reference when considering the related values in
Table 1. Although in some cases,
RL seems to show a perfect resilience of one, this value is the product of rounding up to two decimal places.
Table 2 provides additional information by showing the values obtained for brittleness and resistance of several areas affected in 2012 by Hurricane Sandy and in 2008 by Hurricane Ike. These two hurricanes were selected because of the geographic similarities between Galveston Bay and the bays south of New York City. Additionally, both areas have zones with some somewhat different power grid design approaches with more underground facilities in Houston and New York City than in the surrounding areas. In these cases,
σ is considered to be equal to the natural logarithm of the
LTCIIMOI presented in [
1]. This choice for
σ was taken as a reference for analysis here. However, as was indicated above, future research may yield better fitted indexes for
σ and, preferably, a unifying approach to characterizing
σ regardless of the event. Such analysis requires extensive research outside of the scope of this paper.
Table 1.
Base and dependent resilience in various recent natural disasters.
Table 1.
Base and dependent resilience in various recent natural disasters.
| Event | Area | Area Type | θmax | TU (Days) | TD (Days) | RB | RL (TS = 1 Day) |
|---|
| Chile Earthquake (EQ) | Region VIII | Total | 1.00 | 11.42 | 5.58 | 0.67 | 0.73 |
| Japan EQ | Tohoku affected area | Total | 1.00 | 37.25 | 2.71 | 0.93 | 0.95 |
| Hurricane (H.) Isaac | Entire affected area | Total | 0.72 | 15.56 | 2.65 | 0.85 | 0.90 |
| H. Isaac | Ascension | Parish | 0.56 | 17.10 | 1.11 | 0.94 | 0.98 |
| H. Isaac | Assumption | Parish | 0.35 | 17.47 | 0.73 | 0.96 | 0.99 |
| H. Isaac | Jefferson | Parish | 0.83 | 14.63 | 3.57 | 0.80 | 0.85 |
| H. Isaac | Lafourche | Parish | 0.75 | 15.49 | 2.72 | 0.85 | 0.90 |
| H. Isaac | Orleans | Parish | 0.86 | 14.67 | 3.54 | 0.81 | 0.85 |
| H. Isaac | Plaquemines | Parish | 0.95 | 10.73 | 7.48 | 0.59 | 0.64 |
| H. Isaac | St. Bernard | Parish | 0.92 | 14.77 | 3.43 | 0.81 | 0.86 |
| H. Isaac | St. John the Baptist | Parish | 0.98 | 13.26 | 4.94 | 0.73 | 0.78 |
| H. Isaac | Terrebone | Parish | 0.85 | 16.29 | 1.91 | 0.89 | 0.94 |
| H. Sandy | Monmouth (NJ) | County | 0.95 | 12.67 | 6.06 | 0.68 | 0.73 |
| H. Sandy | Atlantic | County | 0.65 | 10.17 | 1.52 | 0.87 | 0.93 |
| H. Sandy | Staten Island | Borough | 0.70 | 16.20 | 2.55 | 0.86 | 0.91 |
| H. Sandy | Queens | Borough | 0.18 | 17.70 | 1.05 | 0.94 | 0.98 |
| H. Sandy | Manhattan | Borough | 0.40 | 17.35 | 1.40 | 0.93 | 0.96 |
| H. Sandy | Brooklyn | Borough | 0.11 | 18.35 | 0.40 | 0.98 | 1.00 |
| H. Sandy | Bronx | Borough | 0.12 | 18.23 | 0.52 | 0.97 | 1.00 |
| H. Sandy | Suffolk | County | 0.76 | 15.08 | 3.54 | 0.81 | 0.86 |
| H. Sandy | Nassau | County | 0.93 | 12.69 | 5.93 | 0.68 | 0.73 |
| H. Ike | Anderson | County | 0.38 | 25.09 | 0.85 | 0.97 | 0.99 |
| H. Ike | Austin | County | 0.10 | 25.41 | 0.53 | 0.98 | 1.00 |
| H. Ike | Brazoria | County | 0.85 | 19.55 | 6.39 | 0.75 | 0.79 |
| H. Ike | Chambers | County | 1.00 | 15.94 | 10.00 | 0.61 | 0.65 |
| H. Ike | Cherokee | County | 0.76 | 23.52 | 2.42 | 0.91 | 0.94 |
| H. Ike | Fort Bend | County | 0.86 | 22.34 | 3.60 | 0.86 | 0.90 |
| H. Ike | Galveston | County | 0.91 | 17.05 | 8.89 | 0.66 | 0.69 |
| H. Ike | Harris | County | 0.98 | 18.23 | 7.71 | 0.70 | 0.74 |
| H. Ike | Henderson | County | 0.11 | 25.76 | 0.18 | 0.99 | 1.00 |
| H. Ike | Houston | County | 0.63 | 24.05 | 1.89 | 0.93 | 0.96 |
| H. Ike | Jefferson | County | 1.00 | 18.45 | 7.50 | 0.71 | 0.75 |
| H. Ike | Liberty | County | 0.92 | 17.80 | 8.14 | 0.69 | 0.72 |
| H. Ike | Matagorda | County | 0.13 | 25.78 | 0.16 | 0.99 | 1.00 |
| H. Ike | Montgomery | County | 0.98 | 19.66 | 6.28 | 0.76 | 0.79 |
| H. Ike | Orange | County | 1.00 | 20.83 | 5.11 | 0.80 | 0.84 |
| H. Ike | Sabine | County | 0.61 | 24.77 | 1.17 | 0.95 | 0.98 |
| H. Ike | Shelby | County | 0.37 | 24.90 | 1.04 | 0.96 | 0.98 |
| Christchurch EQ | Christchurch and surrounding area | City | 0.80 | 13.46 | 2.59 | 0.84 | 0.89 |
Table 2.
Resistance and brittleness in various areas affected by hurricanes Sandy and Ike and St. Bernard Parish affected by Hurricane Isaac in 2012.
Table 2.
Resistance and brittleness in various areas affected by hurricanes Sandy and Ike and St. Bernard Parish affected by Hurricane Isaac in 2012.
| Event | Area | θmax | RB | σ (ln(LTCIIMOI)) [1] | | φ | φI | D | B |
|---|
| H. Sandy | Staten Island | 0.70 | 0.86 | 6.624 | 0.645 | 6.09 | 4.27 | 20 | 3.51 |
| H. Sandy | Queens | 0.18 | 0.94 | 6.458 | 0.910 | 31.80 | 5.88 | 1 | 18.49 |
| H. Sandy | Manhattan | 0.40 | 0.93 | 6.298 | 0.794 | 12.56 | 5.00 | 5 | 7.96 |
| H. Sandy | Brooklyn | 0.11 | 0.98 | 6.470 | 0.944 | 55.99 | 6.10 | 2 | 5.45 |
| H. Sandy | Bronx | 0.12 | 0.97 | 6.090 | 0.932 | 49.06 | 5.68 | 1 | 11.57 |
| H. Sandy | Suffolk | 0.76 | 0.81 | 6.328 | 0.544 | 4.53 | 3.44 | 1 | 75.98 |
| H. Sandy | Nassau | 0.93 | 0.68 | 6.557 | 0.493 | 3.49 | 3.23 | 1 | 92.65 |
| H. Ike | Anderson | 0.38 | 0.97 | 7.380 | 0.881 | 16.97 | 6.50 | 1 | 38.31 |
| H. Ike | Austin | 0.10 | 0.98 | 6.217 | 0.948 | 61.17 | 5.89 | 1 | 9.63 |
| H. Ike | Brazoria | 0.85 | 0.75 | 7.406 | 0.954 | 8.33 | 7.07 | 10 | 8.48 |
| H. Ike | Chambers | 1.00 | 0.61 | 7.464 | 0.403 | 3.00 | 3.00 | 30 | 3.33 |
| H. Ike | Cherokee | 0.76 | 0.91 | 6.548 | 0.792 | 6.82 | 5.19 | 1 | 76.08 |
| H. Ike | Fort Bend | 0.86 | 0.86 | 7.040 | 0.953 | 7.79 | 6.71 | 1 | 86.18 |
| H. Ike | Galveston | 0.91 | 0.66 | 7.222 | 0.291 | 2.32 | 2.10 | 50 | 1.81 |
| H. Ike | Harris | 0.98 | 0.70 | 5.986 | 0.850 | 5.20 | 5.09 | 8 | 12.23 |
| H. Ike | Henderson | 0.11 | 0.99 | 5.273 | 0.960 | 45.92 | 5.06 | 1 | 11.02 |
| H. Ike | Houston | 0.63 | 0.93 | 6.775 | 0.724 | 7.78 | 4.91 | 1 | 63.12 |
| H. Ike | Jefferson | 1.00 | 0.71 | 7.146 | 0.563 | 4.03 | 4.03 | 50 | 2.00 |
| H. Ike | Liberty | 0.92 | 0.69 | 6.879 | 0.569 | 4.26 | 3.91 | 1 | 91.84 |
| H. Ike | Matagorda | 0.13 | 0.99 | 4.841 | 0.966 | 35.02 | 4.68 | 1 | 13.35 |
| H. Ike | Montgomery | 0.98 | 0.76 | 4.317 | 0.545 | 2.40 | 2.35 | 1 | 97.95 |
| H. Ike | Orange | 1.00 | 0.80 | 4.317 | 0.457 | 1.97 | 1.97 | 1 | 100.0 |
| H. Ike | Sabine | 0.61 | 0.95 | 5.617 | 0.876 | 8.12 | 4.92 | 1 | 60.55 |
| H. Ike | Shelby | 0.37 | 0.96 | 4.317 | 0.940 | 10.84 | 4.06 | 1 | 37.47 |
| H. Isaac | St. Bernard | 0.92 | 0.81 | 6.680 | 0.340 | 2.48 | 2.27 | 15 | 6.11 |
When considering
Table 1, it is possible to observe that, in general, higher resilience values are observed with lower values of
θmax, as is confirmed in
Figure 4 showing a plot of
RB vs. θmax and by observing that a relatively high
R2 value of 0.714 is found with a second order polynomial curve fit of the form:
This relationship can be explained by practical observations indicating that, usually, lower values of
θmax imply that a lower number of customers experienced an outage, and thus, fewer circuits are affected. Hence, service restoration for lower values of
θmax tend to be simpler and, thus, cause lower down times. This explanation is confirmed in
Figure 5, showing a very strong relationship between
TD and
θmax with an
R2 value of 0.862 corresponding to the fitting exponential curve:
The strong relationship between
θmax,
RB and
TD can also be explored by defining a factor
γ equal to the ratio
RB/
θmax. The resulting plot of
TD vs. γ is shown in
Figure 6. The curve fit for this plot is:
which has an
R2 value of 0.869. The existence of such strong correlation among parameters that are intuitively expected to be related seems to provide an additional validation for the metrics proposed in this resilience framework. These correlations seem to motivate further studies that could help to understand how these parameters relate to design parameters, components’ selection and structural relationships influencing power distribution grids’ performance during extreme events. However, due to their extension and complexity, these studies are left for future works, as this paper focuses on presenting resilience metrics and, in particular here, identifying statistical relationships in these specific cases as a way to support validation of the approach presented for the proposed framework.
Figure 4.
Regression curve and points for
RB vs. θmax for the data in
Table 1.
Figure 4.
Regression curve and points for
RB vs. θmax for the data in
Table 1.
Figure 5.
Regression curve and points for
TD vs. θmax for the data in
Table 1.
Figure 5.
Regression curve and points for
TD vs. θmax for the data in
Table 1.
Figure 6.
Regression curve and points for γ =
RB/
θmax.
vs. TD for the data in
Table 1.
Figure 6.
Regression curve and points for γ =
RB/
θmax.
vs. TD for the data in
Table 1.
In
Table 1, it is also possible to make some more observations that apply to particular cases. For example, it is interesting to compare the cases of the earthquakes in Chile and Japan because of their similarities: both cases involve very well-constructed power grids prepared for intense earthquakes, and both events had a similar intensity with the epicenter in the ocean, which in both cases caused a significant tsunami that affected the coastline. Although in both cases, a complete power outage affected both areas, Japan’s grid was more resilient, as it had a shorter down time. Japan’s power grid was also more resilient than the power grid serving the city of Christchurch, New Zealand, even when in this earthquake, not all of the electricity customers lost power. However, since a significant portion of the electric power distribution grid in Christchurch was buried, many cables experienced failures due to soil liquefaction and ground shaking or other ground movements that took longer to repair than cables located overhead, as is observed with the vast majority of electric power lines in Japan. Practical experience also serves to exemplify the effect that different conditions affecting restoration speeds have on resilience. For example, when examining Hurricane Isaac data, the low resilience observed in Plaquemines Parrish stands out, particularly compared to the data from St. John the Baptist data, as both areas flooded; they are served by the same electric power distribution utility using the same design approaches, and they both experienced similar
θmax levels. However, power restoration in Plaquemines Parish is more complicated because, contrary to the case of St. John the Baptist Parish, where there are various roads to access the town of La Place, there is only one road accessing each of the Mississippi River Delta shores (LA Hwy 23 on the south shore and LA Hwy 39 on the north shore). Hence, restoration speed in Plaquemines Parrish was relatively slow, as demonstrated by a
TD equal to 7.48 in
Table 1, because restoration crews needed to wait for flood waters to recede or use slower means of transportation using waterways. Thus, limited access made the power distribution grid in Plaquemine Parrish more susceptible to experience lower values of base resilience than the power distribution grid in St. John the Baptist Parish. Such susceptibility could loosely be related to the concept of vulnerability, which is not included within the scope of this paper due to the complexity and extension that such a discussion would imply. Hence, this represents a possible path for expanding this proposed framework in order to support design efforts, while at the same time considering the effect of humans on processes essential for critical infrastructures’ performance. Examples of past works that represent this possible path include [
54,
55].
Table 2 can be used in combination with
Table 1 to explore further practical insights. In
Table 2, it is possible to observe that most of the calculated individual resistances fall within a relatively narrow range. The average individual resistance for all indicated areas in
Table 2 equals 4.533 with a standard deviation of 1.479. In general, it is possible to observe that both
φI and
φ have a general tendency in which a higher resistance implies a higher resilience. This is an already indicated and expected observation, as resistance is characterized withstanding capability, which is a component of resilience. However, as
Figure 7 shows,
φ has a stronger regression fit than
φI with curves of increasing resilience for increasing resistance. The reason for the better fit for
φ is that its value is affected by
θmax, which, as previously indicated in
Figure 7 and
Figure 8, is strongly related to
TD. As a result, as
Figure 8 represents,
θmax will establish a strong relationship between
φ and
TD and, hence, with
RB. However, since
φI is not influenced by
θmax, it has no clear relationship with
TD (see
Figure 9) and, thus, a weaker relationship with
RB. The influence of
θmax on
φ may lead to cases, such as Harris and Henderson counties after Hurricane Ike, in which areas could have similar values for
φI, but dissimilar values for
φ. The reason for this difference is that the ratio
represents one aspect of the withstanding capability of a system, and although this value could be similar for two areas of the same disaster, differences in how severe the disruption
θmax is when it occurs could lead to difference values in
φ, but similar values of
φI. Hence, individual customers may perceive a different grid resistance than the measurement done by the electric utility serving such customers, because
φ considers the overall performance of many customers (not all of them may experience a power outage) that an individual customer cannot evaluate. As expected and as
Table 2 indicates, neither
φI nor
φ show a significant relationship between resistance and damage or brittleness.
Figure 7.
Resistance
vs. base resilience for the data points in
Table 2 and trend curve equations. (
a) Resistance for multiple loads; (
b) Individual resistance.
Figure 7.
Resistance
vs. base resilience for the data points in
Table 2 and trend curve equations. (
a) Resistance for multiple loads; (
b) Individual resistance.
Figure 8.
(a) Resistance vs. θmax; (b) Resistance vs. down time.
Figure 8.
(a) Resistance vs. θmax; (b) Resistance vs. down time.
Figure 9.
Individual resistance vs. down time.
Figure 9.
Individual resistance vs. down time.
Some other practical observations can also be made from
Table 2. In the case of Hurricane Sandy, despite having most of the power distribution cables underground, both resistance metrics of Manhattan during Hurricane Sandy are about average. This is explained by the fact that a significant cause of the power outages affecting Lower Manhattan originated in a failure in a substation at a power plant located on an island, making Manhattan’s resistance less than that of neighboring areas powered also from other power stations. Chambers and Galveston counties during Hurricane Ike are two areas that show particularly low values of resistance, which may be explained by the fact that most areas in these counties are served by a single, relatively long sub-transmission line, such as the one serving the Bolivar Peninsula that failed soon after the first effects of the storm were felt. It is also interesting to compare both Chambers and Galveston counties during Hurricane Ike with St. Bernard Parish during Hurricane Isaac (also shown in
Table 2) and Nassau County during Hurricane Sandy. Although these four areas have similar
θmax values above 0.9 and similar low resistances, the power grid in St. Bernard shows a higher resilience value than the other three areas discussed in this section of this paragraph. This is relevant, particularly when compared to Nassau County after Hurricane Sandy, because damage levels in both areas were lighter than damage observed in the two counties affected by Ike, even in areas of St Bernard Parish unprotected by the new levee system. The difference in power grids’ resilience most likely originates in different approaches to manage service restoration processes, which led to relatively long down times for Nassau County and shorter down times for St Bernard Parish. Hence, the power grid in Nassau County with Sandy shows similar resilience as the power grid in Chambers or Galveston counties, where damage in some areas was extreme (e.g., in Gilchrist, Texas). Although the power grid in Nassau County after Sandy had a higher resistance than that the power grid in Chambers or Galveston counties after Ike, its resistance is still low. Moreover, the performance of the power grid in Chambers and Galveston counties after Ike was significantly influenced by the intensity of Hurricane Ike, whereas Sandy was not as intense when affecting Nassau County. As a result, the power grid in Nassau County was very brittle under the effects of Hurricane Sandy, while the opposite characteristic is observed for the power grids in Chambers and Galveston counties after Ike. Still, these data suggest that in general, higher resistance is equivalent to higher resilience.


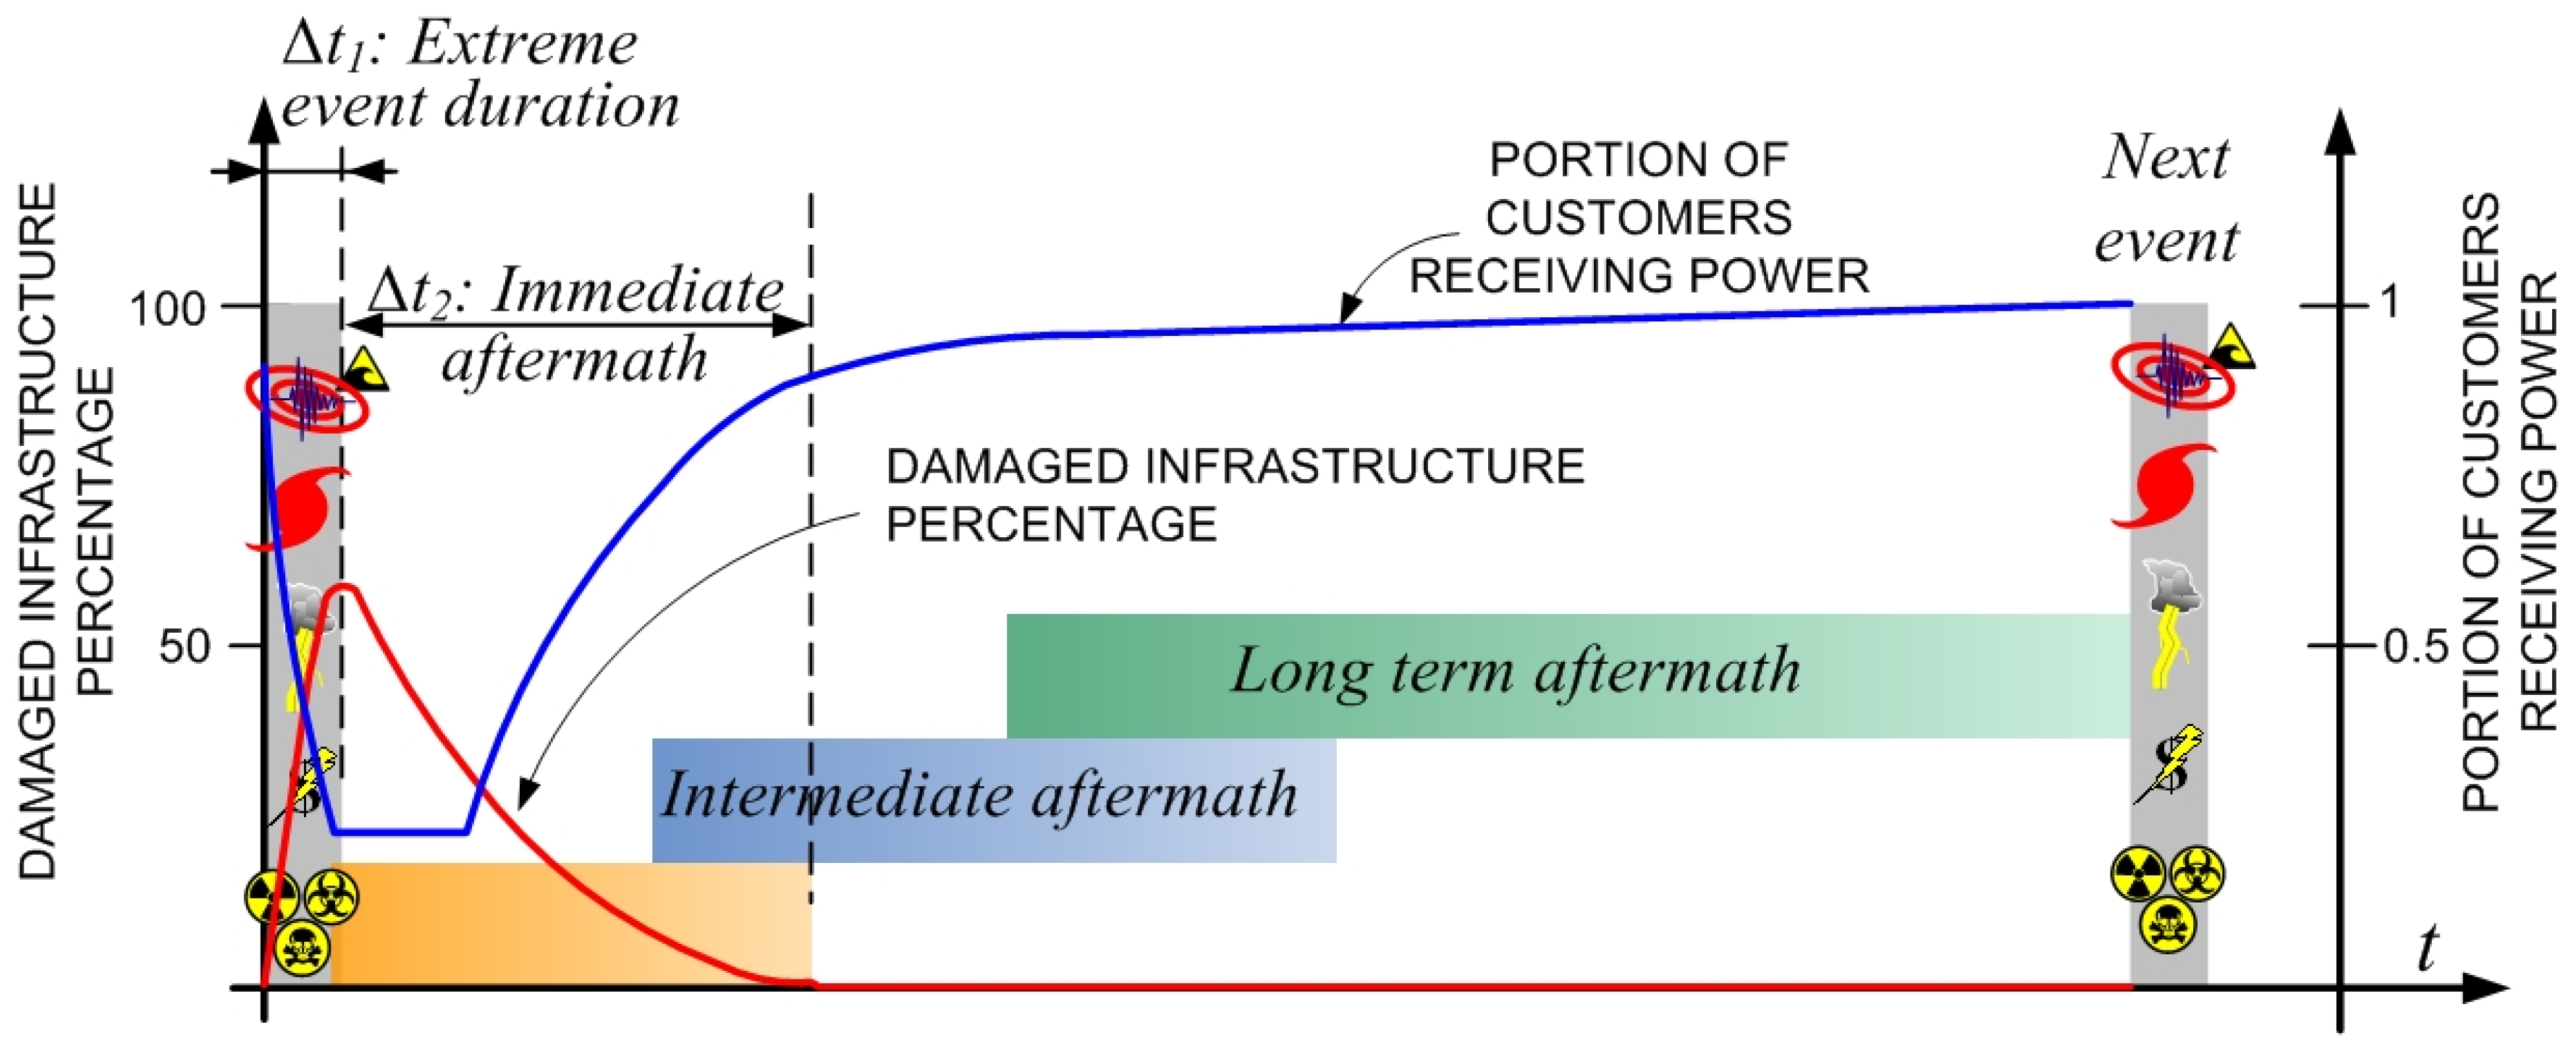
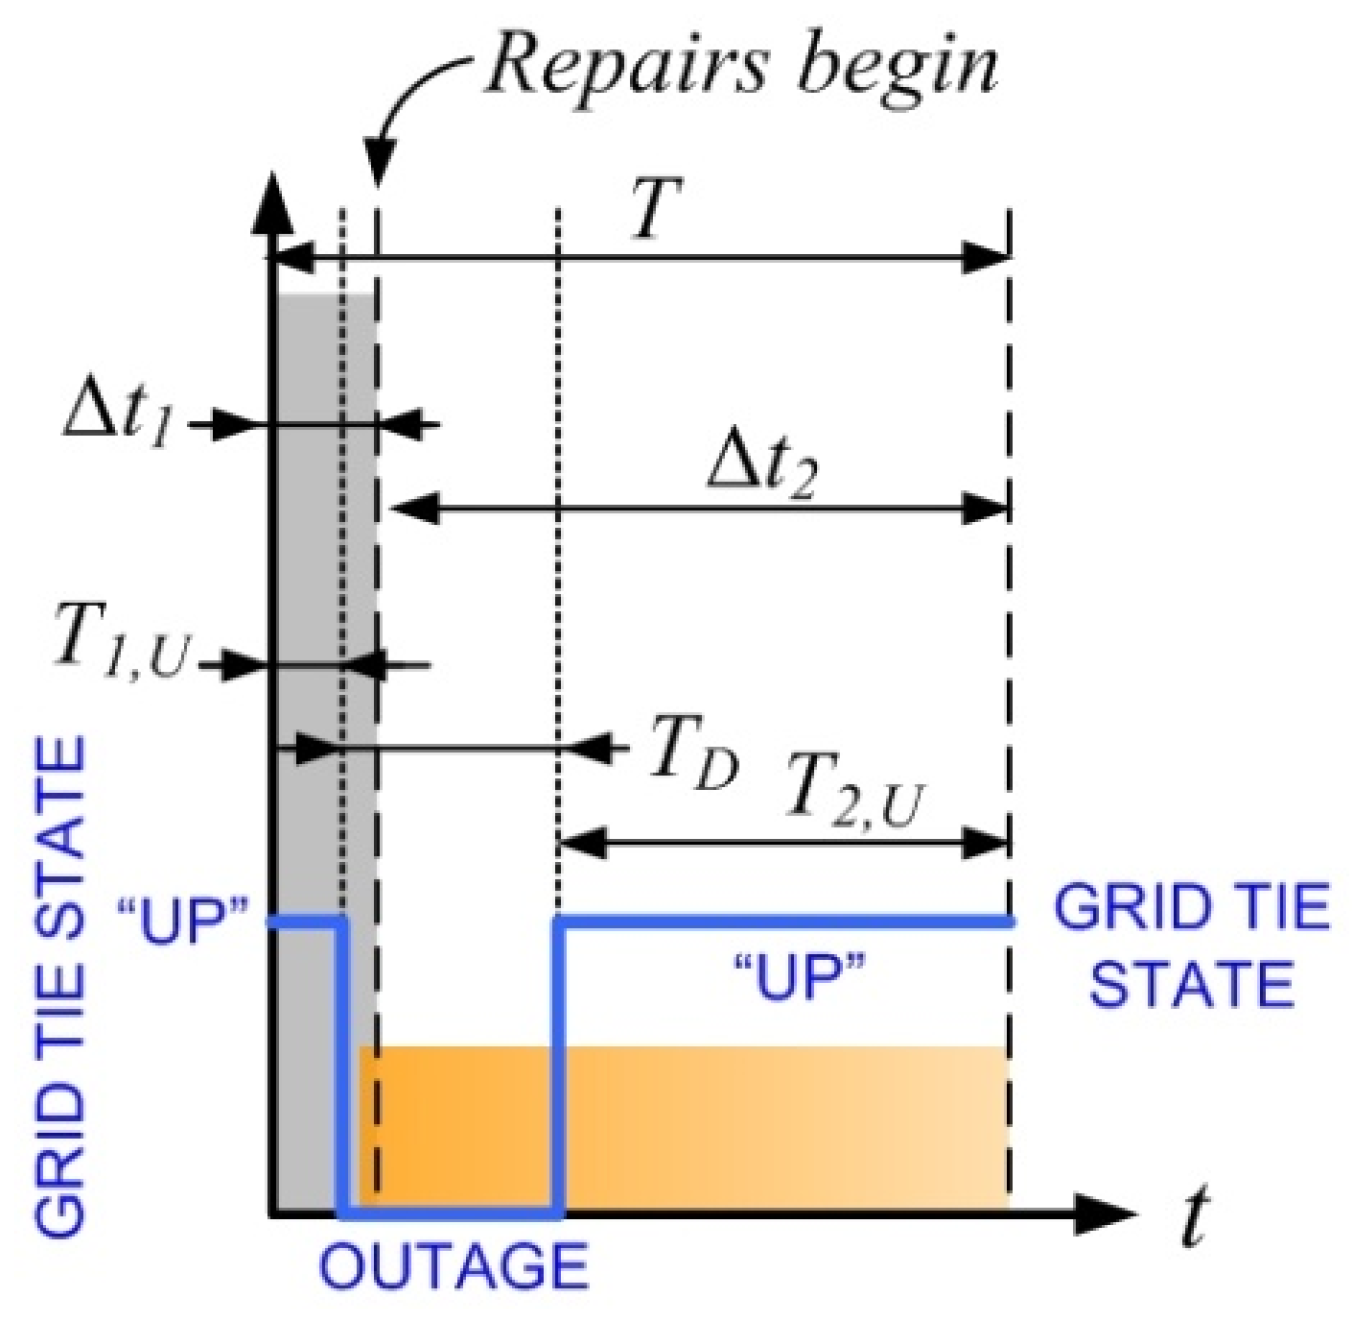
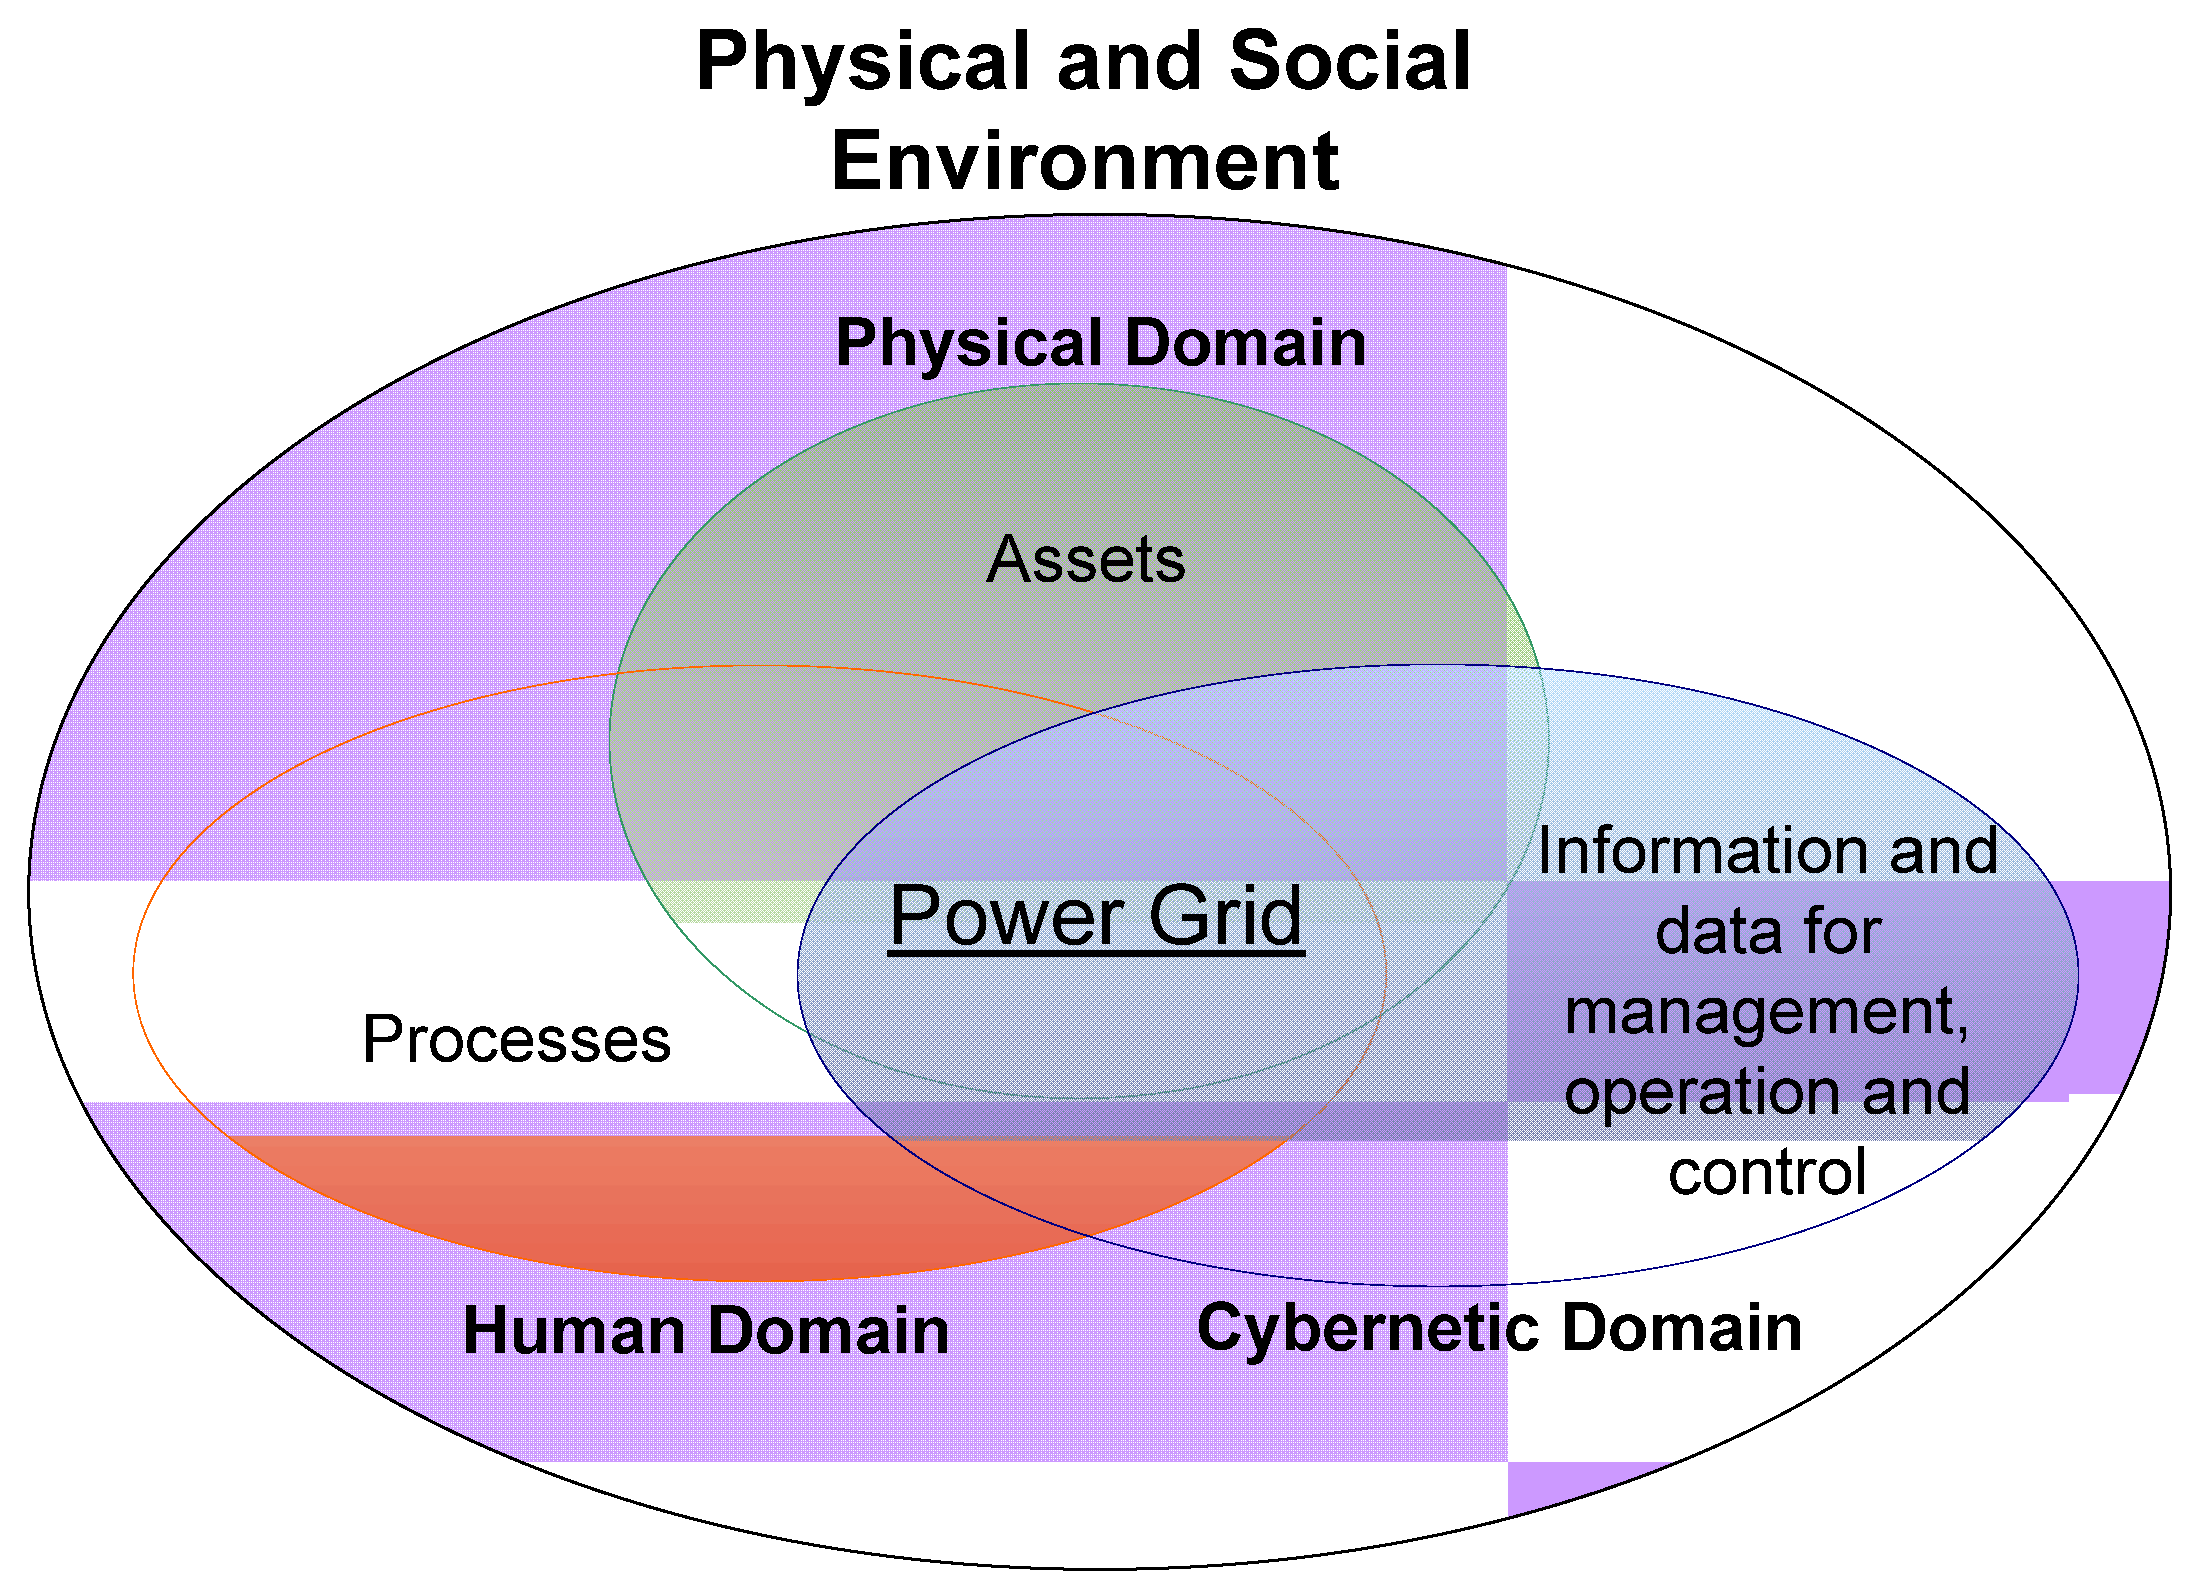
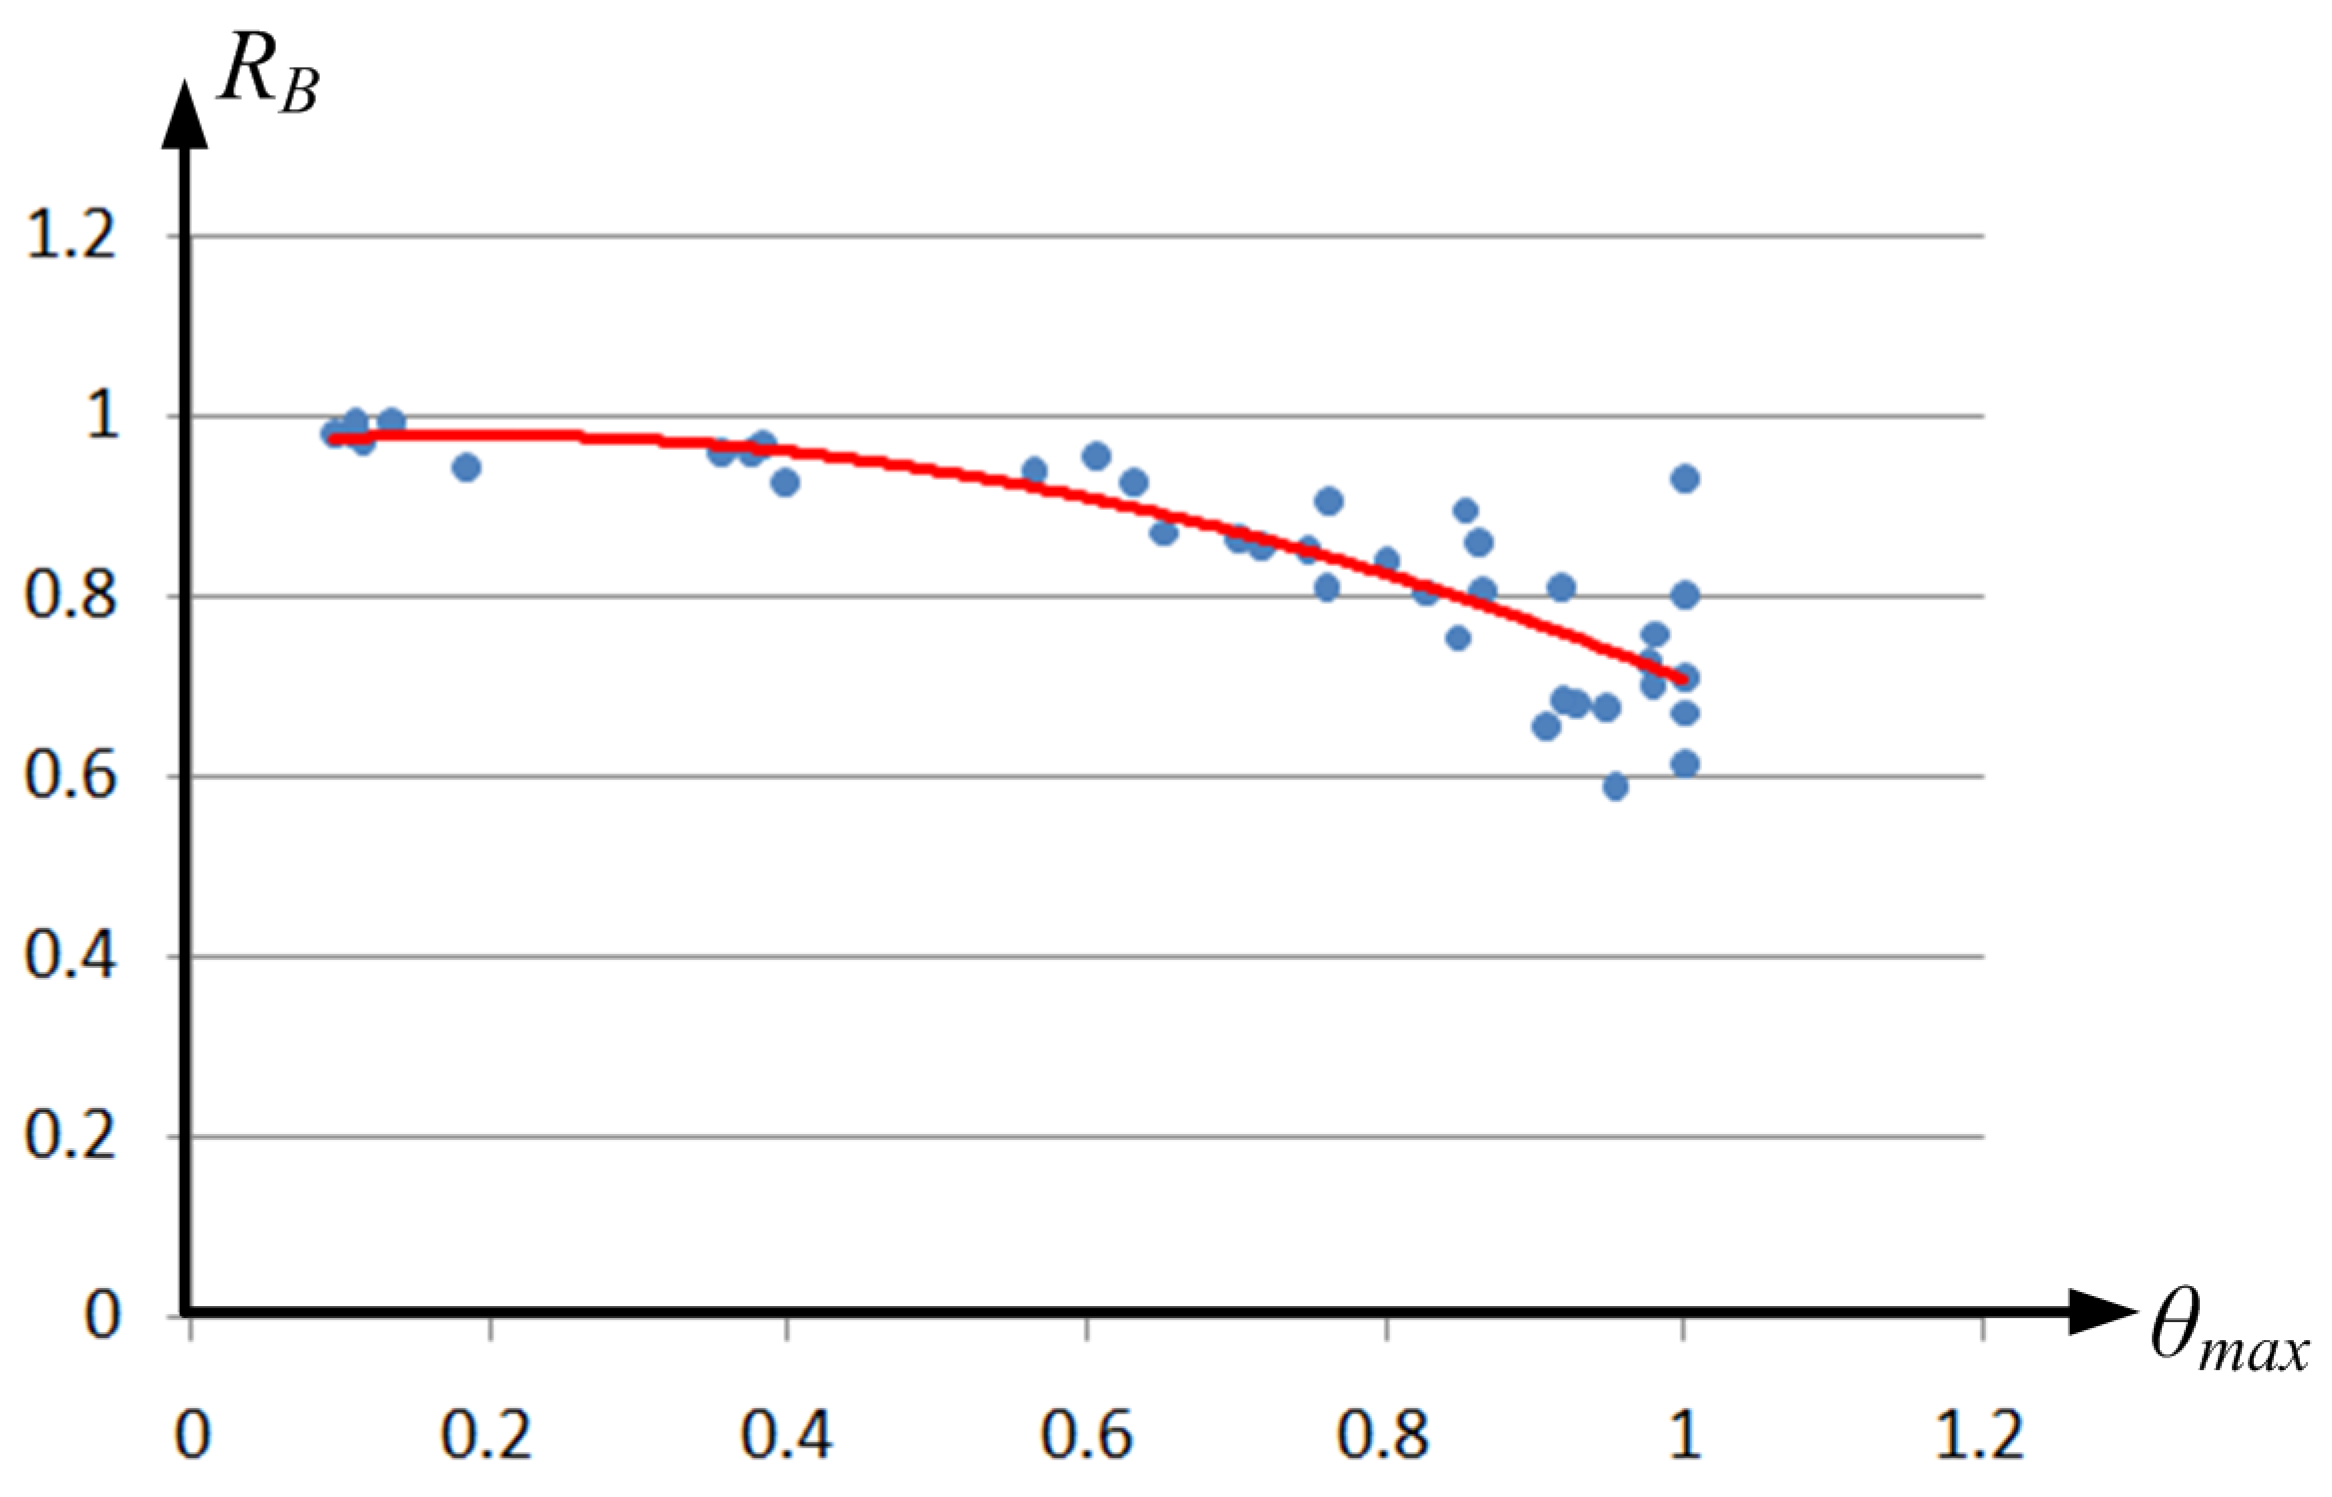
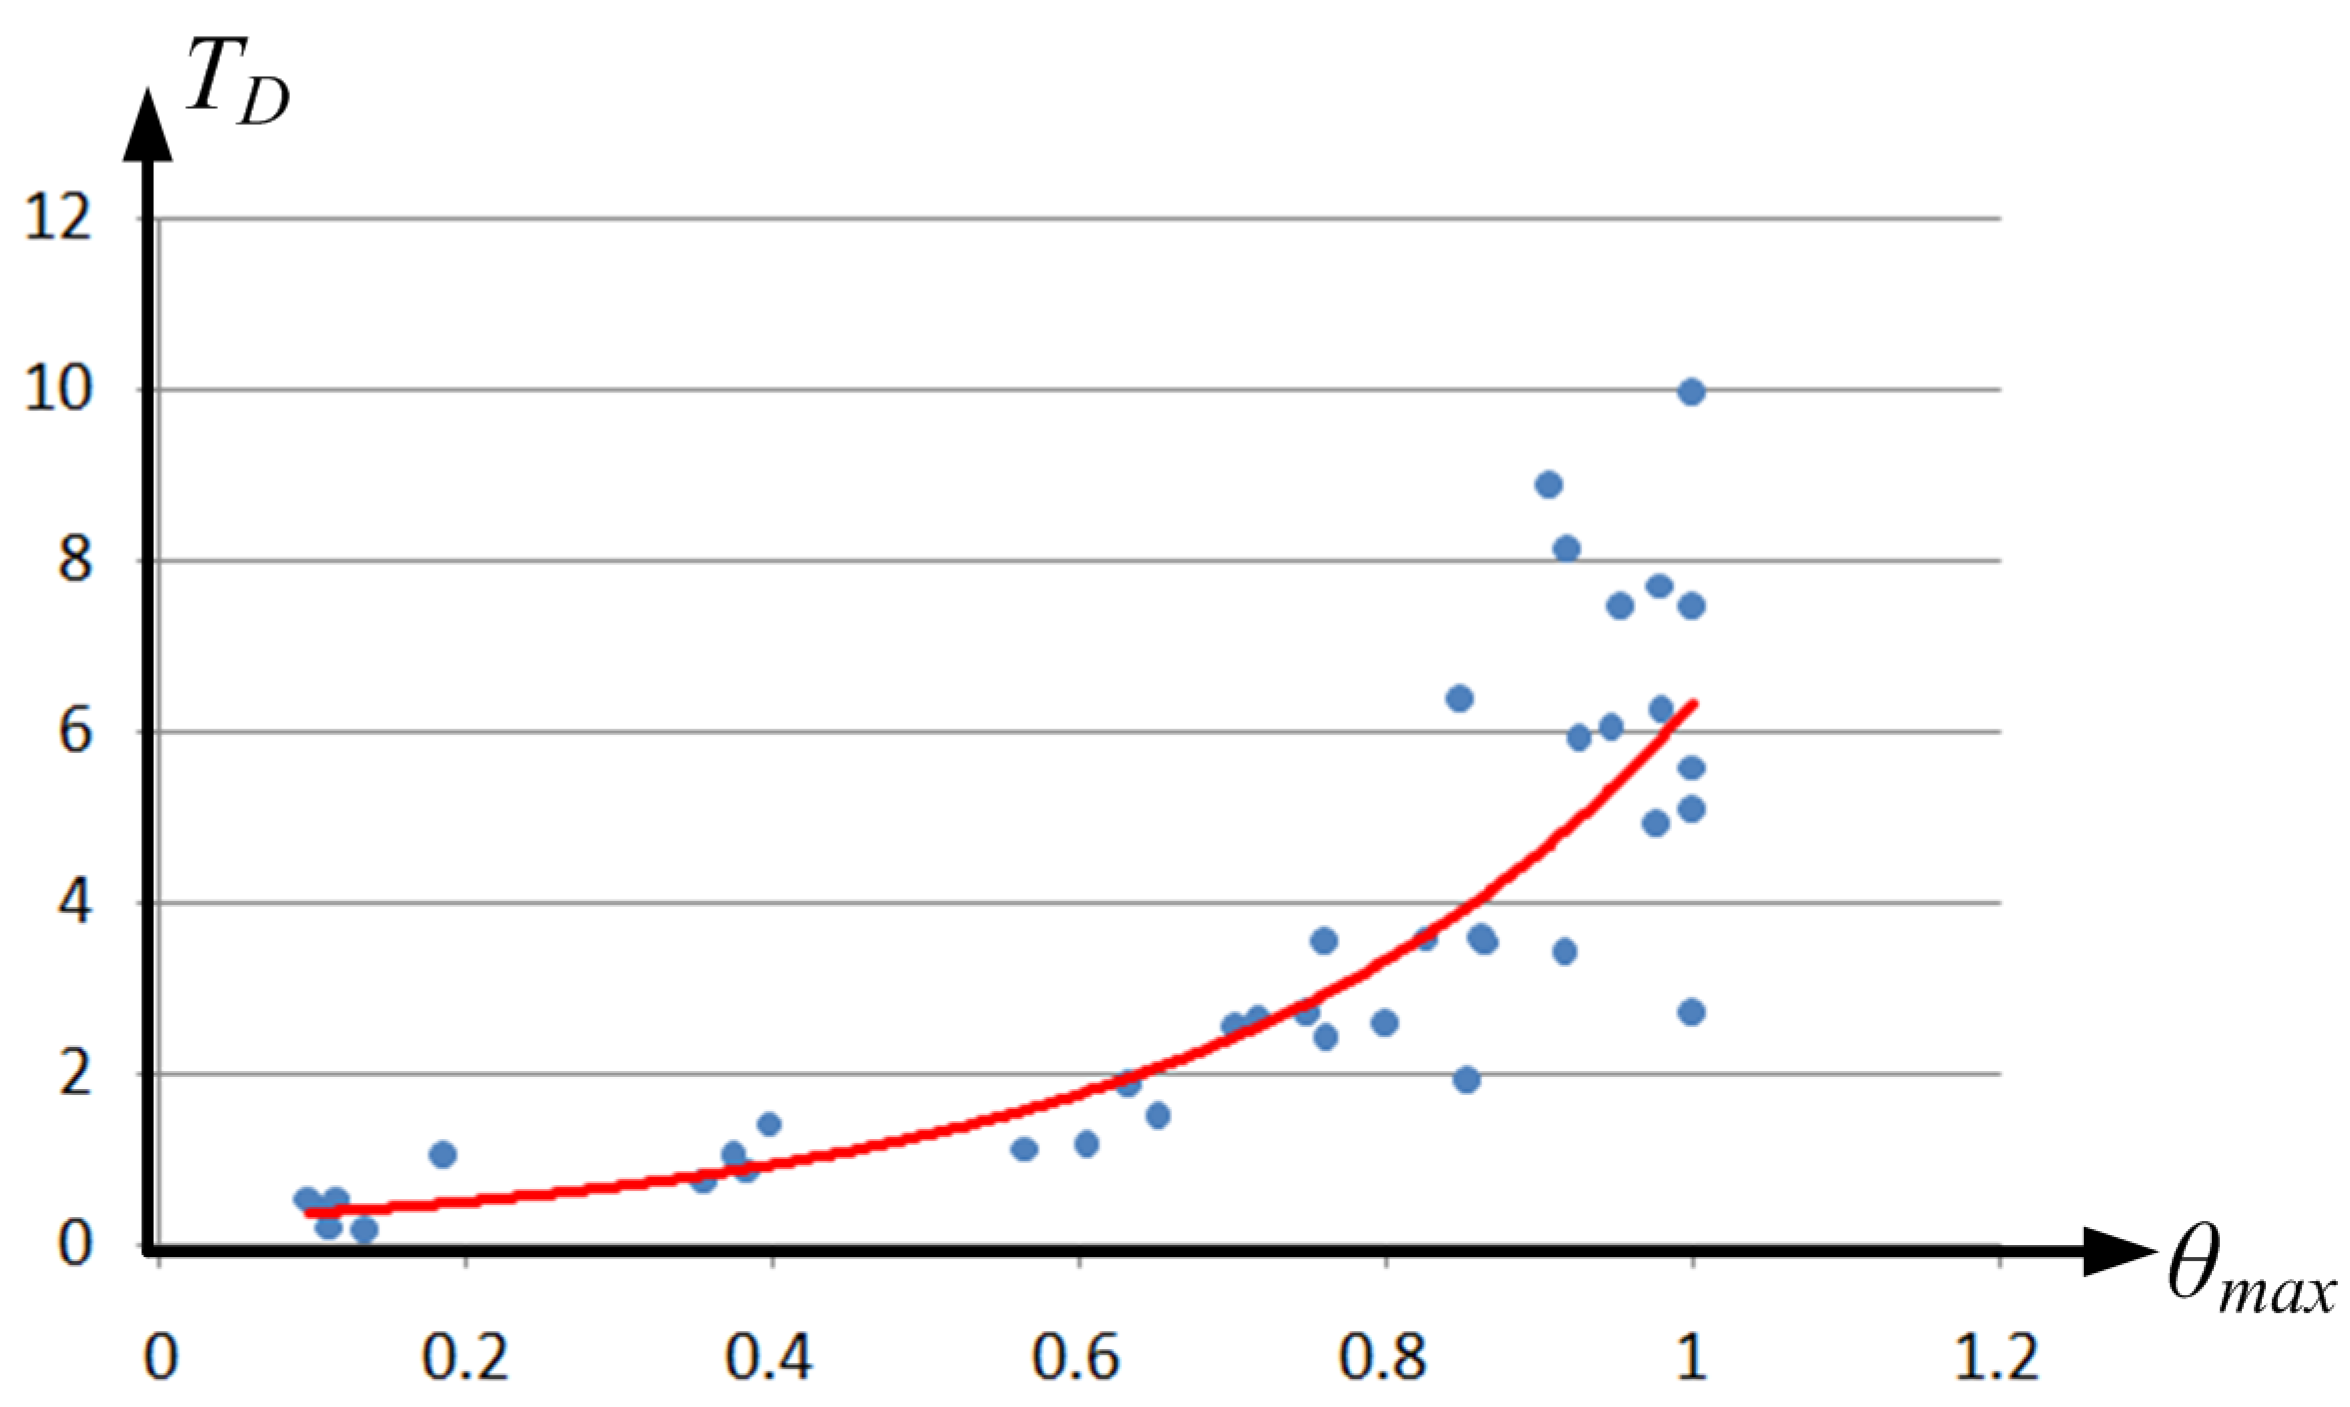
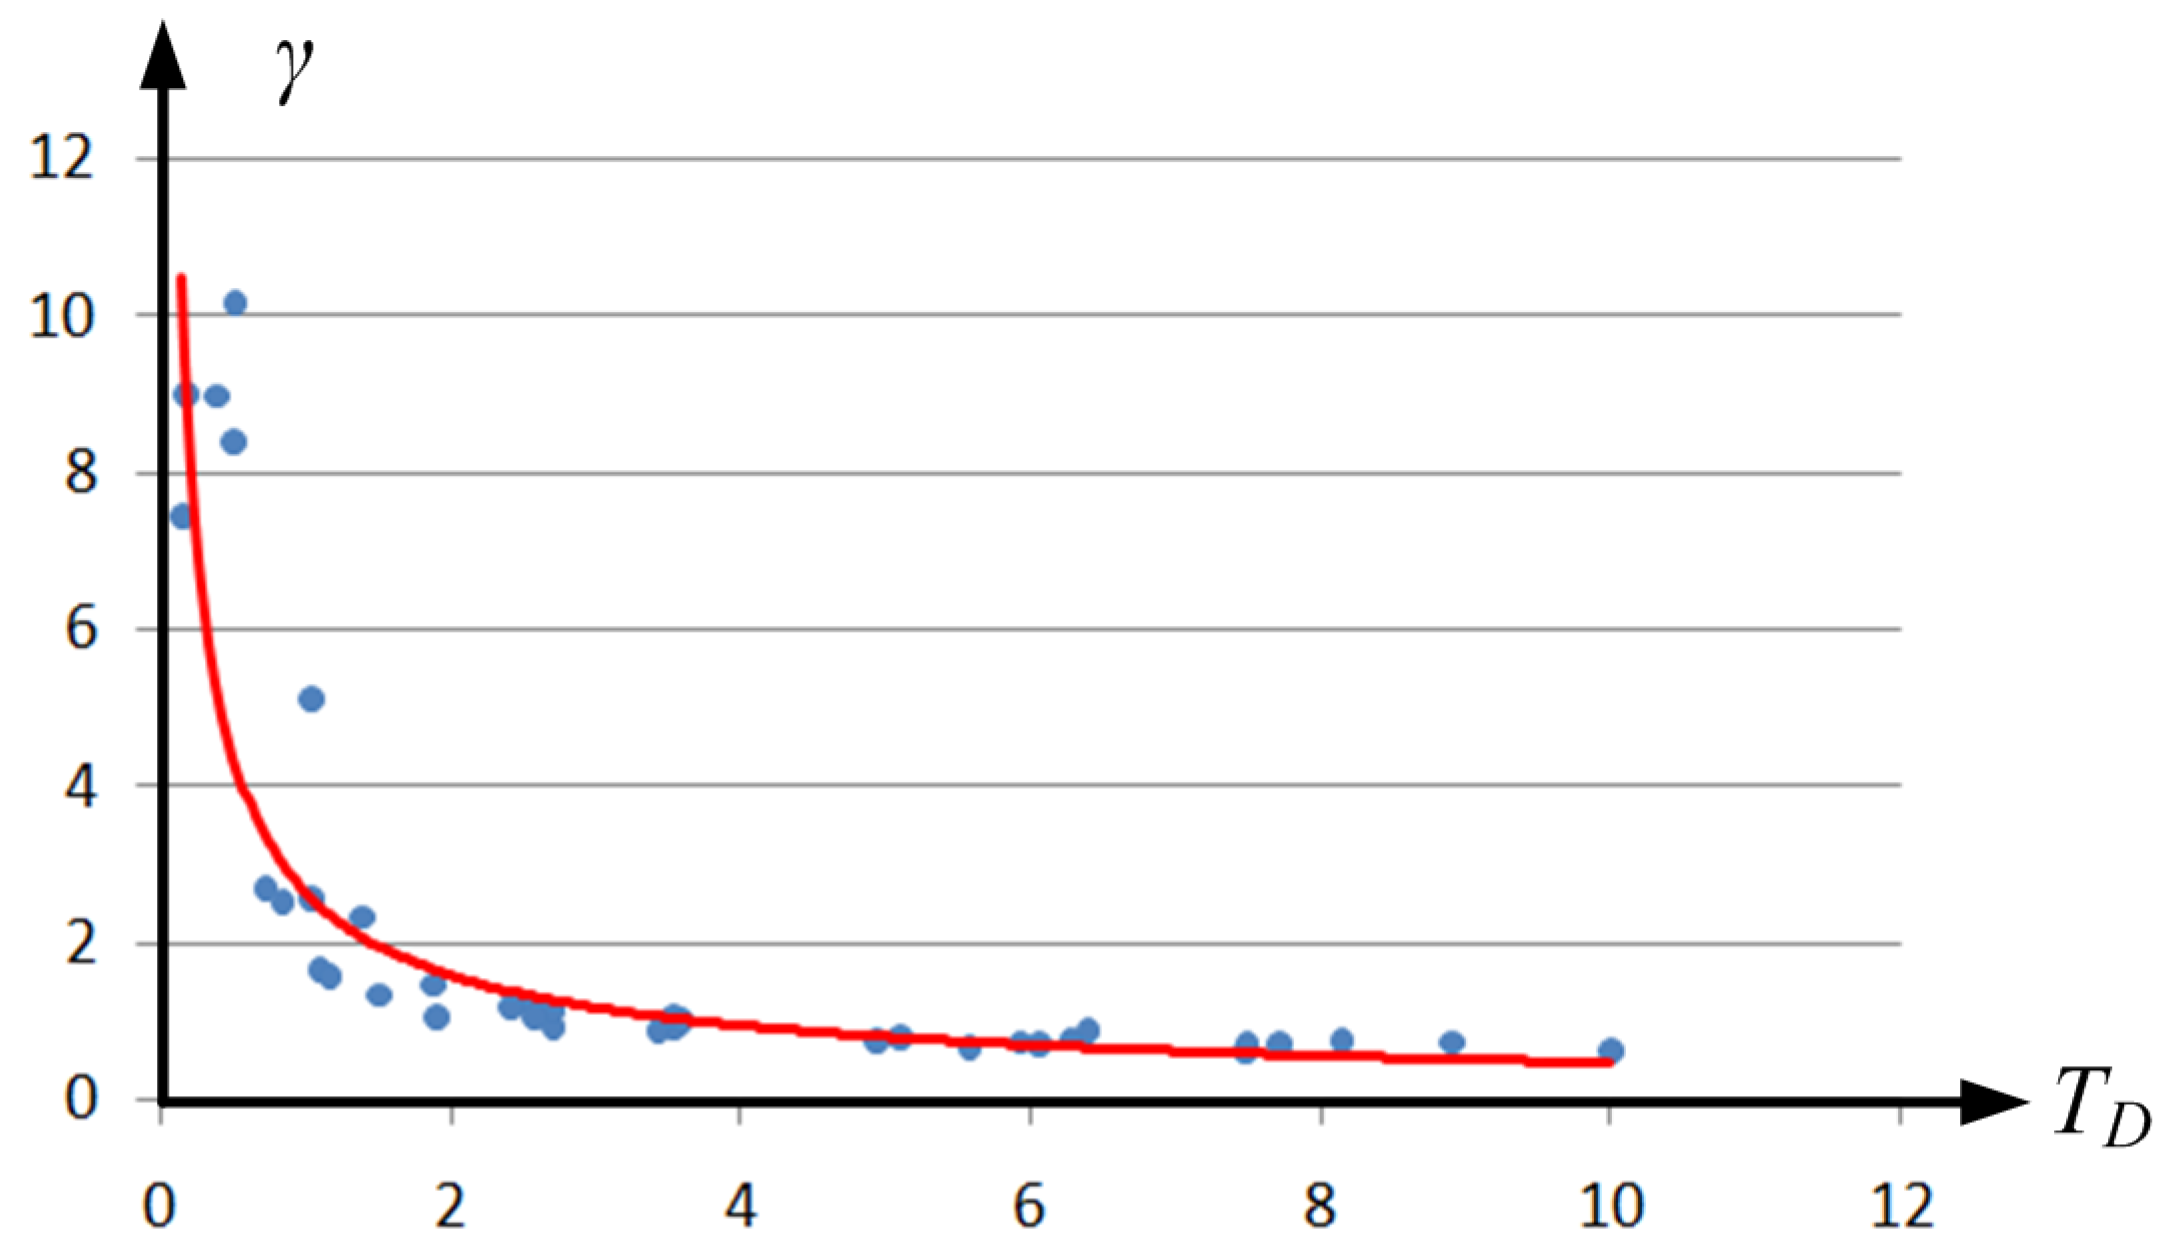
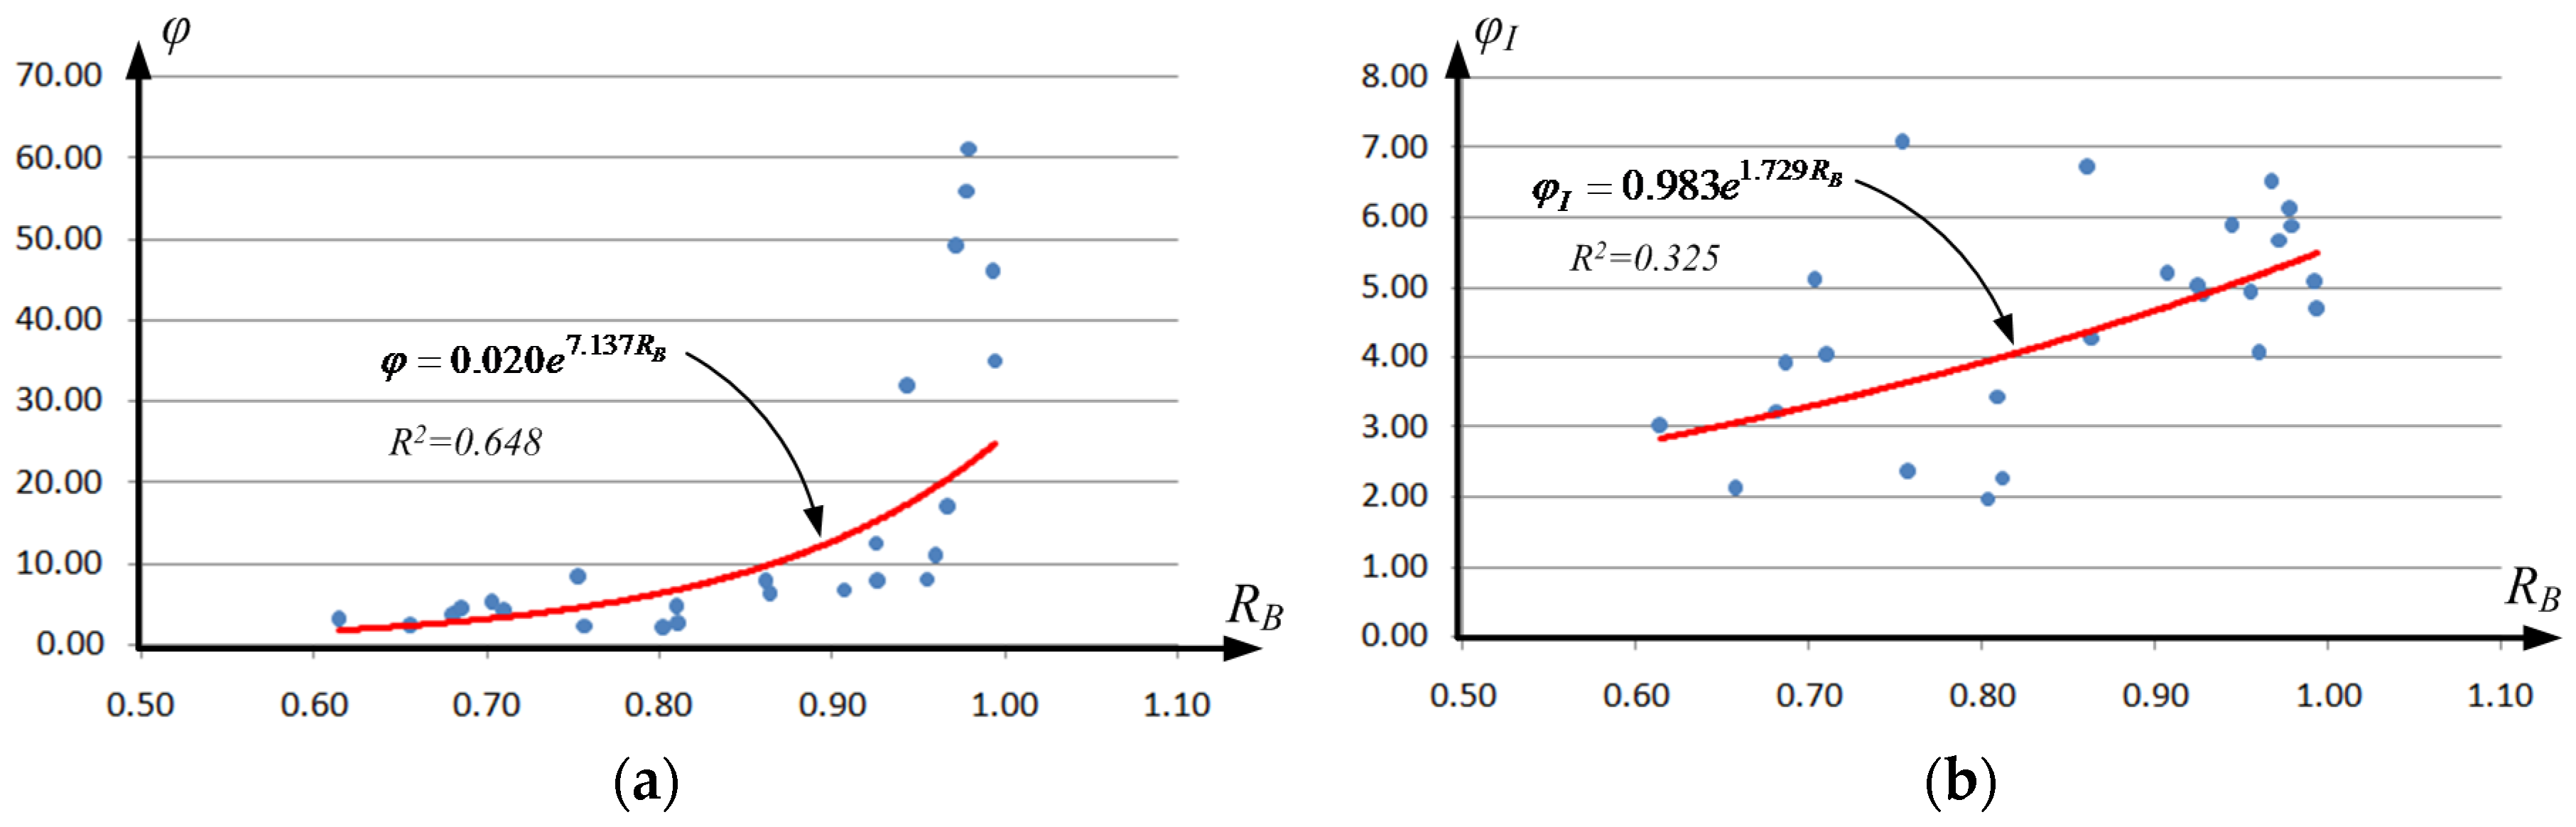
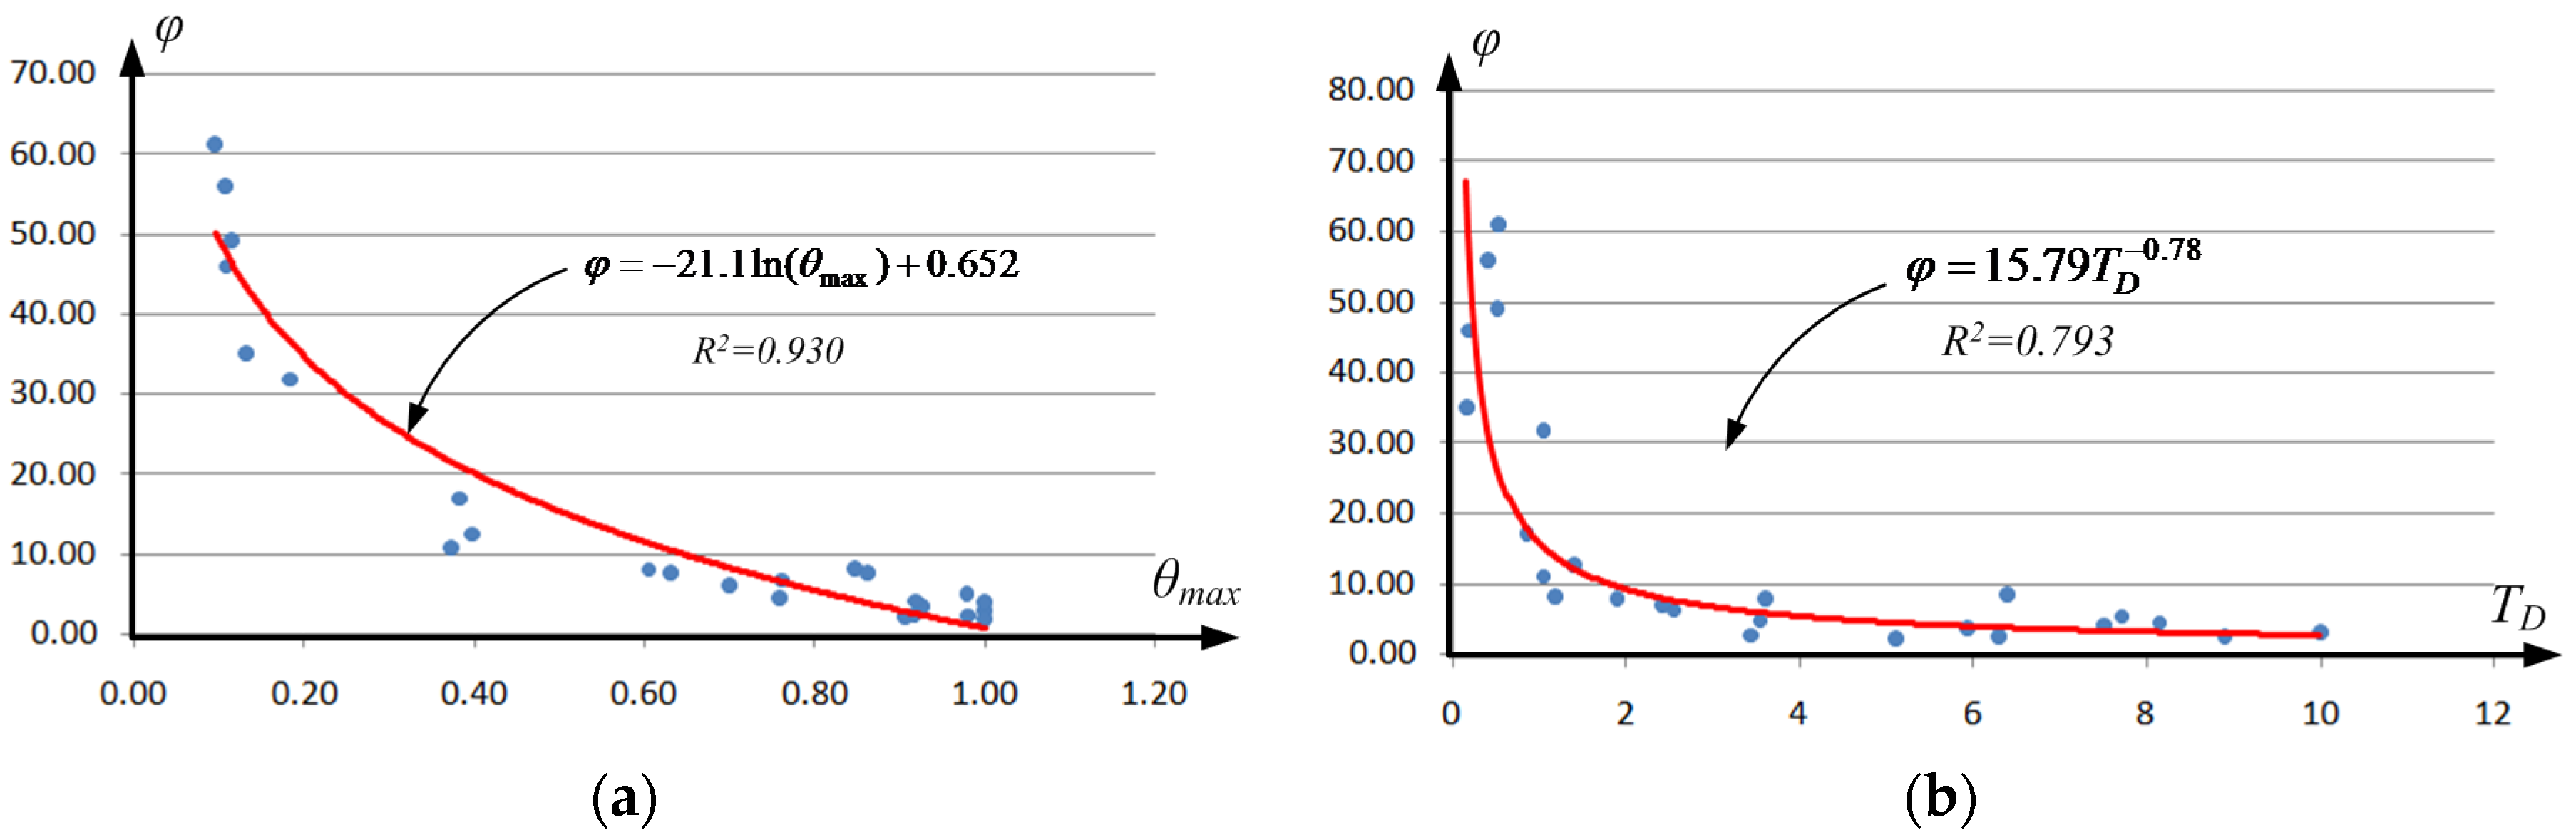
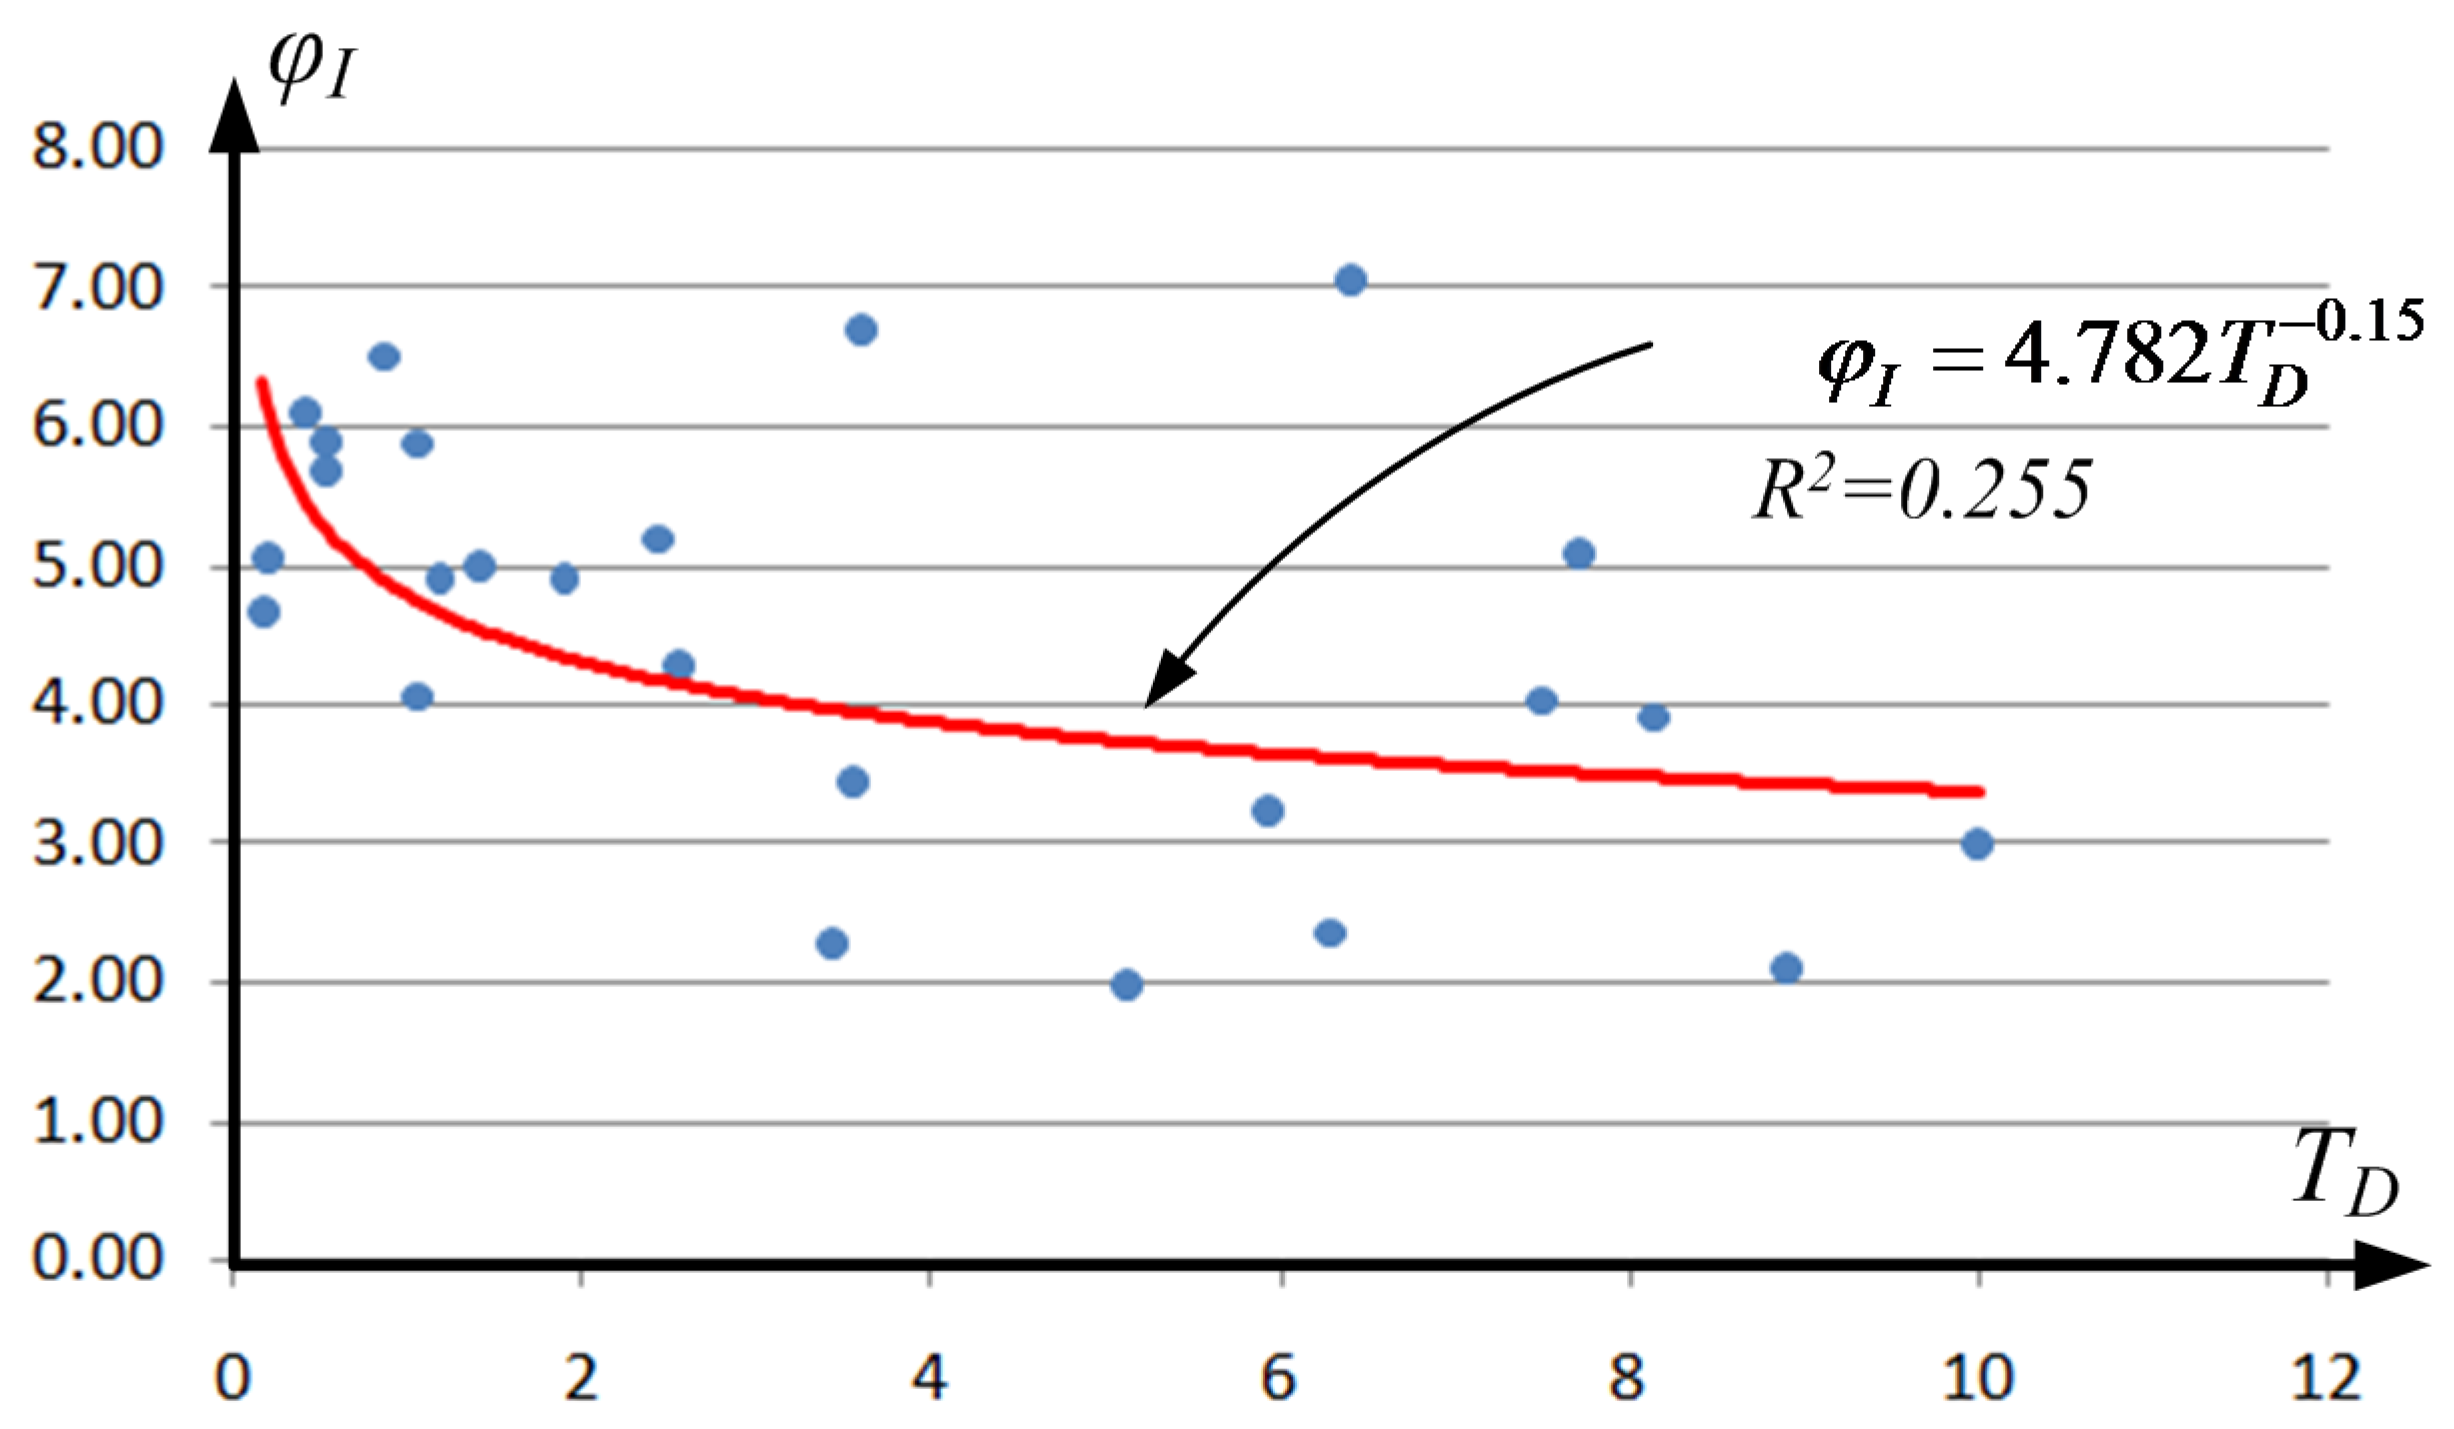


