1. Introduction
Ejector-based refrigeration systems may be an attractive solution wherever low-grade thermal energy (industrial waste heat or solar energy) is available. Among their advantages are the simplicity in construction, installation and maintenance. However one of the most important shortcomings of these systems is their relatively low coefficient of performance (COP) [
1]. To understand the main causes of this inefficiency some authors [
2,
3,
4] have undertaken second law thermodynamic analysis of ejectors. Arbel
et al. [
2] performed an analysis of entropy generation within ejectors. Al-Najem
et al. [
3] presented one of the possible definitions of ejector exergy efficiency. McGovern
et al. [
4] showed that many performance measures of ejectors efficiency can be used, but they have not always been clearly defined and the rationale underlying and justifying these measures was often unclear. They also illustrated that the common ground for assessing ejectors performance was to define thermodynamically reversible reference processes against which real processes may be benchmarked. These reversible processes represent the thermodynamic limit of real ejector performance. However the authors proved that even for the relatively simple case of fixed conditions for two identical inlet fluids, 21 reversible reference processes were possible.
In the present paper, a new systematic methodology is proposed to define the efficiency of an ejector and its parts independently of a chosen reversible reference process. The methodology is based on the computation of the transiting exergy flow through a thermodynamic system, a concept first introduced by Brodyansky
et al. [
5]. Two important metrics arise from this analysis, the exergy production and exergy consumption in different parts of the ejector. In the case of identical inlet fluids, analysed in the present paper, each of these metrics is linked to three intensive parameters of the flow inside the ejector, namely pressure, temperature and velocity.
2. Transiting Exergy in a Process with Pressure, Temperature and Velocity Variations
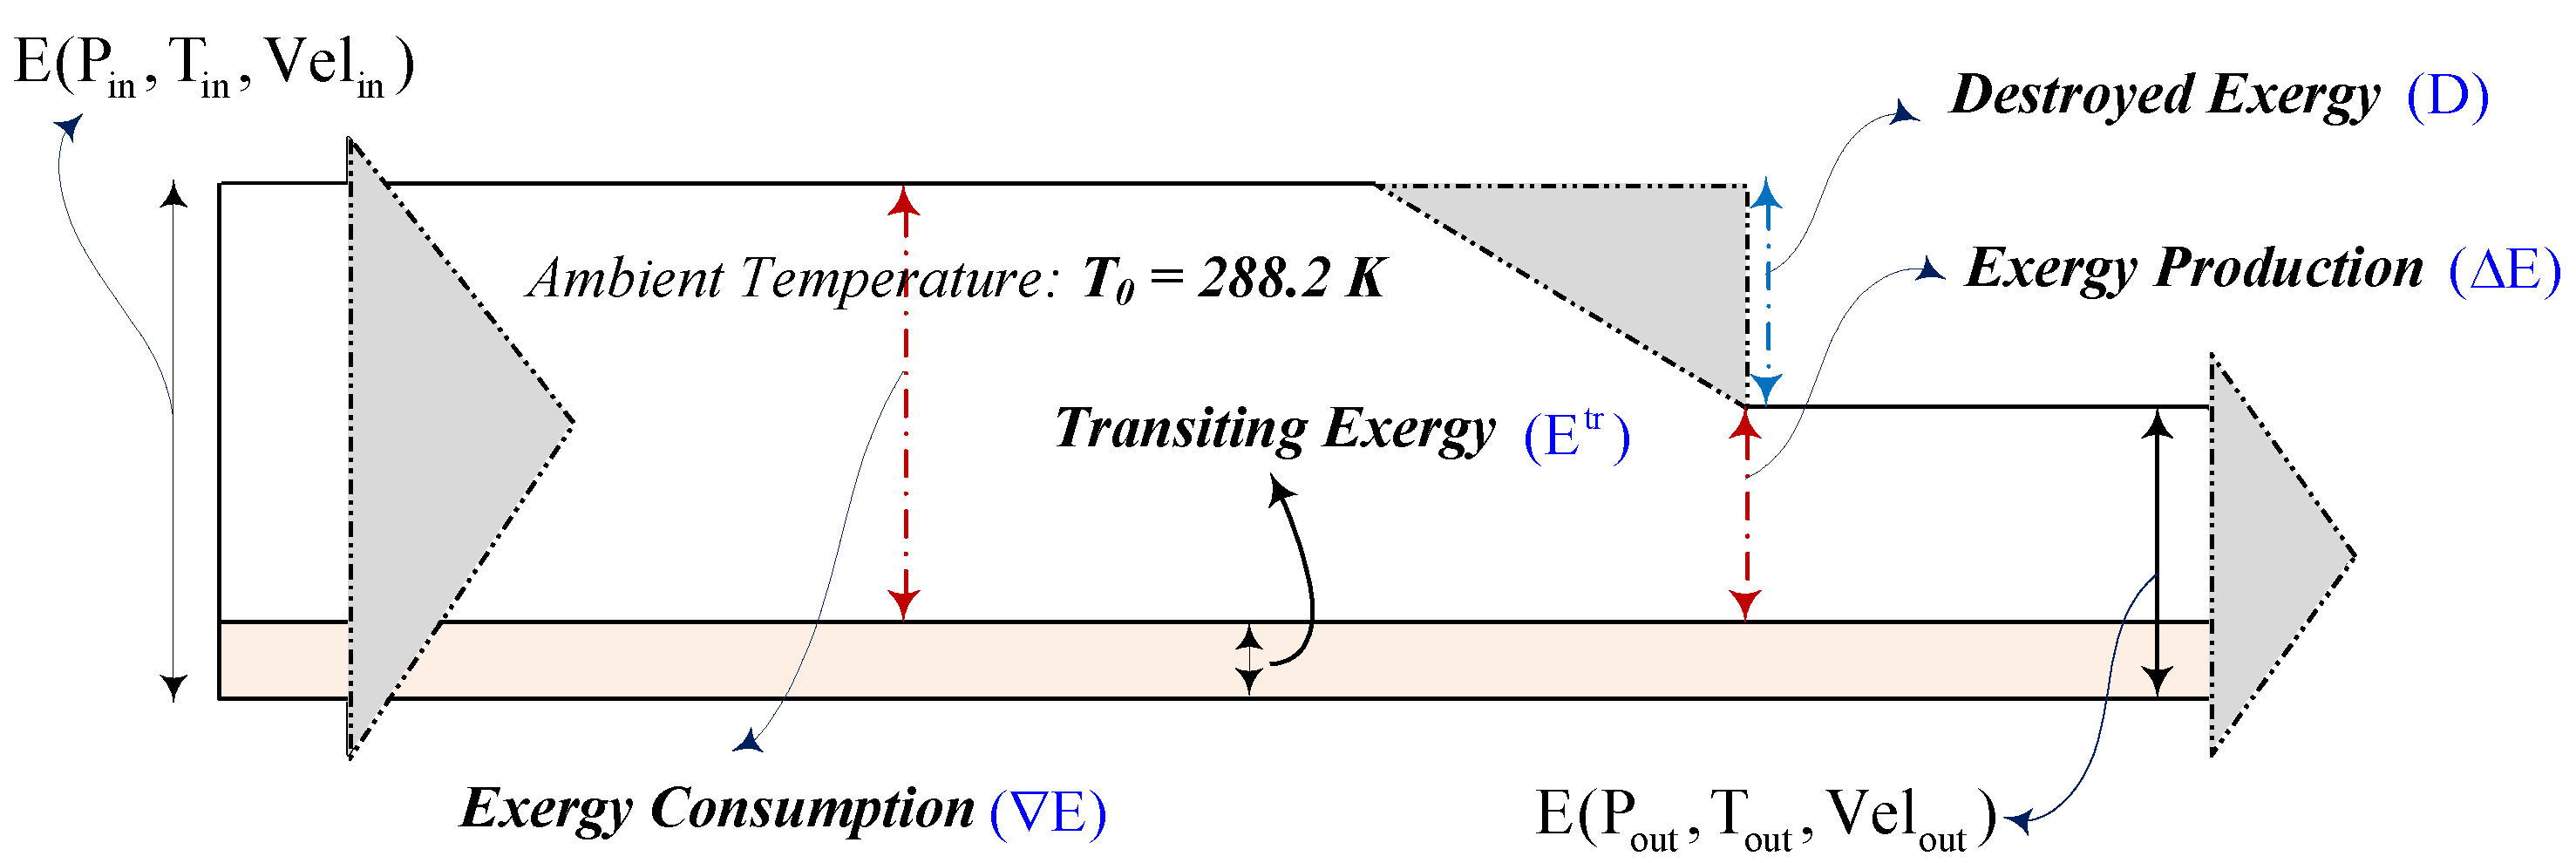
The Grassmann diagram in
Figure 1 illustrates a thermodynamic process where the intensive properties, such as temperature (T), pressure (P) and velocity (V) of a material stream change from their inlet (in) to outlet (out) values. The widths of the bands present the inlet and outlet exergies. The difference between these widths is the lost exergy (D). The specific exergy is defined as
. The Grassmann exergy efficiency is defined in the Equation (1) as follows:
According to Brodyansky
et al. [
5], the transiting exergy of material stream is the lowest exergy value defined by the intensive parameters at the inlet and the outlet of an analysed system or its parts. The following equations illustrate the computation of transiting exergy:
These equations illustrate the fact that this lowest value of exergy is defined by the minimum values of pressure and velocity chosen among their inlet and outlet values. The situation is quite different for temperature since the transiting exergy is defined by its minimum value if the inlet and outlet conditions are higher than the environmental temperature T
0, Equation (1a), by its maximum value for sub-environmental conditions, Equation (1b) and by the value T
0 if the environmental temperature has an intermediate value, Equation (1c).
Figure 1 visualises the fact that the introduction of the transiting exergy results in a shift of the reference state for exergy calculations. As a result the exergy consumed and produced in a system or its parts are represented by smaller band widths.
The “transiting exergy approach” is different from the traditionally proposed approaches [
6,
7,
8,
9,
10] in that it does not attempt to individually compute the exergy variations caused by the different factors which may affect any defined thermodynamic system. On the contrary it relies on the unaffected part of the exergy entering and leaving the system [
5]. As a result this approach provides the grounds for the non-ambiguous definition of exergy consumed (∇E) and produced (ΔE). As an example of (∇E) and (ΔE) definitions let us analyse the throttling process taking place at sub-environmental conditions. At first let us assume that for this particular case the kinetic energies of the fluid at the inlet and the outlet of the throttling valve are negligible. Then these two quantities are calculated as:
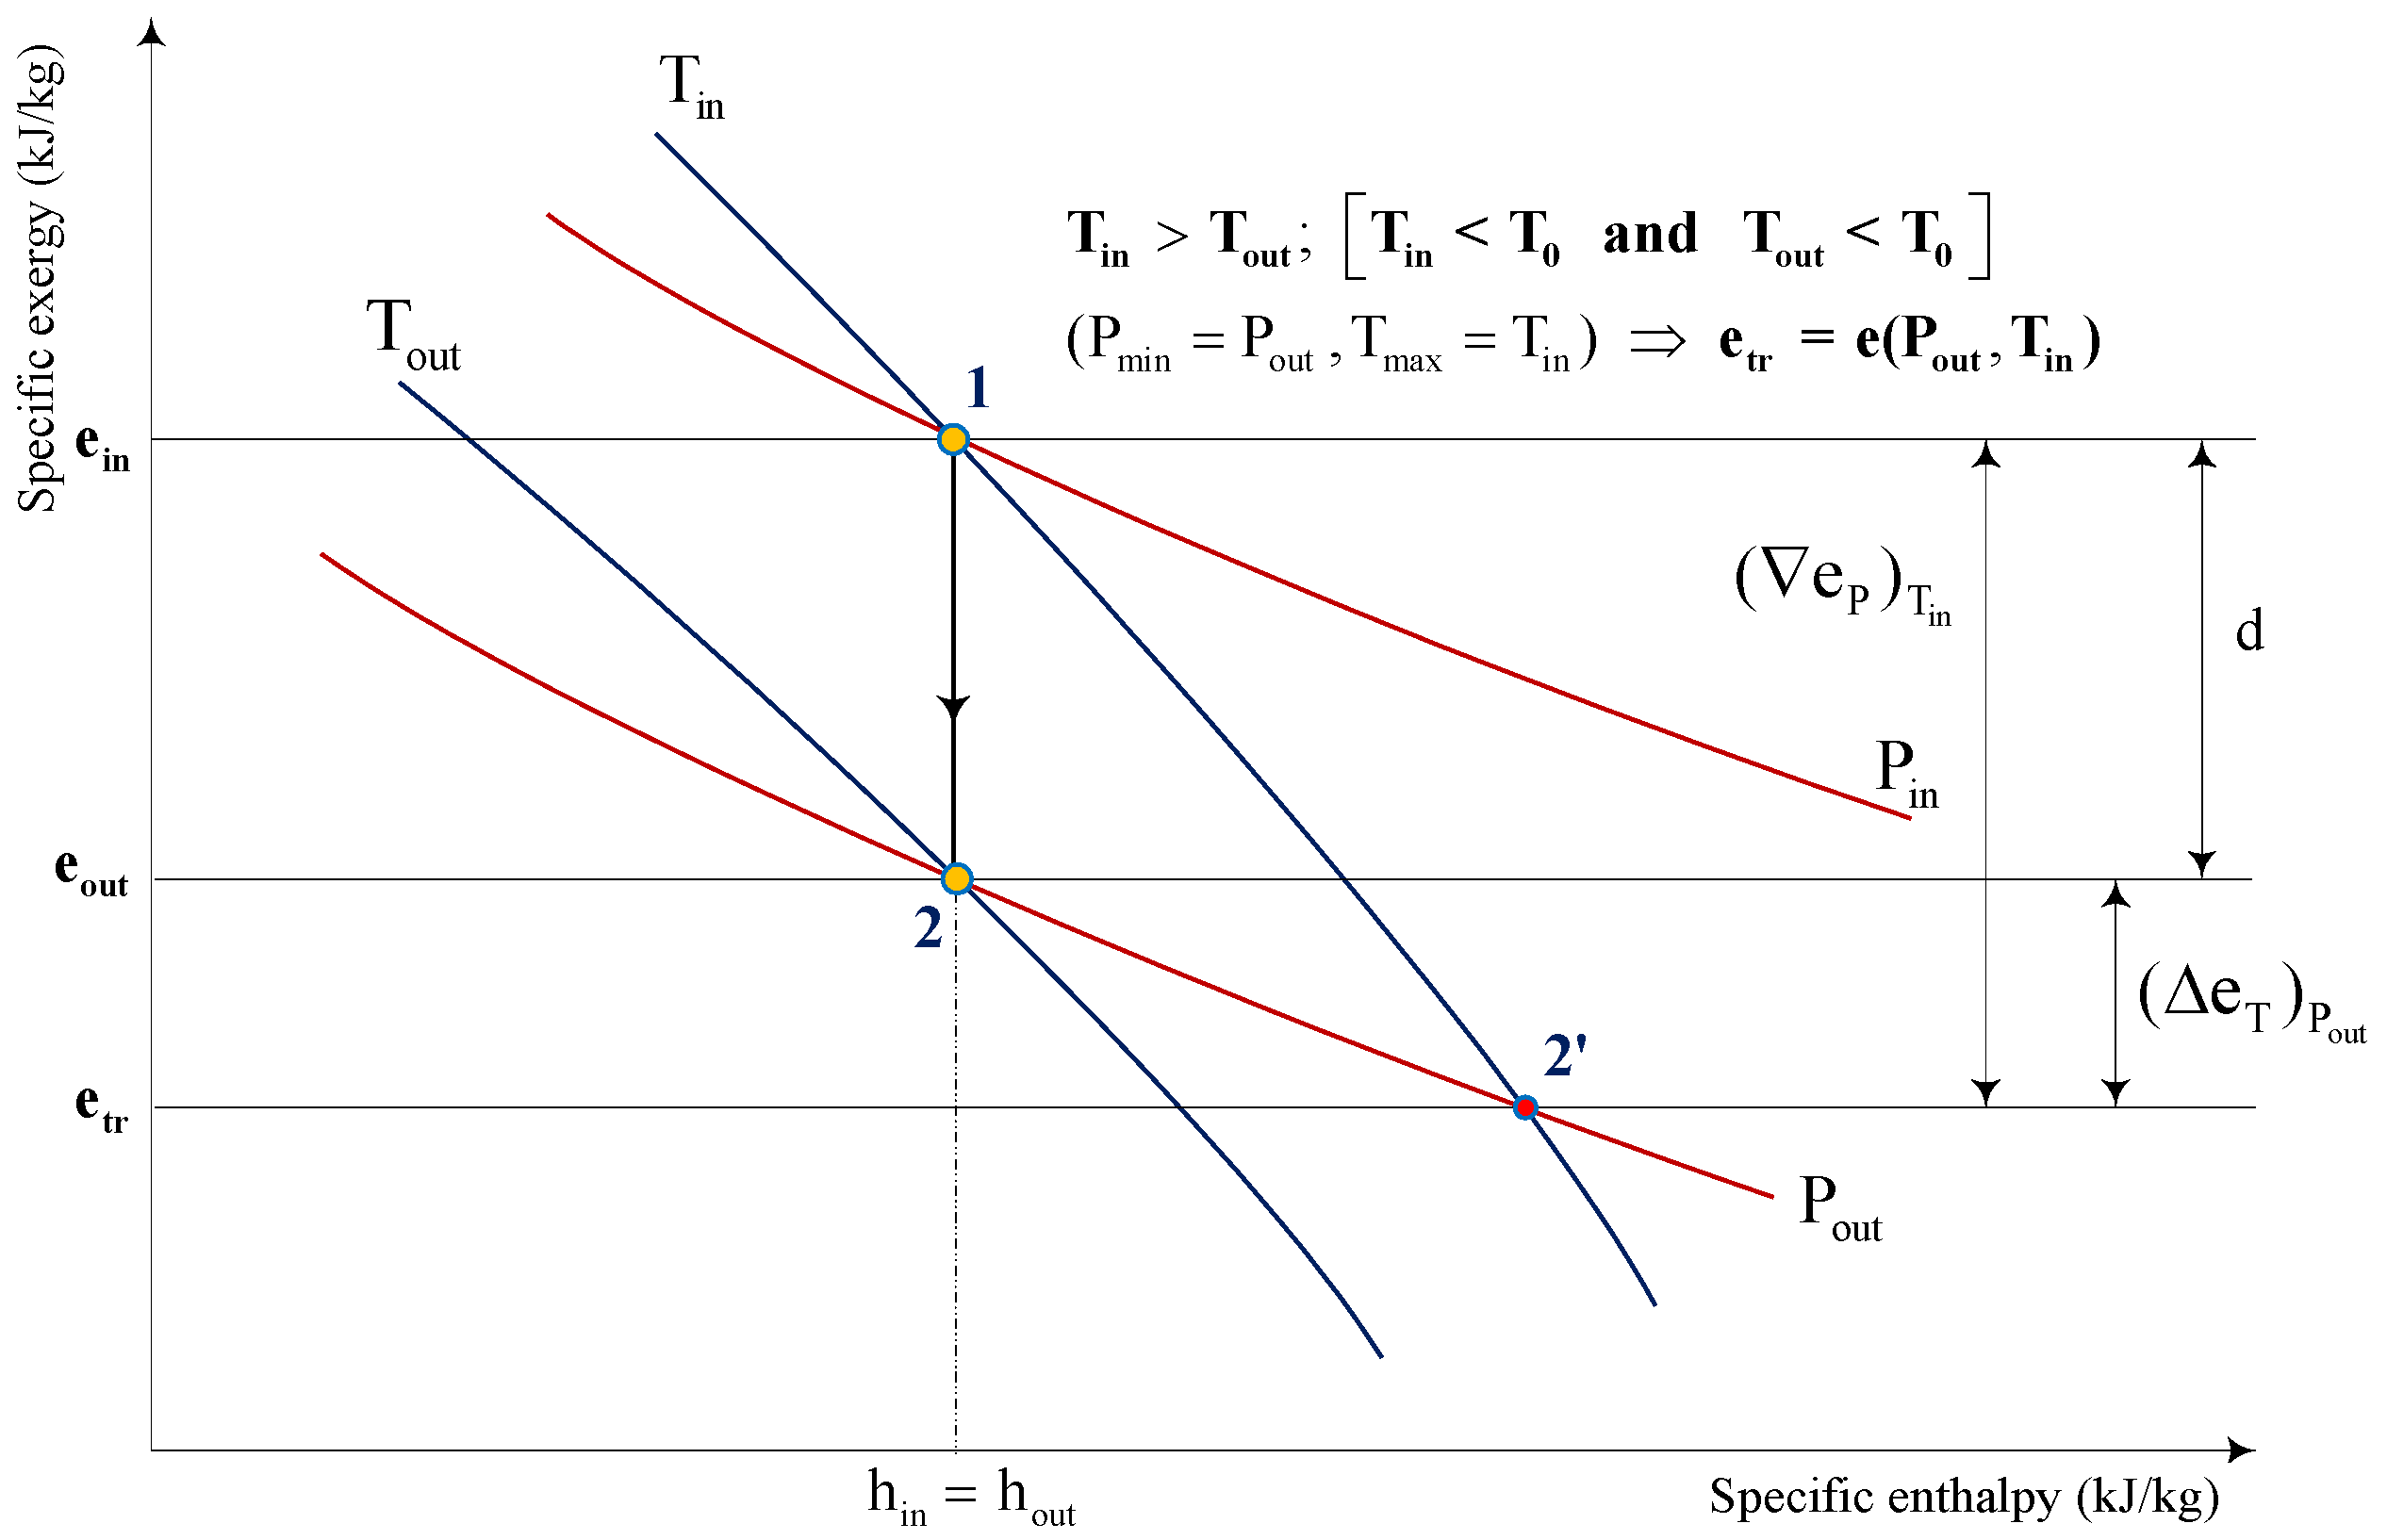
The term (∇e
P)
Tin in Equation (2) is the decrease of the specific mechanical exergy due to an isothermal pressure drop at constant temperature Tin. The term (Δe
T)
Pout in Equation (3) is the increase of the specific thermal exergy due to an isobaric temperature drop under sub-environmental conditions at constant pressure Pout. The fluid flow rate is (
). The specific exergy losses (d) are also presented on the diagram in
Figure 2. As illustrated in Equations (4) and (5) the values (∇E) and (ΔE) allow the computation of two important thermodynamic measures, namely exergy efficiency (ƞ
ex, TR) and exergy losses (D) where (d) represents the specific exergy losses:
The attention of the reader should be drawn to the fact that all the ambiguities, how to define the consumed and produced exergies [
5,
6,
7], are removed by using the above approach. The values (∇E) and (ΔE) are defined by Equations (2) and (3) in a unique way. The interpretation of the results can be easily represented on the specific exergy-enthalpy diagram presented in
Figure 2.
The path 1-2 represents the change occurring to the stream between the throttling valve inlet and outlet conditions. The same overall result could be achieved by following the composite path 1-2′-2. The segment 1-2′ is (∇e
P)
Tin, the segment 2′-2 is (Δe
T)
Pout. Given that the throttling takes place under sub-environmental conditions, the lowest exergy content of the fluid is reached at point 2′ which corresponds to the lowest pressure Pout and the highest temperature Tin. This exergy value is the specific transiting exergy of the stream. If the kinetic energy of the stream cannot be neglected, the lowest velocity value should be added to the definition of transiting exergy as illustrated in
Figure 1. The expressions (2) and (3) for consumed and produced exergies will be changed accordingly; the subject is important for an ejector analysis and will be discussed in the next section.
3. The Exergy Consumption and Production in Different Parts of a One-Phase Ejector
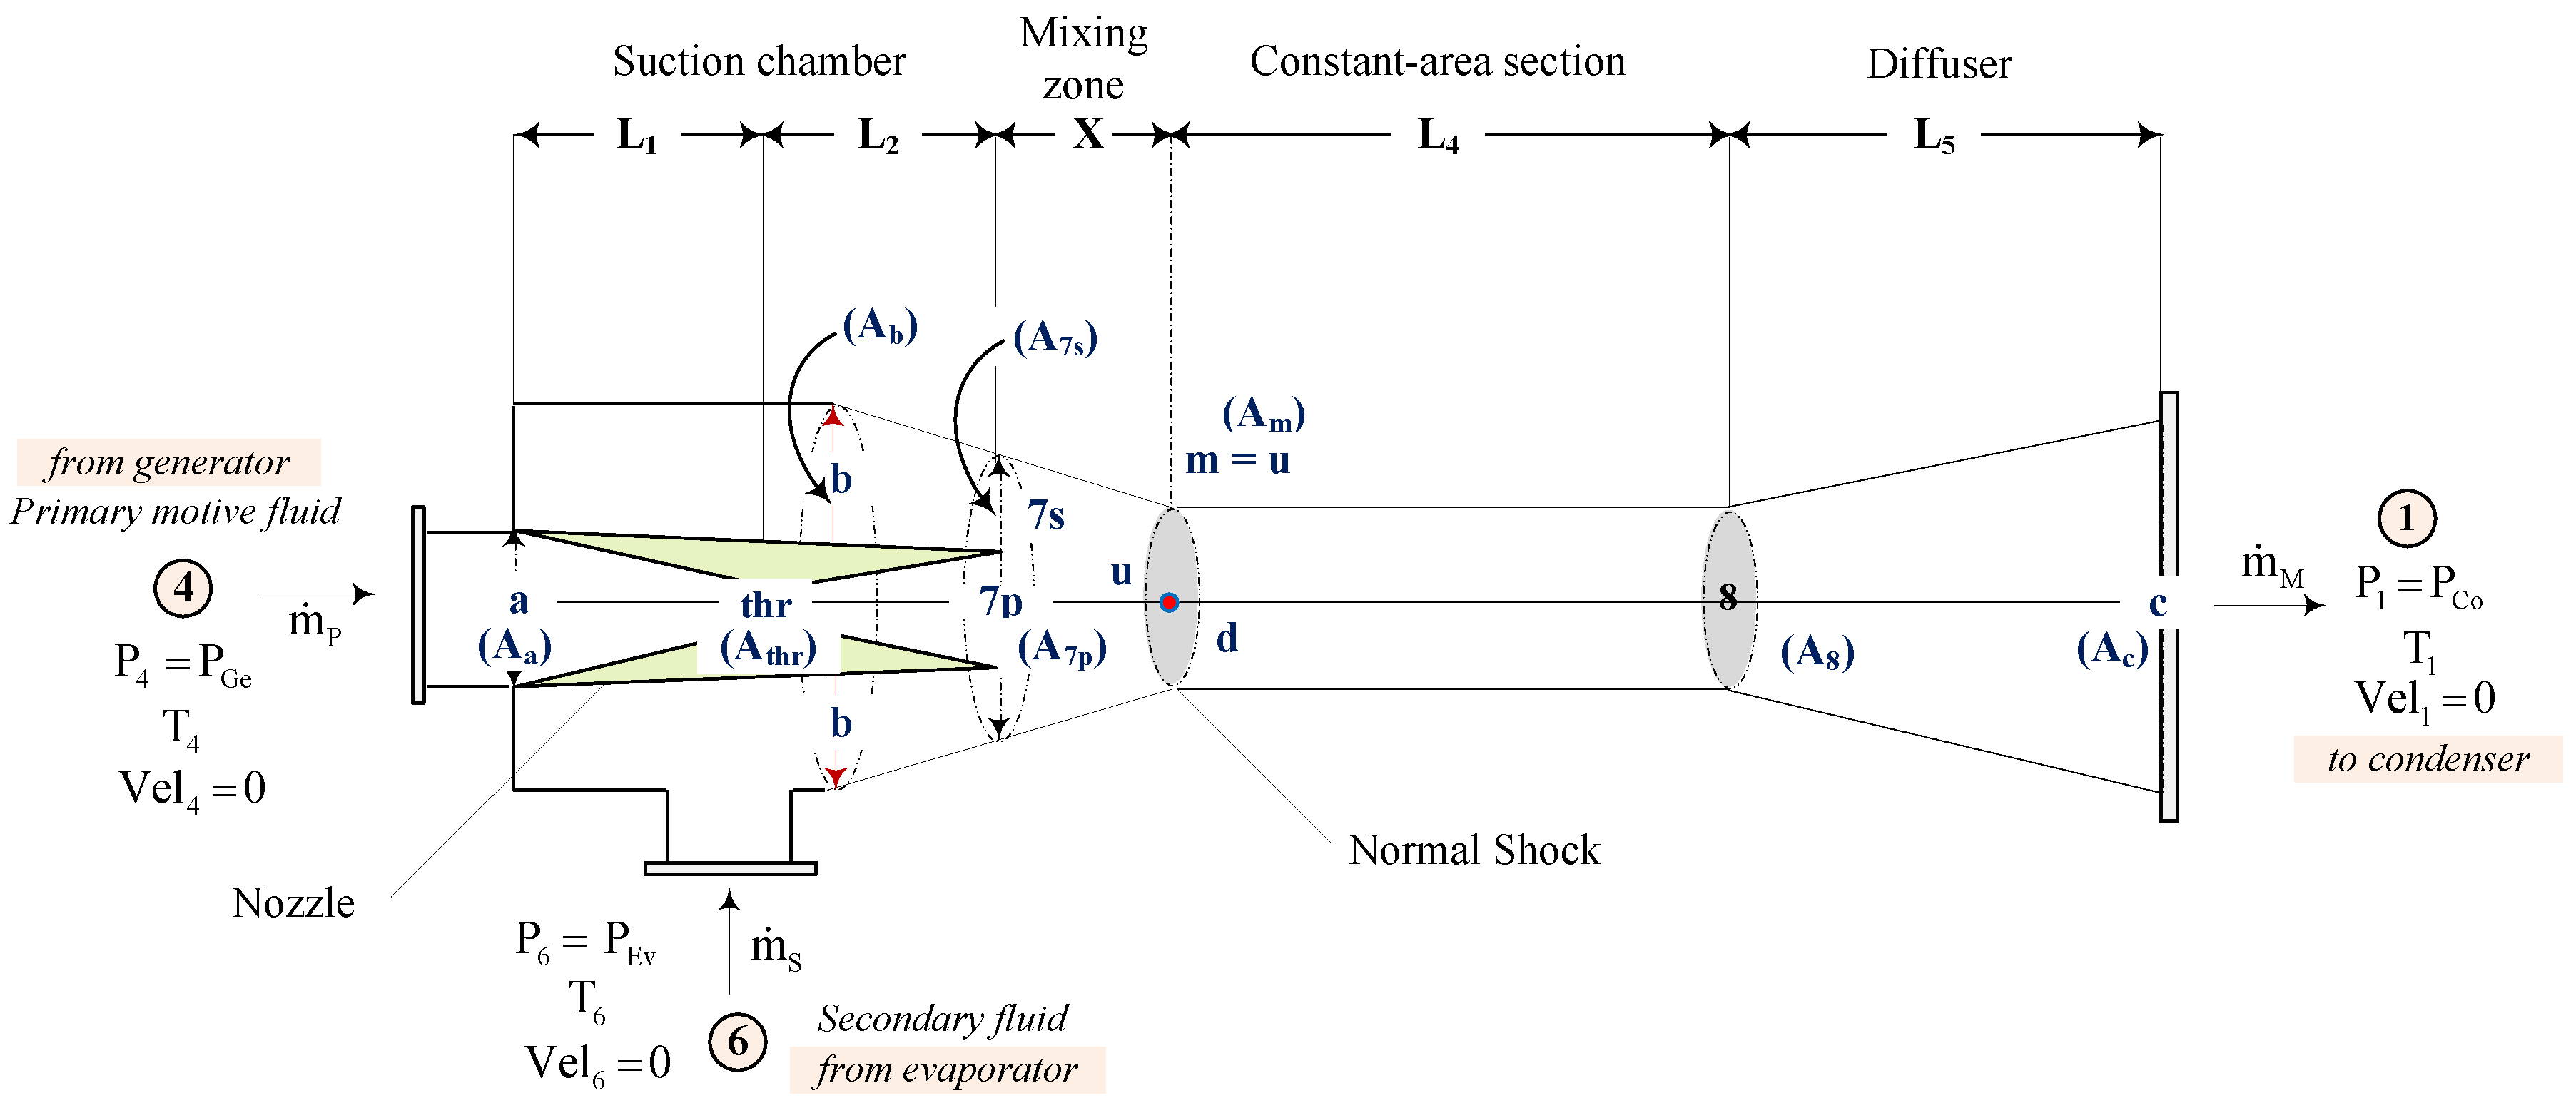
The one phase ejector studied in the present paper is the so-called “constant-pressure mixing ejector”. It is presented in
Figure 3. The exit of the nozzle is located within the suction chamber which is upstream of the constant-area section. The constant-pressure mixing theory of ejector developed by Keenan
et al. [
11] was frequently used in the analysis of constant-pressure ejectors [
12,
13]. Keenan
et al. [
11] assumed that the primary and the secondary (entrained) flows at the exit of the nozzle have an identical pressure. Mixing of the two streams begins there and proceeds with constant pressure, until the inlet of the constant-area section. This theory is used as one assumption among others in the new validated ejector model [
14] that is used in the present paper to calculate the pressure, temperature and velocity at the different cross-sections illustrated in
Figure 3. The refrigerant R141b is used as an example for this study. It has been assumed that: the temperature and the pressure of the primary motive fluid entering the primary nozzle are T
4 = 145 °C and P
4 = 1000 kPa, the flow rate is
= 0.19838 kg/s; the temperature and the pressure of the secondary fluid are T
6 = −5 °C and P
6 = 22.28 kPa, the flow rate is
= 0.04959 kg/s. According to information compiled by Liu and Groll [
15], it has been assumed that the polytropic efficiencies are: 0.95 for the primary nozzle, 0.85 for the suction chamber and 0.78 for the diffuser.
To make the exergy analysis representative, the ejector is split into 7 sections: (1) primary stream and the converging part of the nozzle (4-thr); (2) diverging part of the nozzle (thr-7p); (3) suction section of the entrained stream (6-7s), (4) mixing zone (7p-m + 7s-m); (5) zone of the shock (m-d); (6) constant area section (d-8); (7) diffuser and the ejector outlet part (8-1). The calculated parameters such as pressure, temperature, velocity and flow-rates at the inlet and outlet of each section are presented in
Table 1 [
16].
The choice of a suitable working fluid is one of the essential steps in the design of the ejector and, subsequently, in the design and manufacturing of the solar driven refrigeration system. Such a fluid must meet the performance criteria as well as the requirements of safety and environmental protection. It must also be available at an affordable price. In the present study, the refrigerant R141b (CH
3CCl
2F) was chosen. Previous studies [
17,
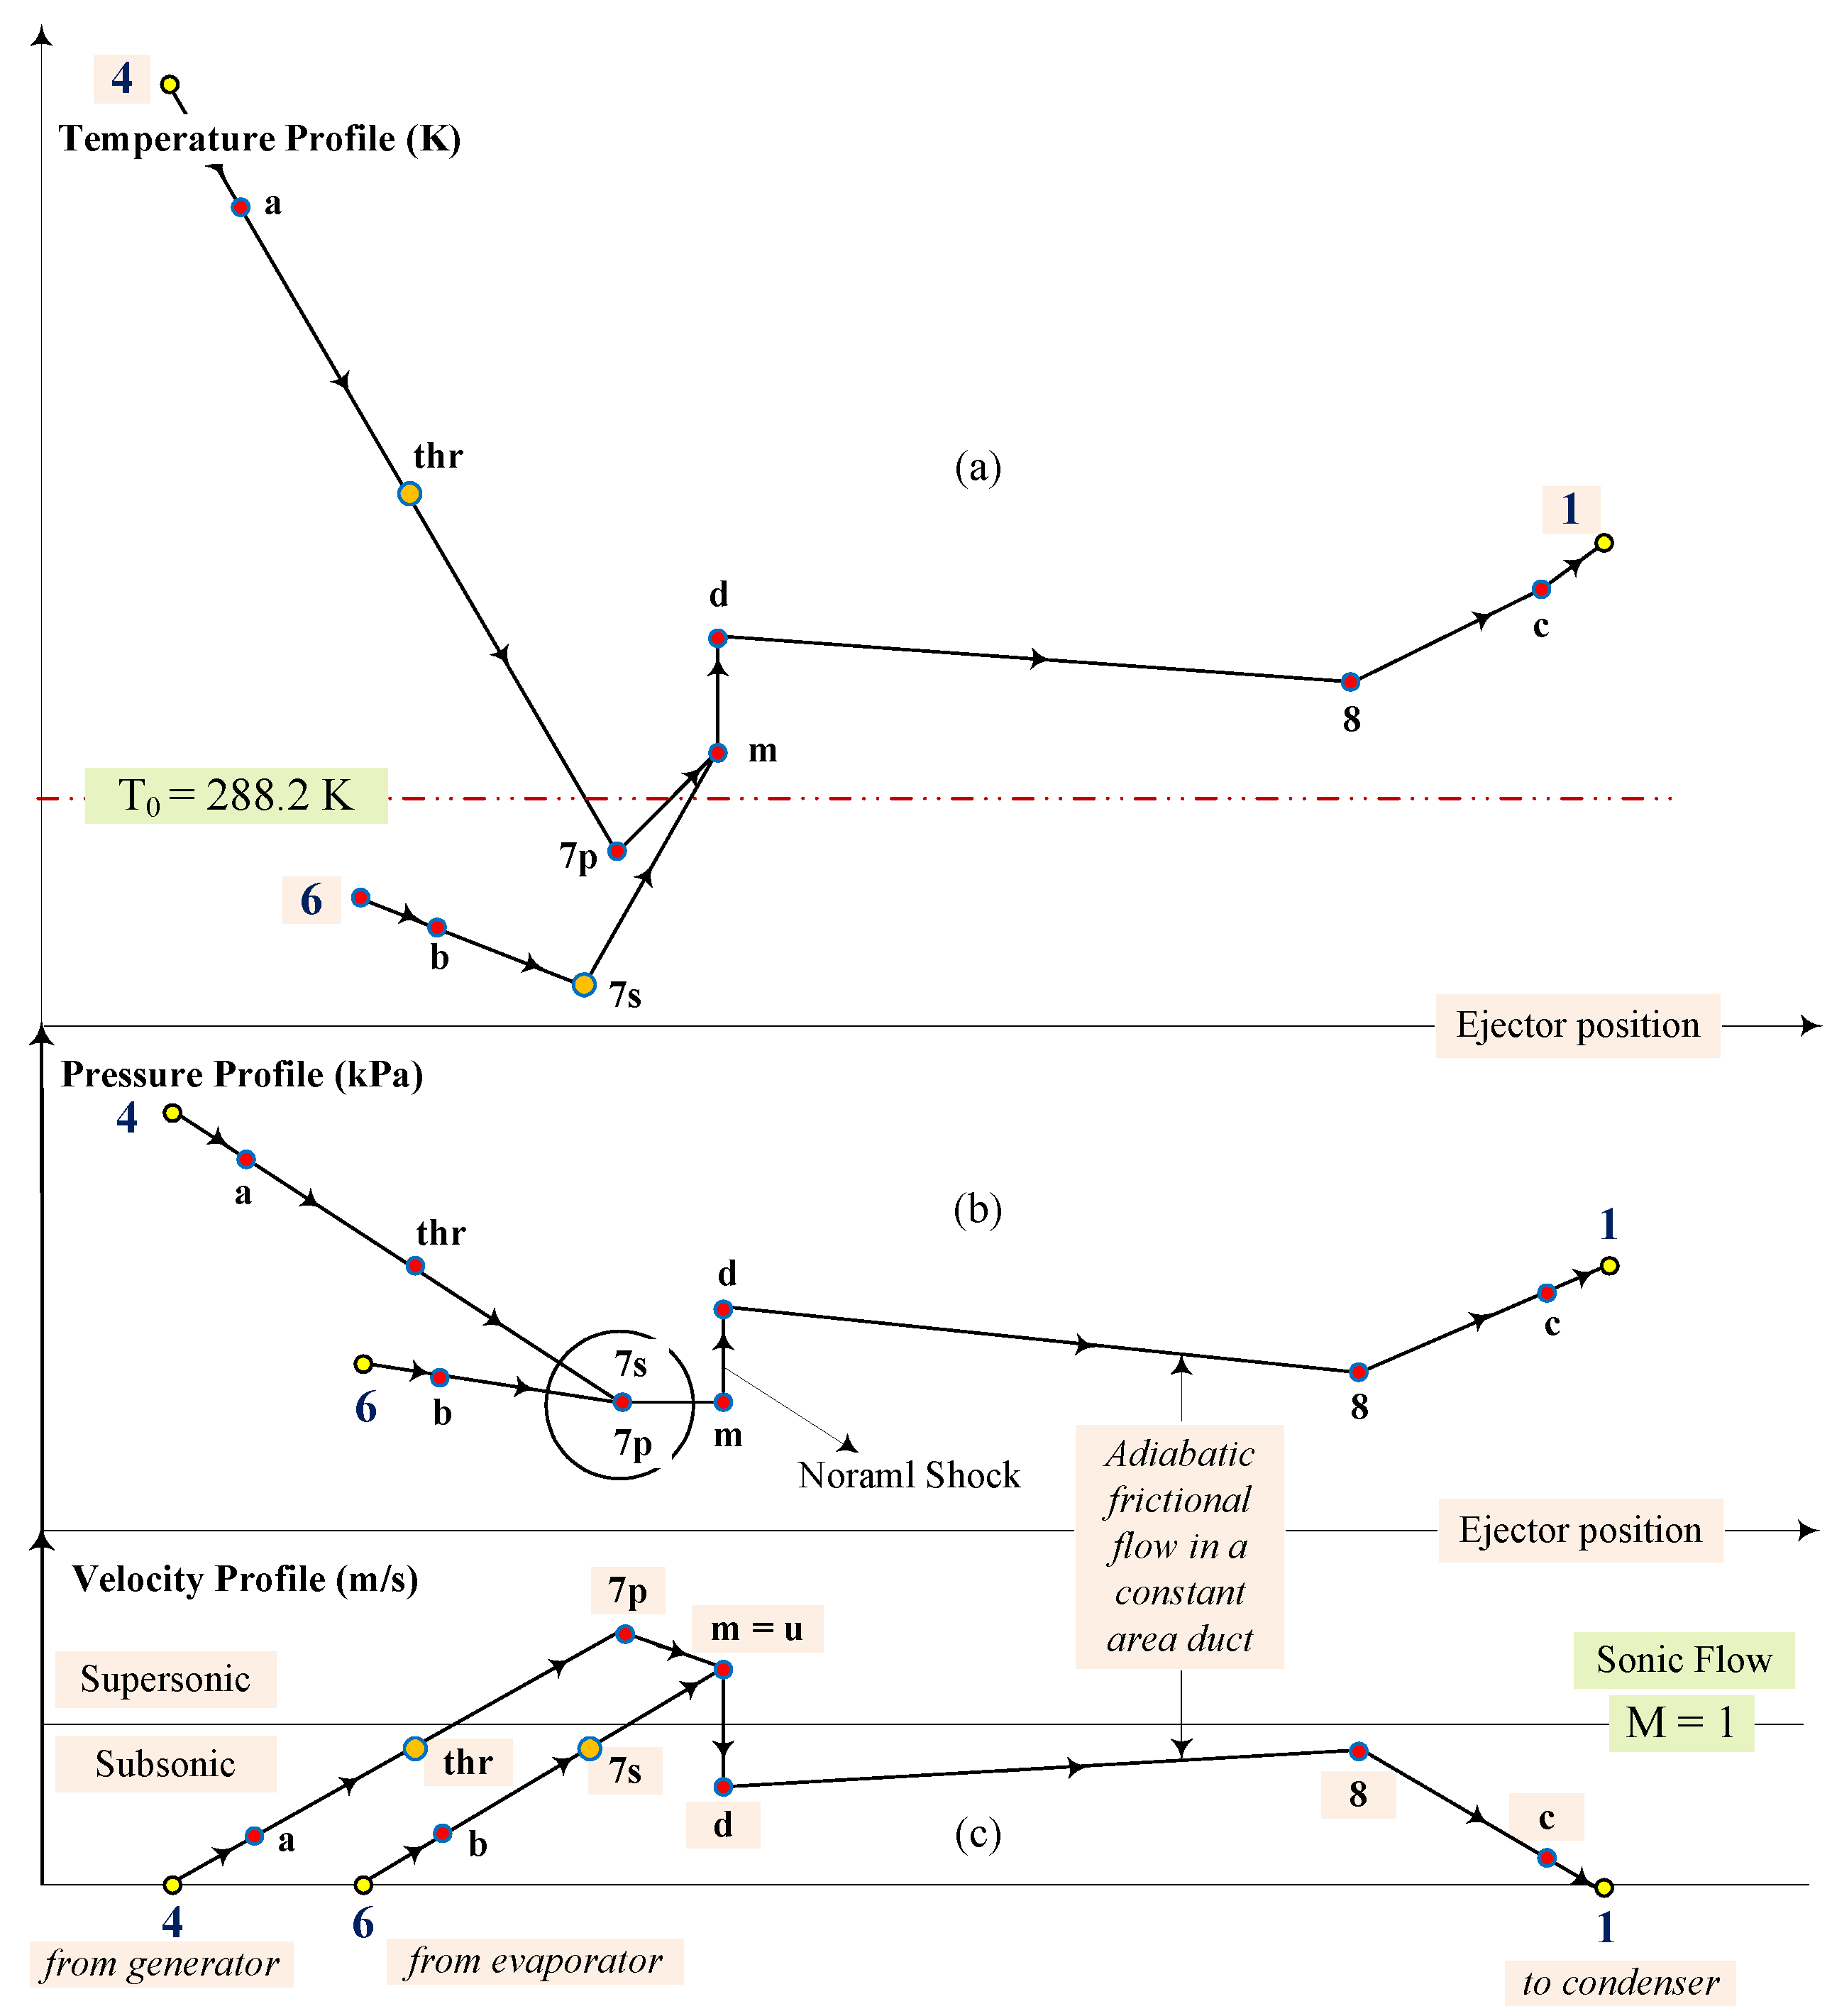
18] have found that it is suitable for ejector applications. Furthermore, R141b has a positive-slope saturated-vapor line in the temperature-entropy diagram and therefore does not require superheating. Its critical temperature and pressure are respectively 204.2 °C and 4205 kPa. Its normal boiling point is 32 °C. Its ODP (Ozon depletion potential) value is 0.1 proving that it has a negligible impact on the environment, while its global warming potential (GWP) value is 725 which is quite acceptable for the application under consideration. The profiles of pressure, temperature and velocity along the ejector are illustrated in
Figure 4.
By using the definition of transiting exergy from
Figure 1 and the simulation results presented in
Table 1, it is possible to compute the exergy consumed (∇E) and produced (ΔE) within each part of the ejector. Let us discuss the mathematical expression and the physical meaning of each of these terms.
The exergy consumption is the decrease of thermo-mechanical exergy due to pressure and temperature drops at sup-environmental conditions. The exergy production is the increase of kinetic energy due to the velocity rise from the section’s inlet to outlet.
(∇E) is the decrease of thermo-mechanical exergy due to the pressure drop from inlet to outlet and the temperature drop from its inlet value to T0. The exergy production includes: (1) the increase of thermal exergy due to the temperature drop from T0 to T7p at the sub-environmental conditions and calculated at constant outlet pressure P7p, and (2) the increase of kinetic energy due to the velocity rise from inlet to outlet.
(∇E) is the decrease of mechanical exergy due to the pressure drop and calculated at constant inlet temperature T6. (ΔE) is the sum of: (1) the increase of thermal exergy due to the temperature drop in the sub-environmental region and calculated at constant outlet pressure P7s, and (2) the increase of kinetic energy due to the velocity rise from inlet to outlet.
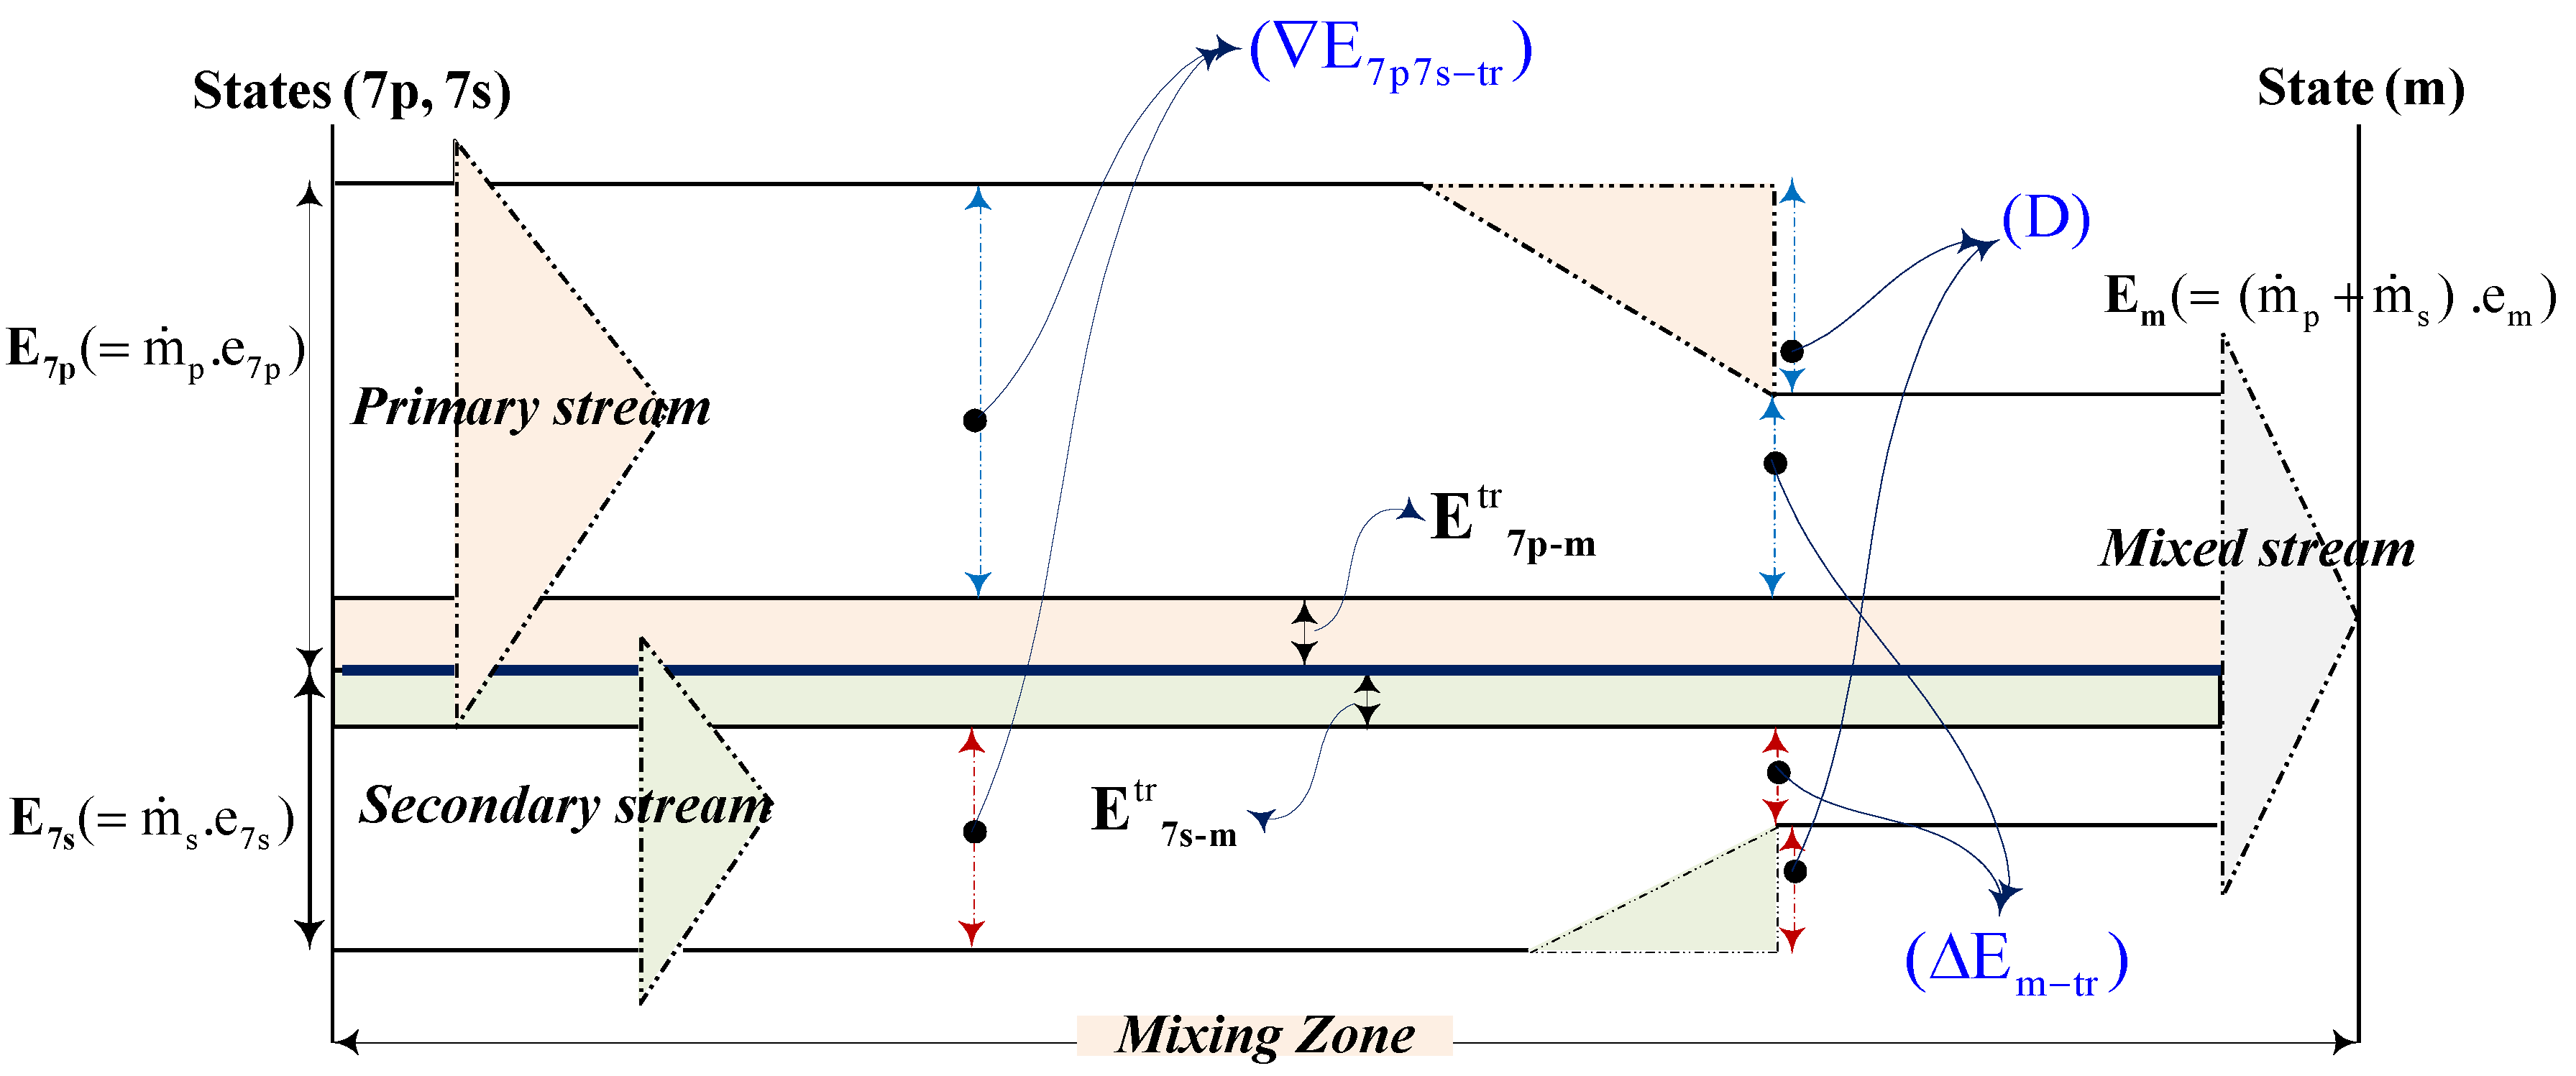
Given that the mixing section deals with two currents ( and ), the transiting exergies in Equations (12) and (13) are calculated for each current. As a result the consumed exergy is linked to both currents. For the primary stream it is the sum of: (1) the decrease of thermal exergy due to a temperature rise in the sub-environmental region and calculated at constant inlet pressure P7p, and (2) the decrease of kinetic energy due to the velocity reduction. For the secondary stream it is the decrease of thermal exergy due to a temperature rise in the sub-environmental region and calculated at constant inlet pressure P7s. The produced exergy is linked to the primary and secondary streams together. For the primary it is the increase of thermal exergy due to a temperature rise in the sup-environmental region and calculated at constant outlet pressure P7p. For the secondary it is the sum of: (1) the increase of thermal exergy due to the temperature rise in the sub-environmental region and calculated at constant outlet pressure P7s, and (2) the increase of kinetic energy due to the velocity rise.
Figure 5 used the diagram of Grassmann applied to the section (7p-m + 7s-m) to illustrate the existing phenomenon in this mixing zone which is given by the two equations (12) and (13).
The exergy consumption (∇E) across the normal shock is the decrease in kinetic energy due to the velocity drop. The exergy production (ΔE) is the increase of thermo-mechanical exergy due to the temperature rise from the inlet to the outlet in sup-environmental region and the increase in pressure from the inlet to the outlet.
The temperature variation can be neglected in this section, thus (∇E) is the decrease of mechanical exergy due to the pressure drop caused by friction and calculated at constant inlet temperature Td. (ΔE) is the increase of kinetic energy due to the velocity rise from the inlet to the outlet.
In this section (∇E) is the decrease in kinetic energy due to the velocity drop. (ΔE) is the increase of thermo-mechanical exergy due to the pressure and temperature rise.
The terms (∇E) and (ΔE) for the overall ejector may be calculated applying the same methodology. Given that the velocities of the stream in the inlet (states 4, 6) and outlet (state 1) of the ejector are negligible, the terms are:
The consumed exergy is linked to both currents. For the primary stream (∇E) is the decrease of thermo-mechanical exergy due to the pressure and temperature drops in the sub-environmental region. For the secondary stream (∇E) is the decrease of thermal exergy due to the temperature rise from the sub-environmental value to T0 and calculated at constant inlet pressure P6. The produced exergy (ΔE) is linked to the secondary stream only. The exergy production is the increase of thermo-mechanical exergy due to the pressure rise from the inlet to the outlet and to the temperature rise from T0 to T1.
4. Analysis of Numerical Results
The numerical values of the above terms are presented in
Table 2. The corresponding exergy losses (D), Grassmann exergy efficiencies (ƞ
ex, GR) and exergy efficiencies taking into account the transition streams (ƞ
ex, TR) are calculated according to Equations (1), (4), (5) and are presented in the table as well.
The most important exergy losses take place within the zone of the shock (section m-d). The second important place with the greatest irreversibility is the mixing zone (sections 7p-m + 7s-m). The third one is the diverging part of the nozzle (section thr-7p). Let us now illustrate in which way the newly introduced thermodynamic metrics, exergy consumed (∇E) and produced (ΔE) as well as exergy efficiency (ƞex, TR), may be used to complement this analysis.
According to
Table 2, D
m-d is larger than D
7p-m+7s-m, however ƞ
m-d is higher than ƞ
7p-m+7s-m. It means that the transformation of thermal and kinetic exergies into thermal and mechanical exergies, taking place within the zone of shock, is thermodynamically more efficient than the transformation of thermal and kinetic exergies into kinetic exergy of the secondary stream, taking place within the zone of mixing. Thus, particular attention should be paid to the improvement of the mixing process. The analysis of expression (12) for (∇E) reveals that the most important factor influencing the irreversible losses in the zone of mixing is the decrease of thermal exergy due to the temperature rise in the sub-environmental region (from 257 K to 289 K for the secondary stream and from 284 K to 289 K for the primary stream). As a result the cold created in the evaporator of a refrigeration system, in the diverging part of the nozzle (thr-7p) and in the suction section of the entrained stream (6-7s) is completely destroyed in the zone of mixing. To our knowledge this type of result has never been published in the scientific literature. The engineering proposals regarding the reduction of (∇E) in this zone and the consequent reduction of exergy losses will be discussed in future publications.
Another important result derived from this analysis deals with the diverging part of the nozzle (thr-7p). As has been already mentioned the exergy losses are substantial in this section. Thus it seems that their reduction is an important direction for the ejector’s improvement. However it is not the case. Indeed, the thermodynamic efficiency of the transformation of mechanical and thermal exergies into kinetic and thermal exergies is highly efficient in this section (95.7%). Thus the likelihood of exergy losses reduction here is very low.
Now let’s compare the values of Grassman exergy efficiency (ƞex, GR) with the efficiency (ƞex, TR) taking into account the transiting exergy flow. First of all let’s notice that the value of (ƞex, GR) for the suction section of the entrained stream (6–7s) is higher than 100%, and thus does not have any physical meaning. The explanation of this unacceptable result is the following; because of the vacuum conditions the exergies E7s and E6 are negative, where E7s is lower than E6 by the value of exergy losses. It means that absolute value of E7s is higher than E6. As a result the ratio E7s/E6 is higher than 1. Contrary to (ƞex, GR), the value of (ƞex, TR) is lower than 100%, and it reflects in this way the exergy losses occurring within the suction section of the entrained stream.
The second observation concerns the efficiencies of the mixing zone (7p-m + 7s-m) and the zone of the shock (m-d). According to (ƞex, GR) the section (m-d) is less efficient and according to (ƞex, TR) it is more efficient. The main reason of this contradiction is the fact that exergy flows at the entries and exists of each zone present the summation of positive terms (thermal and kinetic exergies) and negative ones (mechanical exergies under vacuum conditions). As a result their ratio (ƞex, GR) does reflect the mutual transformation of one form of exergy to another. On the contrary, given that the transiting part of mechanical exergy is negative, the application of (ƞex, TR) reflects this mutual transformation. Thus by transforming the kinetic exergy to mechanical one, the zone of the shock is more efficient than the mixing zone. The third observation concerns the constant area section (d-8). According to (ƞex, TR), it is the less efficient part of the ejector. According to (ƞex, GR), it is one of the most efficient. The main reason of this discrepancy is the presence of an important transiting exergy flow; this fact is ignored when the Grassman exergy efficiency is applied.
Finally the exergy efficiency (ƞex, TR) of the overall ejector, calculated according to Equations (20), (21) and (4) is low and equals 18.3%, contrary to the “optimistic” value 37.5% of (ƞex, GR). The main reason of this difference is the presence of an important transiting exergy flow of 3.2 kW.


