
Time Series Chlorophyll-A Concentration Data Analysis: A Novel Forecasting Model for Aquaculture Industry †


Abstract
:1. Introduction
2. Data Source
2.1. The Study Area Description and Datasets Analysis
2.2. Data Pre-Treatment, Filling and Correction
3. Proposed Model
3.1. Deep Learning LSTM Neural Networks
- (a)
- Forget gate equation:
- (b)
- Input gate equations:
- (c)
- Output gate equations:
- (d)
- Cell state equation:
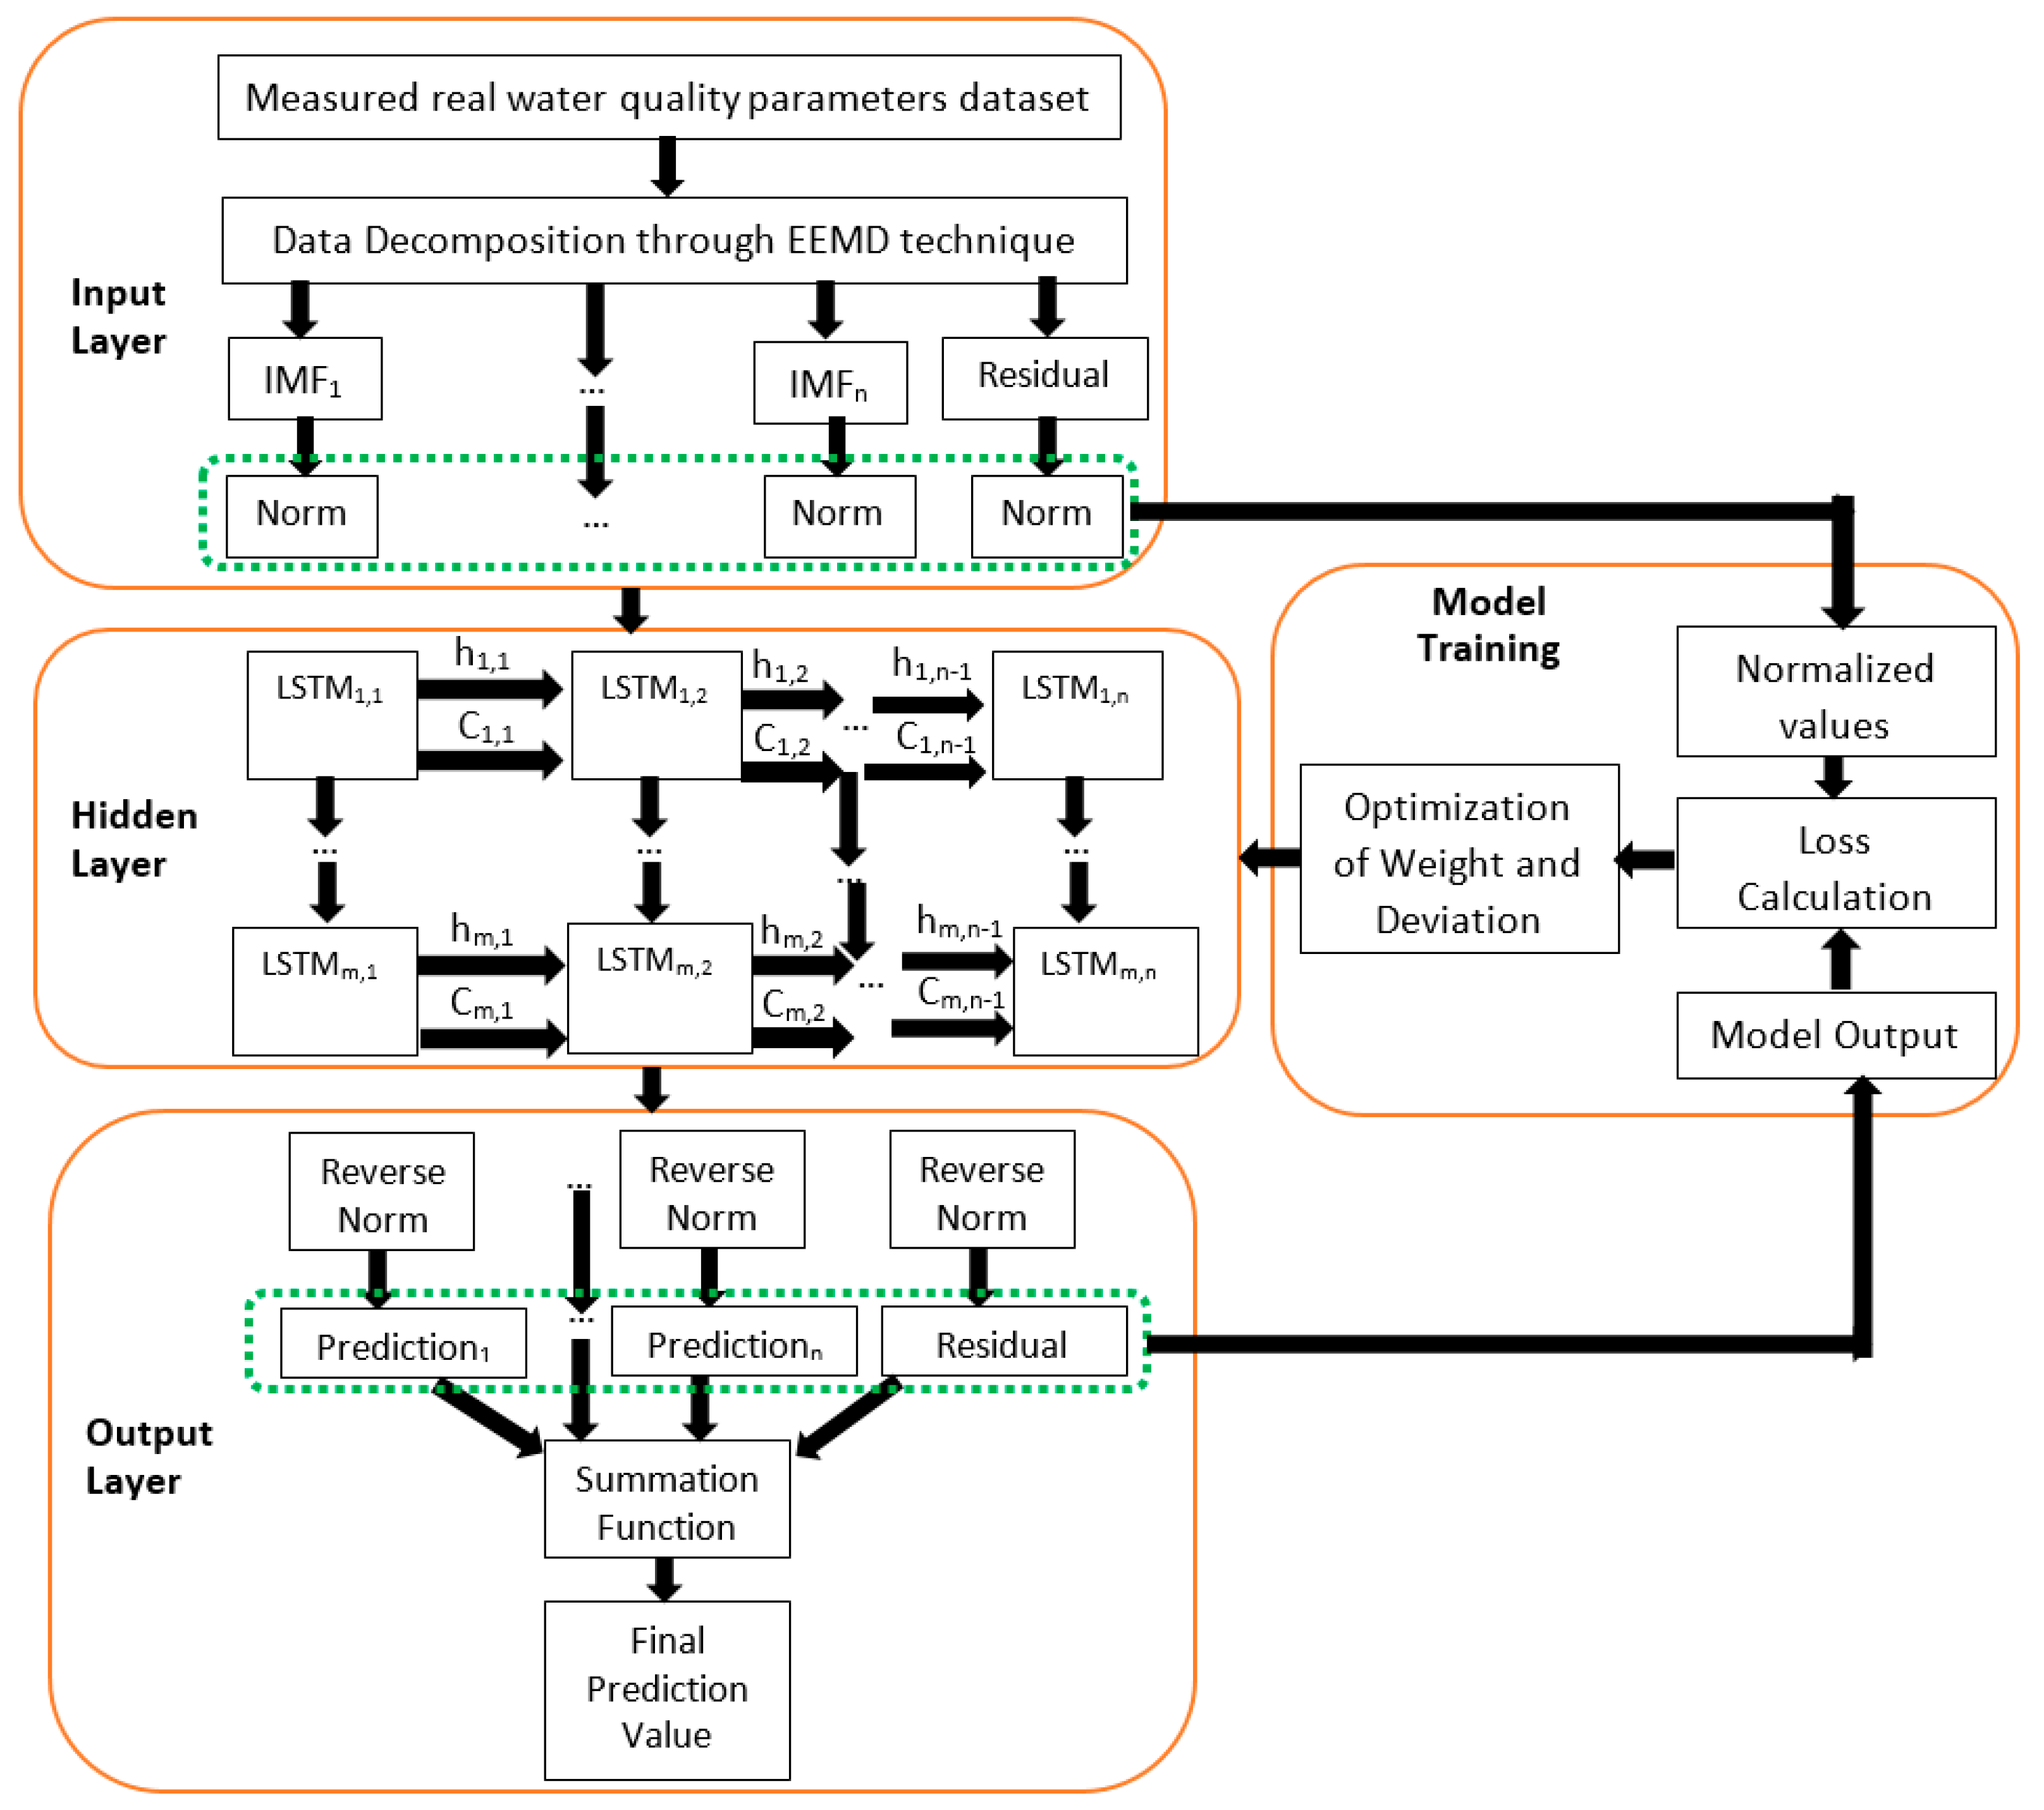
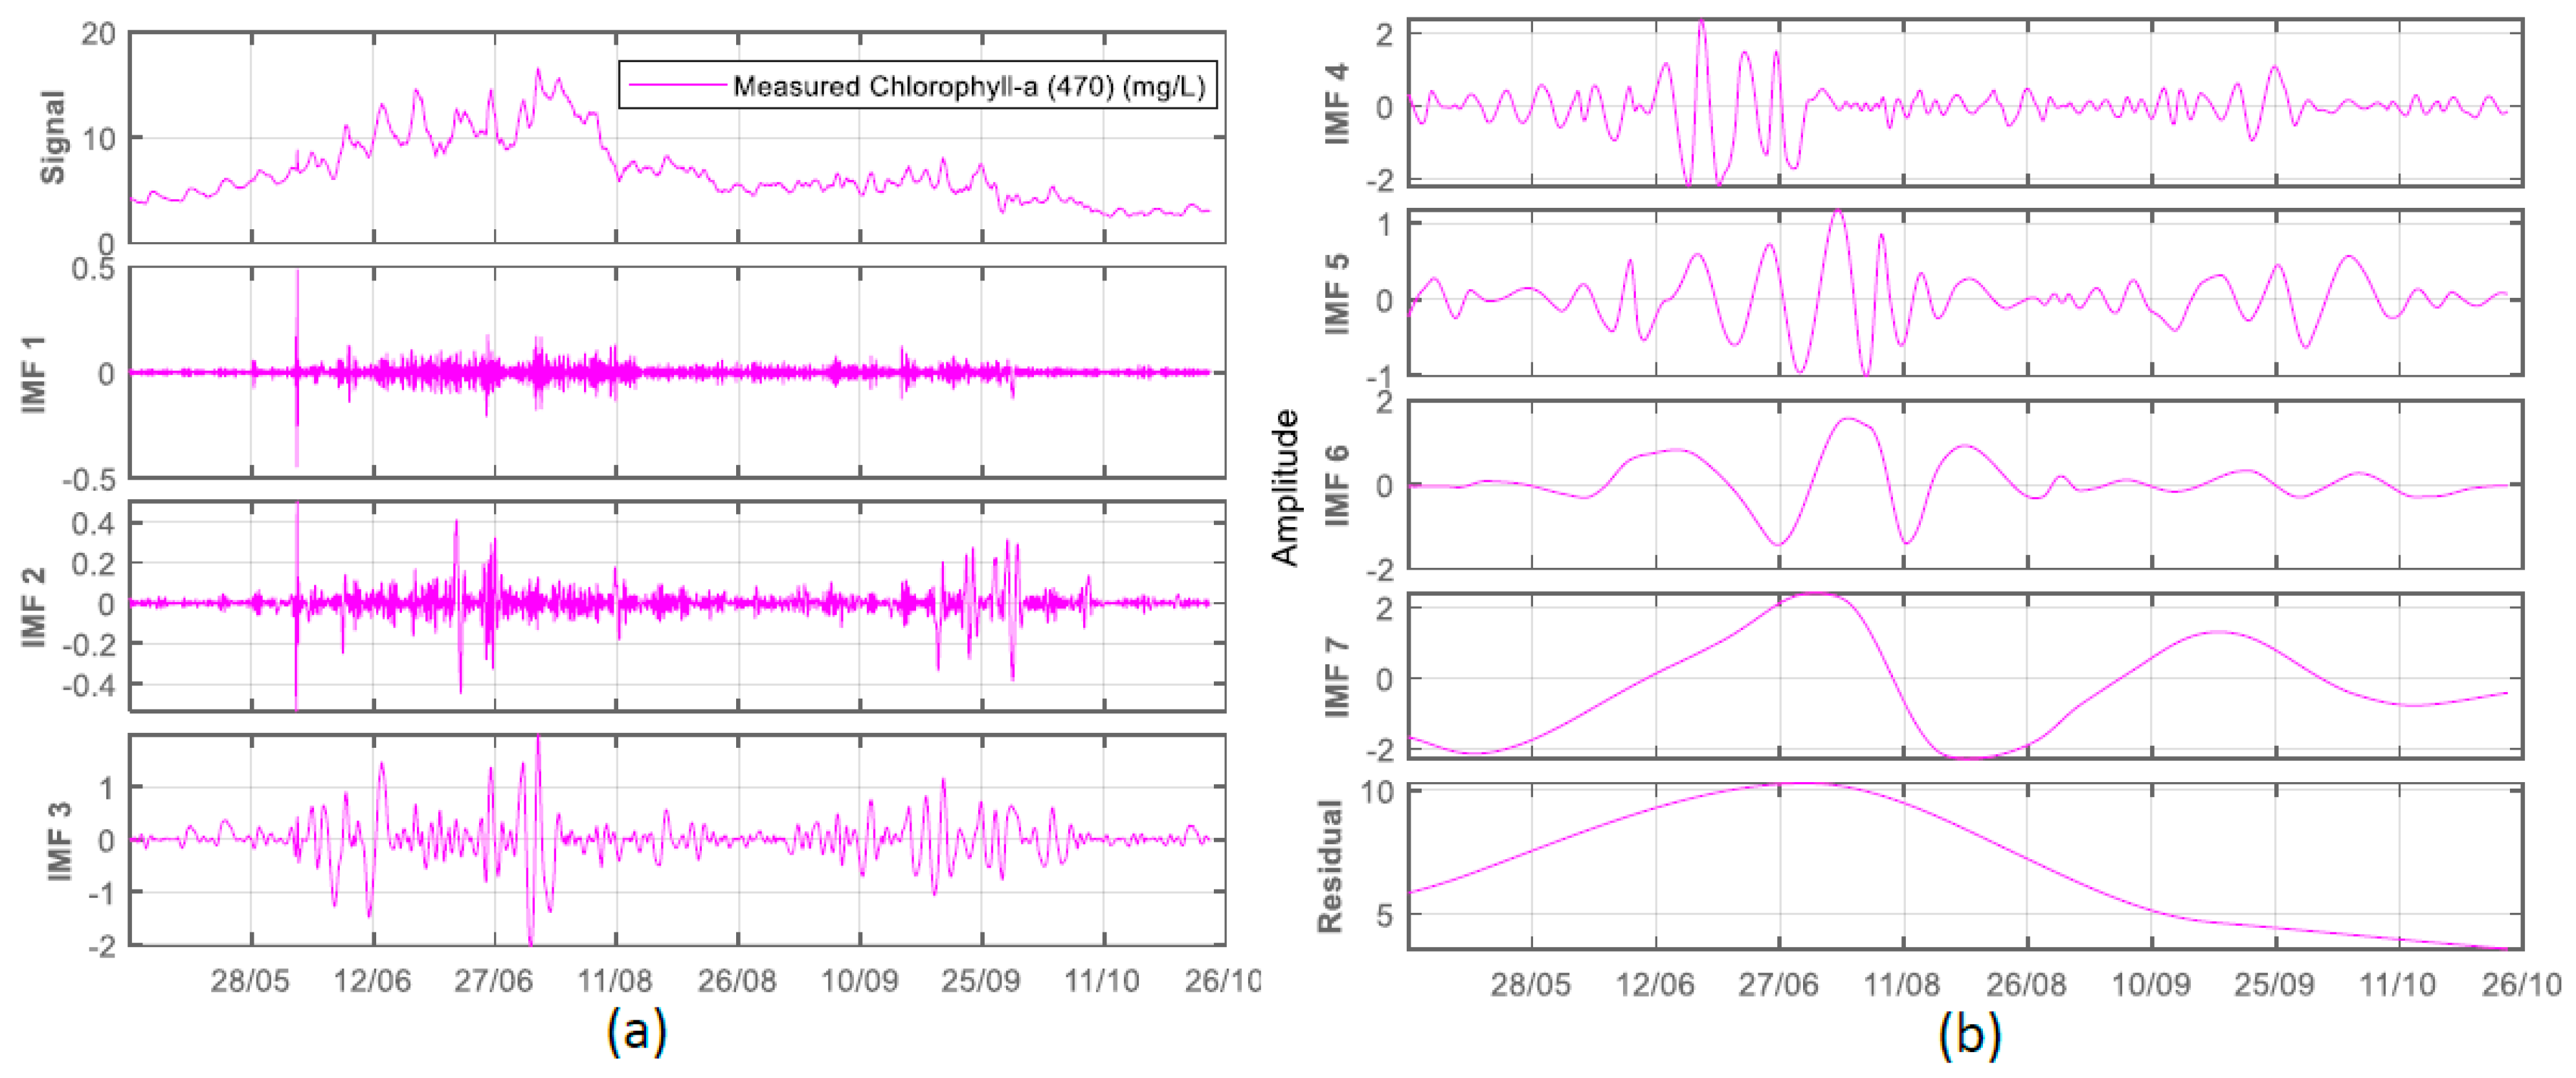
3.2. Proposed Water Quality Prediction Model
4. Performance Evaluation
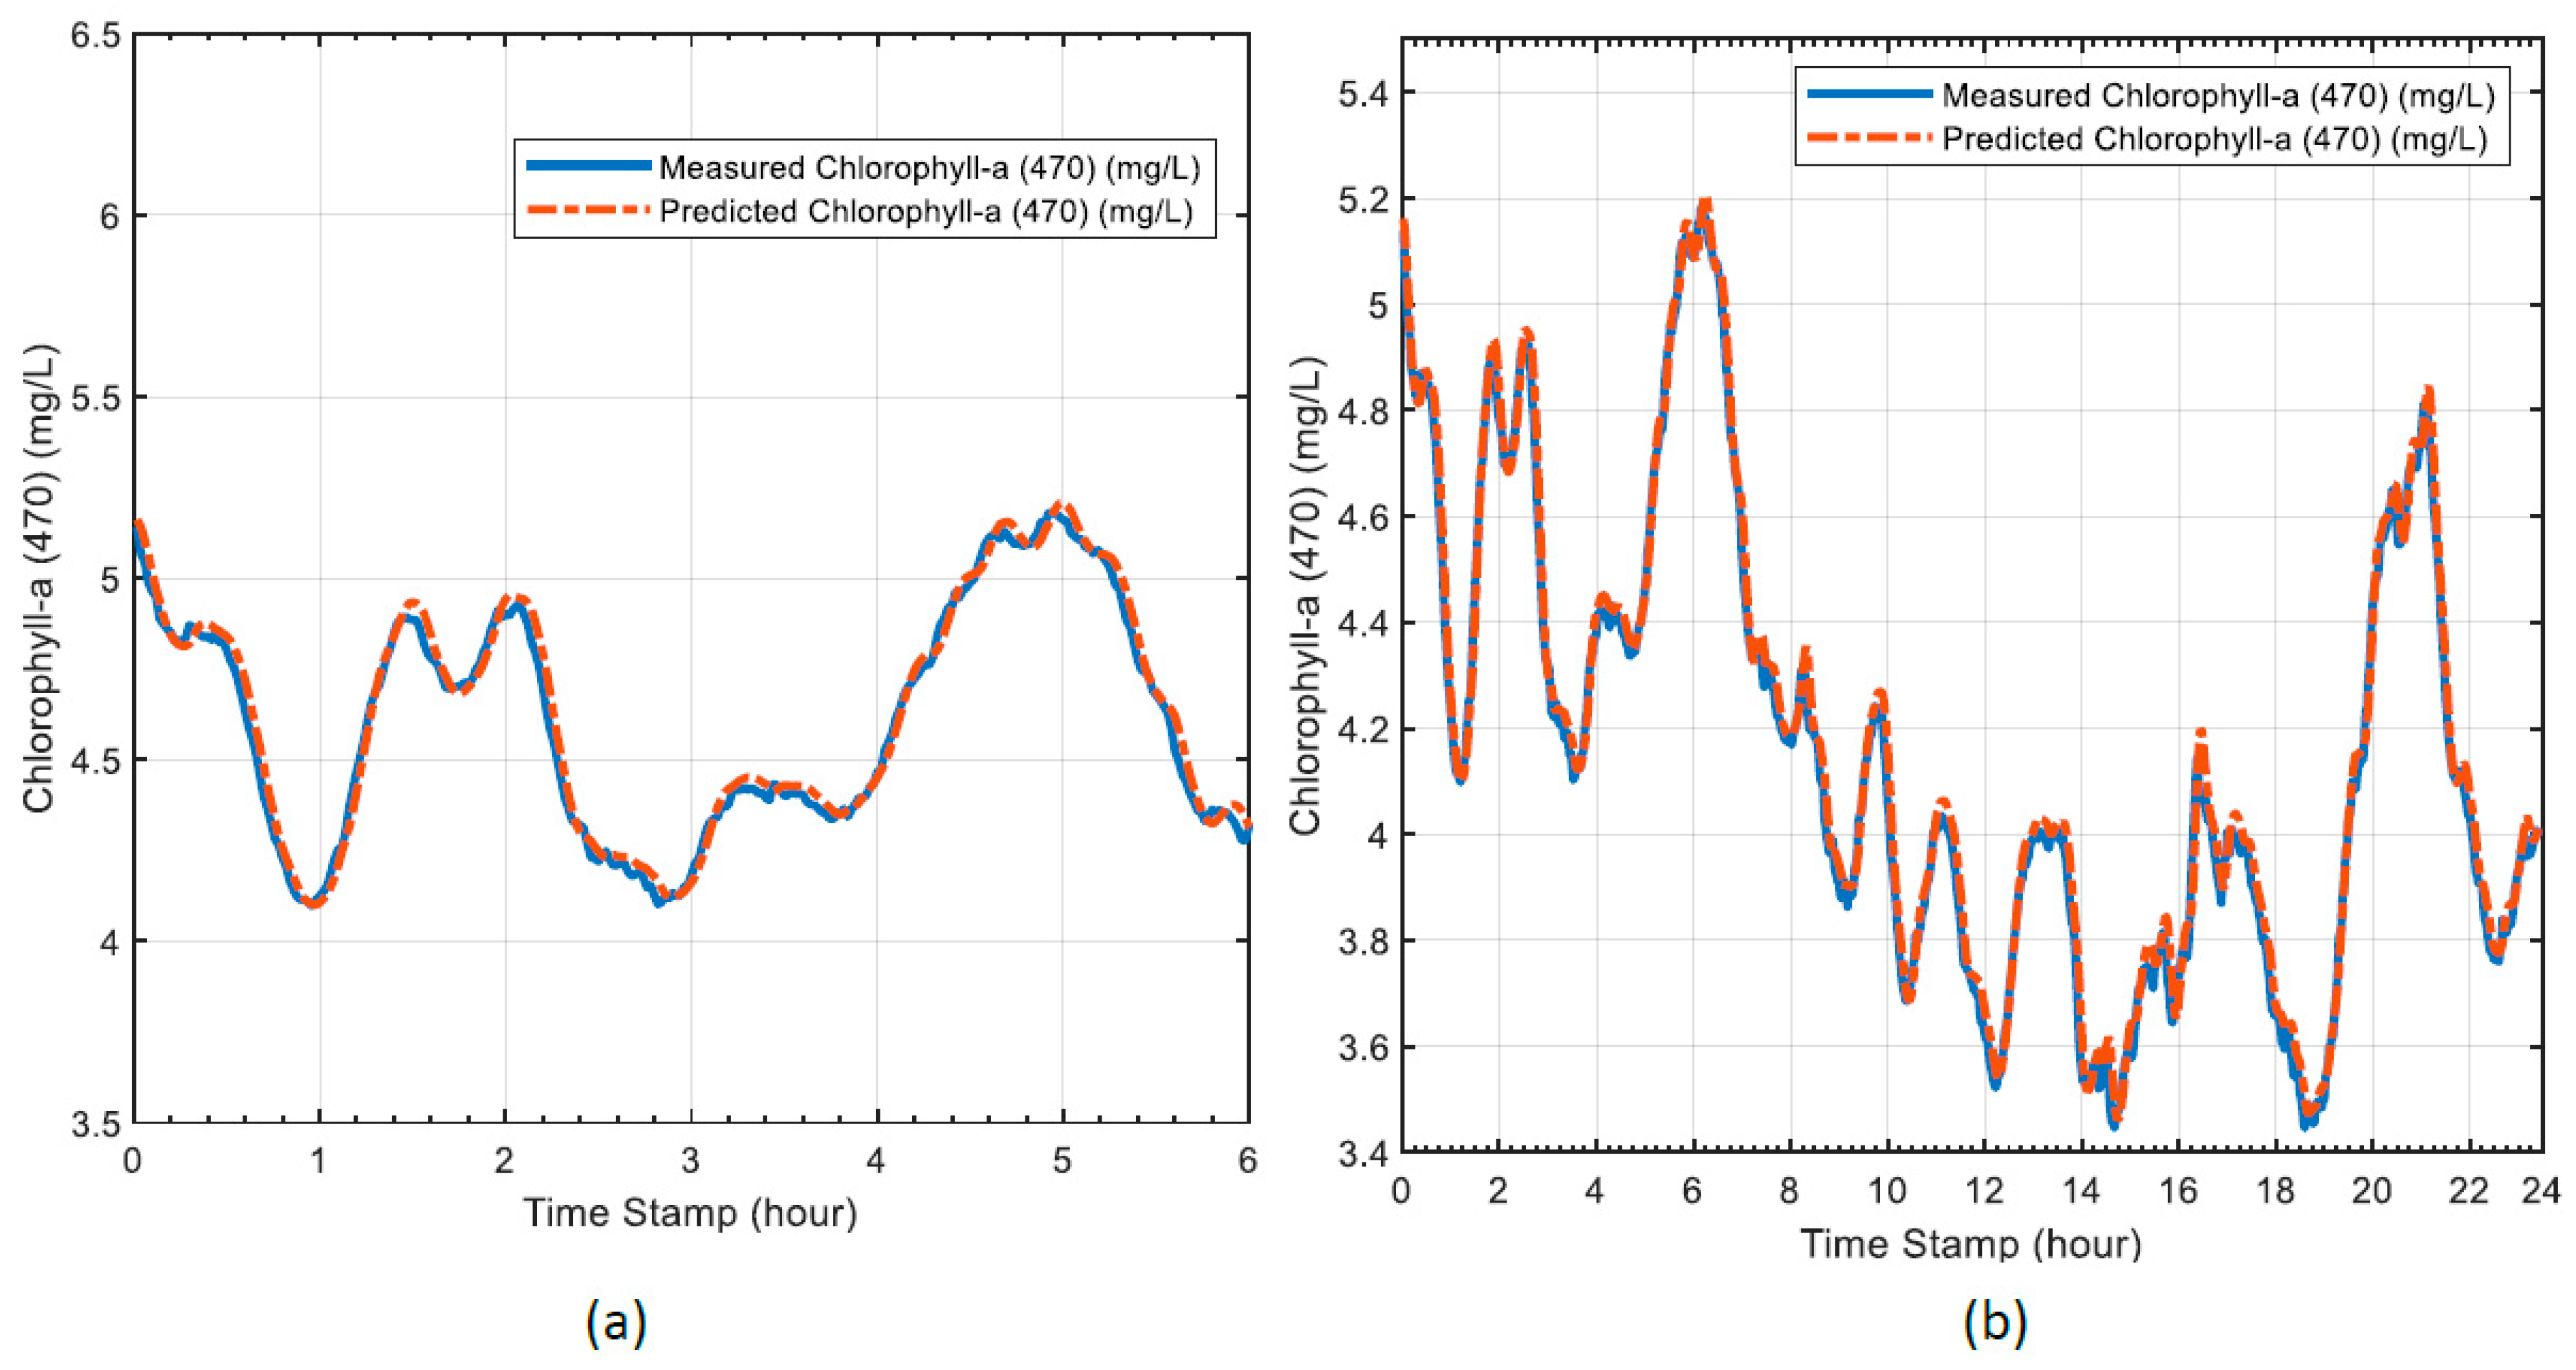
5. Results and Discussions
6. Conclusions
Funding
Acknowledgments
Conflicts of Interest
References
- Chislock, M.F.; Doster, E.; Zitomer, R.A.; Wilson, A.E. Eutrophication: Causes, Consequences, and Controls in Aquatic Ecosystems. Nat. Educ. Knowl. 2013, 4, 1–10. [Google Scholar]
- Howarth, R.; Chan, F.; Conley, D.J.; Garnier, J.; Doney, S.C.; Marino, R.; Billen, G. Coupled biogeochemical cycles: Eutrophication and hypoxia in temperate estuaries and coastal marine ecosystems. Front. Ecol. Environ. 2011, 9, 18–26. [Google Scholar] [CrossRef] [Green Version]
- Kim, B.C.; Jung, S.M.; Jang, C.W.; Kim, J.K. Comparison of BOD, COD and TOC as the indicator of organic matter pollution in streams and reservoirs of Korea. J. Korean Soc. Environ. Eng. 2007, 29, 640–643. [Google Scholar]
- Gao, C.; Zhang, T. Eutrophication in a Chinese context: Understanding various physical and socio-economic aspects. Ambio 2010, 39, 385–393. [Google Scholar] [CrossRef] [PubMed] [Green Version]
- Pretty, J.N.; Mason, C.F.; Nedwell, D.B.; Hine, R.E.; Leaf, S.; Dils, R. Environmental Costs of Freshwater Eutrophication in England and Wales. Environ. Sci. Technol. 2003, 37, 201–208. [Google Scholar] [CrossRef] [PubMed] [Green Version]
- Chelsea Technologies. Aquaculture. Available online: https://chelsea.co.uk/application-category/aquaculture (accessed on 13 April 2021).
- El-Otify, A.M. Evaluation of the physicochemical and chlorophyll-a conditions of a subtropical aquaculture in Lake Nasser area, Egypt. Beni-Suef Univ. J. Basic Appl. Sci. 2015, 4, 327–337. [Google Scholar] [CrossRef] [Green Version]
- Ha, N.T.; Koike, K.; Nhuan, M.T. Improved Accuracy of Chlorophyll-a Concentration Estimates from MODIS Imagery Using a Two-Band Ratio Algorithm and Geostatistics: As Applied to the Monitoring of Eutrophication Processes over Tien Yen Bay (Northern Vietnam). Remote Sens. 2013, 6, 421–442. [Google Scholar] [CrossRef] [Green Version]
- Shumway, S.E. A review of the effects of algal blooms on shellfish and aquaculture. J. World Aquac. Soc. 1990, 21, 65–104. [Google Scholar] [CrossRef]
- Shin, Y.; Kim, T.; Hong, S.; Lee, S.; Lee, E.; Hong, S.; Lee, C.; Kim, T.; Park, M.S.; Park, J.; et al. Prediction of chlorophyll-a concentrations in the Nakdong River using machine learning methods. Water 2020, 12, 1822. [Google Scholar] [CrossRef]
- Wang, X.; Wang, G.; Zhang, X. Prediction of Chlorophyll-a content using hybrid model of least squares support vector regression and radial basis function neural networks. In Proceedings of the 2016 Sixth International Conference on Information Science and Technology (ICIST), Dalian, China, 6–8 May 2016; pp. 366–371. [Google Scholar]
- Syariz, M.A.; Lin, C.H.; Nguyen, M.V.; Jaelani, L.M.; Blanco, A.C. WaterNet: A convolutional neural network for chlorophyll-a concentration retrieval. Remote Sens. 2020, 12, 1966. [Google Scholar] [CrossRef]
- Eze, E.; Ajmal, T. Dissolved Oxygen Forecasting in Aquaculture: A Hybrid Model Approach. Appl. Sci. 2020, 10, 7079. [Google Scholar] [CrossRef]
- Hu, Z.; Zhang, Y.; Zhao, Y.; Xie, M.; Zhong, J.; Tu, Z.; Liu, J. A water quality prediction method based on the deep LSTM network considering correlation in smart mariculture. Sensors 2019, 19, 1420. [Google Scholar] [CrossRef] [PubMed] [Green Version]
- Chelsea Technologies. TriLux. Available online: https://chelsea.co.uk/products/trilux/ (accessed on 13 April 2021).
- Pan, L.; Li, J.; Luo, J. A temporal and spatial correction based missing values imputation algorithm in wireless sensor networks. Chin. J. Comput. 2010, 33, 1–10. [Google Scholar] [CrossRef]
- Jason Brownlee, Stacked Long Short-Term Memory Networks Develop Sequence Prediction Models in Keras. 14 August 2019. Available online: https://machinelearningmastery.com/stacked-long-short-term-memorynetworks/ (accessed on 19 February 2021).


| Fluorometers | Active Fluorometers | Optical Sensors | ||||||||||||||
|---|---|---|---|---|---|---|---|---|---|---|---|---|---|---|---|---|
| UniLux | TriLux | UviLux | VLux AlgaePro | VLux TPro | VLux FuelPro | VLux OilPro | LabSTAF | FastOcean APD | FastOcean | Act2 Lab | FastBallast | PAR Sensor | GlowTracka | UniLux Turbidity | ||
| Fluorometers | Chlorophyll-a |  | | | | | | | | | | | ||||
| Phycobiliproteins | | | | | | | | | | | | |||||
| Fluorescein | | |||||||||||||||
| Rhodamine | | |||||||||||||||
| BTEX | | | ||||||||||||||
| PAH | | | ||||||||||||||
| Tryptophan | | | ||||||||||||||
| CDOM | | | | | ||||||||||||
| Active Fluorometers | Variable Fluorescence | | | | | | ||||||||||
| Fluorescence Light Curves (FLC) | | | ||||||||||||||
| Phytoplankton Primary Productivity | | | | |||||||||||||
| Phytoplankton Cell Counting | | |||||||||||||||
| Optical Sensors | PAR | | ||||||||||||||
| Bioluminescence | | |||||||||||||||
| Turbidity | | | | | | | | |||||||||
| Absorbance | | | | |||||||||||||
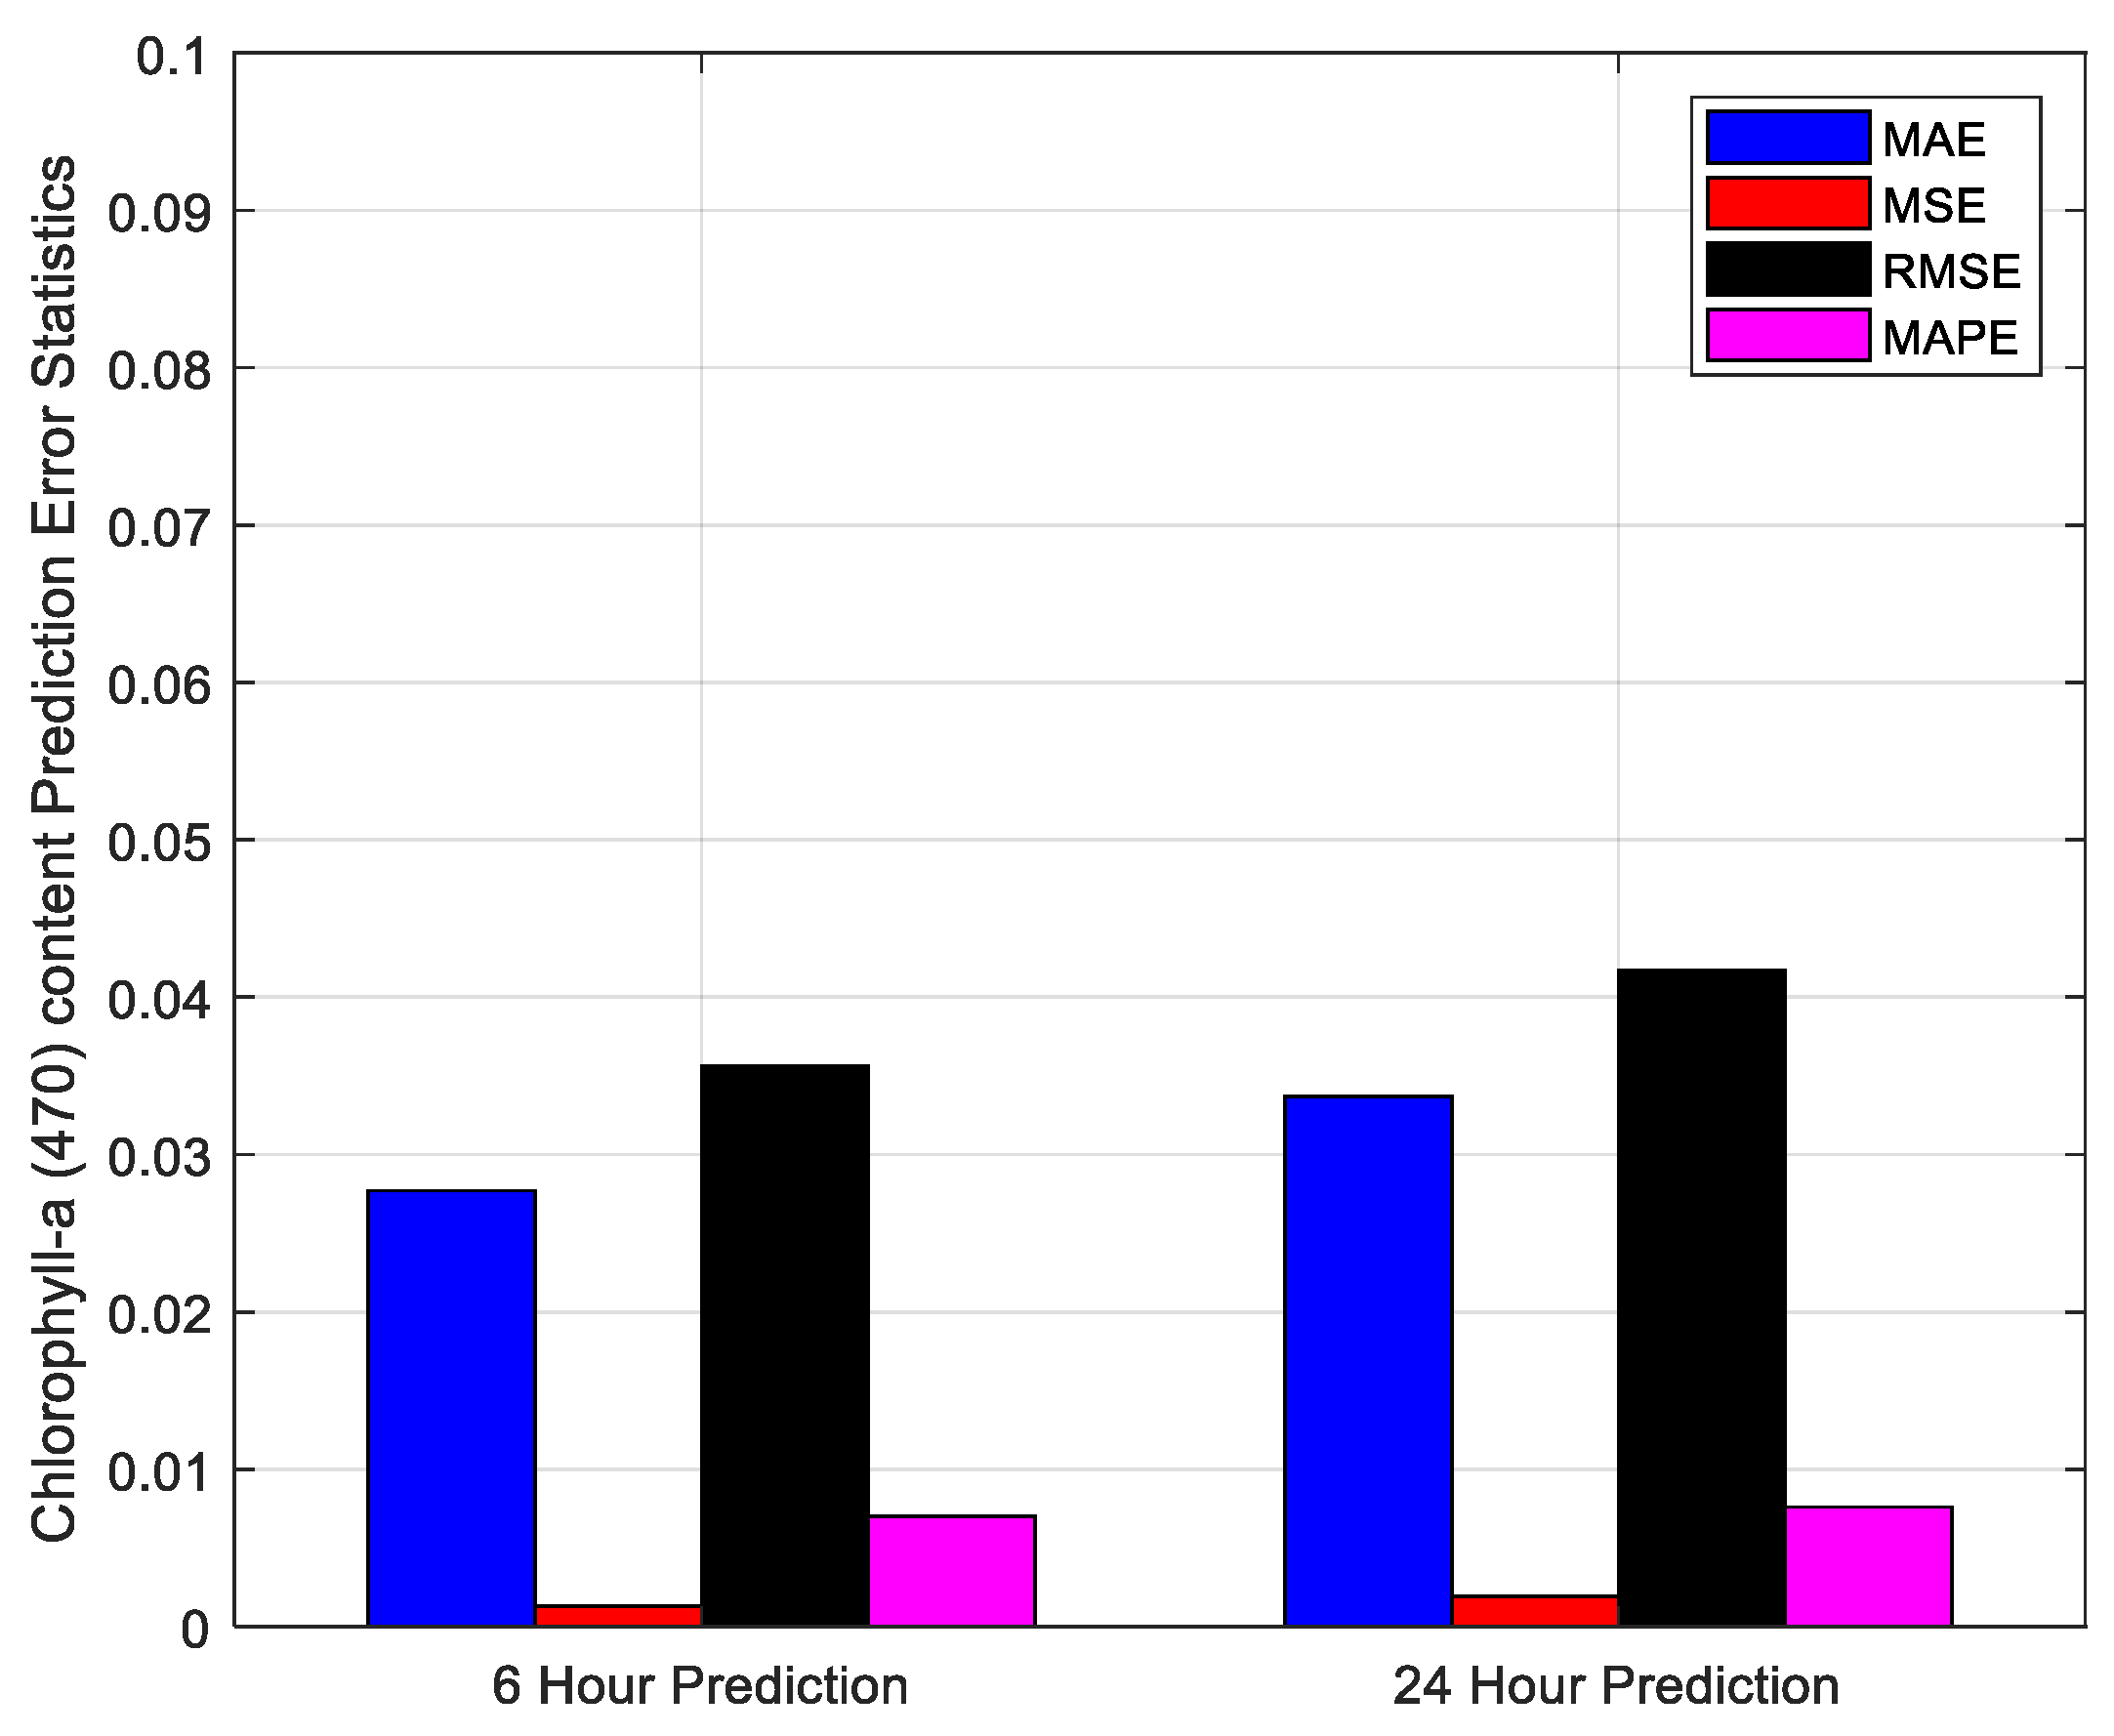
| Error Statistics | 6 Hour Prediction | 24 Hour Prediction |
|---|---|---|
| MSE | 0.0013 | 0.0019 |
| MAE | 0.0277 | 0.0337 |
| RMSE | 0.0356 | 0.0417 |
| MAPE | 0.0070 | 0.0076 |
Publisher’s Note: MDPI stays neutral with regard to jurisdictional claims in published maps and institutional affiliations. |
© 2021 by the authors. Licensee MDPI, Basel, Switzerland. This article is an open access article distributed under the terms and conditions of the Creative Commons Attribution (CC BY) license (https://creativecommons.org/licenses/by/4.0/).
Share and Cite
Eze, E.; Kirby, S.; Attridge, J.; Ajmal, T. Time Series Chlorophyll-A Concentration Data Analysis: A Novel Forecasting Model for Aquaculture Industry. Eng. Proc. 2021, 5, 27. https://0-doi-org.brum.beds.ac.uk/10.3390/engproc2021005027
Eze E, Kirby S, Attridge J, Ajmal T. Time Series Chlorophyll-A Concentration Data Analysis: A Novel Forecasting Model for Aquaculture Industry. Engineering Proceedings. 2021; 5(1):27. https://0-doi-org.brum.beds.ac.uk/10.3390/engproc2021005027
Chicago/Turabian StyleEze, Elias, Sam Kirby, John Attridge, and Tahmina Ajmal. 2021. "Time Series Chlorophyll-A Concentration Data Analysis: A Novel Forecasting Model for Aquaculture Industry" Engineering Proceedings 5, no. 1: 27. https://0-doi-org.brum.beds.ac.uk/10.3390/engproc2021005027