Article

Poultry Litter, Biochar, and Fertilizer Effect on Corn Yield, Nutrient Uptake, N2O and CO2 Emissions

1
USDA-ARS, 2413 Nashville Rd B-5, Bowling Green, KY 42101, USA
2
Self-Employed, Bowling Green, KY 42104, USA
3
USDA-ARS, Florence, SC 29501, USA
*
Author to whom correspondence should be addressed.
Submission received: 21 April 2019 / Revised: 18 May 2019 / Accepted: 23 May 2019 / Published: 24 May 2019

Abstract

:
Biochar holds promise as a soil amendment with potential to sequester carbon, improve soil fertility, adsorb organic pollutants, stimulate soil microbial activities, and improve crop yield. We used a hardwood biochar to assess its impact on corn (Zea mays) grain, biomass yields and greenhouse gas emission in central Kentucky, USA. Six treatments included as follows: control (C) with no amendment applied; poultry litter (PL); biochar (B); biochar + poultry litter (B + PL); fertilizers N-P-K (F); and biochar + fertilizers (B + F). Biochar was applied only once to plots in 2010 followed by rototilling all plots. Only PL and fertilizer were applied annually. When applied alone, biochar did not significantly increase dry matter, grain yield, and N-P-K uptake. There was also no significant difference between the combined treatments when compared with PL or F applications alone. We observed a slight increasing trend in corn grain yield in the following 2 years compared to the first year from biochar treatment. Poultry litter treatment produced significantly greater N2O and CO2 emissions, but emissions were lower from the B+PL treatment. We conclude that this biochar did not improve corn productivity in the short term but has potential to increase yield in the long term and may have some benefit when combined with PL or F in reducing N2O and CO2 emissions.

1. Introduction

One strategy that has been advocated for mitigating and reducing global CO2 concentration is based on the pyrolysis of biomass—a process that produces a byproduct known as biochar. When biochar is produced from biomass, it represents a net withdrawal of CO2 from the atmosphere [1]. Biochar is black carbon, but not all black carbon materials are biochar [2]. The C in biochar is highly resistant to microbial degradation for many years [3]. It has also been emphasized that biochar holds great promise as a soil amendment to sequester carbon, improve soil fertility, adsorb organic pollutants, and stimulate soil microbial activities. Additionally, there are other benefits of incorporating biochar into a soil such as increases in cation exchange capacity (CEC) [4], increases in nutrient retention and availability for plant uptake particularly in highly weathered soils (Ultisols), and increases in fertilizer N use efficiency [5,6,7,8]. Clough and Condron [9] reported that agronomic benefits of biochar addition are well documented for highly weathered soils; however, little information exists on biochar impact on soil properties and crop yields in moderately weathered soils (Alfisols).
Biochar adds C structures into the stable soil organic matter (SOM) pool which improves soil fertility and crop productivity. The addition of biochar to soils may produce immediate effects on soil properties such as soil nutrition, water retention, and microbial activities [10,11,12]. Although these effects vary depending on soil type, the impacts may be long-term on soil and environments [13,14]. The addition of biochar to soils has not proven to be consistent with increasing crop yields. Approximately 50% of the compiled studies observed short-term positive yield or growth impact, while 30% have reported no significant differences and 20% reported negative yield or growth effects [2]. They also reported that greater positive yield impacts for biochar addition occurred when it was applied to highly weathered or degraded soils with limited fertility and productivity. Novak et al. [15,16] reported that biochar produced at higher pyrolysis temperatures increased soil pH. They also concluded that biochar produced from different feedstocks under different pyrolysis conditions affects soil physical and chemical properties in different ways. Jeffery et al. [17] and Crane-Droesch et al. [18] evaluated the impact of various biochar on crop yield. They used results from two meta-analyses of biochar studies and showed an overall average crop yield increase of 10% after applying biochar to soil. They also reported that crop yields were soil-type-dependent and growth enhancements were highly variable. Another more recent meta-analysis using data from 84 reports by Crane-Droesch et al. [18] reported that biochar increased crop yields in the highly weathered soils of humid tropics more than in nutrient-rich temperate soils. One reason for crop yield variability in these studies may be due to differences in biochar quality associated with the feedstock, pyrolysis conditions, application rates, and soil properties [19]. For example, yield improvements were often associated with biochar application to low pH, nutrient-poor soils because alkaline biochar induced a soil-liming effect [20,21]. The array of controversies regarding the benefits of biochar and the variabilities reported for similar treatments through different studies as reported in the literature warrants further and continued research with different types of biochar for specific regions and crops. Therefore, the objective of this study was to investigate the impact of hardwood biochar alone and in combination with poultry litter or with chemical fertilizer on corn growth, grain yield, and greenhouse gas emissions on a Crider silt loam near Bowling Green, Kentucky USA. We hypothesized that the hardwood biochar used in this study, whether applied alone or combined with PL, would increase corn productivity and reduce N2O and CO2 emissions.

2. Material and Methods

Field experiments were conducted in 2010, 2011, and 2013 (the experiment was lost in 2012 due to severe summer drought) in which no-till corn was grown for grain on a Crider silt loam soil (Fine-silty, mixed, active, mesic, Typic Paleudalfs) of 1–2% slope in Bowling Green, Kentucky, Kentucky, USA (36°56’19.1” N, 86°28’51.2” W), with textural analysis of 3.1% sand, 65.3% silt, and 31.6% clay and soil organic matter of 25 g kg−1. The region has a temperate climate with a typical mean temperature of 14.5 °C and rainfall of 1300 mm year−1. Precipitation data were collected from a nearby weather station (Western Kentucky University Research Farm) during the growing seasons. The experimental design was a randomized complete block with three replicated plots (4.6-m × 3.5-m). The study site was fallow under mixed grasses such as tall fescue, orchardgrass, and white clover. We purposely chose the site because it had not been fertilized for the previous 5 years. The study included six treatment controls (C) with no amendment applied, poultry litter (PL) (a mixture of poultry manure and bedding materials) applied at a rate to provide 224 kg N ha−1; biochar (B) applied alone at the rate of 21.28 Mg ha−1; biochar + poultry (B + PL); chemical fertilizers; N-P-K (F); and biochar + chemical fertilizers (B + F). Every PL (alone or combined) was surface broadcast applied at the rate to provide 224 kg N ha−1 assuming 50% of the PL total N becomes plant-available during the growing season. Poultry litter application also supplied 245, 181, 187, and 376 kg P ha−1, and 599, 447, 484, and 747 kg K ha−1 in 2010, 2011, 2012, and 2013, respectively. Due to the unbalanced nutrient content of the poultry litter, particularly N:P:K compared to the N:P:K requirement of corn, there was a surplus of P and K applied from litter treatment, since the poultry litter quantity was applied base on the N requirement of the corn. The chemical fertilizers consisted of a blend of urea, muriate of potash, and diammonium phosphate (46-0-0, 0-0-60, 18-46-0). The fertilizer blend was surface broadcast applied at the rate of 224 kg N ha−1 plus P and K based on soil test recommendations, 67.2 kg P ha−1 and 112 kg K ha−1 respectively.
Soil samples (background) were taken to a depth of 15 cm before initial treatment applications. Five random cores of soil were taken with a 2.54-cm diameter soil probe from each plot, combined in a plastic zip seal bag, air-dried, and ground with a Dynacrush soil crusher (Custom Laboratory Inc., Holden, MO, USA) to pass a 2.0-mm mesh. The soil chemical properties were as follows: pH (4.7) measured on a 1:1 soil:CaCl2 (0.05 M) solution using a combination electrode (Accuphast electrode, Fisher Scientific, Pittsburg, PA, USA), total N (1.4 g kg−1) and TC (13.05 g kg−1) in soil were measured using a Vario Max CN analyzer (Elementar Americas, Inc. Mt. Laurel, NJ, USA), and NH4-N (22.8 mg kg−1) and NO3-N (0.84 mg kg−1) were extracted from soil samples with 2 M KCl [22] and then analyzed using flow injection analysis (QuickChem FIA+, Lachat Instruments, Milwaukee, WI, USA). Soil nutrient availability was also assessed after extraction with Mehlich 3 [23], and then elements were quantified using Inductively Coupled Plasma–Optical Emissions Spectroscopy (ICP-OES; Varian, Vista Pro; Varian Analytical Instruments, Walnut Creek, CA, USA). The elements analyzed were as follows: P 4.88 mg kg−1; Ca 1334 mg kg−1; Mg 117 mg kg−1; K 152 mg kg−1; Na 79 mg kg−1; Fe 87 mg kg−1; Mn 144 mg kg−1; and Zn 1.85 mg kg−1.
Approximately 340 kg of CQuest™ biochar for this experiment was produced using sawdust generated from the wood flooring process using mixed hardwood species subject to a fast pyrolysis process at 500–600 °C by the Dynamotive Technologies Corp., (West Lorne, ON, Canada). The biochar was pulverized to fine-sized (<0.5-mm) material and stored in steel drums. Chemical and physical analysis of the hardwood biochar is presented in Table 1. The % moisture, ash content, fixed C, volatile C, and elemental (C, H, O, and N) contents were determined on an oven dry-weight basis by Hazen Research, Inc. (Golden, CO, USA) following ASTM D 3171 and 3176 standard methods (ASTM, 2006). In this method, the O content was determined by difference. These results were used to calculate a molar O/C and H/C ratio. The total K, Ca and P contents were determined using the USEPA 3052 microwave-assisted acid digestion method (USEPA, 1996) and their concentrations were quantified using an inductively-coupled plasma mass spectrometer as outlined by Ref. [24]. The hardwood biochar pH, specific surface area (SAA), and total acidity were measured as outlined by Ref. [15]. The hardwood biochar was surface broadcast applied to all B treatments and incorporated to soil to a depth of 10 cm by a rototiller to prevent potential surface transport of biochar out of the plots by wind or water. The biochar was applied only once at the start of this study in the spring of 2010.
Corn (Zea mays) (DeKalb DKC61-69 RR/BT) was planted (76 cm row spacing) in 4.6 m × 3.5 m sized plots (total of six rows per plot) on 12 May 2010; 9 May 2011, and 2 May 2013. Total aboveground plant biomass was determined at physiological maturity (R6 growth stage) on 17 August 2010, 4 August 2011, and 14 August 2013. For biomass measurement, six plants were randomly selected per plot from a non-border row, cut above the soil surface, weighed, and shredded with a wood chipper (Modern Tool and Die Company, Cleveland, OH, USA) to allow homogenous mixed subsamples to be taken. Samples were then oven-dried at 65 °C for a minimum of 72 h and ground into composite samples with a grinder mill (Thomas Wiley Mill Model 4; Thomas Scientific, Swedesboro, NJ, USA) to pass a 1-mm mesh. Corn was harvested as grain on 9 September 2010, 23 August 2011, and 25 September 2013, by hand-picking the two center rows of each plot for a harvest area of 1.5 m × 3.5 m. Grain subsamples from each plot were taken for analyzing moisture content. Samples were oven-dried at 65 °C and ground with a grinder mill to pass a 1-mm mesh for chemical analysis. Plant tissue samples were analyzed for total N and C using a CN analyzer, and a dry ash/acid extraction procedure [25] was used to analyze samples for total P and K using ICP-OES.
Gaseous emissions (N2O and CO2) were measured during the growing seasons using static, vented chambers [26] and a gas chromatograph analyzer. Measurements of the N2O and CO2 fluxes were taken from May (planting) to September (harvest) for only 2 years (2010 and 2011) following the procedures reported by Mosier et al. [27]. Measurements were generally taken two to three times per week midmorning of each sampling day. The chambers used were made of aluminum and measured 10 cm tall. After treatment applications, anchors were forced into the ground to a depth of 15 cm in each plot such that they were flush with the soil surface. Anchors were installed each year, 1 to 3 days prior to beginning measurements and were not removed until the fall after harvest. At each flux measurement time, the chambers were placed on fixed anchors (38 cm wide and 102 cm long). The anchors were placed such that the 102 cm length was parallel to the corn rows. Plants emerging inside the measurement area were removed. Flux measurements sites were included within each replicate of each treatment plot. Air samples (40 mL) were collected from inside the chambers by syringe at 0, 15, and 30 min intervals after the chambers were seated on the anchors. The air samples were injected into 20 ml evacuated vials that were sealed with grey butyl rubber septa. Samples were analyzed with a gas chromatograph (CP-3800, Varian, Inc., Palo Alto, CA, USA) equipped with a thermoconductivity detector and an electron capture detector for quantification of CO2 and N2O. A quality control standard sample (known concentration) was also analyzed after every 25 unknown samples’ analysis. Fluxes were calculated for each gas from the linear or non-linear [28] increase in concentration (selected according to the emission pattern) in the chamber headspace with time as suggested by Livingston and Hutchinson [26]. To calculate the cumulative growing season fluxes, estimates of daily N2O and CO2 emissions between sampling days were calculated using a linear interpolation between adjacent sampling dates.
The experimental design was a randomized complete block with three replicated plots (4.6-m × 3.5-m). Differences among treatments and years were determined by analysis of variance (ANOVA) using PROC GLM procedure (SAS Institute, 2001). Blocks were considered as random factor and year as repeated measurement. All statistical comparisons were made at α = 0.05 probability level using Fisher’s protected LSD to separate treatment means.

3. Results and Discussion

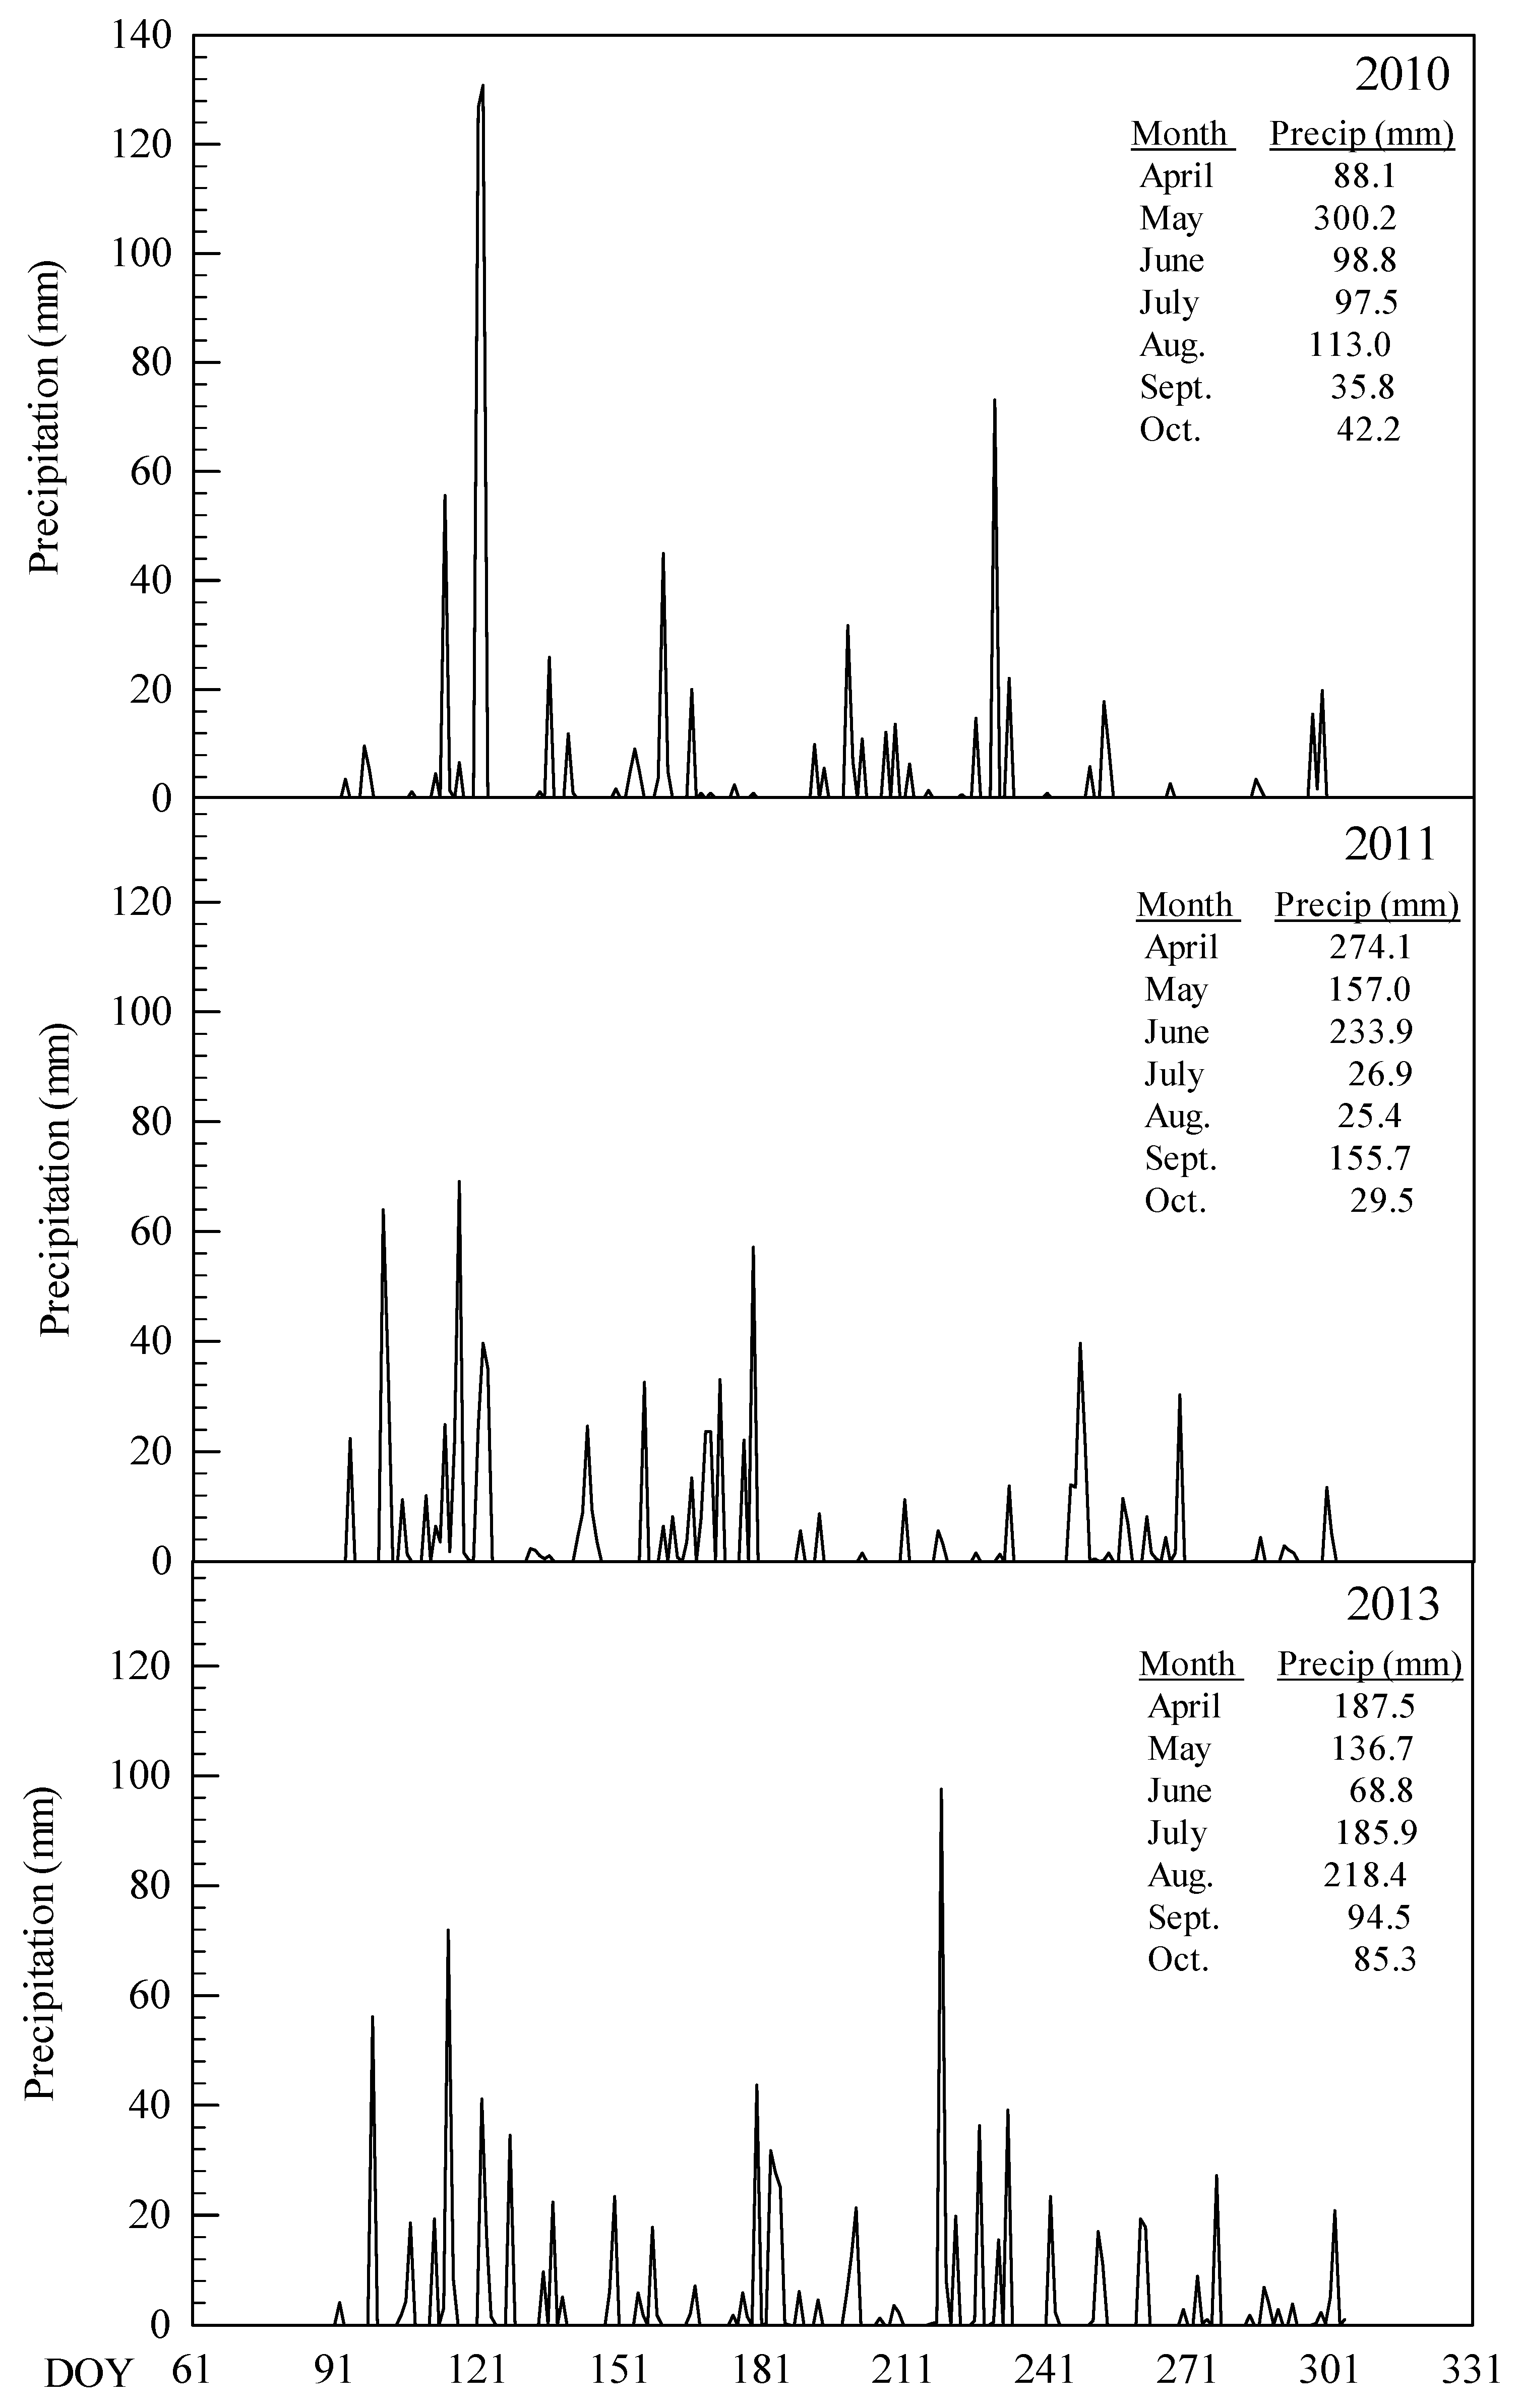
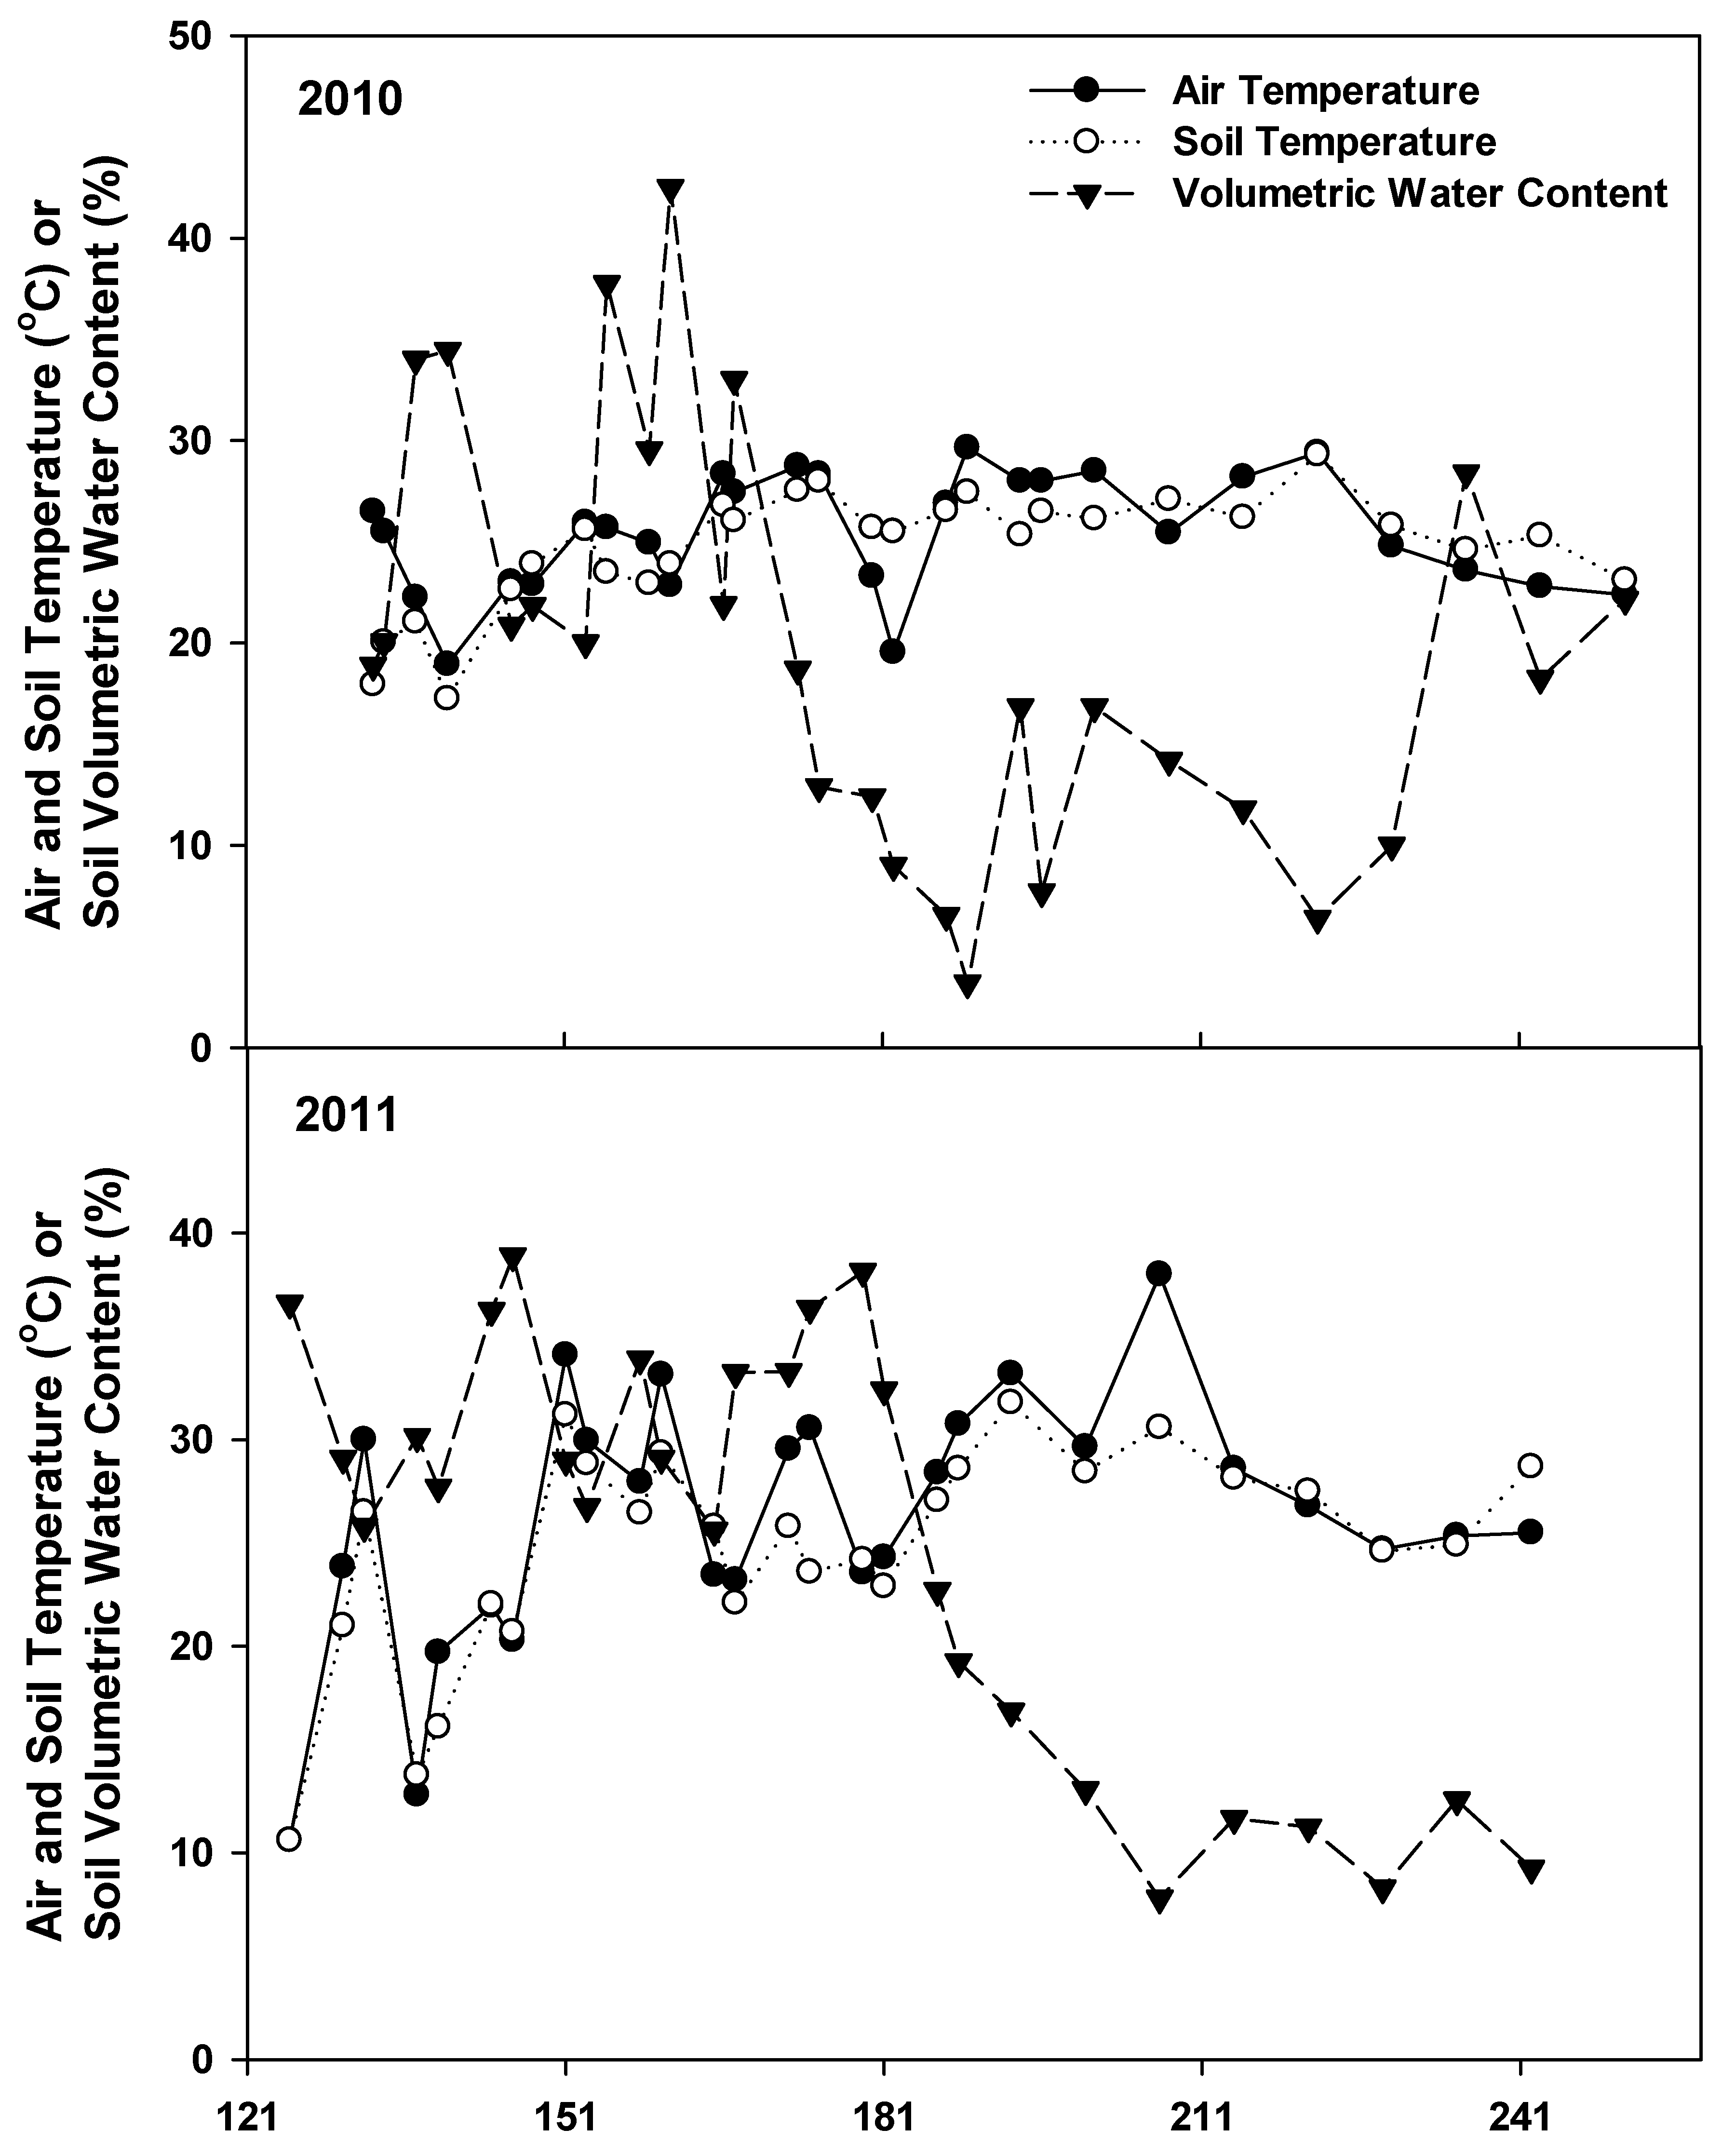
3.1. Environmental Condition

The 3-year experiment was established in 2010 with a corn planting date of 20 May. In 2012, the experiment was completely lost due to severe drought particularly during the critical growing season months of June, July, and August; hence, we continued the study for 1 more year in 2013. The total precipitation for the three critical months of June, July, and August were 309 mm, 286 mm, and 473 mm for 2010, 2011, and 2013, respectively (Figure 1). However, the distribution of the rainfall among the critical growing season months was better in 2013 followed by 2011 and 2010.

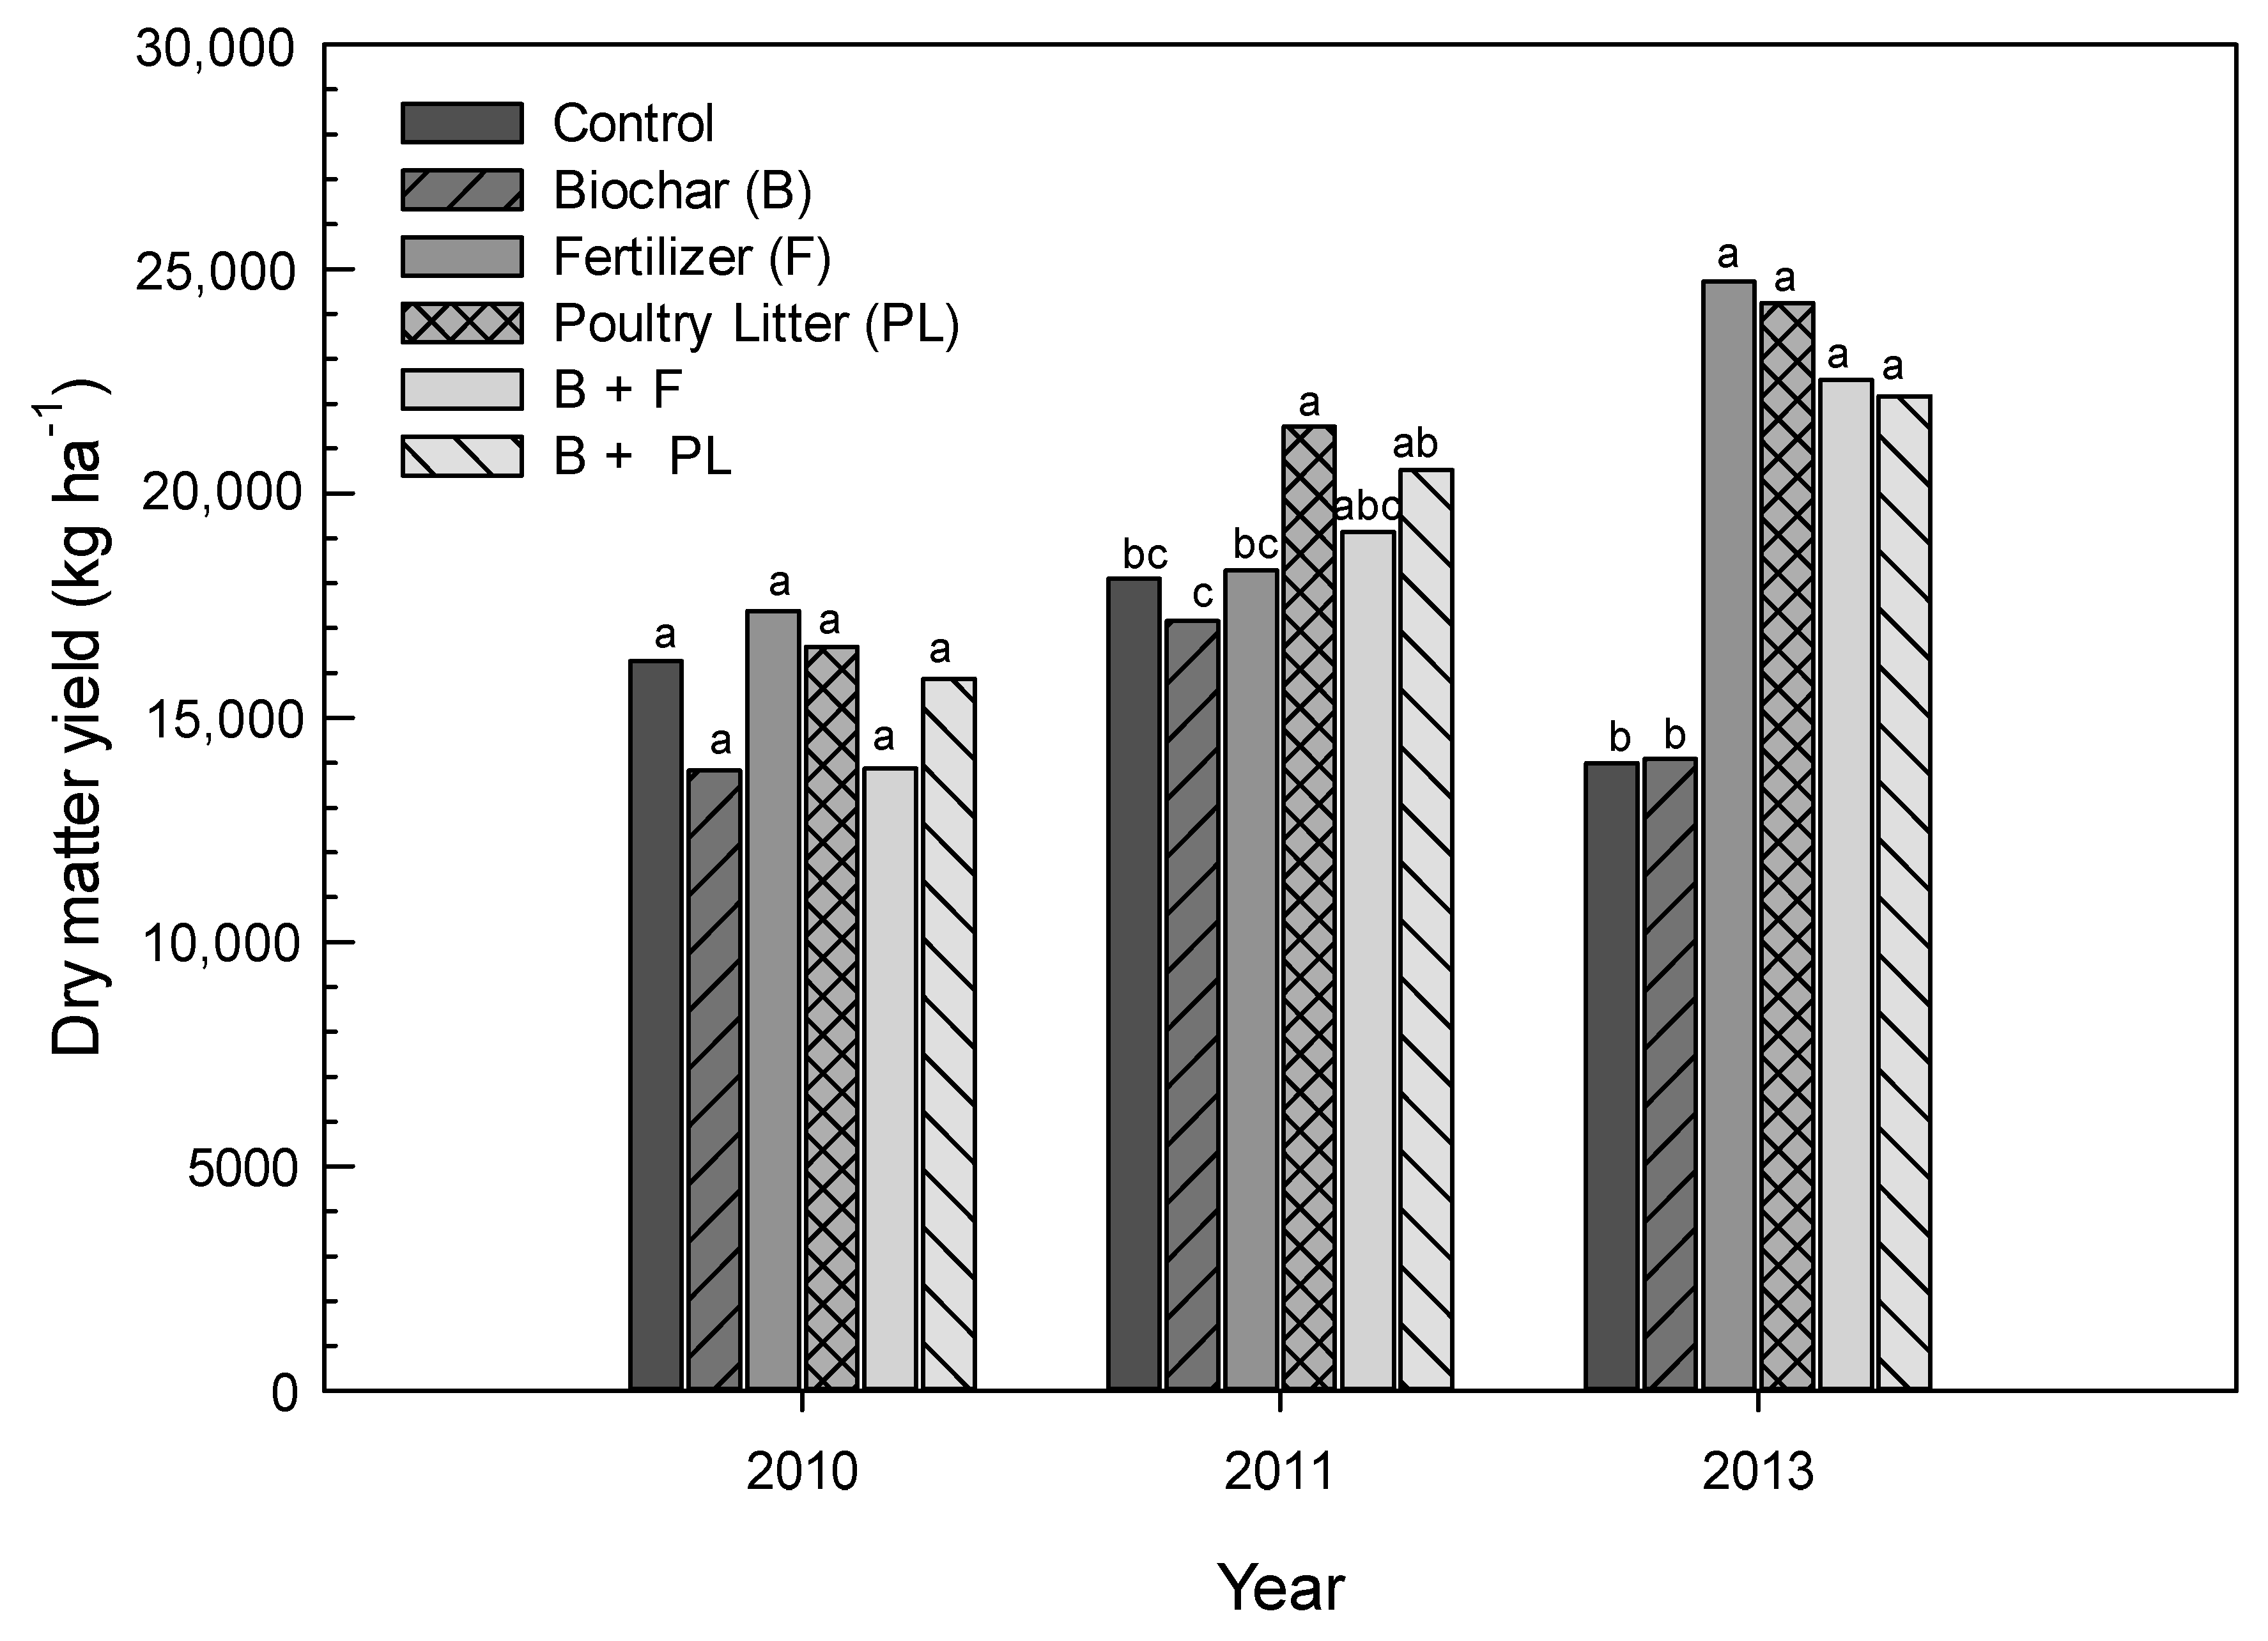
3.2. Corn Dry Matter Yield

Since the interaction between year and all the agronomic measurements (dry matter yield, grain yield, and nutrient uptake) were significant, the results are reported on a yearly basis. No significant corn dry matter yield differences occurred among treatments in 2010 (dry year). In 2011, PL treatment produced the greatest dry matter yield and was significantly different than control, biochar, and fertilizer (N-P-K) treatments. The combination of PL and biochar resulted in significantly higher dry matter yield compared to biochar alone in the 2011 growing season (Table 2, Figure 2). In 2013, fertilizer, PL, and their combinations with biochar treatments produced significantly greater dry matter yields than control and biochar alone treatments. Similar to 2011, the addition of nutrients by way of fertilizer or PL enhanced the impact of biochar on corn dry matter production particularly under more favorable soil moisture conditions. We believe the level of impact of these treatments on corn dry matter yield was mostly related to the precipitation and soil moisture availability in each year. Results suggest that biochar alone did not contain the quantity and specific forms of required plant nutrients for optimum corn growth in this study. However, above ground dry matter yield increased when biochar was supplemented with nutrients from poultry litter and fertilizer under optimum soil moisture content compared to biochar alone treatment (Table 2, Figure 2). This is indicative of the synergistic effect of biochar when applied with fertilizer sources. Such a synergistic effect has been reported in various studies such as for the increased production of maize by Yamato et al. [29] through combined biochar and fertilizer; Yamato et al. reported a 4–12 times higher yield of rice and sorghum when combined with fertilizer and compost [14,30] and reported increases in corn yield through increased P availability and uptake when biochar combined with arbuscular mycorrhiza (AM) fungal spores [31,32].

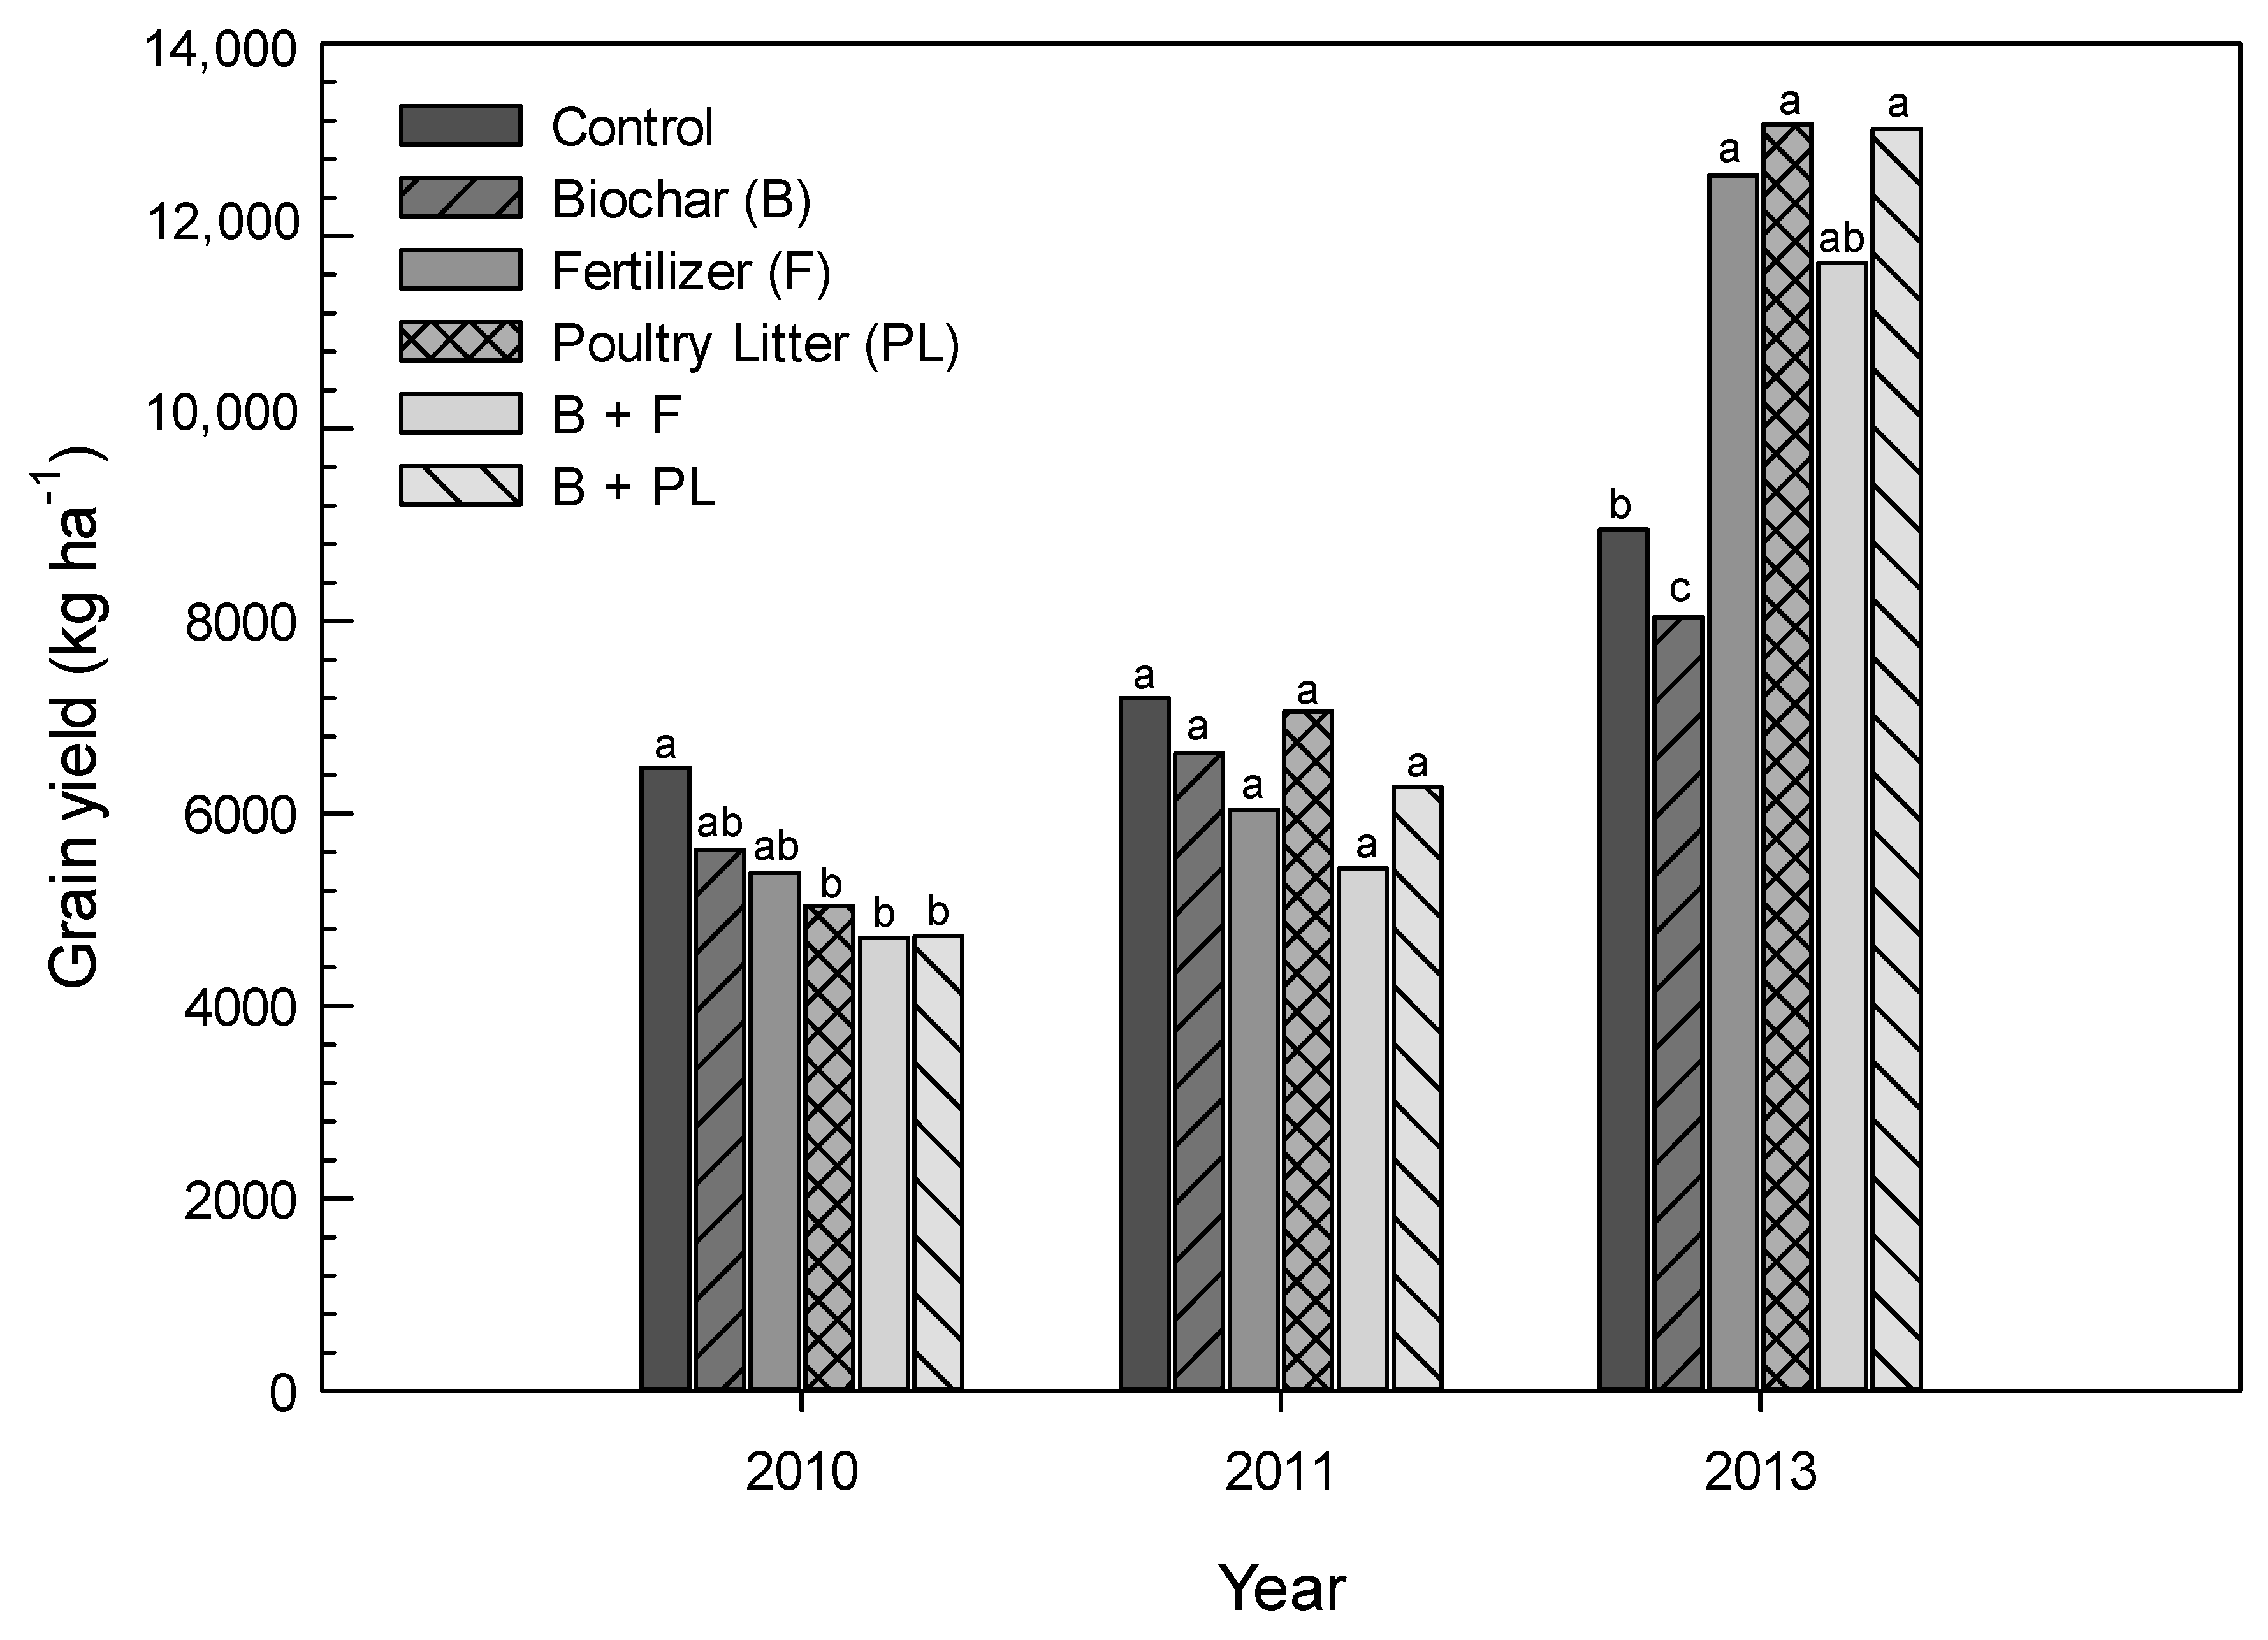
3.3. Corn Grain Yield

Significant differences in corn grain yield occurred among treatments in 2010 and 2013 growing seasons with 2013 producing the greatest, followed by 2011 and 2010 (Table 2, Figure 3). All treatments produced a similar grain yield in 2011 while biochar alone and control treatments had the lowest grain yield in 2013. When applied alone, biochar treatment did not increase corn grain yield in the three growing seasons compared to other treatments; however, the results indicate that over time, biochar positively impacted grain yield (Table 2), with a significant increase each consecutive year compared to the first year, which seems to indicate that biochar has potential to positively impact yield in the long term. This result is indicative of the carrying over effect of biochar also reported in a study by Adejumo et al. [33]. We also believe that the low soil pH may have influenced nutrient availability and uptake by corn. We also speculate that the low soil pH may have created a situation for Al toxicity for corn. Besides, organic matter is known to release nutrients slowly over time with only a small fraction of nutrients available the first year of application [34,35]. Biochar is also known to have a long-term effect on nutrient availability which is due to its potential to increase cation exchange capacity [6], consequently leading to increased yield over time. The control treatment was the same or higher than other treatments under limited moisture availability in 2010 and 2011. It seems to indicate that the addition of more nutrients through fertilizer and PL application exerted more stress and had a slightly negative impact on corn plants under drought conditions of 2010 and 2011 growing seasons (Table 2, Figure 3).

3.4. Corn biomass N, P, and K Concentration and Uptake

The whole plant biomass N, P, and K concentrations were measured yearly at plant maturity followed by total N, P, and K uptake determination for each treatment. Since year by treatment interactions were mostly significant for N, P, and K biomass concentration and N, P, and K uptake, the results are shown separately by year in Table 3 and Table 4. The biomass N concentration was significantly different among treatments in each year (Table 3). In more favorable soil moisture conditions (2011 and 2013), biochar treatment (alone) had lower biomass N concentration than other treatments except for control treatment; however, in 2010, a dry year, biochar alone had higher N concentration than when biochar alone was applied in the other years. In all three growing seasons, the biomass N content increased significantly when biochar was combined with nutrients by way of fertilizer or poultry litter compared to the biochar (alone) application (Table 3). The 2013 biomass N concentration was lower for all treatments compared to 2011 and 2010, probably due to greater biomass yield because of optimum soil moisture condition and better N use efficiency in 2013. The biomass P and K concentrations were significantly different among treatments except for PL and B + PL treatments, which had numerically higher P and K concentrations (Table 3). Table 4 shows N, P, and K uptake by corn for each growing season. No significant differences regarding N uptake among treatments were noted in the 2010 growing season. However, all treatments had significantly greater N uptake than biochar alone and control treatments in 2011 and 2013 growing seasons. In general, no specific trend regarding P and K uptake occurred in any of the growing seasons except for the B+PL treatment which had significantly greater P and K uptake than biochar alone treatment, indicating the low level of available nutrients of the biochar (Table 4). We speculate that precipitation and soil moisture availability may have had a big impact on corn nutrient uptake. Biochar in combination with fertilizer or poultry litter treatments positively influenced the N, P, K uptake more than biochar treatment alone, indicating a synergistic effect of the combined treatments [14,29,30]. Corn plants which were grown on poultry litter alone as a source of nutrients utilized N, P, and K more efficiently than other treatments (Table 4). It should be noted that even though the amount of P and K applications for the fertilizer treatment were based on the standard soil test recommendations, the poultry litter treatment provided more P and K because the quantity of poultry litter application was calculated based on the N requirement of the corn.

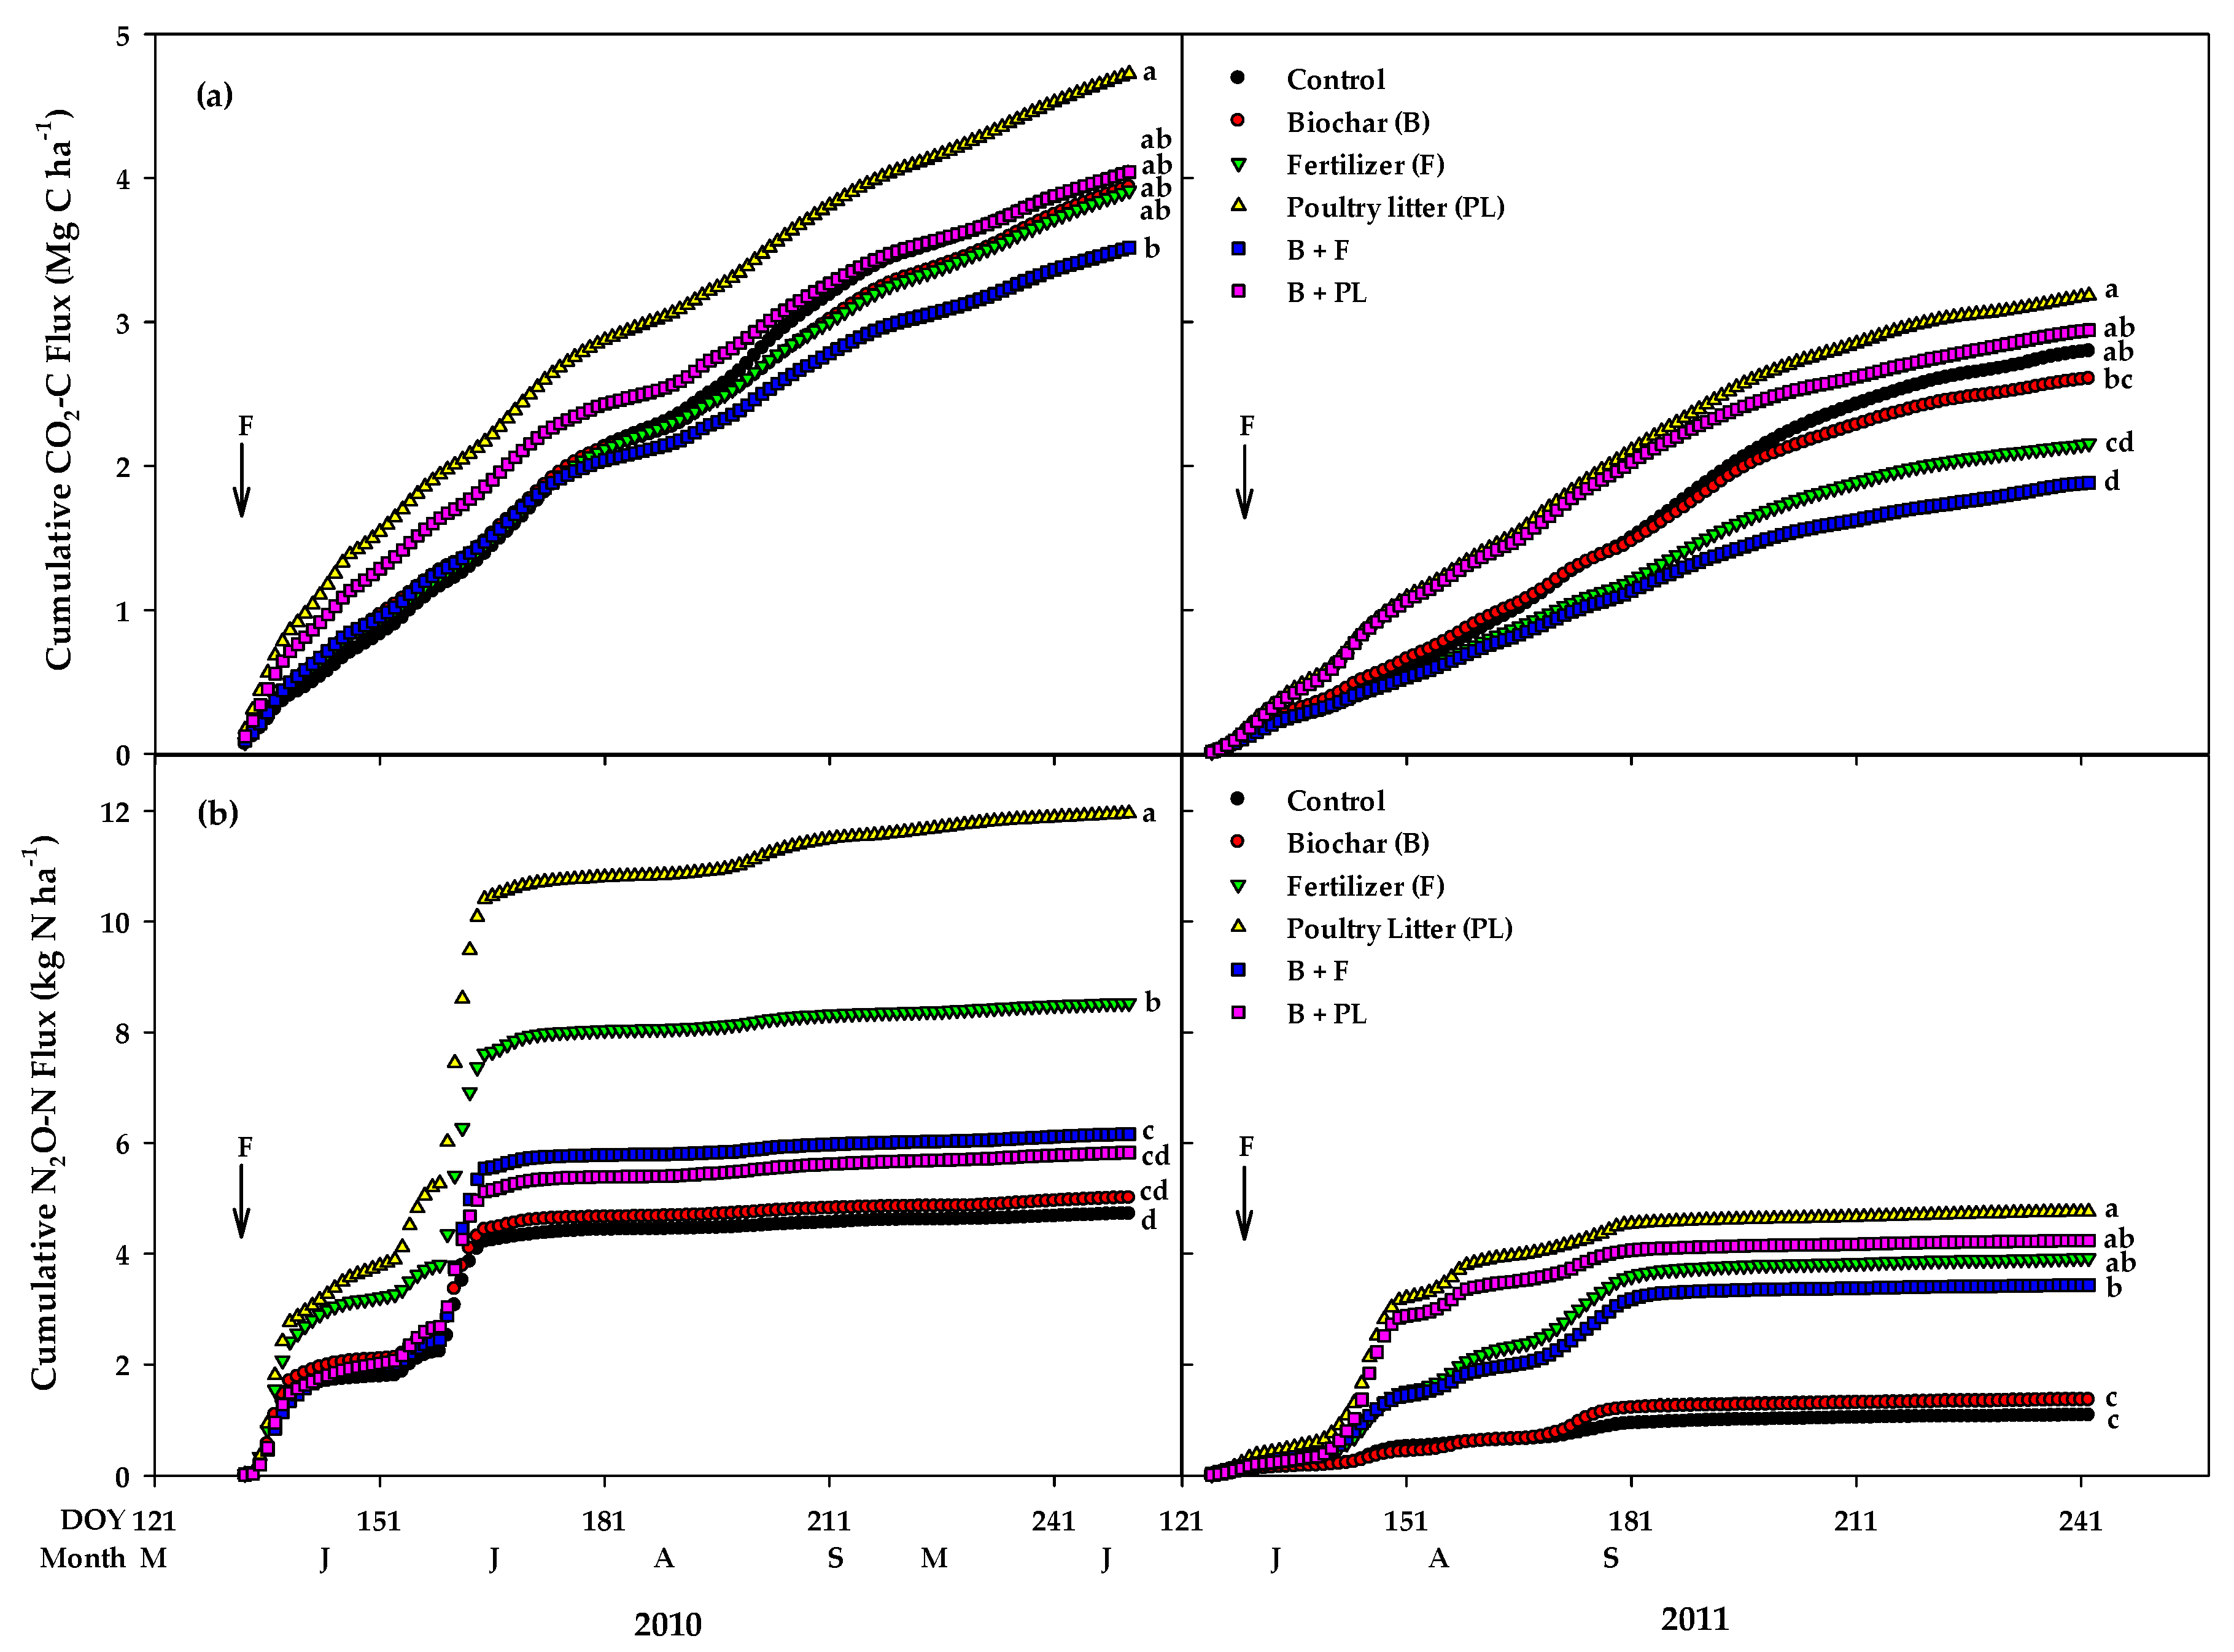
3.5. Quantification of N2O and CO2

The impact of biochar and poultry litter alone and in combined treatments on the loss of N and C by way of greenhouse gas emission (N2O and CO2) were measured during 2010 and 2011 growing seasons (Table 5 and Figure 4). Poultry litter treatment produced significantly greater N2O emission in both years; however, the N2O emission decreased significantly when PL was combined with biochar in 2010. The decrease in N2O emission was most likely due to the conversion of different N forms from PL by microorganism activities which occur with biochar presence. This is due to the ability for biochar to provide a habitat for microorganisms, thus increasing microbial activities. Biochar has been shown to both increase and lower nitrous oxide (N2O) emissions [9] which seem to be related to the type of biochar used and the soil properties. In this study, the latter occurred. The N2O emission from biochar was the same as the control. The N2O fluxes did not increase significantly when biochar was combined with PL or fertilizer, except in 2010 (Table 5). Fertilizer treatment resulted in significantly greater N2O emission than when it was combined with biochar. The N2O emission factors (emission per total N applied for each treatment) and emission based on yield scale followed the same trend as N2O emission for each treatment (Table 5). Similar to N2O, CO2 emission was greatest with PL treatment. In general, biochar slightly lowered the emission of N2O and CO2 when combined with PL or fertilizer in both years (Table 5). Cumulative N2O and CO2 fluxes were lower for the first 2 weeks after application (DOY 135, mid-May) and then increased drastically for the following 2 weeks until mid-June (DOY 165) (Figure 4). Poultry litter treatment produced greater (mostly significant) cumulative N2O and CO2 fluxes than other treatments. The cumulative fluxes were higher in 2010 than in 2011. The higher fluxes may be due to the fresh application of litter, biochar, and fertilizer in 2010 (Figure 4), along with air and soil moisture content differences in each year (Figure 5). We also speculate that the disturbance of the experimental plots from no-till grass covered plots (in order to apply biochar and planting corn) may have caused a temporary aerobic condition and increased microbial activities resulting in influxes of more N2O and CO2 in 2010 compared to 2011 (Figure 4, Table 5).

4. Conclusions

We conducted a field plot study to investigate the impact of biochar and poultry litter alone or in combination on corn biomass, grain yield, nutrient uptake, and greenhouse gas emission (N2O and CO2) for three growing seasons. Results indicate that biochar alone application to soil did not increase corn grain yield or N, P, and K uptake when compared to other treatments. This finding is in line with other research reports [36,37]. However, grain yield increased slightly over time from biochar application. These mixed results of delayed positive responses and even initial negative responses observed from the biochar in this study have also been reported by other research [2]. Soil pH for biochar treatment increased slightly from 4.7 (background) to 4.81 at the end of the study. Similar trends of slight increases in total C (22.4 g kg−1) and total N (1.7 g kg−1) observed for biochar treatments compared to background. However, we observed greater concentrations of P (7.95 mg kg−1) and K (157 mg kg−1) at the end of the study for biochar and biochar plus poultry litter treatments compared to soil background concentrations. Poultry litter application alone produced a significantly greater corn yield than biochar but was similar to chemical fertilizer. The N, P, and K uptake by corn grown on biochar alone applications were significantly lower than PL and fertilizer treatments. Results indicated that the addition of fertilizer or poultry litter to biochar had a positive effect on reducing N2O and CO2 fluxes compared to fertilizer or poultry litter application alone. In general, biochar application did not show a significant improvement in corn production parameters measured when compared to other treatments under the specific soil and environmental conditions of the study site within the three growing seasons. However, positive results were observed, such as a slight increase in grain yield in each year following biochar application and also when biochar was mixed with poultry litter or fertilizers. Therefore, more research is warranted to include different types of biochar and different rates of application under different environmental and management conditions and for longer term periods (long-term studies) to understand the impact of biochar as a soil amendment.

Author Contributions

All the authors (K.R.S., J.R.S., M.J.-B., and J.M.N.) substantially contributed to the Conceptualization, Investigation, Methodology, Data Analyses, and Preparation of this manuscript.

Funding

This work was funded by the United State, Department of Agriculture (USDA-ARS).

Conflicts of Interest

The authors declare no conflict of interest.

References

  1. Lehmann, J. Bio-Energy in the black. Front. Ecol. Environ. 2007, 5, 381–387. [Google Scholar] [CrossRef]
  2. Spokas, K.A.; Cantrell, K.B.; Novak, J.M.; Archer, D.A.; Ippolito, J.A.; Collins, H.P.; Boateng, A.A.; Lima, I.M.; Lamb, M.C.; McAloon, A.J.; et al. Biochar: A synthesis of its agronomic impact beyond carbon sequestration. J. Environ. Qual. 2012, 41, 973–989. [Google Scholar] [CrossRef]
  3. Lehmann, J.; Abiven, S.; Kleber, M.; Pan, G.; Singh, B.P.; Sohi, S.P.; Zimmerman, A.R. Persistence of biochar in soil. In Biochar for Environmental Management: Science, Technology and Implementation, 2nd ed.; Lehmann, J.L., Joseph, S., Eds.; Earthscan: London, UK, 2015; pp. 235–282. [Google Scholar]
  4. Fowles, M. Black carbon sequestration as an alternative to bioenergy. Biomass Bioenergy 2007, 31, 426–432. [Google Scholar] [CrossRef]
  5. Glaser, B.; Lehmann, J.; Zech, W. Ameliorating physical and chemical properties of highly weathered soils in the tropics with charcoal-a review. Biol. Fertil. Soils 2002, 35, 219–230. [Google Scholar] [CrossRef]
  6. Liang, B.; Lehmann, J.; Solomon, D.; Kinyangi, J.; Grossman, J.; O’Neill, B.; Skjemstad, J.O.; Theis, J.; Luizao, R.J.; Peterson, J.; et al. Black carbon increases cation exchange capacity in soils. Soil Sci. Soc. Am. J. 2006, 70, 1719–1730. [Google Scholar] [CrossRef]
  7. Chan, K.Y.; Van Zwieten, L.; Meszaros, I.; Downie, A.; Joseph, S. Agronomic values of green-waste biochar as soil amendment. Aust. J. Soil Res. 2007, 45, 629–634. [Google Scholar] [CrossRef]
  8. Biederman, L.A.; Harpole, W.S. Biochar and its effects on plant productivity and nutrient cycling: A meta-analysis. GCB Bioenergy 2013, 5, 202–214. [Google Scholar] [CrossRef]
  9. Clough, T.J.; Condron, L.M. Biochar and the nitrogen cycle: Introduction. J. Environ. Qual. 2010, 39, 1218–1223. [Google Scholar] [CrossRef] [PubMed]
  10. Atkinson, C.J.; Fitzgerald, J.D.; Hipps, N.A. Potential mechanisms for achieving agricultural benefits from biochar application to temperate soils: a review. Plant Soil 2010, 337, 1–18. [Google Scholar] [CrossRef]
  11. Lehmann, J.; Rilling, M.; Thies, J.; Masiello, C.A.; Hockaday, W.C.; Crowley, D. Biochar effects on soil biota: A review. Soil Biol. Biochem. 2011, 43, 1812–1836. [Google Scholar] [CrossRef]
  12. Novak, J.M.; Spokas, K.A.; Cantrell, K.B.; Ro, K.S.; Watts, D.W.; Glaz, B.; Busscher, W.J.; Hunt, P.G. Effects of biochar and hydrochars produced from lignocellulosic and animal manure on fertility of a Mollisol and Entisol. Soil Use Manag. 2014, 30, 175–181. [Google Scholar] [CrossRef]
  13. Spokas, K.A.; Reicosky, D. Impacts of sixteen different biochars on soil greenhouse gas production. Ann. Environ. Sci. 2009, 3, 179–193. [Google Scholar]
  14. Van Zwieten, L.; Kimber, S.; Morris, S.; Chan, K.Y.; Downie, A.; Rust, J.; Joesph, S.; Cowie, A. Effects of biochar from slow pyrolysis of papermill waste on agronomic performance and soil fertility. Plant Soil 2010, 327, 235–246. [Google Scholar] [CrossRef]
  15. Novak, J.M.; Lima, I.M.; Xing, B.; Gaskin, J.W.; Steiner, C.; Das, K.C.; Ahmedna, M.; Rehrah, D.; Watts, D.W.; Busscher, W.J.; et al. Characterization of designer biochar produced at different temperatures and their effects on a loamy sand. Soil Sci. 2009, 3, 195–206. [Google Scholar]
  16. Novak, J.M.; Ro, K.; Ok, Y.S.; Sigua, G.; Spokas, K.; Uchimiya, S.; Bolan, N. Biochars multifunctional role as a novel technology in the agricultural, environmental, and industrial sectors. Chemosphere 2016, 142, 1–3. [Google Scholar] [CrossRef] [PubMed]
  17. Jeffery, S.; Verheijen, F.G.; Van der Velde, M.; Bastos, A.C. A quantitative review of the effects of biochar application to soils on crop productivity using meta-analysis. Agric. Ecosyst. Environ. 2011, 144, 175–187. [Google Scholar] [CrossRef]
  18. Crane-Droesch, A.; Abiven, S.; Jeffery, S.; Torn, M.S. Heterogeneous global crop yield response to biochar: A meta-regression analysis. Environ. Res. Lett. 2013, 8, 1–8. [Google Scholar] [CrossRef]
  19. Ronsee, F.; Van Hecke, S.; Dickinson, D.; Prins, W. Production and characterization of slow pyrolysis biochar: Influence of feedstock type and pyrolysis conditions. GCB Bioenergy 2013, 5, 104–115. [Google Scholar] [CrossRef]
  20. Hass, A.; Gonzalez, J.M.; Lima, I.M.; Godwin, H.W.; Halvorson, J.J.; Boyer, D.G. Chicken manure biochar as liming and nutrient source for acid Appalachian soil. J. Environ. Qual. 2012, 41, 1096–1106. [Google Scholar] [CrossRef]
  21. Wang, L.; Butterly, C.R.; Wang, Y.; Herath, H.M.; Xi, Y.G.; Xiao, X.J. Effect of crop residue biochar on soil acidity amelioration in strongly acidic tea garden soils. Soil Use Manag. 2014, 40, 119–128. [Google Scholar] [CrossRef]
  22. Keeney, D.R.; Nelson, D.W. Nitrogen-inorganic forms. In Methods of Soil Analysis, Part 2, 2nd ed.; Page, A.L., Miller, R.H., Keeney, D.R., Eds.; ASA and SSSA: Madison, WI, USA, 1982; pp. 643–698. [Google Scholar]
  23. Mehlich, A. Mehlich 3 soil extractant: A modification of Mehlich-2 extractant. Commun. Soil Sci. Plant Anal. 1984, 15, 1409–1416. [Google Scholar] [CrossRef]
  24. Novak, J.M.; Busscher, W.J.; Laird, D.L.; Ahmedna, M.; Watts, D.W.; Niandou, M.A. Impact of biochar on fertility of a southeastern Coastal Plain soil. Soil Sci. 2009, 74, 105–112. [Google Scholar] [CrossRef]
  25. Miller, R.O. High-temperature oxidation: Dry ashing. In Referenced Methods for Plant Analysis; Kalra, V.P., Ed.; Handbook of. CRC Press: Boca Raton, FL, USA, 1998; pp. 53–56. [Google Scholar]
  26. Livingston, G.P.; Hutchinson, G.L. Enclosure-based measurement of trace gas exchange: Applications and sources of error. In Biogenic Trace Gases: Measuring Emissions from Soil and Water; Matson, P.A., Harriss, R.C., Eds.; Blackwell Sci. Ltd.: London, UK, 1995. [Google Scholar]
  27. Mosier, A.R.; Halvorson, A.D.; Reule, C.A.; Liu, X.J. Net global warming potential and greenhouse gas intensity in irrigated cropping systems in northeastern Colorado. J. Environ. Qual. 2006, 35, 1584–1598. [Google Scholar] [CrossRef] [PubMed]
  28. Hutchinson, G.L.; Mosier, A.R. Improved soil cover method for field measurements of nitrous oxide fluxes. Soil Sci. Soc. Am. J. 1981, 45, 311–316. [Google Scholar] [CrossRef]
  29. Yamato, M.; Okimori, Y.; Wibowo, I.F.; Anshori, S.; Ogawa, M. Effects of the application of charred bark of Acaciamangium on the yield of maize, cowpea and peanut and soil chemical properties in south Sumatra, Indonesia. Soil Sci. Plant Nut. 2006, 52, 489–495. [Google Scholar] [CrossRef]
  30. Steiner, C.; Teixeira, W.G.; Lehmann, J.; Nehls, T.; Macedo, J.; Blum, W.H.; Zech, W. Long term effect of manure, charcoal and mineral fertilization on crop production and fertility on a highly weathered Central Amazonian upland soil. Plant Soil 2007, 291, 275–290. [Google Scholar] [CrossRef]
  31. Mau, A.E.; Utami, S.R. Effects of biochar amendment and arbuscular mycorrhizal fungi inoculation on availability of soil phosphorus and growth of maize. J. Degr. Min. Lands Manag. 2014, 1, 69–74. [Google Scholar]
  32. Ahmad, M.A.; Asghar, H.N.; Saleem, M.; Khan, M.Y.; Zahir, Z.A. Synergistic effect of rhizobia and biochar on growth and physiology of maize. Agron. J. 2015, 107, 2327–2334. [Google Scholar] [CrossRef]
  33. Adejumo, S.A.; Owolabi, M.O.; Odesola, I.F. Agro-physiologic effects of compost and biochar produced at different temperatures on growth, photosynthetic pigment and micronutrients uptake of maize crop. Afr. J. Agric. Res. 2015, 11, 661–673. [Google Scholar] [CrossRef]
  34. Eghball, B.; Wienhold, B.J.; Gilley, J.E.; Eigenberg, R.A. Mineralization of manure nutrients. J. Soil Water Conserv. 2002, 57, 470–478. [Google Scholar]
  35. Motavalli, P.P.; Kelling, K.A.; Converse, J.C. First-year nutrient availability from injected dairy manure. J. Environ. Qual. 1998, 18, 180–185. [Google Scholar] [CrossRef]
  36. Lentz, R.D.; Ippolito, J.A.; Spokas, K.A. Biochar and Manure Effects on Net Nitrogen Mineralization and Greenhouse Gas Emissions from Calcareous Soil under Corn. Soil Sci. Soc. Am. J. 2014, 78, 1641–1655. [Google Scholar] [CrossRef]
  37. Laird, D.A.; Novak, J.M.; Collins, H.P.; Ippolito, J.A.; Karlen, D.L.; Lentz, R.D.; Sistani, K.R.; Spokas, K.; van Pelt, R.S. Multi-year and multi-location soil quality and crop biomass yield responses to hardwood fast pyrolysis biochar. Geoderma 2017, 289, 46–53. [Google Scholar] [CrossRef] [Green Version]
Figure 1. Daily precipitation during the growing seasons of 2010, 2011 and 2013. DOY, day of year.
Environments 06 00055 g001
Figure 2. Effect of biochar, poultry litter, chemical fertilizer, and the combined treatments tested on corn dry matter yield in 2010, 2011, and 2013 growing seasons. Within each year, values followed by the same letters are not significantly different according to Fisher’s LSD (0.05) level.
Environments 06 00055 g002
Figure 3. Effect of biochar, poultry litter, chemical fertilizer, and the combined treatments tested on corn dry matter yield in 2010, 2011, and 2013 growing seasons. Within each year, values followed by the same letters are not significantly different according to Fisher’s LSD (0.05) level.
Environments 06 00055 g003
Figure 4. (a) Cumulative CO2-C and (b) N2O-N emissions for each treatment during the 2010 and 2011 growing seasons as a function of day of year (DOY). Cumulative values within each year for same effect followed by the same letters are not significantly different according to Fisher’s LSD (0.05) level. B, biochar; F, fertilizer; PL, poultry litter.
Environments 06 00055 g004
Figure 5. Air and soil temperature and soil moisture content measured during the first 2 years (2010 and 2011) of the study.
Environments 06 00055 g005
Table 1. Characteristics of hardwood biochar (oven dry basis, SD = standard deviation).
PropertyMeanSD
%H2O4.60.61
%ash14.1613.21
%Fixed C468.49
%Volatile C5426
%C68.296.86
%H2.670.65
%N0.250.09
%O*13.383.86
O/C0.160.02
H/C0.510.04
%Ca0.490.06
%K0.650.05
%P0.03na
pH (H2O)5.590.61
SSA (m2/g) 1.29na
Total acidity (cmol/100g)120na
where SAA = specific surface area, and na = not available.
Table 2. Whole plant dry matter and grain yield influenced by different treatment and growing season year.
Whole Plant Dry Matter YieldGrain Yield
Treatment (T)201020112013201020112013
kg ha−1
Control16,262a 18,100bc13,995b6480a7201a8952bc
Biochar (B)13,828a17,168c14,090b5619ab6629a8042c
Fertilizer (F)17,379a18,291bc24,721a5382ab6036a12,632a
Poultry Litter (PL)16,581a21,495a24,245a5037b7062a13,163a
B + F13,875a19,145abc22,526a4706b5430a11,723ab
B + PL15,874a20,524ab22,170a4721b6281a13,114a
LSD(0.05)445429206276123218253557
Values within columns followed by the same letters are not significantly different according to Fisher’s LSD (0.05) level.
Table 3. Whole plants nutrients (N, P, and K) concentrations influenced by different treatments and growing season year.
Whole Plant N, P, and K Concentration
NPK
Treatment (T)201020112013201020112013201020112013
g kg−1
Control11.1c 7.9d6.8b1.3c1.0d1.3c8.9b13.8b8.2b
Biochar (B)12.9b8.5d7.3b1.5bc1.2cd1.4c10.6b14.1b8.7b
Fertilizer (F)13.2ab12.5ab9.6a1.5bc1.4bc1.6b9.7b15.5ab8.6b
Poultry Litter (PL)13.9ab11.6bc9.9a2.0a1.8ab2.0a11.8ab18.5a12.7a
B + F14.0a13.3a9.2a1.7b1.5b1.6b11.4ab17.6a8.7b
B + PL14.2a10.7c9.7a2.1a1.9a2.0a13.8a18.9a13.3a
LSD(0.05)1.091.350.990.260.350.212.993.403.29
Values within columns followed by the same letters are not significantly different according to Fisher’s LSD (0.05) level.
Table 4. Whole plants nutrients (N, P, and K) uptake influenced by different treatment and growing season year.
Whole Plant N, P, and K Uptake
NPK
Treatment (T)201020112013201020112013201020112013
kg ha−1
Control182a 144b95b21.0b16.5d17.6b150b250c116c
Biochar (B)178a146b103b20.6b20.2cd19.1b145b243c123c
Fertilizer (F)230a228a239a26.5ab25.8bc40.1a170ab283bc212b
Poultry Litter (PL)231a249a240a33.9a37.8a48.5a195ab398a306a
B + F194a254a207a23.0b29.5b36.0a159ab337ab195b
B + PL225a220a215a32.5a39.0a44.8a217a390a287a
LSD(0.05)62.637.568.09.406.8614.0866.775.053.9
Values within columns followed by the same letters are not significantly different according to Fisher’s LSD (0.05) level.
Table 5. Cumulative growing-season CO2-C and N2O-N emissions, N2O-N emission factor, and yield-scaled N2O emissions for each treatment in 2010 and 2011.
TreatmentCO2-C EmissionsN2O-N EmissionsN2O-N Emission Factor Yield Scaled N2O-N Emissions
20102011201020112010201120102011
Mg ha−1kg ha−1%kg N2O-N Mg grain yield−1
Control4.04ab 2.80ab4.72d1.09c--0.73e0.15c
Biochar (B)3.94ab2.61bc5.01cd1.36c--0.91de0.21c
Fertilizer (F)3.92ab2.16cd8.53b3.92ab1.70a1.26a1.82b0.63b
Poultry litter (PL)4.73a3.19a11.95a4.76a1.61a0.82a2.54a0.88a
B + F3.52b1.89d6.16c3.43b0.64b1.05a1.22c0.51b
B + PL4.04ab2.94ab5.83cd4.24ab0.25b0.70a1.09cd0.71ab
Values for each year (column) followed by the same letters are not significantly different according to Fisher’s LSD (0.05) level. Calculated based on the TN application rate for each treatment.

