Article

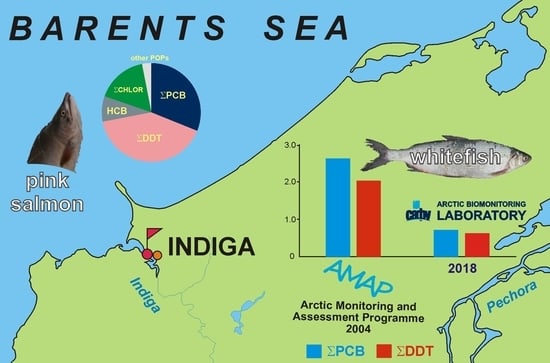
Persistent Organic Pollutants (POPs) in Fish Consumed by the Indigenous Peoples from Nenets Autonomous Okrug

1
Arctic Biomonitoring Laboratory, Northern (Arctic) Federal University Named After M. V. Lomonosov, Naberezhnaya Severnoy Dvini 17, 163002 Arkhangelsk, Russia
2
Northwest Public Health Research Centre, 2-Sovetskaya, 191036 St. Petersburg, Russia
3
Institute of Ecology, National Research University Higher School of Economics, 20 Myasnitskaya Ulitsa, 101000 Moscow, Russia
4
National Institute of Occupational Health, P.O. Box 5330 Majorstua, N-0304 Oslo, Norway
5
Department of Environmental Sciences and Natural Resource Management, Norwegian University of Life Sciences, N-1432 Ås, Norway
*
Author to whom correspondence should be addressed.
Submission received: 26 November 2019 / Revised: 13 December 2019 / Accepted: 30 December 2019 / Published: 31 December 2019

Abstract

:
Currently, monitoring of persistent organic pollutant (POP) content in various biological and environmental matrixes in the Arctic is an urgent task. The present study focused on the determination of POPs such as: PCB#28, PCB#52, PCB#101, PCB#105, PCB#118, PCB#123, PCB#153, PCB#128, p,p’-DDE, o,p’-DDE, p,p’-DDD, o,p’-DDD, hexachlorobenzene (HCB), cis-nonachlor, trans-nonachlor, cis-chlordane, trans-chlordane, mirex, 1,2,3,5-tetrachlorobenzene and 1,2,4,5-tetrachlorobenzene in fish consumed by the indigenous people of the Nenets Autonomous Okrug (NAO) of the Russian Arctic. Fish samples were analyzed by gas chromatography triple quadrupole mass spectrometry (GC-MS/MS) using the multiple reaction monitoring (MRM) technique. The obtained results show that the major POPs in fish were dichlorodiphenyltrichloroethane (DDT) breakdown products and polychlorinated biphenyls (PCB) congeners. The ∑PCB8 in pink salmon, Arctic char, navaga, humpback whitefish and northern pike were 1.54, 1.58, 1.24, 0.72 and 0.32 ng/g (ww), respectively. The main PCB congeners maximum average medium concentrations were 0.68 ng/g (ww) and 0.51 ng/g (ww) of PCB#153 in navaga and PCB#128 in pink salmon, respectively. The main DDT breakdown product was p,p’-DDE. In Arctic char, pink salmon, navaga, humpback whitefish and northern pike, the concentration of p,p’-DDE was 0.58, 1.61, 0.49, 0.63 and 0.08 ng/g (ww), respectively. A moderate positive relationship between ∑PCB8 and lipid content and a high positive relationship between ∑DDT and lipid content were observed. In fish samples with fat content <0.5% (northern pike, humpback whitefish), the amount of analyzed POPs was 2 or more times lower than that in fish species with fat content >1% (pink salmon, Arctic char). Despite the large number of fish in the diet of indigenous peoples from NAO, no significant risks were identified. Most legacy POP and organochlorine pesticides (OCPs) tend to decrease, which can be explained by past national and regional bans and restriction on their use and emission.

Graphical Abstract

1. Introduction

The Arctic region is considered to be one of the few unspoiled ecosystems; however, it is also subjected to the negative impact of persistent organic and inorganic pollutants (POPs and PIPs) through transboundary transfers, and to a lesser extent, via ocean currents and rivers [1,2]. Due to physicochemical properties, POPs and mercury (Hg) typically bioaccumulate and biomagnify in organisms, especially in fat tissues in aqueous food webs in the Arctic.
These environmental chemical pollutants have been shown to cause negative effects on human health [3,4,5], such as diseases of liver and cardiovascular systems, damage to organs and tissues and endocrine disorders with consequences for the reproductive system [6]. They cause teratogenic effects (birth defects), neurodevelopmental disorders and subclinical brain dysfunction. During early fetal development, exposure to Hg, PCBs and pesticides can cause brain damage at doses much lower than those affecting adult brain function [7,8].
To date, there is lack of knowledge about POPs and PIPs related risks in Russia and in the Russian Arctic in particular, which is highlighted in many international reports prepared as part of the Global Monitoring Plan and AMAP initiative [9].
Indigenous populations in the Russian Arctic are at greater risk of potentially adverse health outcomes [10,11]. Approximately 30–35% of the indigenous diet is fish such as pink salmon, Arctic char, navaga, humpback whitefish and northern pike. Fish can accumulate high amounts of POPs and Hg, and this is one of the sources of their entry in human organism [12,13]. These data differ from the average for Russia, where it is 26% [14]. POPs stay longer in the Arctic environment due to the low annual temperatures. It increases the possibility of getting them into local hydrobionts used in food [15,16,17]. The exposure to persistent toxic substances through traditional food is one of the main risk factors for human health in the Arctic [8]. The concentrations of some key Legacy POPs listed in the Stockholm Convention have declined in marine biota in other Arctic regions during the past two decades. Conversely, the concentrations of polychlorinated biphenyls (PCBs) and chlordanes have remained relatively constant and at high amounts in wildlife [18].
The quality of locally collected freshwater and marine seafood in the indigenous peoples’ diet is not controlled by the Russian state, as these products do not enter the market. Migratory fish species consumed are also not subject to the state environmental monitoring [9]. The Stockholm Convention has pledged member states to encourage and implement at both national and international levels for appropriate research, monitoring and cooperation [19]. The Russian state monitoring system has not yet been able to adapt rapidly to international obligations. As a result, there is a concern for the health of fish, wildlife and humans who consume local food [10,20]. Recently, a long-term study was initiated to monitor changes in the amounts of POPs and PIPs in the diet of pan-Russian Arctic indigenous populations by establishing an Arctic biomonitoring laboratory in the Northern (Arctic) Federal University since 2017 [21]. This part of the study presents the concentrations of priority POPs in five fish species: pink salmon, Arctic char, navaga, northern pike and humpback whitefish, which are among the most commonly consumed species by indigenous peoples of coastal villages of Nenets Autonomous Okrug (NAO).

2. Materials and Methods

2.1. Sampling Strategy

Indiga is one of the largest settlements of the Nenets Autonomous Okrug, Russia, located on the Barents Sea coast [22]. The fish species were selected on the basis of a nutritional survey among the population of the village. According to the questionnaire, which was published earlier [23], the fish consumed by indigenous peoples in the area mainly belong to the families Salmonidae (62%) and Gadidae (15%). Salmon fish (pink salmon, Arctic char and humpback whitefish) and a representative cod (navaga) were bought from local fishermen in 2017–2018. Northern pike from the Pechora River (Barents Sea basin) was chosen as a freshwater predator species. The number of fish collected ranged from 8 to 12 samples depending on the fish species. Transportation, storage, age determination and preparation of samples for analysis was performed in our previous work [22].

2.2. Reagents and Materials

The choice of congeners is justified by their presence in the Stockholm Convention on Persistent Organic Pollutants. High purity single analytical standards of the following polychlorinated biphenyl (PCB) congeners: #28, 52, 101, 105, 118, 123, 128, 153, 180, 183, p,p’-DDE, o,p’-DDE, p,p’-DDD, o,p’-DDD, hexachlorobenzene, cis-nonachlor, trans-nonachlor, cis-chlordane, trans-chlordane, mirex, 1,2,3,5-tetrachlorobenzene, 1,2,4,5-tetrachlorobenzene, β-heptachloroepoxide, aldrin and heptachlor were chosen.
HPLC-grade acetone, hexane, Florisil (60–100 mesh) and all high-purity analyte standards were obtained from Sigma-Aldrich (Steinheim, Germany). Labeled 13C12 PCB#101 used was from Cambridge Isotope Laboratories (USA). Sulfuric acid (98% purity) was purchased from Supelco (Bellefonte, PA, USA). Helium (99.9999% purity) and nitrogen (99.9999% purity) were from NIIKM (Moscow, Russia).

2.3. Determination of POP

Determination of POPs was performed using an Agilent 7890A gas chromatography (GC) system equipped with an Agilent 7000 series MS/MS triple quadrupole system (USA).
Data acquisition and processing were done using the Agilent MassHunter QQQ Quantitative Analysis B.05.00 software. An Agilent ultra inert GC column (HP-5MS UI, 30 m × 0.25 mm × 0.25 μm) connected to a Restek Guard column (Rtx-5M) was used throughout for analytes separation.
The portions of the extracts (1 µL) were injected using a multimode injector inlet in splitless mode through an ultra inlet liner with a glass wool frit (Agilent 5190-2293). The injector temperature was 250 °C. Helium was used as the carrier and quenching gas, and nitrogen was used as the collision gas. The oven temperature program was as follows: 70 °C for 3 min, up to 150 °C at a rate of 50 °C min−1, up to 200 °C at a rate of 3 °C min−1 maintained for 1 min, up to 280 °C at a rate of 20 °C min−1 maintained for 5 min and finally, up to 310 °C at a rate of 40 °C min−1 maintained for 4 min.
The total run time was 38 min with 4 additional minutes for backflushing at 280 °C; the pressure was maintained at 70 psi. Constant pressure (18 psi) mode was used. The purge flow to the split vent was 30 mL min−1 at 0.75 min. The system was operating in electron-ionization (EI) mode (70 eV). The transfer line temperature was kept at 270 °C. The ion source and quadrupole analyzer temperatures were fixed at 230 °C and 150 °C, respectively. The collision gas flow was 1.5 mL min−1 and the quenching gas flow was 2.35 mL min−1.

2.4. Optimization of Gas Chromatography and Mass Spectrometry Parameters

For optimization of the MS parameters, all analytes were monitored in full scan mode in the 50–800 m/z range to select the precursor and product ions. The collision energy (CE) was optimized for each transition in a multiple reaction monitoring (MRM) experiment. The most intense transitions were was selected as the quantifier transitions, and the second most intense transitions were selected as the qualifier transitions. A 14 time segment method was created to obtain an adequate sensitivity and signal to noise (S/N) ratio. The solvent delay was 9 min.

2.5. Sample Preparation and Clean Up

A 1-gram portion of freeze-dried fish muscle was extracted using 20 mL of a hexane-acetone mixture (1:1 v/v) in a 250 mL conical flask. The flasks were then shaken for 8 h in an IKA KS 260 basic automatic laboratory shaker (IKA-Werke GmbH & Co. KG., Staufen, Germany).
After extraction, the flasks content were transferred to 50 mL polypropylene tubes (PP) (Sarstedt AG & Co. KG, Nümbrecht, Germany) and centrifuged at room temperature for 5 min at 4000 rpm. The resulting supernatants were quantitatively transferred to 200 mL evaporation cups. The tubes were rinsed with a 20 mL portion of hexane and centrifuged again at room temperature for 5 min at 4000 rpm. This procedure was repeated twice.
The contents of the cups were evaporated at 36 °C to a volume of 0.5–1.0 mL in a stream of nitrogen. The residues after evaporation were transferred to 15 mL polypropylene centrifuge tubes. The evaporation cups were rinsed twice with 7 mL of hexane, and the hexane portions were combined with the residues followed by addition of 1 mL of concentrated sulfuric acid. The tubes were shaken and centrifuged at room temperature for 3 min at 4000 rpm.
After centrifugation, the supernatants were purified on glass columns (10 mm Ø). These columns were filled with Florisil and silica gel. The filled columns were rinsed by gravity with 20 mL of hexane. The wash fraction was discarded.
The persistent organic pollutant residues were washed off, passing through a column of 20 mL of a 6% solution of diethyl ether in hexane. The resulting eluate was evaporated at a temperature of 36 °C in a stream of nitrogen until dry. The dry residue was dissolved in 100 µL of acetone and transferred with a pipette dispenser to a 200 µL micro vial for GC analysis (Agilent, Santa Clara, CA, USA). A measure of 1 µL of internal standard (1 mg/L) was then added.

2.6. Quality Control and Validation

Daily preparation of blank samples and calibration were used. Calibration curves consist of 6 points at 0, 5, 10, 20, 50 and 100 ng/g. Linear regression coefficient values (R2) ≥ 0.99. The lowest calibration levels for the majority of analytes were 2–6 ng/g. The validation procedure involved analysis of the fish samples in which one portion was a matrix blank and the other was 20 ppb spiked, yielding 5 replicates; the relative standard deviation (RSD) ≤ 20% and the coefficient of variability (CV) ≤ 33%. The spiking procedure for recovery studies was used; to determine the quality of the methodology, a recovery study was performed using standard addition methods. A prior analysis of the samples was performed to detect the target compound. The limits of quantification (LOQs) were calculated by the three methods described elsewhere [24]. The highest value was selected as the LOQ. Certificated reference material (CRM) and 20 ppb spike samples were used for quality assurance and control procedures. The average recovery was: PCB#28 (107%), 52 (108%), 101 (108%), 105 (122%), 118 + 123 (115%), 128 (124%), 138 (116%), 153 (117%), 180 (127%), 183 (109%), HCB (79%), p,p’-DDE (144%), o,p-DDD (130%), p,p’-DDD (101%), o,p-DDE (140%), heptachlor (98%), cis-nonachlor (100%), trans-nonachlor (101%), cis-chlordane (122%), trans-chlordane (125%), mirex (60%), ∑tetrachlorobenzene (75%), β-heptachloroepoxide (105%) and aldrin (115%). Labeled 13C12 PCB#101 was used as internal standard.

2.7. Lipid Determination

The fat content in the fish muscle was determined by measuring the initial and final mass of the extract. The recommended weight of the sample was ground and extracted into 40 mL of hexane for 40 min in a conical flask. The extract obtained was filtered through a folding filter into a pear-shaped flask, which was previously dried and weighed on an analytical balance. After that, this operation was repeated. The second liquid portion obtained was filtered through the same filter and added to the first portion in the pear-shaped flask. The combined filtrate was evaporated at 67–68 °C, and then the flask was dried in an oven to a constant weight, cooled and weighed on an analytical balance. The weight of the fat sample was defined as the weight of the empty flask minus the weight of the flask with the resulting fat [25].

2.8. Statistical Analysis

For calculations, the software package IBM SPSS Statistics, version 23.0 (IBM Corp., Armunk, New York, NY, USA) was used. The distribution of variables was evaluated visually, and asymmetry was also calculated. The use of parametric analysis (normal data distribution) was not performed, and attempts to normalize the data were futile. To determine the relationships between substances, a correlation analysis was performed using the Spearman criterion (R) (a nonparametric analog of the correlation analysis).
A two-sided p-value < 0.05 was considered statistically significant. Correlation analysis was used to assess differences between several groups at the same time in order to assess which groups were different from each other and how.

3. Results and Discussion
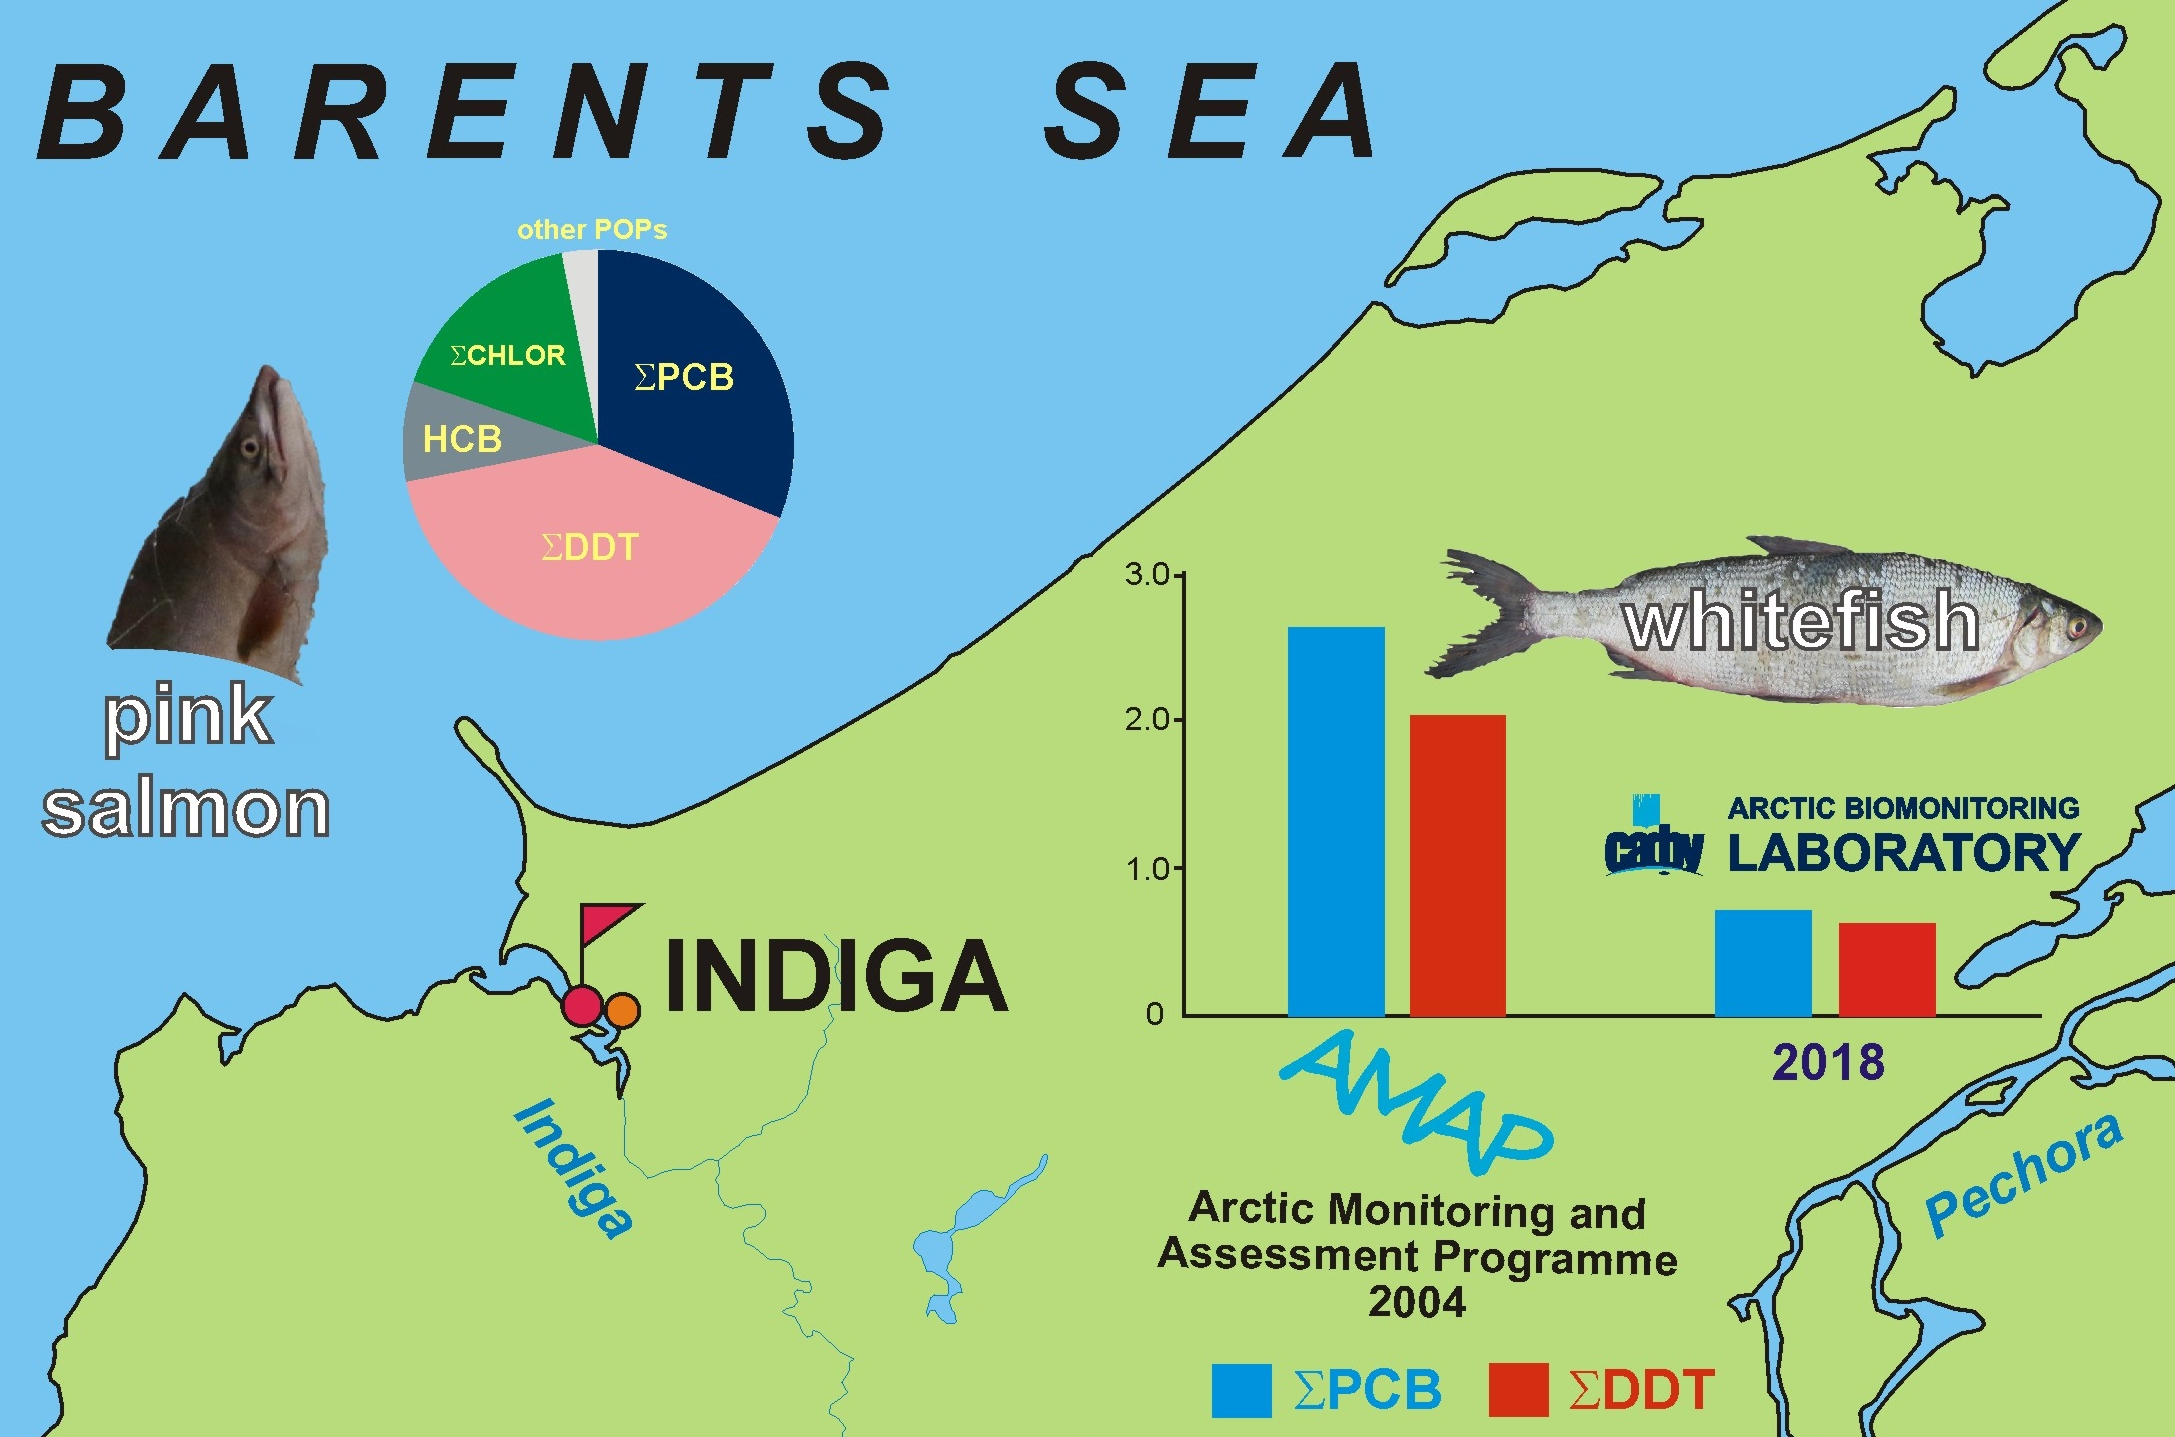
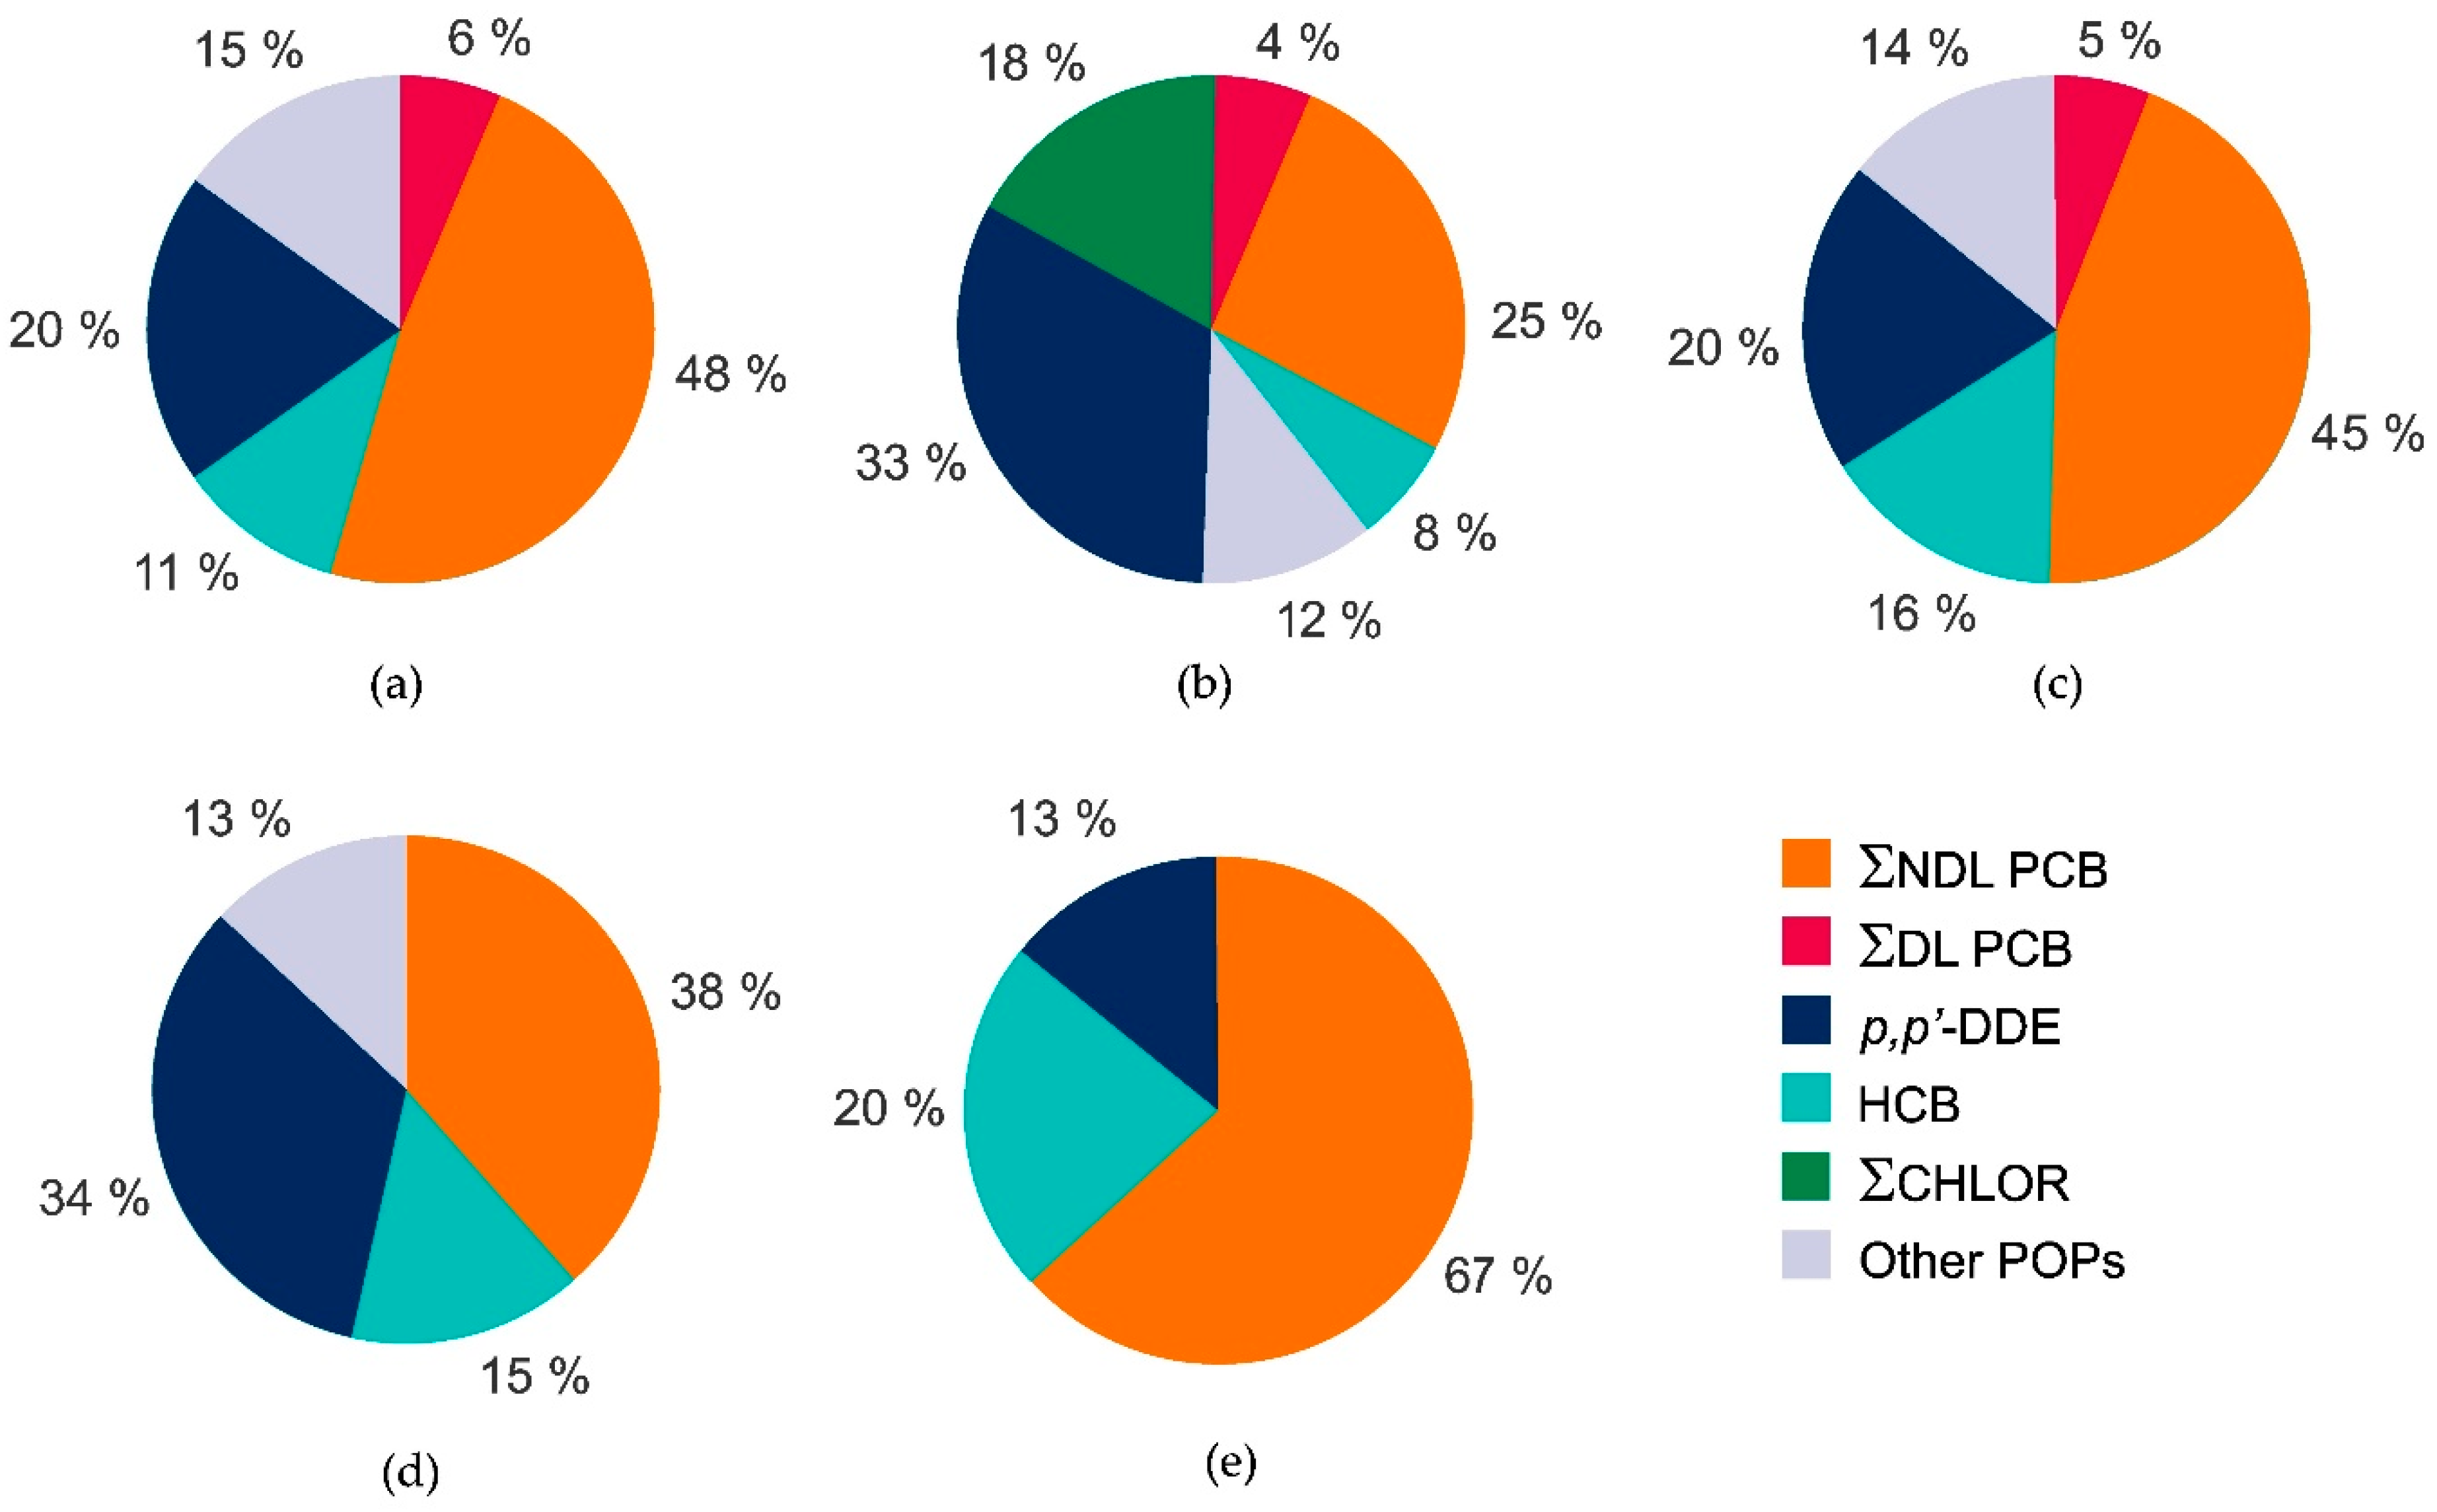
The lipid content of the fish muscle is highest in the marine species pink salmon and Arctic char with arithmetic mean values of 2.93 and 1.35 wet weight %, respectively.
The weight, age and lipid content of five fish species are presented in Table 1.
The following POPs were detected in fish: PCB#28, PCB#52, PCB#101, PCB#105, PCB#118, PCB#123, PCB#153, PCB#128, p,p’-DDE, o,p’-DDE, p,p’-DDD, o,p’-DDD, hexachlorobenzene (HCB), cis-nonachlor, trans-nonachlor, cis-chlordane, trans-chlordane, mirex, 1,2,3,5-tetrachlorobenzene and 1,2,4,5-tetrachlorobenzene. Other compounds such as PCB #180, 183, β-heptachloroepoxide, aldrin, and heptachlor were below LOQ.

3.1. PCB Congeners

The POPs with the highest concentrations in the analyzed fish were PCB congeners and dichlorodiphenyltrichloroethane (DDT) breakdown products. This supports the finding by Bonito et al. [26] that the most common organochlorine pollutants in fish are PCBs.
In our study, Arctic char and pink salmon had the highest ∑PCB8 concentrations of the 5 species studied with mean concentrations of 1.58 and 1.54 ng/g wet weight (ww), respectively. The lowest mean concentrations were present in northern pike muscle (∑PCB8 of 0.32 ng/g (ww)) (Table 2).
PCB#153 was the dominant PCB congener, which was found in all fish species except northern pike, and the highest mean concentration was found in navaga (0.68 ng/g, ww) (Figure 1). When exploring other territories such as Western Europe, Asia and Africa, the presence of PCB#153 as the main congener in fish has also been confirmed [15,16,27,28]. Navaga, which contains little fat in muscles, is a marine cod species, as are freshwater northern pike and humpback whitefish.
As shown in Figure 1, another prevailing PCB congener was PCB#128. The highest mean concentration was present in pink salmon (0.51 ng/g (ww)). In humpback whitefish, this congener was below the detection limit.
Comparing the data in the present study (Table 2) with those reported by Muir et al. (2003) [17], they show that the concentration of ∑PCB congeners in the same or closely related species of fish from NAO was generally lower than in fish caught in the White Sea in the 2000s. Thus, in the present study, the ΣPCB showed that the concentrations of these compounds were 16 times lower in navaga caught downstream of the Indiga River. In addition, the mean concentration of ∑PCB congeners in the northern pike in the present study was approximately 4 times lower than in the pike from the Kola Peninsula, and 7 times lower than in the pike from Chukotka Peninsula. For whitefish, the mean concentration of ∑PCB congeners was 3 to 4 times lower than in AMAP 2004 [29]. The results of the present study show that the ∑PCB concentration in fish has decreased over the past 18 years in the North. This indicates that PCB reduction is a worldwide trend [26].
PCBs can be divided into dioxin-like PCBs (DL-PCBs), whose chemical structure and steric configuration are similar to dioxins, and non-dioxin-like (NDL-PCBs). In the present study, the DL-PCBs were PCB#105, PCB#118 and PCB#123. Despite the fact that the value of ∑PCBs in Arctic char and pink salmon was approximately similar, the ∑DL-PCB in pink salmon (0.25 ng/g (ww)) was higher than that in Arctic char (0.19 ng/g (ww)). In humpback whitefish and northern pike, DL-PCBs were not detected. In navaga, this value was (0.15 ng/g (ww)), but the ratio of ∑DL-PCB to the total PCB content was the same as in Arctic char and amounted to 12%. Additionally, fish with low amounts of NDL-PCBs contain less DL-PCB.

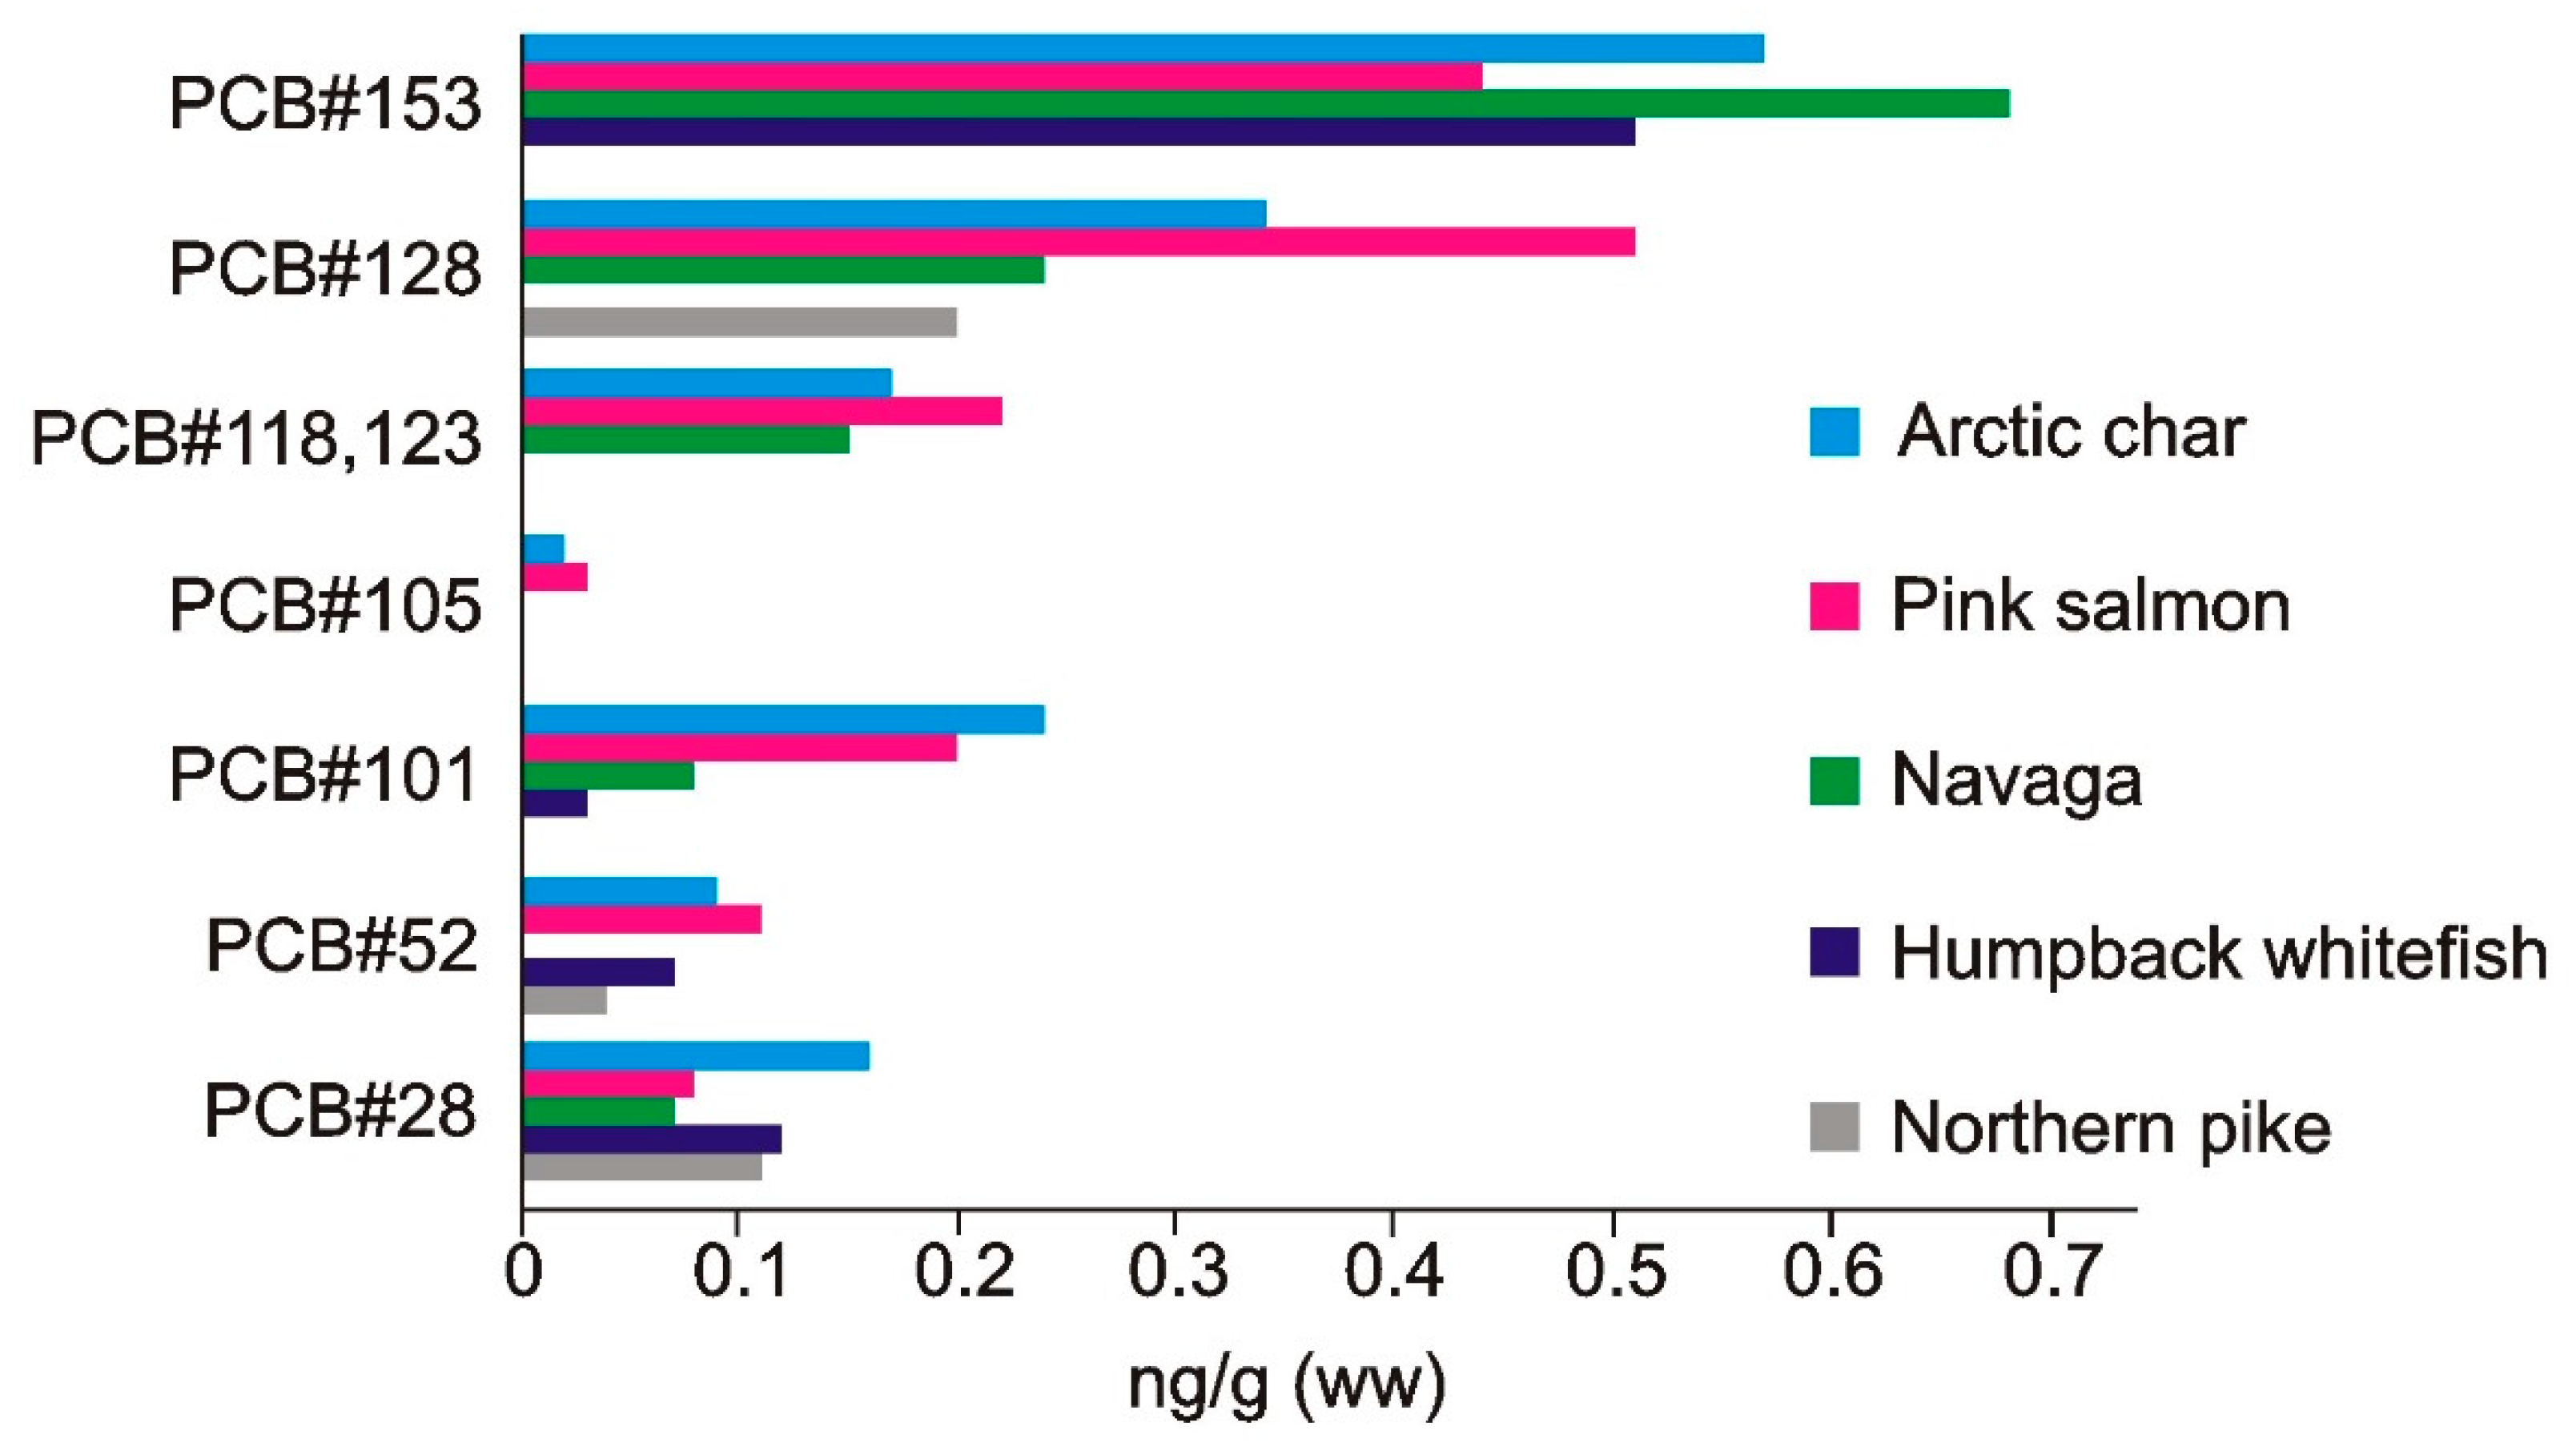
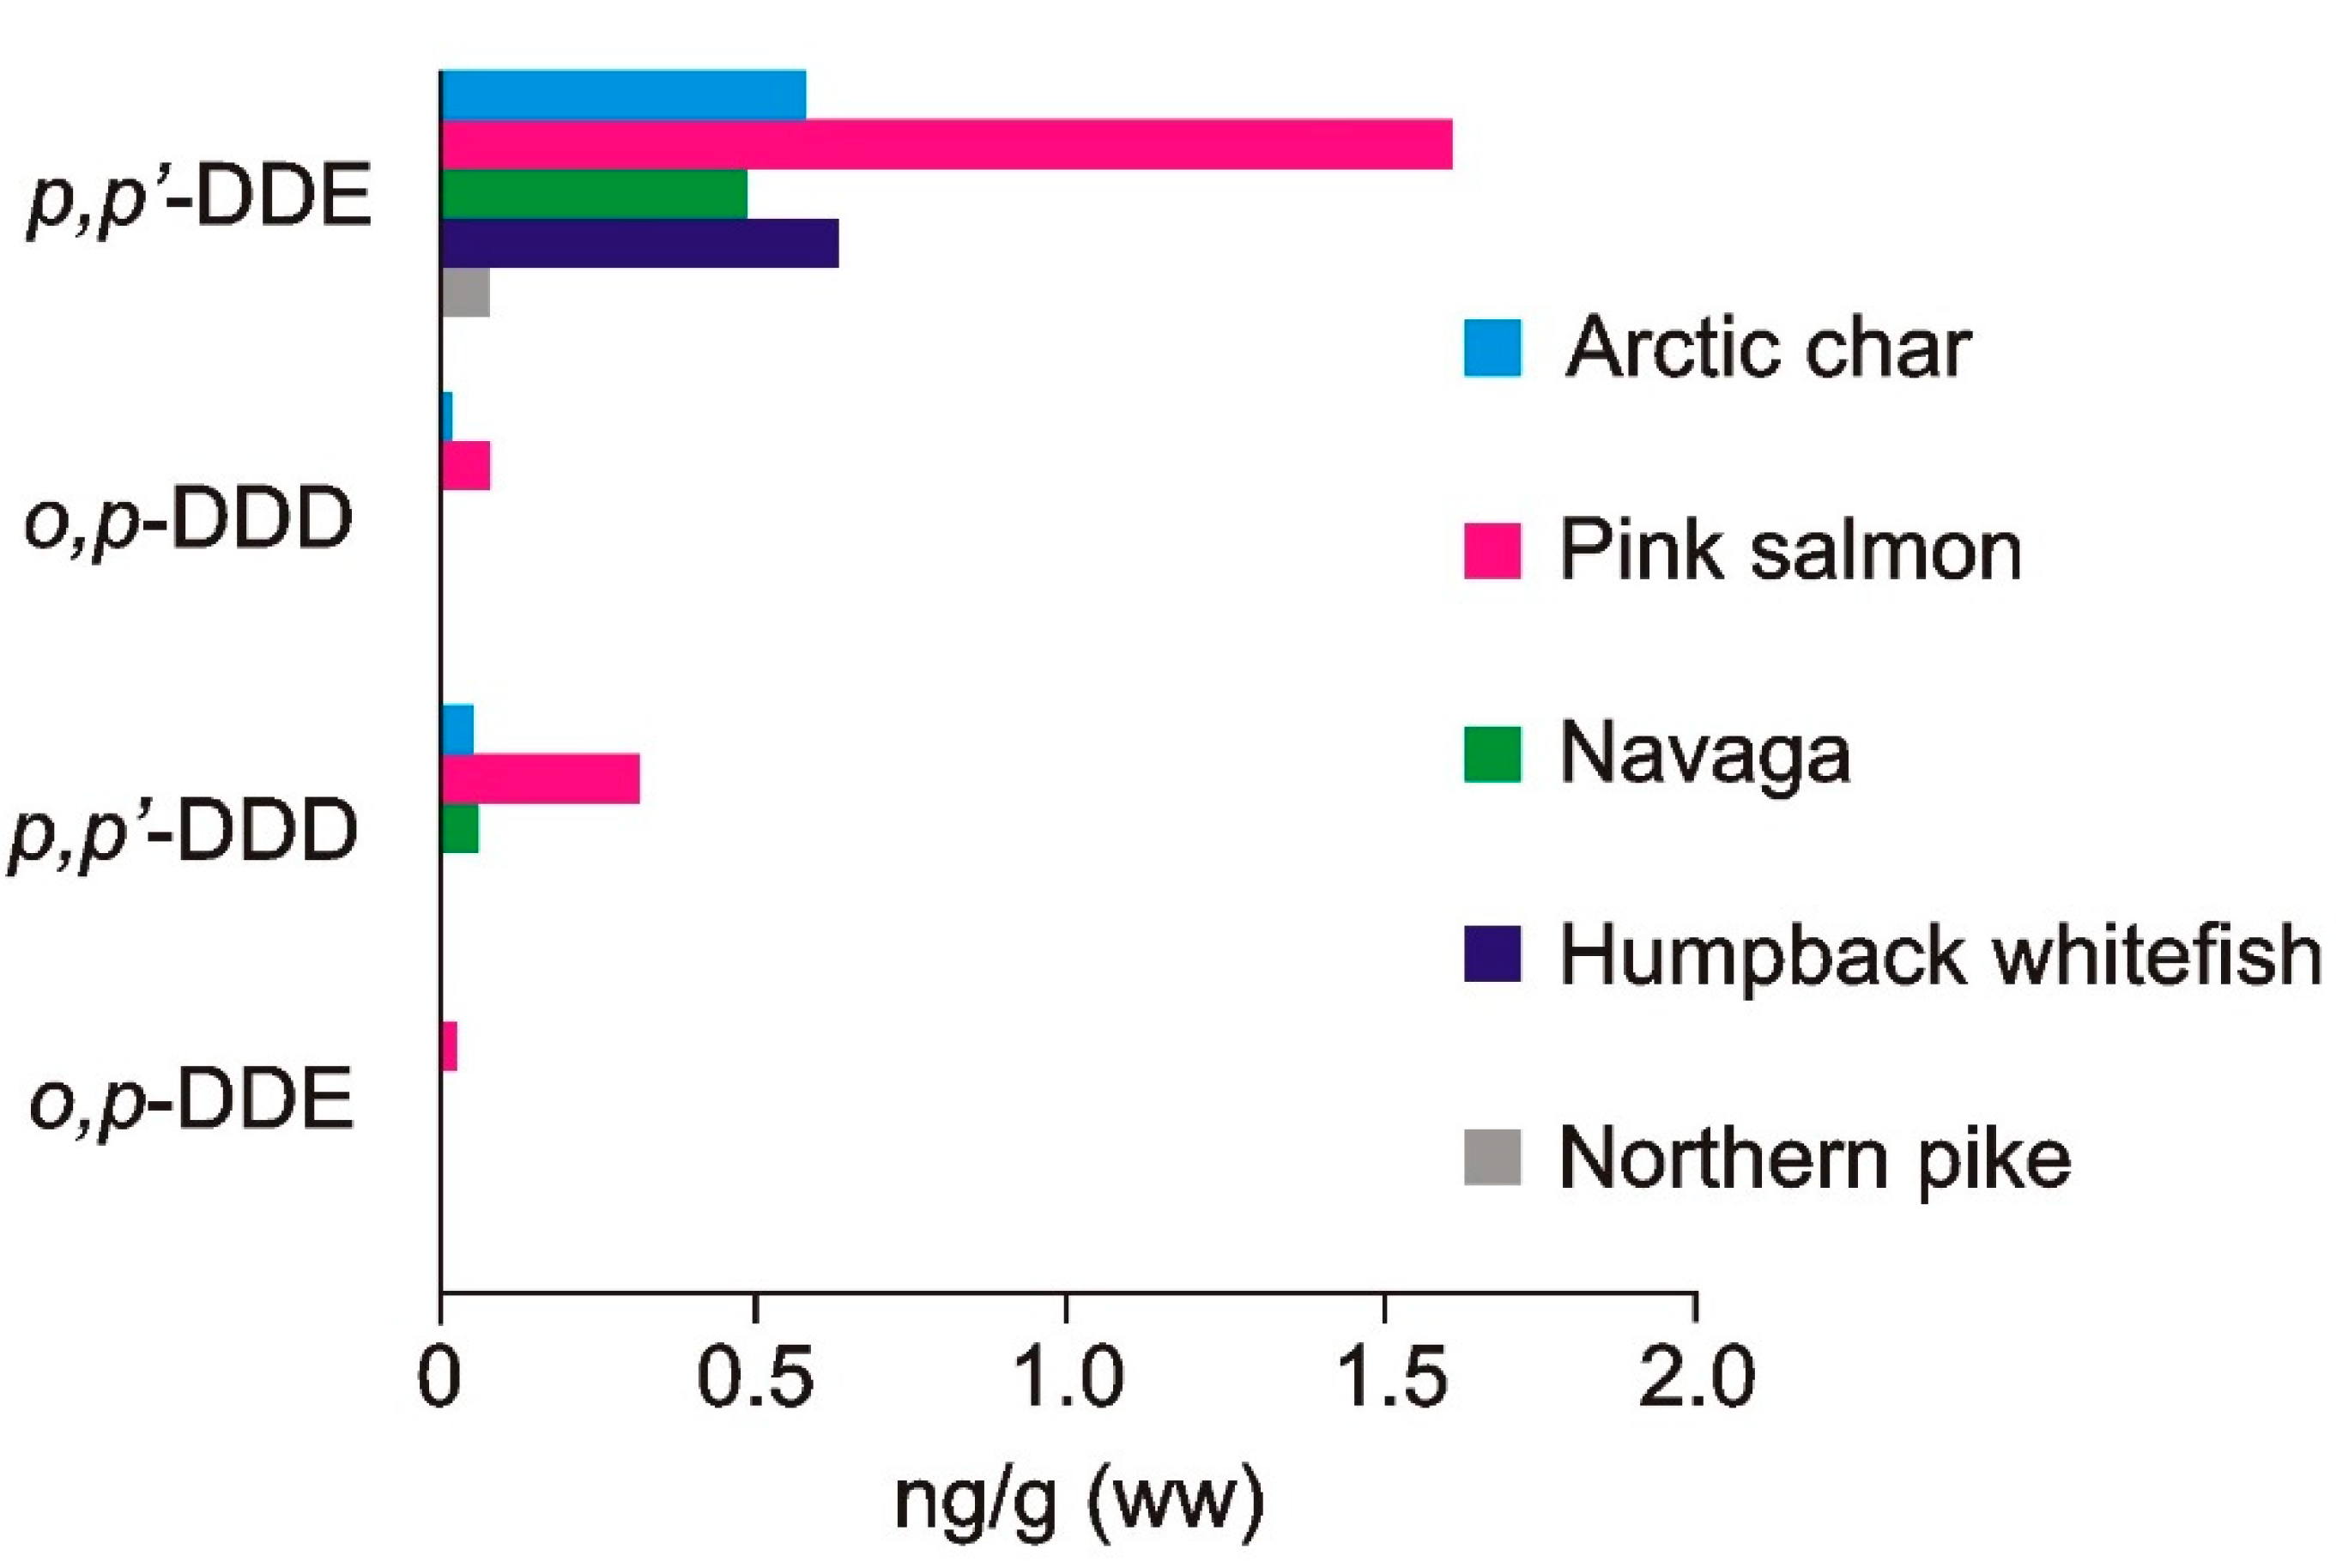
3.2. DDT Breakdown Products

DDT breakdown products were also found in the fish muscles. The ∑DDT means the sum of the following analytes: p,p’-DDE, p,p’-DDD, o,p-DDE and o,p-DDD. Pink salmon had the highest mean concentration ∑DDT (2.04 ng/g (ww)). The lowest mean concentration was present in northern pike (0.08 ng/g (ww)) (Table 2).
In the present study, p,p’-DDE was the main DDT breakdown product residue, and this same result has also been observed in other studies [17,30] (Figure 2).
In Arctic char, pink salmon, navaga, humpback whitefish and northern pike, the concentration of p,p’-DDE was 0.58, 1.61, 0.49, 0.63 and 0.08 ng/g (ww), respectively. DDD was the next major DDT residue contaminant in fish, especially in pink salmon. The ∑DDT concentration in navaga caught in NAO was 28 times lower than that found in navaga caught in the White Sea [17]. ∑DDT congeners in whitefish from NAO were 3 to 4 times lower than in whitefish presented in AMAP 2004 [29]; thus, the concentration in whitefish from the Pechora basin (1.6 ng/g (ww)) compared with present results (0.63 ng/g (ww)). However, the concentration of p,p’-DDE was nearly at the same level of 0.63 ng/g (ww) in our study compared with 0.43 to 1.1 ng/g (ww) in AMAP 2004 [29]. The highest mean concentration was found in pink salmon (1.61 ng/g (ww)), which was slightly higher than the 0.53 ng/g (ww) presented by Tsygankov et al. [30].
In four fish species, the total amount of PCBs was higher than ∑DDT. In Arctic char, the concentration of ∑PCB was 2.4 times higher than that of ∑DDT; in navaga, humpback whitefish and northern pike, it was 2.25, 1.14 and 4.0 times higher, respectively. The exception was pink salmon, where the total amount of PCBs was 0.75 times lower than ∑DDT. In addition, the average age of pink salmon in the present study was 1+ years, and from this we can conclude that the rate of DDT accumulation is greater than that of the accumulation of PCB.

3.3. Other POPs

Along with PCBs and DDTs, other POP were found in fish samples such as HCB, cis-chlordane, trans-chlordane, cis-nonachlor, trans-nonachlor and mirex. HCB was measured in all fish species ranging from 0.13 ng/g (ww) in northern pike to 0.40 ng/g (ww) in pink salmon (Table 2). The concentration of HCB was only 1.6 times lower than in navaga from the White Sea [26]. However, the concentration was slightly higher or approximately at the same level compared with AMAP 2004 [29]. This is likely due to a lower biodegradation rate for HCB than PCBs.
Most of the other analytes in northern pike and humpback whitefish were less than the detection limit. β-Heptachlor epoxide, aldrin and heptachlor were less than the detection limit for all fish species. Muir et al. [17] present data on the content of heptachlor in fish samples (0.05–0.44 ng/g (ww)).
Chlordane-related compounds (cis-chlordane, trans-chlordane) and nonachlor-related compounds (cis-nonachlor, trans-nonachlor) were present at low mean concentrations in all species and were lower than those presented by Muir et al. [17]. The highest sum concentration was observed in pink salmon with 0.84 ng/g (ww), whereas in Arctic char and navaga, it was 0.28 and 0.22 ng/g (ww), respectively, and while in humpback whitefish and northern pike, it was below the limit of detection (LOD).
The amounts of mirex (0.04–0.13 ng/g (ww)) were practically at the same level as AMAP from 2004 [29] (<0.05–0.13 ng/g (ww)), which indicates its resistance to biodegrade. Compared with the landlocked char from lakes in the Canadian High Arctic reported by Ana Cabrerizo et al. (2018) [31], the concentration of POP in the present study was significantly lower. Visually, the contents of the main analytes and POP groups are shown in Figure 3.
Figure 3 shows that the main compounds in fish are p,p’-DDE and ∑NDL-PCB. In all fish species, the predominant POP were NDL-PCB, except pink salmon, where p,p’-DDE was the predominant compound. The group “others” includes nonachlors, chlordanes, mirex and the remaining DDT breakdown products. An exception was pink salmon, where chlordanes and nonachlors were allocated to a separate group because their number occupies a significant percentage of the remaining POP.

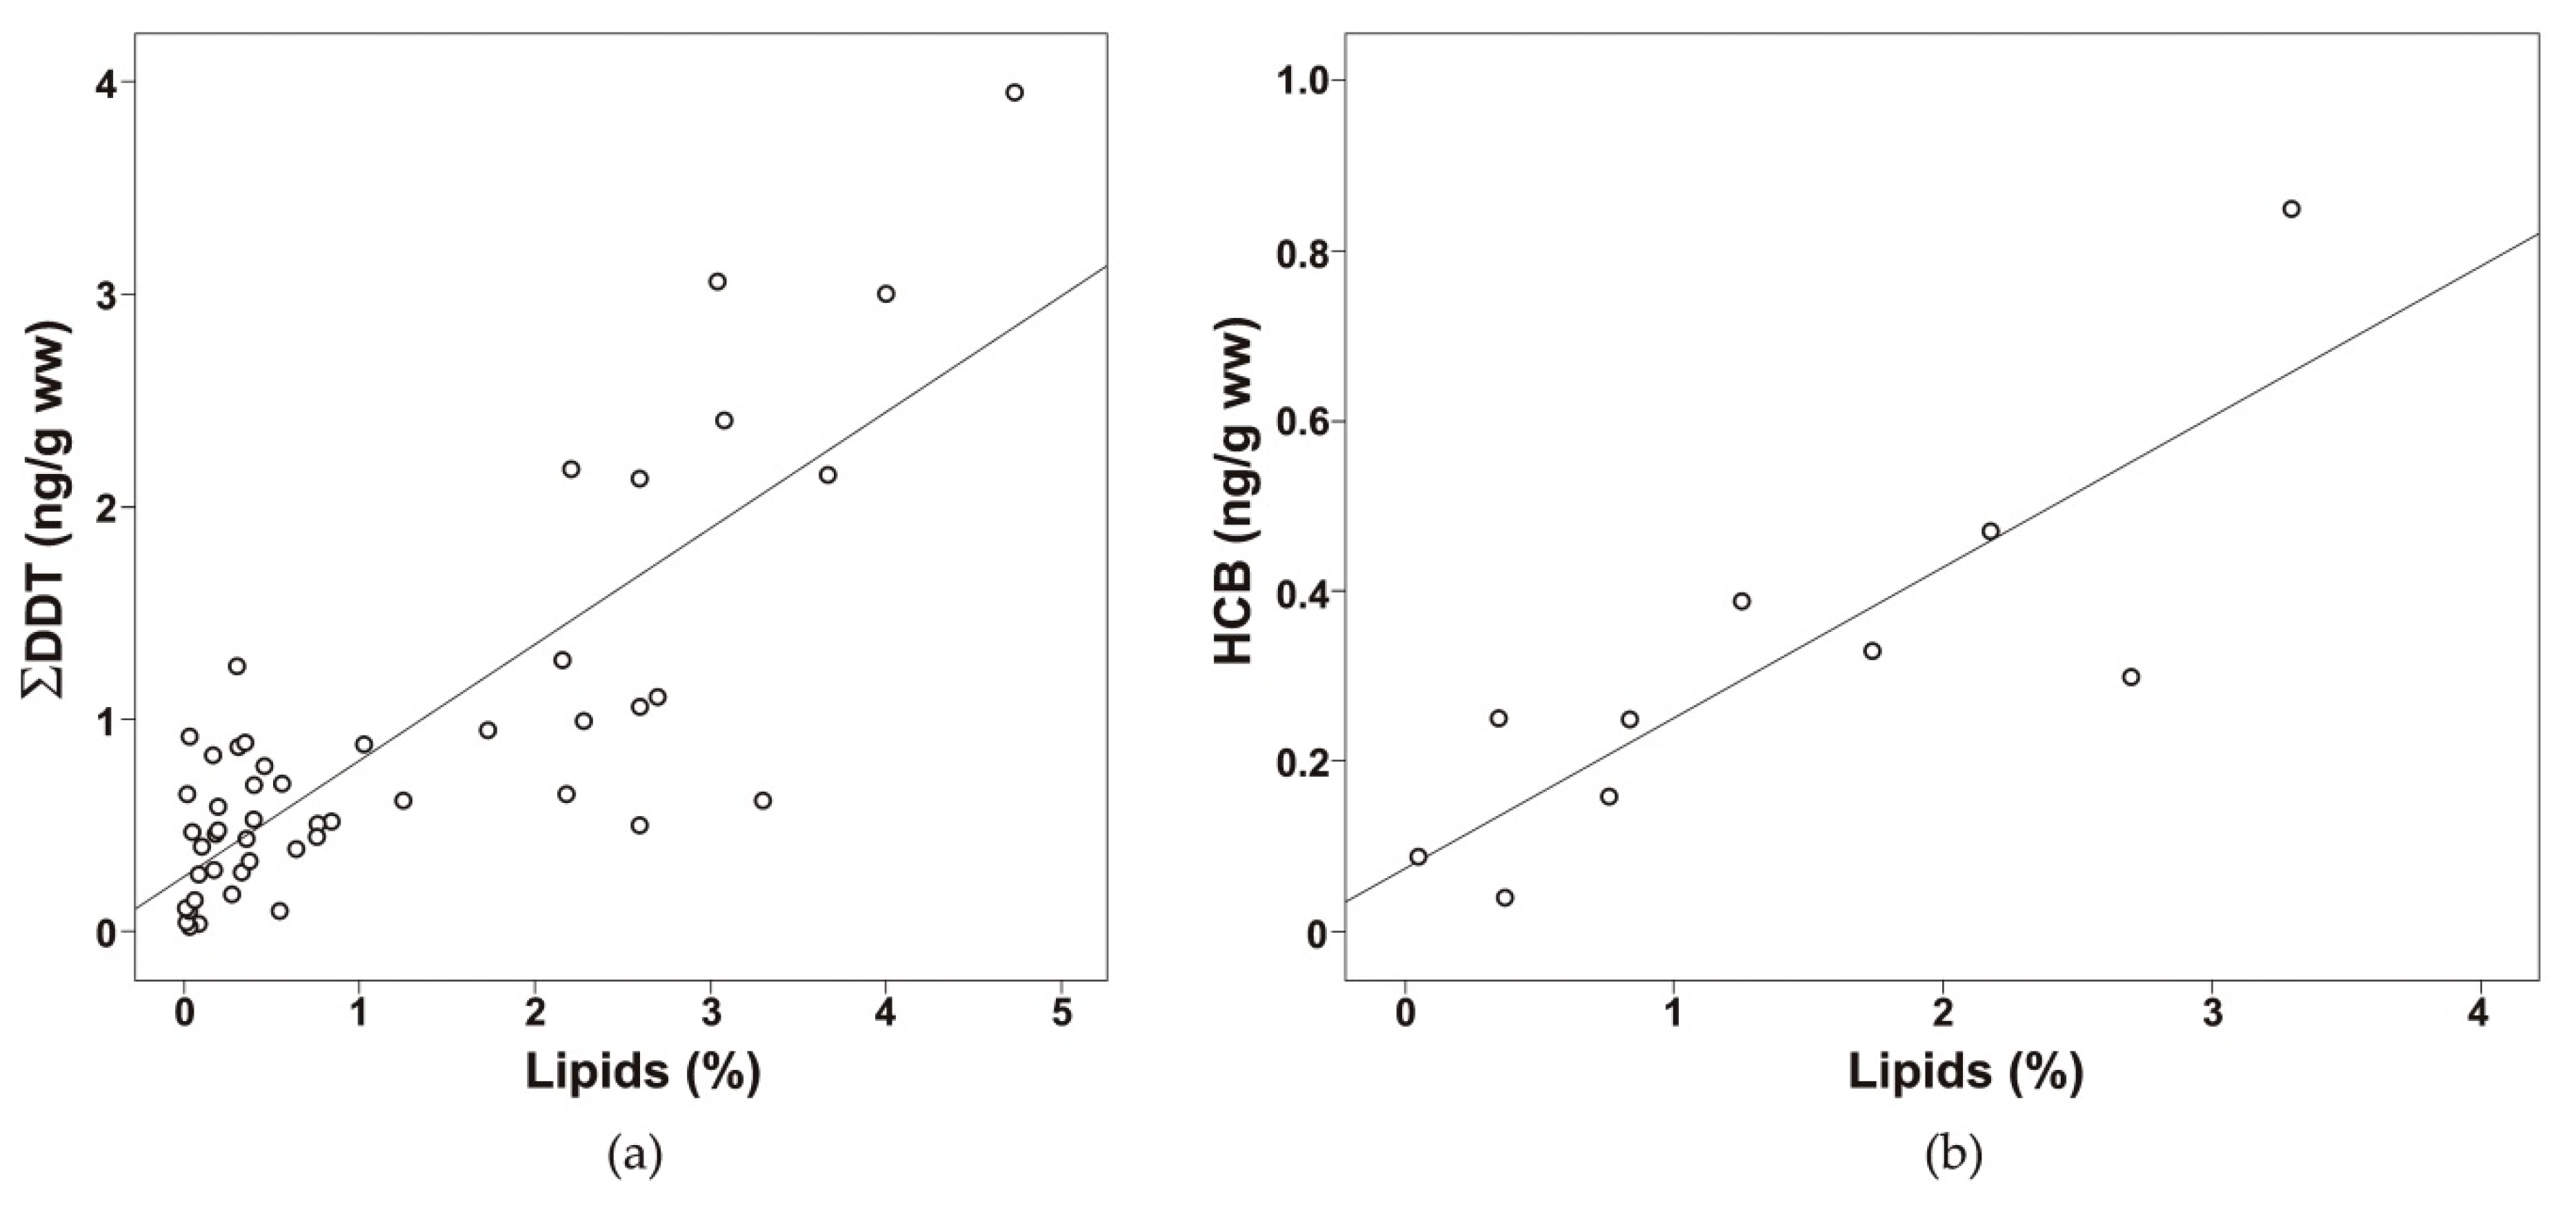
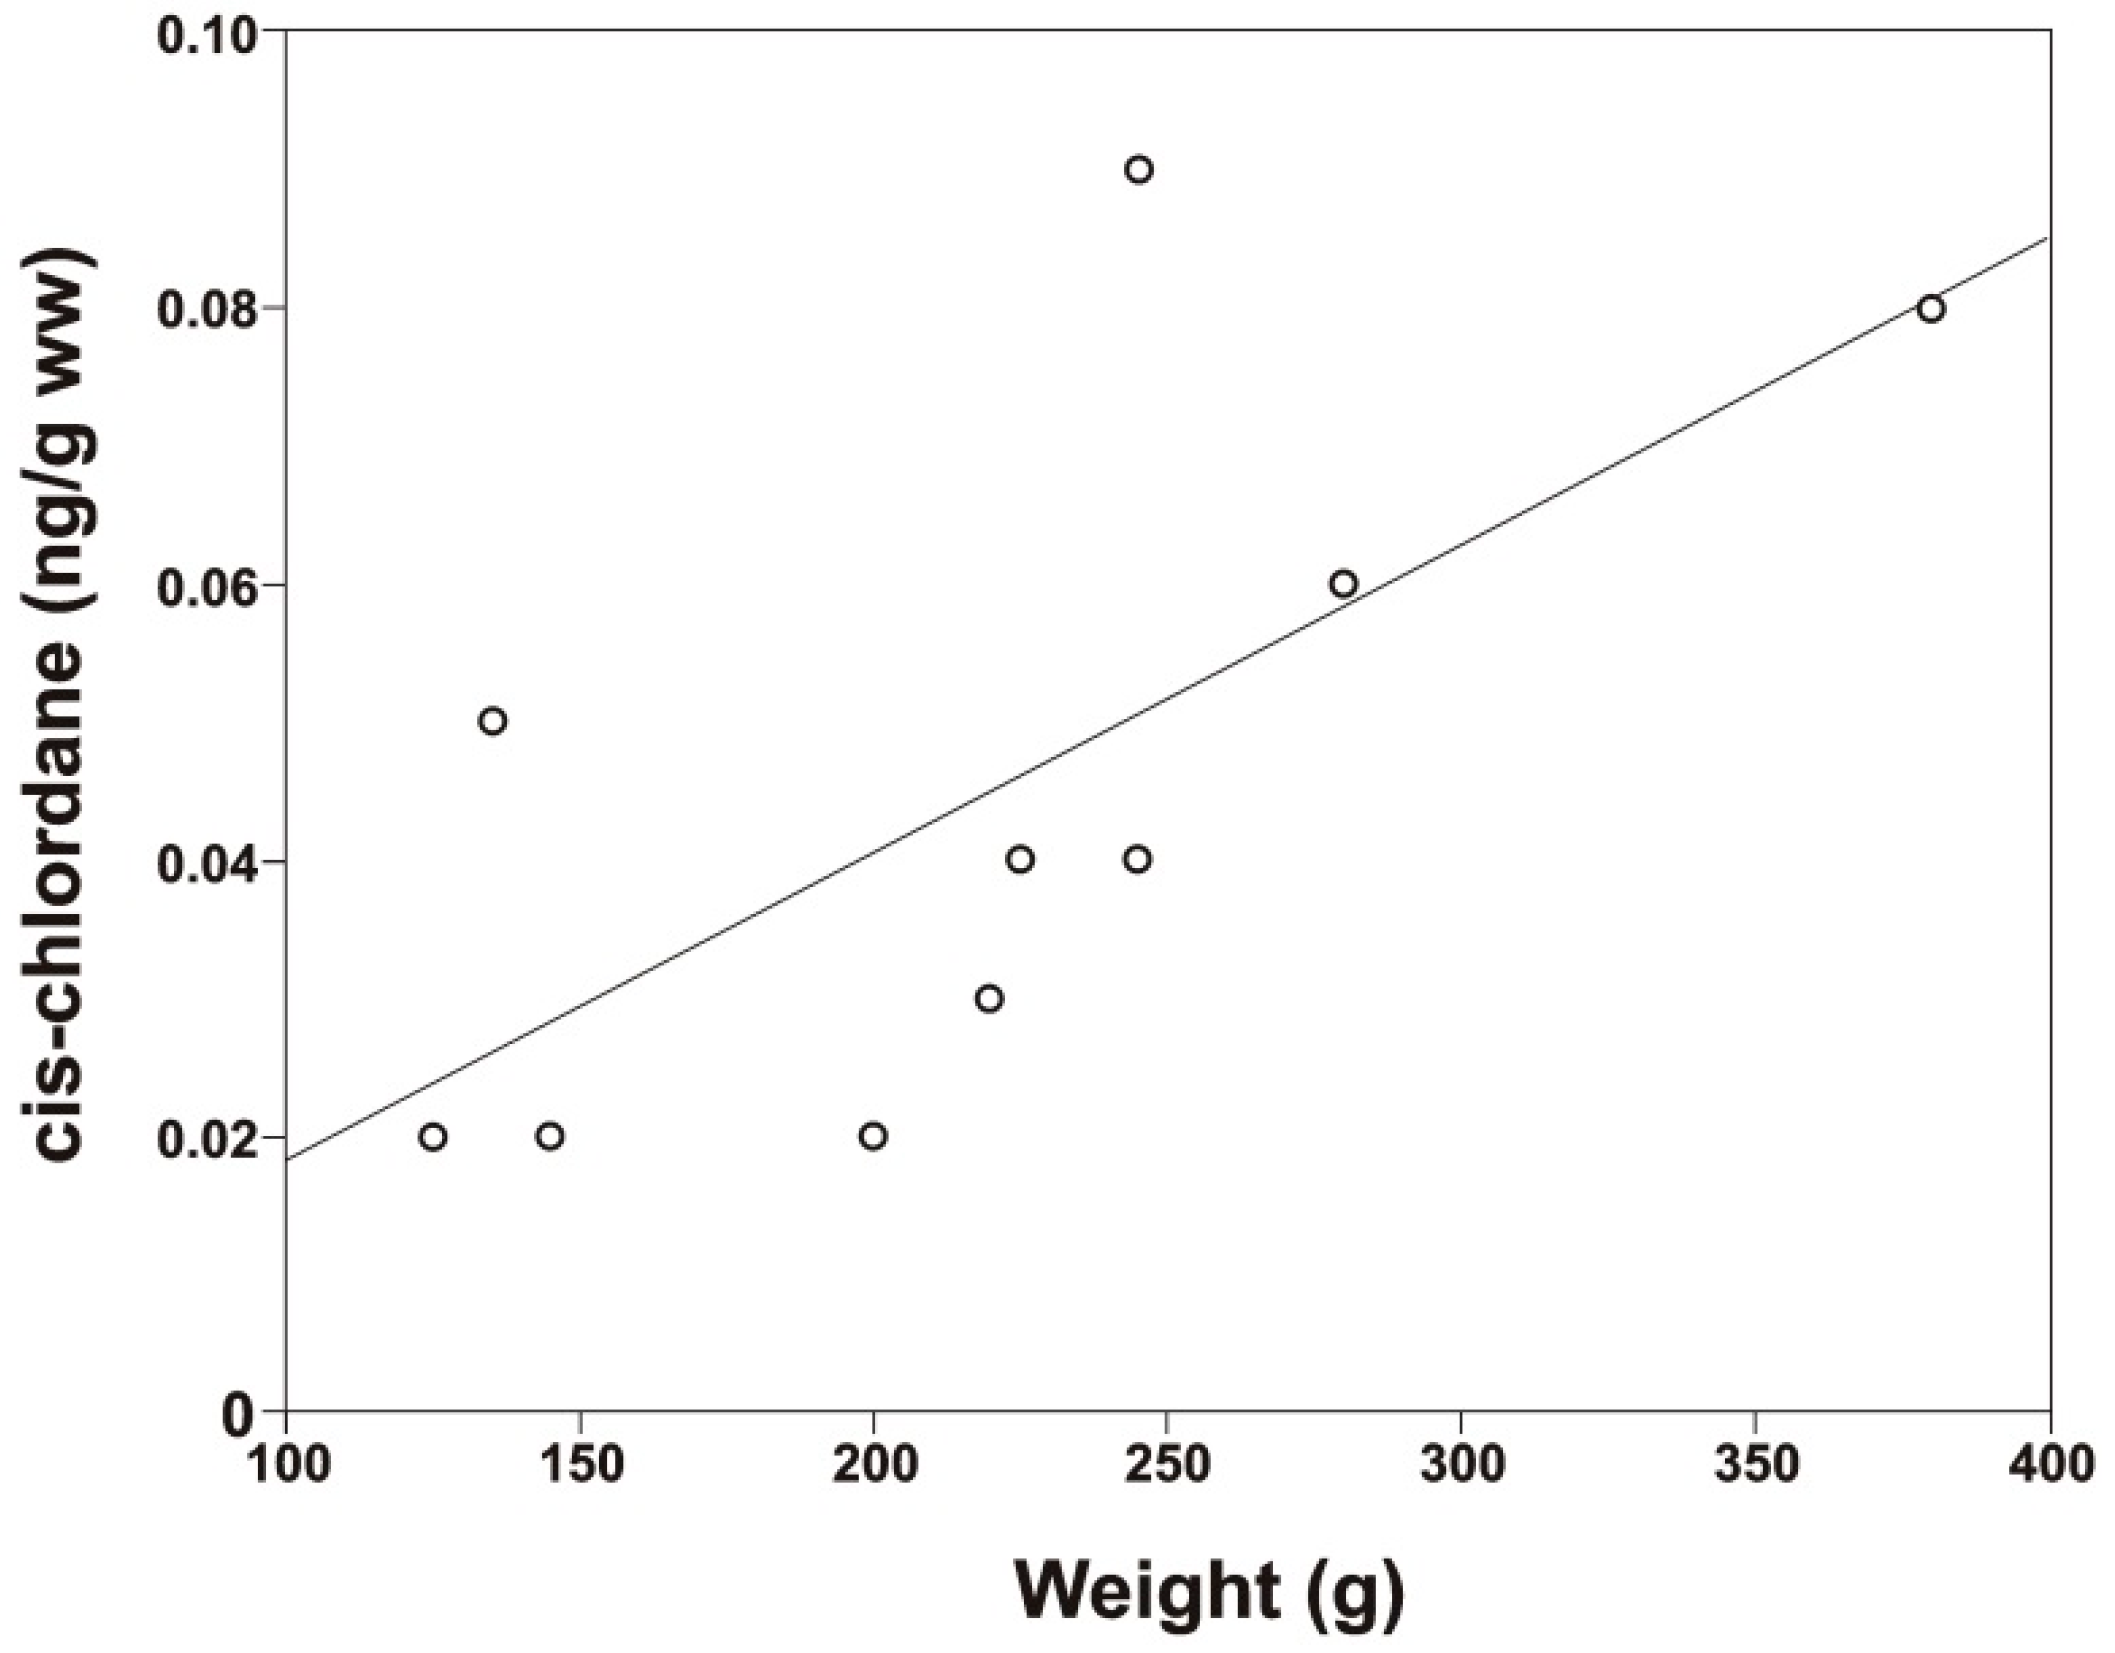
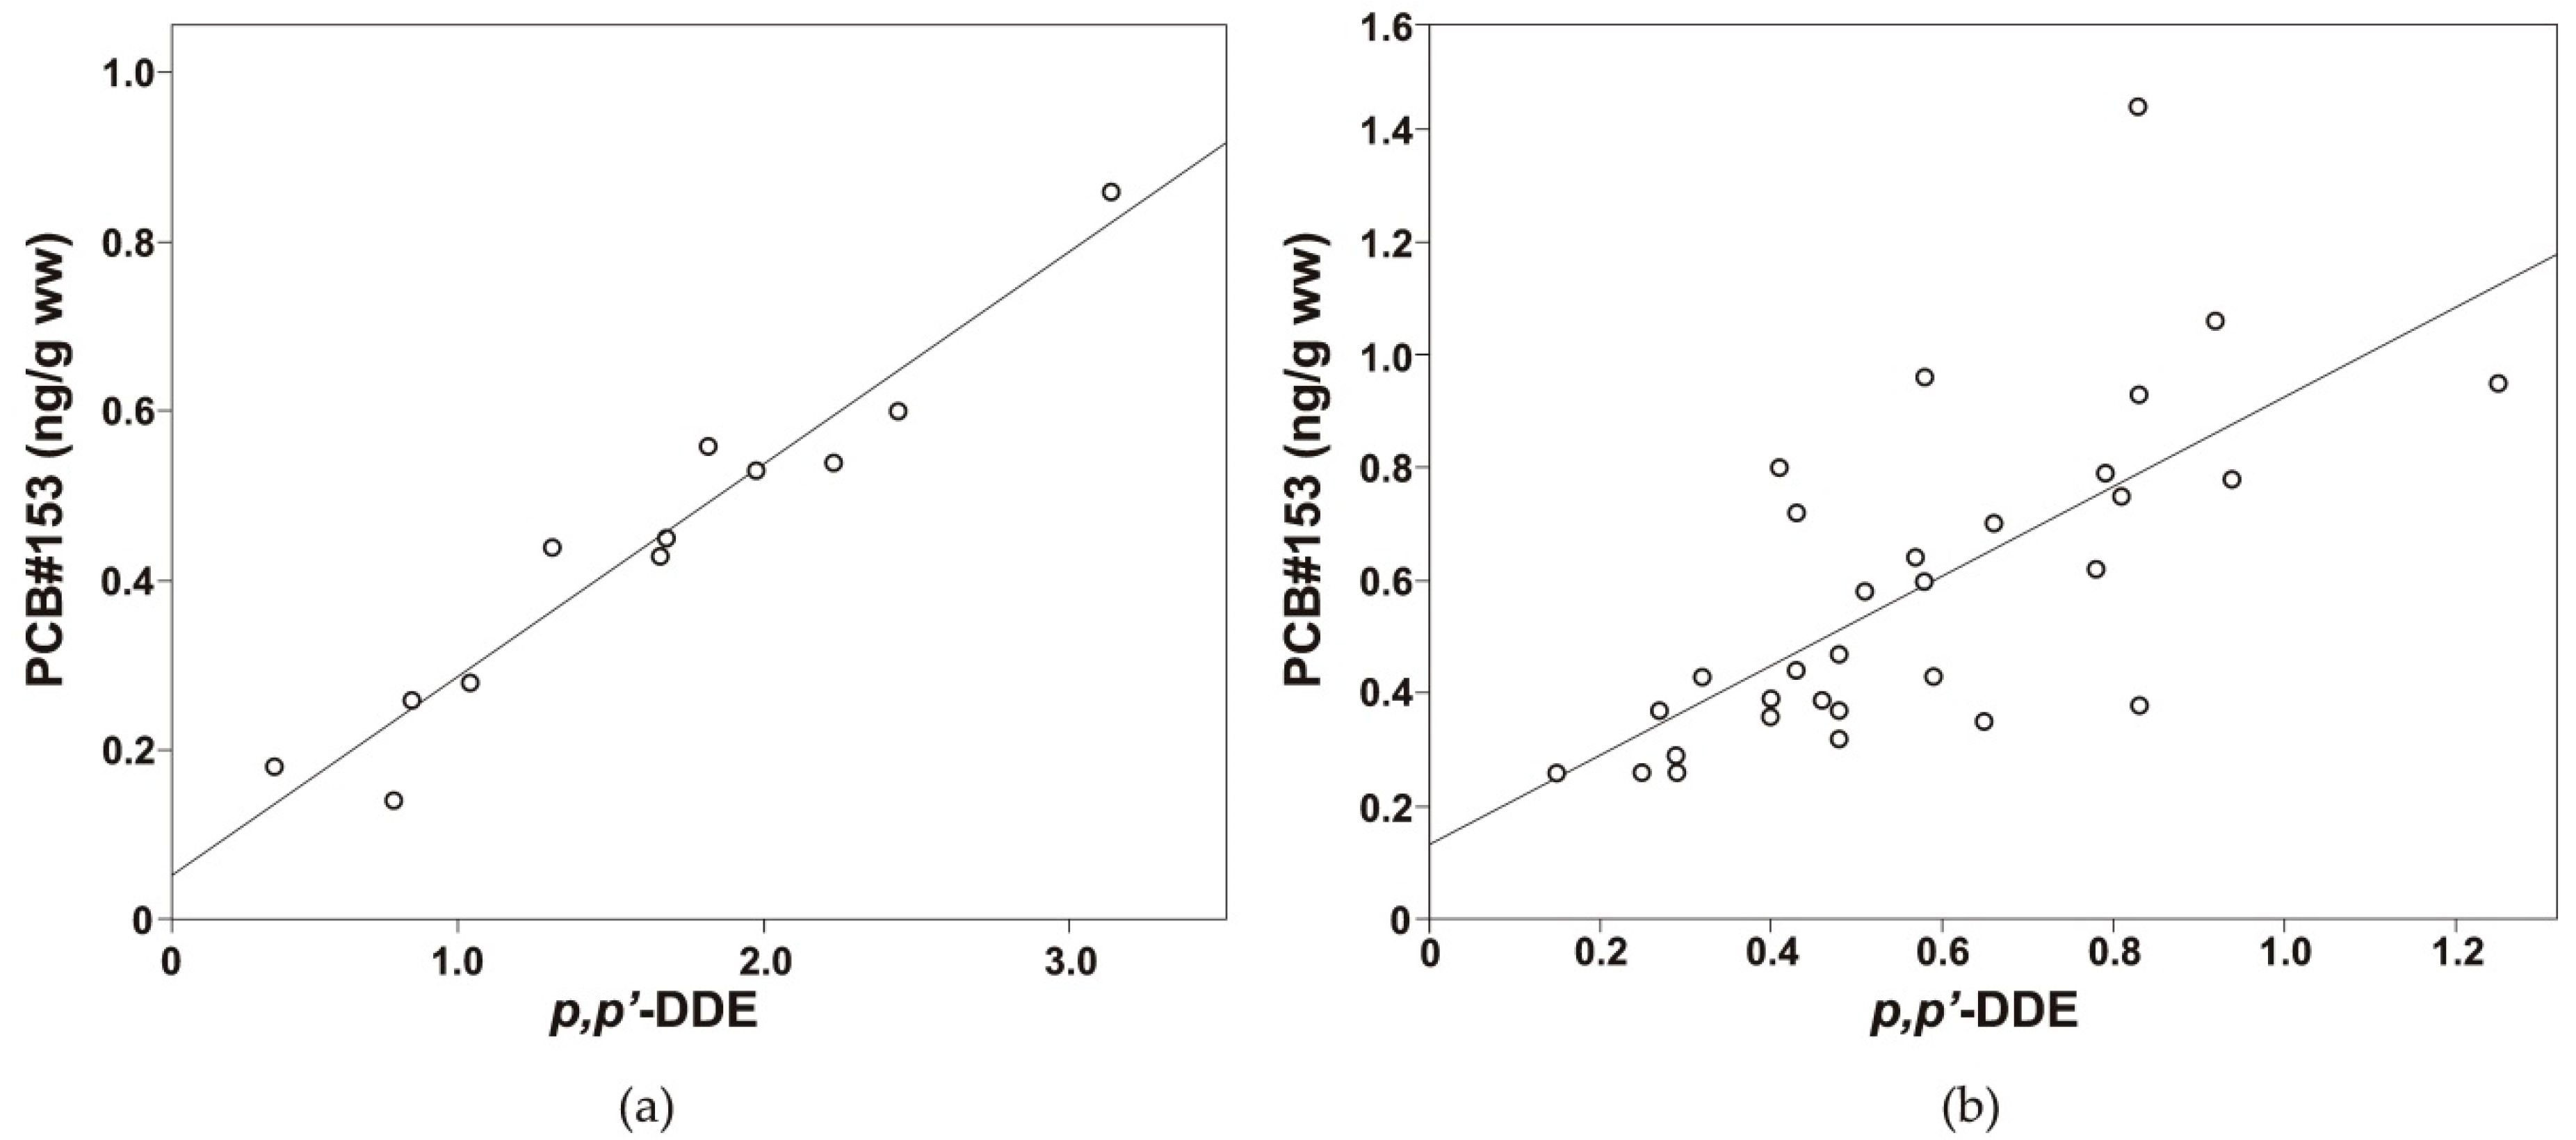
3.4. Correlation Analysis

In all studied fish with a high fat content (especially pink salmon), the content of POP increased (R values ranged from 0.445 to 0.866; p < 0.01 to 0.05) (Table 3). This dependence is especially pronounced for ∑DDT (R = 0.724), trans-nonachlor (R = 0.733), trans-chlordane (R = 0.866) and cis-chlordane (R = 0.800). The correlation between POP and lipid content is presented in Figure 4.
Figure 4 shows a strong positive correlation between ∑DDT and lipid content in all fish. Some fish species have individual correlations between analyte and lipid content, such as the correlation between HCB and lipid content in Arctic char.
However, in some samples, the weight of the sample affects the content of POP, and Spearman’s correlation coefficient varies from 0.403 to 0.799. In navaga weighing between 0.125–0.380 kg, cis-chlordane accumulates to a greater extent (Figure 5), indicating accumulation, and this is partly because old (large) fish have been exposed to cis-chlordane for a longer time than young (small) fish.
However, in most fish samples, no statistically significant relationships between POP concentration and fish weight were found; the same results were observed by Cabrerizo et al. [31].
In addition, the current study revealed the relationship between several congeners (Table 3.) A strong positive relationship between ∑PCB and ∑DDT was observed by comparing all types of analyzed fish (R = 0.779). A strong positive correlation was observed between ∑DDT and cis-nonachlor (R = 0.821), trans-nonachlor (R = 0.914), trans-chlordane (R = 0.901) and cis-chlordane (R = 0.864). Additionally, a strong positive relationship was observed between PCB#52 and PCB#128 (R = 0.726) and between PCB#128 and PCB#118,123 (R = 0.791). A strong positive correlation was observed between PCB#153 and p,p’-DDE (Figure 6). The same correlation was observed by Storelli et al. [32].
Due to the higher ratio of ∑DDT to ∑PCB, the correlation between PCB#153 and p,p’-DDE for pink salmon does not fit the general correlation between PCB#153 and p,p’-DDE for other fish. Therefore, it is presented separately.
Such a high ratio suggests that these POPs can come from similar sources and reflect old pollution, which may be background pollution in this area. Thus, the main factor in the accumulation of POP is lipid content. There was also a link of major POPs with each other.

4. Conclusions

The major POPs in fish from the NAO were DDT-related compounds and PCBs. The amounts of ∑PCB8 and ∑DDT were relatively low in all fish species and did not exceed 10 ng/g wet wt. A relationship between fat content in the fish and POP concentration was found, and fatty fish (pink salmon, Arctic char) from the Barents Sea basin contain 2 or more times higher concentrations of POP compared with lower fat fish (northern pike, humpback whitefish). A strong positive correlation was observed between ∑PCB and ∑DDT, ∑DDT and lipid contents and ∑DDT and chlordane and nonachlor. Despite the large number of fish in the diet of indigenous peoples from NAO, no significant risks were identified. Most legacy POP and OCPs tend to decrease, which can be explained by the past national and regional bans and the restriction on their use and emission. The aim of further research will be an expansion of the list of analytes and species including human blood.

Author Contributions

Methodology, formal analysis, investigation, writing—review and editing, D.L., Y.V., A.A., N.S., T.S., D.K., E.P.; data curation, Y.T.; project administration, T.S.; funding acquisition, V.C. All authors have read and agreed to the published version of the manuscript.

Funding

This work was supported by the Government of the Russian Federation in compliance with Resolution No. 220 of 9 April 2010 (contract No. 14.Y26.31.0009; 14.03.2017), and the analyses were conducted using the instrumentation of the Core Facility Center “Arktika” of the Northern (Arctic) Federal University named after M.V. Lomonosov.

Acknowledgments

This work was performed on the equipment of the Core Facility Center “Arktika”.

Conflicts of Interest

The authors declare no conflict of interest. The founding sponsors had no role in the design of the study; in the collection, analyses, or interpretation of data; in the writing of the manuscript; or in the decision to publish the results.

References

  1. De Wit, C.A.; Herzke, D.; Vorkamp, K. Brominated flame retardants in the Arctic environment—Trends and new candidates. Sci. Total Environ. 2010, 408, 2885–2918. [Google Scholar] [CrossRef]
  2. Braune, B.M.; Outridge, P.M.; Fisk, A.T.; Muir, D.C.G.; Helm, P.A.; Hobbs, K.; Hoekstra, P.F.; Kuzyk, Z.A.; Kwan, M.; Leteher, R.J.; et al. Persistent organic pollutants and mercury in marine biota of the Canadian Arctic: An overview of spatial and temporal trends. Sci. Total Environ. 2005, 351–352, 4–56. [Google Scholar] [CrossRef] [PubMed]
  3. Marques-Pinto, A.; Carvalho, D. Human infertility: Are endocrine disruptors to blame? Endocr. Connect. 2013, 2, 15–29. [Google Scholar] [CrossRef] [PubMed] [Green Version]
  4. Geissen, V.; Mol, H.; Klumpp, E.; Umlauf, G.; Nadal, M.; van der Ploeg, M.; van de Zee, S.E.A.T.M.; Ritsema, C.J. Emerging pollutants in the environment: A challenge for water resource management. Int. Soil Water Conserv. Res. 2015, 3, 57–65. [Google Scholar] [CrossRef]
  5. Golding, J.; Emmett, P.; Iles-Caven, Y.; Steer, C.; Lingam, R. A Review of Environmental Contributions to Childhood Motor Skills. J. Child Neurol. 2013, 29, 1531–1547. [Google Scholar] [CrossRef] [PubMed] [Green Version]
  6. World Health Organisation (WHO). Agrochemicals, Health and Environment: Directory of Resources. Available online: http://www.who.int/heli/risks/toxics/chemicalsdirectory/en/index1.html (accessed on 10 September 2019).
  7. Jurewicz, J.; Polańska, K.; Hanke, W. Chemical exposure early in life and the neurodevelopment of children—An overview of current epidemiological evidence. Ann. Agric. Environ. Med. 2013, 20, 465–486. [Google Scholar]
  8. Mughal, B.B.; Fini, J.-B.; Demeneix, B.A. Thyroid-disrupting chemicals and brain development: An update. Endocr. Connect. 2018, 7, 160–186. [Google Scholar] [CrossRef] [Green Version]
  9. Sorokina, T.Y. A national system of biological monitoring in the Russian Arctic as a tool for the implementation of the Stockholm Convention. Int. Environ. Agreem. Politics Law Econ. 2019, 19, 341–355. [Google Scholar] [CrossRef] [Green Version]
  10. AMAP. Biological Effects of Contaminants on Arctic Wildlife and Fish; Arctic Monitoring and Assessment Programme (AMAP): Tromsø, Norway, 2018. [Google Scholar]
  11. Abass, K.; Emelyanova, A.; Rautio, A. Temporal trends of contaminants in Arctic human populations. Environ. Sci. Pollut. Res. 2018, 25, 28834–28850. [Google Scholar] [CrossRef] [Green Version]
  12. Petrenya, N.; Dobrodeeva, L.; Brustad, M.; Bichkaeva, F.; Menshikova, E.; Lutfalieva, G.; Poletaeva, A.; Poletaeva, A.; Repina, V.; Cooper, M.; et al. Fish consumption and socio-economic factors among residents of Arkhangelsk city and the rural Nenets autonomous area. Int. J. Circumpolar Health 2011, 70, 46–58. [Google Scholar] [CrossRef] [Green Version]
  13. Dudarev, A.; Yamin-Pasternak, S.; Pasternak, I.; Chupakhin, V. Traditional Diet and Environmental Contaminants in Coastal Chukotka I: Study Design and Dietary Patterns. Int. J. Environ. Res. Public Health 2019, 16, 702. [Google Scholar] [CrossRef] [PubMed] [Green Version]
  14. Rosstat. The Diet of the Population [Ratsion Pitaniya Naseleniya]; Russian Federal State Statistics Service (Rosstat): Moscow, Russian, 2016.
  15. Uekusa, Y.; Takatsuki, S.; Tsutsumi, T.; Akiyama, H.; Matsuda, R.; Teshima, R.; Hachisuko, A.; Watanabe, T. Determination of polychlorinated biphenyls in marine fish obtained from tsunami-stricken areas of Japan. PLoS ONE 2017, 12, e0174961. [Google Scholar] [CrossRef] [PubMed] [Green Version]
  16. Manirakiza, P.; Covaci, A.; Nizigiymana, L.; Ntakimazi, G.; Schepens, P. Persistent chlorinated pesticides and polychlorinated biphenyls in selected fish species from Lake Tanganyika, Burundi, Africa. Environ. Pollut. 2002, 117, 447–455. [Google Scholar] [CrossRef]
  17. Muir, D.; Savinova, T.; Savinov, V.; Alexeeva, L.; Potelov, V.; Svetochev, V. Bioaccumulation of PCBs and chlorinated pesticides in seals, fishes and invertebrates from the b, Russia. Sci. Total Environ. 2003, 306, 111–131. [Google Scholar] [CrossRef]
  18. AMAP. Temporal Trends in Persistent Organic Pollutants in the Arctic; AMAP Assessment 2015; Arctic Monitoring and Assessment Programme (AMAP): Oslo, Norway, 2016. [Google Scholar]
  19. Stockholm Convention on Persistent Organic Pollutants Was Adopted on 22 May 2001 in Stockholm, Sweden. Available online: http://chm.pops.int/Portals/0/Repository/convention_text/UNEP-POPS-COP-CONVTEXT-FULL.English.PDF (accessed on 19 September 2019).
  20. Letcher, R.J.; Bustnes, J.O.; Dietz, R.; Jenssen, B.M.; Jørgensen, E.H.; Sonne, C.; Verrault, J.; Vijayan, M.; Gabrielsen, G.W. Exposure and effects assessment of persistent organohalogen contaminants in arctic wildlife and fish. Sci. Total Environ. 2010, 408, 2995–3043. [Google Scholar] [CrossRef] [PubMed]
  21. De Araujo, J.S.A.; Delgado, I.F.; Paumgartten, F.J.R. Glyphosate and adverse pregnancy outcomes, a systematic review of observational studies. BMC Public Health 2016, 16, 472. [Google Scholar] [CrossRef] [Green Version]
  22. Sobolev, N.; Aksenov, A.; Sorokina, T.; Chashchin, V.; Ellingsen, D.; Nieboer, E.; Varakina, Y.; Veselkina, E.; Kotsur, D.; Thomassen, Y. Essential and non-essential trace elements in fish consumed by indigenous peoples of the European Russian Arctic. Environ. Pollut. 2019, 253, 966–973. [Google Scholar] [CrossRef]
  23. Sobolev, N.; Nieboer, E.; Aksenov, A.; Sorokina, T.; Chashchin, V.; Ellingsen, D.G.; Varakina, Y.; Plakhina, E.; Kotsur, D.; Kosheleva, A.; et al. Concentration dataset for 4 essential and 5 non-essential elements in fish collected in Arctic and sub-Arctic territories of the Nenets Autonomous and Arkhangelsk regions of Russia. Data Brief 2019, 27, 104631. [Google Scholar] [CrossRef]
  24. Shrivastava, A.; Gupta, V. Methods for the determination of limit of detection and limit of quantitation of the analytical methods. Chron. Young Sci. 2011, 2, 21. [Google Scholar] [CrossRef]
  25. Tsygankov, V.Y.; Boyarova, M.D. Sample preparation method for the determination of organochlorine pesticides in aquatic organisms by gas chromatography. Achieve Life Sci. 2015, 9, 65–68. [Google Scholar] [CrossRef] [Green Version]
  26. Bonito, L.T.; Hamdoun, A.; Sandin, S.A. Evaluation of the global impacts of mitigation on persistent, bioaccumulative and toxic pollutants in marine fish. PeerJ 2016, 4, e1573. [Google Scholar] [CrossRef] [PubMed]
  27. Perugini, M.; Cavaliere, M.; Giammarino, A.; Mazzone, P.; Olivieri, V.; Amorena, M. Levels of polychlorinated biphenyls and organochlorine pesticides in some edible marine organisms from the Central Adriatic Sea. Chemosphere 2004, 57, 391–400. [Google Scholar] [CrossRef] [PubMed]
  28. Yang, R.; Wang, Y.; Li, A.; Zhang, Q.; Jing, C.; Wang, T.; Li, Y.; Jiang, G. Organochlorine pesticides and PCBs in fish from lakes of the Tibetan Plateau and the implications. Environ. Pollut. 2010, 158, 2310–2316. [Google Scholar] [CrossRef] [PubMed]
  29. AMAP. Persistent Toxic Substances, Food Security and Indigenous Peoples of the Russian North. Final Report; Arctic Monitoring and Assessment Programme (AMAP): Oslo, Norway, 2004. [Google Scholar]
  30. Tsygankova, V.; Lukyanovaa, O.; Boyarovaa, M.; Gumovskiya, A.; Donetsa, M.; Lyakha, V.; Korchagina, V.; Prikhodkoa, Y. Organochlorine pesticides in commercial Pacific salmon in the Russian Far Eastern seas: Food safety and human health risk assessment. Mar. Pollut. Bull. 2019, 140, 503–508. [Google Scholar] [CrossRef]
  31. Cabrerizo, A.; Muir, D.C.G.; Köck, G.; Iqaluk, D.; Wang, X. Climatic Influence on Temporal Trends of Polychlorinated Biphenyls and Organochlorine Pesticides in Landlocked Char from Lakes in the Canadian High Arctic. Environ. Sci. Technol. 2018, 52, 10380–10390. [Google Scholar] [CrossRef]
  32. Storelli, M.M.; Losada, S.; Marcotrigiano, G.O.; Roosens, L.; Barone, G.; Neels, H.; Covaci, A. Polychlorinated biphenyl and organochlorine pesticide contamination signatures in deep-sea fish from the Mediterranean Sea. Environ. Res. 2009, 109, 851–856. [Google Scholar] [CrossRef]
Figure 1. Average medium concentration of PCBs in fish muscle.
Environments 07 00003 g001
Figure 2. Average medium concentration of DDT breakdown product in fish muscle.
Environments 07 00003 g002
Figure 3. The ratio of DL-PCB and NDL-PCB in various fish species: (a) Arctic char, (b) pink salmon, (c) navaga, (d) humpback whitefish and (e) northern pike.
Environments 07 00003 g003
Figure 4. Correlation between POP and lipid content, (a) between ∑DDT and lipid content in all fish samples and (b) between HCB and lipid content in Arctic char samples.
Environments 07 00003 g004
Figure 5. Correlation between cis-chlordane and weight in navaga.
Environments 07 00003 g005
Figure 6. Correlation between PCB#153 and p,p’-DDE in (a) pink salmon and (b) other fish species.
Environments 07 00003 g006
Table 1. Arithmetic mean (AM) of weight, age and lipid in fish species.
Fish SpeciesnWeight (kg)Age (Year)Lipid (%)
AMMin–MaxAMMin–MaxAMMin–Max
Arctic char
(Salvelinus alpinus)
100.730.47–1.054.53.0–6.51.370.16–3.30
Pink salmon
(Oncorhynchus gorbuscha)
121.070.80–1.641+ *1–22.932.15–4.73
Navaga
(Eleginus nawaga)
100.220.13–0.384.53.0–6.50.510.27–1.03
Humpback whitefish
(Coregonus pidschian)
110.440.38–0.577.05.0–10.00.170.02–0.46
Northern pike
(Esox lucius)
83.451.07–6.535.01.5–8.50.100.02–0.54
* Age of all fish.
Table 2. Concentrations of persistent organic pollutants in fish muscle from Nenets Autonomous Okrug.
Analytes,
ng/g (ww)
Limit of Quantification (LOQ)Limit of Detection (LOD)Arctic Char
(N = 10)
Pink Salmon
(N = 12)
Navaga
(N = 10)
Humpback Whitefish
(N = 11)
Northern Pike
(N = 8)
AMMin–MaxAMMin–MaxAMMin–MaxAMMin–MaxAMMin–Max
∑PCB80.030.0081.580.56–2.441.540.41–2.891.240.46–2.590.720.34–1.450.320.09–0.50
DL-PCB * 0.190.11–0.250.210.02–0.380.130–0.21----
NDL-PCB ** 1.390.45–2.201.200.40–1.971.100.38–2.380.720.34–1.450.430–0.5
∑DDT0.030.0090.660.33–1.112.040.50–3.950.550.18–0.880.630.27–1.250.080.03–0.15
HCB0.030.0100.310.04–0.850.400.12–0.630.390.14–0.700.280.02–0.950.130.03–0.29
∑Tetrachlorobenzene0.0040.0010.020.01–0.040.020.01–0.030.020.01–0.060.170.09–0.35<LOD
Mirex0.010.0030.050.04–0.080.130.10–0.160.040.01–0.060.060.01–0.33<LOD
cis-Nonachlor0.120.0400.070.06–0.100.170.06–0.300.080.06–0.20<LOD<LOD
trans-Nonachlor0.080.0270.130.04–0.310.400.12–0.710.070.03–0.12<LOD<LOD
trans-Chlordane0.040.0130.030.02–0.060.100.04–0.160.030.02–0.04<LOD<LOD
cis-Chlordane(ng/g)0.040.0130.050.02–0.090.170.06–0.290.040.02–0.09<LOD<LOD
β-Heptachlor epoxide0.030.010<LOD<LOD<LOD<LOD<LOD
Aldrin0.040.013<LOD<LOD<LOD<LOD<LOD
Heptachlor0.050.016<LOD<LOD<LOD<LOD<LOD
* Dl-PCB (105, 118, 123). ** NDL-PCB (28, 52, 101, 128, 153).
Table 3. Univariate associations (Spearman r and p-values (R)) between elements in all fish (n ¼ 51).
PCB
52
PCB
101
PCB
105
PCB
118,123
PCB
128
PCB
153
∑PCB∑DDTHCBcis-Nonachlortrans-Nonachlortrans-Chlordanecis-ChlordaneMirex∑Tetrachloro-BenzeneLipidWeightAge
PCB#280.461 **0.424 **0.3300.2460.384 *0.406 **0.400 **0.2150.338 *0.0560.3150.2310.202−0.156−0.0900.0540.1350.162
PCB#52 0.637 **0.654 **0.664 **0.726 **0.338 *0.644 **0.695 **0.463 **0.577 **0.831 **0.784 **0.738 **0.332 *−0.1100.550 **0.439 **−0.174
PCB#101 0.459 *0.673 **0.680 **0.486 **0.840 **0.536 **0.392 **0.3350.558 **0.510 **0.423 *0.490 **−0.499 **0.658 **0.529 **−0.379 *
PCB#105 0.589 **0.656 **0.522 *0.646 **0.542 **0.3570.521 *0.541 **0.509 *0.523 *0.3260.1380.445 *0.449 *−0.014
PCB#118,123 0.791 **0.706 **0.837 **0.836 **0.727 **0.650 **0.658 **0.673 **0.608 **0.524 **0.3480.590 **0.403 *−0.191
PCB#128 0.486 **0.825 **0.725 **0.388 *0.689 **0.816 **0.695 **0.694 **0.358 *−0.1880.520 **0.244−0.286
PCB#153 0.763 **0.413 **0.537 **0.2320.1240.0980.0580.0630.0170.107−0.1020.188
∑PCB 0.779 **0.663 **0.527 **0.590 **0.508 **0.471 **0.328 *−0.379 *0.638 **−0.072−0.280 *
∑DDT 0.596 **0.821 **0.914 **0.901 **0.864 **0.603 **−0.1350.724 **0.025−0.360 **
HCB 0.461 **0.2740.434 *0.390 *0.1710.0730.543 **−0.127−0.188
cis-Nonachlor 0.773 **0.842 **0.871 **0.667 **0.0660.654 **0.605 **−0.441 *
trans-Nonachlor 0.901 **0.883 **0.695 **−0.1460.733 **0.749 **−0.603 **
trans-Chlordane 0.941 **0.808 **0.0380.866 **0.799 **−0.508 **
cis-Chlordane 0.749 **−0.0360.800 **0.746 **−0.484 **
Mirex −0.315 *0.708 **0.615 **−0.651 **
∑Tetrachloro-benzene −0.499 **−0.2690.611 **
Lipid 0.107−0.616 **
Weight −0.212
** Correlation is significant at the 0.01 level (2-tailed). * Correlation is significant at the 0.05 level (2-tailed).

