Article

Monitoring Arsenic Species Content in Seaweeds Produced off the Southern Coast of Korea and Its Risk Assessment

1
Department of Biotechnology, College of Life Science & Biotechnology, Korea University, Seoul 02841, Korea
2
Department of Statistics, College of Natural Science, Dongguk University, Seoul 04620, Korea
*
Author to whom correspondence should be addressed.
Submission received: 22 July 2020 / Revised: 29 August 2020 / Accepted: 31 August 2020 / Published: 3 September 2020

Abstract

:
Seaweed, a popular seafood in South Korea, has abundant dietary fiber and minerals. The toxicity of arsenic compounds is known to be related to their chemical speciation, and inorganic arsenic (iAs) is more detrimental than other species. Due to the different toxicities of the various chemical forms, speciation analysis is important for evaluating arsenic exposure. In this study, total arsenic (tAs) and six arsenic species (arsenite, arsenate, monomethylarsonic acid, dimethylarsinic acid, arsenobetaine, and arsenocholine) were analyzed in 180 seaweed samples. Although there were differences between seaweed species, the concentration of tAs was detected at levels ranging from 1 to 100 µg/g, and the distribution of six arsenic species differed depending on the seaweed species. No correlation between the concentration of iAs and tAs was found in most seaweed species. Through statistical clustering, hijiki and gulfweed were seen to be the seaweeds with the highest ratios of iAs to tAs. Using the iAs concentration data from the arsenic speciation analysis, a risk assessment of seaweed intake in South Korea was conducted. The margin of exposure values showed no meaningful risk for the general population, but low levels of risk were identified for seaweed consumers, with high intakes of gulfweed and hijiki.

Graphical Abstract

1. Introduction

Arsenic (As) is known to have harmful effects on humans and animals. Arsenic exists in various chemical forms, and is largely divided into inorganic As (iAs) and organic As [1]. Inorganic As, containing arsenite (AsIII) and arsenate (AsV), is known to have high potential for toxicity and frequent occurrence in food and water, posing a health risk to millions of people [2,3]. Previous research reported that iAs causes damage to lung, urinary bladder, and skin [4,5], and is classified as a nonthreshold Group 1 carcinogen to humans by the International Agency for Research on Cancer (IARC) [6,7]. Additionally, methylated arsenicals are known metabolites found in humans that have been exposed to iAs [8]. Despite the low toxicity of dimethylarsinic acid (DMAV) and monomethylarsonic acid (MMAV), dimethylarcinic acid (DMAIII) and monomethylarsonic acid (MMAIII) are extremely toxic [8,9]. The latter two organic forms of arsenic have also been classified as Group 2 potential carcinogens for humans [10]. Furthermore, dimethylmonothioarsinic acid (DMMTAV), which is produced during the metabolism of DMAV, is also reported to be highly toxic [8]. While current risk assessments of dietary exposure to As are mainly based on inorganic substances, for a more accurate risk assessment, organoarsenicals that are not fully categorized in terms of their toxicological properties, lack knowledge of chemical structures, and may cause potential threats to human health, remain to be studied [9,11]. The Joint FAO/WHO Expert Committee on Food Additives (JECFA) and European Food Safety Authority (EFSA) have proposed BMDL (benchmark dose lower confidence limits) values for iAs. BMDL01 for iAs range between 0.3–8 μg kg−1 day−1 [12], and the BMDL0.5 is 3 μg kg−1 day−1 [13].
In South Korea, seaweed is used for various purposes. It can be eaten in raw, cooked, and processed forms, and seaweed polysaccharides are used for cosmetics and pharmaceutical products [14]. Seaweed intake is recommended for satisfying the dietary requirements of essential minerals and trace elements that are less available in other common edible plants [15]. More than 50 species of seaweeds are used for food [16]. The annual consumption of seaweed in South Korea is 8.5 kg per person, which is one of the highest consumption rates in the world [16]. In recent decades, seaweed has become increasingly consumed as food in Western countries because of its nutritional and health benefits [17]. Previous research indicated that As is abundant in seafoods at concentrations as high as several hundred mg kg−1 [18]. Whereas seaweed contains high levels of total arsenic (tAs), most As exist as organic species, and iAs content is relatively low [19]. However, some species such as hijiki are known to have relatively high levels of tAs, with a high ratio of iAs to tAs [17,20,21,22]. Therefore, due to the differences in toxicity among chemical forms and different content patterns of As species among seaweed species, the necessity of speciation analysis is evident.
Since levels of tAs and iAs in particular seaweed species have been mainly investigated [23,24,25], and levels of As species in a variety of seaweed species currently available in South Korea need to be monitored, the levels of tAs and 6 different arsenic species (inorganic species including AsIII and AsV, and organic species including MMA, DMA, arsenobetain (AsB), and arsenocholine (AsC) in seaweeds were examined in this study. Ten categories comprising 180 total seaweed samples (kelp (n = 32), sea mustard (n = 25), laver (n = 25), agar (n = 20), sea lettuce (n = 20), seaweed fulvescens (n = 17), gulfweed (n = 12), sea staghorn (n = 13), sea string (n = 8), and hijiki (n = 8)) produced in the southern coastal region of Korea were collected from various markets, and their As contents were analyzed by high-performance liquid chromatography inductively coupled plasma mass spectrometry (HPLC-ICP-MS). The objectives of this study were to collect data about the concentration of each As species in various South Korean seaweed samples, and to conduct a risk assessment for the general population and the seaweed consumer group, that will provide a basis for dietary recommendations.

2. Materials and Methods

2.1. Chemicals and Reagents

Ultrapure deionized water obtained from the YL WPS System (Young Lin Instrument Co., Gyeonggi-do, Korea) was used for all experiments in this study. Arsenic standard solutions for ICP (Fluka, Buchs, Switzerland), hydrogen peroxide and nitric acid (Chemitop, Chungcheongbuk-do, Korea) were used for the analysis of total arsenic. For As speciation analysis standards, arsenic oxide hydrate (Inorganic ventures, Christiansburg, VA, USA), arsenic trioxide (Inorganic ventures, Christiansburg, VA, USA), sodium cacodylate trihydrate (Sigma-Aldrich, St. Louis, MO, USA), disodium methyl arsonate hexahydrate (Chemservice, Pittsburgh, PA, USA), arsenocholine bromide (Wako, Japan) and arsenobetaine (Sigma-Aldrich, St. Louis, MO, USA) were used (Table S1). For the chromatographic mobile phase, sodium 1-butanesulfonate (Sigma-Aldrich, St. Louis, USA), tetramethylammonium hydroxide (Sigma-Aldrich, St. Louis, MO, USA), malonic acid (Wako, Osaka, Japan), and HPLC grade methanol (Burdick & Jackson, Ulsan, Korea) were used. Certified reference material (CRM) NMIJ CRM 7405b Hijiki (National Metrology Institute of Japan, Ibaraki, Japan) was used to validate the analytical method. All chemicals used in this study were analytical grade.

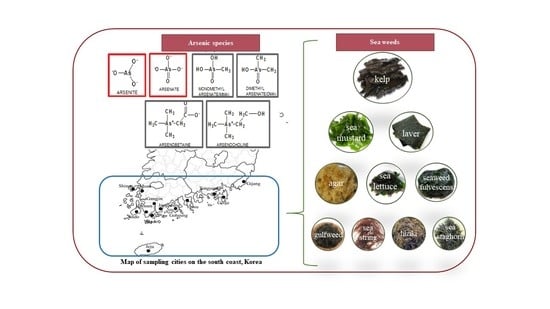
2.2. Sample Collection and Preparation

A total of 180 seaweed samples; kelp (n = 32), laver (n = 25), sea mustard (n = 25), agar (n = 20), sea lettuce (n = 20), seaweed fulvescens (n = 17), gulfweed (n = 12), sea staghorn (n = 13), sea string (n = 8), and hijiki (n = 8); were purchased from supermarkets, traditional markets, and online markets. Sample numbers were selected with consideration of the consumer’s purchasing preferences [26] and average consumption [27]. All the samples were produced in the southern coastal region of Korea, 2018; most of the products were produced off the southern coast of the Jeolla province (Wando, Shinan, Muan, Jindo, Gangjin, Haenam, Jangheung, Goheung, and Yeosu); however, some samples were produced in other provinces, like the southern region of Gyeongsang province (Tongyeong, Geoje, and Gijang), and Jeju Island (Figure S1).
Seaweed samples were freeze-dried (FDU-2110, EYELA, Tokyo, Japan) and homogenized using a grinder (FM-700SS, Hanil Electric, Seoul, Korea). Homogenized samples were sealed with Parafilm (Neenah, WI, USA) and kept at 4 °C in the refrigerator until analysis.

2.3. Instruments

The As analysis was performed with ICP-MS (Agilent 7700x, Agilent Technologies, Santa Clara, CA, USA), and the experimental conditions of the previous studies that analyzed As using the same instrument were modified and used in this experiment [28]. The working condition for tAs analysis is presented in Table S2. The ICP-MS consisted of a double-pass spray chamber and a micro-mist concentric nebulizer. For As speciation analysis, chromatographic separation by using an HPLC (Agilent 1200 series, Agilent Technologies, Santa Clara, CA, USA) was added to ICP-MS. The working conditions for HPLC in As speciation analysis are presented in Table S2. The reversed phase CAPCELL PAK C18 MG column (4.6 × 250 mm, 5 μm, Shiseido, Tokyo, Japan) was connected to the nebulizer of the ICP-MS for separation.

2.4. Determination of Total As

Digestion of seaweed samples was performed based on the protocols described in the Korean Food Standard Codex Working Manual on Heavy Metals Analysis [29]. About 0.1 g of each dried and powdered seaweed sample was weighed in a polytetrafluoroethylene (PTFE) tube (50 mL). Four milliliters of nitric acid (70%, v/v) were added, and the samples were heated on a hot plate (100 °C, 90 min). After cooling at 25 °C, 1 mL of hydrogen peroxide (30%, v/v) and 3 mL of nitric acid (70%, v/v) were added. PTFE tubes were closed and put into a microwave digestion system (ETHOS EASY, Milestone, Italy). The digestion procedure was performed in 3 steps: (1) 20 min at 1600 W to raise the temperature to 200 °C, (2) 15 min holding time under the same conditions, and (3) 30 min cooling time for sample temperature to fall to 60 °C or lower. After digestion, the sample mass was adjusted to 20.0 g by adding distilled water before ICP-MS analysis. Quantification of tAs was conducted by an 8-point external calibration ranging from 0.5 to 50 µg kg−1. These standard samples were prepared in 2.5% nitric acid.

2.5. Determination of As Species

The methods for sample pre-treatment, extraction, separation and detection of As were performed by following a method of iAs analysis described in the Korean Food Standard Codex [30]. Approximately 0.2 g of each seaweed sample was weighed in a 50 mL polypropylene tube. Next, 5 mL of 1% (v/v) nitric acid was added to the samples and heated in the water bath for 90 min at 90 °C, and in the first 30 min, samples were vigorously shaken at 5 min intervals to promote the sufficient mixing of samples and nitric acid. The extracts were cooled at 25 °C and sample volumes were adjusted to 25 mL with distilled water. Diluted samples were centrifuged (Allegra X-15R, Beckman Coulter, CA, USA) for 10 min at 3000× g and the supernatants were collected. The supernatants were centrifuged again under the same conditions (10 min at 3000× g) and the supernatants collected after the second centrifugation were filtered through a 0.45 µm nylon membrane filter and analyzed as samples. Two inorganic As species and four organic As species were separated under an HPLC-ICP-MS with the C18 reversed phase column. For the mobile phase, 0.05% (v/v) methanol, 4 mM malonic acid, 10 mM sodium 1-butane sulfonate, and 4 mM tetramethylammonium hydroxide pentahydrate were used, and pH was adjusted to 2.7. The quantification of 6 As species was enabled by an 8-point external calibration ranging from 0.5 to 50 µg kg−1. A stock solution of each of the 6 As species was prepared by dissolving the chemical standards in ultrapure deionized water to a concentration of 600 mg kg−1. Stock solutions of standards were stored at 4 °C until analysis. Working solutions were prepared freshly for each analysis batch by mixing stock solutions of 6 As species standards, and diluting the mixed stock solution with 1% (v/v) nitric acid for analysis.

2.6. Validation

To reflect the characteristics of the matrix of different seaweeds, random samples of each seaweed group were selected, used in equal amounts, and homogenized for a representative sample. For the method validation, validity was proven through method limit of detection (MLOD), method limit of quantification (MLOQ), precision, and accuracy. The arsenic standard solution was used to augment the representative sample at 5 concentration levels (2.5, 5, 10, 25, and 50 µg kg−1), and then samples were pretreated with the same procedure as the tAs and As speciation analyses. This pretreatment and analysis of standard augmented samples were repeated 7 times to obtain 7 calibration curves for MLOD and MLOQ. The certified reference material NMIJ CRM 7405b Hijiki (National Metrology Institute of Japan, Ibaraki, Japan) was analyzed to verify accuracy and precision. The same amount of reference material was pretreated and analyzed in 7 iterations as an intraday test, which was repeated three times on different days.
For quality control, the certified reference material NMIJ CRM 7405b Hijiki was analyzed with every batch of seaweed samples for both tAs and As species measurements. External calibration standards for quantification were prepared daily from the standard stock solutions. The calibration was in the range of 0.5 to 50 µg kg−1 and analyzed with every batch for tAs and each As species.

2.7. Risk Assessment

Among 10 seaweed categories, a risk assessment was conducted on seaweed groups with higher intake or higher percentage of inorganic arsenic than other groups. To collect consumption data of seaweeds for the risk assessment of iAs, data from the Korea National Health and Nutrition Examination Survey (KNHNES) of 2016, published by the Korea Center for Disease Control and Prevention (KCDC), were used [31]. The KNHNES dietary data were estimated by a food intake frequency test and a 24 h dietary recall test on 7042 participants. Seaweed intake was calculated by dividing it into two groups: the first group was a general population group in which intake value was calculated for all people, regardless of seaweed intake, and the second group was a seaweed consumer group in which intake value was only calculated for people who consumed seaweed. Seaweed intake values obtained from this calculation were multiplied with the mean iAs concentration of each seaweed group.
The margin of exposure (MOE) was used for the risk assessment of iAs. The MOE calculation was based on the benchmark dose (BMDL0.1; 0.3–8 µg kg−1 day−1), estimated by the EFSA that can cause 1% increased risk of skin, lung, and bladder cancer, based on past epidemiologic research [12]. For risk assessment, BMDL0.1 of 0.3 µg kg−1 day−1 was used as a representative point which corresponds to the lower end of the BMDL01 value range. The average body weight (65.28 kg) of subjects was used for daily iAs intake calculation [32]. The formula used for risk assessment is as follows:
Daily   iAs   intake   =   Daily   consumption   ( g   day 1 )   ×   iAs   concentration   ( μ g   kg 1 ) Average   body   weight   ( kg )
MOE = BMDL EDI =   0.3   ( μ g   kg 1   day 1 ) Daily   iAs   intake   ( μ g   kg 1   day 1 )

2.8. Statistical Analysis

Statistical analyses for risk assessment in this study were performed using SAS software (Ver. 9.4; SAS Institute, Cary, NC, USA). All other statistical analyses were conducted using R statistical software (http://www.r-project.org/). K-means clustering analysis was used for grouping, and ten categories of seaweeds were grouped by the distribution pattern of tAs and iAs/tAs. To estimate the correlation of tAs and iAs for each seaweed species, we used correlation factor (r), and correlation analysis was performed through p-value at a 95% confidence level. Correlation factors (r) were calculated for each seaweed group, and the equation for obtaining the correlation factor is as follows:
Correlation   factor = cov ( x , y ) var ( x ) var ( y ) =     ( x i x ¯ ) ( y i y ¯ )   ( x i x ¯ ) 2 ( y i y ¯ ) 2
where, x and y represent the tAs and iAs concentration. The tAs and iAs values of each sample are expressed as xi and yi.

3. Results and Discussion

3.1. Validation Results of Analytical Methods

The linearity was measured in the calibration curve ranging from 0.5 to 50 µg kg−1 for total As and each of the six As species by the correlation coefficient (R2). R2 of total As and six As species was greater than 0.9998 in all results (Table 1). MLOD was calculated as 3.14 σ/S (σ is the standard deviation of the y-intercept, and S is the mean of the slope) and MLOQ was calculated as 10 σ/S. The MLOD for tAs was 0.55 µg kg−1 and the MLOD for arsenic speciation ranged from 0.38 to 0.77.
Among arsenic species, AsV values were used as representative results because the AsV content of the CRM used in this study was certified by the manufacturer. The accuracy was determined to be 99.0% and the precision was 5.1%. Based on these results, the analytical methods used in this research were found to be sufficiently robust for the analysis of As species in seaweed samples.

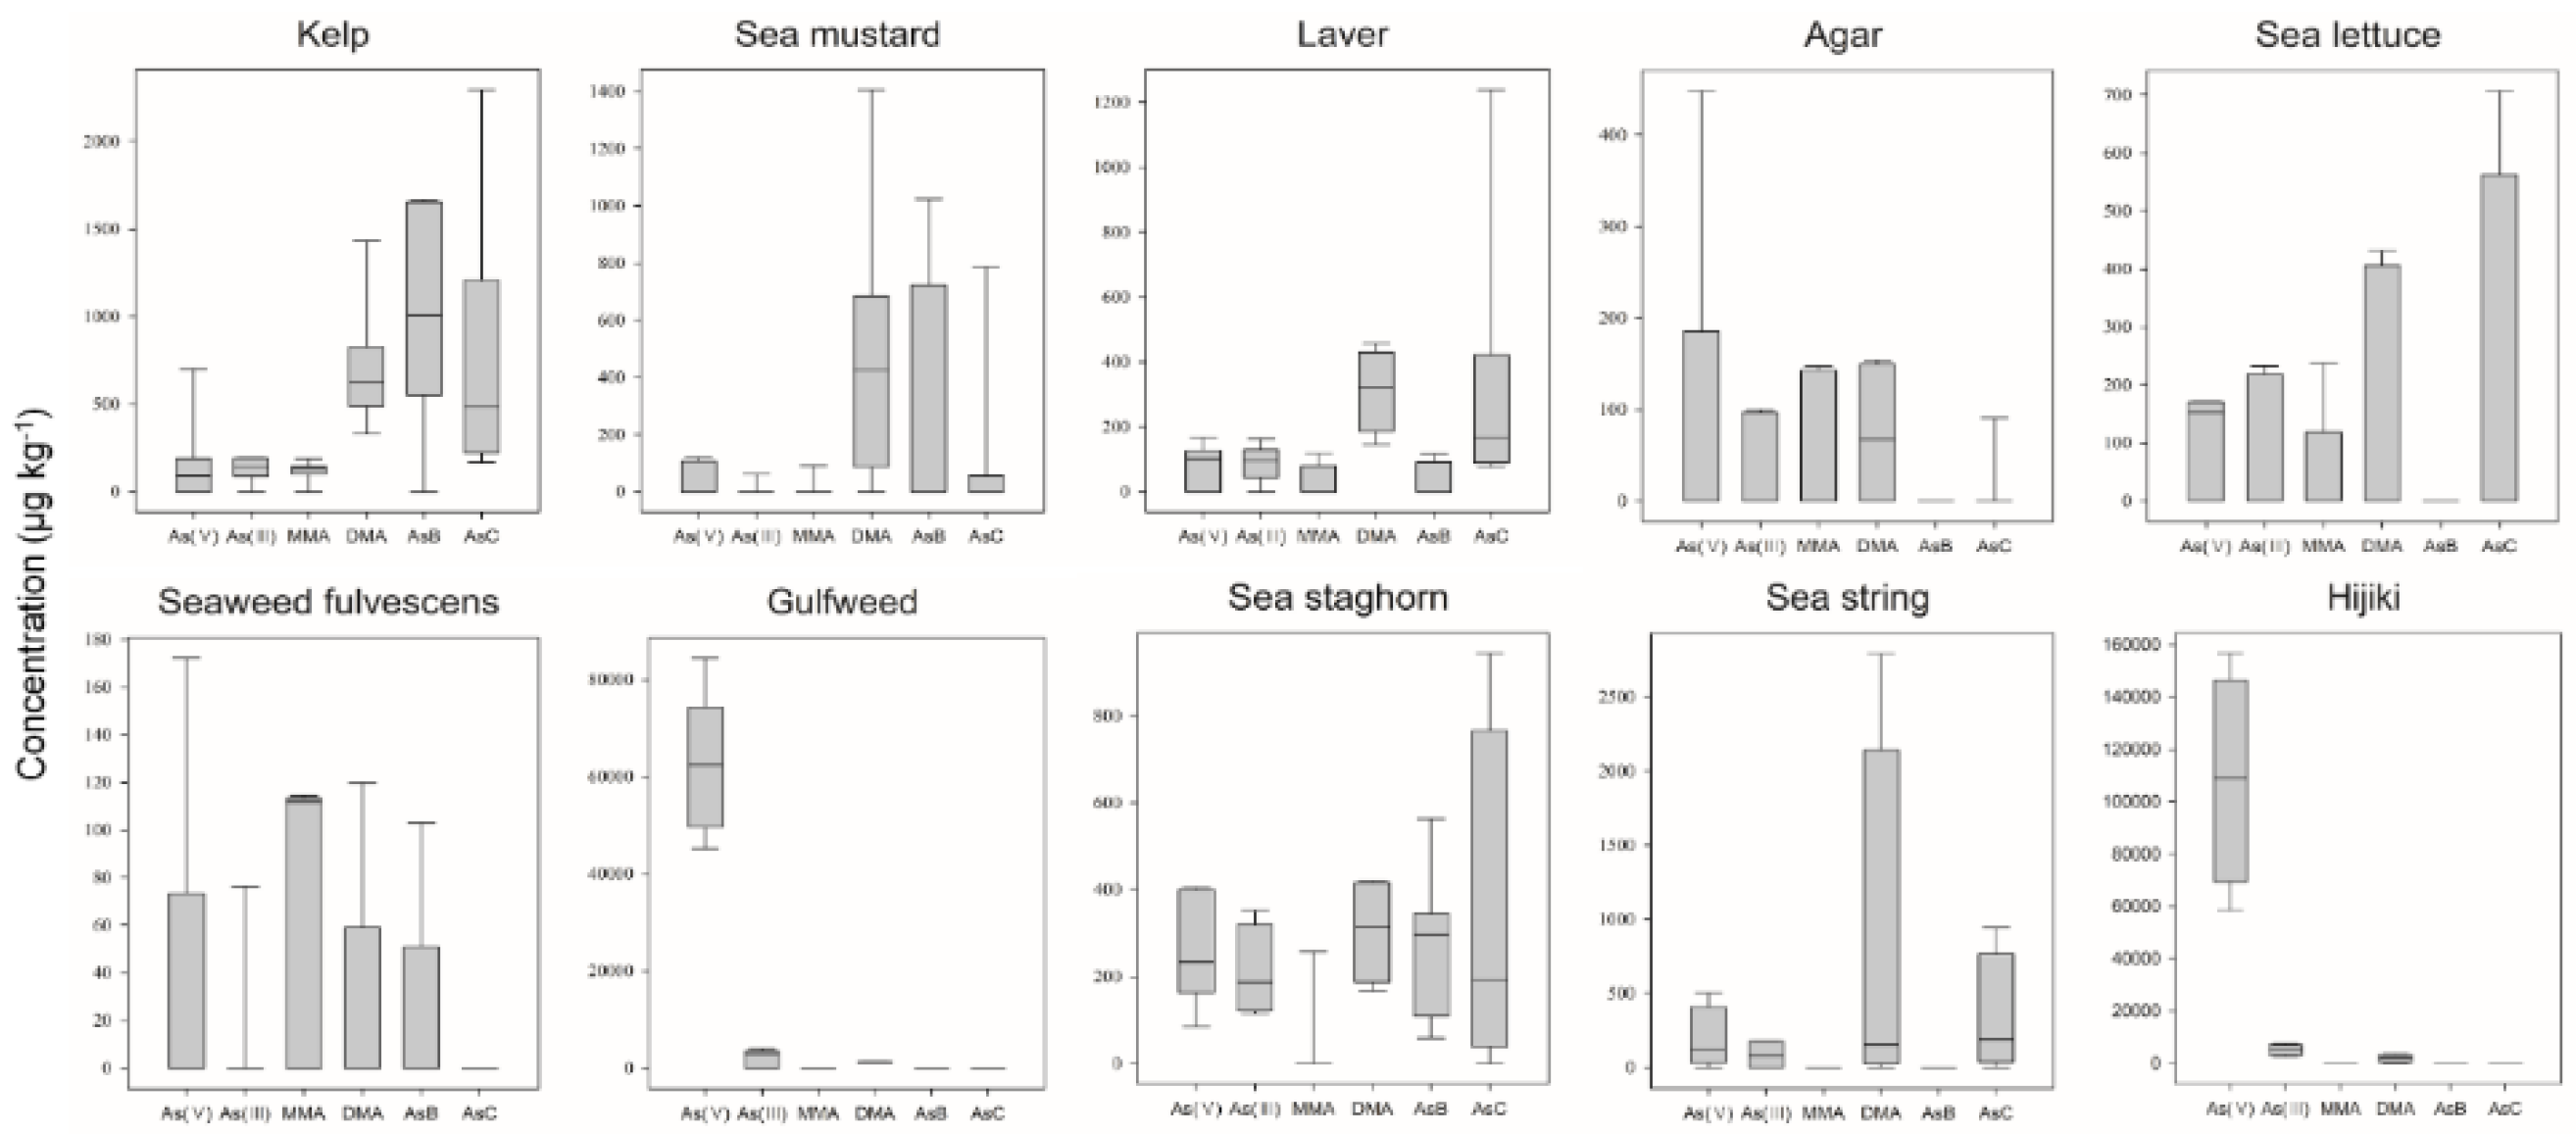
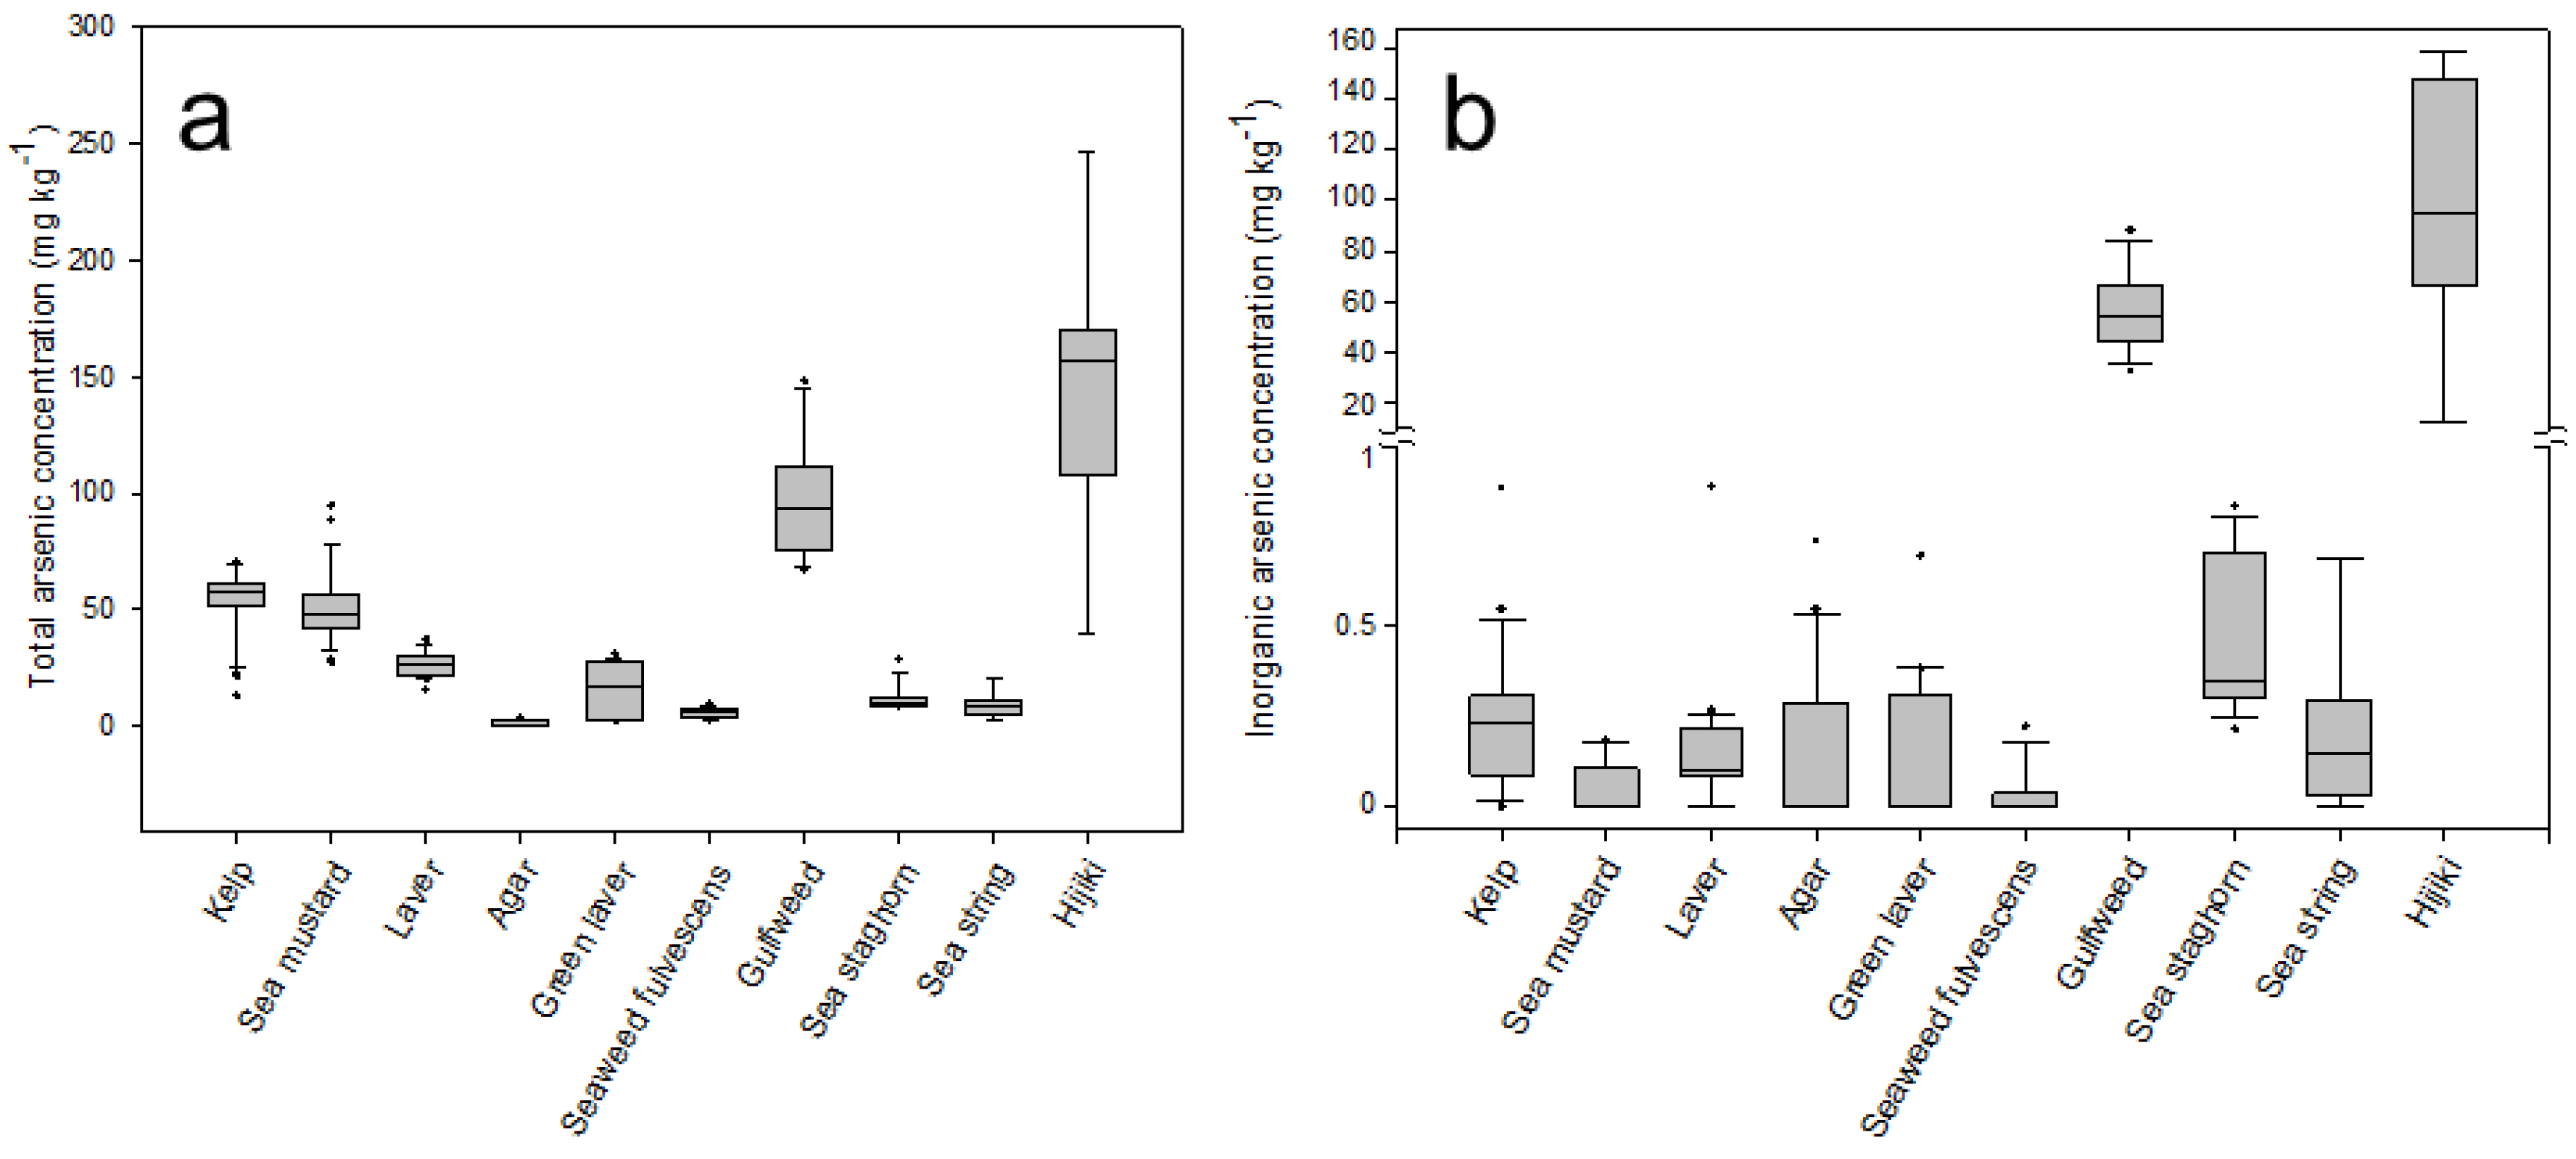
3.2. Determination of Total As and As Species in Seaweed

The analyzed results of tAs and the six As species in seaweed samples are represented in Table 2. Concentrations of tAs and the six As species in the ten categories of seaweeds were found to be variable depending on the sample origins. It should be noted that other As species of methylated arsenicals, methylated thioarsenicals, arsenosugars, and arsenolipids in the present study were not measured due to lack of standards of these organoarsenicals. Arsenosugars and arsenolipids also exist in seafood and algae, and these organoarsenics could be more harmful than previously thought, although the lack of these organoarsenical characteristics is a progressive challenge [8].
Average tAs concentrations of the 10 categories of 180 seaweed samples (kelp, sea mustard, laver, agar, sea lettuce, seaweed fulvescens, gulfweed, sea staghorn, sea string, hijiki) ranged from 1.3 ± 1.5 mg kg−1 in agar to 145 ± 61 mg kg−1 in hijiki. Arsenic was detected in all seaweed samples except for approximately half of the agar samples. The lowest levels of tAs were detected in agar samples in the range of <LOD to 3.2 mg kg−1, and tAs was detected in only 45% of the agar samples analyzed. In seaweed fulvescens, tAs was detected in all samples, but arsenic concentrations were lower than other seaweed samples, except the agar samples, ranging from 3.07 to 9.18 mg kg−1. The next lowest tAs levels were found in sea staghorn (8.37–28.9 mg kg−1) and sea string (3.28–20.0 mg kg−1), and were found to contain a similar mean concentration of around 10 mg kg−1. Slightly higher concentrations were measured in sea lettuce (2.18–31.2 mg kg−1) and laver (15.9–37.8 mg kg−1) than in the above groups. Kelp and sea mustard were found to have an average concentration of 50 mg kg−1 of total arsenic, somewhat higher than that of the other seaweed groups. Kelp, with tAs ranging from 13.1 to 70.8 mgkg−1, and sea mustard, with tAs ranging from 27.2 to 95.0 mg kg−1, showed a wider range than the previously discussed seaweed groups. Finally, two groups, gulfweed and hijiki, were found to contain relatively high As concentrations of around 100 mg kg−1 or higher. The tAs concentrations in gulfweed ranged from 67.8 to 148 mg kg−1, and tAs concentrations in hijiki ranged from 39.43 to 246.45 mg kg−1.The tAs concentrations for gulfweed and hijiki were similarly reported at levels greater than 100 mg kg−1 in other studies [17,23,25]. More than 100 mg kg−1 of arsenic was detected in approximately half of the gulfweed samples, and all of the hijiki samples except one. While the levels of arsenic differ considerably depending on the species of seaweed, the general ability of seaweed to concentrate arsenic derived from seawater was previously described, and explains the comparatively high levels observed in certain types of seaweed [33]. In the current study, the four species with the highest tAs concentrations are brown algae species. Some specialized cell wall components, such as fucoidan and alginate with binding groups, such as OH, COO, NO3−, and PO43−, which are known to be associated with high metal-chelating capacity, might lead to an increased concentration of As in brown algae species [34,35].
The concentrations of six As species (AsV, AsIII, MMA, DMA, AsB, and AsC) in 10 categories of seaweed differed from the tAs results. The concentration ranking and appearance pattern of six As species were different for each seaweed category (Figure 1). Overall, MMA was not detected in most of the samples, or were detected at very low concentrations. In contrast, AsV and DMA were more prominent than other arsenic species in most samples. AsB was not detected in all samples of agar, gulfweed and hijiki groups, but in the kelp group, AsB concentration was the highest among six arsenic species. AsC was not detected in any of the samples of gulfweed or hijiki, or any of the seaweed fulvescens samples except one. However, AsC was detected in most laver and kelp samples, and the highest concentrations among six arsenic species were found in the laver and sea lettuce groups.
Regarding the highly toxic inorganic arsenic species AsIII and AsV, the sum of the two arsenic species was detected at average concentrations below 0.5 mg kg−1, in all seaweed categories analyzed except gulfweed and hijiki. The mean concentrations of iAs in gulfweed and hijiki were 55.7 ± 15.7 mg kg−1 and 97.2 ± 49.7 mg kg−1, respectively (Figure 2). These detected concentrations of iAs were at least 100 to 3000 times higher than other seaweed species. The iAs concentration of the sample with the lowest arsenic concentration in the above two groups was 12.62 mg kg−1, which was more than 8 times higher than the highest sample among the other 8 seaweed categories. Although the reason for the high iAs concentrations in some types of seaweed is not clear, seaweed is known to store arsenic byproducts resulting from the detoxification pathway that converts iAs to arsenosugar [36]. Furthermore, the accumulation rate of arsenic varies depending on the growth rate and location of the seaweed, and the degree of accumulation may vary depending on whether arsenic can be easily transferred between tissues [37]. In this experiment, both hijiki and gulfweed with high concentrations of iAs were identified as members of the Sargassum genus. It has been suggested that high iAs concentrations in Sargassum may be due to energy constraints limiting their efficiency in completing As conversion or lack of genetic capability of detoxifying iAs species [22].
The results of these analyses are similar to those that were previously reported in other studies that evaluated similar categories of seaweed to those analyzed in this experiment (Table 3). The seaweed categories, which were reported by their scientific names in other studies, were grouped by their common names in this experiment according to the defined categories. Although there was variation in As content between samples within each group, it was found that tAs and iAs accumulation trends were similar. In other studies that analyzed samples from New England, Spain, Japan, Korea, and China, tAs concentrations of kelp and sea mustard were reported at around 50 mg kg−1, and iAs concentrations were below 1 mg kg−1, similar to the results of this study. Approximately 20 mg kg−1 and below 10 mg kg−1 of tAs were detected in laver and sea lettuce, respectively, and around 0.2 mg kg−1 of iAs was detected in both groups, which was also similar to the results of this study [17,23,38]. The results of the current study were also similar to those found in other studies that reported tAs in gulfweed and hijiki over 100 mg kg−1 and iAs around 70 mg kg−1 [17,25].

3.3. Correlation Analysis between Total Arsenic and Inorganic Arsenic

The correlation between the two was tested, based on the results of tAs and iAs analysis. In order to estimate the correlation of tAs and iAs for each seaweed species, we calculated the correlation factor (r) for the concentration of tAs and iAs of each seaweed group using the Equation (3) shown in Section 2.8, and compared these values by Student’s t-test through p-value at a 95% confidence level. The hijiki group was the only group with a p-value less than the significance threshold p = 0.05 (95% confidence level). Thus, it was concluded that there was no significant correlation between tAs and iAs in any of the seaweed groups except for hijiki. Therefore, in seaweed, the estimation of iAs is not an accurate predictor of tAs, and vice versa; arsenic speciation analysis is needed to more accurately determine levels of iAs.

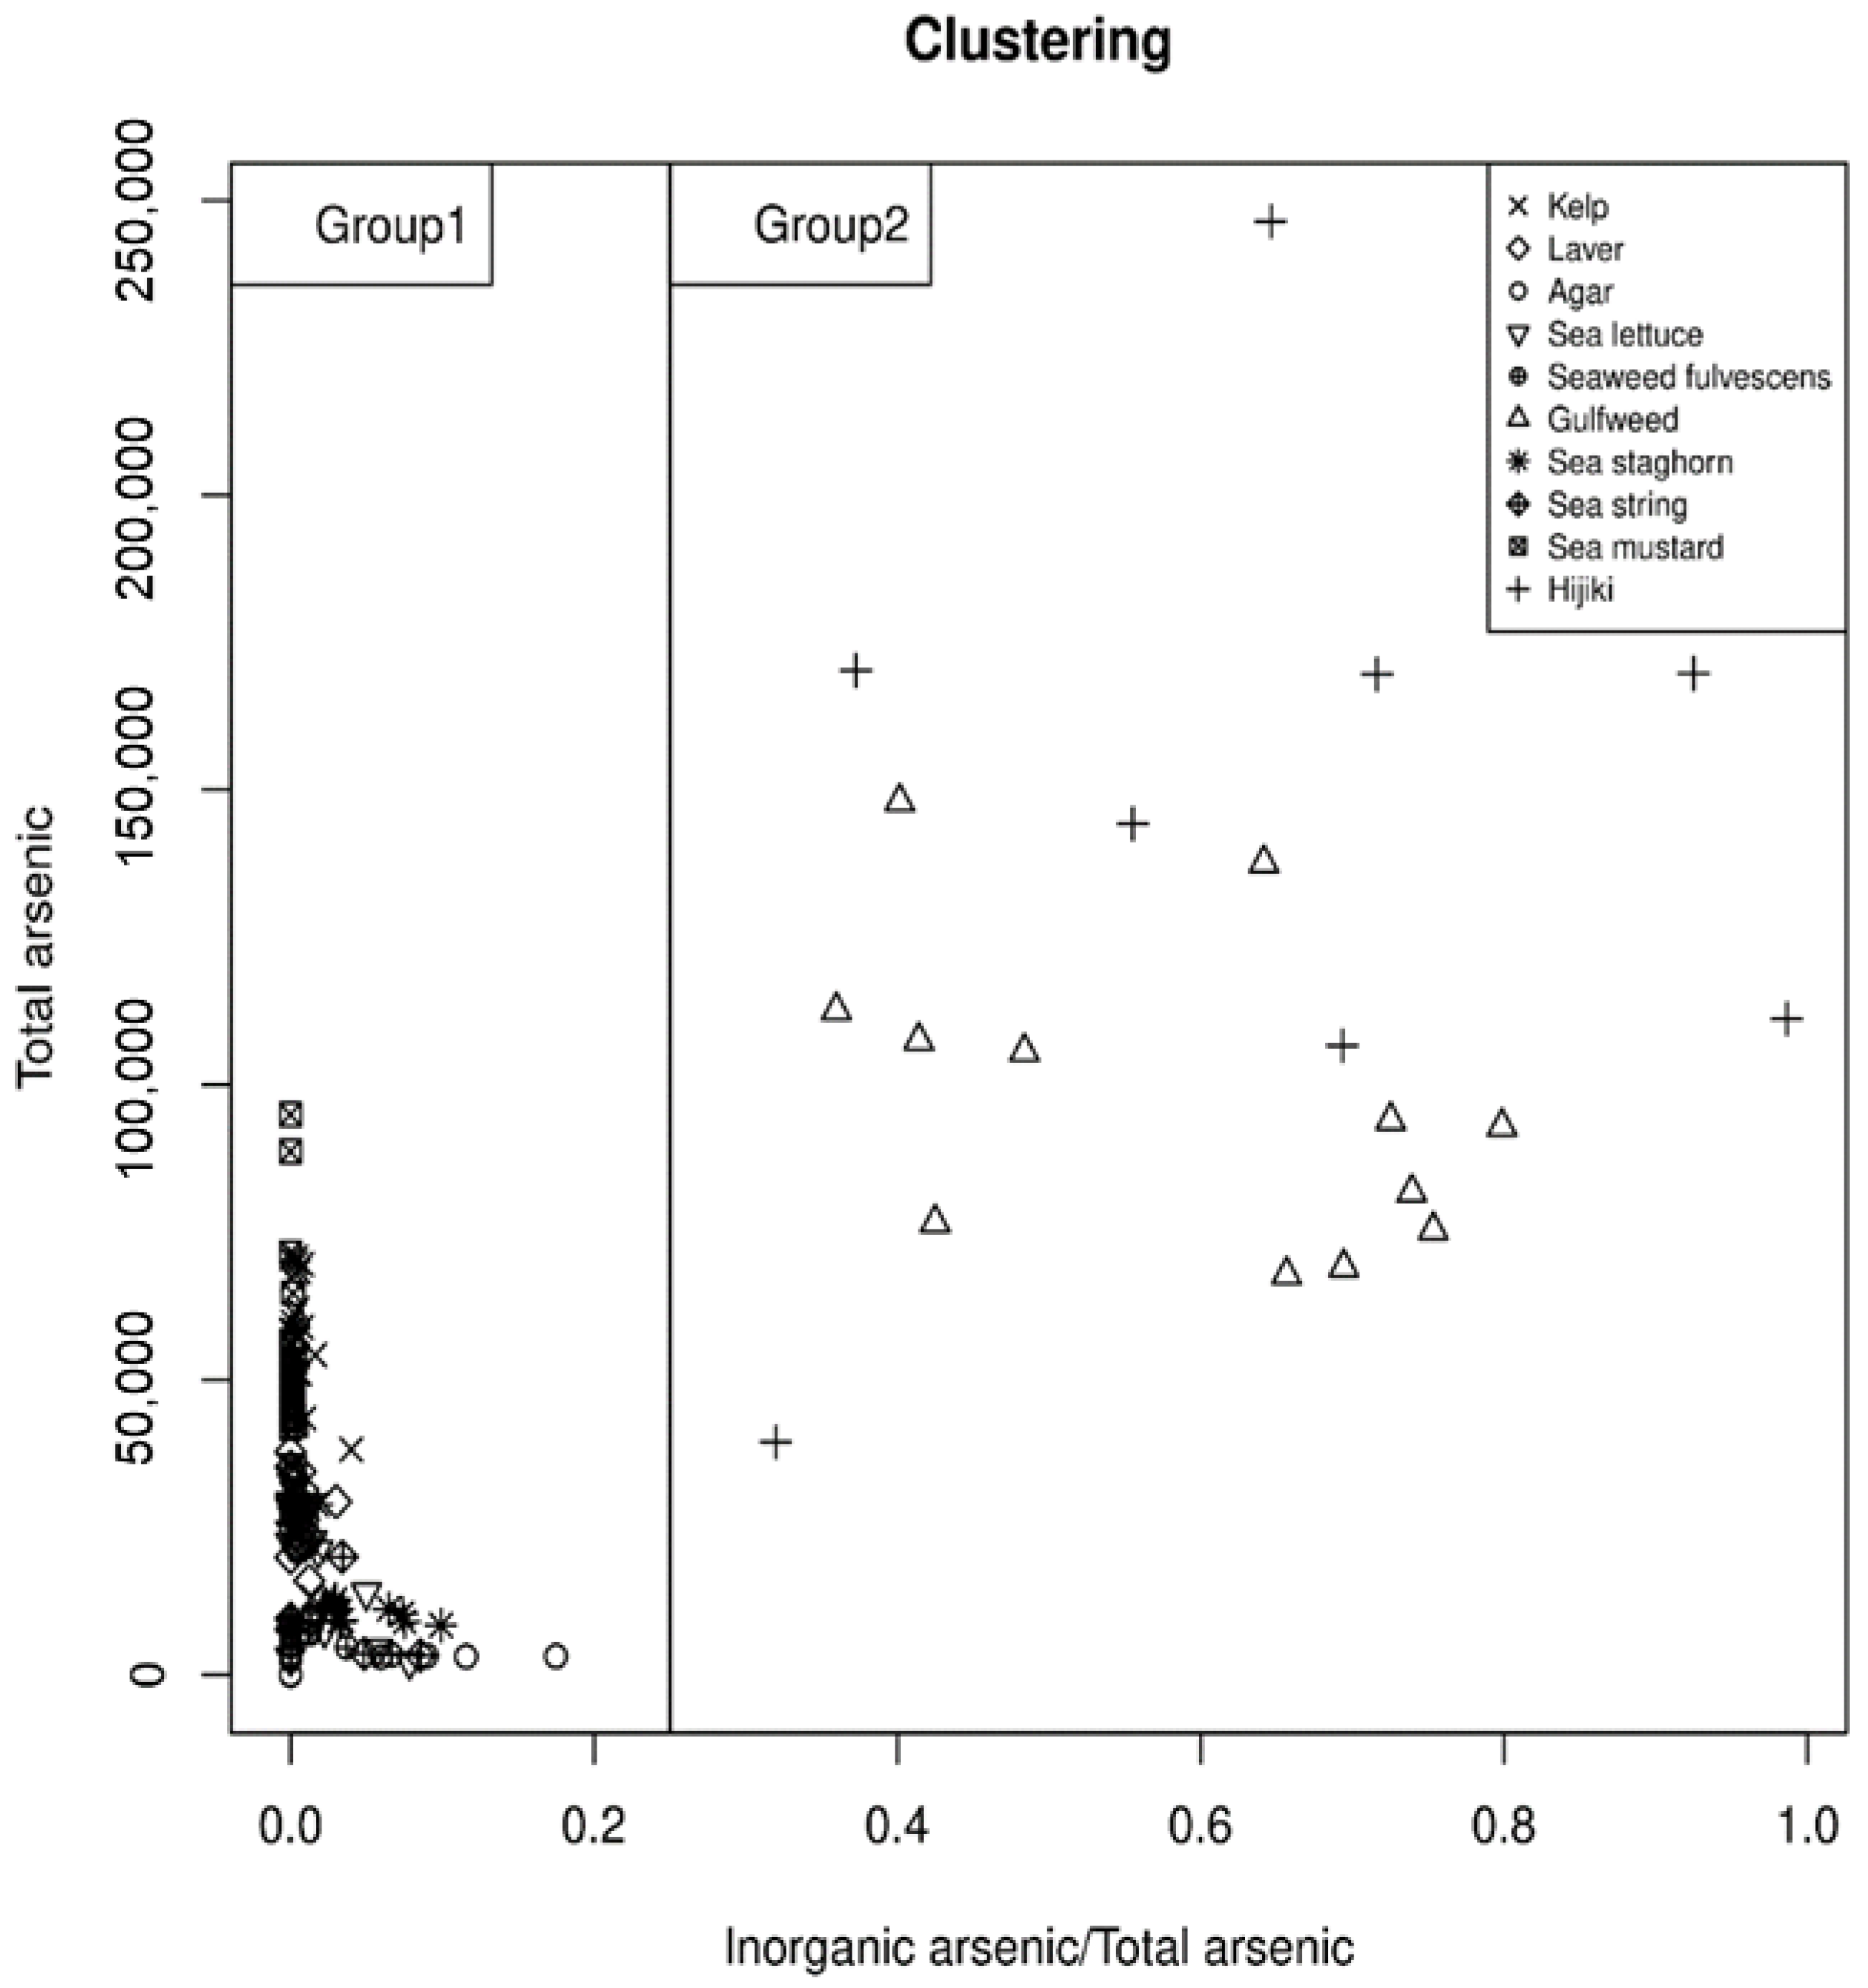
3.4. Clustering Analysis for Grouping

Because arsenic species concentrations appeared to differ by seaweed category, statistical clustering analysis was performed to group categories with similar appearance patterns (Figure 3). The k-means clustering analysis was performed using the tAs concentrations and iAs to tAs ratios of each sample as factors. As a result, hijiki and gulfweed, which were both characterized by high iAs:tAs ratios, were grouped together, and the other 8 seaweed categories comprised a second group. Hijiki and gulfweed also showed higher overall iAs concentrations compared to other seaweeds analyzed.

3.5. Risk Assessment

Daily seaweed intake and dietary exposure of iAs arsenic for two different groups (general and seaweed consumer groups) are shown in Table 4. Estimated daily consumption data for each seaweed group were derived from KNHNES 2016. Among the 10 seaweed categories analyzed in this experiment, three species of seaweed with higher daily consumption rates than other seaweeds (kelp, sea mustard, laver) and two species of seaweed with a high ratio of harmful iAs as determined by the clustering analysis (gulfweed and hijiki) were assessed for risk.
The MOE method approach was used to assess the carcinogenic risks associated with the consumption of seaweeds. The MOE calculations yielded values greater than 104 for the intake of all seaweed species in negligible risk [39]; we determined that there is no significant risk to the general population with regard to iAs intake by seaweed. The seaweed consumer group, which contained only those who consumed seaweed, showed a value greater than 104 for kelp, sea mustard, and laver, indicating no significant risk. However, for gulfweed and hijiki, values below 103 were calculated as MOE values for the general group, because the guidelines consider values above 103 of between 102 and 103 to reflect “no-to-low” risk levels [39]. Although MOE values for these categories in the seaweed consumer group indicated a higher associated risk in comparison to the general group, it is unlikely that the arsenic levels would pose a meaningful risk when seaweeds are consumed in normal quantities; however, it may be advisable to avoid an overconsumption of gulfweed or hijiki by consumers with higher-than-average seaweed intake, such as those living on islands or in coastal regions. Similar research in Japan, where hijiki is used more frequently for food, reported that Sargassum seaweed generally contained high amounts of iAs and recommended handling these species with caution [40]. Moreover, since AsIII ’s toxicity is more toxic than that of AsV [8], separate iAs speciation with different toxicity can be considered in the risk assessment, whereas the current MOE for health risk of iAs is based on EFSA’s BMDL0.1 of 0.3 µg kg−1 day−1 and does not evaluate AsIII and AsV separately.

4. Conclusions

The distribution of arsenic species and the ratio of harmful inorganic arsenic to total arsenic differ between seaweed species. It would therefore be important to analyze As species as well as tAs in order to carry out an objective risk evaluation of consuming any given species of seaweed in which the As species could be one of the factors when assessing the dietary risk of arsenic. According to the results of the risk assessment for South Koreans, all seaweeds are generally safe for consumption in standard quantities, but those who consume above average levels of seaweed should be cautious about overconsuming hijiki and gulfweed. The risk assessment did not take into account the cleaning, cooking, and human uptake rate of seaweed nutrients, which may have resulted in an overestimated risk. With the recent trends of increasing seaweed consumption around the world, the findings of this study will establish a basis for dietary arsenic risk assessment in other seaweed-consuming regions of the world.

Supplementary Materials

The following are available online at https://0-www-mdpi-com.brum.beds.ac.uk/2076-3298/7/9/68/s1, Figure S1: Map of sampling cities on the south coast of Korea, Table S1: Target compounds, structure, and molecular weight, Table S2: Instrumental operating conditions of HPLC and ICP-MS for arsenic determination.

Author Contributions

Conceptualization, M.-h.K. and K.-W.L.; methodology, M.-h.K. and S.C.; software, J.K. and M.-h.K.; validation, M.-h.K. and S.C.; formal analysis, M.-h.K.; investigation, M.-h.K., S.C. and C.-H.N.; resources, M.-h.K.; data curation, M.-h.K.; writing—original draft preparation, M.-h.K.; writing—review and editing, K.-W.L.; visualization, M.-h.K.; supervision, K.-W.L. and Y.-S.J.; project administration, K.-W.L. All authors have read and agreed to the published version of the manuscript.

Funding

This research was supported by a grant (15162MFDS077) from the Ministry of Food and Drug Safety (15162MFDS077), Korea University Grant (K1922591), and the School of Life Sciences & Biotechnology of Korea University for BK21 PLUS.

Acknowledgments

The authors thank the Institute of Biomedical Science & Food Safety, CJ-Korea University Food Safety Hall (Seoul, Korea) for providing the equipment and facilities.

Conflicts of Interest

The authors declare no conflict of interest.

References

  1. Devesa, V.; Martinez, A.; Suner, M.; Benito, V.; Vélez, D.; Montoro, R. Kinetic study of transformations of arsenic species during heat treatment. J. Agric. Food Chem. 2001, 49, 2267–2271. [Google Scholar] [CrossRef] [PubMed]
  2. Zwolak, I. The role of selenium in arsenic and Cadmium toxicity: An updated review of scientific literature. Biol. Trace Elem. Res. 2020, 193, 44–63. [Google Scholar] [CrossRef] [Green Version]
  3. Styblo, M.; Del Razo, L.M.; Vega, L.; Germolec, D.R.; LeCluyse, E.L.; Hamilton, G.A.; Reed, W.; Wang, C.; Cullen, W.R.; Thomas, D.J. Comparative toxicity of trivalent and pentavalent inorganic and methylated arsenicals in rat and human cells. Arch. Toxicol. 2000, 74, 289–299. [Google Scholar] [CrossRef] [PubMed]
  4. Cohen, S.M.; Arnold, L.L.; Beck, B.D.; Lewis, A.S.; Eldan, M. Evaluation of the carcinogenicity of inorganic arsenic. Crit. Rev. Toxicol. 2013, 43, 711–752. [Google Scholar] [CrossRef] [PubMed]
  5. Tseng, W.; Chu, H.M.; How, S.; Fong, J.; Lin, C.; Yeh, S. Prevalence of skin cancer in an endemic area of chronic arsenicism in Taiwan. J. Natl. Cancer Inst. 1968, 40, 453–463. [Google Scholar]
  6. IARC. Overall Evaluations of Carcinogenicity: An Updating of IARC Monographs Volumes 1 to 42; IARC: Lyon, France, 1987. [Google Scholar]
  7. Rousseau, M.-C.; Straif, K.; Siemiatycki, J. IARC carcinogen update. Environ. Health Perspect. 2005, 113, A580–A581. [Google Scholar] [CrossRef] [PubMed]
  8. Kim, Y.T.; Lee, H.; Yoon, H.O.; Woo, N.C. Kinetics of dimethylated thioarsenicals and the formation of highly toxic dimethylmonothioarsinic acid in environment. Environ. Sci. Technol. 2016, 50, 11637–11645. [Google Scholar] [CrossRef] [PubMed]
  9. Luvonga, C.; Rimmer, C.A.; Yu, L.L.; Lee, S.B. Organoarsenicals in Seafood: Occurrence, Dietary Exposure, Toxicity, and Risk Assessment Considerations—A Review. J. Agric. Food Chem. 2020, 68, 943–960. [Google Scholar] [CrossRef]
  10. IARC. A Review of Human Carcinogens: Arsenic, Metals, Fibres, and Dusts; IARC: Lyon, France, 2012; Volume 100C. [Google Scholar]
  11. Cubadda, F.; Jackson, B.P.; Cottingham, K.L.; Van Horne, Y.O.; Kurzius-Spencer, M. Human exposure to dietary inorganic arsenic and other arsenic species: State of knowledge, gaps and uncertainties. Sci. Total Environ. 2017, 579, 1228–1239. [Google Scholar] [CrossRef] [Green Version]
  12. Alexander, J.; Benford, D.; Boobis, A.; Ceccatelli, S.; Cravedi, J.-P.; Di Domenico, A.; Doerge, D.; Dogliotti, E.; Edler, L.; Farmer, P. Scientific Opinion on Arsenic in Food EFSA Panel on Contaminants in the Food Chain (CONTAM). EFSA J. 2009, 7, 1–198. [Google Scholar]
  13. Joint FAO/WHO Expert Committee on Food Additives; Weed Control in Organic Farming; World Health Organization. Safety Evaluation of Certain Contaminants in Food; World Health Organization: Geneva, Switzerland, 2006; pp. 1–753. [Google Scholar]
  14. Chung, I.K.; Beardall, J.; Mehta, S.; Sahoo, D.; Stojkovic, S. Using marine macroalgae for carbon sequestration: A critical appraisal. J. Appl. Phycol. 2011, 23, 877–886. [Google Scholar] [CrossRef]
  15. Rupérez, P. Mineral content of edible marine seaweeds. Food Chem. 2002, 79, 23–26. [Google Scholar] [CrossRef]
  16. Hwang, Y.; Park, S.; Park, G.; Choi, S.; Kim, M. Total arsenic, mercury, lead, and cadmium contents in edible dried seaweed in Korea. Food Addit. Contam. Part B 2010, 3, 7–13. [Google Scholar] [CrossRef] [PubMed]
  17. Cherry, P.; O’Hara, C.; Magee, P.J.; McSorley, E.M.; Allsopp, P.J. Risks and benefits of consuming edible seaweeds. Nutr. Rev. 2019, 77, 307–329. [Google Scholar] [CrossRef] [Green Version]
  18. Hsieh, Y.-J.; Jiang, S.-J. Application of HPLC-ICP-MS and HPLC-ESI-MS procedures for arsenic speciation in seaweeds. J. Agric. Food Chem. 2012, 60, 2083–2089. [Google Scholar] [CrossRef]
  19. Maher, W.A. Inorganic Arsenic in Marine Organisms. Mar. Pollut. Bull. 1983, 14, 308–310. [Google Scholar] [CrossRef]
  20. Shibata, Y.; Sekiguchi, M.; Otsuki, A.; Morita, M. Arsenic Compounds in Zoo-and Phyto-plankton of Marine Origin. Appl. Organomet. Chem. 1996, 10, 713–719. [Google Scholar] [CrossRef]
  21. Hirata, S.; Toshimitsu, H. Determination of arsenic species and arsenosugars in marine samples by HPLC–ICP–MS. Anal. Bioanal. Chem. 2005, 383, 454–460. [Google Scholar] [CrossRef]
  22. Rose, M.; Lewis, J.; Langford, N.; Baxter, M.; Origgi, S.; Barber, M.; MacBain, H.; Thomas, K. Arsenic in seaweed—Forms, concentration and dietary exposure. Food Chem. Toxicol. 2007, 45, 1263–1267. [Google Scholar] [CrossRef]
  23. Taylor, V.F.; Jackson, B.P. Concentrations and speciation of arsenic in New England seaweed species harvested for food and agriculture. Chemosphere 2016, 163, 6–13. [Google Scholar] [CrossRef] [Green Version]
  24. Almela, C.; Clemente, M.J.; Vélez, D.; Montoro, R. Total arsenic, inorganic arsenic, lead and cadmium contents in edible seaweed sold in Spain. Food Chem. Toxicol. 2006, 44, 1901–1908. [Google Scholar] [CrossRef] [PubMed]
  25. Llorente-Mirandes, T.; Ruiz-Chancho, M.J.; Barbero, M.; Rubio, R.; López-Sánchez, J.F. Determination of water-soluble arsenic compounds in commercial edible seaweed by LC-ICPMS. J. Agric. Food Chem. 2011, 59, 12963–12968. [Google Scholar] [CrossRef] [PubMed]
  26. MOF. Fisheries Statistics on the Sale of Marine Products 2017. Available online: https://www.fips.go.kr/p/S020601/ (accessed on 5 November 2019).
  27. KHIDI. National Nutrition Statistics 2015. Available online: https://www.khidi.or.kr/kps/dhraStat/intro?menuId=MENU01650&year=2015#sub04 (accessed on 5 November 2019).
  28. Lee, S.G.; Lee, Y.S.; Cho, S.-Y.; Chung, M.-S.; Cho, M.; Kang, Y.; Kim, H.; Kim, D.; Lee, K.-W. Monitoring of arsenic contents in domestic rice and human risk assessment for daily intake of inorganic arsenic in Korea. J. Food Compost. Anal. 2018, 69, 25–32. [Google Scholar] [CrossRef]
  29. MFDS. Korean Food Standard Codex Working Manual on Heavy Metals Analysis. Available online: http://www.foodsafetykorea.go.kr/foodcode/01_03.jsp?idx=12042 (accessed on 5 November 2019).
  30. MFDS. Manual for Testing Inorganic Arsenic in Food; MFDS: Chungcheongbuk-do, Korea, 2018; pp. 1–39. [Google Scholar]
  31. KCDC. The seventh Korea National Health and Nutrition Examination Survey (KNHA NES VII-1); Korea Centers for Disease Control and Prevention: Sejong, Korea, 2018. [Google Scholar]
  32. NHIS. Health Examination Statistics. Available online: http://kosis.kr/statHtml/statHtml.do?orgId=350&tblId=DT_35007_N132&vw_cd=MT_ZTITLE&list_id=350_35007_A007&seqNo=&lang_mode=ko&language=kor&obj_var_id=&itm_id=&conn_path=MT_ZTITLE (accessed on 5 November 2019).
  33. Norman, J.; Pickford, C.; Sanders, T.; Waller, M. Human intake of arsenic and iodine from seaweed-based food supplements and health foods available in the UK. Food Addit. Contam. 1988, 5, 103–109. [Google Scholar] [CrossRef] [PubMed]
  34. Ghimire, K.N.; Inoue, K.; Ohto, K.; Hayashida, T. Adsorption study of metal ions onto crosslinked seaweed Laminaria japonica. Bioresour. Technol. 2008, 99, 32–37. [Google Scholar] [CrossRef]
  35. Bilal, M.; Rasheed, T.; Sosa-Hernández, J.E.; Raza, A.; Nabeel, F.; Iqbal, H. Biosorption: An interplay between marine algae and potentially toxic elements—A review. Mar. Drugs 2018, 16, 65. [Google Scholar] [CrossRef] [Green Version]
  36. Caumette, G.; Koch, I.; Reimer, K. Arsenobetaine formation in plankton: A review of studies at the base of the aquatic food chain. J. Environ. Monit. 2012, 14, 2841–2853. [Google Scholar] [CrossRef]
  37. Katayama, M.; Sugawa-Katayama, Y.; Murakami, K. Do the tissue concentrations of accumulated arsenic, calcium, iron, magnesium, manganese, potassium and zinc become niform throughout the Hijiki plant body with growth. Trace Nutr. Res. 2014, 31, 51–58. [Google Scholar]
  38. McSheehy, S.; Pohl, P.; Vélez, D.; Szpunar, J. Multidimensional liquid chromatography with parallel ICP MS and electrospray MS/MS detection as a tool for the characterization of arsenic species in algae. Anal. Bioanal. Chem. 2002, 372, 457–466. [Google Scholar] [CrossRef]
  39. Sand, S.; Bjerselius, R.; Busk, L.; Eneroth, H.; Färnstrand, J.S.; Lindqvist, R. The Risk Thermometer—A Tool for Risk Comparison. National Food Agency (Livsmedelsverket) Home Page. Available online: https://www.Livsmedelsverket.se/globalassets/rapportter/2015/the-risk-thermometer.pdfRapport (accessed on 9 November 2019).
  40. Yokoi, K.; Konomi, A. Toxicity of so-called edible hijiki seaweed (Sargassum fusiforme) containing inorganic arsenic. Regul. Toxicol. Pharmacol. 2012, 63, 291–297. [Google Scholar] [CrossRef]
Figure 1. Boxplots of the distribution of 6 arsenic species in each seaweed species. Distribution of six arsenic species in kelp (n = 32), sea mustard (n = 25), laver (n = 25), agar (n = 20), sea lettuce (n = 20), seaweed fulvescens (n = 17), gulfweed (n = 12), sea staghorn (n = 13), sea string (n = 8), and hijiki (n = 8).
Environments 07 00068 g001
Figure 2. Boxplots of total and inorganic arsenic in seaweeds. Box and whiskers plot with central lines (median), box (first and third quartiles), whiskers (lower and higher boundaries), and dots (outliers) for total arsenic (tAs) (a) and inorganic arsenic (iAs) (b) levels in various types of seaweed analyzed in this experiment, three species of seaweed with higher daily consumption rates than other seaweeds (kelp, sea mustard, laver), and two species of seaweed with a high ratio of harmful iAs, as determined by the clustering analysis (gulfweed and hijiki) were assessed for risk. The small symbols represent outlier points in the figure.
Environments 07 00068 g002
Figure 3. K-means clustering analysis according to the tAs and iAs/tAs distribution pattern of each seaweed group.
Environments 07 00068 g003
Table 1. Analytical performance of arsenic species in representative samples of seaweed collected from Korean markets.
Method Detection LimitInterday Precision and Recovery
Arsenic Species 1R2LOD 2 (µg kg−1)LOQ 3 (µg kg−1)RSD 4 (%)Rec 5 (%)
tAs0.99990.5471.742.2103.6
As0.99990.7732.465.199
As0.99980.4031.28
MMA0.99990.5931.89
DMA0.99990.6221.98
AsB0.99990.5351.70
AsC0.99990.3841.22
1 tAs, total arsenic; AsV, arsenate; AsIII, arsenite; MMA, monomethylarsonic acid; DMA, dimethylarsinic acid; AsB, arsenobetaine; AsC, arsenocholine; 2 LOD refers to the limit of detection, S/σ = 3.14; 3 LOQ refers to the limit of quantification, S/σ = 10; 4 RSD: relative standard deviation, (standard deviation/mean × 100); 5 Rec: recovery, (mean measured concentration/CRM nominal concentration) × 100 µg kg−1. For total arsenic, the obtained accuracy result was 103.6% and the precision result was 2.2%.
Table 2. Concentrations and detection frequency of arsenic species in seaweeds.
Seaweed Categories (n) 1tAs (mg kg−1)Concentration of each Arsenic Species (mg kg−1)
AsVAsIIIMMADMAAsBAsC
Kelp53.6 ± 14.6 20.163 ± 0.2560.103 ± 0.0800.113 ± 0.0470.636 ± 0.2850.834 ± 0.6920.466 ± 0.507
(n = 32)(100) 3(69)(72)(91)(97)(75)(94)
Sea mustard51.0 ± 15.8 0.036 ± 0.0540.010 ± 0.0230.011 ± 0.0300.316 ± 0.3020.179 ± 0.3640.060 ± 0.160
(n = 25)(100)(32)(16)(12)(96)(40)(40)
Laver26.9 ± 5.30.064 ± 0.1310.094 ± 0.0610.046 ± 0.0520.299 ± 0.1330.034 ± 0.0480.702 ± 1.518
(n = 25)(100)(36)(84)(48)(100)(36)(100)
Agar1.34 ± 1.530.109 ± 0.1820.025 ± 0.0440.037 ± 0.0650.083 ± 0.111<LOD0.025 ± 1.035
(n = 20)(45)(35)(25)(25)(50)(0)(20)
Sea lettuce15.6 ± 11.80.085 ± 0.1250.056 ± 0.0920.036 ± 0.0800.103 ± 0.1570.006 ± 0.0260.214 ± 0.282
(n = 20)(100)(45)(30)(20)(40)(5)(40)
Seaweed fulvescens5.54 ± 2.000.019 ± 0.0530.014 ± 0.0320.066 ± 0.0570.035 ± 0.0560.024 ± 0.0450.004 ± 0.018
(n = 17)(100)(12)(18)(59)(30)(24)(6)
Gulfweed97.4 ± 26.053.6 ± 14.82.09 ± 1.57<LOD 41.45 ± 0.82<LOD <LOD
(n = 12)(100)(100)(75)(0)(100)(0)(0)
Sea staghorn11.8 ± 5.30.258 ± 0.1150.201 ± 0.1030.020 ± 0.0710.282 ± 0.1200.232 ± 0.1350.414 ± 1.32
(n = 13)(100)(100)(100)(8)(100)(100)(46)
Sea string9.15 ± 5.200.144 ± 0.1580.066 ± 0.091<LOD0.509 ± 0.9540.029 ± 0.0830.281 ± 0.369
(n = 8)(100)(75)(38)(0)(63)(13)(63)
Hijiki145 ± 6193.2 ± 47.63.99 ± 3.55<LOD 2.02 ± 1.75<LOD<LOD
(n = 8)(100)(100)(75)(0)(75)(0)(0)
1 n is the number of samples; 2 Arsenic species and total arsenic concentration (mg kg−1); 3 Frequency of detection (%); 4 Limit of detection.
Table 3. Comparison of mean concentrations of arsenic species (mg kg−1 DW) in this study with those reported in previous studies for similar seaweed samples.
SpeciesTrade NameCountryn 1tAsiAs As(V)As(III)MMADMAAsBAsCReference
Laminaria digitataKelpNew England657.778.32--0.060.97ND-[23]
Saccharina latissimaKelpNew England156.29ND 2--ND0.39ND-[23]
Laminaria sp. KelpSpain139.60.473------[23]
Laminaria sp. KelpJapan148.30.145------[23]
Laminaria japonicaKelpJapan21100.838------[23]
Laminaria digitataKelp-165.70.251------[23]
Alaria esculentaSea mustardNew England434.460.03--ND0.47ND-[24]
Undaria pinnatifidaSea mustardJapan342.7ND------[23]
Undaria pinnatifidaSea mustardSpain335.50.586------[23]
Undaria pinnatifidaSea mustardKorea1461.06------[23]
Porphyra umbilicalusLaverNew England120.730.12--0.050.25ND-[24]
Porphyra teneraLaverJapan223.650.224------[23]
Porphyra umbilicalisLaverSpain134.50.239------[23]
Porphyra sp. LaverJapan132.70.189------[23]
Porphyra sp. LaverSpain124.30.383------[23]
Porphyra sp. LaverSouth Korea320.90.141------[23]
Porphyra sp. LaverChina2500.313------[23]
Ulva lactucaSea lettuceNew England24.740.075--ND0.050.04-[24]
Ulva proliferaSea lettuceNew England114.650.12--ND0.04ND-[24]
Enteromorpha sp. Sea lettuce-12.150.346------[23]
Ulva pertusaSea lettuce-13.240.268------[23]
Chondrus crispusSea stringNew England310.120.07--ND0.050.04-[24]
Graciaria vermiculophyllaSea stringNew England111.80.23--ND0.04ND-[24]
Chondrus crispusSea stringSpain214.10.599------[23]
Hizikia fusiformeHijikiJapan9109.673.5------[23]
Sargassum fulvellumGulfweed-1110.369.969.9NDND2.1NDND[25]
1 n is the number of samples analyzed in each group; 2 ND = not detected (<LOD).
Table 4. Daily intake of seaweed and dietary exposure of arsenic through seaweed ingestion.
Consumption Data Margin of Exposure
(MOE) 3
Exposure GroupSeaweed SpeciesDaily Consumption
(g day−1) 1
iAs Intake
(μg kg−1 day−1) 2
BMDL01/iAs Intake
General group 4
Kelp1.55 × 10−46.30 × 10−74.76 × 105
Sea mustard1.14 × 10−47.99 × 10−83.75 × 106
Laver1.66 × 10−44.04 × 10−77.43 × 105
Gulfweed2.90 × 10−72.48 × 10−71.21 × 106
Hijiki1.10 × 10−51.63 × 10−51.84 × 104
Seaweed consumer group 5
Kelp2.14 × 10−38.69 × 10−63.45 × 104
Sea mustard7.68 × 10−45.37 × 10−75.58 × 105
Laver4.85 × 10−41.18 × 10−62.55 × 105
Gulfweed5.18 × 10−44.42 × 10−46.79 × 102
Hijiki1.76 × 10−32.62 × 10−31.15 × 102
1 Daily consumption data based on the National Health and Nutrition Survey published by the Korea Health Industry Development Institute (KCDC) in 2016; 2 iAs intake = Daily   consumption   ( g   day 1 )   ×   iAs   concentration   ( μ g   kg 1 ) Average   body   weight   ( 65.28   kg ) ; 3 MOE = Margin of exposure, =BMDL01 (0.3 μg kg−1 day1)/iAs intake (μg kg−1 day−1); 4 A group comprising everyone who took the survey, regardless of reported seaweed intake; 5 A group consisting only of people who reported eating seaweed in the survey.

