
Abundance and Composition of Marine Litter on the Seafloor of the Gulf of Sant Jordi (Western Mediterranean Sea)


1
Chair of Sustainable Development Dow-URV, Universitat Rovira i Virgili, 43480 Vila-seca, Spain
2
Department of Geography, Universitat Rovira i Virgili, 43480 Vila-seca, Spain
*
Author to whom correspondence should be addressed.
Environments 2021, 8(10), 106; https://0-doi-org.brum.beds.ac.uk/10.3390/environments8100106
Submission received: 17 August 2021
/
Revised: 22 September 2021
/
Accepted: 10 October 2021
/
Published: 13 October 2021
Abstract
:This article analyzes the abundance and composition of marine litter in the Gulf of Sant Jordi (Catalonia, Spain). Marine litter was removed from the sea by a fishing trawler operating from the port of L’Ametlla de Mar; 56 hauls were performed between July and September 2018. The marine litter was classified following UNEP/IOC Guidelines on Survey and Monitoring of Marine Litter and EU MSFD Technical Group on Marine Litter Joint List, with a total of 2691 items collected and an average number by haul of 48 (SD 28.24). The density was 130 items km−2 but with significant differences according to trawling depth: 192 items km−2 (≤100 m) and 71.5 items km−2 (>100 m). As expected, plastic was the most commonly found material, comprising almost 80% of the total. The relative presence of plastics declined as trawling depth increased. An alarmingly high amount of sanitary waste was found. Further studies are necessary to compare summer results with those of smaller seasonal populations and to analyze what happens to sanitary waste.
1. Introduction
One of the characteristics of modern production and consumption patterns is the generation of waste, a part of which ends up in oceans and seas, becoming marine litter [1,2]. The United Nations Environment Programme/Intergovernmental Oceanographic Commission (UNEP/IOC) defines marine litter as any manufactured material or object that, directly or indirectly and voluntarily or involuntarily, has been dumped or abandoned in marine aquatic environments and either remains afloat, stays on the seafloor or on a beach [3]. Marine litter is a global environmental problem [4,5,6,7,8]. The presence of marine litter in seas and oceans damages marine ecosystems [9,10,11,12]. It also affects various socio-economic activities such as tourism, fishing, and sailing [13,14] as well as public health through the introduction of microplastics into food chains [15,16]. Nevertheless, according to Science Advice for Policy by European Academies [17], ‘the best available evidence suggests that microplastics and nanoplastics do not pose a widespread risk to humans or the environment, except in small pockets. However, the same report concludes that ‘evidence is limited, and the situation could change if pollution continues at the current rate’. Marine litter can also be a potential secondary dispersal vector for invasive species [18,19,20].
The UN General Assembly recognized marine litter as a global problem in 2001 and called for national, regional, and global actions to address this challenge (Resolution A/60/L.22). The UNEP’s Regional Seas Programme and the Global Programme of Action were started to develop the Global Initiative on Marine Litter in 2003, and ten years later, the UNEP Mediterranean Regional Plan for Marine Litter Management was designed (Barcelona Convention). Regarding the European Union, we have to highlight the Marine Strategy Framework Directive (MSFD) (2008/56/EC). The EU authorities consider it a priority to reduce the proliferation of marine litter, and the MSFD (amended by Directive 2017/845) aims to protect the marine environment and guarantee its sustainable use. Its original challenge was to achieve Good Environmental Status (GES) of EU marine waters by 2020.
Potential solutions to the problem of marine litter require knowledge, prevention, mitigation, removal, and behavioral changes [21]. In this regard, identifying (i) sources, (ii) means of release, (iii) geographic origin, (iv) pathways, and (v) transport mechanisms are key challenges for managing the prevention and mitigation of marine litter [22]. The first, sources, refers to the economic sector or human activities that cause litter (tourism, agriculture, fishing, aquaculture, private households, etc.). The second, means of release, indicates the mechanism or manner in which a given item leaves the intended cycle and becomes a problem (improper disposal in the toilet, inadequate waste management, abandoned equipment, direct dumping into the sea from boats, etc.). The third, geographic origin, refers to the location of the source (where the release took place) and its relative distance from the site where marine litter is recorded. The fourth, pathways, is the physical and/or technical means by which litter enters the marine environment (sewage, run-off, permanent river flow, ephemeral flows resulting from high-intensity rainfall, etc.). The fifth and last challenge, transport mechanisms, concerns how litter is transported to and ends up in the marine environment.
About 70% to 80% of marine litter originates from land-based sources [23], especially in areas with many recreational activities [24] and a high non-resident population [25]. Nevertheless, there is a predominance of sea-based sources in some areas with a high presence of abandoned, lost, or discarded fishing gear (ALDFG) [26,27]. Veiga et al. [22] recognized the complexity involved in identifying the concrete sources of marine litter. Its land or sea-based source can be unambiguously determined in only a few cases [28]. Determining the abundance, spatial distribution and composition of marine litter requires its removal from beaches and seas or recording it using video or photography from autonomous underwater vehicles (AUVs), human-occupied vehicles (HOVs), towed underwater cameras (TUCs), or remotely operated vehicles (ROVs) [29]. Some of the most recent studies using ROVs include those by Consoli et al. [30,31], Botero et al. [32], Costanzo et al. [33], Dominguez-Carrió et al. [27], Enrichetti et al. [34], Garofalo et al. [35], Mecho et al. [36], and Pierdomenico et al. [37].
One of the most common ways to remove floating marine litter or marine litter on the seafloor is by means of bottom trawl surveys. In some cases, there are vessels specifically dedicated to collecting marine litter, and all of the operations in this process are planned in advance, including the hauls and the swept area. Several of the most recent studies in this respect are those by Alvito et al. [38], Cau et al. [39], García-Rivera et al. [40], Grøsvik et al. [41], Kammann et al. [42], Urban-Malinga et al. [43], Fortibuoni et al. [44], Zablotski and Kraak [45], Alomar et al. [46] and Compa et al. [47]. Marine litter is also collected by commercial fishing trawlers. Several studies have characterized marine litter after its separation from catches [48,49,50,51,52,53]. In these cases, the swept area matches the routes selected by the fishermen. In some instances, there may also be the possibility of a specific marine litter observer on the fishing vessel [54]. Another way to characterize marine litter is by means of visual surveys by scuba divers. This approach allows the analysis of areas where bottom trawl surveys cannot be performed because the waters are too shallow or too close to the coastline [44,55,56,57]. Canals et al. [29] reviewed the methods of seafloor litter monitoring highlighting strengths and weaknesses.
The concentration of marine litter depends on a number of factors including distance from the coastal area, population density of the coastal area, coastal physiography, presence of rivers, sea depth, and oceanographic conditions such as sea currents and topographic characteristics of the seafloor [29,46,58,59,60]. Deep canyons, sometimes far from the coast, have been found to represent important sinks for marine litter [27,37]. The association of topographic (bathymetric profile and slope) and hydrodynamic components (surface and bottom currents) is also a pivotal factor that influences the dispersion or accumulation of marine macro-litter [61].
A large number of studies have analyzed the composition and vast amounts of marine litter in marine waters worldwide [29]. The results point to a clear predominance of plastic objects, in terms of litter numbers, with percentages ranging from 45% in Constanta Bay to 95% in the Saronikos Gulf [62]. The territorial context plays an important role when comparing results, but this is made more difficult by the existence of different classifications, as stated by Williams and Rangel-Buitrago [21] or Alvito et al. [38]. In this sense, plastic items represented only 35% in the research conducted by Zablotski and Kraak [45] on the Baltic seafloor. Their characterization included the category ‘natural products’, with plastic items in the second position. By contrast, Galimany et al. [52] and García-Rivera et al. [54] claimed that some of the plastic collected, such as fragments of plastic bags, is very small in size and, therefore, often over-represented. The relative presence of this material declines when weight is taken into account; in this case, the percentage ranges from 45% along the coast of Barcelona Province [51] to 17% in the Gulf of Antalya [50].
Different areas of the Mediterranean basin have been analyzed, with bottom trawl surveys the approach used in many cases to characterize marine litter, including studies conducted in the Spanish Mediterranean Sea [46,47,51,52,54,59]. Nonetheless, the study of marine litter in some areas of the Spanish Mediterranean Sea remains insufficiently addressed. One such area is situated along the southern coast of Catalonia. In this respect, the objectives of the present study were: (i) to determine the abundance of marine litter in the Gulf of Sant Jordi; (ii) to characterize the marine litter collected; (iii) to analyze possible differences in the abundance and composition of different types of marine litter, taking into account sea depth and when the litter was collected; and (iv) to contribute to filling the gap in this issue regarding the Western Mediterranean area.
The data required to achieve these goals were provided by a fishing trawler from the port of L’Ametlla de Mar during the period from July through September 2018. The research was possible thanks to an agreement between the Federation of the Fishermen’s Association of Tarragona Province and the Diputació de Tarragona (Provincial Council of Tarragona). This research is aligned with the initiatives undertaken by the Spanish government (Spanish Marine Strategies (Ministerio de Transición Ecológica (https://www.miteco.gob.es/es/costas/temas/proteccion-medio-marino/estrategias-marinas/default.aspx, accessed on 10 August 2021))) in the framework of the MSFD (adopted by means of Act 41/2010 on the Protection of the Marine Environment and Royal Decree 957/2018), as well as with the initiatives of the autonomous government of Catalonia (Marviva project (Agència de Residus de Catalunya (http://residus.gencat.cat/ca/ambits_dactuacio/tipus_de_residu/deixalles-marines/projectes/projecte-marviva/, accessed on 10 August 2021))).
2. Materials and Methods
2.1. Area of Study
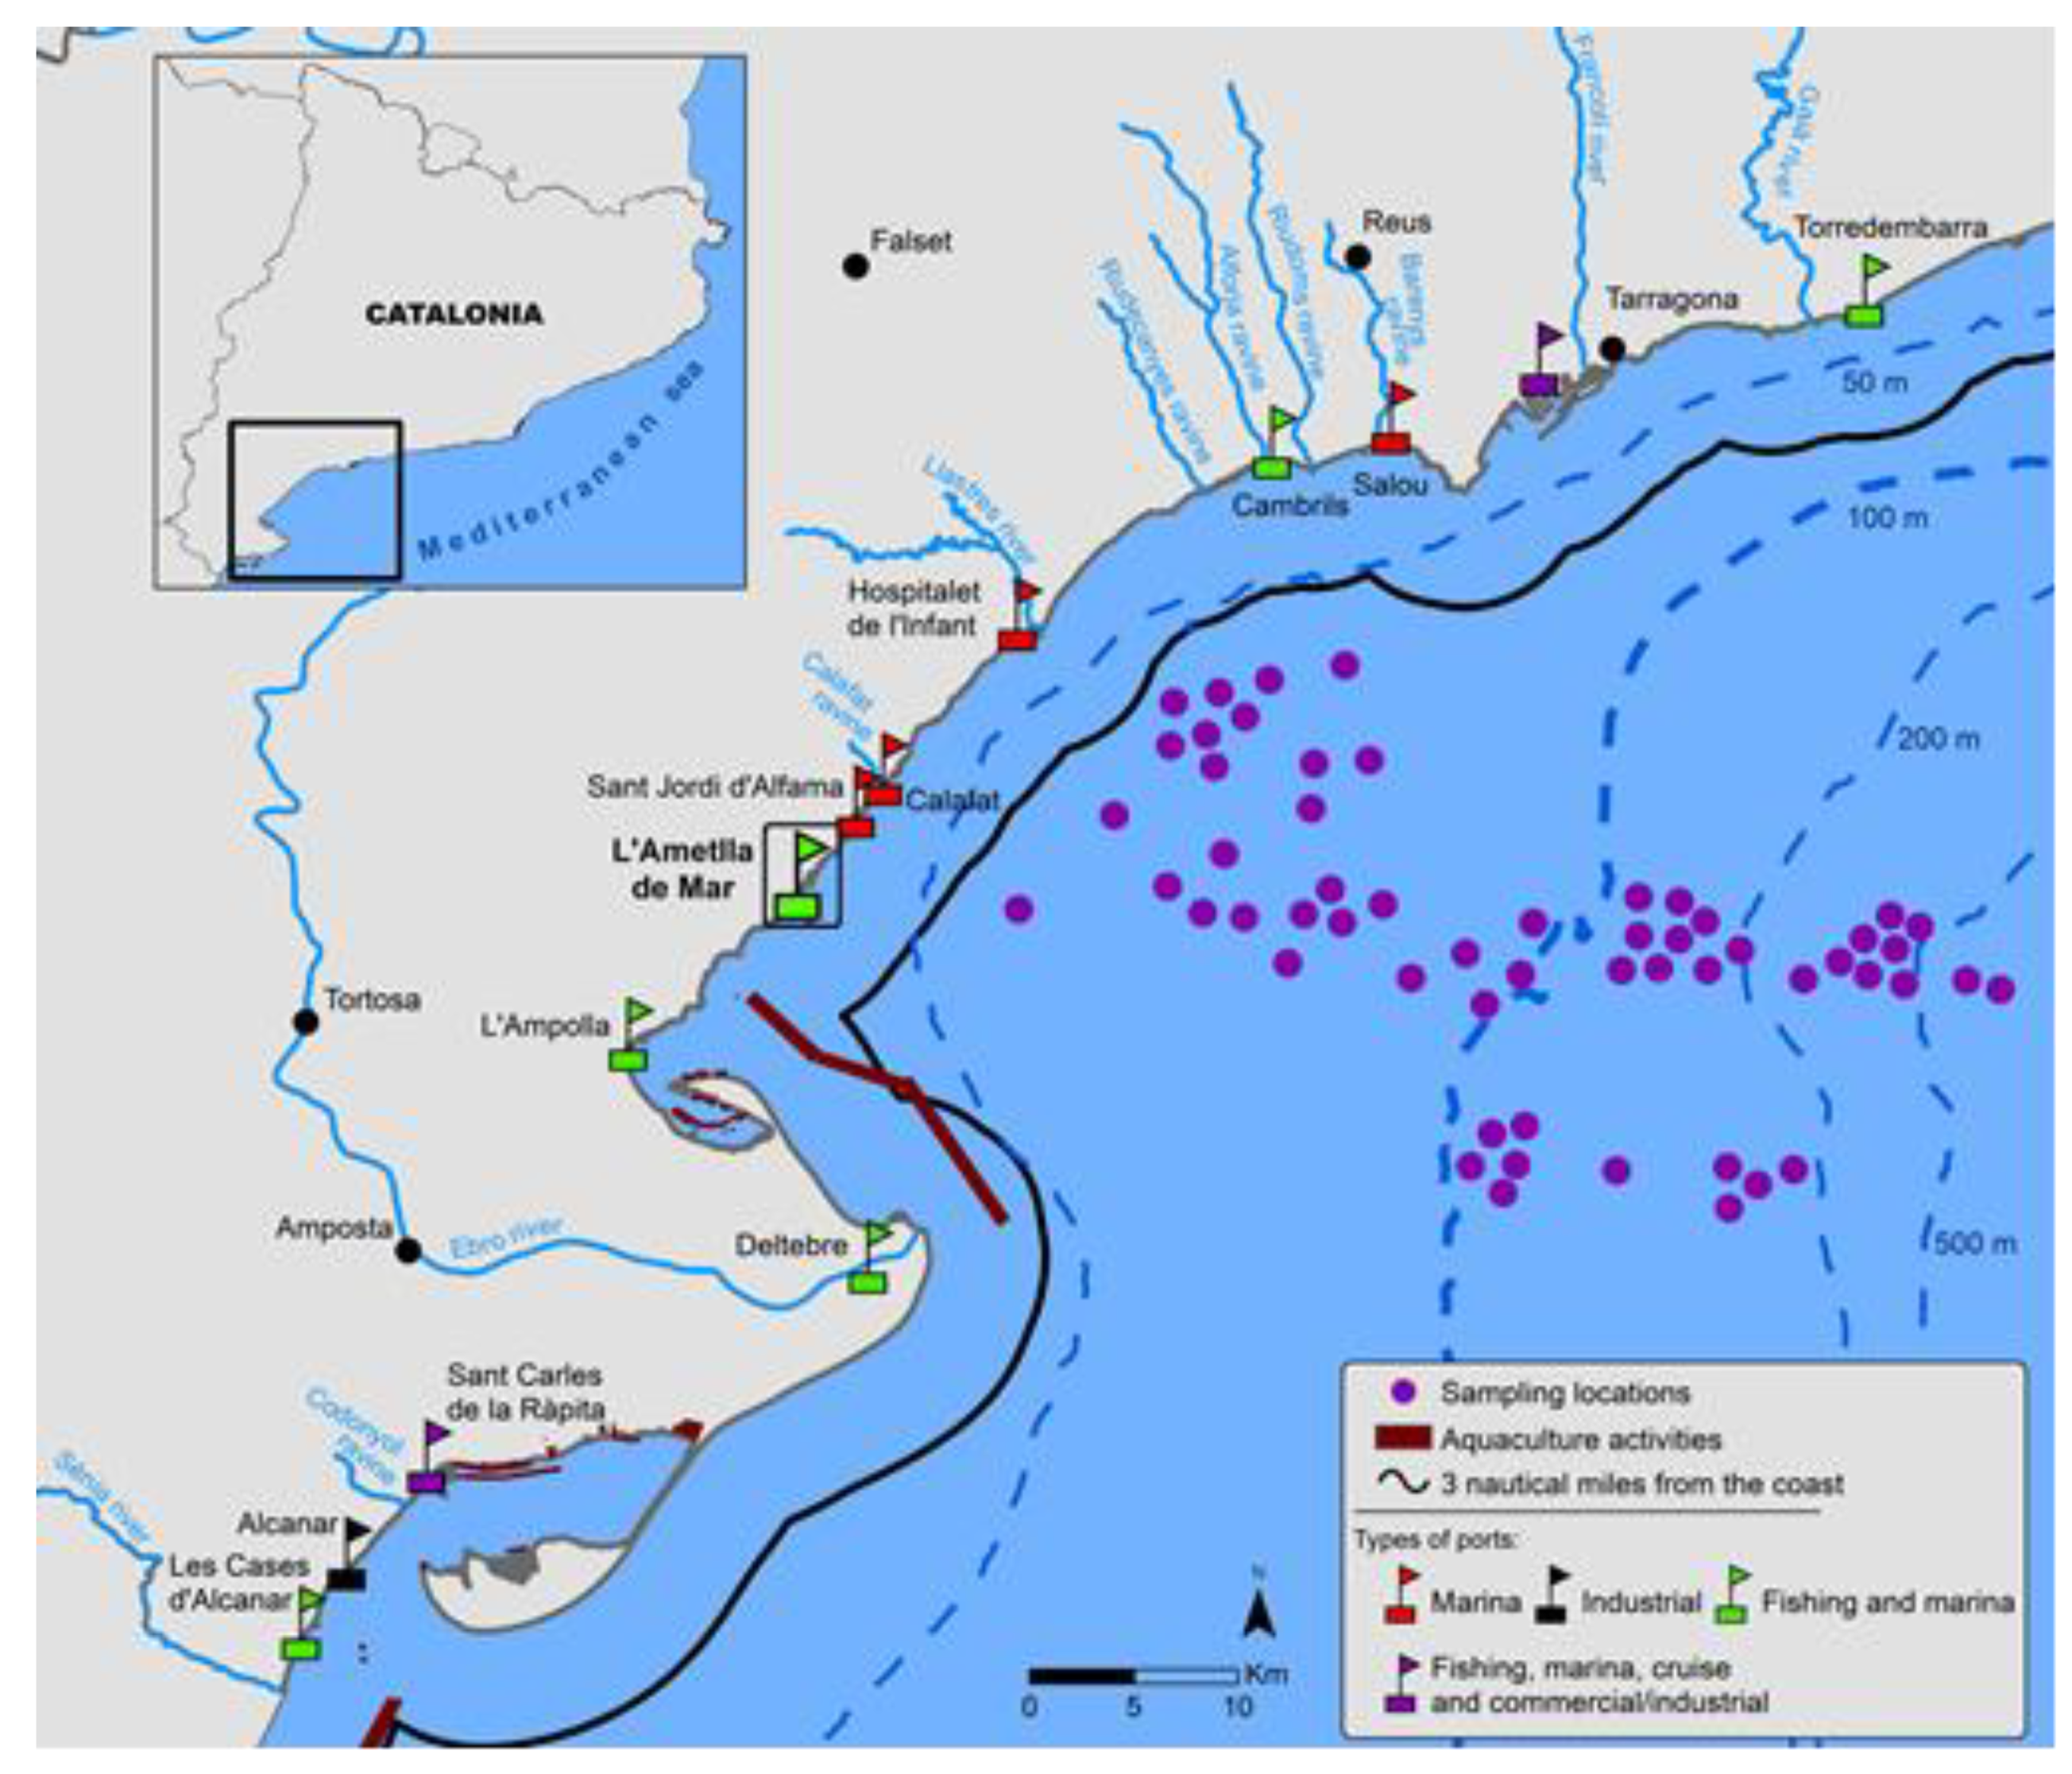
The Gulf of Sant Jordi is located in the Western Mediterranean Sea, just off the southern coast of Catalonia (Figure 1). The most populated neighboring municipality is L’Ametlla de Mar, with almost 7000 inhabitants. It is close to other, more populated towns such as Cambrils (34,000 inhabitants), Salou (27,000 inhabitants), and Tarragona (135,000 inhabitants). The study area included part of one of the main sun and beach tourist destinations in Catalonia, the Costa Daurada. Thus, there is a large seasonal population in the area that consumes resources and generates waste. In fact, the summer population is three times greater than the resident population in Salou and 1.7 times greater than in L’Ametlla de Mar.
The geomorphologic and climatic features of the territory have been shaped by a hydrographic network that is characteristic of much of the Mediterranean coastline. A mountain range runs parallel to the coast and is located only a short distance from it. The precipitation, which is scarce, irregular, and seasonally concentrated, has helped to create a complex network of ravines and streams with ephemeral flows. In most cases, these carry water only after episodes of heavy rainfall; one of the few exceptions to this is the Ebro River. The Cape of Tortosa (which coincides with the mouth of the Ebro River) marks the southern limit of the Gulf of Sant Jordi. The water current just off the coast runs from northeast to southwest.
According to data from the Catalan Water Agency, 16 wastewater treatment plants are currently operating in the 12 coastal municipalities between Torredembarra and the Cape of Tortosa. Two of these plants discharge treated water into the Ebro River, eight into ravines, and six into the Mediterranean Sea. The treatment plants were designed to serve a population of 745,000 inhabitants, although the registered population in 2019 was just 300,000. The area’s main inland settlements (Reus, Tortosa, and Amposta) also have their own wastewater treatment plants.
The most important fishing port on the Gulf of Sant Jordi is located at L’Ametlla de Mar. There are also others near the study area, with the most important being at Cambrils and Sant Carles de la Ràpita. These three ports account for 70% of the trawler fleet in Tarragona Province. According to the fishing regulations, fishing trawls have to be performed at a depth of over 50 m or at a distance of at least three nautical miles from the coast. There are also several marine leisure harbors and a small cruise-ship dock at Sant Carles de la Ràpita. However, the main port in the local area is in the city of Tarragona and is a fishing, leisure, commercial, and industrial port. In recent years, it has also become a significant destination for the arrival of cruise ships. In the south of the study area, there are several aquaculture fish farms that are mainly dedicated to the production of mussels. They are principally located in the two natural bays created by sediment from the Ebro River as well as opposite the northern perimeter of the Ebro Delta.
The depth of the sea in the study area increases more rapidly in the northern sector than in the southern area. At Torredembarra, the distance from the shore to the 100 m isobath is less than five nautical miles, whereas at L’Ampolla it is 21 nautical miles.
2.2. Data and Methodology
The marine litter was collected by one fishing trawler, Catalí Segon (For more details: https://www.youtube.com/watch?v=Sif6ZpR1kwQ, accessed on 10 August 2021), from the port of L’Ametlla de Mar, with a length of 21.2 m and 48.26 gross register tonnage (GRT). The vessel operates with a bottom otter trawl (bou d’arrast). The fishing net is conical in shape, narrowing towards the cod end (cop), and the mesh size is 40 mm. The maximum width of the net is 10 m. The mouth remains open by means of the otter boards (portes), and its vertical height depends on the presence of floats, which vary in number and size according to the species being targeted (invertebrates and fish). The marine litter was landed at the port. It was separated from the catches, classified, counted, and noted on a daily basis, using a record card designed by the Waste Agency of Catalonia in the framework of the Marviva project. The card, in the Catalan language, includes general information under the following file headings: date, fishing area, trawled surface area, and weather. The operations were in charge of the fishermen after a hard day’s work and the litter was not weighted.
The items were distributed in the card following an adaptation of the UNEP/IOC [3] guidelines for the classification of marine litter. Marine litter was classified into eight types of material: plastic (PL), paper and cardboard (PC), anthropogenic wood (WD), metal (ME), rubber (RB), cloth (CL), glass and ceramic (GC), and other (OT). Each of these is divided into various groups of objects of the same material. Nevertheless, according to the UNEP/IOC guidelines, the OT group is not necessarily based on composition’ [3], differentiating between OT01 (paraffin or wax), OT02 (sanitary), OT03 (appliances and electronics), OT04 (batteries) and OT05 (other). Sanitary waste (OT02) comprises diapers, cotton buds, tampon applicators, wet wipes, and panty liners. Although cellulose and cotton are materials found in some of these objects, they are mainly made of plastic resins (polyester, polyethylene, and polypropylene), and therefore, we treated OT02 items as plastic objects. However, a more recent list has been published by the EU MSFD Technical Group on Marine Litter [63]. Marine litter is classified into nine types of material. Seven are equivalent to those in the UNEP/IOC list (artificial polymer/plastic (pl), paper/cardboard (pp), processed/worked wood (wo), metal (me), rubber (ru), cloth/textiles (cl) and glass/ceramics (gc)), and two more are added: chemicals (ch) and food waste (fw). We show the results according to the two lists in order to increase the harmonization of data reporting and intercomparability of our results with future works using the EU MSFD list. Nevertheless, there is not a complete equivalence when a high level of detail is required.
The study period ran from July through September 2018, with information being collected for 56 days (22 in July, 17 in August, and 17 in September) beginning on Monday, 2 July, and ending on Friday, 28 September (12 on Monday, and 11 on Tuesday, Wednesday, Thursday and Friday). The daily trawl of the fishing vessel participating in this study, the Catalí Segon, covered 20 nautical miles, corresponding to 37.04 km, for a total of 2074.24 km. As mentioned p‘reviously, the maximum width of the net is 10 m. The swept surface was calculated using the horizontal opening of the net and the distance trawled for the 56 days. The fishing trawler, therefore, covered an area of 20.75 km2. The available data allowed us to analyze the amount and composition of marine litter for the entire period, as well as its temporal distribution, by comparing two periods. The first ran from the beginning of July until the end of August (summer season), and the second covered the month of September. The last analysis took into account the depth at which fishing was conducted: ≤100 m and >100 m.
The Mann–Whitney U test was applied to compare whether the difference in the medians of the two temporal samples (July–August and September) was statistically significant and also to determine whether the difference between the medians of the two samples linked to fishing depth (≤100 and >100 m) was statistically significant. In a similar way, the chi-square (χ2) test was applied to analyze whether the differences in marine litter composition were statistically significant.
3. Results
3.1. Abundance and Composition of Marine Litter
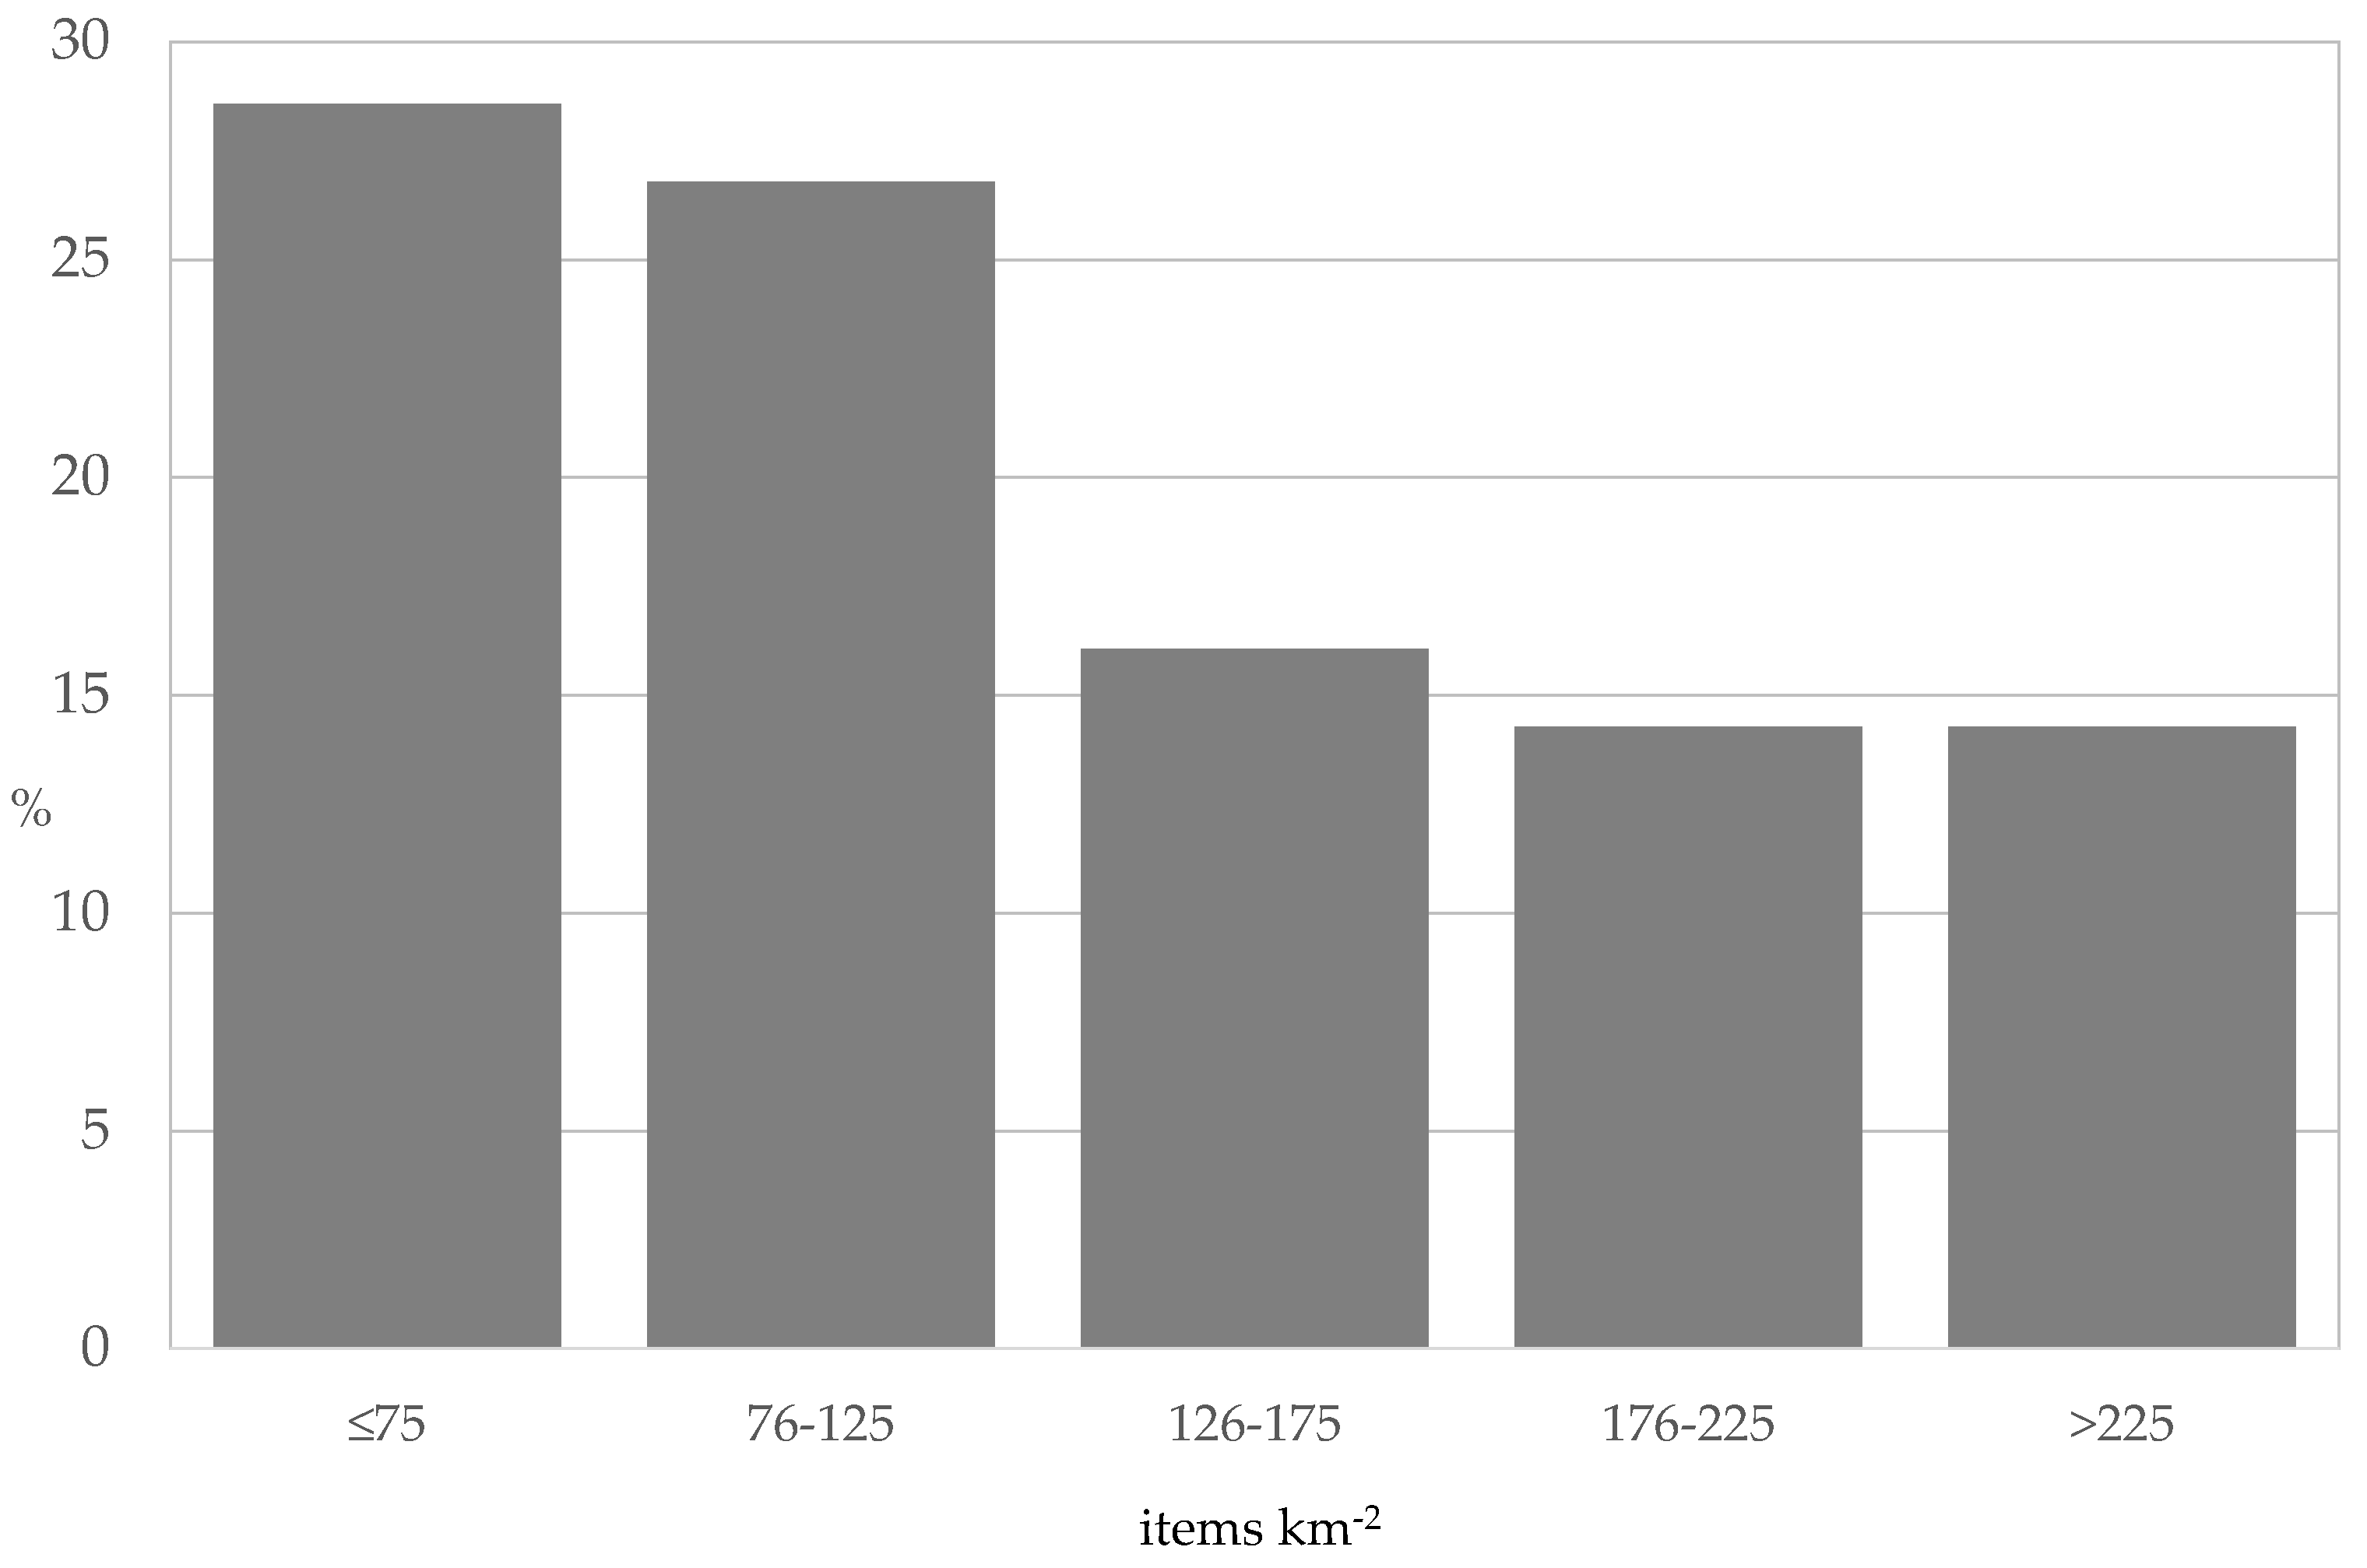
The Catalí Segon fishing trawler collected 2691 items during the 56-day period from July to September 2018. The daily number of items of marine litter collected was, on average, 48. The interest in this figure is limited because it is exclusively related to only one fishing trawler and its schedule. The density of marine litter in the swept area of the Gulf of Sant Jordi was 130 items km−2. Figure 2 shows the distribution of the days, taking into account the density of marine litter recorded on each day. Between 24 and 75 items km−2 were collected on almost 30% of these days and between 76 and 125 on a quarter of the days. The other three thresholds accounted for 15% of the days each. The largest density and number of items was collected on 7 September (294 items km−2/109 items) and the fewest on 25 July and 29 September (24 items km−2/9 items each day).
Table 1 shows the composition of marine litter taking into consideration the seven materials indicated in the methodology section and their amounts: total and relative number, daily average, and density. All the items coded OT corresponded to OT02 (diapers, cotton buds, tampon applicators, wet wipes, and panty liners) and were considered plastic objects. The fishermen stated that most of them were wet wipes. Almost 80% of the litter (2093 items) were objects made of plastic. The daily number of objects made of plastic was, on average, 37.3, and the density was 100.9 items km−2. The second-most abundant material collected from the seafloor in the Gulf of Sant Jordi was metal (9.7%), while none of the other five materials (paper/cardboard, anthropogenic wood, rubber, cloth, and glass/ceramic) individually represented more than 5% of the total.
A wide range of plastic objects become waste and end up in seas and oceans. Table 2 shows the distribution of the different types of plastic litter. Two-fifths were in the form of bags (PL07–J3/J4). Sanitary waste (OT02–J96/J97/J98/J144/J237) was the second-most common, and bottles (<2 L) (PL02 (There is no equivalence. MSFD: J7 (≤0.5 L) and J8 (<0.5 L))) were in the third position. Together, these represented almost 80% of the total plastic recovered from the seafloor in the Gulf of Sant Jordi. The concentration was even greater in the case of metal, with over 90% in the form of aluminum drink cans (ME03–J175) or food cans (ME04–J176).
As for the other materials, almost 80% of paper and cardboard items were objects included in codes PC03–J150/J151/152/J244/J245 (cups, food trays, food wrappers, cigarette packages and drink containers); four of five cloth items were included in codes CL01–J137/J138 (clothes, shoes, hats, and towels); nine of ten glass and ceramic items were included in codes GC02–J200/J201 (bottles and jars); more than half of anthropogenic wood items were included in codes WD04–J160 (processed timber and pallet crates); and one-third of rubber items represented footwear (RB01–J127), including flip-flops, while another third were included in codes RB01–J125/J126 (balloons, balls, and toys).
3.2. Temporal Distribution of Marine Litter
Table 3 shows the distribution of marine litter after taking into consideration whether the fishing activity took place in July and August of 2018 (peak summer-season population) or in September. A total of 39 (69.6%) fishing days corresponded to the first period and 17 (30.4%) to the second, while the swept areas were 14.44 km2 and 6.31 km2, respectively. The marine litter collected for the summer period accounted for 65.2% of the total, with the remaining 34.8% corresponding to the first month of autumn. This implies differences in the average daily amount (45 vs. 55 items) and in the density (121.5 vs. 148.5 items km−2). The Mann–Whitney U test showed that the difference between the median of the two samples is statistically significant (U = 192; p < 0.05).
Table 3 also shows the composition of marine litter after taking into account the materials found. The same pattern existed in both periods: plastic was the most abundant form of litter, followed by metal and then paper/cardboard. There is a higher relative proportion of plastic items collected in September than in July–August. The other categories declined in September, especially metal objects. The only exceptions, in terms of relative proportion, were objects made of glass and ceramic. The differences in the distribution were statistically significant (χ2 = 30.01; p < 0.001).
3.3. Depth Distribution of Marine Litter
Table 4 shows the distribution of marine litter after taking into account sea depths of ≤100 m and >100 m. The numbers of fishing days were 27 (48.2%) and 29 (51.8%), respectively, and the swept areas were 10 km−2 and 10.75 km−2. In contrast, the 1921 items collected at shallower depths (≤100 m) accounted for almost three-quarters of the total. This implies major differences in the average daily amounts (71 vs. 26.5 items (SD 21.23 and 12.44, respectivelly.)) and densities (192 vs. 71.5 items km−2). The Mann–Whitney U test showed a significant difference between the median values of the two samples (U = 30.5; p < 0.05).
The abundance of marine litter for all seven materials declined when fishing took place beyond the 100 m isobath. There was, however, a significant decrease in the relative presence of plastic items and a slight decrease in the case of glass/ceramic items. By contrast, there was an increase in the relative presence of all other materials, especially in the case of metal and paper/cardboard objects The difference between the two samples was statistically significant (χ2 = 71.77; p < 0.001).
The frequency of the different plastic objects found was analyzed after taking into consideration the depth at which trawling was conducted (Table 5). At greater depths, a lower presence of each of the five main typologies was noted. Plastic bags were the most common objects found at both depths. However, their relative presence rose by 7.5 points when the depth exceeded 100 m. The highest relative increase occurred in the case of the monofilament line. The amount of this type of item with an unequivocally sea-based litter source remained very close at both depths. In contrast, the presence of sanitary waste declined drastically both in absolute as well as in relative numbers. The differences between the two samples were statistically significant (χ2 = 149.01; p < 0.001).
4. Discussion
4.1. Abundance and Distribution
The density of marine litter in the Gulf of Sant Jordi was 130 items km−2. This density was greater than that found by Neves et al. [49] in the Atlantic Ocean, ranging from 80 to 17 items km−2 in the northern and southern coasts of Portugal, respectively; or in the North Sea and Baltic Sea, with 17 and 5 items km−2, respectively [42]. The characteristics of the North-East Atlantic Ocean, the North Sea, and the Baltic Sea, as well as the territorial context of the areas bordering them, might explain the lower amounts of marine litter found in these waters than in the Mediterranean Sea. Nevertheless, lower densities than ours have been found in several areas of the Mediterranean Sea, for example, by Stefatos et al. [48] in the Gulf of Echinades (89 items km−2), Ioakeimidis et al. [62] in the Gulf of Limassol (24 items km−2), Alvito et al. [38] in Sardinia (58 items km−2), Fortibuoni et al. [44] in offshore Rimini and in Montenegrin and Slovenian waters, Garofalo et al. [35] off the southern coast of Sicily (79.6 items km−2), and by Mutlu et al. [57] on the Turkish Mediterranean coasts (19 items km−2). In some cases, the authors attributed the low values to a relatively low population along a coast, the absence of large rivers flowing into the sea, and/or a relatively small fishing fleet.
In contrast, higher values than ours have been reported in the Eastern Mediterranean Sea by Stefatos et al. [48] in the Gulf of Patras (240 items km−2), Ioakeimidis et al. [62] in the Gulf of Saronikos (1211 items km−2), Cau et al. [39] in the Tyrrhenian Sea (258 items km−2), Crocetta et al. [53] in the Gulf of Naples (300 items km−2), Enrichetti et al. [34] in the Ligurian Sea (maximum densities of 7900 items ha−1), Pierdomenico et al. [37] in the Southern Tyrrhenian Sea (up to 56.3 items/100 m), and by Fortibuoni et al. [44] in the southern area of the Gulf of Venice (983 items km−2), North Corfu (910 items km−2), and the Kerkiraikos Gulf (829 items km−2). These higher values are, in some cases, because of high population density including seasonal arrivals, or because the study area is located near the mouth of a river and/or aquaculture fishing activities. In other cases, the study area was a relatively enclosed gulf.
It is not possible to compare our results with those of several studies undertaken along other Mediterranean areas, including some Spanish [40,46,54] and Catalan areas [52], as their analyses were performed considering the weight of the marine litter instead of the number of items recorded or removed from the seafloor or because they focused on only plastic objects [47]. Two exceptions are the study conducted by Dominguez-Carrió et al. [27] off the Cap de Creus and the study by Pérez [51] along the coast of Barcelona Province. The latter reported a density of 66 items km−2, which was 50% lower than that of our study. Despite the fact that the population density of the Barcelona area is higher than in our study area, the depth of the sea increases more rapidly than in the Gulf of Sant Jordi. Furthermore, the main maritime current runs from northeast to southwest off the Catalan coast. By contrast, the density found by Dominguez-Carrió et al. [27] was significantly higher, reaching 11,000 items km−2. The analyzed area of the Cap de Creus included a submarine canyon where marine litter tends to accumulate over time due to bottom currents. In addition, fishing bottom trawlers try to avoid these areas in order to be more efficient in terms of catches. Another factor that needs to be considered is the methodology applied (see Introduction section). The research conducted by Dominguez-Carrió et al. [27] used underwater video transects, whereas both the present study and the one by Perez [51] used a bottom trawl survey. The first study recorded all the marine litter following the hauls chosen by the researchers. In the latter, the marine litter was removed through a bottom trawler and the swept area was selected by the fishermen.
Our results showed statistically significant differences when the July–August period was compared with September. The Costa Daurada welcomes a very large seasonal population every summer, with various land- and sea-based leisure and tourism activities resulting in an increase in the amount of waste objects that end up in the waters off these coasts, including the Gulf of Sant Jordi. Even so, the process by which marine litter reaches the seafloor where the fishing trawlers work requires some time. It should also be noted that commercial fishing is banned in the Gulf of Sant Jordi in May and June. It would be advisable to compare our results with findings for other seasons, as Olguner et al. [49] carried out in Antalya, a tourist destination on the southern coast of Turkey.
The abundance of marine litter in the Gulf of Sant Jordi clearly varies at different depths. It is higher in shallower waters, which are close to human settlements and socio-economic activities (including tourism), and where rivers or ravines discharge water into the sea along with sediments and waste. Our results are in line with those reported by Ioakeimidis et al. [62] for various areas in the Eastern Mediterranean Sea and by Strafella et al. [64] in the Adriatic Sea. Nevertheless, the hauls in the Gulf of Sant Jordi were performed at a depth of over 50 m (or at a distance of at least three nautical miles from the coast). We have no information about the abundance of marine litter in the shallowest waters close to the coast where the amount of marine litter tends to decline, as reported by Fortibuoni et al. [44] and Mutlu et al. [57]. Moreover, the hauls in the Gulf of Sant Jordi did not include deep canyons, where the amounts of marine litter tend to be higher than on the continental shelf [27,37].
4.2. Characterization and Sources
As expected, plastic material was the most common item removed from the seafloor in the Gulf of Sant Jordi (close to four of every five items). The predominance of plastic items concurs with results found in other Mediterranean areas [4,37,38,39,44,48,49,53,57,62,64,65], but also in other waters including the Atlantic Ocean [49,66,67], the Black Sea [62,68], the North Sea [42,69], the Baltic Sea [42,43], and the Caribbean Sea [32].
However, there are substantial differences between the above studies when the relative presence of plastic items is quantified (ranging from 45% to 95%). The overwhelming amount of plastic situates the Gulf of Sant Jordi towards the upper limit of this range. While the territorial and oceanographic context explains part of the differences found in the literature [29], the methodology used to record or collect the marine litter [34], as well as the way the marine litter is classified [21,38], are also important factors. In this regard, we can satisfactorily compare our results only with those obtained in the research conducted by Pérez [51] along the coast of Barcelona Province, following the same approach (bottom trawl survey) and the same classification. In that study, plastic items represented 83% of the total amount of litter, very close to our results (77.8%).
The second-most abundant material removed from the seafloor in the Gulf of Sant Jordi was metal (almost 10% of the total); this was also the case in the Gulfs of Echinades, Santorini and Limassol, and the Bay of Constanta [62] or in the Southern Baltic Sea [43]. In the study by Pérez [51], the second-most abundant material was cloth (8%), with metal objects accounting for 4% of the marine litter recovered along the coast of Barcelona Province.
A wide range of plastic objects become waste and end up in the sea. Plastic bags constitute the most commonly recovered item, with the value we report (two of every five plastic objects) very close to that reported by Pérez [51] for the coast of Barcelona Province. Plastic bags, together with bottles and food containers, are commonly single-use objects that too frequently end up in the sea. In our study, the presence and large amounts of sanitary waste, mainly wet wipes, were unusually high compared to other results reported in the literature. As far as we are aware, no other research has reported similar values. This suggests markedly inappropriate behavior regarding sanitary waste management and the discharge of untreated sewage from recreational activities and facilities located on the coastline or from cruise boats. Nevertheless, we cannot eliminate the possibility of a wastewater treatment plant malfunction; these are potential escape routes through which plastic and sanitary waste can enter aquatic environments [70].
We found statistically significant differences when comparing temporal and depth distributions of marine litter. The relative presence of plastic items increased in September compared with July and August. In particular, consumption of single-use plastic objects, like bags and bottles, increased in summer because of the arrival of the seasonal population. Some of these items ended up in the sea, increasing the probability of their capture from the seafloor by fishing trawlers in autumn and probably in winter. As for sea depth, the relative presence of plastic items was lower in deeper waters where there was a relative increase in the presence of other materials, particularly metal objects. Some plastic items (especially wet wipes and other sanitary waste) remained on the seafloor of the shallow waters close to their mainland-based sources. In contrast, the amount of monofilament line was very similar at both depths, and its relative presence was greatest at depths > 100 m. These objects have an unequivocally marine-based source from fishing boats working at different depths.
Despite most marine litter having a land source [23], quantifying its distribution among the wide range of land and marine sources is a complex operation. There are, however, several marine litter typologies that have an unequivocal marine source. These include fishing gear, monofilament lines, fishing nets, sinkers, lures, and hooks [54,62]. We can state that 6.7% of the marine litter removed from the Gulf of Sant Jordi has an unequivocal marine source.
5. Conclusions
The aims of this study have been met in that we determined the abundance of marine litter removed from the seafloor and characterized it according to seven different materials and their main typologies, thereby contributing to filling the existing gap on the subject of marine litter in the Gulf of Sant Jordi, an area of the Western Mediterranean Sea that has been scarcely analyzed. The amount of marine litter found in the Gulf of Sant Jordi in the present study can be considered moderate compared to the findings of existing literature on the entire Mediterranean Sea. The vast majority of marine litter was made of plastic, amounting to almost 80% of the total. The most abundant objects were plastic bags and sanitary waste (mainly wet wipes). We found statistically significant differences both in the amount and characterization of the marine litter when considering the time of year the trawl was performed (summer vs. autumn) and the depth at which it was conducted.
Public policies and programmes need to be designed and implemented to prevent or at least reduce the marine litter problem [71,72,73] by means of strict control of land- and sea-based sources [27] and also by reducing the amounts of plastic objects manufactured in general. To this end and complementing the MSFD, the European Strategy for Plastics in a Circular Economy [74] proposes four measures (improving the economics and quality of plastics recycling, curbing plastic waste and littering, driving investment and innovation towards circular solutions, and harnessing global action) as well as several actions to achieve a more circular plastic economy and, thereby, reduce its production and the amount of plastic objects that end up in the world’s marine waters. These objectives are reinforced by EU Directive 2019/904 on the reduction of the impact of certain plastic products on the environment. The problem of sanitary waste is addressed in Article 10 of this recent EU Directive through awareness-raising measures to avoid ‘the impact of inappropriate means of waste disposal of those single-use plastic products on the sewer network’.
Our work is a starting point for the analysis of the abundance and composition of marine litter along the southern part of the Mediterranean coast of Catalonia. While it is a modest contribution to tackling the problem of marine litter, it is aligned with EU objectives, especially those of the MSFD monitoring programme in Spain. It should also be acknowledged that our study has several limitations. First, with just three months of data, the temporal scope is limited. Second, as well as being classified by material, number and size, the marine litter also needs to be weighed to allow more extensive comparisons of the results obtained with those from other studies that have analyzed the abundance and characterization of marine litter taking into account its weight. Finally, there are several limitations to the methodology used to achieve the objectives, namely bottom trawl surveys conducted by a fishing trawler. The researchers had very little or no influence on the decision about the area to be swept, and additionally, regulations prohibit fishing trawler activity close to the shore (<3 nautical miles) and in shallow waters (<50 m).
In this sense, further analysis should be conducted in the Gulf of Sant Jordi, particularly in order to compare our results (abundance and characterization) with those of other seasons, as well as to determine the sources, means of release, geographic origins, pathways and transport mechanisms of marine litter in this area and taking into account marine currents and the topography of the seafloor. In addition, due to its excessive presence, sanitary waste calls for special attention. Bottom trawl surveys should be complemented with visual scuba surveys, as performed by Fortibuoni et al. [44] in order to extend the swept area. Other areas of the continental shelf where bottom trawlers cannot operate because of the bathymetric profile and slope also need to be considered. In such cases, an ROV can be an option. However, ROVs allow the recording of marine litter but not its removal. Dominguez-Carrió et al. [27] raised the dilemma posed by, on one hand, the environmental benefit of removing marine litter from the seafloor and, on the other, by the environmental impact of doing so through bottom trawlers. Another challenge will be to assess the impact of the COVID-19 pandemic on water ecosystems in terms of the amounts of personal protective equipment (PPE), especially masks and gloves, that end up in marine waters [75,76].
In summary, this kind of research is necessary in order to achieve UN Sustainable Development Goal 14 and, more specifically, Target 14.1: ‘prevent and significantly reduce marine pollution of all kinds, in particular from land-based activities, including marine debris and nutrient pollution’.
Author Contributions
Conceptualization, Ò.S.; methodology, Ò.S. and E.B.; cartography, E.B.; writing and editing, Ò.S and E.B. All authors have read and agreed to the published version of the manuscript.
Funding
This research was funded by the Chair of Sustainable Development Dow/URV.
Acknowledgments
We would like to thank the Diputació de Tarragona, the Federation of Fishermen’s Association of Tarragona Province, the Fishermen’s Association of the port of L’Ametlla de Mar and the crew of the Catalí Segon. The authors are members of the Research Group on Territorial Analysis and Tourism Studies at Universitat Rovira i Virgili (2017SGR22).
Conflicts of Interest
The authors declare no conflict of interest.
References
- Derraik, J.G.B. The pollution of the marine environment by plastic debris: A review. Mar. Pollut. Bull. 2002, 44, 842–852. [Google Scholar] [CrossRef]
- Jambeck, J.R.; Geyer, R.; Wilcox, C.; Siegler, T.R.; Perryman, M.; Andrady, A.; Narayan, R.; Lavender Law, K. Plastic waste inputs from land into the ocean. Science 2015, 347, 768–771. [Google Scholar] [CrossRef]
- Cheshire, A.C.; Adler, E.; Barbière, J.; Cohen, Y.; Evans, S.; Jarayabhand, S.; Jeftic, L.; Jung, R.T.; Kinsey, S.; Kusui, E.T.; et al. UNEP/IOC Guidelines on Survey and Monitoring of Marine Litter; UNEP Regional Seas Reports and Studies, No. 186; United Nations Environmental Programme and Intergovernmental Oceanographic Commission: Nairobi, Kenya, 2009. [Google Scholar]
- Galgani, F. Macro-Dechets en Méditerranée Française: Etat des Connaissances, Analysies des Données de la Surveillance et Recommandations; Rapport RST.ODE/LER-PAC/11-03; Département Océanographie et Dynamiques des Ecosystèmes, Laboratoire Environnement Ressources Provence Azur Corse: France, 2011; Available online: https://archimer.ifremer.fr/doc/00053/16434/13943.pdf (accessed on 10 August 2021).
- Depledge, M.H.; Galgani, F.; Panti, C.; Caliani, I.; Casini, S.; Fossi, M.C. Plastic litter in the sea. Mar. Environ. Res. 2013, 92, 279–281. [Google Scholar] [CrossRef] [PubMed] [Green Version]
- Íñiguez, M.E.; Conesa, J.A.; Fullana, A. Marine debris occurrence and treatment: A review. Renew. Sustain. Energy Rev. 2016, 64, 394–402. [Google Scholar] [CrossRef] [Green Version]
- Beaumont, N.J.; Aanesen, M.; Austene, M.C.; Börger, T.; Clark, J.R.; Cole, M.; Hooper, T.; Lindeque, P.K.; Pascoe, C.; Wyles, K.J. Global ecological, social and economic impacts of marine plastic. Mar. Pollut. Bull. 2020, 142, 189–195. [Google Scholar] [CrossRef]
- Maeland, C.E.; Staupe-Delgado, R. Can the global problem of marine litter be considered a crisis? Risk Hazards Crisis Public Policy 2020, 11, 87–104. [Google Scholar] [CrossRef]
- Katsanevakis, S.; Verriopoulos, G.; Nicolaidou, A.; Thessalou-Legaki, M. Effect of marine litter on the benthic megafauna of coastal soft bottoms: A manipulative field experiment. Mar. Pollut. Bull. 2007, 54, 771–778. [Google Scholar] [CrossRef]
- Gall, S.C.; Thompson, R.C. The impacts of debris on marine life. Mar. Pollut. Bull. 2015, 92, 170–179. [Google Scholar] [CrossRef] [PubMed]
- Anastasopoulou, A.; Fortibuoni, T. Impact of Plastic Pollution on Marine Life in the Mediterranean Sea. In The Handbook of Environmental Chemistry; Springer: Berlin/Heidelberg, Germany, 2019. [Google Scholar] [CrossRef]
- Azevedo-Santos, V.M.; Gonçalves, G.R.L.; Manoel, P.S.; Andrade, M.C.; Lima, F.P.; Pelicice, F.M. Plastic ingestion by fish: A global assessment. Environ. Pollut. 2019, 255, 112994. [Google Scholar] [CrossRef] [PubMed]
- Hardesty, B.D.; Lawson, T.J.; Van der Velde, T.; Landsdell, M.; Wilcox, C. Estimating quantities and sources of marine debris at a continental scale. Front. Ecol. Environ. 2017, 15, 18–25. [Google Scholar] [CrossRef]
- Rodríguez, Y.; Ressurreiçao, A.; Phanm, C.K. Socio-economic impacts of marine litter for remote oceanic islands: The case of the Azores. Mar. Pollut. Bull. 2020, 160, 111631. [Google Scholar] [CrossRef]
- Lusher, A.L.; McHugh, M.; Thompson, R.C. Occurrence of microplastics in the gastrointestinal tract of pelagic and demersal fish from the English Channel. Mar. Pollut. Bull. 2013, 67, 94–98. [Google Scholar] [CrossRef]
- Pietrelli, L.; Poeta, G.; Battisti, C.; Sighicelli, M. Characterization of plastic beach debris finalized to its removal: A proposal for a recycling scheme. Environ. Sci. Pollut. Res. 2017, 24, 16536–16542. [Google Scholar] [CrossRef]
- SAPEA. A Scientific Perspective on Microplastics in Nature and Society; Evidence Review Report nº 4; Science Advice for Policy by European Academies: Berlin, Germany, 2019; Available online: https://www.sapea.info/topics/microplastics/ (accessed on 15 January 2021).
- Miralles, L.; Gomez-Agenjo, M.; Rayon-Viña, F.; Gyraitè, G. Alert calling in port areas: Marine litter as possible secondary dispersal vector for hitchhiking invasive species. J. Nat. Conserv. 2018, 42, 12–18. [Google Scholar] [CrossRef]
- Gracia, A.; Rangel-Bruitago, N. The invasive species Perna viridis (Linnaeus, 1758—Bivalvia: Mytilidae) on artificial substrates: A baseline assessment for the Colombian Caribbean Sea. Mar. Pollut. Bull. 2020, 152, 110926. [Google Scholar] [CrossRef]
- Mantelatto, M.C.; Póvoa, A.A.; Skinner, L.F.; de Arauja, F.V.; Creed, J.C. Marine litter and wood debris as habitat and vector for the range expansion of invasive corals (Tubastraea spp.). Mar. Pollut. Bull. 2020, 160. [Google Scholar] [CrossRef]
- Williams, A.T.; Rangel-Buitrago, N. Marine litter: Solutions for a major environmental problem. J. Coast. Res. 2019, 35, 648–663. [Google Scholar] [CrossRef] [Green Version]
- Veiga, J.M.; Fleet, D.; Kinsey, S.; Nilsson, P.; Vlachogianni, T.; Werner, S.; Galgani, F.; Thompson, R.C.; Dagevos, J.; Gago, J.; et al. Identifying Sources of Marine Litter; MSFD GES TG Marin Litter Thematic Report; JRC Technical Report; EUR 28309; Publications Office of the European Union: Luxembourg, 2016. [Google Scholar] [CrossRef]
- Galgani, F.; Fleet, D.; Van Franeker, J.A.; Katsanevakis, S.; Maes, T.; Mouat, J.; Oosterbaan, L.; Poitou, I.; Hanke, G.; Thompson, R.C.; et al. Marine Strategy Framework Directive; Task Group 10 Report Marine litter, JRC Scientific and technical Report, ICES/JRC/IFREMER; Office for Official Publications of the European Communities: Luxembourg, 2010. [Google Scholar]
- Munari, C.; Corban, C.; Simeoni, U.; Mistri, M. Marine litter on Mediterranean shores: Analysis of composition, spatial distribution and sources in north-western Adriatic beaches. Waste Manag. 2016, 49, 483–490. [Google Scholar] [CrossRef]
- Campbell, M.L.; Paterson de Heer, C.; Kinslow, A. Littering dynamics in a coastal industrial setting: The influence of non-resident populations. Mar. Pollut. Bull. 2014, 80, 179–185. [Google Scholar] [CrossRef]
- Pham, C.K.; Ramirez-Llodra, E.; Alt, C.H.S.; Amaro, T.; Bergmann, M.; Canals, M.; Company, J.B.; Davies, J.S.; Duineveld, G.C.A.; Galgani, F.; et al. Marine litter distribution and density in European seas, from the shelves to deep basins. PLoS ONE 2014, 9, e0095839. [Google Scholar] [CrossRef] [Green Version]
- Dominguez-Carrió, C.; Sanchez-Vidal, A.; Estournel, C.; Corbera, G.; Riera, J.L.; Orejas, C.; Canals, M.; Gili, J.-M. Seafloor litter sorting in different domains of Cap de Creus continental shelf and submarine canyon (NW Mediterranean Sea). Mar. Pollut. Bull. 2020, 161, 111744. [Google Scholar] [CrossRef]
- Galgani, F.; Hanke, G.; Werner, S.; De Vrees, L. Marine litter within European Marine Strategy Framework Directive. ICES J. Mar. Sci. 2013, 70, 1055–1064. [Google Scholar] [CrossRef]
- Canals, M.; Pham, C.K.; Bergmann, M.; Gutow, L.; Hanke, G.; van Sebille, E.; Angiolillo, M.; Buhl-Mortensen, L.; Cau, A.; Ioakeimidis, C.; et al. The quest for seafloor macrolitter: A critical review of background knowledge, current methods and future prospects. Environ. Res. Lett. 2021, 16. [Google Scholar] [CrossRef]
- Consoli, P.; Andaloro, F.; Altobelli, C.; Battaglia, P.; Campagnuolo, S.; Canese, S.; Castriota, L.; Cillari, T.; Falautano, M.; Pedà, C.; et al. Marine litter in an EBSA (Ecologically or Biologically Significant Area) of the central Mediterranean Sea: Abundance, composition, impact on benthic species and basis for monitoring entanglement. Environ. Pollut. 2018, 236, 405–415. [Google Scholar] [CrossRef]
- Consoli, P.; Falautano, M.; Sinopoli, M.; Perzia, P.; Canese, S.; Esposito, V.; Battaglia, P.; Romeo, T.; Andaloro, F.; Galgani, F.; et al. Composition and abundance of benthic marine litter in a coastal area of the central Mediterranean Sea. Mar. Pollut. Bull. 2018, 136, 243–247. [Google Scholar] [CrossRef]
- Botero, C.M.; Zielinski, S.; Pereira, C.I.; León, J.A.; Dueñas, L.F.; Puentes, V. The first report of deep-sea litter in the South-Western Caribbean Sea. Mar. Pollut. Bull. 2020, 157, 157. [Google Scholar] [CrossRef] [PubMed]
- Costanzo, L.G.; Marletta, G.; Alongi, G. Assessment of marine litter in the coralligenous habitat of a marine protected area along the Ionian coast of Sicily (Central Mediterranean). J. Mar. Sci. Eng. 2020, 8, 656. [Google Scholar] [CrossRef]
- Enrichetti, F.; Dominguez-Carrió, C.; Toma, M.; Bavestrello, G.; Canese, S.; Bo, M. Assessment and distribution of seafloor litter on the deep Ligurian continental shelf and shelf break (NW Mediterranean Sea). Mar. Pollut. Bull. 2020, 151, 110872. [Google Scholar] [CrossRef] [PubMed]
- Garofalo, G.; Quattrocchi, F.; Bono, G.; Di Lorenzo, M.; Di Maio, F.; Falsone, F.; Gancitano, V.; Geraci, M.L.; Lauria, V.; Massi, D.; et al. What is in our seas? Assessing anthropogenic litter on the seafloor of the central Mediterranean Sea. Environ. Pollut. 2020, 266, 115213. [Google Scholar] [CrossRef]
- Mecho, A.; Francescangeli, M.; Ercilla, G.; Fanelli, E.; Estrada, F.; Valencia, J.; Sobrion, I.; Danovaro, R.; Company, J.B.; Aguzzi, J. Deep-sea litter in the Gulf of Cadiz (Northeastern Atlantic, Spain). Mar. Pollut. Bull. 2020, 153, 110969. [Google Scholar] [CrossRef]
- Pierdomenico, M.; Casalbore, D.; Chiocci, F.L. The key role of canyons in funnelling litter to the deep sea: A study of the Gioia Canyon (Southern Tyrrhenian Sea). Anthropocene 2020, 30, 100237. [Google Scholar] [CrossRef]
- Alvito, A.; Bellodi, A.; Cau, A.; Moccia, D.; Mulas, A.; Palmas, F.; Pesci, P.; Follesa, M.C. Amount and distribution of benthic marine litter along Sardinian fishing grounds (CW Mediterranean Sea). Waste Manag. 2018, 75, 131–140. [Google Scholar] [CrossRef]
- Cau, A.; Bellodi, A.; Moccia, D.; Mulas, A.; Pesci, P.; Cannas, R.; Pusceddu, A.; Follesa, M.C. Dumping to the abyss: Single-use marine litter invading bathyal plains of the Sardinian margin (Tyrrhenian Sea). Mar. Pollut. Bull. 2018, 135, 845–851. [Google Scholar] [CrossRef]
- García-Rivera, S.; Sánchez Lizaso, J.L.; Bellido Millán, J.M. Spatial and temporal trends of marine litter in the Spanish Mediterranean seafloor. Mar. Pollut. Bull. 2018, 137, 252–261. [Google Scholar] [CrossRef] [PubMed]
- Grosvik, B.E.; Prokhorova, T.; Eriksen, E.; Krivosheya, P.; Horneland, P.A.; Prozorkevich, D. Assessment of marine litter in the Barents Sea, a part of the joint Norwegian-Russian ecosystem survey. Front. Mar. Sci. 2018, 5, 5. [Google Scholar] [CrossRef] [Green Version]
- Kammann, U.; Aust, M.-O.; Bahl, H.; Lang, T. Marine litter at the seafloor—Abundance and composition in the North Sea and the Baltic Sea. Mar. Pollut. Bull. 2018, 127, 774–780. [Google Scholar] [CrossRef] [PubMed]
- Urban-Malinga, B.; Wodzinowski, T.; Witalis, B.; Zalewski, M.; Radtke, K.; Grygiel, W. Marine litter on the seafloor of the southern Baltic. Mar. Pollut. Bull. 2018, 127, 612–617. [Google Scholar] [CrossRef]
- Fortibuoni, T.; Ronchi, T.; Macic, V.; Mandic, M.; Mazziotti, M.; Peterlin, M.; Prevenio, M.; Prvan, M.; Somarakis, S.; Tutman, P.; et al. A harmonized and coordinated assessment of the abundance and composition of seafloor litter in the Adriatic-Ionian macroregion (Mediterranean Sea). Mar. Pollut. Bull. 2019, 139, 412–426. [Google Scholar] [CrossRef] [PubMed]
- Zablotski, Y.; Kraak, S.B.M. Marine litter on the Baltic seafloor collected by the international fish-trawl survey. Mar. Pollut. Bull. 2019, 141, 448–461. [Google Scholar] [CrossRef] [PubMed]
- Alomar, C.; Compa, M.; Deudero, S.; Guijarro, S. Spatial and temporal distribution of marine litter on the seafloor of the Balearics Islands (western Mediterranean Sea). Deep. -Sea Res. Part I 2020, 155, 103178. [Google Scholar] [CrossRef]
- Compa, M.; Alomar, C.; Mourre, B.; March, D.; Tintoré, J.; Deudero, S. Nearshore spatio-temporal sea surface trawls of plastic debris in the Balearic Islands. Mar. Environ. Res. 2020, 158, 104945. [Google Scholar] [CrossRef]
- Stefatos, A.; Charalampakis, M.; Papatheodorou, G.; Ferentinos, G. Marine debris on the seafloor of the Mediterranean Sea: Examples from two enclosed gulfs in Western Greece. Mar. Pollut. Bull. 1999, 36, 389–393. [Google Scholar] [CrossRef]
- Neves, D.; Sobral, P.; Pereira, T. Marine litter bottom trawls off the Portuguese coast. Mar. Pollut. Bull. 2015, 99, 301–304. [Google Scholar] [CrossRef] [PubMed]
- Olguner, M.T.; Olguner, C.; Mutlu, E.; Deval, M.C. Distribution and composition of benthic marine litter on the shelf of Antalya in the eastern Mediterranean. Mar. Pollut. Bull. 2018, 136, 171–176. [Google Scholar] [CrossRef]
- Pérez, M. Anàlisi de la Composició, Fonts i Estat de Degradació de les Deixalles Marines a la Costa de Barcelona. Projecte MARVIVA. Tram Vilanova—Arenys de Mar; Universitat de Barcelona: Barcelona, Spain, 2018. [Google Scholar]
- Galimany, E.; Marco-Herrero, E.; Soto, S.; Recasens, L.; Lombarte, A.; Lleonart, J.; Abelló, P.; Ramón, M. Benthic marine litter in shallow fishing grounds in the NW Mediterranean Sea. Waste Manag. 2019, 95, 620–627. [Google Scholar] [CrossRef] [PubMed]
- Crocetta, F.; Riginella, E.; Lezzi, M.; Tanduao, V.; Balestrieri, L.; Rizzo, L. Bottom-trawl catch composition in a highly polluted coastal area reveals multifaceted native biodiversity and complex communities of fouling organisms on litter discharge. Mar. Environ. Res. 2020, 155, 104875. [Google Scholar] [CrossRef] [PubMed]
- García-Rivera, S.; Sánchez Lizaso, J.L.; Bellido Millán, J.M. Composition, spatial distribution and sources of macro-marine litter on the Gulf of Alicante seafloor (Spanish Mediterranean. Mar. Pollut. Bull. 2017, 121, 249–259. [Google Scholar] [CrossRef] [PubMed] [Green Version]
- Katsanevakis, S.; Katsarou, A. Influences on the distribution of marine debris on the seafloor of shallow coastal areas. Water Air Soil Pollut. 2004, 159, 325–337. [Google Scholar] [CrossRef]
- Abu-Hilal, A.; Al-Najjar, T. Marine litter in coral reef areas along the Jordan Gulf of Aqaba, Red Sea. J. Environ. Manag. 2009, 90, 1043–1049. [Google Scholar] [CrossRef]
- Mutlu, E.; Özvarol, Y.; Sahin, A.; Sila Duman, G.; Karaca, D. Macro litter distribution of the Turkish Mediterranean coasts dominated by pleasure crafts. Mar. Pollut. Bull. 2020, 151, 1108333. [Google Scholar] [CrossRef]
- Keller, A.A.; Fruh, E.L.; Johnson, M.M.; Simon, V.; McGourty, C. Distribution and abundance of anthropogenic marine debris along the shelf and slope of the US West Coast. Mar. Pollut. Bull. 2010, 60, 692–700. [Google Scholar] [CrossRef]
- Ramírez-Lolodra, E.; De Mol, B.; Company, J.B.; Coll, M.; Sardà, F. Effects of natural and anthropogenic processes in the distribution of marine litter in the deep Mediterranean sea. Prog. Oceanogr. 2013, 118, 273–287. [Google Scholar] [CrossRef]
- Turrell, W.R. How litter moves along a macro tidal mid-latitude coast exposed to a coastal current. Mar. Pollut. Bull. 2020, 160, 111600. [Google Scholar] [CrossRef]
- Spedicato, M.T.; Massutí, E.; Mérigot, B.; Tserpes, G.; Jadaud, A.; Relini, G. The MEDITS trawl survey specifications in an ecosystem approach to fishery management. Sci. Mar. 2019, 83, 9–20. [Google Scholar] [CrossRef]
- Ioakeimidis, C.; Zeri, C.; Kaberi, H.; Galatchi, M.; Antoniadis, K.; Streftaris, N.; Galgani, F.; Papathanasiu, E.; Papatheodorou, G. A comparative study of marine litter on the seafloor of coastal areas in the Eastern Mediterranean and Black Seas. Mar. Pollut. Bull. 2014, 89, 296–304. [Google Scholar] [CrossRef] [PubMed] [Green Version]
- Fleet, D.; Vlachogianni, T.; Hanke, G. A Joint List of Litter Categories for Marine Macrolitter Monitoring; EUR 30348 EN, Publications Office of the European Union: Luxemburg, 2021; Available online: https://publications.jrc.ec.europa.eu/repository/handle/JRC121708 (accessed on 10 August 2021).
- Strafella, P.; Fabi, G.; Spagnolo, A.; Grati, F.; Polidroi, P.; Punzo, E.; Fortibuoni, T.; Marceta, B.; Raicevich, S.; Cvitkovi, I.; et al. Spatial pattern and weight of seabed marine litter in the northern and central Adriatic Sea. Mar. Pollut. Bull. 2015, 91, 120–127. [Google Scholar] [CrossRef] [PubMed]
- Pasquini, G.; Ronchi, F.; Strafella, P.; Scarcella, G.; Fortibuoni, T. Seabed litter composition, distribution and sources in the Northern and Central Adriatic Sea (Mediterranean). Waste Manag. 2016, 58, 41–51. [Google Scholar] [CrossRef] [PubMed]
- Mordecai, G.; Tayler, P.A.; Masson, D.G.; Huvenne, V.A.I. Litter in submarine canyons off the west coast of Portugal. Deep. Sea Res. Part II Trop. Stud. Oceanogr. 2011, 58, 2489–2496. [Google Scholar] [CrossRef]
- Rodríguez, Y.; Pham, C.K. Marine litter on the seafloor of the Faial-Pico Passage, Azores Archipielago. Mar. Pollut. Bull. 2017, 116, 448–453. [Google Scholar] [CrossRef]
- Moncheva, S.; Stefanova, K.; Krastev, A.; Apostolov, A.; Bat, L.; Sezgin, M.; Sahin, F.; Timofte, F. Marine litter quantification in the Black Sea: A pilot assessment. Turk. J. Fish. Aquat. Sci. 2016, 16, 213–218. [Google Scholar] [CrossRef]
- Van Cauwenberghe, L.; Claessen, M.; Vandegehuchte, M.B.; Mees, J.; Janssen, C.R. Assessment of marine debris on the Belgian Continental Shelf. Mar. Pollut. Bull. 2013, 73, 161–169. [Google Scholar] [CrossRef] [PubMed]
- Mourgkogiannisa, N.; Kalavrouziotisb, I.K.; Karapanagiotia, H.K. Questionnaire-based survey to managers of 101 wastewater treatment plants in Greece confirms their potential as plastic marine litter sources. Mar. Pollut. Bull. 2018, 133, 822–827. [Google Scholar] [CrossRef]
- Rees, G.; Pond, K. Marine litter monitoring programmes—A review of methods with special references to national surveys. Mar. Pollut. Bull. 1995, 30, 103–108. [Google Scholar] [CrossRef]
- Hasting, E.; Potts, T. Marine litter: Progress in developing an integrated policy approach in Scotland. Mar. Policy 2013, 42, 49–55. [Google Scholar] [CrossRef]
- Raubenheimer, K.; McIlgorm, A. Is the Montreal Protocol a model that can help solve the global marine plastic debris problem? Mar. Policy 2017, 81, 322–329. [Google Scholar] [CrossRef] [Green Version]
- European Commission. European Strategy for Plastics in a Circular Economy; European Commission: Brussels, Belgium, 2018; Available online: https://eur-lex.europa.eu/legal-content/EN/TXT/?uri=CELEX%3A52018DC0028 (accessed on 4 May 2021).
- Patrício Silva, A.L.; Prat, J.C.; Walker, T.R.; Campos, D.; Duarte, A.C.; Soares, A.M.V.M.; Barceló, D.; Rocha-Santos, T. Rethinking and optimising plastic waste management under COVID-19 pandemic: Policy solutions based on redesign and reduction of single-use plastics and personal protective equipment. Sci. Total Environ. 2020, 742, 140565. [Google Scholar] [CrossRef]
- De-la-Torre, G.E.; Aragaw, T.A. What we need about PPE associated with the COVID-19 pandemic in the marine environment. Mar. Pollut. Bull. 2021, 163, 111879. [Google Scholar] [CrossRef]
Figure 1.
Area of study: sampling locations, aquaculture areas, isobaths, ports, and main towns.

Figure 2.
Distribution of fishing days according to the density of marine litter.


Table 1.
Abundance, characterization, and frequency of marine litter.
| Material (UNEP/IOC–EU MSFD) | Items | Daily Mean Items (SD) | Density (Items km−2) |
|---|---|---|---|
| Plastic (PL–pl) | 2093 (77.8%) | 37.3 (25.61) | 100.9 |
| Metal (ME–me) | 260 (9.7%) | 4.6 (3.20) | 12.6 |
| Paper and cardboard (PC–pp) | 130 (4.8%) | 2.3 (1.74) | 6.3 |
| Cloth (CL–ct) | 94 (3.5%) | 1.7 (1.34) | 4.6 |
| Glass and ceramics (GC–gc) | 70 (2.6%) | 1.3 (1.16) | 3.4 |
| Anthropogenic wood (WD–wo) | 23 (0.9%) | 0.4 (0.65) | 1.2 |
| Rubber (RB–ru) | 21 (0.7%) | 0.4 (0.63) | 1.0 |
| Total | 2691 | 48.0 (28.24) | 130.0 |
Table 2.
Frequency and abundance of main plastic objects.
| Plastic Objects (UNEP/IOC–EU MSFD) | Frequency | Density (Items km−2) |
|---|---|---|
| Plastic bags (PL07–J3/J4) | 40.4% | 40.8 |
| Sanitary waste (OT02- *) | 25.6% | 25.7 |
| Bottles < 2 L (PL02) | 13.8% | 13.9 |
| Food containers (PL06–J224) | 7.8% | 7.9 |
| Monofilament line (PL18–J59) | 5.2% | 5.3 |
| Sheeting (PL16–J67/J220) | 1.5% | 1.5 |
| Other plastic objects | 5.7% | 5.8 |
| Total | 100% | 100.9 |
* EU MSFD: J96, J97, J98, J144 and J237.
Table 3.
Frequency and abundance of marine litter by materials: July–August and September 2018.
| Material | July–August | September | ||
|---|---|---|---|---|
| Codes | Frequency | Density (Items km−2) | Frequency | Density (Items km−2) |
| PL–pl | 74.9% | 90.9 | 83.2% | 123.6 |
| ME–me | 11.1% | 13.4 | 7.1% | 10.5 |
| PC–pp | 5.5% | 6.7 | 3.6% | 5.4 |
| CL–co | 4.0% | 4.9 | 2.5% | 3.7 |
| GC–gc | 2.5% | 3.1 | 2.8% | 4.1 |
| WD–wo | 1.1% | 1.3 | 0.4% | 0.6 |
| RB–ru | 0.9% | 1.2 | 0.4% | 0.6 |
| Total | 100% | 121.5 | 100% | 148.5 |
Table 4.
Frequency and abundance of marine litter by materials: sea depth ≤100 m and >100 m.
| Material | Sea Depth ≤ 100 m | Sea Depth > 100 m | ||
|---|---|---|---|---|
| Codes | Frequency | Density (Items km−2) | Frequency | Density (Items km−2) |
| PL–pl | 81.9% | 157.3 | 67.4% | 48.3 |
| ME–me | 7.9% | 15.1 | 14.2% | 10.1 |
| PC–pc | 3.6% | 6.8 | 8.1% | 5.8 |
| CL–co | 2.9% | 5.6 | 4.9% | 3.5 |
| GC–gc | 2.2% | 4.2 | 3.6% | 2.6 |
| WD–wo | 0.8% | 1.6 | 0.9% | 0.6 |
| RB–ru | 0.7% | 1.4 | 0.9% | 0.6 |
| Total | 100% | 192 | 100% | 71.5 |
Table 5.
Frequency and abundance of main plastic objects: sea depth ≤ 100 m and >100 m.
| Plastic Objects | Sea Depth ≤ 100 m | Sea Depth > 100 m | ||
|---|---|---|---|---|
| Frequency | Density (Items km−2) | Frequency | Density (Items km−2) | |
| Plastic bags | 38.6% | 60.7 | 46.1% | 22.2 |
| Sanitary waste | 31.8% | 50.0 | 6.7% | 3.3 |
| Bottles < 2 L | 12.3% | 19.4 | 18.3% | 8.9 |
| Food containers | 7.4% | 11.7 | 8.9% | 4.3 |
| Monofilament line | 3.7% | 5.8 | 9.8% | 4.7 |
| Other plastic objects | 6.2% | 9.8 | 10.2% | 4.9 |
| Total | 100% | 157.3 | 100% | 48.3 |
Publisher’s Note: MDPI stays neutral with regard to jurisdictional claims in published maps and institutional affiliations. |
© 2021 by the authors. Licensee MDPI, Basel, Switzerland. This article is an open access article distributed under the terms and conditions of the Creative Commons Attribution (CC BY) license (https://creativecommons.org/licenses/by/4.0/).
Share and Cite
MDPI and ACS Style
Saladié, Ò.; Bustamante, E. Abundance and Composition of Marine Litter on the Seafloor of the Gulf of Sant Jordi (Western Mediterranean Sea). Environments 2021, 8, 106. https://0-doi-org.brum.beds.ac.uk/10.3390/environments8100106
AMA Style
Saladié Ò, Bustamante E. Abundance and Composition of Marine Litter on the Seafloor of the Gulf of Sant Jordi (Western Mediterranean Sea). Environments. 2021; 8(10):106. https://0-doi-org.brum.beds.ac.uk/10.3390/environments8100106
Chicago/Turabian StyleSaladié, Òscar, and Edgar Bustamante. 2021. "Abundance and Composition of Marine Litter on the Seafloor of the Gulf of Sant Jordi (Western Mediterranean Sea)" Environments 8, no. 10: 106. https://0-doi-org.brum.beds.ac.uk/10.3390/environments8100106
Note that from the first issue of 2016, this journal uses article numbers instead of page numbers. See further details here.