1. Introduction
The conversion from fossil to renewable energy sources has become vital to dampen the climate change effects on the environment. Due to this realization, it has been predicted that 70% of global energy generation by 2023 will be led by solar photovoltaic (solar PV), wind, hydropower and bioenergy [
1]. Climate and weather conditions have a strong influence on energy demand, and with the strong development of the renewable energies, electricity generation has also been affected [
2]. The changes of the European energy mix together with ongoing climate change raises several questions regarding the adaptation of the energy supply system to its environment. A detailed assessment is required to determine the effects of climate change on the operation of power systems. To address these issues, the project CLIM2POWER (C2P) (
https://clim2power.com/) aims to create a bridge between complex scientific model-based knowledge and targeted usable information for end-users by developing a web-based climate service, at seasonal and long-term timescales, to estimate how climate impacts hydro, wind and solar power production and infrastructures operation, electricity demand and the whole integrated power system.
The project includes study areas in various countries (Portugal, Sweden, Germany, Austria and France) and the resulting web service provides the connection between climate data, hydrological models, renewable energy sources, energy simulation tools and models of the energy system in an interactive user-friendly. C2P generally targets processing and quantification of energy related information thus providing valuable support to the decision making process of both private (e.g., companies in the power market) and public relevant entities (e.g., power market regulators, and water and environment authorities), as well as market based water energy service providers. Some of these interested parts are represented within the C2P project end user Board.
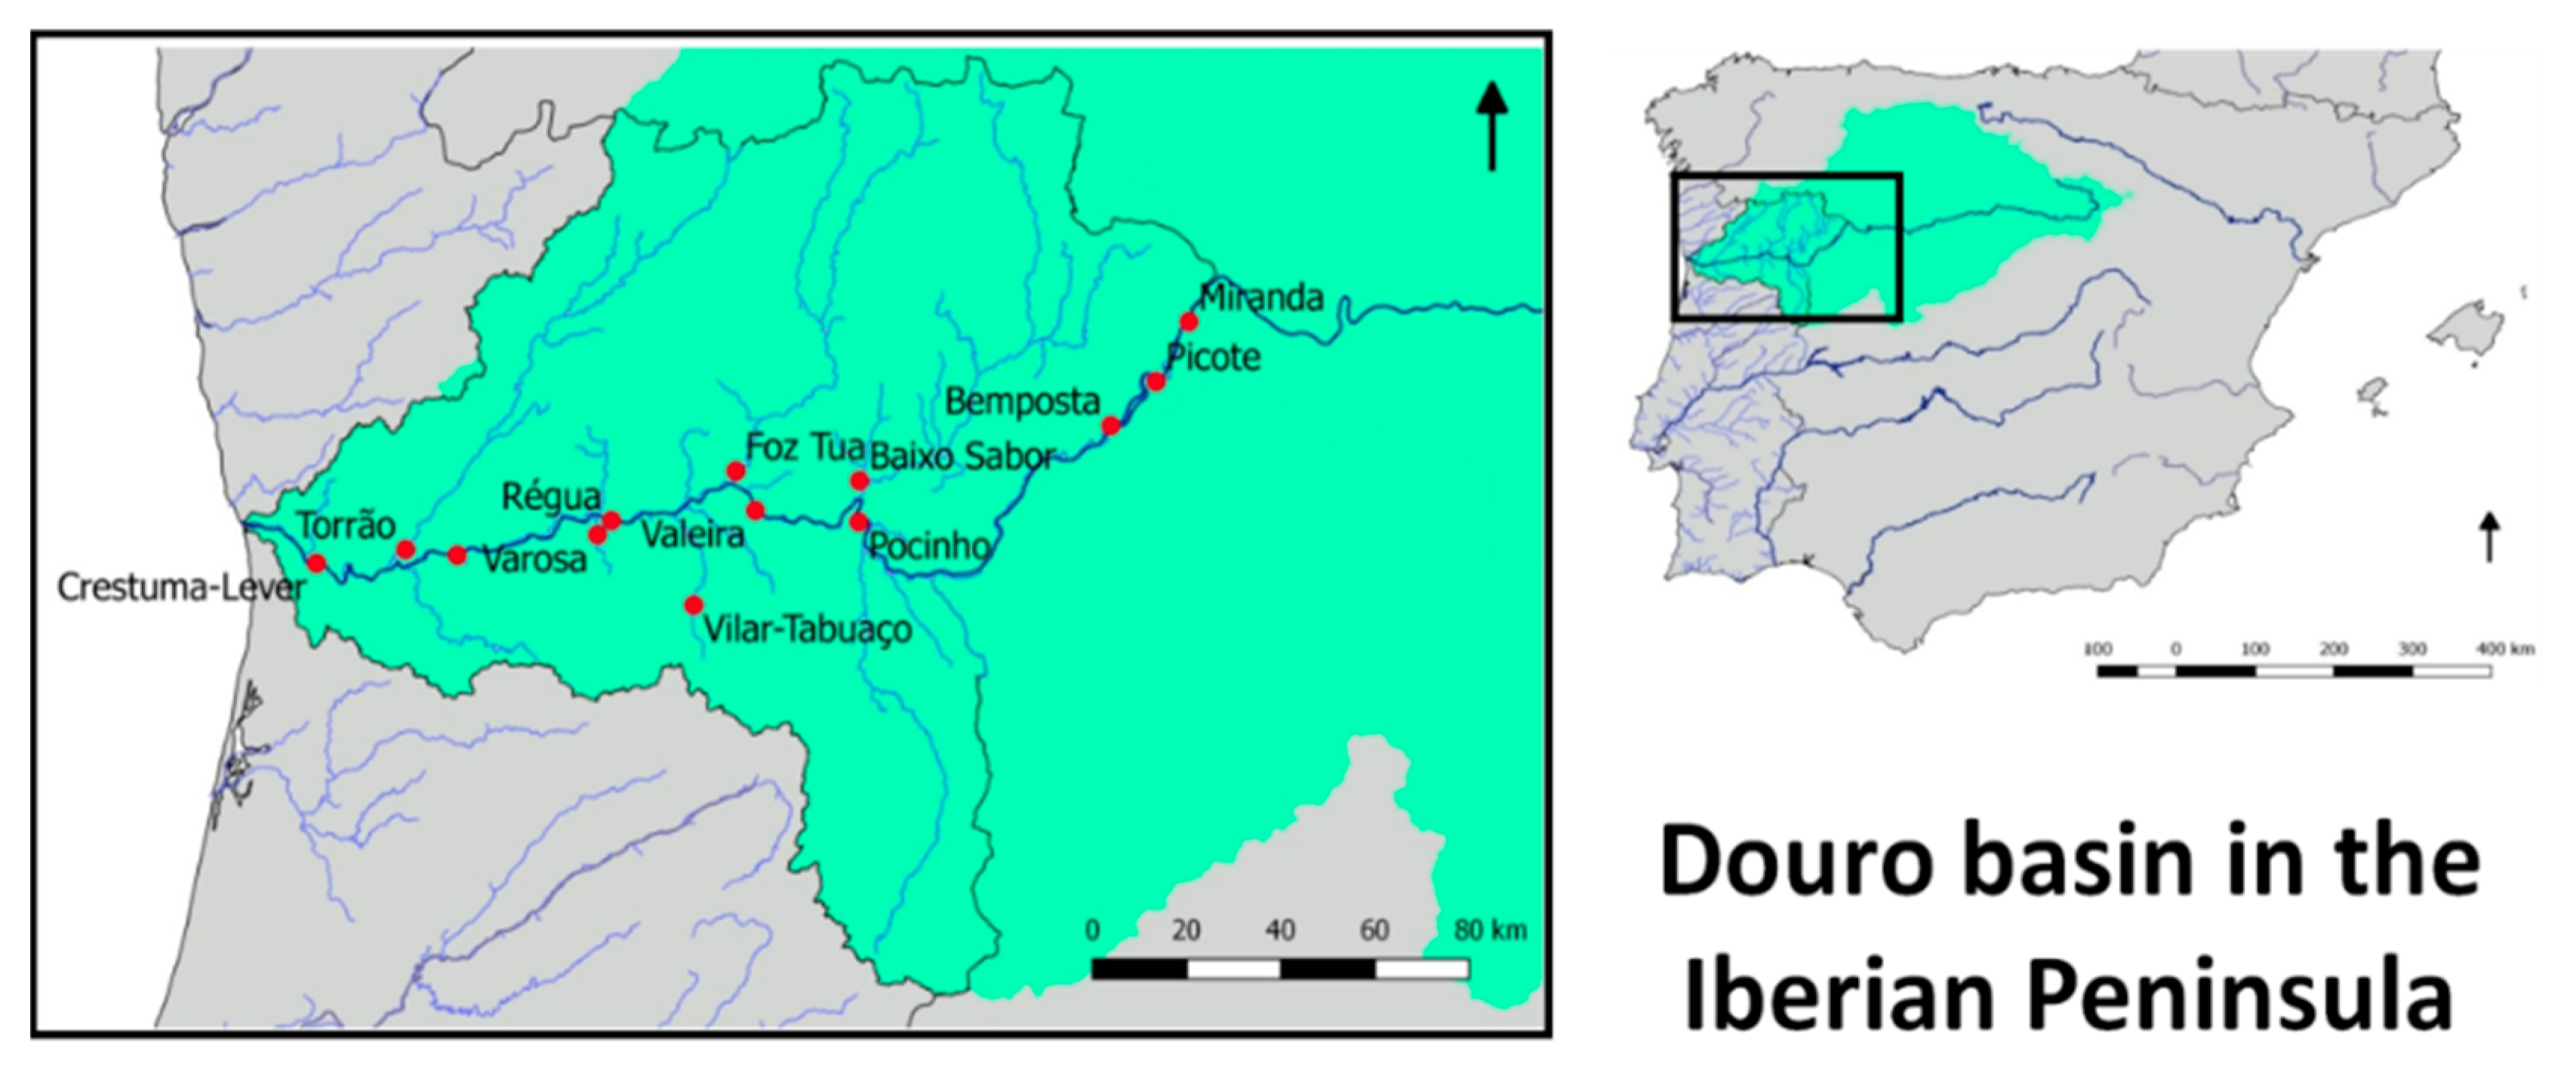
The present study describes part of the C2P project, addressing the forecasting of the outflows and energy generation from the hydropower dams (reservoirs) in the Portuguese part of the transboundary Douro River basin (
Figure 1). For that purpose, seasonal daily precipitation forecasts for six months periods are used as inputs to the hydrological modelling of the basin using the HEC-HMS (Hydrologic Engineering Center—Hydrologic Modeling System) model. Transboundary inflows from the Spanish part of the Douro basin that is, inflows into the first reservoir located along the Douro River in Portugal (Miranda reservoir—see
Figure 1), were estimated according to historical observed inflows and wet, dry and medium scenarios were defined and crossed with simulated runoff obtained for the Portuguese part of the basin.
2. Methods
This section outlines the methodology used for translating the climate data into hydropower production (
Figure 2). The seasonal forecast data series include daily precipitation, wind, solar radiation and temperature, climate variables which were used to estimate potential energy production and use. Regarding hydropower production, precipitation forecasts were used as input for the HEC-HMS hydrological model, previously calibrated for each dam river basin using observed data. Runoff simulations are used to simulate reservoir inflows, which, in turn, are used to calculate potential electricity production in each dam and according to the basin water balance and installed hydropower capacity.
2.1. Study Area
The Douro is the largest Iberian river basin (97,290 km
2), with 78,954 km
2 in Spain and 18,336 km
2 in Portugal (respectively, 15.6% and 19.8% of each national territory), which corresponds to 17% of the Peninsular area. The Douro catchment represents around 50% of Portugal’s hydropower production, including a total 66 hydropower plants, 13 of which have an installed capacity above 15 MW. These 13 hydropower plants represent more than 90% of the total installed capacity in the Portuguese Douro catchment (
Figure 1). Out of these 13, five hydropower plants are located in tributary rivers (
Table 1).
2.2. Hydrological Model Calibration for Portuguese Territory
The calibration procedure is an essential step within the process of the implementation of a hydrological model. Thus, the HEC-HMS model [
3,
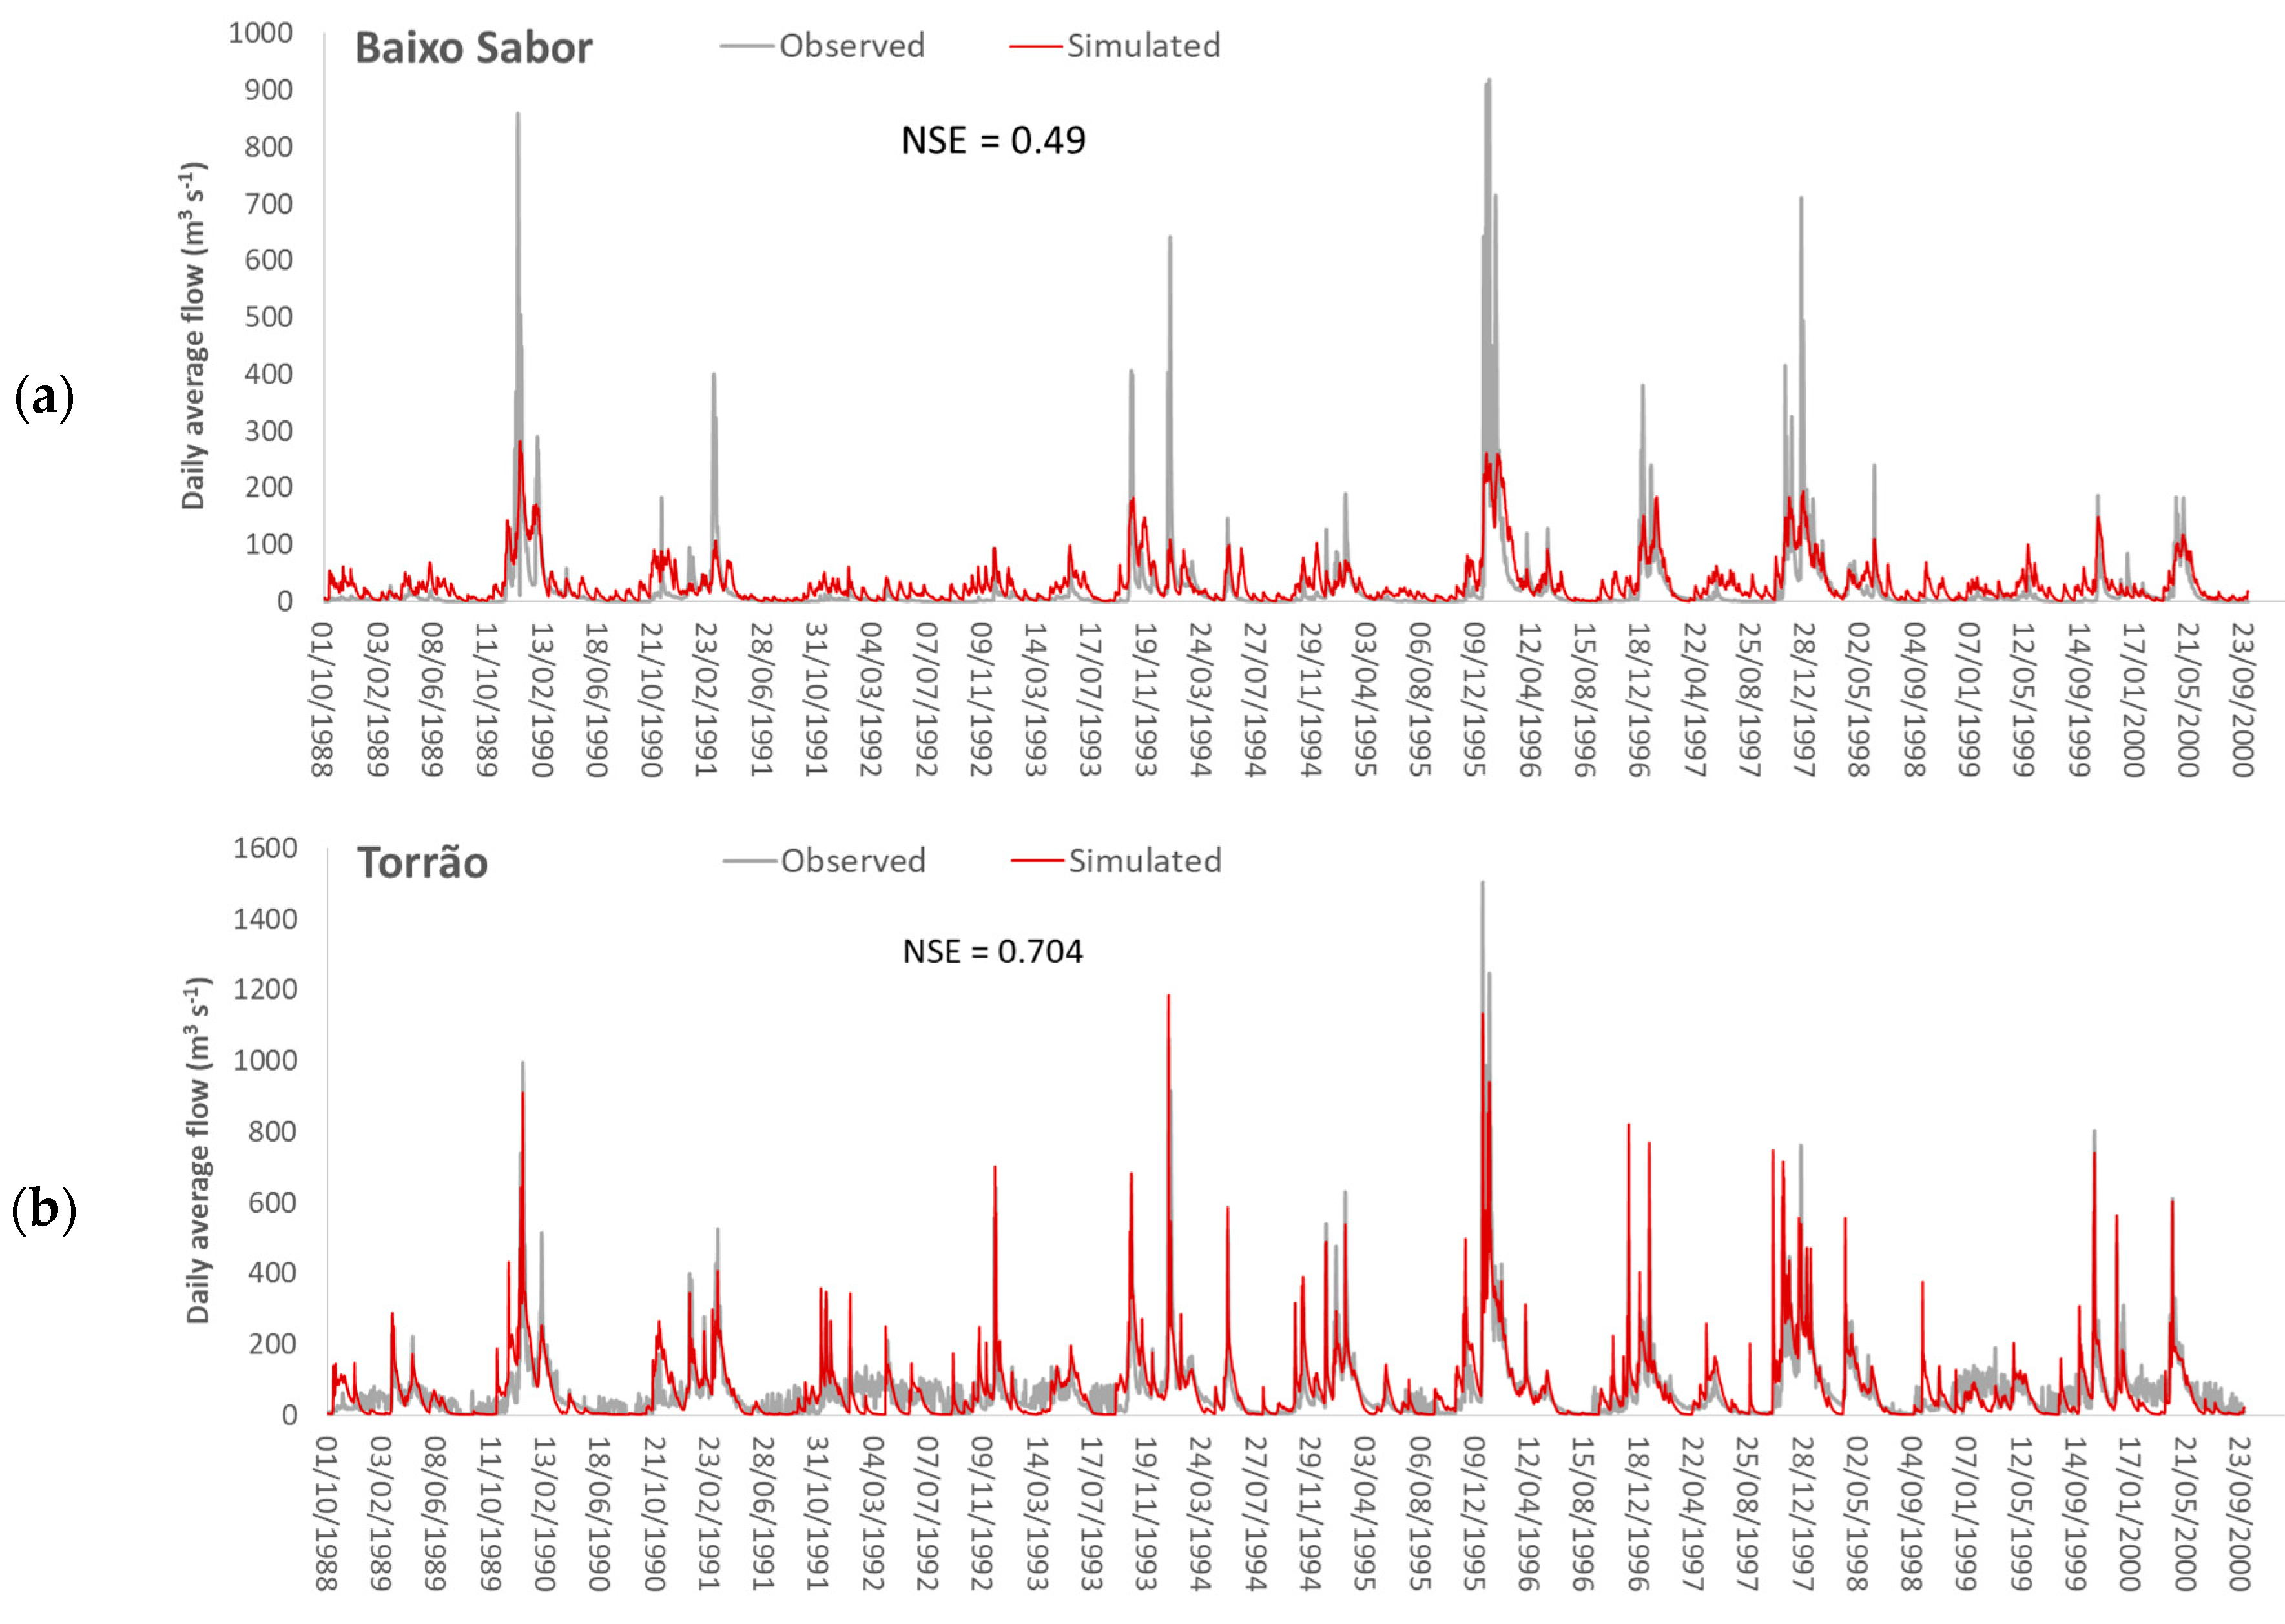
4] has been calibrated for the Douro catchment in Portugal, on a daily time scale. In the Portuguese Douro catchment, seven main tributary rivers have been considered: Paiva, Tâmega, Tua, Sabor, Côa, Varosa and Távora. The calibration period was established from 1988 to 2000.
HEC-HMS comprises multiple methodological approaches for simulation of each of the hydrograph parts that translate precipitation-runoff processes. For the case of the C2P project the Soil Conservation Service (SCS) unit hydrograph method was used for direct runoff computation, the linear reservoir method was used for the base flow calculations and the lag method was implemented for channel flow modeling. The overall performance of the hydrological model was evaluated using the Nash–Sutcliffe coefficient (NSE). This evaluation could only be implemented for the seven tributaries as for the Douro River most of the flow is originated in Spain. This procedure leaves out of the calibration process part of the national basin (drainage areas between each reservoir located along the Douro River) but the corresponding areas were not considered significant for this evaluation. NSE values ranging from 0.45 to 0.75 were obtained for the tributary catchments indicating satisfactory calibration of the hydrological model (e.g.,
Figure 3).
2.3. Reservoir Water Balance and Energy Production Procedure
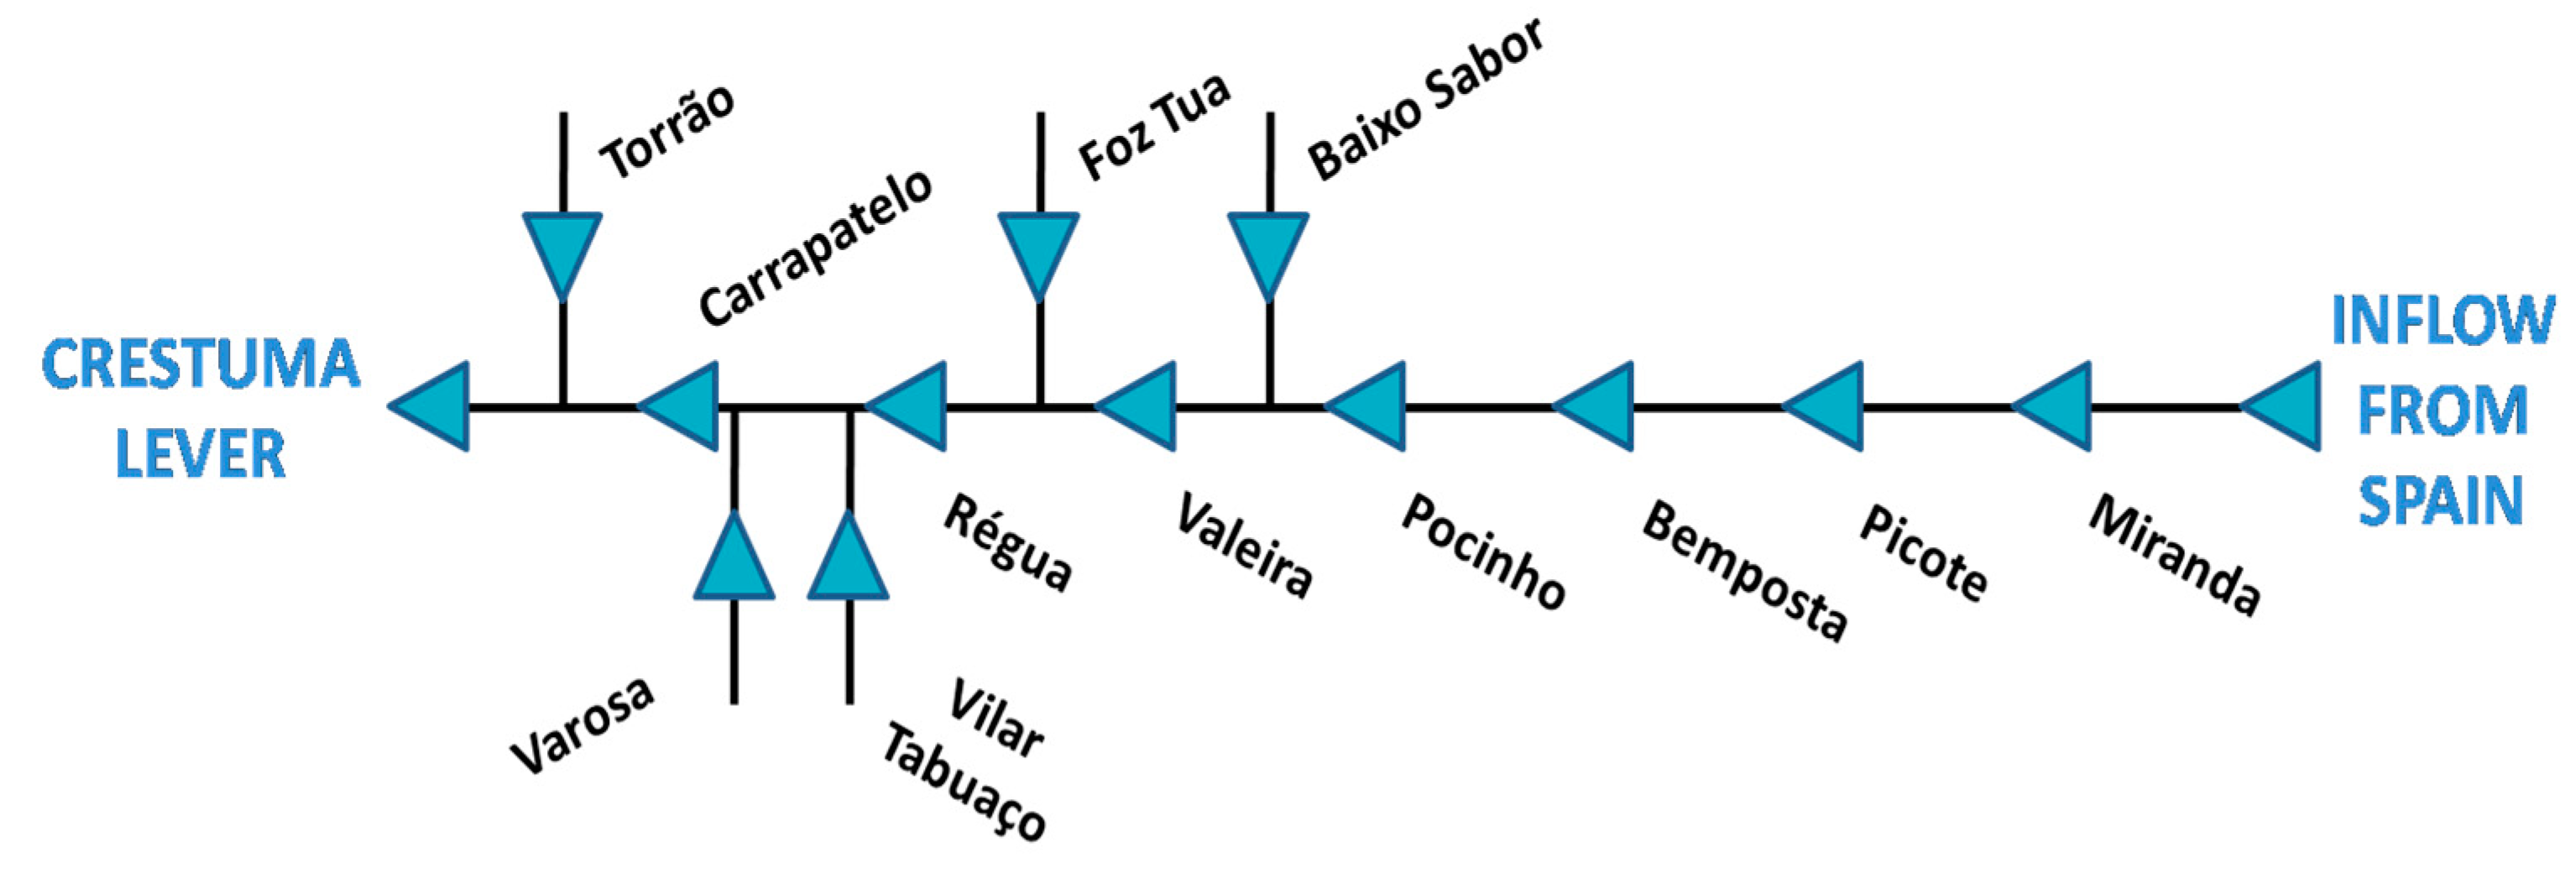
A water balance modelling procedure was implemented as a reservoir in series system (cascading reservoir system—
Figure 4) for the above mentioned 13 hydropower plant reservoirs (see
Figure 1 and
Table 1), using daily inflow data and storage—volume curves for each reservoir. For reservoirs along the Douro River, inflows from the upstream reservoir and from the intermediate catchment were considered. Transboundary inflows were introduced both at the Miranda and Pocinho reservoirs, both with significant drainage areas in Spanish territory.
For the purpose of establishing the main criteria for the operation of the hydropower plants, a general scenario was built on the following assumptions:
The total volume of water entering each reservoir in each day will result in electricity production, i.e., inflow will be equal to outflow; reservoir storage is considered constant.
On a given day, if no inflow is observed in the tributary reservoirs, no electricity will be produced.
If the water level of each reservoir is up to its maximum level, electricity will be produced up to the hydropower plant’s installed capacity and excess volumes will be discharged to the downstream reservoir through flood gates.
After obtaining the simulated outflows, capacity factors were calculated as the ratio between the daily energy generated and total energy generation capacity of each hydropower plant.
2.4. Scenarios for Seasonal Forecast Climate Data
Seasonal daily climate forecasts for six months (February–July 2019) were collected by the German Meteorological Center (DWD) (C2P partner) based on the German Climate Forecast System (GCFS 2.0) [
5]. The data are presented as a grid of 6 km
2 for the whole of Europe. Seasonal forecasts are presented as a set of 50 ensemble members, i.e., 50 seasonal simulations for the same time period based on 50 different initial conditions. Considering the high climate variability described by the 50 forecasts, on the basis of the total precipitation in the Portuguese basin obtained for each of these 50 ensemble members three ensemble members were selected: minimum, average and maximum six month precipitation (300, 562 and 782 mm). These scenarios were designated as DRY, AVERAGE and WET scenarios for Portugal and the corresponding daily hydrological modelling was implemented for the Portuguese watershed.
Regarding daily inflows from Spanish territory, inflow data for the Miranda reservoir, the first hydropower dam located in Portuguese territory (see
Figure 4), was used to define runoff scenarios. First of all, daily inflow data for the period 2004–2017 was aggregated into monthly data and then per hydrological year, i.e., from October–September. After that, wet, average and dry hydrological years were identified according to the probability of the occurrence of 0.85, 0.50 and 0.15 (2015/2016, 2014/2015 and 2011/2012). These scenarios were identified as WET, AVERAGE and DRY scenarios for Spain. Three scenarios from each country resulted in a total of 9 arrangements.
3. Results and Discussion
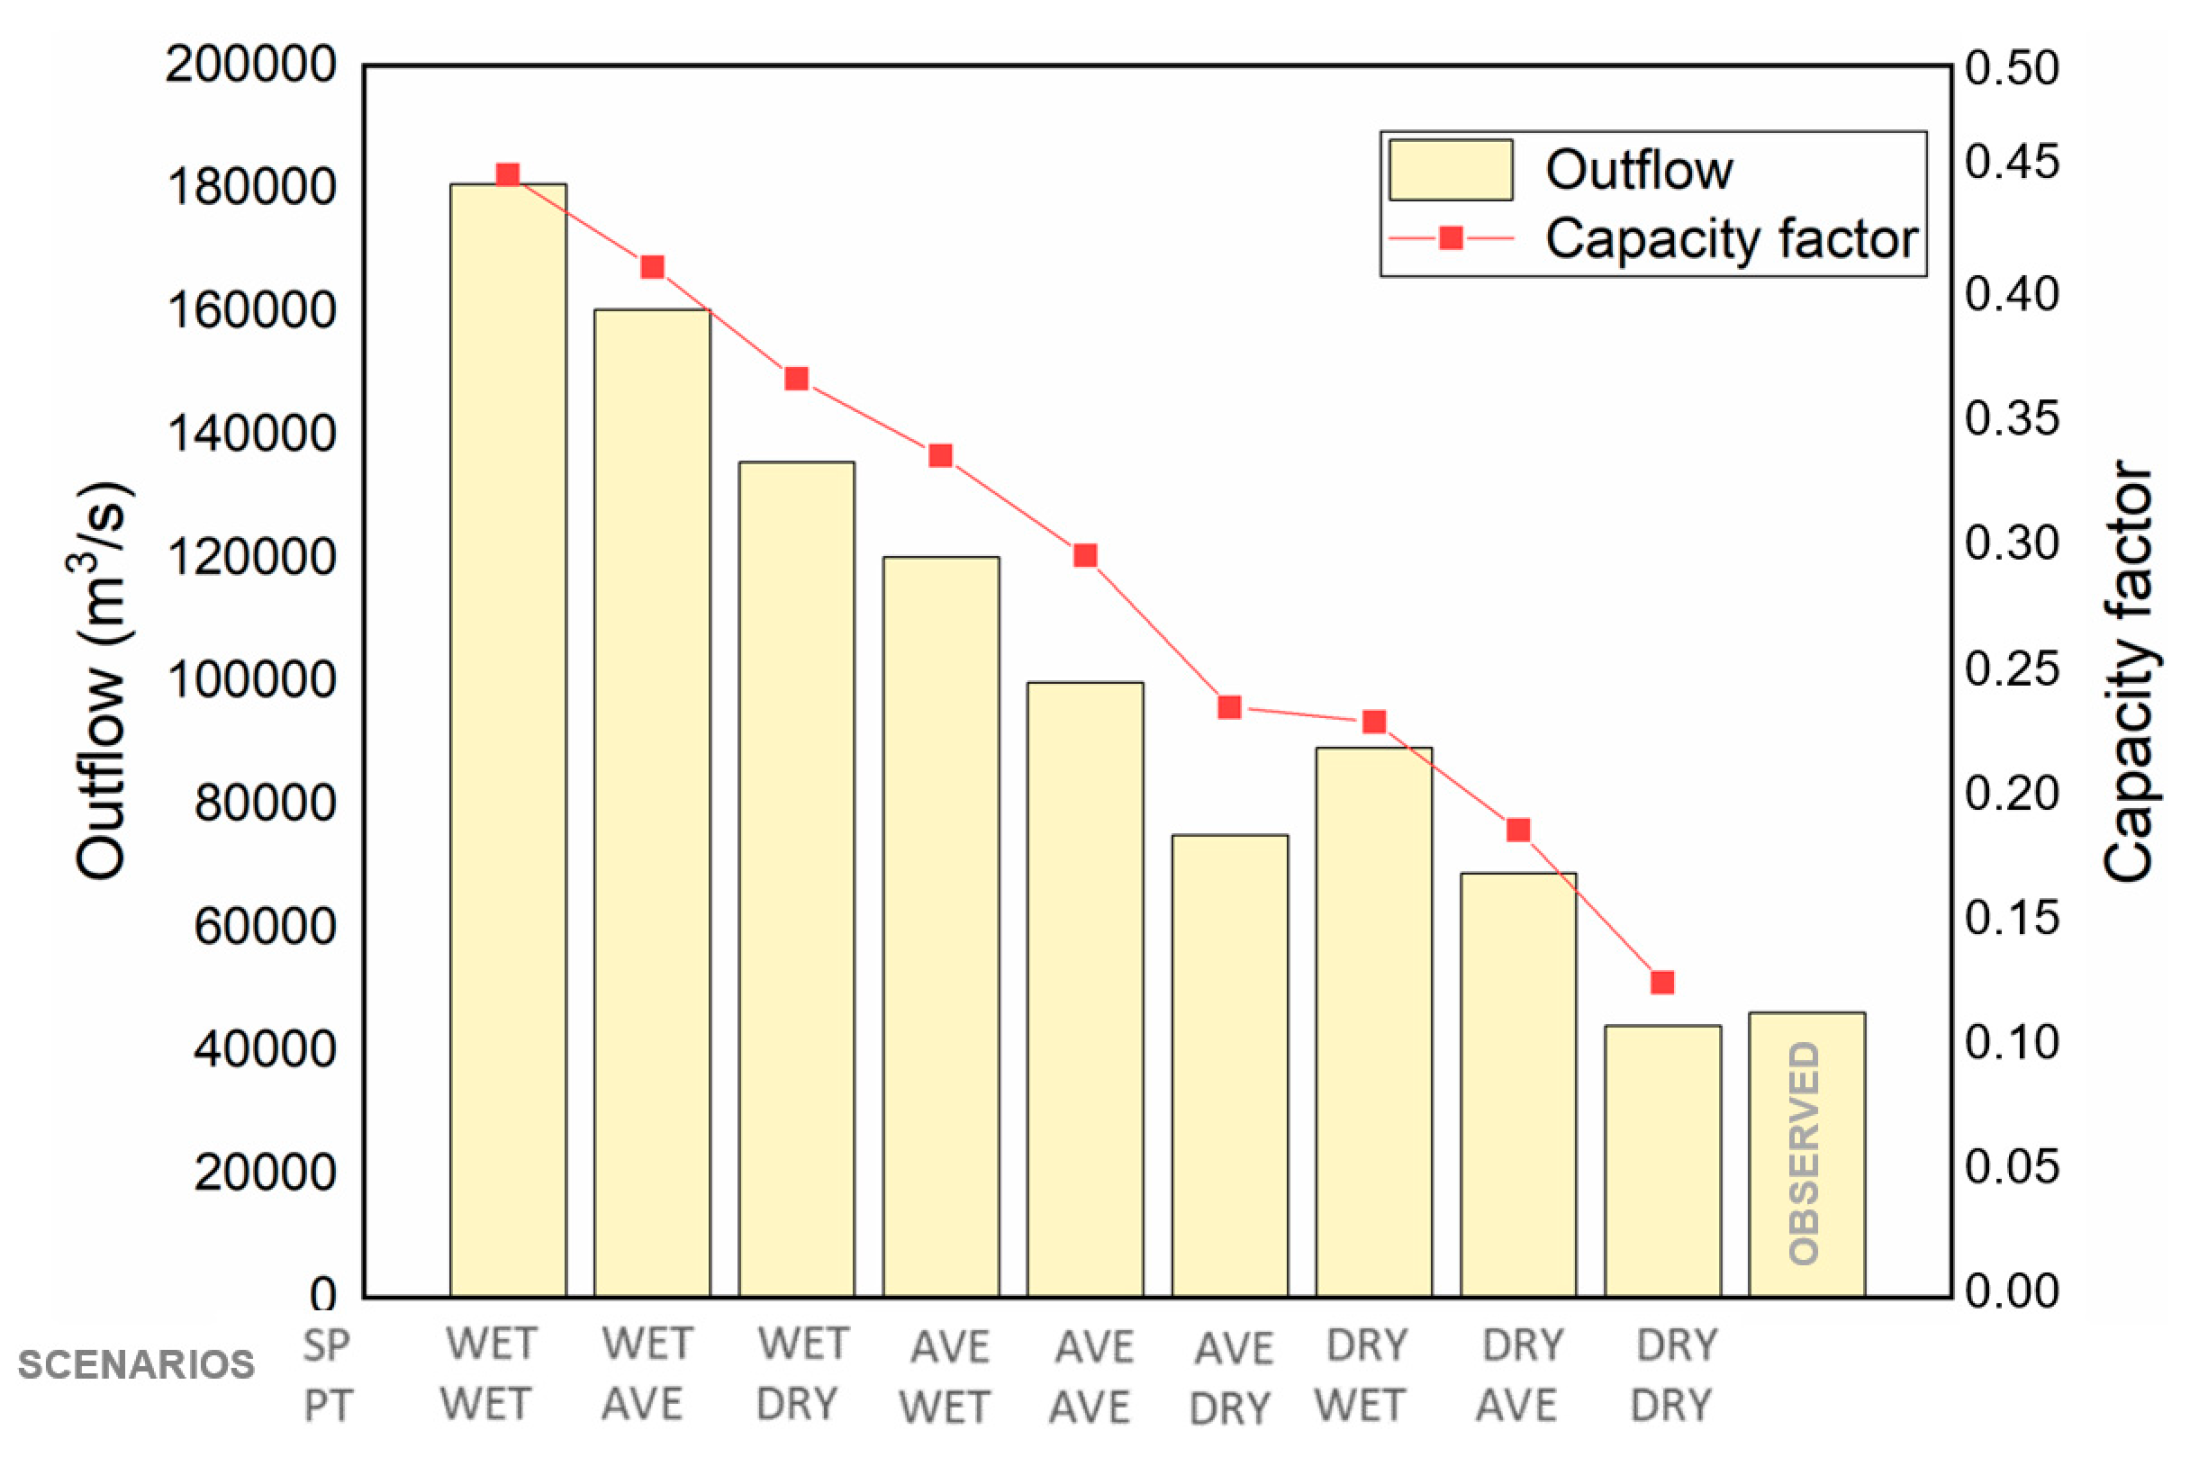
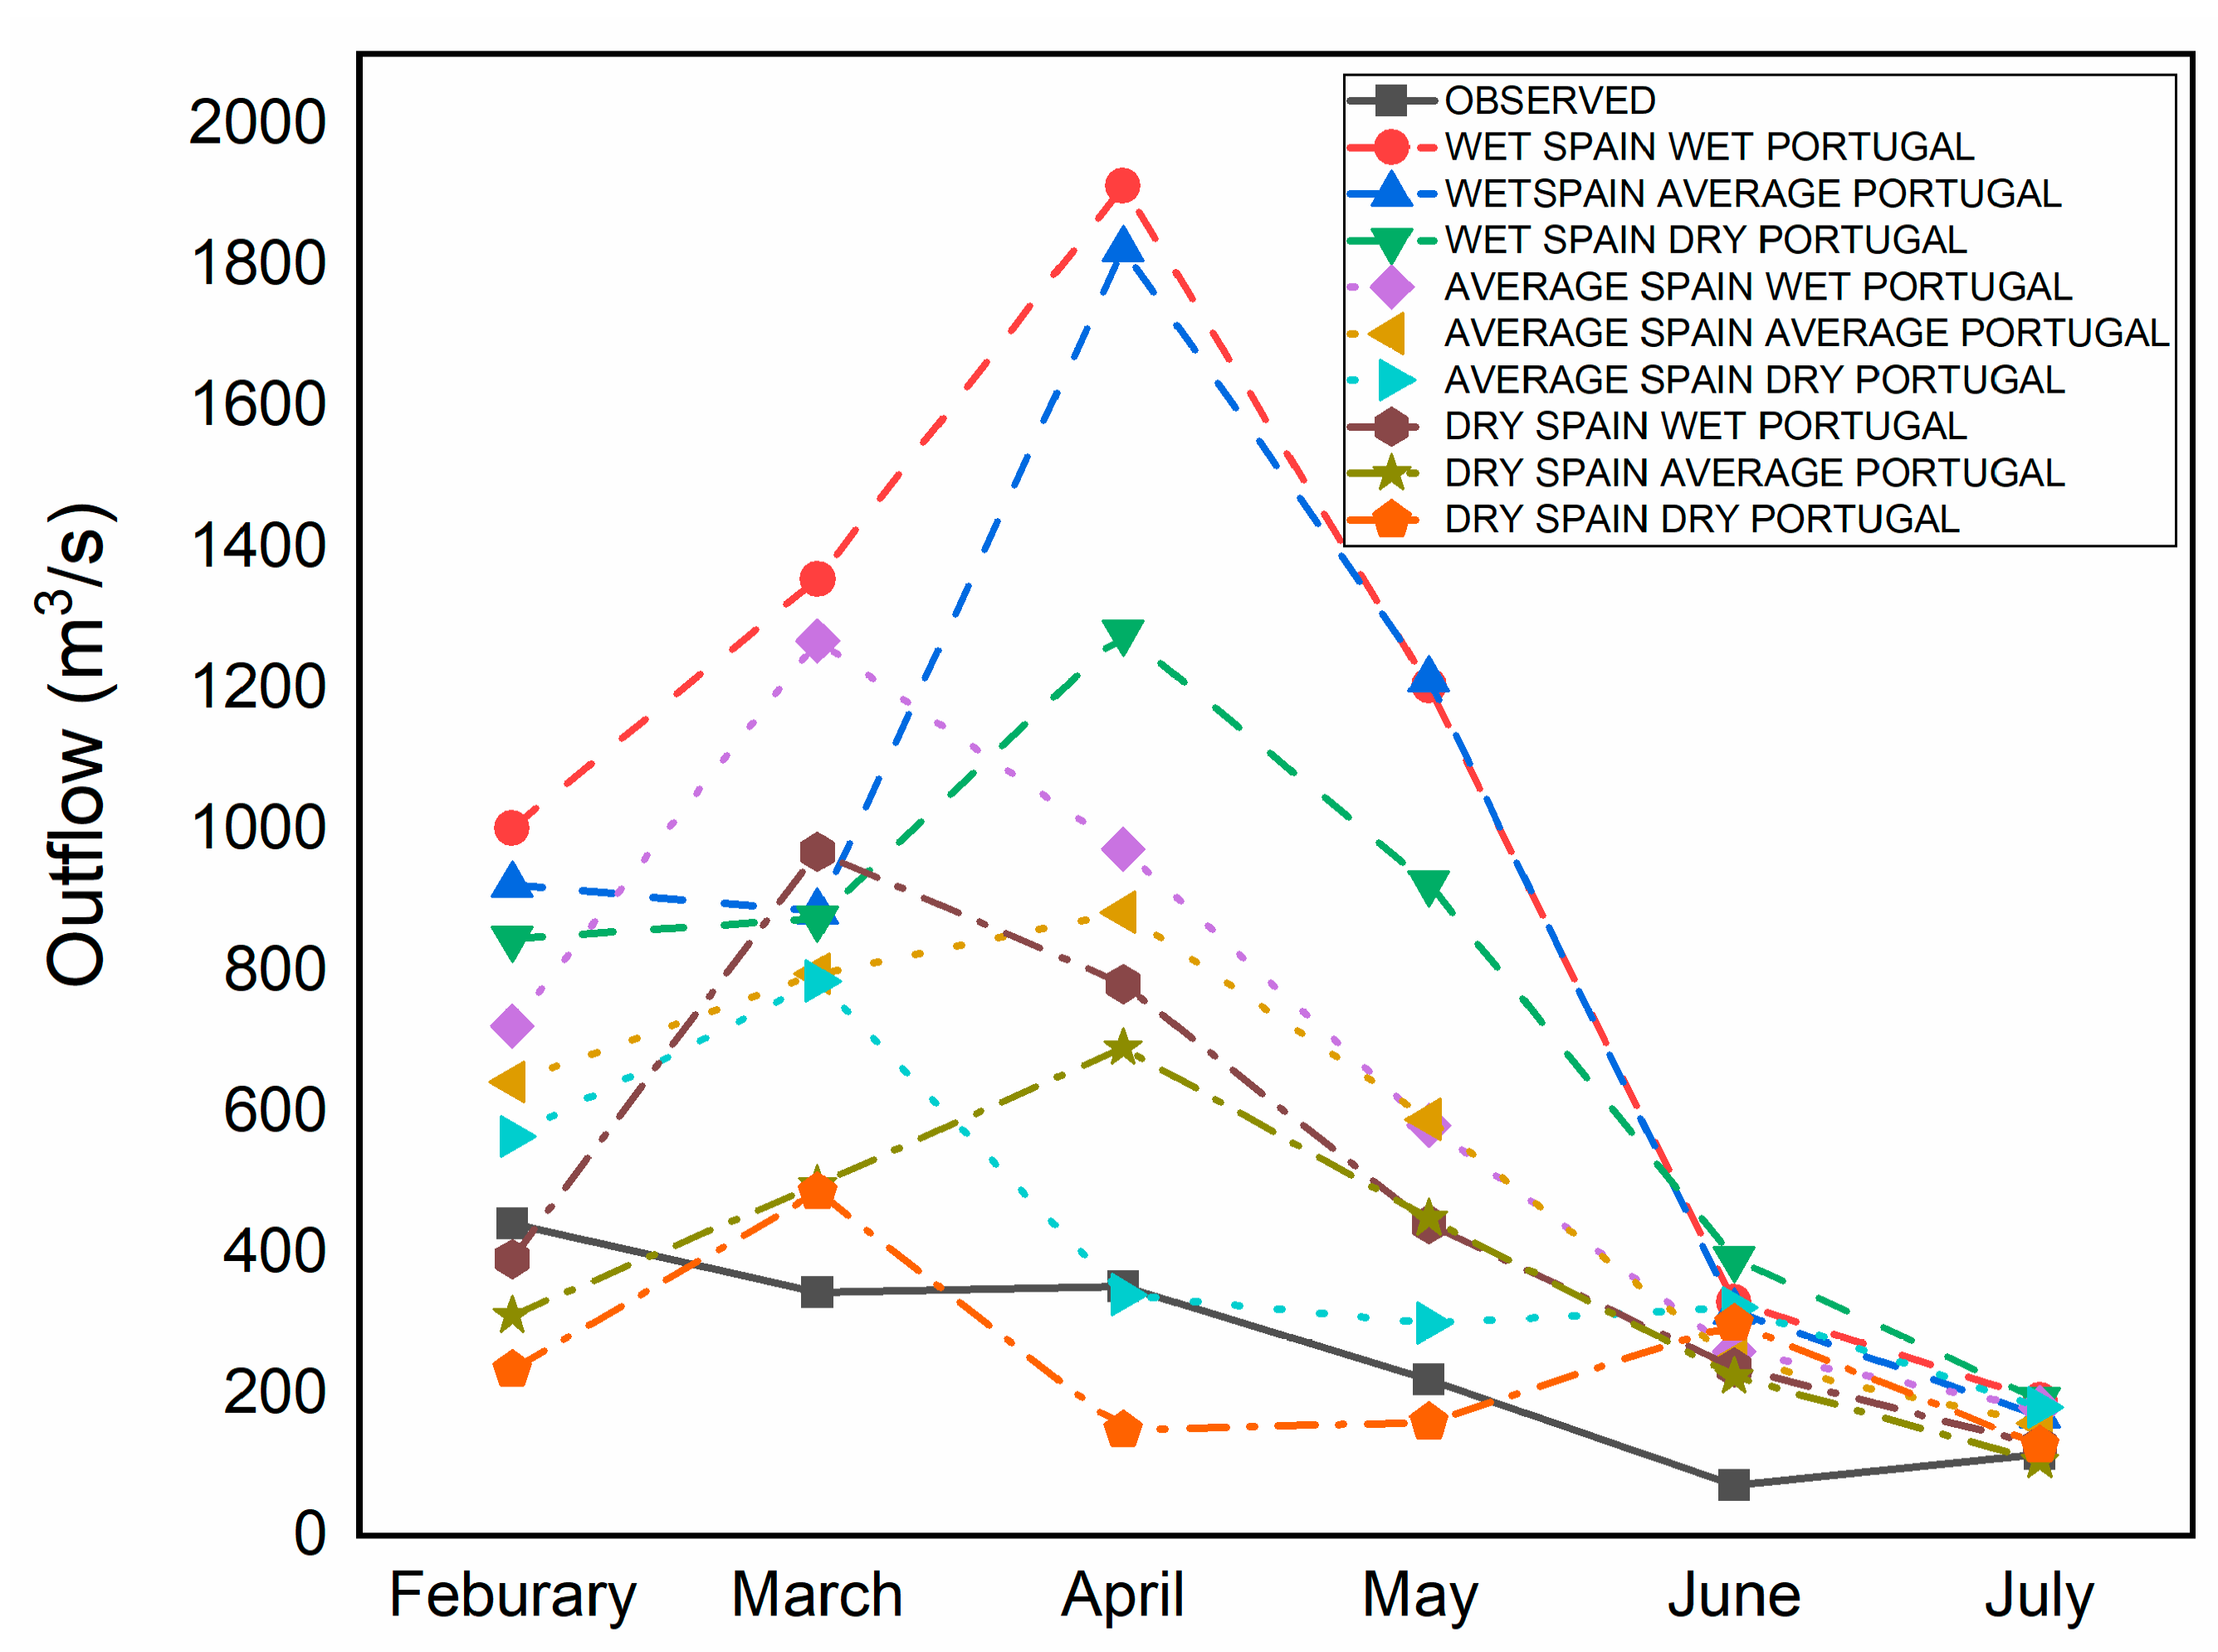
The results herein presented are limited to the Crestuma-Lever hydropower dam, the last downstream dam of the Douro basin (although results for all the dams are available). The observed and simulated total monthly outflows for six months for all nine arrangements are shown in
Figure 5. Three arrangements including maximum inflow from Spain (WET SPAIN) had the highest outflow in all the arrangements. With respect to observed outflow, the minimum difference (5%) was found for the scenario DRY SPAIN DRY PORTUGAL and the maximum was for WET SPAIN WET PORTUGAL (287%).
During the simulated period, observed inflows from Spain were 29% lower than those in the DRY SPAIN scenario, whereas the WET and AVERAGE SPAIN inflows were 338% and 119% higher. Additionally, the DRY PORTUGAL 6 month precipitation was the closest (albeit 72% higher) to the observed precipitation in the Portuguese drainage basin. The AVERAGE and WET PORTUGAL scenarios’ precipitation was 222% and 348% higher than the observed precipitation. These comparisons indicate that in reality, for the forecast period (February to July 2019), the flows in Spain and in Portugal can both be considered as dry periods, suggesting the modelling procedure adequately describes the behavior of the system. The resulting capacity factors ranged between 0.45 and 0.35 for three arrangements composed of maximum inflow from Spain (WET SPAIN). However, this range decreased to 0.25 to 0.13 when the inflow from Spanish territory was minimum (DRY SPAIN)
The monthly average outflows from the observed data and simulations for the 9 arrangements are shown in
Figure 6. All 9 arrangements’ outflows were closer to the observed values in the months of June and July. Interestingly, these two months’ observed outflows were the lowest in all six months.
Our results reflect the high dependence of flows in the Douro River from the Spanish territory. A probability-of-occurrence analysis of each arrangement is needed in order to make seasonal forecasting a better tool. Further research using seasonal data should be pursued in future studies, and also, improvements in the hydrological modelling of Spanish territory are required in order to realize the forecasting capability of seasonal climate data. The impact of reservoir operation procedures on reservoir outflows is another issue currently under study.
4. Conclusions
Seasonal climate forecasts for six months were used for the prediction of outflows and hydropower from 13 hydropower dams in the Douro basin, in Portugal. The results confirm that inflows from Spanish territory have a strong influence on the outflows from Portuguese reservoirs thus making hydropower production highly dependent on transboundary inflows. Transboundary inflows are not only dependent on meteorological conditions but also reservoir management in Spain as the Douro River is highly regulated. More importantly, climate forecasts variations the variations of flow obtained from the cascading of the models (climate, hydrological and water balance) are yet very significant.
Nevertheless, seasonal forecast represents an important step to better anticipate available energy resources and therefore determine appropriate dam operation procedures that not only target more efficient energy production but also ensure reservoir outflows that are in accordance with the goals of the water frame directive. Results from the C2P project are yet under thorough analysis as the overall results demonstrate a clear potential to improve decision making in the energy production and management sector. For the particular case of hydropower, the study under way as showed that the identification of the most likely meteorological scenarios is one of the tasks yet requiring further development.
Albeit some difficulties, the overall results herein presented demonstrate that the coupling of climate scenarios and hydrological models is an effective method to improve reservoir management towards hydropower production optimization.
Author Contributions
Conceptualization, P.A.D.; methodology, P.A.D.; writing—original draft preparation, B.M.; writing—review and editing, P.A.D., P.B., F.A. and S.S. All authors have read and agreed to the published version of the manuscript.
Funding
The project CLIM2POWER is part of ERA4CS, an ERA-NET initiated by JPI Climate and funded by FORMAS (SE), DLR (DE), BMWFW (AT), FCT (PT), EPA (IE) and ANR (FR), with co-funding from the European Union (grant 690462). MARE is financed by Fundação para a Ciência e Tecnologia.I.P., Portugal. CENSE is financed by Fundação para a Ciência e Tecnologia, I.P., Portugal (UID/AMB/04085/2019).
Acknowledgments
We are thankful to MARE-NOVA FCT for their support in this research.
Conflicts of Interest
The authors declare no conflict of interest.
References
- World Energy Outlook 2018. Available online: https://www.iea.org/reports/world-energy-outlook-2018 (accessed on 30 January 2020).
- Schaeffer, R.; Szklo, A.S.; de Lucena, A.F.P.; Borba, B.S.M.C.; Nogueira, L.P.P.; Fleming, F.P.; Troccoli, A.; Harrison, M.; Boulahya, M.S. Energy sector vulnerability to climate change: A review. Energy J. 2012, 38, 1–12. [Google Scholar] [CrossRef]
- Oleyiblo, J.O.; Li, Z.J. Application of HEC-HMS for flood forecasting in Misai and Wan’an catchments in China. Water Sci. Eng. 2010, 3, 14–22. [Google Scholar]
- Zhang, H.L.; Wang, Y.J.; Wang, Y.Q.; Li, D.X.; Wang, X.K. The effect of watershed scale on HEC-HMS calibrated parameters: A case study in the Clear Creek watershed in Iowa, US. Hydrol. Earth Syst. Sci. 2013, 17, 2735–2745. [Google Scholar] [CrossRef]
- Baehr, J.; Fröhlich, K.; Botzet, M.; Domeisen, D.I.V.; Kornblueh, L.; Notz, D.; Piontek, R.; Pohlmann, H.; Tietsche, S.; Müller, W.A. The prediction of surface temperature in the new seasonal prediction system based on the MPI-ESM coupled climate model. Clim. Dyn. 2015, 44, 2723–2735. [Google Scholar] [CrossRef]
| Publisher’s Note: MDPI stays neutral with regard to jurisdictional claims in published maps and institutional affiliations. |
© 2020 by the authors. Licensee MDPI, Basel, Switzerland. This article is an open access article distributed under the terms and conditions of the Creative Commons Attribution (CC BY) license (https://creativecommons.org/licenses/by/4.0/).


