Effects of Understory Shrub Biomass on Variation of Soil Respiration in a Temperate-Subtropical Transitional Oak Forest


1
State Key Laboratory of Cotton Biology, School of Life Sciences, Henan University, Kaifeng 475004, China
2
Yellow River Conservancy Technical Institute, Kaifeng 475004, China
3
Key Laboratory of Forest Ecology and Environment, China’s State Forestry Administration, Research Institute of Forest Ecology, Environment and Protection, Chinese Academy of Forestry, Beijing 100091, China
*
Author to whom correspondence should be addressed.
Forests 2019, 10(2), 88; https://0-doi-org.brum.beds.ac.uk/10.3390/f10020088
Submission received: 27 November 2018
/
Revised: 10 January 2019
/
Accepted: 18 January 2019
/
Published: 23 January 2019
(This article belongs to the Section Forest Ecology and Management)
Abstract
:Quantification of the temporal and spatial variations of soil respiration is an essential step in modeling soil carbon (C) emission associated with the spatial distribution of plants. To examine the temporal and spatial variations of soil respiration and its driving factors, we investigated soil respiration, microclimate, and understory vegetation in a 50 m × 70 m plot in a climatic transitional zone oak forest in Central China. The temporal variation of soil respiration based on the 21 measurements ranged from 15.01% to 30.21% across the 48 subplots. Structural equation modeling showed that soil temperature and understory shrub biomass had greater positive effects on the seasonal variability of soil respiration. The spatial variation of soil respiration of the 48 subplots varied from 3.61% to 6.99% during the 21 measurement campaigns. Understory shrub biomass and belowground fine root biomass positively regulated the spatial variation of soil respiration. Soil respiration displayed strong spatial autocorrelation, with an average spatial correlation length of 20.1 m. The findings highlight the importance of understory shrub and belowground biomass in regulating the temporal and spatial heterogeneity of soil respiration in forest ecosystems, and the need to carefully address it to robustly estimate the contribution of soil C emission in terrestrial C cycling.
1. Introduction
Soil respiration represents a major flux of carbon (C) to the atmosphere, releases approximately 100 pg C each year [1], and typically accounts for 30%–80% of total ecosystem respiration [2]. Therefore, soil respiration undoubtedly exerts a great influence on atmospheric CO2 concentration, and consequently on climate change [3]. However, it is not easy to accurately predict soil respiration even within the one ecosystem due to its large temporal and spatial variations [4], which are impacted by different biotic and abiotic factors [5]. Consequently, there is a large uncertainty associated with the prediction of terrestrial C cycling due to the temporal-spatial variability of soil respiration at different scales [6].
The temporal variation of soil respiration has always been related to either seasonal changes in soil temperature [7] or changes in both soil temperature and water content [8]. Soil temperature can regulate metabolism of plant roots [9,10] and decomposition rate of soil organic matter [11] by changing plant phenology [12], fine root biomass [13], and soil microorganism activity [14]. Soil moisture is the second most important environmental factor affecting temporal variation of soil respiration, due to its effect on microbial activity [15,16]. For example, previous studies demonstrate that soil respiration is driven by the variation of soil temperature diurnally and seasonally when soil water content is not a limiting factor, while inter-annual variation of soil respiration is influenced by the variation of soil moisture [17].
Attempts to explain spatial variability in soil respiration often focus on small-scale differences among point measurements within a stand at interannual time scale [18]. Although the relationship between soil respiration rate and soil temperature is useful in broad applications [19], annual mean soil temperature typically does not explain much of the spatial variation of soil respiration among forests [20]. Environmental variables such as soil bulk density [5], soil organic matter [21], nitrogen content [21], soil microbial activity [20], fine root biomass [22], and distance to trees [5] have been proved as important factors that affecting spatial variation of soil respiration. Strong seasonal fluctuation has been determined for soil respiration rate and biotic/abiotic factors. However, data is still scarce on whether the spatial heterogeneity of soil respiration changes with season, and which factors control the seasonal patterns.
The spatial variation of soil respiration has been widely reported in grassland [23], cropland [24], as well as forest ecosystems [25], and is influenced by a set of interacting environmental and physiological variables. Forest ecosystem is characteristic by its complex vertical structure, showing three different functional groups: trees, shrubs, and herbs [26,27]. The presence of shrub and herb is always negatively related to canopy cover of trees, thus plays an important role in forest ecosystem, especially in the area with open canopy [28]. The spatial distribution of shrubs and herbs significantly determine belowground root biomass [29], soil microbial activity [25], and soil organic C [21]. However, there is a lack of understanding of whether the spatial distribution of understory plants affects the spatial heterogeneity of soil respiration, although the effects of trees on the spatial patterns of soil organic C [21] and soil respiration [25] have been widely reported.
Forests in climatic transition are an example of ecosystems with a marked vulnerability, where plant species are richer than either side of the adjacent climatic zones [30]. Climatic fluctuation in this region has a greater potential to shift understory shrub composition, and thus affect soil CO2 emission. Previous studies on the temporal and spatial variations of soil respiration have improved our understanding on soil C cycling. However, the impacts of understory plant species on the temporal and spatial variation of soil respiration have not been well understood in climatic transitional forests.
To better understand the temporal and spatial variations of soil respiration and the environmental drivers, we conducted a field experiment in a climatic transitional zone oak forest in Central China. Our specific objectives were to 1) assess the temporal variation of soil respiration and its dependence on biotic and abiotic factors; 2) determine the effects of understory plant and fine root biomass on the spatial variation of soil respiration.
2. Materials and Methods
2.1. Study Sites
The study was conducted in the Polden Forest Park (31°51′58″ N, 114°02′21″ E, 185 m a.s.l.) of Jigong Mountain National Natural Reserve in Henan Province, Central China. The average elevation is 185 m, with an annual mean precipitation and air temperature of 1098 mm and 15.3 °C. Precipitation occurs mainly in summer (June-August), accounting for 66% of the annual total precipitation (China Meteorological Data Sharing Service System, http: data.cma.gov.cn). Upland soils are dominated by Haplic Luvisols (FAO) (pH = 4.0–5.5) developed from Sandshale bedrock [31]. The dominant tree species in the forests are Quercus spp., Acer Buergerianum Miq., Liquidambar formosana Hance, and Pinus Massoniana Lamb. The understory shrub community mainly consists of Lindera glauca (Sieb. et Zucc.) BI., Vitex negundo L., Symplocos chinensis (Lour.) Druce, and Smilax china L. The herbaceous community is commonly composed of Eriophorum scheuchzeri Hoppe, Cyclosorus interruptus (Willd.) H. Ito, and Oplismenus compositus (Linn.) Beauv.
2.2. Experimental Design
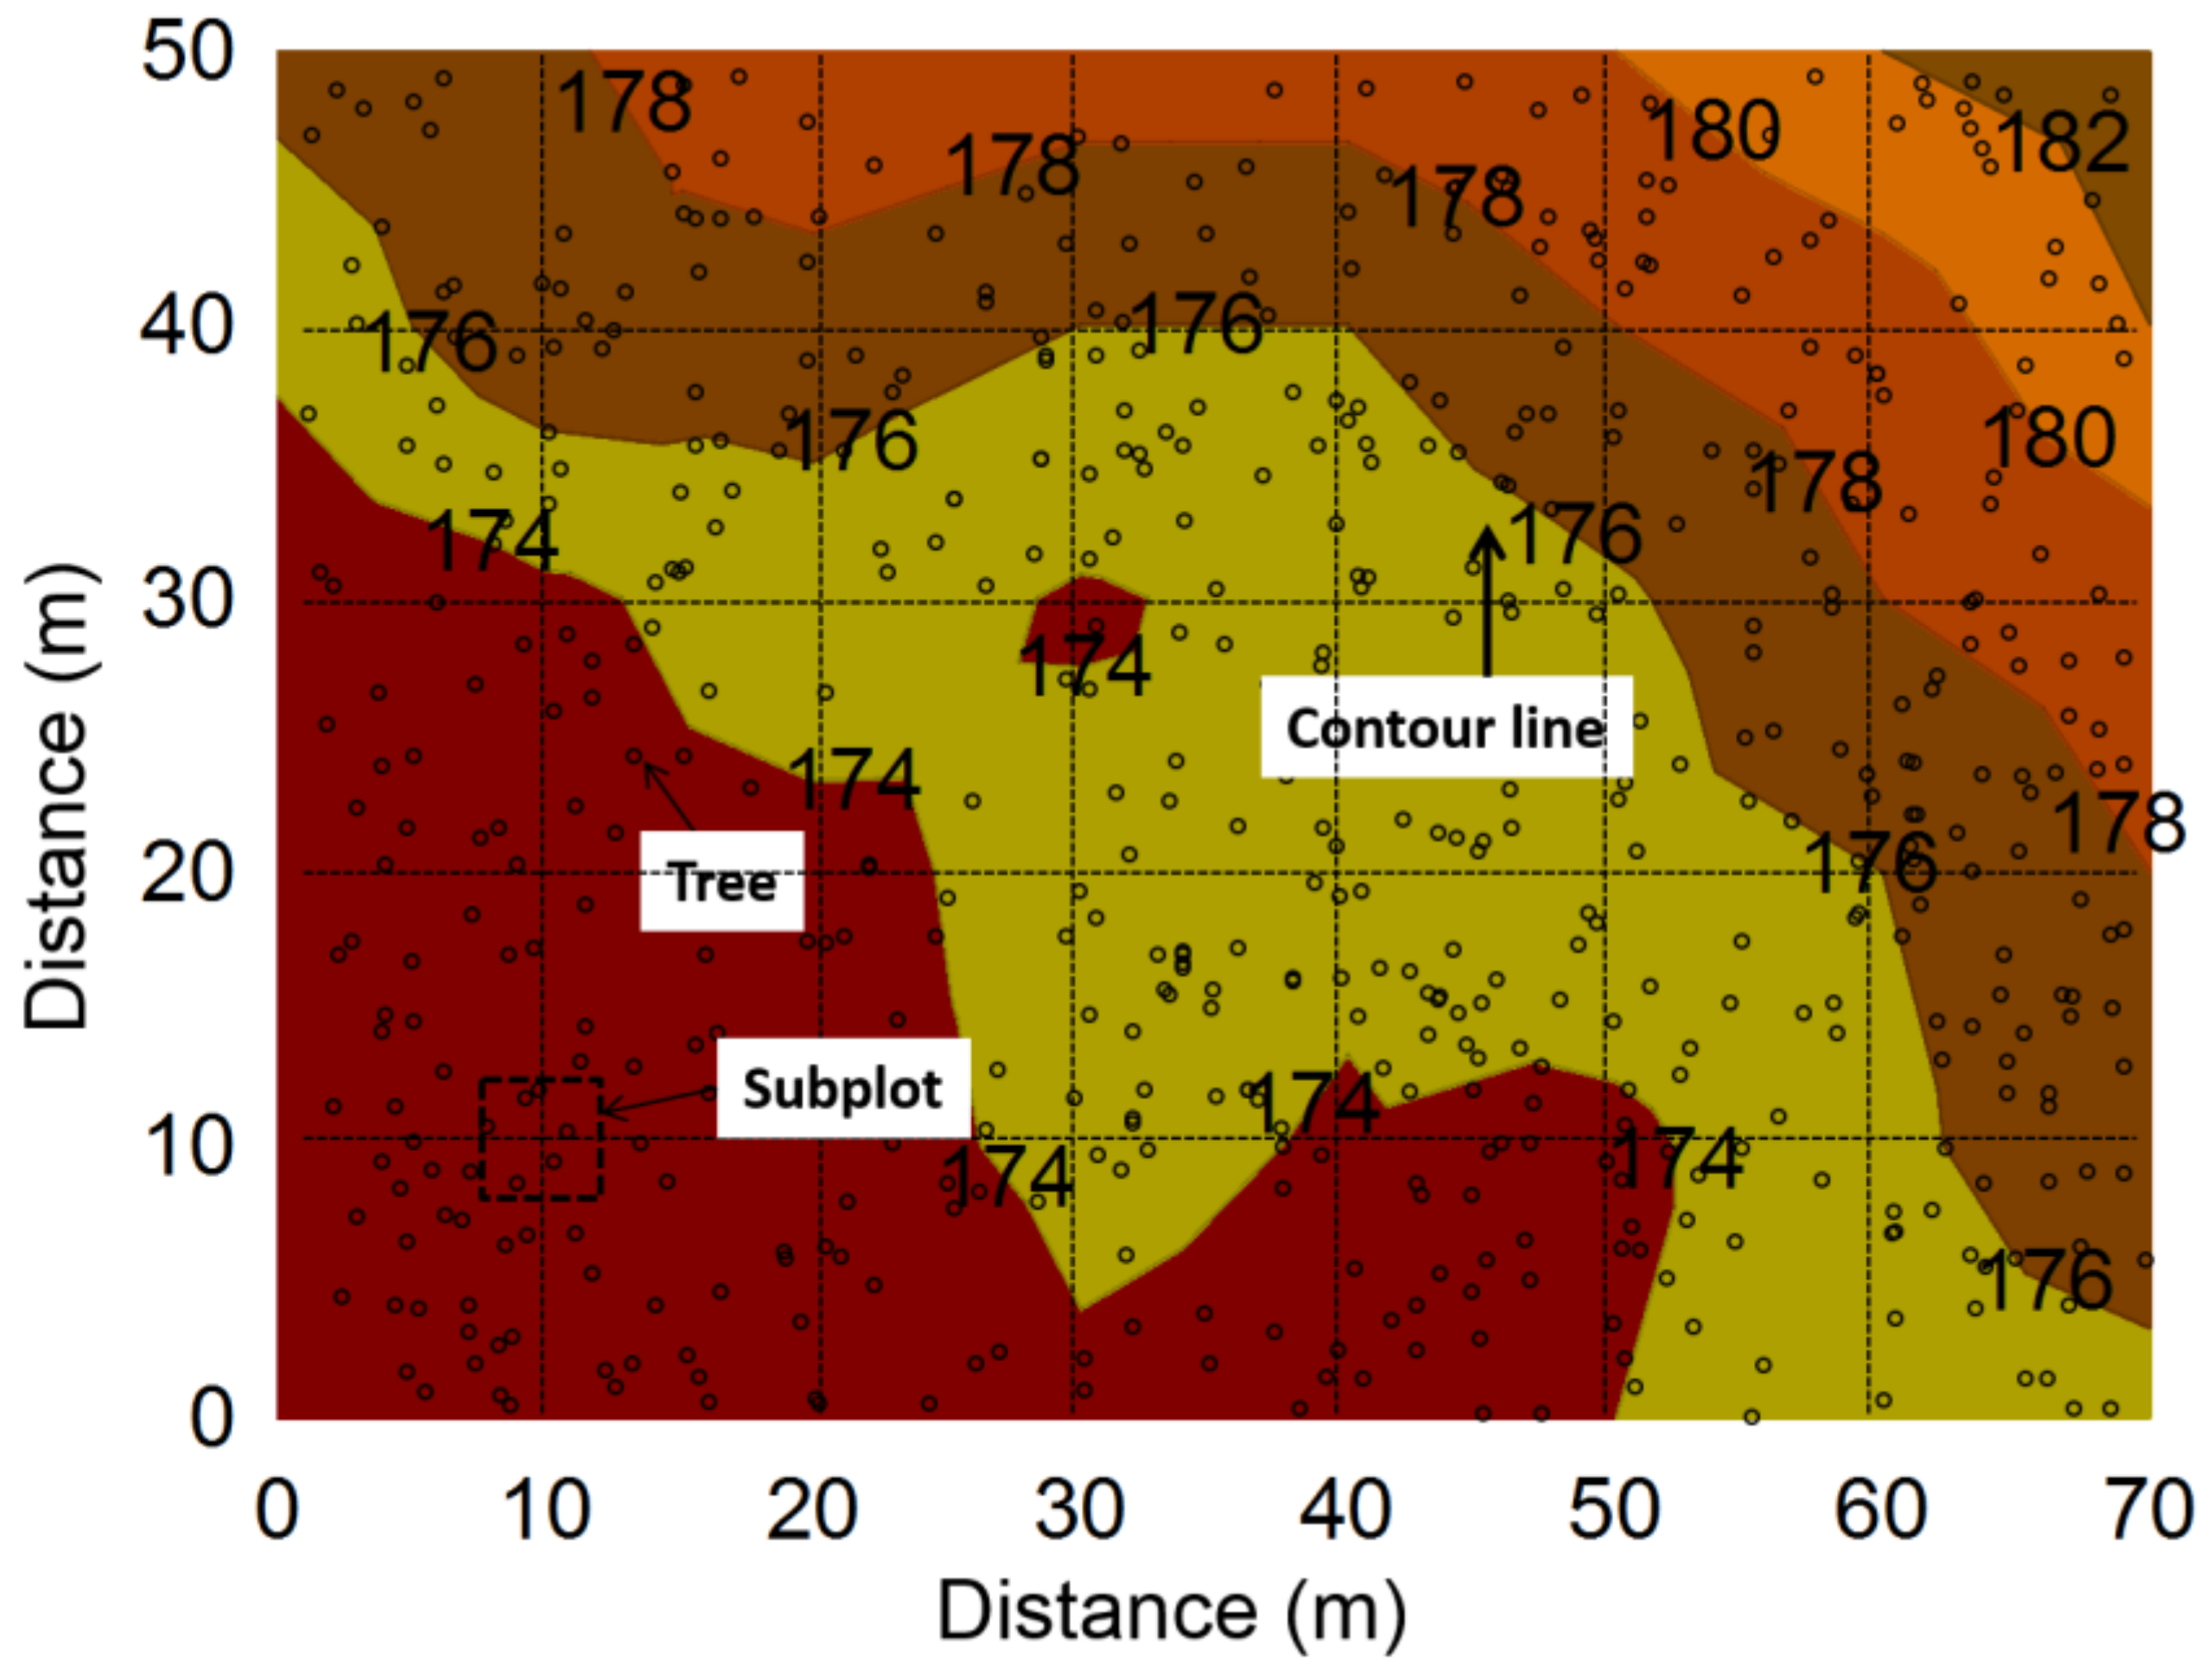
The research was undertaken in a natural secondary oak forest. One 50 m × 70 m plot was delineated in the oak forest with a density of 1026 trees ha−1 and a basal area of 38 m2 ha−1. The study plot was located on the terrain with an average slope of 15 °, with elevations ranging from 173 to 182 m (Figure 1). The average diameter at breast height (DBH) of the dominant tree (Quercus spp.) was 14.6 ± 3.6 cm (~65% of total canopy coverage). Soil organic C varied from 25.2 to 59.3 g kg−1 and soil total nitrogen ranged from 1.12 to 2.14 g kg−1. A 10 m × 10 m square grid was then placed and 48 subplots (5 m × 5 m) were positioned at each intersection of the grid. Polyvinyl chloride (PVC) collars (10 cm inside diameter and 5 cm in height) were inserted 3 cm into the soil at the center of each subplot in March 2014 and were kept on the site throughout the study period.
2.3. Soil Respiration, Temperature, and Moisture
Soil respiration was measured two to three times per month during the growing season from April to November in 2014, using LI-COR infrared gas analyzer (LI-8100, LI-COR Inc., Lincoln, NE, USA). In total, 21 measurements were conducted across the 8 month. The total time for soil respiration measurement was 120 s, in which the deadband was 30 s, and the effective measurement time was 90 s. Soil temperature at 0–10 cm depth adjacent to each PVC collar was monitored using a thermocouple probe attached to the LI-8100 system. Soil volumetric moisture content (% v/v, 0–10 cm) was measured by a portable Time Domain Reflectometer (TDR) equipment (Soil moisture equipment Corp. Santa Barbara, California) at three points close to each collar. All the measurements were carried out between 9:00 and 12:00 a. m. in each campaign.
2.4. Aboveground Biomass of Understory Plant and Fine Root Biomass
All shrub species (DBH < 5 cm) within each subplot (5 m × 5 m) were surveyed in middle growing season (July 2014), including basal diameter [at 10 cm above ground] [32], height, and species. Allometric equations for three dominant shrub species (L. glauca, V. negundo, and S. chinensis) were established through destructive sampling method in the adjacent stand. The relationship between aboveground biomass (B) and basal diameter (D) for each species was estimated using power equations (B = a × Db) (Table 1). Aboveground biomass of other sporadic shrub species was estimated by a general allometric equation based on the data of all three species. The sum of all individual estimates was used as shrub-layer aboveground biomass for each subplot.
Two 1 m × 1 m herbaceous quadrats were established in each subplot in July 2014, and all herbaceous plants were destructively sampled and oven-dried at 70 °C for 48 hours and weighted. We estimated the total understory biomass by adding the shrub biomass with grass biomass in each subplot.
Two 20 cm root cores were taken from each subplot using a cylindrical soil corer (diameter 10 cm) in July 2014. Roots were separated from the soil by washing. The roots were sorted into living and dead based on color, elasticity, and toughness. All living fine roots (less than 2 mm in diameter) samples were oven-dried at 70 °C for 48 h, weighed, and used in this study.
2.5. Statistical Analysis
The temporal variations (CVtp) of soil temperature, moisture, and respiration were estimated based on the mean value and standard deviation (SDp) of the 21 measurements in each subplot (Equation 1). The spatial variations (CVsm) of soil temperature, moisture, and respiration were analyzed using the mean value and standard deviation (SDm) of the 48 subplots in each measurement campaign (Equation 2). The temporal and spatial variability were calculated as the following:
where CVtp and CVsm means temporal and spatial variation, respectively; SD means standard deviation; p represents different subplot; m represents each measurement; and A represents variable, such as soil temperature, moisture, and respiration.
A linear regression was performed to evaluate the relationship between soil respiration and its temporal/spatial variation and biotic/abiotic factors. Structural equation modeling (SEM) is an extension of regression and path analysis that can be used to estimate multivariate relations. A path model was developed to relate soil respiration to biotic (aboveground biomass of grass and shrub and fine root biomass) and abiotic factors (soil temperature and moisture) based on theoretical knowledge of the major factors associated with soil respiration. Maximum likelihood solution procedures were used and we relied on χ2 goodness of fit measures to evaluate model adequacy. The model was fitted using SPSS AMOS 21.0 for Windows (SPSS Inc., Chicago, IL, USA).
We further used geostatistical techniques to analyze the spatial heterogeneous of soil temperature, moisture, respiration, understory biomass, grass biomass, and fine root biomass. Variogram computations were also performed to determine the strength and scale of the spatial variability each variable. The spatial variability was quantified by the semivariance (γ(h)). The semivariance of any variables z is computed as:
where n (h) is the number of observations at lag distance h, and Zx and Zx+h are the scalar values at point pairs separated by a distance h. Plotting γ(h) against h gives the semivariogram, which will exhibit either purely random behavior or systematic behavior described by a theoretical model (linear, spherical, gaussian or power law distribution). The nugget, sill, range were obtained from the model with the best fit to the semivariance data. Geostatistical analyses were performed with GS+ (Geostatistics for the Environmental Sciences V5.1.1, Gamma Design Software Inc., Plainwell, MI, USA). All figures were made using the software of Sigmaplot in version 12.5 (Systat Software Inc., San Jose, CA, USA).
3. Results
3.1. Temporal Variations of Soil Respiration, Temperature, and Moisture
Across the 48 subplots, soil respiration changed from 1.57 μmol m−2 s−1 to 4.13 μmol m−2 s−1, and the temporal variation (CVtp) of soil respiration averaged 20.64%, differed between 15.01% and 30.21% (Table 2). Mean soil temperature varied from 17.78 to 20.97 °C, with the CVtp ranging from 7.21% to 9.31% (Table 2). Soil moisture varied in a range of 8.71% to 34.25%, with the CVtp ranging from 7.92% to 22.30% (Table 2).
3.2. Effects of Understory Plant Biomass on the Temporal Variation of Soil Respiration
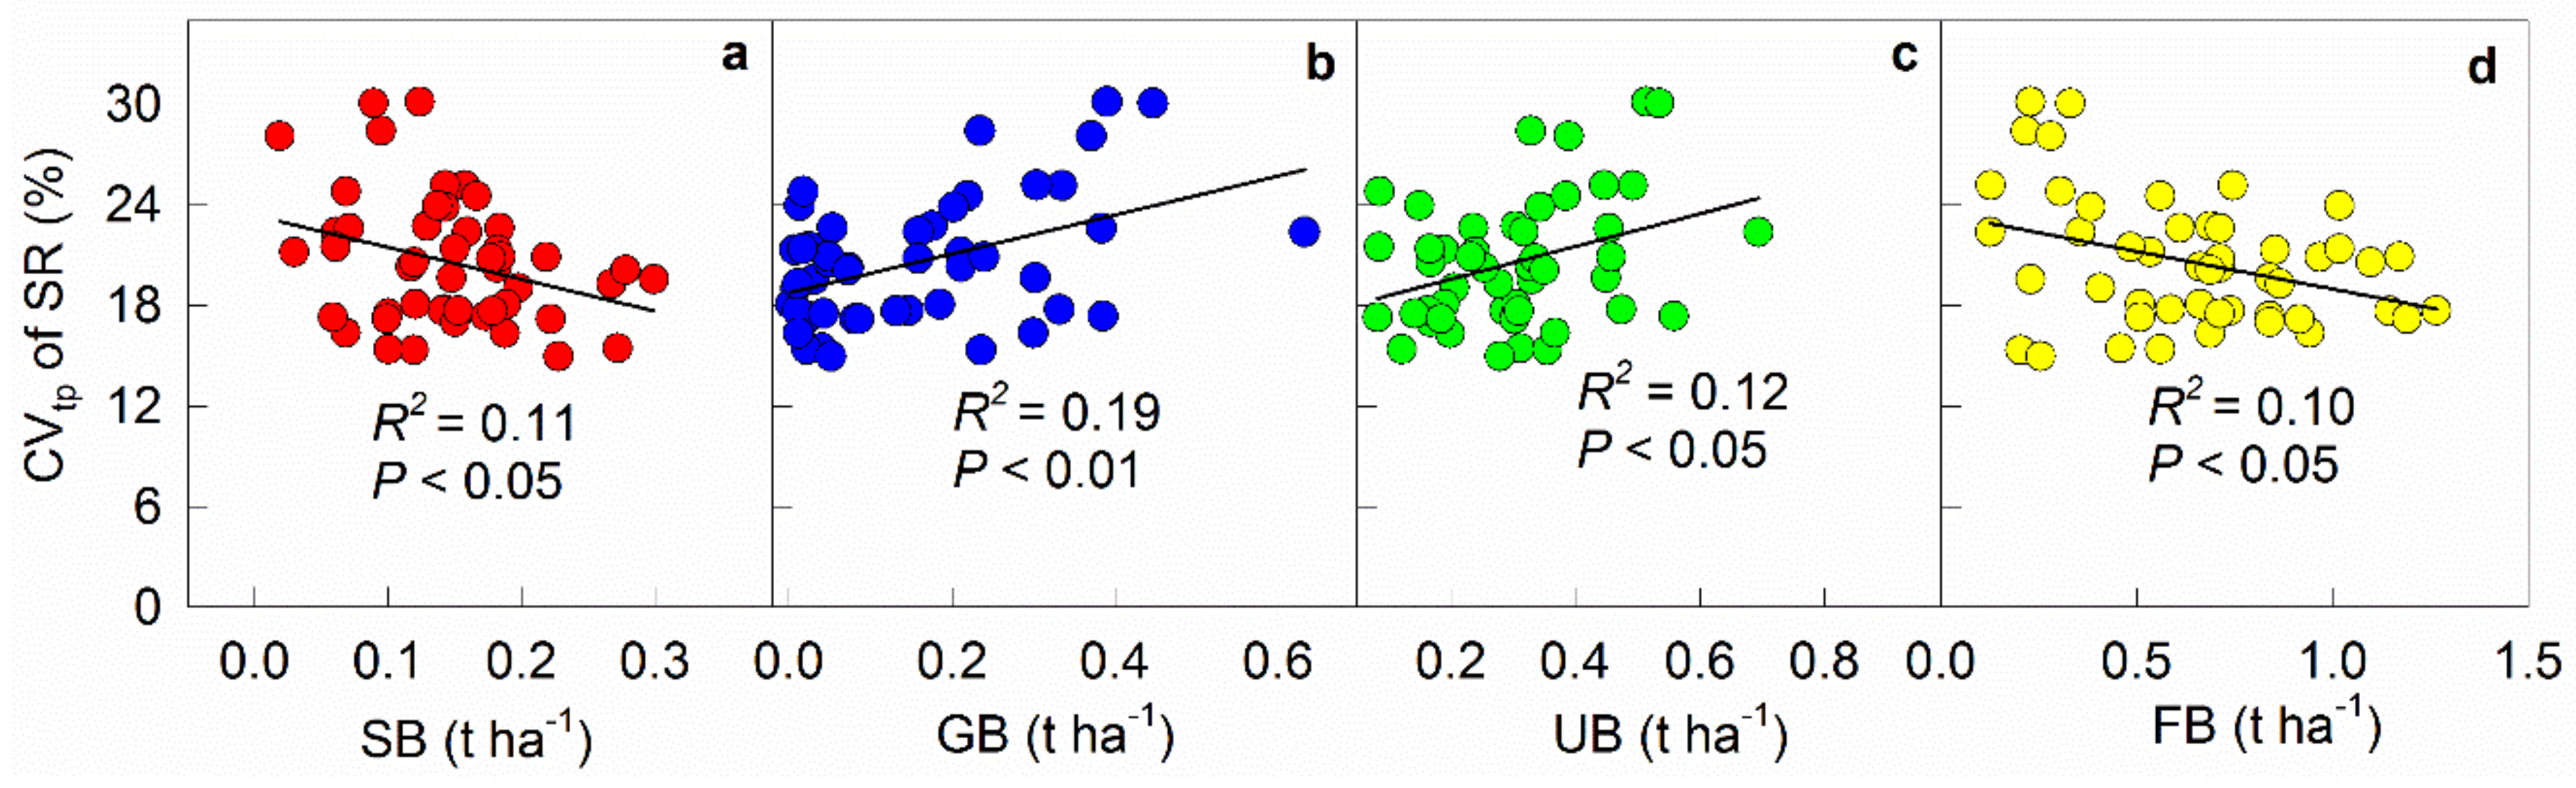
The temporal variation (CVtp) of soil respiration based on the 21 measurements showed negative correlations with shrub (R2 = 0.11, p < 0.05, Figure 2a) and fine root biomass (R2 = 0.10, p < 0.05, Figure 2d), but displayed positive correlations with grass (R2 = 0.19, P < 0.01, Figure 2b) and understory biomass (R2 = 0.12, p < 0.05, Figure 2c).
3.3. Structural Equation Modeling to Explain Temporal Variation in Soil Respiration
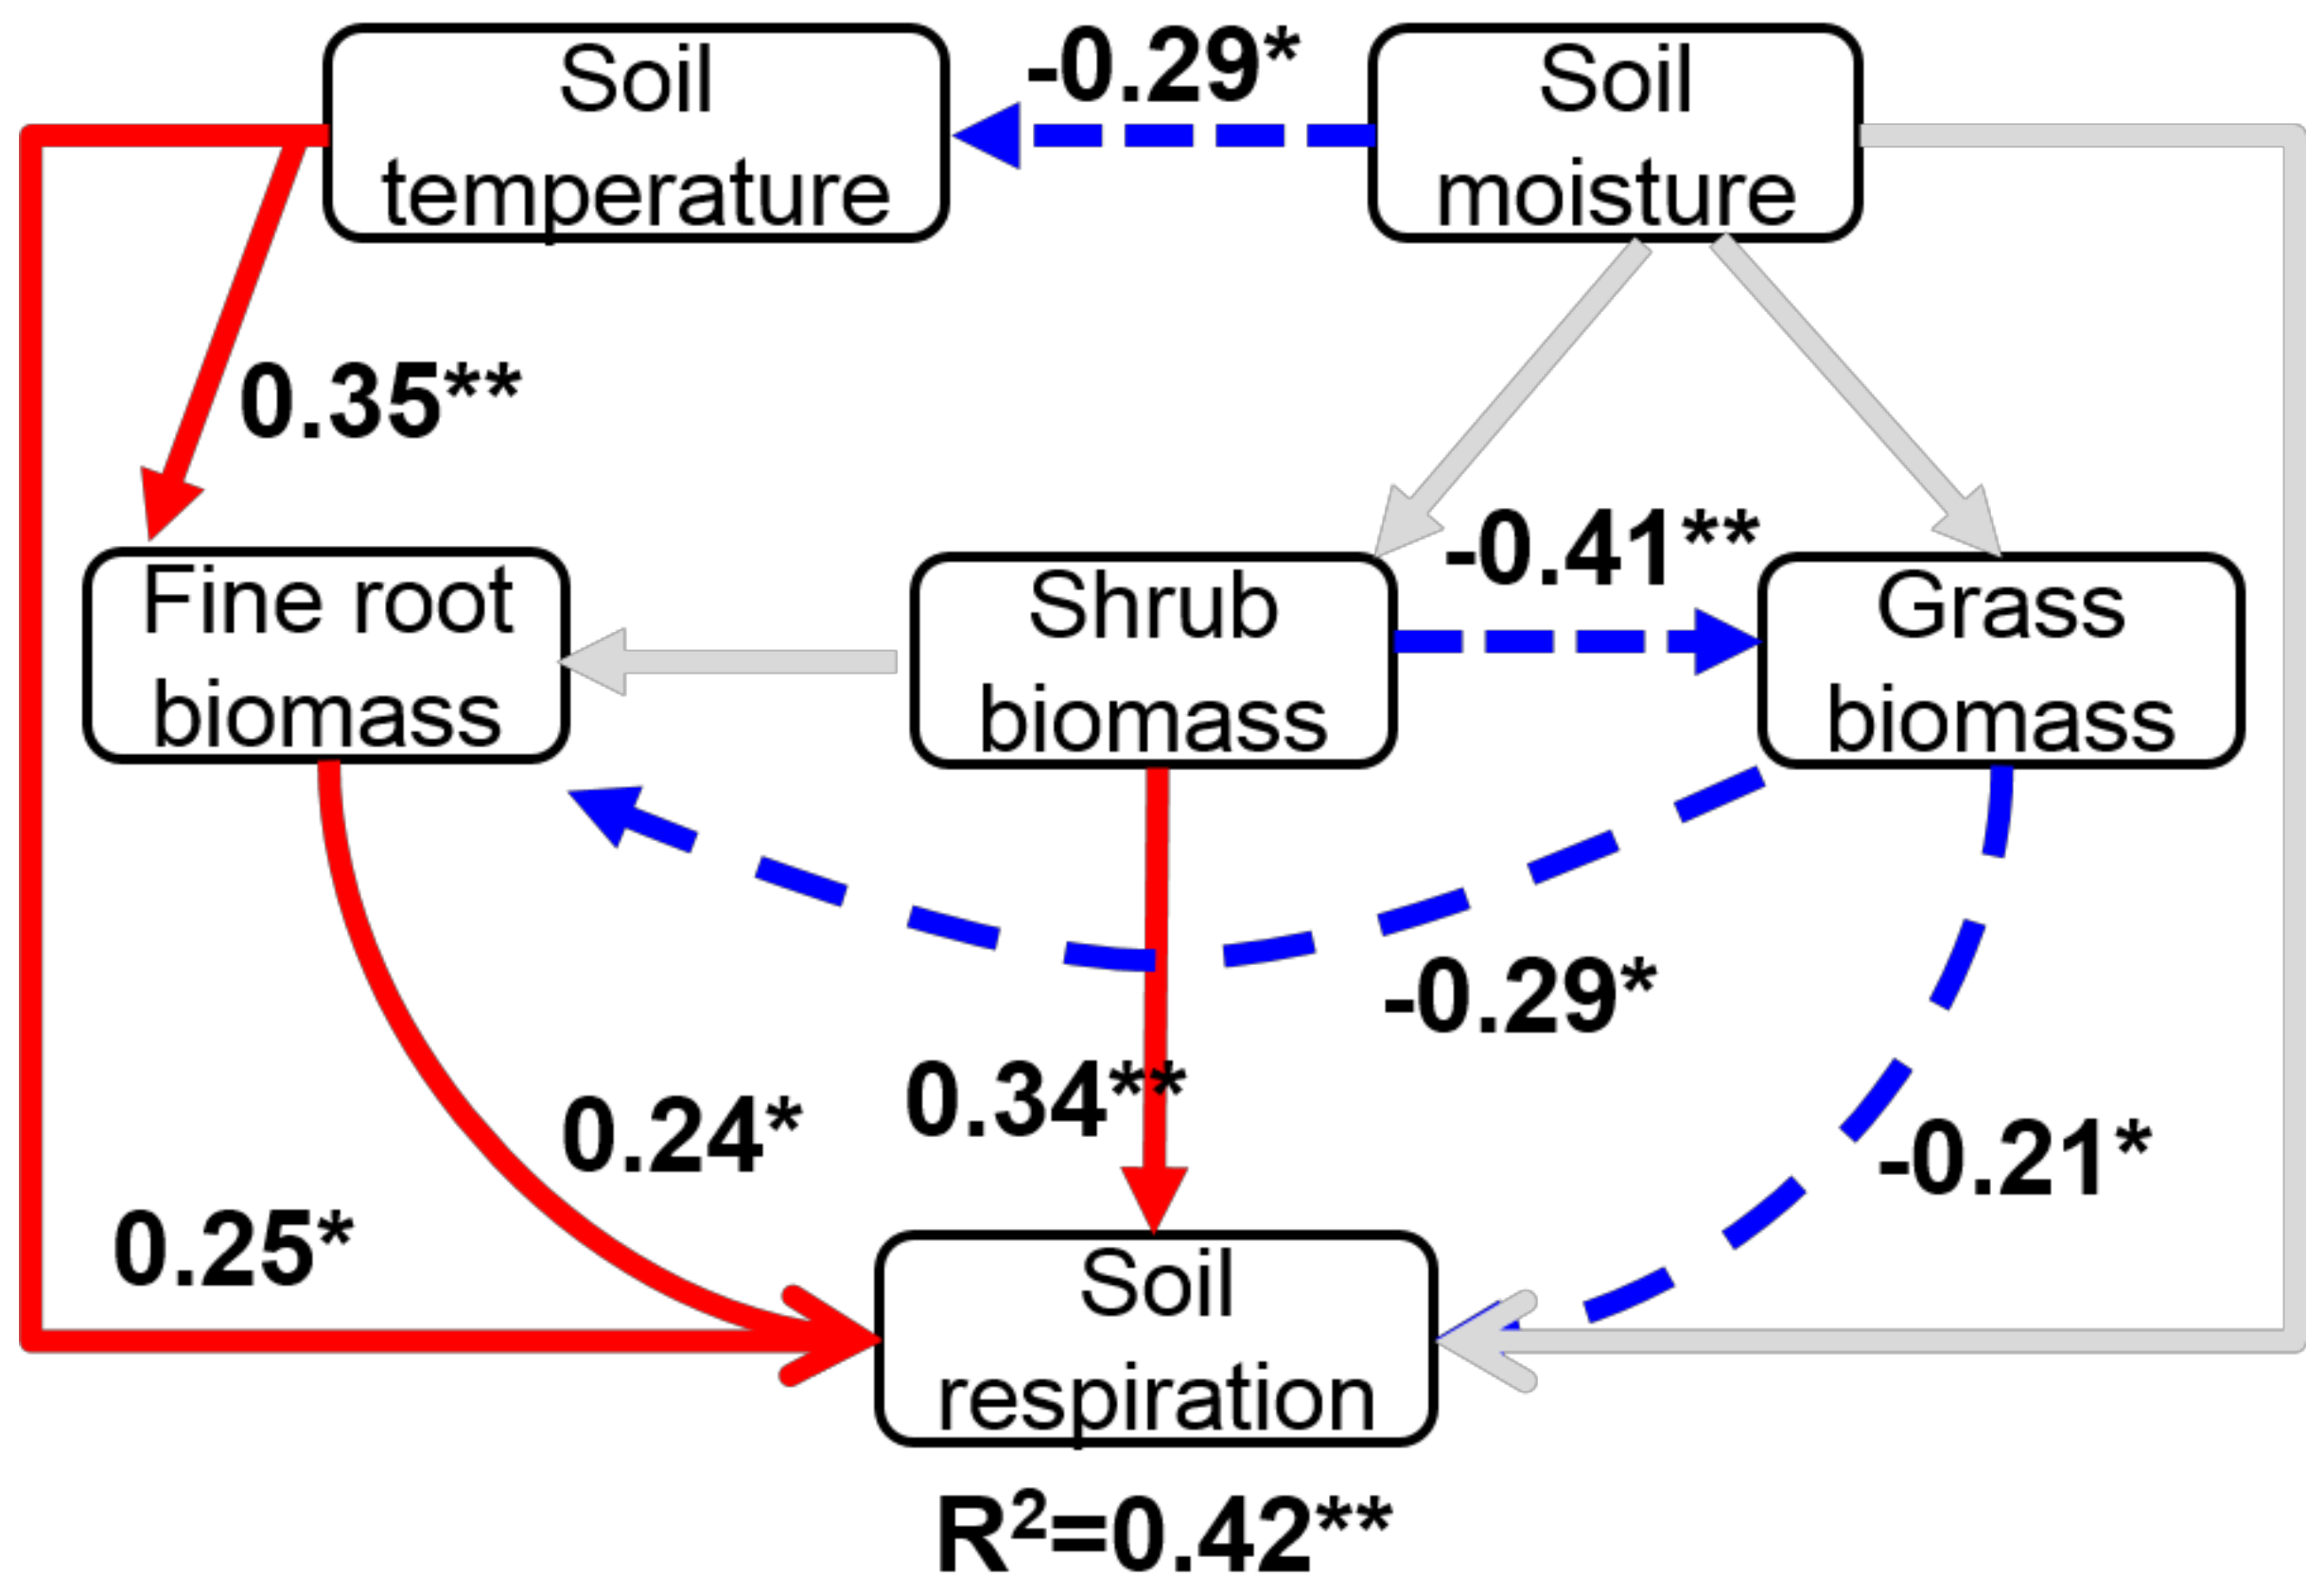
The χ2 test of model fit (χ2 = 2.249, d. f. (degree of freedom) = 5, p = 0.503), CFI (0.95) and RMSEA (p < 0.001) all indicated that the model was of excellent fit. The SEM explained 42% of the variation in soil respiration rate (Figure 3). The model showed that soil temperature and understory shrub biomass had significant positive effects on soil respiration rate (p < 0.05), which together explained approximately 59% of the variation in soil respiration rate (Figure 3). However, understory grass biomass showed a negative effect on soil respiration rate through its direct and indirect effects on fine root biomass (both p < 0.05, Figure 3).
3.4. Seasonal Patterns of Soil Temperature, Moisture, and Respiration and Their Spatial Variability
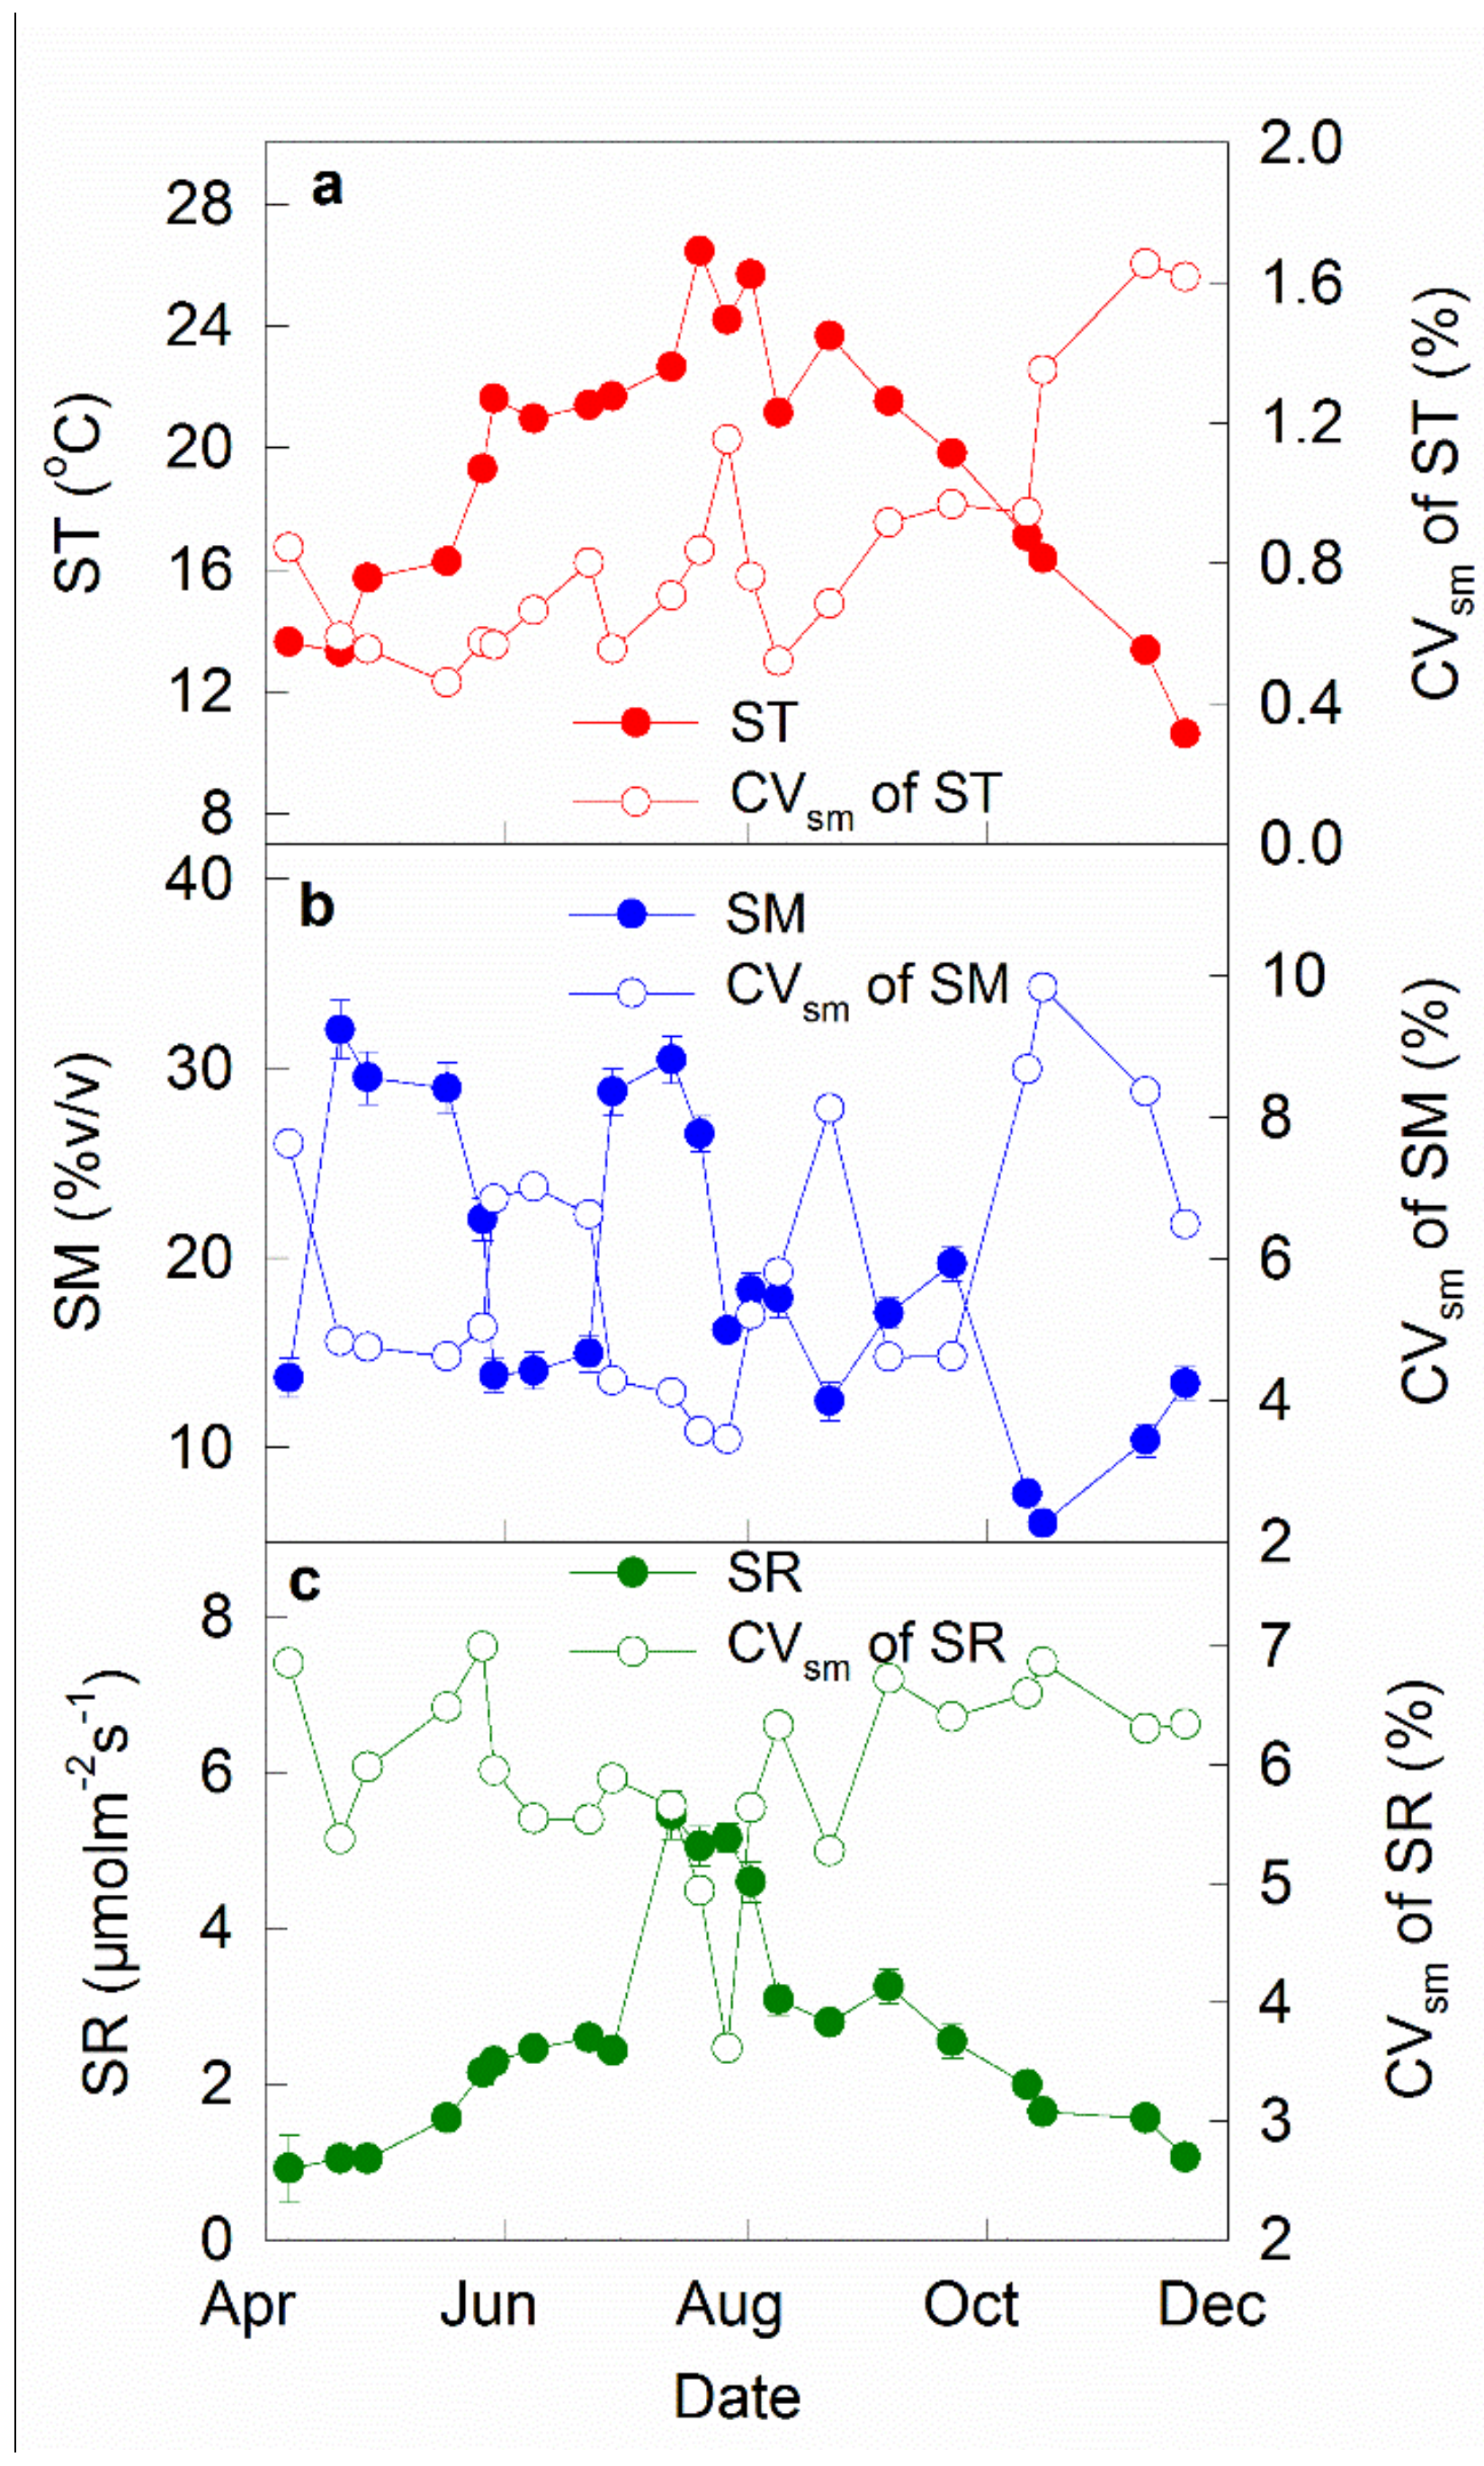
Soil temperature showed a commonly known seasonal pattern, with the highest value on 20 July (26.5 °C) and the lowest one on 20 November (10.6 °C, Figure 4a). The CVsm of soil temperature ranged from 0.46% on 17 May to 1.66% on 10 November (Figure 4a). The CVsm of soil temperature was relatively stable across the first 9 measurements but tended to increase during the following 12 measurements over the study period (Figure 4a).
Soil moisture was highly variable, ranging from 5.97% to 32.03% (Figure 4b), due to discrete precipitation events. However, the CVsm of soil moisture displayed an inverse pattern compared with the magnitude of soil moisture, showing lower values in the months with higher soil moisture (Figure 4b).
Mean soil respiration rate across the 21 measurements was 2.52 μmol m−2 s−1, ranging from 0.91 μmol m−2 s−1 on 7 April to 5.46 μmol m−2 s−1 on 13 July (Figure 4c). Soil respiration rate displayed similar pattern with soil temperature, showing substantial seasonal variation (Figure 4c). Temporal variation of soil respiration was relatively stable across the study period. The mean CVsm of soil respiration was 6.0%, ranging from 3.61% on 27 July to 6.99% on 26 May (Figure 4c).
3.5. Effects of Soil Temperature and Moisture on Spatial Variation of Soil Respiration
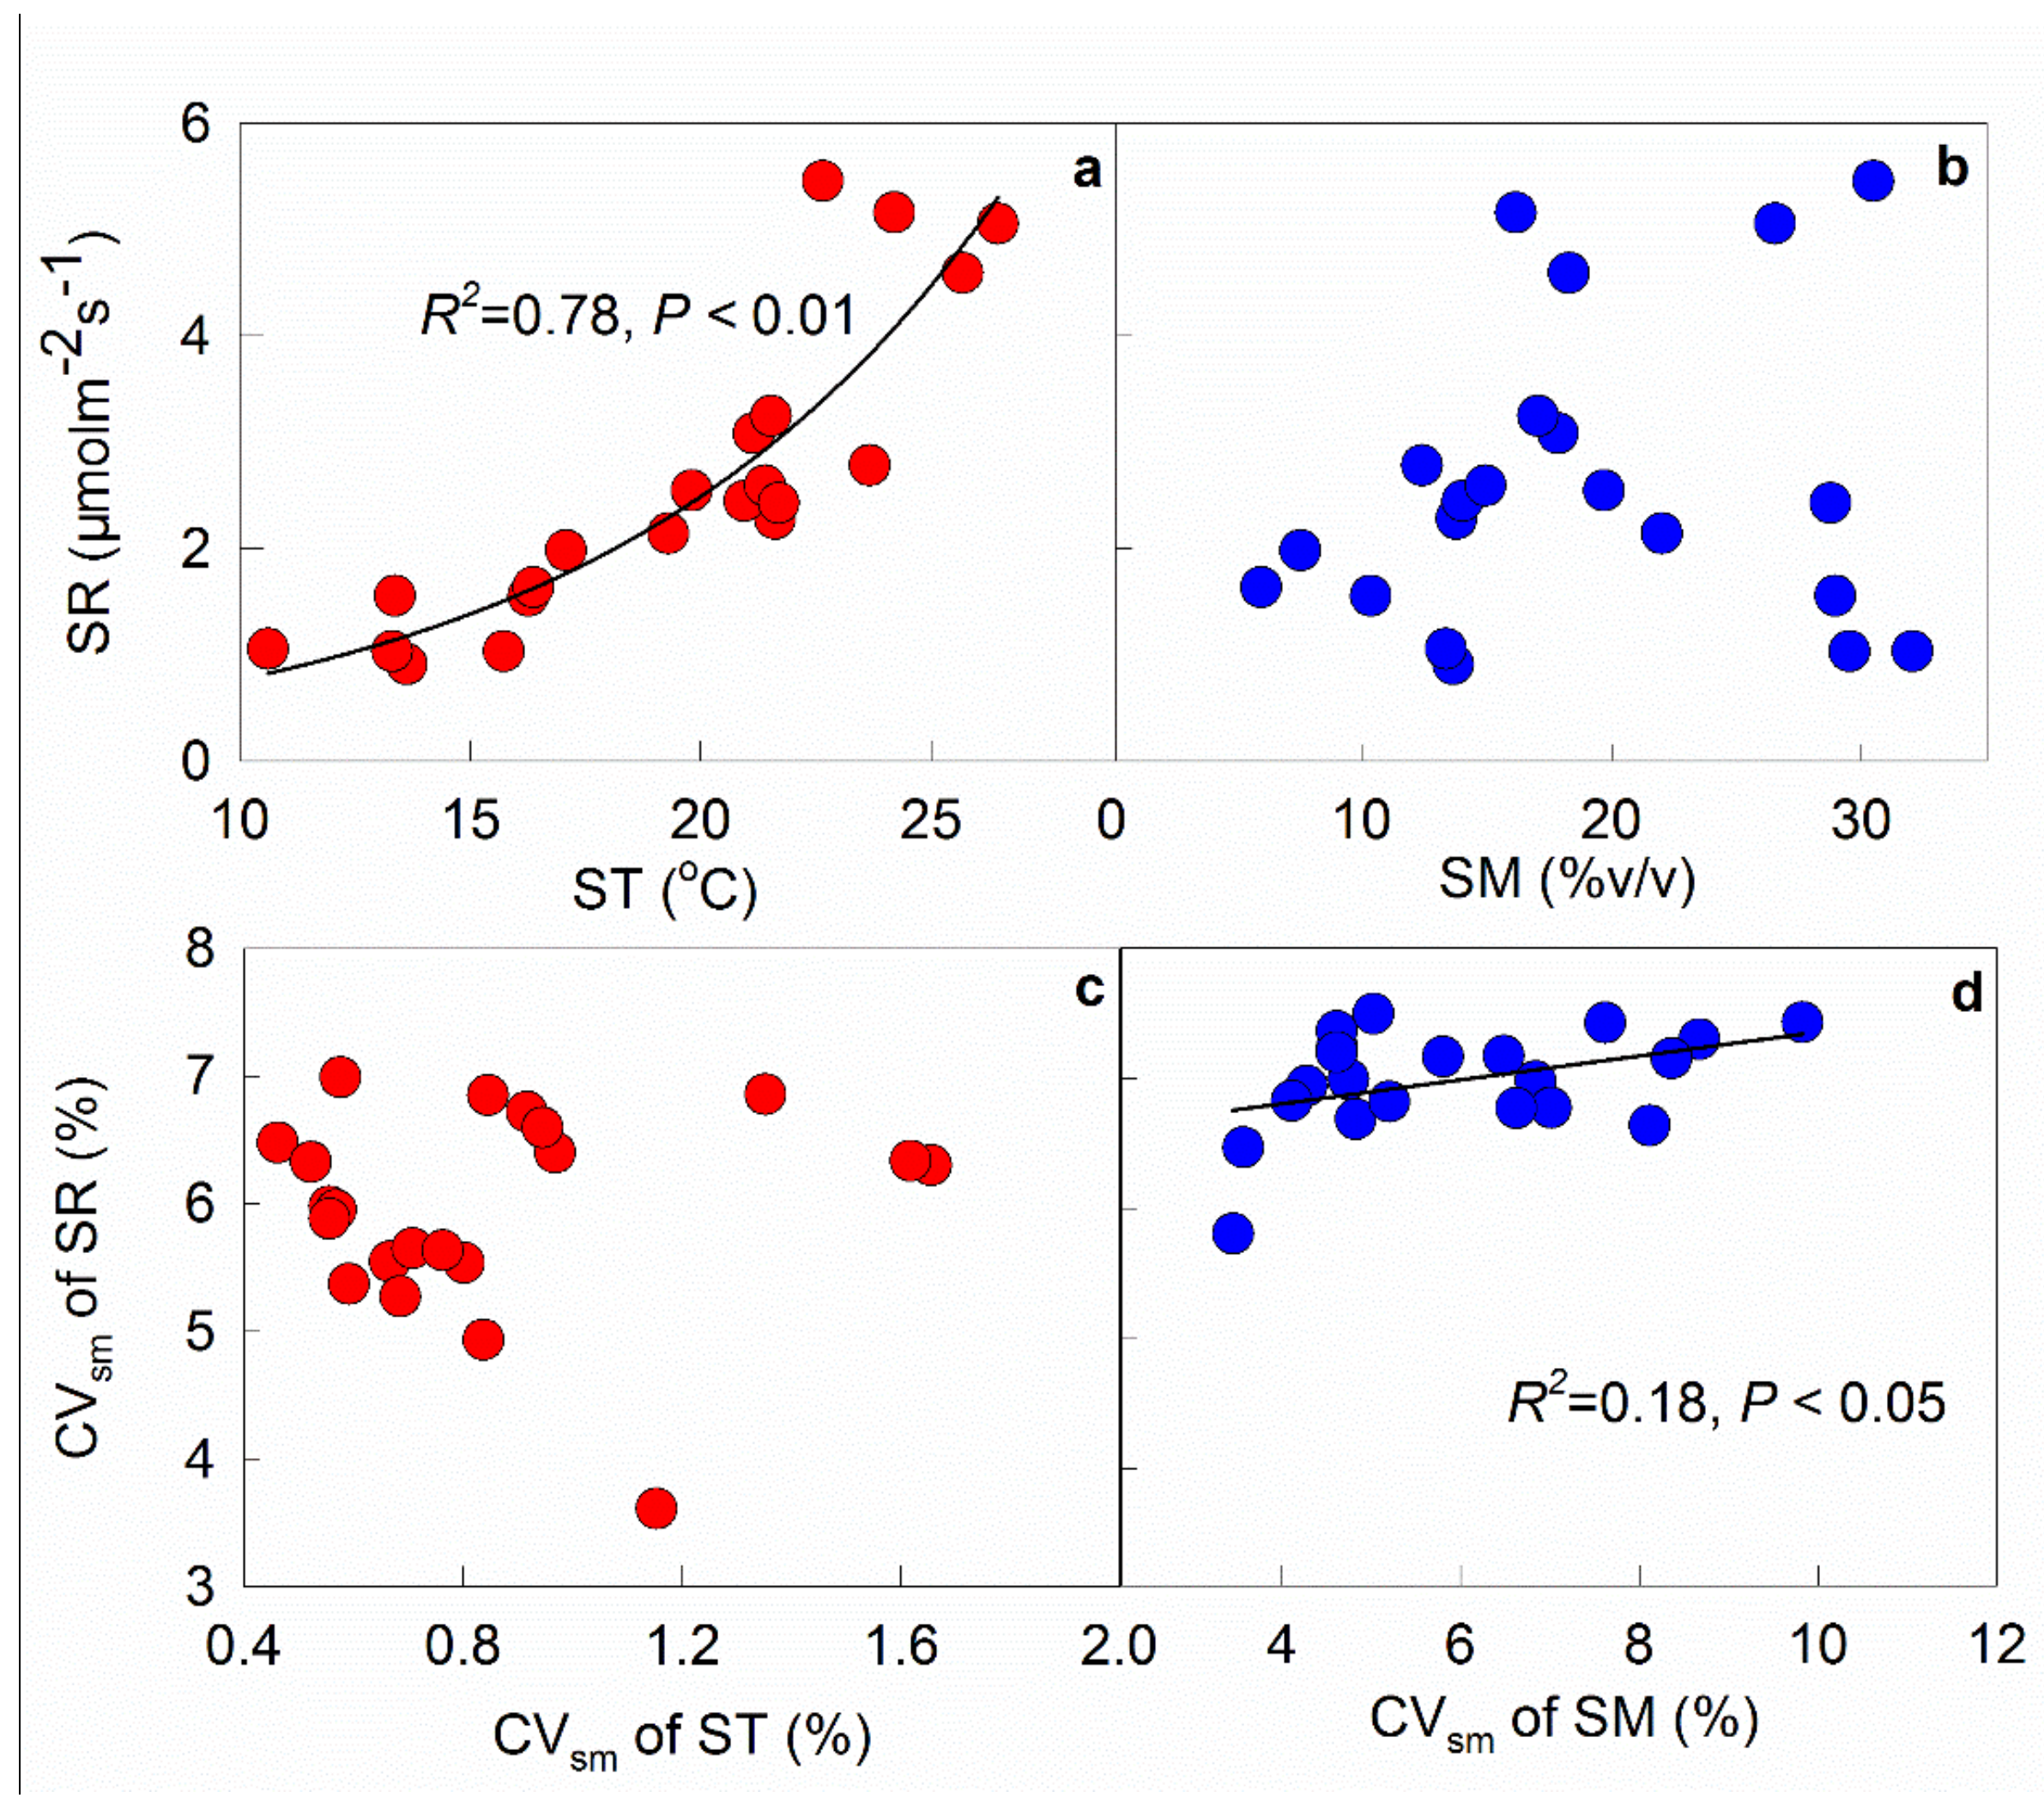
Across the 21 measurement campaigns, a significant exponential relationship between soil respiration rate and temperature was observed in this study (R2 = 0.78, p < 0.01, Figure 5a). However, no relationship was found between soil respiration rate and moisture (Figure 5b). The spatial variation of soil respiration (CVsm) was positively correlated with the CVsm of soil moisture (R2 = 0.18, p < 0.05, Figure 5d), but was not related to the CVsm of soil temperature (p > 0.05, Figure 5c).
3.6. Mid-Growing Season Plant Biomass and its Effect on Spatial Variation of Soil Respiration
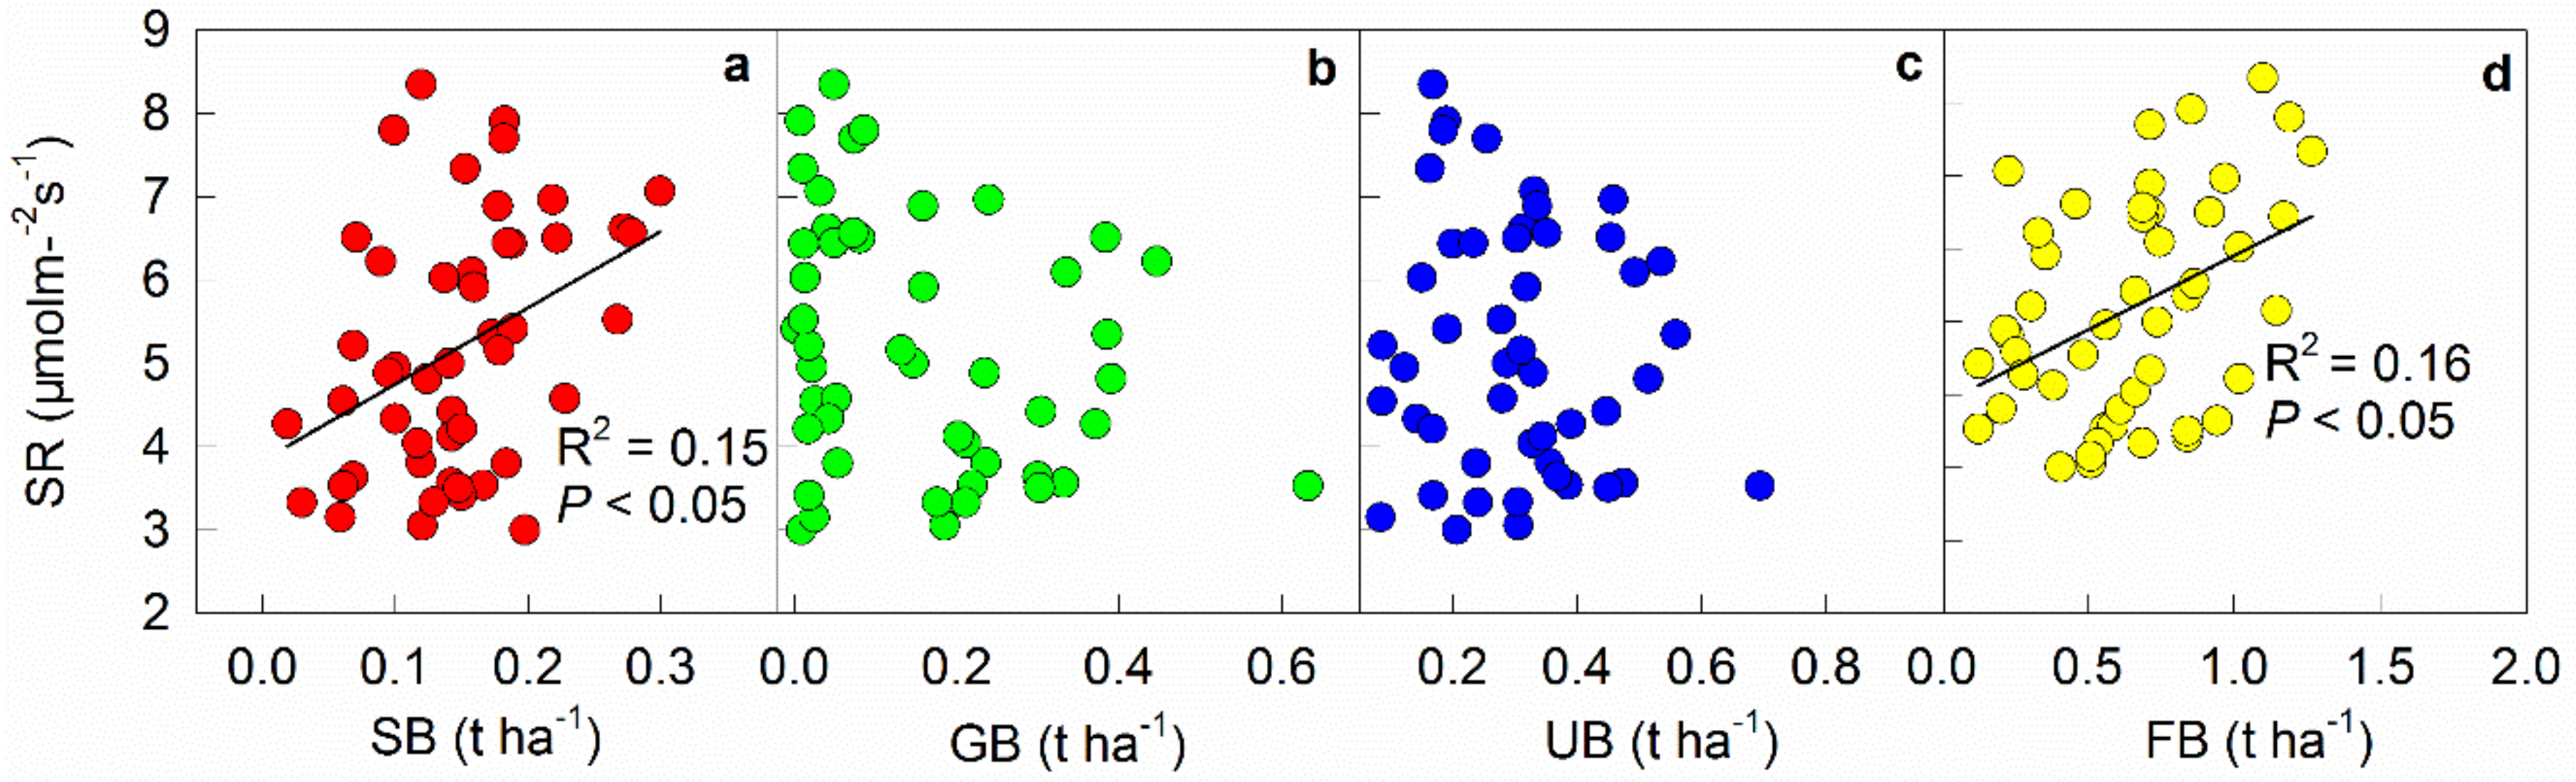
Understory shrub biomass was 0.15 t ha−1, ranged between 0.02 and 0. 30 t h−1 (Table 3). Total understory biomass varied from 0.08 to 0.69 t ha−1 and averaged 0.30 t ha−1 (Table 3). The average fine root biomass across the 48 plots was 0.65 t ha−1, with the minimum and maximum values ranging from 0.13 t ha−1 to 1.27 t ha−1, respectively (Table 3). Soil respiration rate in mid-growing season was positively correlated with shrub (R2 = 0.15, p < 0.05, Figure 6a) and fine root biomass (R2 = 0.16, p < 0.05, Figure 6d), but showed no correlations with grass biomass and total understory biomass (p > 0.05, Figure 6b, c).
As shown in Table 4, the spatial autocorrelation was strong for soil respiration [C0/(C0 + C) = 0.057] but weak for soil temperature [C0/(C0 + C) = 0.912]. A pure nugget variogram was determined for soil moisture [C0/(C0 + C) = 1], indicating poor spatial autocorrelation of moisture at field scale. The average spatial autocorrelation range was 20.11 m for soil respiration (Table 4). Both grass biomass (A = 11.21, Table 4) and total understory biomass (A = 11.95, Table 4) were found to be spatially heterogeneous. However, understory shrub and fine root biomass displayed no spatial trend (Table 4).
4. Discussion
4.1. Temporal Variation of Soil Respiration
The measured soil respiration rate (1.57–4.13 μmol m−2 s−1) in this study is comparable with those investigated in previous studies in temperate forests [5,15]. The temporal variation of soil respiration rate has been widely reported in a variety of ecosystems [23,33]. The temporal variation of soil respiration in this study (15.01%–30.21%) agrees with the values reported in a temperate oak forest (25.3%–39.95%) and a masson pine plantation (22.3%–35.1%) [5], whereas is smaller than that in a tropic rainforest (41%–62%) [34] and a grassland (48%–58%) [35].
Our study demonstrates the commonly known temporal fluctuation of soil respiration rate, which is consistent with the growing body of literature on temporal patterns of soil respiration rate [36,37]. The seasonal difference of soil respiration rate clearly reflects the temporal fluctuation of soil temperature (Figure 4a,c). The seasonal difference in soil respiration rate has been reported to be generally explained by either soil temperature alone [38] or both soil temperature and water content in dry regions [39]. In this study, the temporal fluctuation of soil respiration rate is better accounted for by the parallel changes in soil temperature (Figure 5a).
In terms of biotic factors, the temporal variation of soil respiration is negatively correlated with shrub and fine root biomass but positively related to grass and understory biomass (Figure 2). The results suggest that soil respiration displayed lower seasonal variation in the area where more shrub and fine root distributed. This phenomenon may be attributed to the following reasons. First, soil microclimate (temperature and moisture) may fluctuate less under shrub canopies due to its interception on light and precipitation [40]. Second, the amount of carbon and the availability of substrate for microbial decomposition may change less due to the sustained inputs of aboveground litter and belowground roots [41].
4.2. Spatial Variation of Soil Respiration Rate
As Figure 4b shows, soil moisture displays higher spatial variability among subplots when soil is dry, which is likely induced by the differences in water holding ability of soil and in absorbing ability of plants among different subplots. It indicates that soil structure and plant distribution play a stronger role in regulating soil water availability in dry season. The spatial variation of soil respiration shows positive correlation with the spatial variation of soil moisture (Figure 5d). The result suggests that soil respiration rate exhibits greater variation when soil moisture has a higher spatial variation value. A similar result has been reported in a tropical rainforest, where higher spatial variation of soil respiration rate was found in dry months [42]. The finding is probably related to the changes in plant root and microbial respiration under water stress condition [43]. Compared with wet conditions, microbial respiration contributes less to total soil respiration rate in dry conditions [22], mainly due to the strengthen root activity. The reduced soil water availability in surface soil probably enhanced root biomass in order to search for more water deeper in the soil profile, thus increase autotrophic respiration [13]. Therefore, soil respiration could decrease with increased distance to trees.
In this study, understory shrub biomass and fine root biomass are the major biotic factors affecting soil respiration rate and its spatial variation across the 8 months (Figure 6). Our findings agree with previous studies in a tropical rainforest [25] and a steppe ecosystem [44]. The result that understory shrub rather than grass biomass showed a greater effect on the spatial variation of soil respiration (Figure 6) could be attributed to the morphological differences between shrub and grass. Shrub plants have a relatively fixed location and play a stronger role in regulating soil organic matter content than grass species. Moreover, grass species in this study dominated by E. scheuchzeri and C. Interruptus, are perennial plants. The litters of both E. scheuchzeri and C. Interruptus keep standing throughout the winter, which may weaken soil C substrate availability. In addition, fine root biomass shows a positive effect on soil respiration rate, which agrees with the study in a tropical rainforest [42]. Therefore, rhizospheric respiration mainly originated from the growth and activity of plant roots could contribute greater at places with higher root biomass [45].
5. Conclusions
Overall, our study shows that understory shrub plays an essential role in affecting the temporal and spatial variations of soil respiration in a climate transitional zone oak forest. The temporal variation of soil respiration during measurement campaigns is greater than the spatial variation across different sampling sites. Soil temperature and understory shrub biomass show higher positive effects on the seasonal variability of soil respiration. Both understory shrub biomass and belowground fine root biomass positively affects spatial variation of soil respiration, probably due to its indirect effect on microclimate and soil organic C. Our findings highlight the importance of understory plants in influencing the temporal and spatial variation of soil respiration and indicate the necessity to consider the variation of soil respiration in both time and spatial scales when evaluating the role of soil CO2 emission in terrestrial ecosystem C cycling.
Author Contributions
Conceptualization, Y.L., and L.W.; methodology, Q.S.; software, Q.S.; validation, L.W., and Y.L.; formal Analysis, Y.L.; investigation, Y.L. Q.S., and L.W.; resources, S.L.; data curation, Y.L.; writing—original draft preparation, Y.L.; writing—review & editing, S.L.; visualization, L.W.; supervision, Q.S.; project administration, Y.L.; funding acquisition, Y.L.
Funding
This study was financially supported by the China National Science Foundation (No. 31600379), the China Postdoctoral Science Special Foundation (2018T110722), Key Research Project of Colleges and Universities in Henan Province (No. 17A180001).
Acknowledgments
Authors thank Yixi Ju and Guangwei Jing for their help in field measurement.
Conflicts of Interest
The authors declare no conflict of interest.
References
- Bond-Lamberty, B.; Thomson, A. Temperature-associated increases in the global soil respiration record. Nature 2010, 464, 579–582. [Google Scholar] [CrossRef] [PubMed]
- Davidson, E.A.; Janssens, I.A. Temperature sensitivity of soil carbon decomposition and feedbacks to climate change. Nature 2006, 440, 165–173. [Google Scholar] [CrossRef] [PubMed] [Green Version]
- Raich, J.; Schlesinger, W.H. The global carbon dioxide flux in soil respiration and its relationship to vegetation and climate. Tellus B 1992, 44, 81–99. [Google Scholar] [CrossRef]
- Saiz, G.; Green, C.; Butterbach-Bahl, K.; Kiese, R.; Avitabile, V.; Farrell, E.P. Seasonal and spatial variability of soil respiration in four Sitka spruce stands. Plant Soil 2006, 287, 161–176. [Google Scholar] [CrossRef]
- Luan, J.; Liu, S.; Zhu, X.; Wang, J.; Liu, K. Roles of biotic and abiotic variables in determining spatial variation of soil respiration in secondary oak and planted pine forests. Soil Biol. Biochem. 2012, 44, 143–150. [Google Scholar] [CrossRef]
- Xie, J.; Chen, J.; Sun, G.; Chu, H.; Noormets, A.; Ouyang, Z.; John, R.; Wan, S.; Guan, W. Long-term variability and environmental control of the carbon cycle in an oak-dominated temperate forest. For. Ecol. Manag. 2014, 313, 319–328. [Google Scholar] [CrossRef]
- Peng, F.; You, Q.G.; Xu, M.H.; Zhou, X.H.; Wang, T.; Guo, J.; Xue, X. Effects of experimental warming on soil respiration and its components in an alpine meadow in the permafrost region of the Qinghai-Tibet Plateau. Eur. J. Soil Sci. 2015, 66, 145–154. [Google Scholar] [CrossRef]
- Raich, J. Temporal variability of soil respiration in experimental tree plantations in Lowland Costa Rica. Forests 2017, 8, 40. [Google Scholar] [CrossRef]
- Montagnoli, A.; Di Iorio, A.; Terzaghi, M.; Trupiano, D.; Scippa, G.; Chiatante, D. Influence of soil temperature and water content on fine-root seasonal growth of European beech natural forest in Southern Alps, Italy. Eur. J. For. Res. 2014, 133, 957–968. [Google Scholar] [CrossRef] [Green Version]
- Reich, P.B.; Luo, Y.; Bradford, J.B.; Poorter, H.; Perry, C.H.; Oleksyn, J. Temperature drives global patterns in forest biomass distribution in leaves, stems, and roots. Proc. Natl. Acad. Sci. USA 2014, 111, 13721–13726. [Google Scholar] [CrossRef] [Green Version]
- Bracho, R.; Natali, S.; Pegoraro, E.; Crummer, K.G.; Schädel, C.; Celis, G.; Hale, L.; Wu, L.; Yin, H.; Tiedje, J.M. Temperature sensitivity of organic matter decomposition of permafrost-region soils during laboratory incubations. Soil Biol. Biochem. 2016, 97, 1–14. [Google Scholar] [CrossRef] [Green Version]
- Schwarz, P.A.; Fahey, T.J.; Dawson, T.E. Seasonal air and soil temperature effects on photosynthesis in red spruce (Picea rubens) saplings. Tree Physiol. 1997, 17, 187–194. [Google Scholar] [CrossRef] [PubMed]
- Liu, Y.; Liu, S.; Wan, S.; Wang, J.; Wang, H.; Liu, K. Effects of experimental throughfall reduction and soil warming on fine root biomass and its decomposition in a warm temperate oak forest. Sci. Total Environ. 2017, 574, 1448–1455. [Google Scholar] [CrossRef] [PubMed]
- Lin, G.; Zeng, D.-H. Heterogeneity in decomposition rates and annual litter inputs within fine-root architecture of tree species: Implications for forest soil carbon accumulation. For. Ecol. Manag. 2017, 389, 386–394. [Google Scholar] [CrossRef]
- Liu, Y.; Liu, S.; Wan, S.; Wang, J.; Luan, J.; Wang, H. Differential responses of soil respiration to soil warming and experimental throughfall reduction in a transitional oak forest in central China. Agric. For. Meteorol. 2016, 226–227, 186–198. [Google Scholar] [CrossRef]
- Tóth, Z.; Táncsics, A.; Kriszt, B.; Kröel-Dulay, G.; Ónodi, G.; Hornung, E. Extreme effects of drought on composition of the soil bacterial community and decomposition of plant tissue. Eur. J. Soil Sci. 2017, 68, 504–513. [Google Scholar] [CrossRef]
- Palmroth, S.; Maier, C.A.; McCarthy, H.R.; Oishi, A.C.; Kim, H.S.; Johnsen, K.H.; Katul, G.G.; Oren, R. Contrasting responses to drought of forest floor CO2 efflux in a Loblolly pine plantation and a nearby Oak-Hickory forest. Glob. Chang. Biol. 2005, 11, 421–434. [Google Scholar] [CrossRef]
- Da Cunha, J.M.; Campos, M.C.C.; Gaio, D.C.; de Souza, Z.M.; Soares, M.D.R.; da Silva, D.M.P.; Simoes, E.L. Spatial variability of soil respiration in Archaeological Dark Earth areas in the Amazon. Catena 2018, 162, 148–156. [Google Scholar] [CrossRef]
- Wei, W.; Weile, C.; Shaopeng, W. Forest soil respiration and its heterotrophic and autotrophic components: Global patterns and responses to temperature and precipitation. Soil Biol. Biochem. 2010, 42, 1236–1244. [Google Scholar] [CrossRef]
- Oishi, A.C.; Palmroth, S.; Butnor, J.R.; Johnsen, K.H.; Oren, R. Spatial and temporal variability of soil CO2 efflux in three proximate temperate forest ecosystems. Agric. For. Meteorol. 2013, 171, 256–269. [Google Scholar] [CrossRef]
- Jiang, F.; Wu, X.; Xiang, W.; Fang, X.; Zeng, Y.; Ouyang, S.; Lei, P.; Deng, X.; Peng, C. Spatial variations in soil organic carbon, nitrogen and phosphorus concentrations related to stand characteristics in subtropical areas. Plant Soil 2017, 413, 289–301. [Google Scholar] [CrossRef]
- Liu, Y.; Liu, S.; Wang, J.; Zhu, X.; Zhang, Y.; Liu, X. Variation in soil respiration under the tree canopy in a temperate mixed forest, central China, under different soil water conditions. Ecol. Res. 2014, 29, 133–142. [Google Scholar] [CrossRef]
- Imer, D.; Merbold, L.; Eugster, W.; Buchmann, N. Temporal and spatial variations of soil CO2, CH4 and N2O fluxes at three differently managed grasslands. Biogeosciences 2013, 10, 5931–5945. [Google Scholar] [CrossRef]
- Rochette, P.; Desjardins, R.; Pattey, E. Spatial and temporal variability of soil respiration in agricultural fields. Can. J. Soil Sci. 1991, 71, 189–196. [Google Scholar] [CrossRef] [Green Version]
- Li, W.; Bai, Z.; Jin, C.; Zhang, X.; Guan, D.; Wang, A.; Yuan, F.; Wu, J. The influence of tree species on small scale spatial heterogeneity of soil respiration in a temperate mixed forest. Sci. Total Environ. 2017, 590, 242–248. [Google Scholar] [CrossRef]
- Wan, S.; Zhang, C.; Chen, Y.; Zhao, J.; Zhu, X.; Wu, J.; Zhou, L.; Lin, Y.; Liu, Z.; Fu, S. Interactive effects of understory removal and fertilization on soil respiration in subtropical Eucalyptus plantations. J. Plant Ecol. 2015, 8, 284–290. [Google Scholar] [CrossRef]
- Chen, Y.; Cai, X.A.; Zhang, Y.; Rao, X.; Fu, S. Dynamics of Understory Shrub Biomass in Six Young Plantations of Southern Subtropical China. Forests 2017, 8, 419. [Google Scholar] [CrossRef]
- Chen, Y.; Yu, S.; Liu, S.; Wang, X.; Zhang, Y.; Liu, T.; Zhou, L.; Zhang, W.; Fu, S. Reforestation makes a minor contribution to soil carbon accumulation in the short term: Evidence from four subtropical plantations. For. Ecol. Manag. 2017, 384, 400–405. [Google Scholar] [CrossRef]
- Miao, R.; Qiu, X.; Guo, M.; Musa, A.; Jiang, D. Accuracy of space-for-time substitution for vegetation state prediction following shrub restoration. J. Plant Ecol. 2018, 11, 208–217. [Google Scholar] [CrossRef]
- Mahlstein, I.; Daniel, J.S.; Solomon, S. Pace of shifts in climate regions increases with global temperature. Nat. Clim. Chang. 2013, 3, 739–743. [Google Scholar] [CrossRef] [Green Version]
- Zhang, W.; Shen, W.; Zhu, S.; Wan, S.; Luo, Y.; Yan, J.; Wang, K.; Liu, L.; Dai, H.; Li, P.; et al. CAN Canopy Addition of Nitrogen Better Illustrate the Effect of Atmospheric Nitrogen Deposition on Forest Ecosystem? Sci. Rep. 2015, 5, 11245. [Google Scholar] [CrossRef] [PubMed] [Green Version]
- Cipollini, M.L.; Drake, B.G.; Whigham, D. Effects of elevated CO2 on growth and carbon/nutrient balance in the deciduous woody shrub Lindera benzoin (L.) Blume (Lauraceae). Oecologia 1993, 96, 339–346. [Google Scholar] [CrossRef]
- Epron, D.; Nouvellon, Y.; Roupsard, O.; Mouvondy, W.; Mabiala, A.; Saint-André, L.; Joffre, R.; Jourdan, C.; Bonnefond, J.-M.; Berbigier, P. Spatial and temporal variations of soil respiration in a Eucalyptus plantation in Congo. For. Ecol. Manag. 2004, 202, 149–160. [Google Scholar] [CrossRef]
- Ohashi, M.; Kumagai, T.O.; Kume, T.; Gyokusen, K.; Saitoh, T.M.; Suzuki, M. Characteristics of soil CO2 efflux variability in an aseasonal tropical rainforest in Borneo Island. Biogeochemistry 2008, 90, 275. [Google Scholar] [CrossRef]
- Van den Pol-van Dasselaar, A.; Corré, W.J.; Priemé, A.; Klemedtsson, Å.K.; Weslien, P.; Klemedtsson, L.; Stein, A.; Oenema, O. Spatial variability of methane, nitrous oxide, and carbon dioxide emissions from drained Grasslands. Soil Sci. Soc. Am. J. 1998, 62, 810–817. [Google Scholar] [CrossRef]
- Huang, Z.; Yu, Z.; Wang, M. Environmental controls and the influence of tree species on temporal variation in soil respiration in subtropical China. Plant Soil 2014, 382, 75–87. [Google Scholar] [CrossRef]
- Pacaldo, R.S.; Volk, T.A.; Briggs, R.D.; Abrahamson, L.P.; Bevilacqua, E.; Fabio, E.S. Soil CO2 effluxes, temporal and spatial variations, and root respiration in shrub willow biomass crops fields along a 19-year chronosequence as affected by regrowth and removal treatments. GCB Bioenergy 2014, 6, 488–498. [Google Scholar] [CrossRef]
- Lu, S.; Katahata, S.; Naramoto, M.; Mizunaga, H.; Wang, Q. Controlling factors of temporal variation of soil respiration in a natural beech forest as revealed by natural incubation experiments. Ecol. Res. 2014, 29, 789–799. [Google Scholar] [CrossRef]
- Qi, Y.; Xu, M. Separating the effects of moisture and temperature on soil CO2 efflux in a coniferous forest in the Sierra Nevada mountains. Plant Soil 2001, 237, 15–23. [Google Scholar] [CrossRef]
- De Long, J.R.; Dorrepaal, E.; Kardol, P.; Nilsson, M.-C.; Teuber, L.M.; Wardle, D.A. Understory plant functional groups and litter species identity are stronger drivers of litter decomposition than warming along a boreal forest post-fire successional gradient. Soil Biol. Biochem. 2016, 98, 159–170. [Google Scholar] [CrossRef]
- Fang, C.; Ye, J.-S.; Gong, Y.; Pei, J.; Yuan, Z.; Xie, C.; Zhu, Y.; Yu, Y. Seasonal responses of soil respiration to warming and nitrogen addition in a semi-arid alfalfa-pasture of the Loess Plateau, China. Sci. Total Environ. 2017, 590, 729–738. [Google Scholar] [CrossRef]
- Kosugi, Y.; Mitani, T.; Itoh, M.; Noguchi, S.; Tani, M.; Matsuo, N.; Takanashi, S.; Ohkubo, S.; Rahim Nik, A. Spatial and temporal variation in soil respiration in a Southeast Asian tropical rainforest. Agric. For. Meteorol. 2007, 147, 35–47. [Google Scholar] [CrossRef]
- Shen, W.; Jenerette, G.D.; Hui, D.; Phillips, R.P.; Ren, H. Effects of changing precipitation regimes on dryland soil respiration and C pool dynamics at rainfall event, seasonal and interannual scales. J. Geophys. Res. 2008, 113. [Google Scholar] [CrossRef] [Green Version]
- Mitra, B.; Mackay, D.S.; Pendall, E.; Ewers, B.E.; Cleary, M.B. Does vegetation structure regulate the spatial structure of soil respiration within a sagebrush steppe ecosystem? J. Arid. Environ. 2014, 103, 1–10. [Google Scholar] [CrossRef]
- Law, B.; Kelliher, F.; Baldocchi, D.; Anthoni, P.; Irvine, J.; Moore, D.V.; Van Tuyl, S. Spatial and temporal variation in respiration in a young ponderosa pine forest during a summer drought. Agric. For. Meteorol. 2001, 110, 27–43. [Google Scholar] [CrossRef]
Figure 1.
Terrain elevation of the study plot and distribution of trees (DBH (average diameter at breast height) > 5 cm). Numbers on lines indicated elevation.
Figure 1.
Terrain elevation of the study plot and distribution of trees (DBH (average diameter at breast height) > 5 cm). Numbers on lines indicated elevation.

Figure 2.
Relationships between temporal variation (CVtp) of soil respiration rate (SR) and shrub biomass (SB, a), grass biomass (GB, b), understory biomass (UB, c), and fine root biomass (FB, d). The CVtp of soil respiration for each point was calculated using equation 1 in each subplot.
Figure 2.
Relationships between temporal variation (CVtp) of soil respiration rate (SR) and shrub biomass (SB, a), grass biomass (GB, b), understory biomass (UB, c), and fine root biomass (FB, d). The CVtp of soil respiration for each point was calculated using equation 1 in each subplot.

Figure 3.
Structural equation model for temporal patterns of soil respiration rate. Black arrows indicate significant positive (solid) or negative (dashed) relationships. Non-significant paths are showed in gray lines. Numbers above the arrows indicate path coefficients (*, p < 0.05, **, p < 0.01). χ2 = 2.249, d. f. = 5, p = 0.503.

Figure 4.
Seasonal patterns of mean values of soil temperature (ST, a), moisture (SM, b), and respiration (SR, c) and their spatial variability (CVsm) across 48 subplots in each measurement campaign. Mean ± S.D., n = 48.
Figure 4.
Seasonal patterns of mean values of soil temperature (ST, a), moisture (SM, b), and respiration (SR, c) and their spatial variability (CVsm) across 48 subplots in each measurement campaign. Mean ± S.D., n = 48.

Figure 5.
Temporal dependence of soil respiration rate (SR) upon soil temperature (ST, a) and moisture (SM, b), and dependence of spatial variation (CVsm) of SR upon CVsm of ST (c) and SM (d). Each point in (a) and (b) represents the mean value of the 48 subplots in each measurement. Each point in (c) and (d) represents the CVs of the 48 subplots in each measurement.

Figure 6.
Spatial dependences of soil respiration rate (SR) on shrub biomass (SB, a), grass biomass (GB, b), understory biomass (UB, c), and fine root biomass (FB, d). Average values of soil respiration in July (the time when we investigated the understory plant biomass) were used here to match the plant biomass data. n = 48.


Table 1.
Allometric equations for the dominant shrub species in our study region. B, aboveground biomass; D, basal diameter.
Table 1.
Allometric equations for the dominant shrub species in our study region. B, aboveground biomass; D, basal diameter.
| Species | Allometric equation | Model R2 | p value | Number of Sample |
|---|---|---|---|---|
| L. glauca | B = 73.190 × D2.5889 | 0.9424 | <0.001 | 15 |
| V. negundo | B = 16.413 × D1.8824 | 0.8136 | <0.001 | 14 |
| S. chinensis | B = 50.139 × D2.7133 | 0.8513 | <0.001 | 13 |
| Others | B = 62.680 × D2.5858 | 0.8994 | <0.001 | 42 |
Table 2.
Mean, maximum, and minimum values of soil respiration (SR), temperature (ST), and moisture (SM) across 48 subplots and corresponding temporal variation (CVtp) of these variables in each subplot. Mean ± S.D.
Table 2.
Mean, maximum, and minimum values of soil respiration (SR), temperature (ST), and moisture (SM) across 48 subplots and corresponding temporal variation (CVtp) of these variables in each subplot. Mean ± S.D.
| Variables | Mean | Maximum | Minimum | CVtp (%) | ||
|---|---|---|---|---|---|---|
| Mean | Maximum | Minimum | ||||
| SR (μmol m−2 s−1) | 2.52 ± 0.11 | 4.13 | 1.57 | 20.64 ± 0.55 | 30.21 | 15.01 |
| ST (oC) | 18.99 ± 0.13 | 20.97 | 17.78 | 8.30 ± 0.07 | 9.31 | 7.21 |
| SM (%v/v) | 17.93 ± 0.70 | 34.25 | 8.71 | 15.61 ± 0.48 | 22.30 | 7.92 |
Table 3.
Spatial variation (CVs) and descriptive statistical analysis of shrub biomass (SB), grass biomass (GB), understory biomass (UB), and fine root biomass (FB) in this study. Mean ± S.D., n = 48.
Table 3.
Spatial variation (CVs) and descriptive statistical analysis of shrub biomass (SB), grass biomass (GB), understory biomass (UB), and fine root biomass (FB) in this study. Mean ± S.D., n = 48.
| Understory vegetation variables | Mean | Maximum | Minimum | CVs |
|---|---|---|---|---|
| SB (t ha−1) | 0.15 ± 0.01 | 0.30 | 0.02 | 6.13 |
| GB (t ha−1) | 0.16 ± 0.02 | 0.63 | 0.01 | 14.07 |
| UB (t ha−1) | 0.30 ± 0.04 | 0.69 | 0.08 | 6.09 |
| FB (t ha−1) | 0.65 ± 0.04 | 1.27 | 0.13 | 7.16 |
Table 4.
Summary of the geostatistical parameters of the empirical semivariogram of soil temperature (ST), moisture (SM), respiration (SR), shrub biomass (SB), grass biomass (GB), understory biomass (UB), and fine root biomass (FB) based on REML fitting procedure. The geostatistical parameters of ST, SM, and SR were generated based on the mean value across the 21 measurements. For explanation of the parameters, see Equation 3. R2 followed by *, **, and *** are significant at 0.05, 0.01, and 0.001, respectively.
| Parameter | Equation | C0 | C0 + C | A | C0/(C0 + C) | R2 |
|---|---|---|---|---|---|---|
| ST (oC) | Gaussian | 0.103 | 1.171 | 74.357 | 0.912 | 0.998*** |
| SM (%v/v) | Linear | 29.081 | 29.081 | 32.746 | 1.000 | 0.996*** |
| SR (μmol m−2 s−1) | Exponential | 0.040 | 0.694 | 20.110 | 0.057 | 0.497** |
| SB (t ha−1) | Linear | 0.023 | 0.023 | 32.746 | 1.000 | 0.693** |
| GB (t ha−1) | Spherical | 0.032 | 0.267 | 11.210 | 0.120 | 0.535* |
| UB (t ha−1) | Linear | 0.023 | 0.323 | 11.945 | 0.070 | 0.720** |
| FB (t ha−1) | Spherical | 33.000 | 837.900 | 17.100 | 0.961 | 0.796*** |
© 2019 by the authors. Licensee MDPI, Basel, Switzerland. This article is an open access article distributed under the terms and conditions of the Creative Commons Attribution (CC BY) license (http://creativecommons.org/licenses/by/4.0/).
Share and Cite
MDPI and ACS Style
Liu, Y.; Shang, Q.; Wang, L.; Liu, S. Effects of Understory Shrub Biomass on Variation of Soil Respiration in a Temperate-Subtropical Transitional Oak Forest. Forests 2019, 10, 88. https://0-doi-org.brum.beds.ac.uk/10.3390/f10020088
AMA Style
Liu Y, Shang Q, Wang L, Liu S. Effects of Understory Shrub Biomass on Variation of Soil Respiration in a Temperate-Subtropical Transitional Oak Forest. Forests. 2019; 10(2):88. https://0-doi-org.brum.beds.ac.uk/10.3390/f10020088
Chicago/Turabian StyleLiu, Yanchun, Qing Shang, Lei Wang, and Shirong Liu. 2019. "Effects of Understory Shrub Biomass on Variation of Soil Respiration in a Temperate-Subtropical Transitional Oak Forest" Forests 10, no. 2: 88. https://0-doi-org.brum.beds.ac.uk/10.3390/f10020088
Note that from the first issue of 2016, this journal uses article numbers instead of page numbers. See further details here.