Species Mixing Effects on Height–Diameter and Basal Area Increment Models for Scots Pine and Maritime Pine


1
Sustainable Forest Management Research Institute, University of Valladolid & INIA, Av. Madrid 44, 34004 Palencia, Spain
2
Department of Silviculture and Forest Management, INIA, Forest Research Centre, Ctra. A Coruña, km 7.5, 28040 Madrid, Spain
3
Department of Forest Engineering, Resources and Management, Oregon State University, Corvallis, OR 97331, USA
4
Departamento de Producción Vegetal y Recursos Forestales, E.T.S de Ingenierías Agrarias, Universidad de Valladolid, 34004 Palencia, Spain
*
Author to whom correspondence should be addressed.
†
Adapted from my Ph.D. Thesis, E.T.S de Ingenierías Agrarias, Universidad de Valladolid, 34004 Palencia, Spain.
Forests 2019, 10(3), 249; https://0-doi-org.brum.beds.ac.uk/10.3390/f10030249
Submission received: 26 February 2019
/
Revised: 7 March 2019
/
Accepted: 7 March 2019
/
Published: 12 March 2019
(This article belongs to the Special Issue Competition and Facilitation in Mixed Species Forests)
Abstract
:Models that incorporate known species-mixing effects on tree growth are essential tools to properly design silvicultural guidelines for mixed-species stands. Here, we developed generalized height–diameter (h-d) and basal area growth models for mixed stands of two main forest species in Spain: Scots pine (Pinus sylvestris L.) and Maritime pine (Pinus pinaster Ait.). Mixed-effects models were fitted from plot measurement and tree rings data from 726 Scots pine and 693 Maritime pine trees from mixed and pure stands in the Northern Iberian Range in Spain, with the primary objective of representing interactions between the species where they are interspersed in mixtures of varying proportions. An independent dataset was used to test the performance of the h-d models against models previously fitted for monospecific stands of both species. Basal area increment models were evaluated using a 10-fold block cross-validation procedure. We found that species mixing had contrasting effects on the species in both models. In h-d models, the species-mixing proportion determined the effect of species interactions. Basal area growth models showed that interspecific competition was influential only for Maritime pine; however, these effects differed depending on the mode of competition. For Scots pine, tree growth was not restricted by interspecies competition. The combination of mixed-effect models and the inclusion of parameters expressing species-mixing enhanced estimates of tree height and basal area growth compared with the available models previously developed for pure stands. Although the species-mixing effects were successfully represented in the fitted models, additional model components for accurately simulating the stand dynamics of mixtures with Scots pine and Maritime pine and other species mixtures require similar model refinements. Upon the completion of analyses required for these model refinements, the degree of improvement in simulating growth in species mixtures, including the effects of different management options, can be evaluated.
1. Introduction
Despite evidence that many mixed-species forests offer greater potential to supply ecological and socio-economical goods and services than monospecific forests [1], quantitative silvicultural guidelines that facilitate the efficient management of mixed-species stands are still largely based on research information from pure even-aged stands [2]. Moreover, the lack of tools for evaluating the long-term sustainability of silvicultural systems proposed for mixed-species stands hinders the acceptance of these systems by stakeholders, practitioners, and scientists [3], particularly concerning potential trade-offs between timber productivity and other ecosystem services involved in moving from single-species stands to potentially more heterogeneous mixed-species forests [4]. Similar trade-offs must be understood to achieve desired outcomes even in single-species stands that can accommodate higher levels of heterogeneity and biodiversity under regimes that depart from those expected to achieve optimal timber productivity [5].
Recent research has demonstrated the inability to simulate the dynamics of the stand-level attributes of mixed-species stands by applying weighted means of the same attributes from pure stands of the constituent species [6]. Results support the general conclusion that the stand and species productivity [7], size distribution and other stand structural attributes [8], tree allometry [9,10], mortality [11], and carrying capacity [12] of mixed-species stands are different from the weighted means of the respective pure stand. However, these effects are not generalizable, because they do not necessarily apply to all combinations of tree species [13], or even to specific species mixes with differences in stand structure [14] or under different site conditions [15]. The development of models that consider known species-mixing effects on tree and stand productivity, tree allometry, mortality, and maximum density is essential to properly design the initial composition and subsequent spatial arrangement and management of mixed-species stands [6].
A critical issue for representing species mixing in forest growth models is the transition from the tree to the stand level, which involves introducing the tree size structure, crown morphology, canopy structure, and growth differences that emerge from species interactions [16]. Modeling at an individual tree resolution is essential to accurately simulate the almost infinite range in stand structures that are possible for a given set of mixed-species stand-level attributes. This is especially important for mixed-species stands where structural and environmental heterogeneity affect productivity at the stand level [2,8].
The equations that are typically used in growth models for simulating productivity under alternative silvicultural regimes are almost certainly influenced by species composition and the resulting variation in stand structure. Therefore, productivity estimates for mixed-species stands are almost certainly influenced as well. The potential crown sizes and growth patterns of the species in a mixed stand may be more relevant for stand growth and potential stand and species overyielding than the given site conditions [2,17]. Since crown size and growth functions are seldom available for species growing in mixed stands, the functions that have been developed for pure stands are commonly used [16]; however, these relationships may not even be well quantified for some species of interest that commonly grow in single-species stands. The effects of either using functions developed from pure stands, or from a combination of pure and mixed stands, may be significant depending on the covariates used in the model. For example, the crown ratio accounts for some additional variability in stem form and volume when its marginal effect on a function containing tree diameter and total tree height is considered [18,19]; hence, if the tree diameter–height–crown ratio combination reflects the local stand structure in complex mixed species stands, the models developed should perform well as long as the modeling data covered the desired trivariate range of these covariates. The extent to which additional information on species composition would affect stem form is largely unknown. Limited evidence suggests the effects would be small [20], but this working hypothesis should be further tested.
Three approaches to representing species-mixing effects in empirical models have been proposed [2]: (i) computing stand-level attributes as the weighted mean attribute of the pure stands (e.g., weighted by species basal area), (ii) adding covariates that represent the almost infinite range of stand structures in mixed species stands, or (iii) including modifiers to represent the departure of mixed species stand attributes from pure stand attributes as a function of species composition. Forest growth models that are based on existing functions for even-aged stands could be directly parameterized from or adapted to more complex stands (uneven-aged or mixed stands) by using correction factors or including specific variables to express the multi-species condition [21,22]. Thus, models of species’ growth rates, tree allometry, maximum density, or mortality could be sensitive to the intraspecific and interspecific competitive environment across the gradient, from pure stands of one species to mixed-species stands to pure stands of another species [9,11,12].
Scots pine (Pinus sylvestris L.) and Maritime pine (Pinus pinaster Ait.) are two of the main tree species in Spain. Growth and yield models for both species are available for different management purposes, for regions and at different scales; however, most models and management tools were developed for pure even-aged stands [23]. Both species grow in pure and mixed stands, either naturally or in stands planted for afforestation. Mixed-species stands are mainly located in the Northern Iberian Range (~50,000 ha), where mixed stands of Maritime pine and Scots pine have traditionally been managed using tools developed in pure stands, with emphasis on the more profitable species, which is Scots pine in this case. For both species, a tree-level distance-independent model (IBERO) is available for even-aged monospecific stands in the region [24]. IBERO predicts the growth of each tree over five-year growth periods for even-aged monospecific stands of Scots pine L. (IBEROPS) in the Iberian and Central Range [25] and Maritime pine (IBEROPT) in the Southern Iberian Range in Spain [26]. IBERO is structured by processes that drive stand dynamics, including the initialization and associated assignment of heights and crown dimensions [27], productivity (side index) [28,29,30], mortality and ingrowth [31,32], diameter and height growth, and stem-taper [27].
This study aimed to develop generalized height–diameter (h-d) and basal area growth models for individual trees in mixed-species stands of Maritime pine and Scots pine in a manner that tested the effect of potential species interactions or species composition on model form, model parameters, and associated growth estimates. Both single-species and mixed-species models could be potentially integrated within IBERO to consider the potential species-mixing effects on initialization and growth sub-modules. We focused on these components because previous evidence showed that crown allometric plasticity and stand vertical stratification could vary in response to different environmental conditions created by differences in competition between constituent species [33]. Likewise, tree growth has sometimes been shown to increase in mixed stands compared to monocultures [34]. The methods applied and specific answers to the following questions have general applicability to mixed-species stands in most forest types, and thus help establish general principles for modeling the growth and stand dynamics of mixed stands. (1) For a mixed species stand on a given site, do the h-d relationships for each species vary significantly with stand attributes and species composition? (2) If so, are the effects of species composition on h-d relationships better represented by species-mixing proportions that consider the species-specific growing space requirements? (3) For a mixed-species stand on a given site, do the basal area growth rates of individual trees of each species respond significantly and similarly to intraspecific and interspecific competition? (4) Can further or alternative separation into size-symmetric and size-asymmetric competition account for a significantly greater marginal gain in explained basal area growth?
2. Materials and Methods
2.1. Data
Individual-tree growth records and diameter and height measurements were obtained from 36 plots, which were grouped into 12 triplets of pure and mixed stands of Scots pine and Maritime pine (Figures S1 and S2). Triplets were established in 2014–2015 by the Sustainable Forest Management Research Institute UVa-INIA (iuFOR) in the Northern Iberian Range. This forest cover is divided into even-aged sections and compartments. The main objective is timber production, but includes a clear multifunctional management objective. Traditionally, forest management consists of strip clear-cutting with soil movement and planting or sowing when necessary, and moderate thinning from below. The study area has a mean annual temperature of 9.0 °C and a mean annual precipitation of approximately 801 mm. Plots are located at an elevation ranging from 1090 to 1277 m a.s.l. Soils are acidic (pH 3.9–5.4) with sandy loam to sandy texture, low cation exchange capacity (2.4–18.1 cmolc kg−1), and medium to low water-retention capacity (1.5–18 g cm−2) [35]. Each triplet consisted of three circular plots of 15-m radius within one km of each other, including two plots dominated either by Scots pine or Maritime pine and one mixed plot that contained both species with a mixing proportion of at least 75%–25% of the total basal area. Plots within triplets had similar site conditions, age, and density, and belonged to the same management compartments with the same silviculture regime (see details in [33]). The stands were at approximately carrying capacity, (60% to 100+% of known maximum density), and none of the plots had been thinned for at least 10 years. Both species were in the same age phase comparing pure and mixed-species stands by triplet, ranging from mature (45 to 50 years) to old stands (120 to 140 years). Site quality at age 100 years indicated moderate to low growth conditions according to the top height curves of the pure stands developed for Scots pine [29,30] and Maritime pine [28]. Some variations in stand age and site conditions were tolerated among triplets to cover the stand variability in the study area.
All stems >7.5 cm in diameter were inventoried and measured for diameter at breast height over bark (d, nearest 0.1 cm). For each tree, total height (h) and height to crown base (hcb, base of the lowest live primary branch) were measured using a vertex hypsometer to the nearest 0.01 m. Stand variables were calculated from measurements of triplets (Table 1), including dominant diameter (Do, cm) and dominant height (Ho, m) based on the 100 thickest trees per hectare of the stand, quadratic mean diameter (dq, cm), and stand basal area (BA, m2 ha−1).
Increment cores that included at least the last 15 years were extracted at a height of 1.30 m, avoiding dead or very suppressed trees. A total of 328 and 408 Scots pine from mixed and pure stands, respectively, and 234 and 459 Maritime pine trees from mixed and pure stands, respectively, were sampled. All of the cores were mounted, sanded until tree-rings boundaries were clearly visible, and scanned at 1800 ppi image resolution. For each cored tree, tree ring widths (mm year−1) were dated and measured from the scanned images using the measuRing R-package [36]. We performed cross-dating using species-specific marker years, narrow rings, followed by statistical confirmation of quality tree-ring series synchronization using the dplR R-package [37]. To fit basal area growth models, past five-year growth (2009–2014) needed to be related to initial conditions, which was referred to as ‘backdating’. For all of the cored trees, diameter over bark at breast height in 2009 was computed using the diameter measured in 2014, and then subtracting the tree ring width measurements, and applying species-specific bark factors [27]. Except for crown ratio (CR, ratio of crown length and tree height), all of the tree and stand variables were backdated. The ratio of tree height to stand dominant height (Rh) was backdated using the h-d function fitted in this study.
2.2. Generalized Height–Diameter Functions
In this study, we considered five functions tested previously to fit the h-d relationships for both species in monospecific stands [27]. Additionally, we tested four asymptotic nonlinear functions that have been widely used for modeling h-d relationships (Table S1). All of these models were modified to include various tree-level and stand-level variables, and the parameter representing the asymptote of the models was expanded as a linear function of the selected covariates. Including stand-level variables in the formulation of h-d models helped consider the local environment in the tree height estimates and ensured that the curves depicted within-stand trends in a single year of measurement. Height–diameter relationships are influenced by the tree social status and vigor, site quality, stand developmental stage, stand density, competition, and stand composition [9,38,39,40,41]. We evaluated the contribution of stand and tree variables (Table 1) for potential improvement of the h-d functions tested, such as dominant height and plot mean quadratic diameter to reflect the stand development stage, the ratio between the diameter of the subject tree and the plot mean quadratic diameter as a social status index, and plot basal area and the basal area of trees larger than a subject tree (BAL, m2 ha−1) as a competition index. Explanatory variables were selected for each model if they were significant and improved the model likelihood, as indicated by the Akaike information criterion (AIC) [42].
Given that the h-d models developed here are intended for mixed stands of Maritime pine and Scots pine, we used species mixing proportion (m) to identify the significant effects of species interactions on h-d relationships. Mixing proportions for both species were calculated based on the stand density index (SDI) and weighted by equivalence coefficients that compare species-specific growing space requirements [16,33].
Since h-d relationships are expected to vary by species [27], models were fitted by species using nonlinear mixed-effects models (NLME) to consider the hierarchical levels of the data (multiple trees in a plot, plots nested in triplets). This nested structure could have caused high correlation among observations within a sampling level, so NLME alleviated this lack of independence of error terms [42]. Accounting for within-triplet correlations did not significantly improve the models based on the likelihood ratio test. A general NLME [42] can be defined as follows:
where is the observed height of tree j within plot i; is a nonlinear function of the 1 × p covariate; is a parameter vector for plot i; and is the tree error term that is assumed to be independent and normally distributed with a mean of zero and constant variance . In matrix form:
where is the × 1 observation vector for the ith plot; Xi is the × p design matrix for the ith plot; is the parameter vector for the ith plot; and is the × 1 vector of residuals for the ith plot. The parameter vector can be split between fixed and random components [α’, βi’]’ to form a nonlinear mixed-effects model as follows [42]:
where αi is the q × 1 vector of the fixed parameters common to all trees and plots (q is the number of fixed parameters in the model), βi is the r × 1 vector β of random parameters associated with the ith plot (ri is the number of random plot parameters in the model), and and are matrices of fixed and random effect covariates, respectively, for the ith plot.
We tested different combinations of random parameters to determine which parameters should include both fixed and random components. First, all parameters on fixed effect variables were assumed to be random, with a general positive definite variance–covariance structure for the random effects. If this model failed to converge, then the number of random parameters was reduced to achieve convergence. Non-nested fitted models were compared by AIC after fitting by maximum likelihood (ML). In addition, we screened for large correlations between estimated random-effects parameters to evaluate whether the NLME model was over-parameterized. The best-fitting generalized h-d functions were re-estimated using the unbiased restricted maximum likelihood method (REML) with R-package ‘nlme’ [42]. From the total generalized h-d functions fitted with NLME, Equation (4) was concluded to best describe the variations in the h-d relationship for Scots pine and Maritime pine, based on the lower AIC and RMSE values (Table S2):
where is the height of tree in plot , to and are considered fixed parameters; is a random plot effect parameter; is an error term that is assumed to be independent and normally distributed; and is the species mixing proportions of target species, for Scots pine and for Maritime pine models; all of the other variables were previously specified in Table 1. Convergence was possible when only one or two parameters of the model were treated as random. However, most of the models with two parameters specified as random showed high correlations between the random parameter, indicating over-parameterized models that can produce poor estimates of the standard errors on the fixed-effect parameters in the model [42]. For both species, the model treating as a random parameter at the plot level gave the smallest AIC value. Graphical analysis showed within-sample plot heteroskedasticity in the residuals, even after the inclusion of the random effects. The power variance function in Equation (5) was included in NLME h-d models; it homogenized the residual variance most effectively among three-variance functions evaluated, including exponential, power, and constant-plus-power functions [42]:
where are the residuals at the lowest level of grouping (plot); is the initial variance for the residual; is a parameter to be estimated from the data; and is the observed tree height.
2.3. Tree Growth Model
We fitted the basal area increment model using the same NLME approach, which was based on a potential growth function multiplied by a modifier function [43,44]. The potential growth estimates the maximum growth depending on tree diameter, which is then reduced by an amount proportional to competition or other limiting factors [43]. The function is formulated as:
with , where BAI is the predicted five-year basal area increment of a tree (cm2 5 years−1); d is the initial diameter (cm); α1 and α2 are parameters in the potential growth portion of the equation to be estimated from the data; β0, …, βk are the parameters in the exponentiated linear modifier function with k explanatory variables (V1, …, Vk); and is the residual error. We considered as a covariate to indicate tree vigor; to indicate competitive status of tree in the stand; and SI, or site index, as a measure of stand productivity (Ho expected at 100 years breast height as estimated from species-specific site index curves [28,29,30]). We assumed that SI in the pure stands of the triplet was a valid estimate of the site index of both species in the mixed-species plot. Finally, we included a competition term () as a combination of both a one-sided (asymmetric) and a two-sided (symmetric) competition used to adjust the potential to actual growth. We compared BA versus SDI to determine the most suitable explanatory variable for competition. Both metrics were distance-independent measures of competition that do not require tree spatial coordinates, because tree locations on the plot are not available in most of the stand inventories in the region. First, we used the basal area of trees larger than the subject tree (BAL) as the size-asymmetric competition, and the total stand basal area (BA) as the size-symmetric competition. Further, SDI was expressed in relative terms (SDIR), as the ratio between the measured SDI and the maximum potential stand density index for each species (SDImax) [45]. We used SDIR to express the size-symmetric competition and relative stand density index of trees larger than the target tree (SDIRL) [11,46] as an indicator of size-asymmetric competition for light. Parameters to estimate SDImax depend on the species, and were taken from species-specific maximum stand density functions [34,47]. Covariates were included in the following order: crown ratio, competition structure, , and site index. Only significant variables were included, and we used AIC and a likelihood ratio test to evaluate the overall contribution of the added covariate relative to a simpler model.
To evaluate the influence of species-mixing on the basal area growth model, competition indices for each species were calculated by pooling both species together and then splitting them into intraspecific and interspecific components [46]. Thus, the resulting competition structures might express the adverse, neutral, or even positive interspecific competitive effects, e.g., when parameter estimates for interspecific competition are higher, non-significant, or lower, respectively, than the intraspecific variable. Then, these new variables were used to test whether distinguishing between intraspecific and interspecific competition results in a better fit of the basal area growth than ignoring the species contributing to the total symmetric and asymmetric competition. We identified the best competition structure taking into account model parsimony using an information-theoretic approach [48]. The model with the lowest AICc (Second-order Akaike Information Criterion) and greater Akaike weight () was considered the best and most parsimonious model [48] for the observed data relative to the set of alternative models with different competition structures (see Appendix S2 in Supplementary Material).
Given the hierarchical nature of the data, we used NLME to fit a model for predicting the basal area growth while accounting for possible autocorrelation among trees within plots and plots within triplets. The significance of the random plot and triplet effect was based on the likelihood ratio test (p < 0.05) between nested models in the presence of all non-collinear fixed predictors [42]. For both species, the random triplet effect was non-significant. We first included plot as a random effect in the parameter of the potential diameter growth component, and then in the intercept () of the modifier function, but the latter step did not improve the model performance (the intercept was not significant). Equation (7) depicts the base nonlinear mixed-effects model that was used for predicting the tree basal area increment of Scots pine and Maritime pine in mixed and pure stands:
where BAIij is the basal area increment of tree within plot i; α1, α2, and are parameters to be estimated from the data; represents the competition term experienced by tree in plot according to the different structures described above; βk are parameters for competition effects estimated from the data; is the random plot effect; and is the error term. Random effect and error term are assumed to be normally distributed with a mean of zero and a variance σi2 and σε2, respectively. Fitted models showed non-constant variance in the residuals for both species. This problem was addressed by weighting observations using the same variance function as in Equation (5), testing d, BAL, and BA to model the residual variance. We verified mixed-model assumptions graphically (quantile–quantile and residual plots). Individual-tree basal area increment models were fitted by species using the nlme R-package [49]. ML was used to compare different competition structures, and then REML was used to fit the parameter estimates and variance components for the final model selected for each tree species.
2.4. Model Evaluation
Predictions of the h-d function and basal area increment model for both species were examined to assess their predictive ability. We used the Third Spanish National Forest Inventory data (NFI) as an independent data source to quantify the model errors of the h-d generalized functions (Figure S3). A total of 213 permanent plots of mixed and pure stands from the NFI network located in the Northern Iberian Range were selected for this purpose, including 47 mixed plots, 109 pure plots of Scots pine, and 57 pure plots of Maritime pine. Plots were considered pure stands when the percentage of the total basal area of the target species was higher than 90%, and mixed stands when both species together accounted for at least 90% of the total basal area, and the proportion of each target species in the mixture plots was higher than 15%. Predictions from the most parsimonious generalized h-d functions that expressed species-mixing effects in their structure were compared with the predictions of the models proposed for the same species parameterized with data from monospecific stands [25,26].
There were some limitations with using the NFI data to evaluate the basal area increment models. Stand age and height to crown base were missing, so the CR could not be calculated. Instead, we evaluated the predictive quality of the basal area increment models using a 10-fold block cross-validation procedure. The original dataset was split at the plot level into 10 subsamples of approximately equal size. The final models were fitted 10 times for each plot, with one of the subsamples omitted at each fit for training the model. Each of the 10 fitted models was tested with the observation of the omitted subsample, and statistics were computed from the differences between the predicted (Pi) and observed (Oi) values across all plots. These predictions provided a pseudo-independent measure of the mean bias, root mean square error (RMSE), and model efficiency (EF), which were computed as follows:
where and were the observed and predicted values, respectively, for the th observation; was the total number of observations; and was the mean of all the observations of the variable. In Equations (4) and (7), each predicted value Pi was estimated by setting μi set to zero; i.e., predictions were based only on fixed effects from the final models; any bias in the model that was attributable to the expectation of a model with nonlinear random effects not including the population mean condition fixed effects was assumed to be minor [38].
3. Results
3.1. Generalized Height–Diameter Selected Models
After the pre-selection of competing variables and comparison among candidate models (see models ranking based on AIC and RMSE values in Table S2), Equation (4) was the most plausible model to describe h-d relationships in Scots pine and Maritime pine. Dominant height and quadratic mean diameter were the most important variables in the final models; further total basal area and tree social status index were non-significant, and did not improve model performance. The inclusion of the mixing proportion of the target species improved the fit statistics of selected equations, reducing the AIC value for Scots pine by 7.2 and for Maritime pine by 1.7 (Table 2). The height predictions of the models covered most of the observations and showed adequate prediction accuracy (Figure S4). On inspecting the residuals versus predicted height from the best models for each species, we observed a homogeneous variation of the residuals over the full range of the predicted values, which would suggest compliance with the assumption of homogeneity of variance (Figure S5).
As an example, Figure 1 shows the sensitivity analysis for Scots pine and Maritime pine, respectively, in regard to the effect of the selected variables on tree height. Ho provided the largest contribution to the h-d models for both species, and showed that the tree heights increased with the increasing effect of stand development described by Ho and dq (Figure 1a,b,d,e). Moreover, the mixing proportion showed a different sign between species, indicating apparent differences of the effects of species mixing in the h-d fitted models (Table 2). When all of the other conditions were assumed to be the same, the tree height increased with increasing for Scots pine (Figure 1c) and decreased with increasing for Maritime pine (Figure 1f). Thus, Scots pine trees growing in monospecific stands reached larger heights than trees in mixed stands at a specific stand condition (including stand density). In contrast, an increase in implies a smaller tree height for Maritime pine, so the heights associated with a given d were greater in mixed stands (Figure 2).
3.2. Height–Diameter Function Validation
The most parsimonious h-d functions (Table 2) were validated based on the independent dataset, a set of pure and mixed plots selected from the third NFI plot network (Figure S3). Validation statistics were calculated and compared with the performance of the equations proposed by Lizarralde et al. [25,26] for monospecific stands of both species. When the fitted models were applied to trees in mixed stands, the Scots pine h-d function had a larger model efficiency and lower RMSE than of those of Maritime pine (Table 3).
Results were consistent across stand composition when prediction bias was compared between the models fitted in this study and those proposed by Lizarralde et al. [25,26]. For both species, the fitted model that included mixed-species stands attributes reduced the total prediction error in the mixed stands, increasing the model efficiency by 6% and 1%, for Scots pine and Maritime pine, respectively. The gain in efficiency in pure stands was about 2% for both species. The fitted models reduced the mean bias of tree height predictions for both species in mixed and monospecific stands across medium to small diameter classes (d < 25 cm; Figure 3). Bias from both models in other diameter classes followed the same patterns. Bias was evident and sizable in larger diameter classes (d > 65 cm) for Maritime pine, although these diameter classes were outside the range of the values that were used to fit the models (Table 1).
3.3. Basal Area Increment Model
Differences in growth rates between mixed and pure stands were more evident in Maritime pine that in Scots pine (Figure S6). In the fitting model, the inclusion of random effects greatly improved the goodness-of-fit indicators, decreasing AIC and producing significant differences in the likelihood ratio. For both species, a power variance function depending on d performed well for homogenizing the variance. A visual check of the model residuals indicated no major departures from the assumptions of normality and homogeneity of variance.
According to the base model structure, the basal area growth increased with the initial tree diameter, d, and with CR, but the magnitudes differed between species. The site index did not improve the performance of the models in either species, as indicated by non-significant differences from the likelihood ratio tests, so it was not included in the base model. Rh had high collinearity with the diameter (variance inflation factor, VIF > 10), so it was also excluded. The inclusion of competition in the model structure considerably improved the BAI models for both species. Competition terms relying on BA and BAL yielded the most parsimonious models compared to competition expressed in terms of relative stand density index.
Table 4 compares the different models that included symmetric or asymmetric competition structures. Not all the possible combinations of competition structure are listed, because non-significant parameters were excluded from the models, and the remaining parameters were re-estimated. Clear differences between species in terms of competition structure were observed after ranking models by AICc and Akaike weights (). For Scots pine, the best ranked model included both size-symmetric and size-asymmetric for predicting the basal area tree growth in mixed and pure stands, with species composition adding little predictive ability (Table 4). The model containing species-specific size-asymmetric competition, BALintra and BALinter, increased AICc very little (ΔAICc = 1.77), endorsing the idea that species mixing may not have a strong influence on Scots pine basal area growth. The results for Scots pine contrasted with the best basal area periodic annual increment (cm2 5 years−1) (BAI) model for Maritime pine. Here, the effects of competition on the basal area growth rate in the most parsimonious model were most accurately predicted by the combination of size-symmetric and size-asymmetric indices separated into intraspecific and interspecific components (Table 4). Akaike weights, , for the model separating asymmetric competition into species-specific components indicated the relative superiority of the second-ranked model containing BAL with no discrimination between competitor species, and was much better than the model with no separation of total competition between species (BA or BAL).
The BAI models with the lowest AICc value were fitted by the REML procedure (Table 5). All of the parameters were significant at p-value < 0.05. Species competition relationships only affected BAI in Maritime pine. Here, the symmetric competition effect was imposed mainly by other Maritime pine, and the symmetric interspecific competition imposed by Scots pine was not significant. Thus, at increasing proportions of basal area of Scots pine (decreasing BAintra) in mixed stands, Maritime pine BAI increased (Figure 4a). On the other hand, the size-asymmetric competition of Scots pine was greater than the intraspecific competition, implying an increased competition effect when the larger competitors were Scots pine rather than Maritime pine competing against itself. This relationship resulted in a decrease of Maritime pine BAI with an increasing BAL proportion of Scots pine in a mixed stand (Figure 4b). Species mixing imposed a positive effect in size-symmetric competition, but a negative effect on size-asymmetric competition.
Figure 5 depicts the effects of species composition of both size-symmetric and size-asymmetric competition on the BAI of Maritime pine, comparing different scenarios when trees were influenced by intraspecific competition only, pure stands (Proportion = 1), and when competition was the combination of intraspecific and interspecific competition, mixed stands (Proportion < 1). The positive effect species mixing on Maritime pine tree growth was smaller as the proportion of Scots pine in the size-symmetric competition increased. However, BAI reduced strongly as the total size-asymmetric competition of Scots pine increased (e.g., in codominant and suppressed trees). The Scots pine showed no species-mixing effects, and the influence of BA, BAL, and CR on the BAI model was simulated in Figure S7.
4. Discussion
Contrasting mixing effects on two or more species in mixed forest stands are common among a range of forest types [9,10,13,50,51]. Our results similarly showed that species-mixing had contrasting effects between species in both the generalized h-d and basal area growth models. Both models described the stand structure and stand dynamics of mixed stands relying on temporary plots grouped in triplets and located where two species such as Scots pine and Maritime pine mix, as is the case in the Northern Iberian Range. Mixed and pure plots covered the prevalent stand development stages, site conditions, and mixing proportions in the region, and were exposed to the same silvicultural regime within a given triplet. Typically, a triplet design allows the control of some stand conditions analogous to blocking, avoiding confounding factors at least for part of the stand development [52]. In this way, estimates of tree height and BAI would accurately represent the species interactions in models that are sufficiently flexible to incorporate mixing effects and test for their magnitude and direction.
4.1. Influence on Species-Mixing in Tree Allometry
For both species, h-d models described a large proportion of the variation in tree height among plots and exhibited no substantial trends in the residuals to indicate bias (Figures S4 and S5). This result suggested that the selected model (Equation (4)) was sufficiently flexible to accommodate mixed species stands and mixing effects that influence the basic structural relationships. Although the final fitted models for mixed species stands differed from the basic formulation of the models developed by Lizarralde et al. [25,26] across a broader geographic area, both included stand variables that reduced bias and increased the precision of the model estimates [38,41]. Testing predictions from these new equations on an independent dataset showed modest increases in the accuracy of height estimates for trees growing in mixed and pure stands (Table 3 and Figure 2).
Dominant height was important to describe the effect of site quality as defined by stand growth and yield capacity [38,39], and it was the most influential covariate in the h-d models (Figure 1a,d). All else being equal, dq measured the degree of inter-tree competition, and secondarily the stage of stand development [41,53,54]. Although the same variables have already been used in several h-d functions for multi-species forest [39,40,50,54], in those studies, the effects of species interactions on h-d relationships were not quantified. Here, we show that for mixed stands, the explicit evaluation of mixing proportion based on species-specific growing space requirements could be advantageous for modeling the more complex effects of the vertical structure of mixed species stands compared to pure stands. Different species almost certainly differ in their influence on competition for light in a forest canopy given their variation in potential crown dimensions, branching structure, leaf area density, and light capture [17,55,56]. Although other tree and stand variables such as stand age or spatially explicit competition indices may also help fine-tune h-d relationships [39], these were not considered because they require a substantial increase in the cost of forest inventory, which restricts the practical application of the developed predictive functions.
The structure of Equation (4) considers Ho and as complementary parameters, with Ho acting as an asymptote, and quantifying relative species prevalence in the h-d models. The effect of varied between the species in the fitted models (Table 2), and the sign of their parameters and the size ranges of the two species in mixed species stands (Table 1) seemed to support the tendency of Maritime pine to overtop Scots pine in mixed stands (Figure 2 and Figure S8). The varying magnitude of the effects of species-mixing in the h-d relationship observed for other mixtures [55,57,58] suggest that the degree of differences in the h-d relationship might depend on shade tolerance, crown width potential, relative juvenile and mature height growth patterns, and maximum potential stand density, with a greater response exhibited by less shade-tolerant species [9].
The predictions from the h-d models fitted to the triplets data for both species perform better than estimates from the previously available h-d models for pure stands [25,26]. Besides the inclusion of terms that expressed the species-mixing effect on the h-d models, consideration of the hierarchical structure of the data in the NLME modeling approach increased the proportion of variation in height, which was accounted for by including random plot effects in addition to only fixed-effects nonlinear models [38,42]. Increasing the accuracy of tree height estimates in mixed stands has important implications, because differences in tree morphology directly affect crown competition, stem volume, biomass production, mechanical stability, and wood quality predictions. In addition, small differences in initial stand structure associated with differences in species composition and proportions of the species are magnified over time, and impose profound changes in stand dynamics [59].
In previous analyses, mixed stands of Scots pine and Maritime pine showed changes in their vertical structure compared with pure stands, which resulted from species interaction rather than the simple combination of species with different traits and structural morphology [33]. The heterogeneity in the vertical structural of mixed stands has been related to over-yielding at the stand level, and sometimes greater stand productivity than in single-species stands [8,14]. These results underscore the need to develop models that reliably account for species interactions as part of the stand dynamics of mixed-species stands.
4.2. Tree Basal Area Growth Models Adapted to Mixed Stands
Our analysis showed that interspecific competition was only relevant for Maritime pine BAI; however, these effects differed depending on whether the competition was symmetric or asymmetric. In contrast, Scots pine BAI was unaffected by mixing, i.e., insensitive to species composition of BA.
For Maritime pine, only intraspecific size-symmetric competition was significant, which might suggest that an increase in BAI can be achieved by a reduction in competition for the below-ground resources in mixtures with Scots pine compared to homogeneous pure stands. However, this positive effect might be overridden by the greater negative effect of interspecific size-asymmetric competition, which might indicate stronger competition for light [46]. Figure 5 shows the effects of interspecific competition and competitive reduction occurring simultaneously when comparing size-asymmetric and size-symmetric competition depending on the competitor species. This simulation also indicates that species exhibited unbalanced competitive relationships for above-ground and below-ground resources, resulting in a positive species-mixing effect for Maritime pine. These results are consistent with the over-yielding observed at the stand level analyzing the same triplets [33], and with the species competitive relationships observed for Maritime pine using NFI data [34]. The different spatial scale of the data used in both analyses might explain these discrepancies.
Although deciphering the underlying ecological causes of these interactions were not the aim of this study, we can propose some possible explanations. The species-specific plastic responses of physiological and morphological traits to shade conditions could be one driving mechanism [60,61]. Differences in shade tolerance between both species [62] might facilitate the complementary crown architectures [63] and canopy vertical stratification [33] observed in mixed stands of Maritime pine and Scots pine. Thus, intercepted light can also be used more efficiently, suggesting that light-related interactions may contribute to the species-mixing effect on stand productivity. However, in mixed stands of light-demanding species such as pines, the degree of differential preference for light is probably not the single controlling mechanism of the positive [64], negative [65], or null [66] effects observed in growth. Complementarity in traits for securing below-ground resources such as differences in water-use efficiency [67] or varying growth responses to fluctuating or directional drought conditions [68] needs special attention.
That the age dependent site index was not significant in any final basal area growth models probably indicates the absorption of site quality into random plot effects. The unimportance of site index in this analysis also coincided with the results of stand-level models developed for the same species in Spain [28,69]. Initial basal area may be enough to indicate stand quality, and might produce accurate productivity estimates, especially in stands exposed to low levels of silvicultural intervention [28], such as pure and mixed stands located in the Northern Iberian Range. Furthermore, species-specific site index equations based on stand age are usually not available in multi-species stands [16], because interspecific competition probably suppresses top height growth for different stages in stand development [17,33], altering the height–age relationship and biasing SI estimations [56,70]. Although a site index based on reference diameter is available in Spain [71], caution is advised in its application because of the inherent sensitivity of diameter growth to stand density relative to height growth [72,73], especially in mixed-species stands where stand density can alter growth dynamics [66,74]. A topic for further exploration might also be compensatory growth in one species or the other along gradients in productivity that parallel changes in species composition and fluctuations in annual growing conditions.
4.3. Implication for Tree-Level Model in Mixed Stands
The generalized h-d and individual-tree BAI models developed in this study can be used for Scots pine and Maritime pine trees growing in pure and mixed stands. The effect of the interspecific competitive environment was successfully represented in the structure of the models. Combining the NLME modeling approach with parameters expressing species mixing enhanced the performance of tree height and basal area growth estimates compared with the previous models fitted for pure stands. The superior performance of multilevel mixed-effects models over fixed-effects models fitted to data collected under a more complex sampling design has already been widely discussed in the literature [38,42]. However, the magnitude of variations in allometric relationships and tree growth due to species-mixing is a subject of intense debate, with evidence of adverse and positive effects that depend on multiple factors operating simultaneously [17,64,75,76]. Therefore, the application of these models is restricted to the range of data as well as to the Northern Iberian Range, because species-mixing effects can vary among regions [33,34]. Climate-sensitive models could have broader applications for h-d relationships and tree growth functions [77,78]; however, analyzing climatic effects is beyond the scope of this study, both because of the narrow geographical amplitude of the triplet network and the relatively short growth series. However, further work is needed to test if the specific years and annual fluctuations in climatic variables might affect the basal area growth and the h-d relationships, or shift the effect of species-mixing on productivity and tree allometry.
The adaptation of IBERO model to mixed stands can be used as a decision-support tool for evaluating the impact of different silvicultural options in the context of sustainable forest management. In this study, we proposed new species-specific models for adapting h-d functions and growth sub-modules of the tree-level IBERO model to mixed stands of Scots pine and Maritime pine in the Northern Iberian Range. Both h-d relationships and basal area growth equations might have larger effects on tree-level models in terms of gains or losses in productivity due to species interactions [33,34,63]. Adapting growth models developed for monospecific stands to mixed stands requires that they become sensitive to species composition [2], and capture sufficient accuracy in upscaling species-mixing effects from the tree-level to the stand-level. For instance, volume and volume growth estimates in mixed stands that rely on volume equations developed for monospecific stands might result in overestimation or underestimation of productivity if form differs substantially [9,16].
Obviously, other IBERO sub-modules require analysis to determine the species-mixing effects on the complete model structure and evaluate the performance of growth estimates on mixed stand simulations. Several studies have demonstrated that species-mixing can have significant effects on species crown size and shape [63,79], taper equations [9], height growth [56], and mortality rates [11], all of which could influence the productivity of mixed-species stands. A wider range of stand structures is clearly possible in mixed-species stands, creating a challenge to both sampling strategies and the choice of model form for individual-tree equations. Therefore, conversely, caution must be exercised that mixing effects are not artefacts of inappropriate model structure or the biased quantification of mixing proportions. The IBERO site quality sub-module interacts with different components within the model architecture and relies on age-related site index curves developed for both species in monospecific conditions. Although the side index was not included in the formulation of the model that was developed in this study, several authors have demonstrated that species interaction effects can change in response to site conditions [15,78]. As mentioned before, using the site index for even-aged monospecific stands could be ineffective in mixed-species stands. Hence, alternative methods to evaluate site quality based on geocentric measures [70,80,81] could be used to establish an alternative productivity index for mixed-species stands, especially in stratified mixtures in which site index curves have not been developed for the more dominant species, which is the least likely to have been overtopped throughout stand development.
5. Conclusions
Compared with previous studies, the originality of our work lies in that our h-d and basal area growth models explicitly accounted for species mixing effects in addition to tree and stand variables that describe the tree competitive environment and stage of stand development. The integration of variables reflecting the species-mixing effects in models to estimate tree height and basal area increment in mixed stands were shown to enhance the performance of predictions compared to available models parameterized for Scots pine and Maritime pine in pure stands. Both models could be incorporated into the tree-level model IBERO for the estimation of stand dynamics, growth, and yield of mixed stands.
Supplementary Materials
The following are available online at https://0-www-mdpi-com.brum.beds.ac.uk/1999-4907/10/3/249/s1, Figure S1: Tree height plotted against diameter of Scots pine (Pinus sylvestris) and Maritime pine (Pinus pinaster) in mixed (black open symbols) and pure stands (gray open symbols) for the triplets network dataset (Training dataset), Figure S2: Basal area increment data used for models fitting in 5-cm diameter classes for Scots pine (Pinus sylvestris) and Maritime pine (Pinus pinaster) in mixed and pure stands, Figure S3: Tree height plotted against diameter of Pinus sylvestris and Pinus pinaster in mixed (black open symbols) and pure stands (gray open symbols) from National Forest Inventory data (Validation dataset), Figure S4: Plot-specific h-d curves using fitted models overlaid on the measured tree heights (gray dots) for Scots pine and Maritime pine, Figure S5: Standardized residuals of generalized non-linear mixed-effects h-d models for Scots pine and Maritime pine, Figure S6: Mean 5-year basal area increment of Pinus sylvestris and Pinus pinaster in mixed and pure stands, Figure S7: Effects of stand basal area (BA), basal area of larger trees (BAL) and crown ratio on the final basal area increment model for Scots pine (Table 4). Curves were produced using the parameter estimates in Table 2 and varying one explanatory variable at a time. Mean values of the data were used for predictors and the range of the variable of interest in the figure, Figure S8: Differences of dominant height of each species between mixed and pure stands. Mean and standard error for Scots pine (white circles) and Maritime pine (black circles), Table S1: Generalized height-diameter equations evaluated, Table S2: Ranking and summary statistics for generalized height–diameter models fitted without considering the species-mixing effects, according to functions of Table S1.
Author Contributions
J.R., M.d.R., and F.B. designed the experiments and performed the modeling approach; J.R. analyzed the data and wrote the first draft of the manuscript; D.A.M. contributed to the statistical analysis and discussion of the manuscript. All of the authors contributed to the final version of the manuscript.
Funding
This study has been supported by the research projects FORMIXING [AGL2014-51964-C2-1-R and AGL2014-51964-C2-2-R] of Spanish Ministry of Economy and Competitiveness, and REFORM [PCIN-2017-027]. JR was funded by the ‘Secretaría Nacional de Educación Superior, Ciencia, Tecnología e Innovación del Ecuador’ (SENESCYT) [Grant 2013-AR3R1676]. The University of Valladolid funding the visit of the lead author to Oregon State University, during which part of this analysis was carried out.
Acknowledgments
We would like to thank researchers of the Sustainable Forest Management Research Institute (University of Valladolid and INIA) who have been involved in the planning, establishment, and measurement of the field experiments used in this study. We further wish to thank the Regional Forest Service of Burgos and Soria for support with field work.
Conflicts of Interest
The authors declare no conflict of interest.
References
- Van Der Plas, F.; Manning, P.; Allan, E.; Scherer-Lorenzen, M.; Verheyen, K.; Wirth, C.; Zavala, M.A.; Hector, A.; Ampoorter, E.; Baeten, L.; et al. Jack-of-all-trades effects drive biodiversity-ecosystem multifunctionality relationships in European forests. Nat. Commun. 2016, 7, 11109. [Google Scholar] [CrossRef]
- Pretzsch, H.; Forrester, D.I.; Rötzer, T. Representation of species mixing in forest growth models. A review and perspective. Ecol. Model. 2015, 313, 276–292. [Google Scholar] [CrossRef] [Green Version]
- Coll, L.; Ameztegui, A.; Collet, C.; Löf, M.; Mason, B.; Pach, M.; Verheyen, K.; Abrudan, I.; Barbati, A.; Barreiro, S.; et al. Knowledge gaps about mixed forests: What do European forest managers want to know and what answers can science provide? For. Ecol. Manag. 2018, 407, 106–115. [Google Scholar] [CrossRef]
- Felton, A.; Nilsson, U.; Sonesson, J.; Felton, A.M.; Roberge, J.M.; Ranius, T.; Ahlström, M.; Bergh, J.; Björkman, C.; Boberg, J.; et al. Replacing monocultures with mixed-species stands: Ecosystem service implications of two production forest alternatives in Sweden. Ambio 2016, 45, 124–139. [Google Scholar] [CrossRef] [Green Version]
- Gadow, K.V.; Zhang, C.Y.; Wehenkel, C.; Pommerening, A.; Corral-Rivas, J.; Korol, M.; Myklush, S.; Gang, Y.H.; Kiviste, A.; Zhao, X.H. Forest Structure and Diversity. In Continuous Cover Forestry, Book Series Managing Forest Ecosys-Tems; Pukkala, T., von Gadow, K., Eds.; Springer: Berlin, Germany, 2012; Volume 23, pp. 29–84. [Google Scholar]
- Pretzsch, H.; Zenner, E.K. Toward managing mixed-species stands: From parametrization to prescription. For. Ecosyst. 2017, 4, 19. [Google Scholar] [CrossRef]
- Zhang, Y.; Chen, H.Y.H.; Reich, P.B. Forest productivity increases with evenness, species richness and trait variation: A global meta-analysis. J. Ecol. 2012, 100, 742–749. [Google Scholar] [CrossRef]
- Dănescu, A.; Albrecht, A.T.; Bauhus, J. Structural diversity promotes productivity of mixed, uneven-aged forests in southwestern Germany. Oecologia 2016, 182, 319–333. [Google Scholar] [CrossRef]
- Del Río, M.; Bravo-Oviedo, A.; Ruiz-Peinado, R.; Condés, S. Tree allometry variation in response to intra- and inter-specific competitions. Trees 2018, 33, 121–138. [Google Scholar] [CrossRef]
- Sharma, R.P.; Vacek, Z.; Vacek, S.; Podrázský, V.; Jansa, V. Modelling individual tree height to crown base of Norway spruce (Picea abies (L.) Karst.) and European beech (Fagus sylvatica L.). PLoS ONE 2017, 12, e0186394. [Google Scholar] [CrossRef]
- Condés, S.; del Río, M. Climate modifies tree interactions in terms of basal area growth and mortality in monospecific and mixed Fagus sylvatica and Pinus sylvestris forests. Eur. J. For. Res. 2015, 134, 1095–1108. [Google Scholar] [CrossRef]
- Pretzsch, H.; Biber, P. Tree species mixing can increase maximum stand density. Can. J. For. Res. 2016, 46, 1179–1193. [Google Scholar] [CrossRef] [Green Version]
- Jonsson, M.; Bengtsson, J.; Gamfeldt, L.; Moen, J.; Snäll, T. Levels of forest ecosystem services depend on specific mixtures of commercial tree species. Nat. Plants 2019, 5, 141–147. [Google Scholar] [CrossRef]
- Zeller, L.; Pretzsch, H. Effect of forest structure on stand productivity in Central European forests depends on developmental stage and tree species diversity. For. Ecol. Manag. 2019, 434, 193–204. [Google Scholar] [CrossRef]
- Toïgo, M.; Vallet, P.; Perot, T.; Bontemps, J.-D.; Piedallu, C.; Courbaud, B. Overyielding in mixed forests decreases with site productivity. J. Ecol. 2015, 103, 502–512. [Google Scholar] [CrossRef] [Green Version]
- Del Río, M.; Pretzsch, H.; Alberdi, I.; Bielak, K.; Bravo, F.; Brunner, A.; Condés, S.; Ducey, M.J.; Fonseca, T.; von Lüpke, N.; et al. Characterization of the structure, dynamics, and productivity of mixed-species stands: Review and perspectives. Eur. J. For. Res. 2016, 135, 23–49. [Google Scholar] [CrossRef]
- Pretzsch, H. Canopy space filling and tree crown morphology in mixed-species stands compared with monocultures. For. Ecol. Manag. 2014, 327, 251–264. [Google Scholar] [CrossRef] [Green Version]
- Hann, D.W.; Walters, D.K.; Scrivani, J.A. Incorporating crown ratio into prediction equations for Douglas-fir stem volume. Can. J. For. Res. 1987, 17, 17–22. [Google Scholar] [CrossRef]
- Burkhart, H.E.; Walton, S.B. Incorporating crown ratio into taper equations for loblolly pine trees. For. Sci. 1985, 31, 478–484. [Google Scholar]
- Garber, S.M.; Maguire, D.A. Modeling stem taper of three central Oregon species using nonlinear mixed effects models and autoregressive error structures. For. Ecol. Manag. 2003, 179, 507–522. [Google Scholar] [CrossRef]
- Calama, R.; Barbeito, I.; Pardos, M.; del Río, M.; Montero, G. Adapting a model for even-aged Pinus pinea L. stands to complex multi-aged structures. For. Ecol. Manag. 2008, 256, 1390–1399. [Google Scholar] [CrossRef]
- Sterba, H.; Blab, A.; Katzensteiner, K. Adapting an individual tree growth model for Norway spruce (Picea abies L. Karst.) in pure and mixed species stands. For. Ecol. Manag. 2002, 159, 101–110. [Google Scholar] [CrossRef]
- Bravo, F.; Álvarez-González, J.G.; del Río, M.; Barrio-Anta, M.; Bravo-Oviedo, A.; Calama, R.; Castedo-Dorado, F.; Crecente-Campo, F.; Condés, S. Growth and Yield Models in Spain: Historical Overview, Contemporary Examples and Perspectives; Instituto Universitario de Investigación en Gestión Forestal Sostenible: Madrid, Spain, 2012. [Google Scholar]
- Bravo, F. Dinámica de Rodales de Pino Negral (Pinus pinaster Ait.) en el Sistema Ibérico Meridional: Estructura Genética, Regeneración y Dinámica Forestal; Project report AGL-2001-1780; Instituto Universitario de Investigación en Gestión Forestal Sostenible: Palencia, Spain, 2005. [Google Scholar]
- Lizarralde, I.; Ordoñez, A.C.; Bravo-Oviedo, A.; Bravo, F. IBEROPS: Modelo de Dinámica de Rodales de Pinus sylvestris L. en Castilla y León. 2010. Available online: www.simanfor.es (accessed on 13 January 2018).
- Lizarralde, I.; Ordoñez, A.C.; Bravo-Oviedo, A.; Bravo, F. IBEROPT: Modelo de Dinámica de Rodales de Pinus pinaster Ait. en el Sistema Ibérico Meridional. 2010. Available online: www.simanfor.es (accessed on 13 January 2018).
- Lizarralde, I. Dinámica de Rodales y Competencia en las Masas de Pino Silvestre (Pinus sylvestris) y Pino Negral (Pinus pinaster Ait.) de los Sistemas Central e Ibérico Meridional. Ph.D. Thesis, Universidad de Valladolid, Valladolid, Spain, 2008. [Google Scholar]
- Bravo-Oviedo, A.; del Río, M.; Montero, G. Site index curves and growth model for Mediterranean maritime pine (Pinus pinaster Ait.) in Spain. For. Ecol. Manag. 2004, 201, 187–197. [Google Scholar] [CrossRef]
- Rojo, A.; Montero, G. El Pino Silvestre en la Sierra de Guardarrama; Ministerio de Agricultura, Pesca y Alimentación: Madrid, Spain, 1996.
- Bravo, F.; Montero, G. Site index estimation in Scots pine (Pinus sylvestris L.) stands in the High Ebro Basin (northern Spain) using soil attributes. Forestry 2001, 74, 395–406. [Google Scholar] [CrossRef]
- Bravo, F.; Pando, V.; Ordóñez, C.; Lizarralde, I. Modelling ingrowth in mediterranean pine forests: A case study from scots pine (Pinus sylvestris L.) and mediterranean maritime pine (Pinus pinaster Ait.) stands in Spain. For. Syst. 2008, 17, 250–260. [Google Scholar] [CrossRef]
- Bravo-Oviedo, A.; Sterba, H.; Del Río, M.; Bravo, F. Competition-induced mortality for Mediterranean Pinus pinaster Ait. and P. sylvestris L. For. Ecol. Manag. 2006, 222, 88–98. [Google Scholar] [CrossRef]
- Riofrío, J.; del Río, M.; Pretzsch, H.; Bravo, F. Changes in structural heterogeneity and stand productivity by mixing Scots pine and Maritime pine. For. Ecol. Manag. 2017, 405, 219–228. [Google Scholar] [CrossRef] [Green Version]
- Riofrío, J.; del Río, M.; Bravo, F. Mixing effects on growth efficiency in mixed pine forests. Forestry 2017, 90, 381–392. [Google Scholar] [CrossRef]
- López-Marcos, D.; Martínez-Ruiz, C.; Turrión, M.B.; Jonard, M.; Titeux, H.; Ponette, Q.; Bravo, F. Soil carbon stocks and exchangeable cations in monospecific and mixed pine forests. Eur. J. For. Res. 2018, 137, 831–847. [Google Scholar] [CrossRef]
- Lara, W.; Bravo, F.; Sierra, C.A. measuRing: An R package to measure tree-ring widths from scanned images. Dendrochronologia 2015, 34, 43–50. [Google Scholar] [CrossRef]
- Bunn, A.G. Statistical and visual crossdating in R using the dplR library. Dendrochronologia 2010, 28, 251–258. [Google Scholar] [CrossRef]
- Calama, R.; Montero, G. Interregional nonlinear height-diameter model with random coefficients for stone pine in Spain. Can. J. For. Res. 2004, 34, 150–163. [Google Scholar] [CrossRef]
- Sharma, M.; Parton, J. Height-diameter equations for boreal tree species in Ontario using a mixed-effects modeling approach. For. Ecol. Manag. 2007, 249, 187–198. [Google Scholar] [CrossRef]
- Temesgen, H.; Zhang, C.H.; Zhao, X.H. Modelling tree height-diameter relationships in multi-species and multi-layered forests: A large observational study from Northeast China. For. Ecol. Manag. 2014, 316, 78–89. [Google Scholar] [CrossRef]
- Saud, P.; Lynch, T.B.; Anup, K.C.; Guldin, J.M. Using quadratic mean diameter and relative spacing index to enhance height–diameter and crown ratio models fitted to longitudinal data. For. Ann. Int. J. For. Res. 2016, 89, 215–229. [Google Scholar] [CrossRef] [Green Version]
- Pinheiro, J.; Bates, D. Mixed-Effects Models in S and S-PLUS; Springer: Berlin, Germany, 2000. [Google Scholar]
- Quicke, H.E.; Meldahl, R.S.; Kush, J.S. Basal area growth of individual trees—A model derived from a regional longleaf pine growth study. For. Sci. 1994, 40, 528–542. [Google Scholar]
- Thürig, E.; Kaufmann, E.; Frisullo, R.; Bugmann, H. Evaluation of the growth function of an empirical forest scenario model. For. Ecol. Manag. 2005, 204, 51–66. [Google Scholar] [CrossRef]
- Sterba, H.; del Río, M.; Brunner, A.; Condés, S. Effect of species proportion definition on the evaluation of growth in pure vs. mixed stands. For. Syst. 2014, 23, 547–559. [Google Scholar] [CrossRef]
- del Río, M.; Condés, S.; Pretzsch, H. Analyzing size-symmetric vs. size-asymmetric and intra- vs. inter-specific competition in beech (Fagus sylvatica L.) mixed stands. For. Ecol. Manag. 2014, 325, 90–98. [Google Scholar] [CrossRef]
- del Río, M.; Montero, G.; Bravo, F. Analysis of diameter—Density relationships and self-thinning in non-thinned even-aged Scots pine stands. For. Ecol. Manag. 2001, 142, 79–87. [Google Scholar] [CrossRef]
- Anderson, D.R. Model. Based Inferences in the Life Sciences: A Primer on Evidence; Springer: Berlin, Germany, 2007. [Google Scholar]
- Pinheiro, J.; Bates, D.; DebRoy, S.; Sarkar, D. Nlme: Linear and Nonlinear Mixed Effects Models. R Package Version 3.1-317. 2018. Available online: https://CRAN.R-project.org/package=nlme (accessed on 12 February 2019).
- Sharma, R.P.; Vacek, Z.; Vacek, S.; Kučera, M. Modelling individual tree height–diameter relationships for multi-layered and multi-species forests in central Europe. Trees 2018, 33, 103–119. [Google Scholar] [CrossRef]
- Mina, M.; del Río, M.; Huber, M.O.; Thürig, E.; Rohner, B. The symmetry of competitive interactions in mixed Norway spruce, silver fir and European beech forests. J. Veg. Sci. 2018, 29, 775–787. [Google Scholar] [CrossRef]
- Forrester, D.I.; Pretzsch, H. Tamm Review: On the strength of evidence when comparing ecosystem functions of mixtures with monocultures. For. Ecol. Manag. 2015, 356, 41–53. [Google Scholar] [CrossRef]
- Zeide, B.; VanderSchaaf, C. The Effect of Density on the Height-Diameter Relationship; Gen. Tech Report; USDA, Forest Service, Southern Research Station: Asheville, NC, USA, 2002; pp. 463–466.
- Vargas-Larreta, B.; Castedo-Dorado, F.; Álvarez-González, J.G.; Barrio-Anta, M.; Cruz-Cobos, F. A generalized height-diameter model with random coefficients for uneven-aged stands in El Salto, Durango (Mexico). Forestry 2009, 82, 445–462. [Google Scholar] [CrossRef] [Green Version]
- Huang, S.; Wiens, D.P.; Yang, Y.; Meng, S.X.; Vanderschaaf, C.L. Assessing the impacts of species composition, top height and density on individual tree height prediction of quaking aspen in boreal mixedwoods. For. Ecol. Manag. 2009, 258, 1235–1247. [Google Scholar] [CrossRef]
- Pinto, P.E.; Gégout, J.C.; Hervé, J.C.; Dhôte, J.F. Respective importance of ecological conditions and stand composition on Abies alba Mill. dominant height growth. For. Ecol. Manag. 2008, 255, 619–629. [Google Scholar] [CrossRef]
- Erickson, H.; Harrington, C.; Marshall, D. Tree growth at stand and individual scales in two dual-species mixture experiments in southern Washington State, USA. Can. J. For. Res. 2009, 39, 1119–1132. [Google Scholar] [CrossRef]
- Thurm, E.A.; Pretzsch, H. Improved productivity and modified tree morphology of mixed versus pure stands of European beech (Fagus sylvatica) and Douglas-fir (Pseudotsuga menziesii) with increasing precipitation and age. Ann. For. Sci. 2016, 73, 1047–1061. [Google Scholar] [CrossRef]
- Oliver, C.D.; Larson, B.A.; Larson, B.C. Forest Stand. Dynamics: Updated Edition; John Wiley & Sons: Hoboken, NJ, USA, 1996. [Google Scholar]
- Gaudio, N.; Balandier, P.; Perret, S.; Ginisty, C. Growth of understorey Scots pine (Pinus sylvestris L.) saplings in response to light in mixed temperate forest. Forestry 2011, 84, 187–195. [Google Scholar] [CrossRef]
- Vizcaíno-Palomar, N.; Ibañez, I.; González-Martínez, S.C.; Zavala, M.A.; Alía, R. Adaptation and plasticity in aboveground allometry variation of four pine species along environmental gradients. Ecol. Evol. 2016, 6, 7561–7573. [Google Scholar] [CrossRef] [Green Version]
- Poorter, L.; Lianes, E.; Moreno-de las Heras, M.; Zavala, M.A. Architecture of Iberian canopy tree species in relation to wood density, shade tolerance and climate. Plant. Ecol. 2012, 213, 707–722. [Google Scholar] [CrossRef] [Green Version]
- Cattaneo, N. Competencia, Productividad y Cambios a Nivel de Copas en Bosques Mixtos de Pinos Mediterráneos, Señales a Nivel del Árbol Individual. Ph.D. Thesis, University of Valladolid, Valladolid, Spain, 2018. [Google Scholar]
- Jucker, T.; Bouriaud, O.; Avacaritei, D.; Dǎnilǎ, I.; Duduman, G.; Valladares, F.; Coomes, D.A. Competition for light and water play contrasting roles in driving diversity-productivity relationships in Iberian forests. J. Ecol. 2014, 102, 1202–1213. [Google Scholar] [CrossRef] [Green Version]
- Liang, J.; Buongiorno, J.; Monserud, R.; Kruger, E.; Zhou, M. Effects of diversity of tree species and size on forest basal area growth, recruitment, and mortality. For. Ecol. Manag. 2007, 243, 116–127. [Google Scholar] [CrossRef]
- Garber, S.M.; Maguire, D.A. Stand Productivity and Development in Two Mixed-Species Spacing Trials in the Central Oregon Cascades. For. Sci. 2004, 50, 92–105. [Google Scholar]
- Navarro-Cerrillo, R.M.; Sánchez-Salguero, R.; Herrera, R.; Ruiz, C.J.C.; Moreno-Rojas, J.M.; Manzanedo, R.D.; López-Quintanilla, J. Contrasting growth and water use efficiency after thinning in mixed Abies pinsapo-Pinus pinaster-Pinus sylvestris forests. J. For. Sci. 2016, 62, 53–64. [Google Scholar]
- Granda, E.; Gazol, A.; Camarero, J.J. Functional diversity differently shapes growth resilience to drought for co-existing pine species. J. Veg. Sci. 2018, 29, 265–275. [Google Scholar] [CrossRef]
- del Río, M.; Montero, G. Modelo de Simulación de Claras en Masas de Pinus sylvestris L.; Monografía, Ministerio de Ciencia y Tecnología: Madrid, Spain, 2001.
- Dănescu, A.; Albrecht, A.T.; Bauhus, J.; Kohnle, U. Geocentric alternatives to site index for modeling tree increment in uneven-aged mixed stands. For. Ecol. Manag. 2017, 392, 1–12. [Google Scholar] [CrossRef]
- Moreno-Fernández, D.; Álvarez-González, J.G.; Rodríguez-Soalleiro, R.; Pasalodos-Tato, M.; Cañellas, I.; Montes, F.; Díaz-Varela, E.; Sánchez-González, M.; Crecente-Campo, F.; Álvarez-Álvarez, P.; et al. National-scale assessment of forest site productivity in Spain. For. Ecol. Manag. 2018, 417, 197–207. [Google Scholar] [CrossRef]
- Weiskittel, A.R.; Hann, D.W.; Kershaw, J.A.; Vanclay, J.K. Forest Growth and Yield Modeling; John Wiley & Sons: Hoboken, NJ, USA, 2011. [Google Scholar]
- Wang, G.G. Is height of dominant trees at a reference diameter an adequate measure of site quality? For. Ecol. Manag. 1998, 112, 49–54. [Google Scholar] [CrossRef]
- Condés, S.; del Río, M.; Sterba, H. Mixing effect on volume growth of Fagus sylvatica and Pinus sylvestris is modulated by stand density. For. Ecol. Manag. 2013, 292, 86–95. [Google Scholar] [CrossRef]
- Forrester, D.I.; Benneter, A.; Bouriaud, O. Diversity and competition influence tree allometric relationships—Developing functions for mixed-species forests. J. Ecol. 2017, 105, 761–774. [Google Scholar] [CrossRef]
- Mina, M.; Huber, M.O.; Forrester, D.I.; Thürig, E.; Rohner, B. Multiple factors modulate tree growth complementarity in Central European mixed forests. J. Ecol. 2018, 106, 1106–1119. [Google Scholar] [CrossRef]
- Fortin, M.; Couwenberghe, R.; Van Perez, V.; Piedallu, C. Evidence of climate effects on the height-diameter relationships of tree species. Ann. For. Sci. 2019, 76, 1–20. [Google Scholar] [CrossRef]
- Manso, R.; Morneau, F.; Ningre, F.; Fortin, M. Effect of climate and intra- and inter-specific competition on diameter increment in beech and oak stands. Forestry 2015, 88, 540–551. [Google Scholar] [CrossRef] [Green Version]
- Barbeito, I.; Dassot, M.; Bayer, D.; Collet, C.; Drössler, L.; Löf, M.; del Río, M.; Ruiz-Peinado, R.; Forrester, D.I.; Bravo-Oviedo, A.; et al. Terrestrial laser scanning reveals differences in crown structure of Fagus sylvatica in mixed vs. pure European forests. For. Ecol. Manag. 2017, 405, 381–390. [Google Scholar] [CrossRef]
- Bravo-Oviedo, A.; Gallardo-Andrés, C.; del Río, M.; Montero, G. Regional changes of Pinus pinaster site index in Spain using a climate-based dominant height model. Can. J. For. Res. 2010, 40, 2036–2048. [Google Scholar] [CrossRef]
- Bueis, T.; Bravo, F.; Pando, V.; Turrión, M.B. Relationship between environmental parameters and Pinus sylvestris L. site index in forest plantations in northern Spain acidic plateau. IForest 2016, 9, 394–401. [Google Scholar] [CrossRef]
Figure 1.
Effects of dominant height (Ho), quadratic mean diameter (dq), and species mixing proportion of target species ( or ) on the final h-d models in Equation (4) for Scots pine (a–c) and Maritime pine (d–f). Curves were produced using the parameter estimates in Table 2 and varying one explanatory variable at a time. Mean values of the data were used for predictors and the range of the variable of interest in the figure.

Figure 2.
Comparison of h-d curves for the two species, black lines for Maritime pine and red lines for Scots pine, under different mixing proportions, PT90-10PS (solid lines, 90% Maritime pine–10% Scots pine), PT50-50PS (light dashed lines, 50% Maritime pine–50% Scots pine) and PT10-90PS (heavy dashed lines, 10% Maritime pine–59% Scots pine). Results are displayed for a mixed stand with Ho = 20 m, dq = 30 cm, and Do = 40 cm.

Figure 3.
Mean bias (m) by 5-cm diameter class from the best generalized h-d models fitted to the triplet data (red circles and lines) and from the Lizarralde et al. [25,26] h-d functions (blue circles and lines).

Figure 4.
Variation of individual-tree basal area increment (cm2 5 years−1) across the range in initial diameter for Maritime pine with: (a) increasing proportion of intraspecific size-symmetric competition (Proportion BAintra = BAintra/BA, = 0.2, 0.5, 0.8, or 1.0) for a stand with BA = 50 m2 ha−1, BALintra = 10 m2 ha−1, and BALinter = 0; and (b) increasing proportion of intraspecific size-asymmetric competition (Proportion BALintra = BALintra/BAL, = 0.2, 0.5, 0.8, or 1.0) for a stand with BAintra = 30 m2 ha−1 and BAL = 30 m2 ha−1, and CR fixed at its mean value (CR = 0.35).

Figure 5.
Response of five-year periodic basal area increment (cm2 5 years−1) of individual Maritime pine tree (d = 30 cm, CR = 0.35) increasing total size-asymmetric competition (BAL) for three stands with the following total basal area: (a) BA = 30 m2 ha−1, (b) 50 m2 ha−1, and (c) 70 m2 ha−1. Different colors of solid lines represent the amount of intraspecific size-symmetric competition in relation with total basal area (Proportion BAintra = BAintra/BA), 0.3 (grey, 30% Maritime pine–70% Scots pine), 0.7 (black, 70% Maritime pine–30% Scots pine) or 1.0 (red, 100% Maritime pine) and the BAL is completely intraspecific. Dashed lines represent BAI reduction depending on composition of size-asymmetric competition within mixed stands (Proportion BALintra = BALintra/BAL), 0.3 (heavy dashed line, 30% Maritime pine–70% Scots pine), and 0.7 (light dashed line, 70% Maritime pine–30% Scots pine).


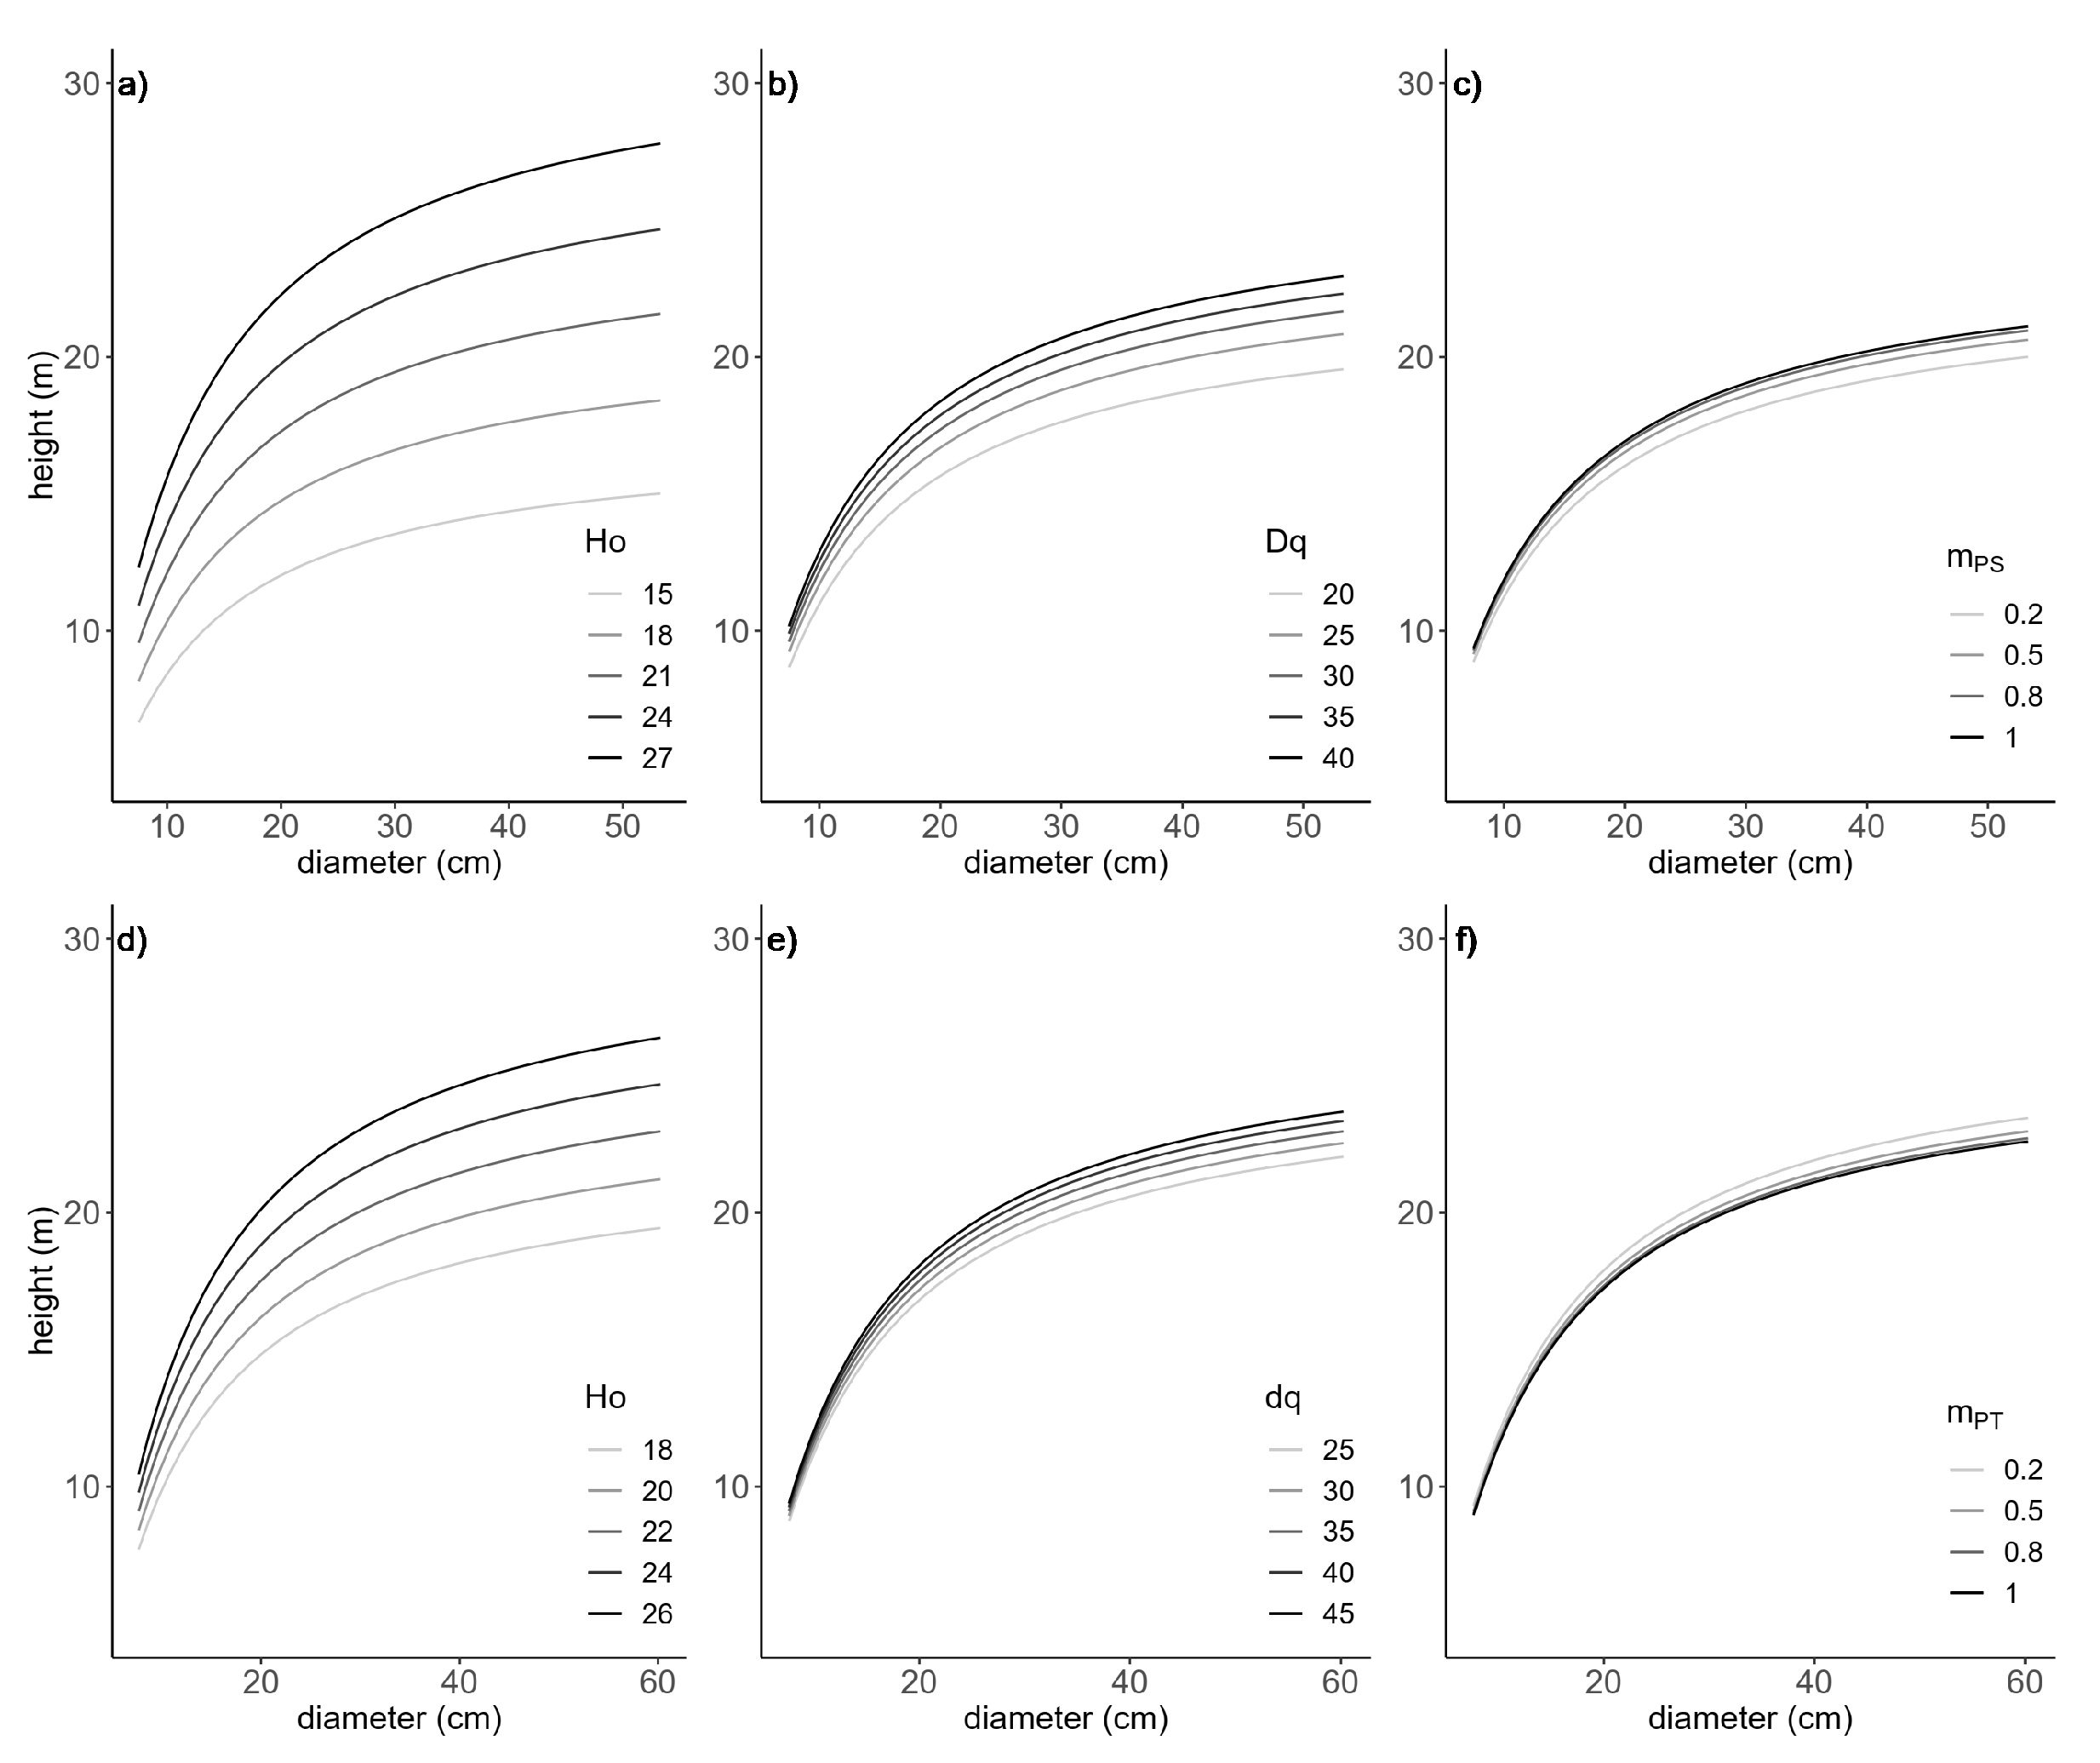
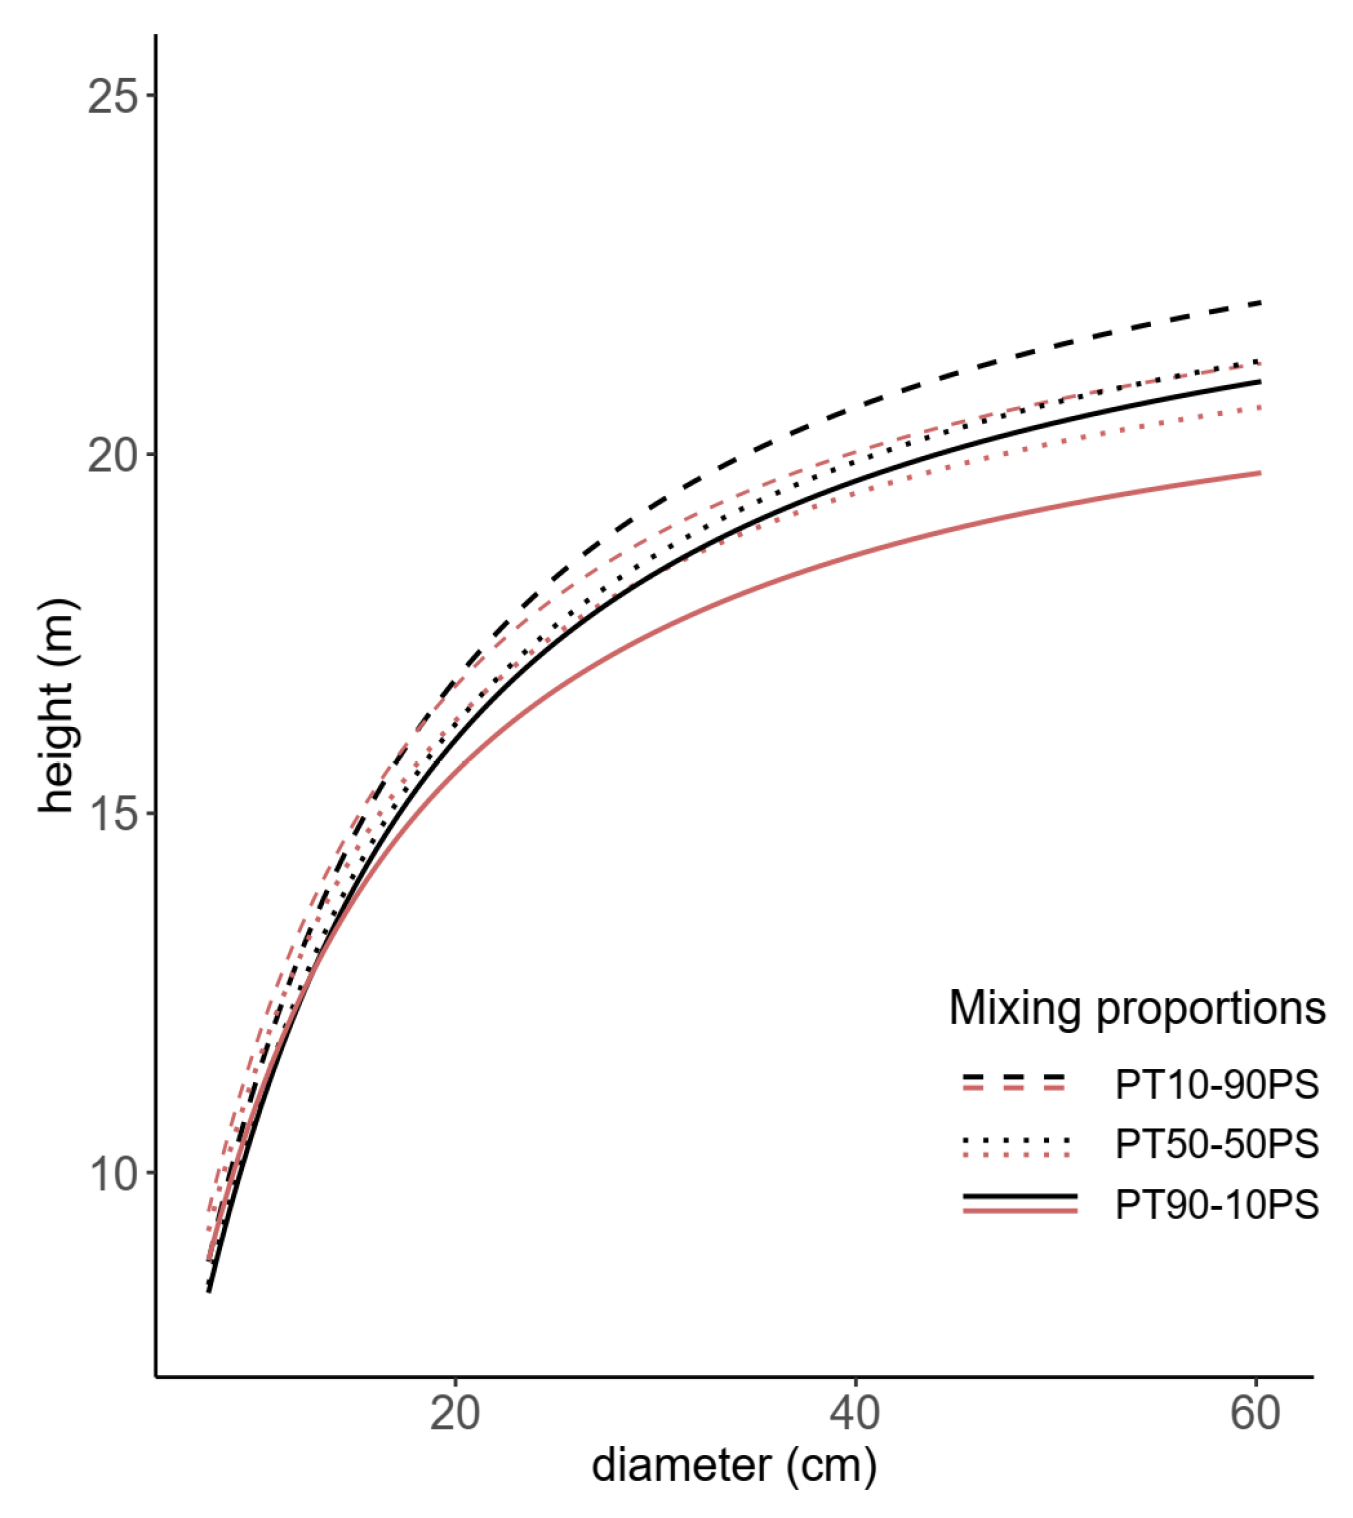
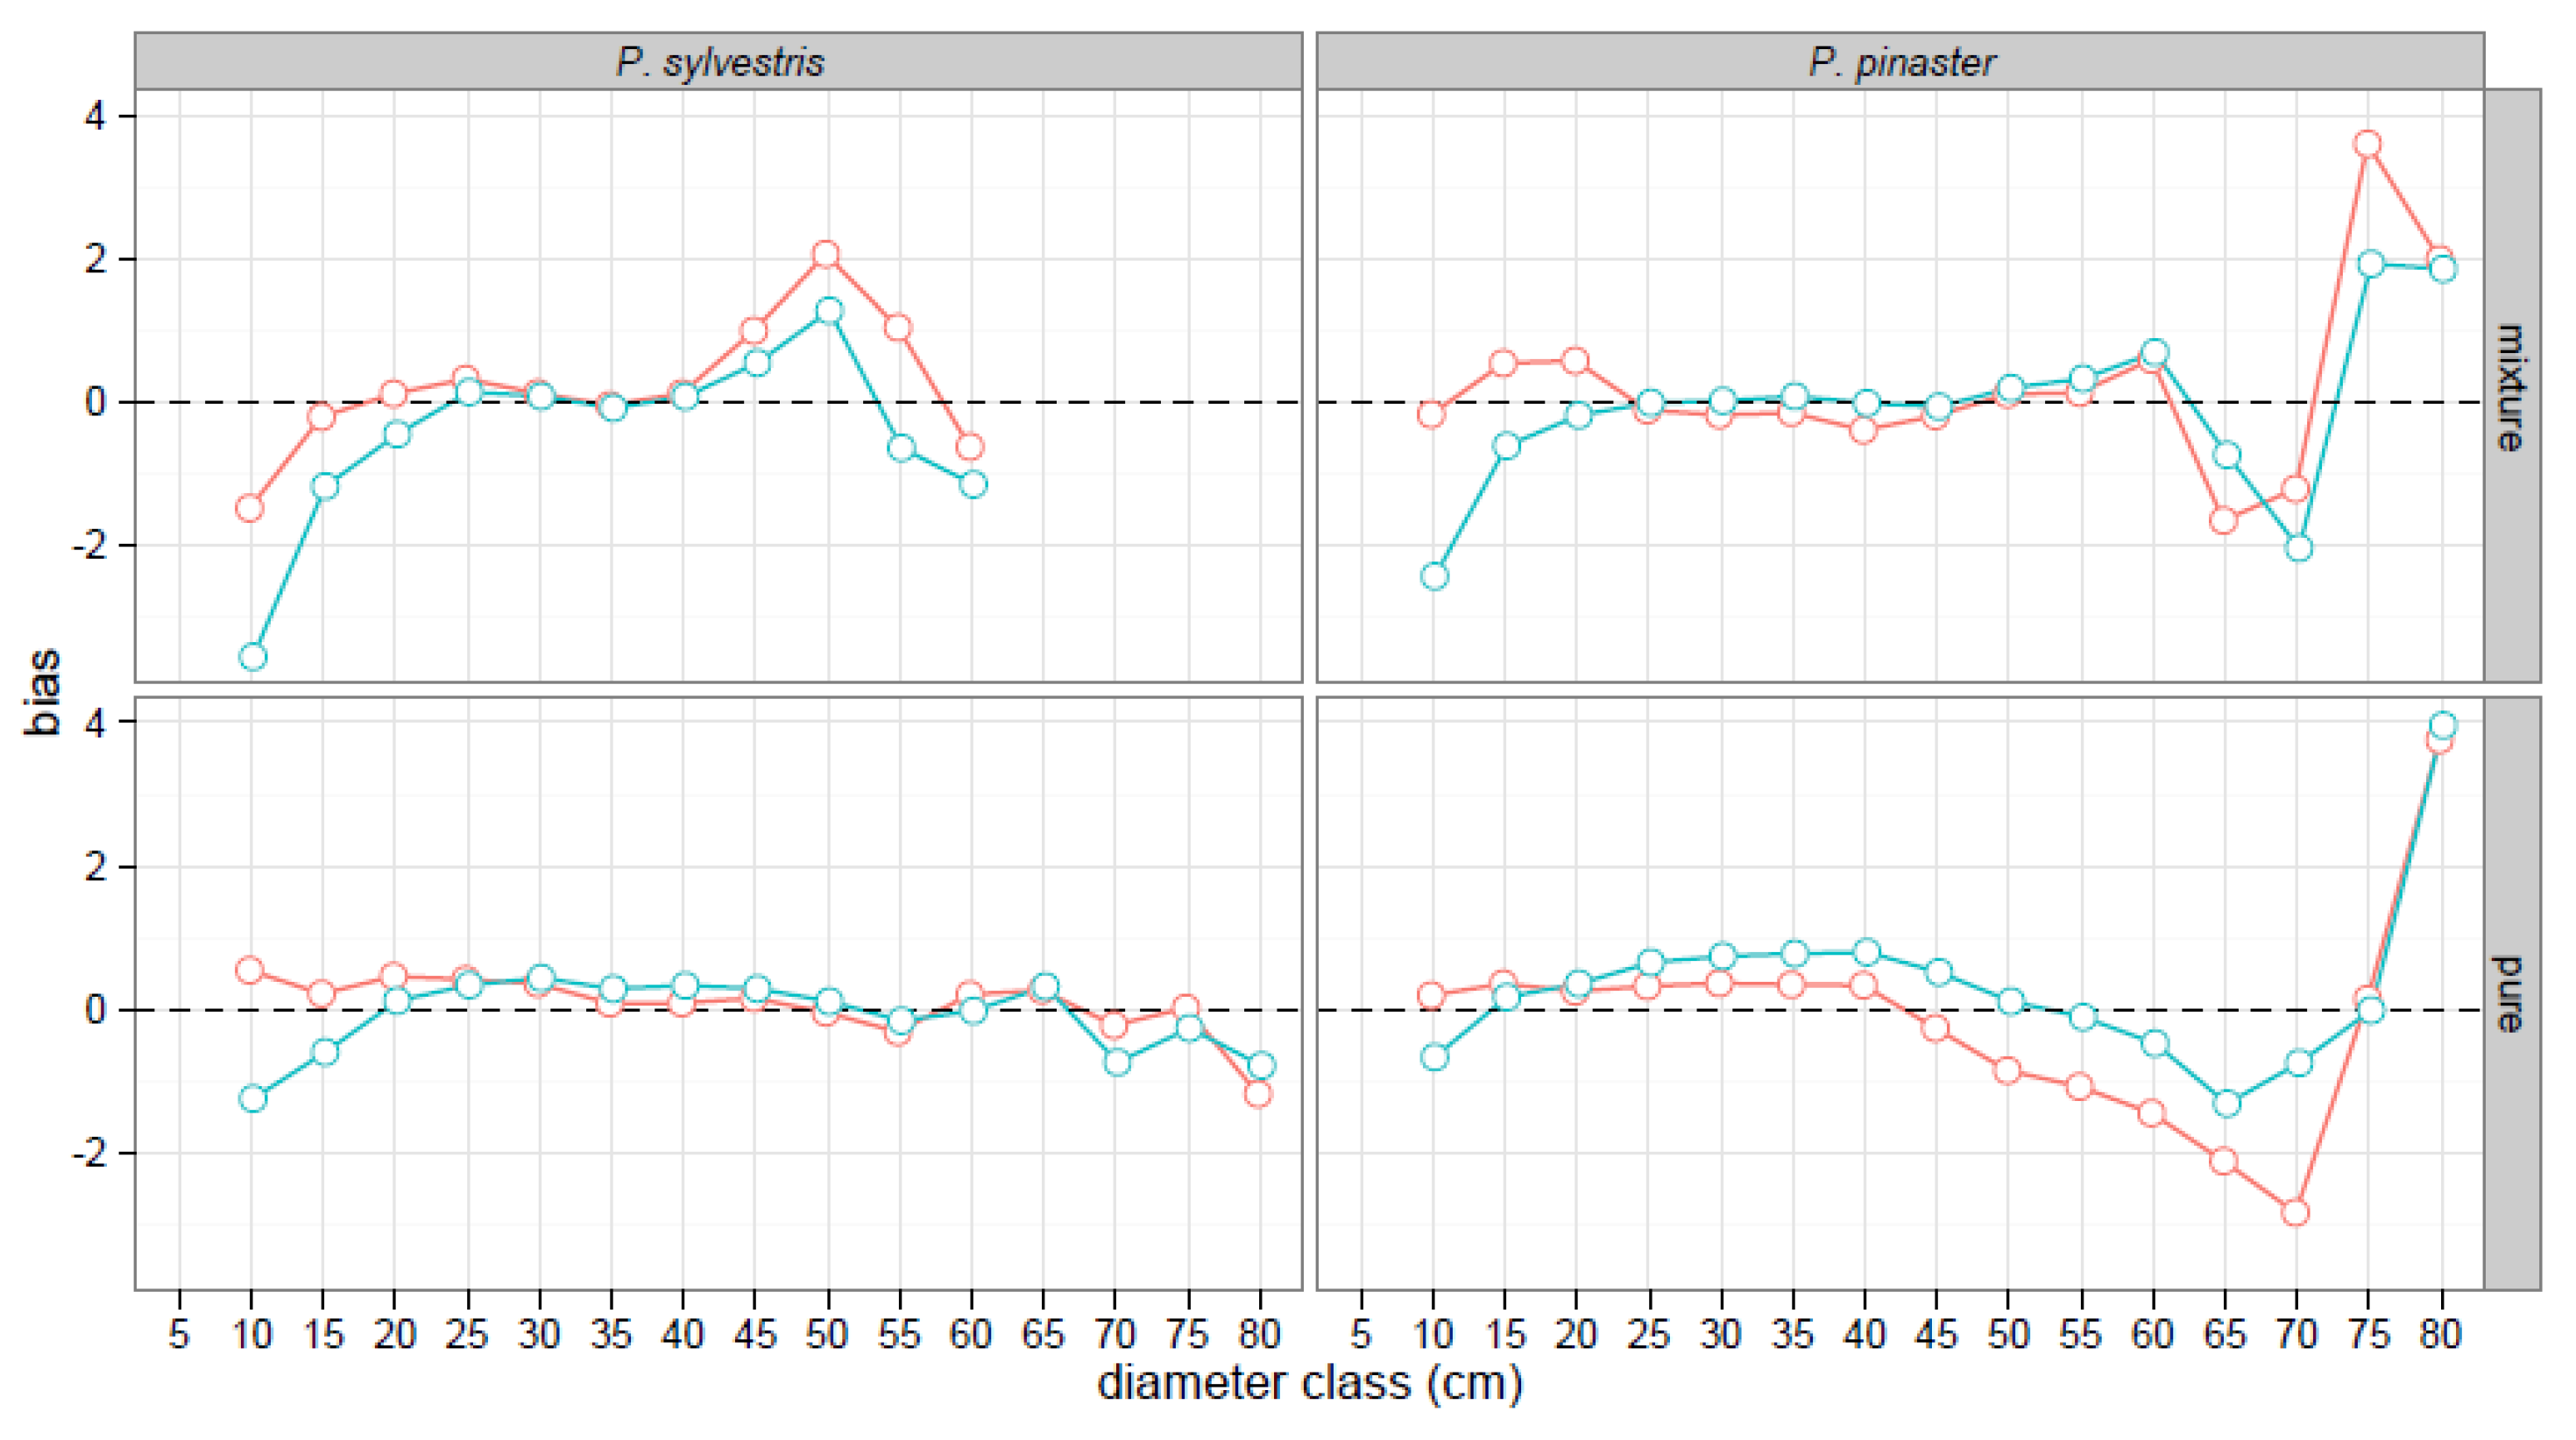
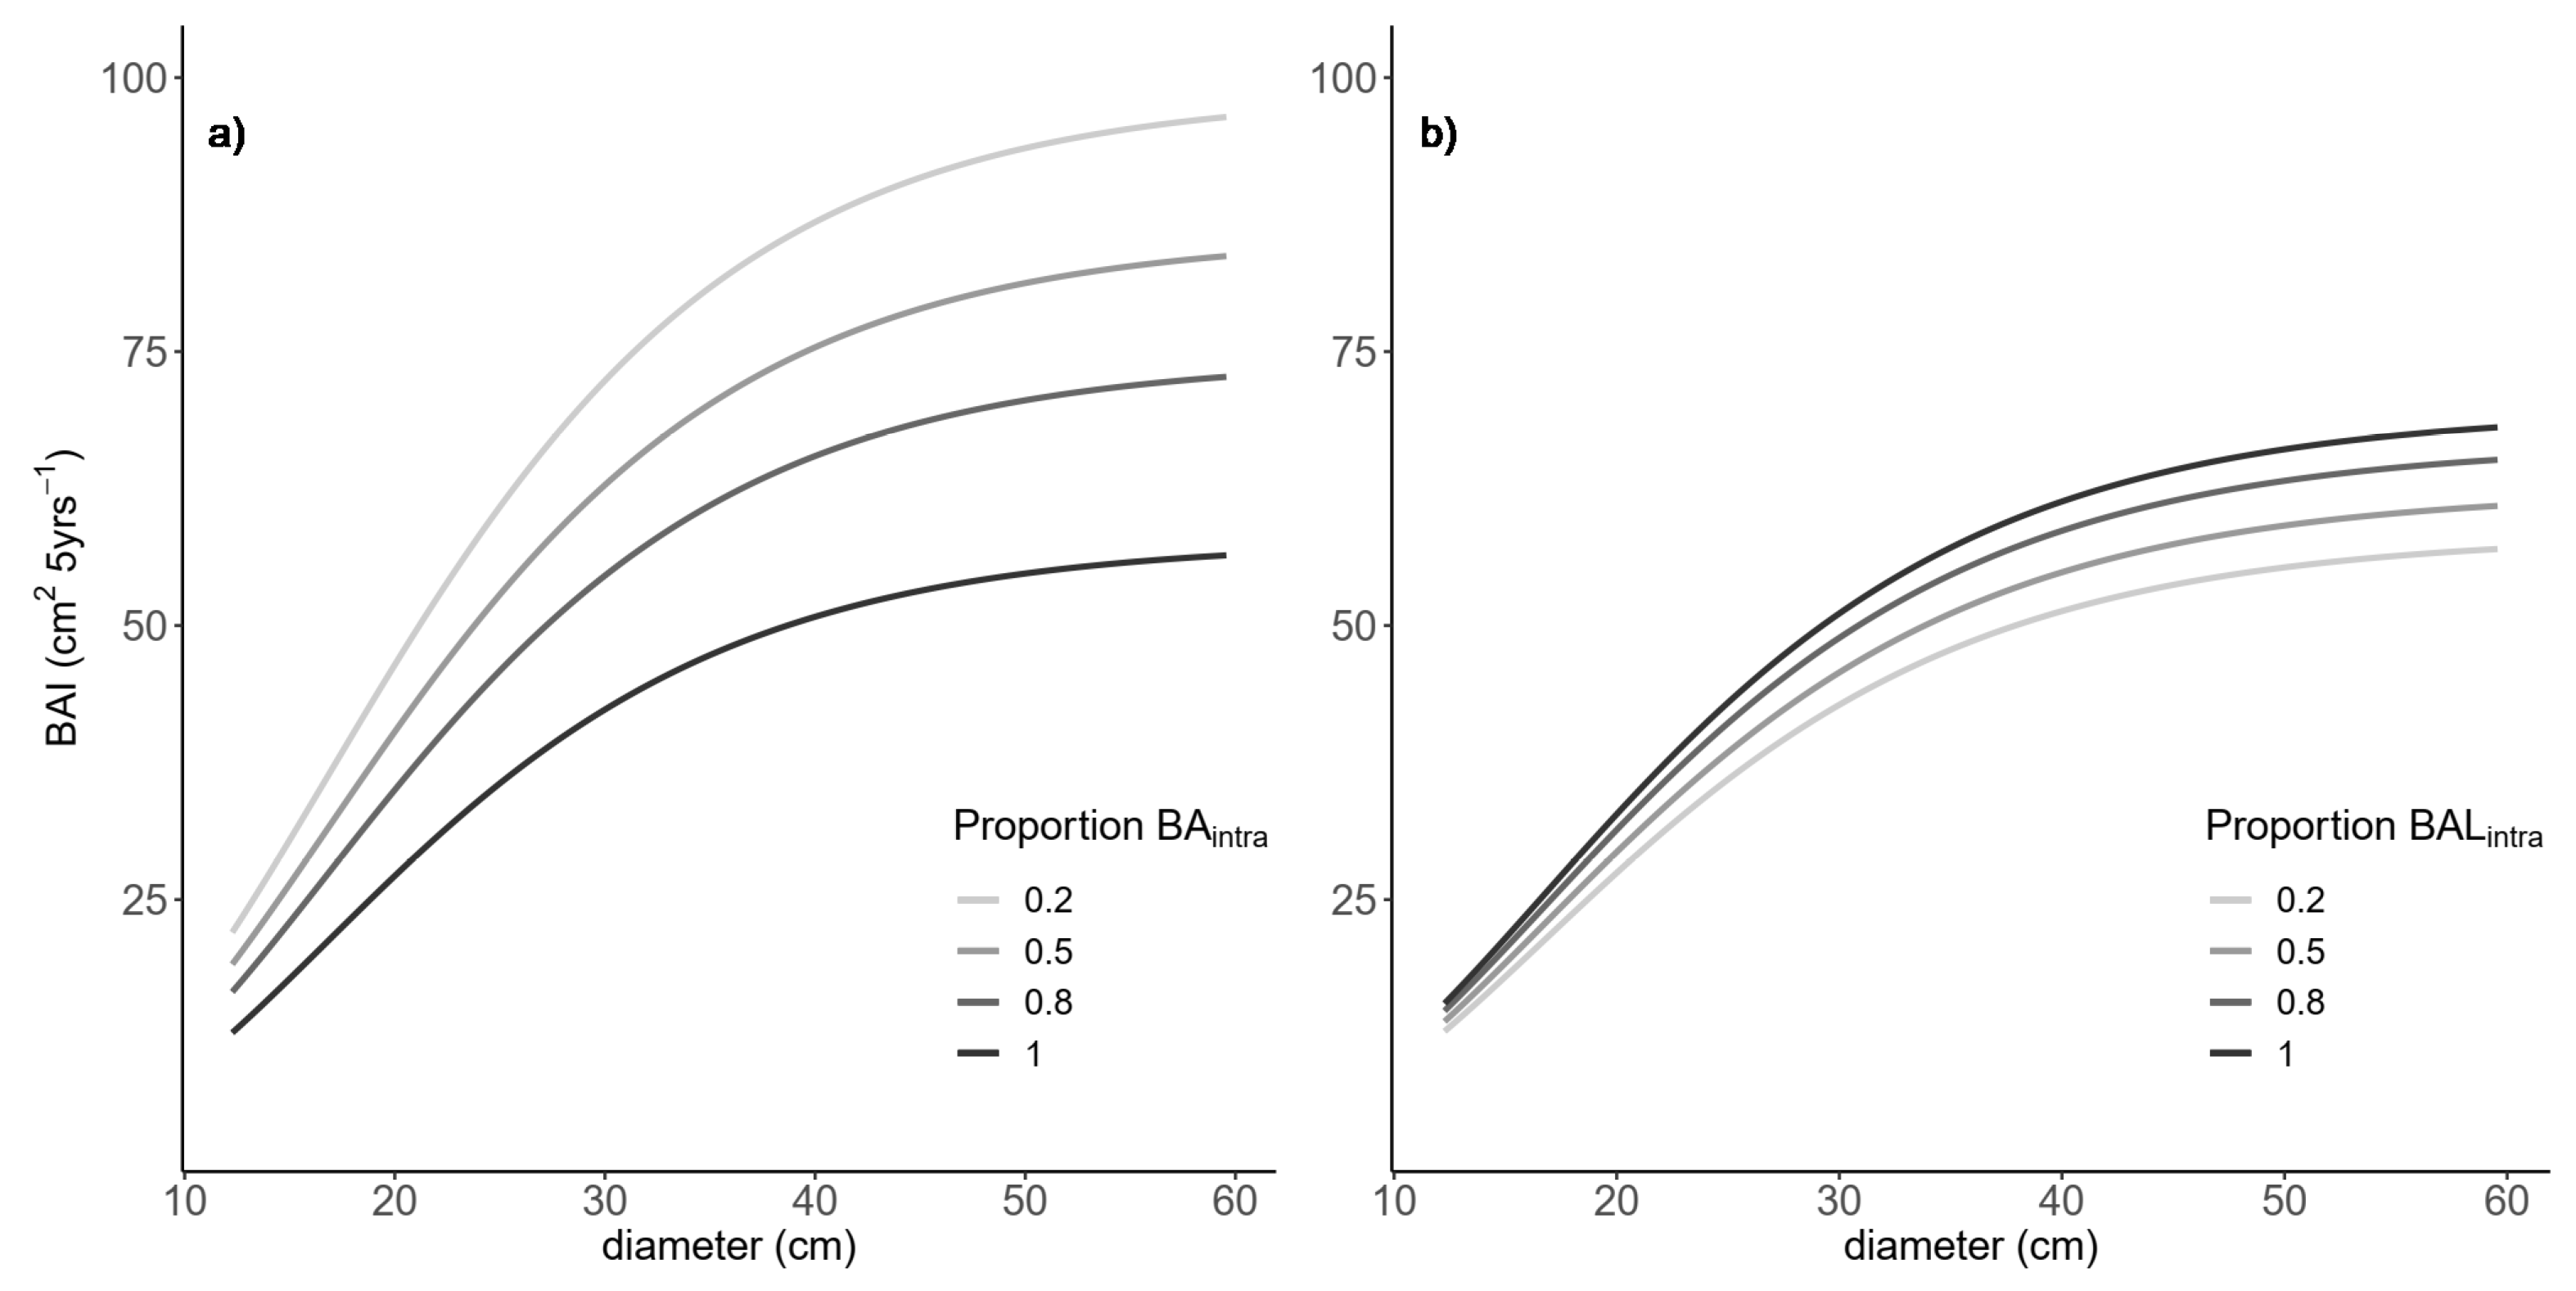
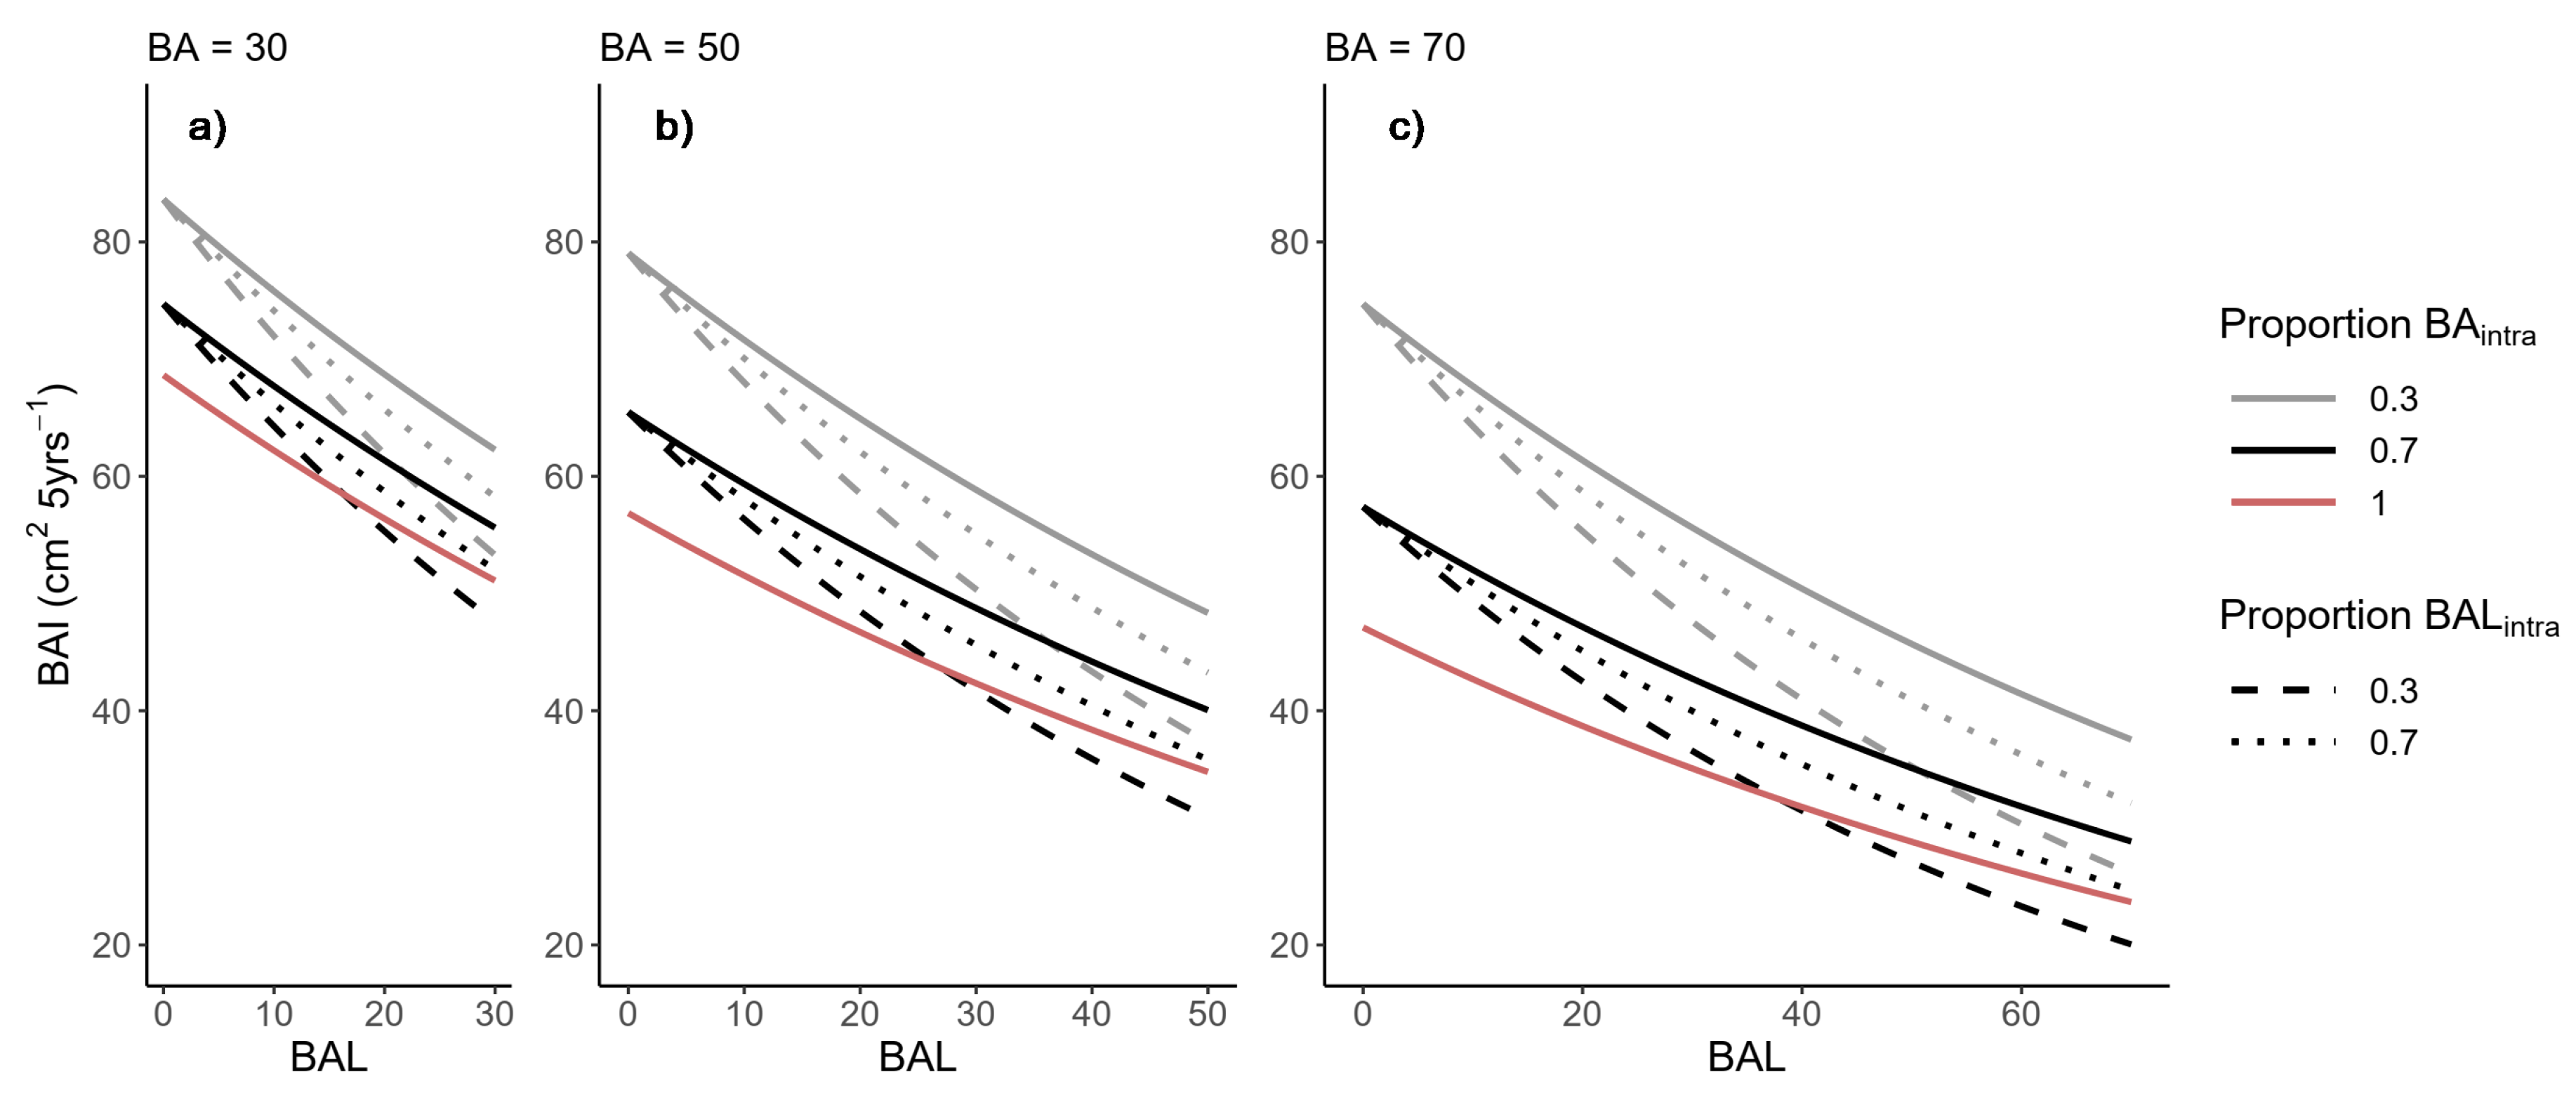
Table 1.
Tree and plot-level attributes in mixed and pure plots for each species across triplets.
| Variable | Scots Pine | Maritime Pine | ||||||||||
|---|---|---|---|---|---|---|---|---|---|---|---|---|
| Pure Stands | Mixed Stands | Pure Stands | Mixed Stands | |||||||||
| mean | min | max | mean | min | max | mean | min | max | mean | min | max | |
| d | 28.54 | 7.80 | 52.20 | 27.86 | 7.50 | 53.30 | 31.60 | 10.80 | 58.00 | 31.60 | 7.65 | 60.25 |
| h | 19.50 | 5.40 | 28.20 | 18.75 | 8.20 | 30.20 | 17.07 | 3.70 | 27.00 | 19.52 | 4.90 | 30.30 |
| BAI | 28.30 | 2.64 | 97.07 | 23.60 | 1.29 | 124.04 | 34.86 | 2.31 | 130.18 | 52.15 | 3.98 | 143.27 |
| CR | 0.25 | 0.04 | 0.54 | 0.24 | 0.06 | 0.74 | 0.25 | 0.06 | 0.54 | 0.23 | 0.06 | 0.61 |
| Rh | 0.92 | 0.23 | 1.19 | 0.88 | 0.39 | 1.26 | 0.92 | 0.24 | 1.20 | 0.93 | 0.32 | 1.20 |
| Ho | 21.31 | 16.53 | 25.67 | 20.2 | 15.0 | 26.7 | 18.43 | 14.89 | 22.46 | 21.50 | 15.00 | 26.90 |
| Do | 39.99 | 26.96 | 48.41 | 37.22 | 23.9 | 46.92 | 42.61 | 33.16 | 50.17 | 43.94 | 32.04 | 50.86 |
| dq | 29.86 | 21.54 | 39.26 | 29.5 | 20.5 | 40.6 | 32.06 | 21.99 | 40.31 | 37.90 | 27.50 | 48.0 |
| d/dq | 0.95 | 0.25 | 1.71 | 0.85 | 0.26 | 1.77 | 0.98 | 0.41 | 1.87 | 1.11 | 0.31 | 1.77 |
| SI | 23 | 17 | 31 | 22 | 14 | 29 | 20 | 17 | 28 | 22 | 17 | 27 |
| m | 0.94 | 0.93 | 1.00 | 0.47 | 0.33 | 0.71 | 0.99 | 0.95 | 1.00 | 0.54 | 0.29 | 0.67 |
| BA | 47.76 | 29.38 | 62.88 | 54.06 | 29.56 | 72.16 | 56.66 | 33.29 | 68.16 | 54.93 | 29.56 | 72.16 |
| BAintra | 47.63 | 29.27 | 62.34 | 27.21 | 13.03 | 45.87 | 58.87 | 37.53 | 70.31 | 33.17 | 11.09 | 49.27 |
| BAinter | 2.89 | 0 | 8.18 | 29.92 | 11.09 | 49.27 | 0.81 | 0 | 3.02 | 24.96 | 13.02 | 45.87 |
| BAL | 31.88 | 0 | 65.34 | 41.97 | 0 | 74.67 | 35.75 | 0 | 69.45 | 27.52 | 0 | 69.51 |
| BALintra | 29.23 | 0 | 61.37 | 16.52 | 0.00 | 44.72 | 35.44 | 0 | 69.45 | 18.97 | 0.00 | 47.92 |
| BALinter | 2.65 | 0 | 7.09 | 25.48 | 0.00 | 48.66 | 0.31 | 0 | 0 | 8.55 | 0.00 | 45.87 |
d: diameter at breast height (cm); h: total tree height (m); BAI: basal area periodic annual increment (cm2 5 years−1); CR: crown ratio; Rh: ratio of tree height and stand dominant height; Ho: stand dominant height, average h of largest 100 trees per ha by d (m); Do: dominant diameter of 100 largest trees per ha by d(cm); dq: quadratic mean diameter (cm); d/dq: tree social status index. SI: site index as the dominant height (m) at age 100 for Scots pine [29,30] and Maritime pine [28]; m: mixing proportion of target species. BA: stand basal area (m2 ha−1); BAL: basal area of larger trees (m2 ha−1); subscripts inter and intra designate interspecific and intraspecific BA or BAL.
Table 2.
Parameter estimates, variance components, and goodness-of-fit statistics for the final generalized h-d model selected for each species. All of the parameters were significant with p < 0.05, standard errors in brackets. ∆AIC is the reduction in AIC achieved by including species mixing proportion in Equation (4).
| Scots Pine | Maritime Pine | ||||
|---|---|---|---|---|---|
| Fixed parameters | 0.864843 | (0.07180) | 1.069423 | (0.08921) | |
| 0.915575 | (0.03974) | 0.831289 | (0.04814) | ||
| 0.118576 | (0.03133) | 0.122623 | (0.04080) | ||
| 0.033849 | (0.01055) | ||||
| −0.023208 | (0.01371) | ||||
| −7.102191 | (0.52549) | −8.114589 | (0.78582) | ||
| Variance components | 4.5447 | 8.5504 | |||
| 3.24 × 10⁻⁶ | 0.0355 | ||||
| Variance function | 1.2608 | 0.7054 | |||
| Fit statistics | RMSE | 1.5626 | 1.3770 | ||
| AIC | 3406.9 | 2901.3 | |||
| ∆AIC | 7.2 | 1.7 | |||
Table 3.
Evaluation statistics, based on data from National Forest Inventory (NFI) plots in the North Iberian Range, comparing the best generalized h-d models fitted to the triplet data and the equations proposed by Lizarralde et al. [25,26].
| Stand Composition | Species | n | Fitted Models | Lizarralde * | ||
|---|---|---|---|---|---|---|
| RMSE | EF | RMSE | EF | |||
| Mixed | Scots pine | 721 | 1.69 | 0.74 | 1.88 | 0.68 |
| Maritime pine | 738 | 1.88 | 0.66 | 1.89 | 0.65 | |
| Pure | Scots pine | 3983 | 1.73 | 0.81 | 1.79 | 0.79 |
| Maritime pine | 2089 | 1.60 | 0.78 | 1.68 | 0.76 | |
Table 4.
Ranking of basal area increment models comparing alternative measures of competition. Competitive status was compared for the size-symmetric (BA) and size-asymmetric competitors (BAL) separated into intraspecific and interspecific components. Models ranked according to their ΔAICc: difference of AICc values between the best model and the ith model; and : Akaike weights.
| Species | Competition Structure * | AICc | Δ AICc | ||||||
|---|---|---|---|---|---|---|---|---|---|
| Scots pine | BA | BAL | 5505.3 | 0 | 0.53 | ||||
| BA | BALintra | BALinter | 5507.0 | 1.77 | 0.22 | ||||
| BAintra | BAinter | BAL | 5507.3 | 2.05 | 0.19 | ||||
| BAintra | BALintra | BALinter | 5509.8 | 4.52 | 0.06 | ||||
| BALintra | BALinter | 5517.4 | 12.13 | 0.00 | |||||
| BA | 5517.9 | 12.61 | 0.00 | ||||||
| BAL | 5517.9 | 12.65 | 0.00 | ||||||
| BAintra | BAinter | 5519.9 | 14.59 | 0.00 | |||||
| Maritime pine | BAintra | BALintra | BALinter | 6097.1 | 0 | 0.86 | |||
| BAintra | BAL | 6101.0 | 3.89 | 0.12 | |||||
| BA | BALintra | BALinter | 6106.3 | 9.19 | 0.01 | ||||
| BAL | 6106.4 | 9.23 | 0.01 | ||||||
| BALintra | BALinter | 6108.4 | 11.28 | 0.00 | |||||
| BA | 6116.9 | 19.75 | 0.00 | ||||||
| BAintra | BAinter | 6117.2 | 20.10 | 0.00 | |||||
| BA | BAL | 6142.1 | 45.01 | 0.00 | |||||
* BA, basal area; BAL, basal area of larger trees; subheading inter and intra indicate separation into interspecific and intraspecific components, respectively.
Table 5.
Estimated parameters (standard errors in brackets) and fitting statistics for the final basal area increment models of the two species. Parameters were estimated by the restricted maximum likelihood method (REML). Variables are defined as follows:, residual variance; , variance for the plot random effects; , parameters of the variance function (Equation (5)). Bias, EF, and RMSE are the mean bias model efficiency and root mean square (Equations (8)–(10)), respectively.
| Scots Pine | Maritime Pine | ||
|---|---|---|---|
| Fixed parameters | 4.427540 (0.2311) | 4.467207 (0.1614) | |
| −0.131687 (0.0122) | −0.089010 (0.0086) | ||
| 0.828948 (0.2315) | 1.009121 (0.2491) | ||
| BA | −0.016671 (0.0043) | ||
| BAintra | −0.009411 (0.0029) | ||
| BAL | −0.011216 (0.0024) | ||
| BALintra | −0.009832 (0.0020) | ||
| BALinter | −0.017252 (0.0052) | ||
| Variance components | 0.0234 | 0.0401 | |
| 0.0053 | 0.0147 | ||
| Variance function | 0.9282 | 0.87767 | |
| Cross-evaluation | Bias | 0.1104 | 0.5769 |
| EF | 0.3267 | 0.4304 | |
| RMSE | 15.422 | 19.851 |
© 2019 by the authors. Licensee MDPI, Basel, Switzerland. This article is an open access article distributed under the terms and conditions of the Creative Commons Attribution (CC BY) license (http://creativecommons.org/licenses/by/4.0/).
Share and Cite
MDPI and ACS Style
Riofrío, J.; del Río, M.; Maguire, D.A.; Bravo, F. Species Mixing Effects on Height–Diameter and Basal Area Increment Models for Scots Pine and Maritime Pine. Forests 2019, 10, 249. https://0-doi-org.brum.beds.ac.uk/10.3390/f10030249
AMA Style
Riofrío J, del Río M, Maguire DA, Bravo F. Species Mixing Effects on Height–Diameter and Basal Area Increment Models for Scots Pine and Maritime Pine. Forests. 2019; 10(3):249. https://0-doi-org.brum.beds.ac.uk/10.3390/f10030249
Chicago/Turabian StyleRiofrío, José, Miren del Río, Douglas A. Maguire, and Felipe Bravo. 2019. "Species Mixing Effects on Height–Diameter and Basal Area Increment Models for Scots Pine and Maritime Pine" Forests 10, no. 3: 249. https://0-doi-org.brum.beds.ac.uk/10.3390/f10030249
Note that from the first issue of 2016, this journal uses article numbers instead of page numbers. See further details here.