Understory Vegetation Responses to 15 Years of Repeated Fuel Reduction Treatments in the Southern Appalachian Mountains, USA


Abstract
:1. Introduction
Research Objectives
2. Materials and Methods
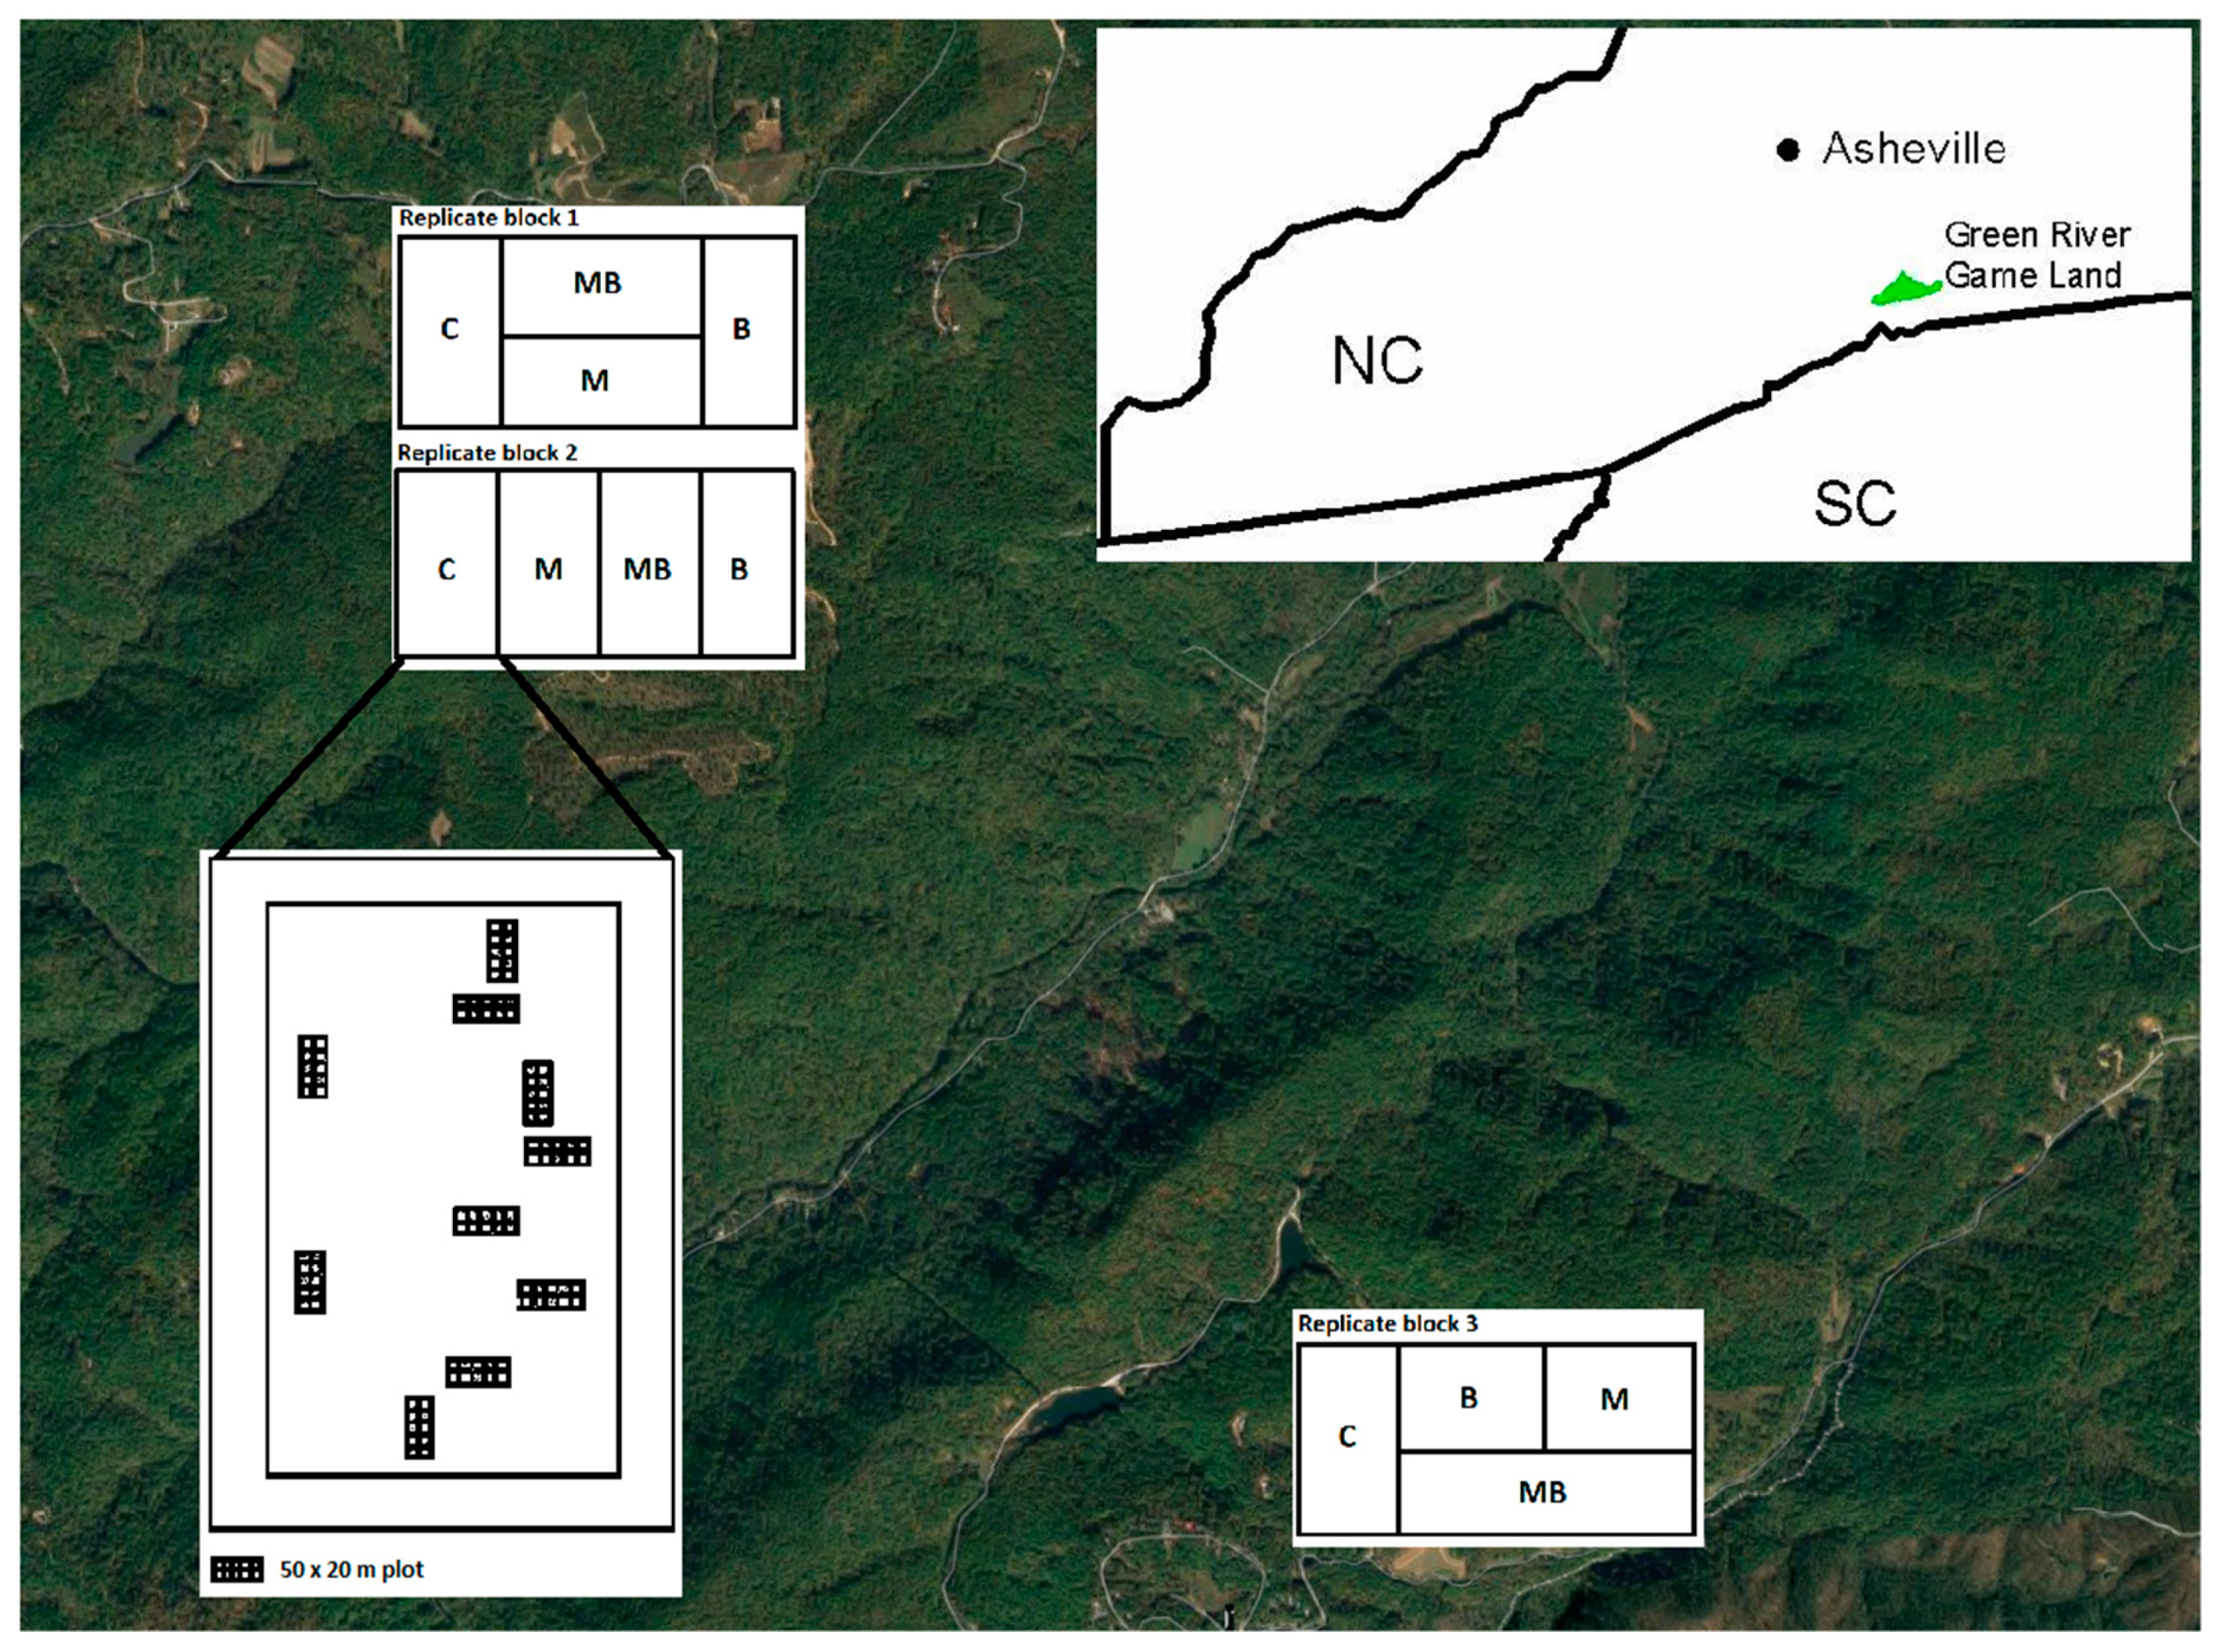
2.1. Location
2.2. Study Design
2.3. Analysis
3. Results
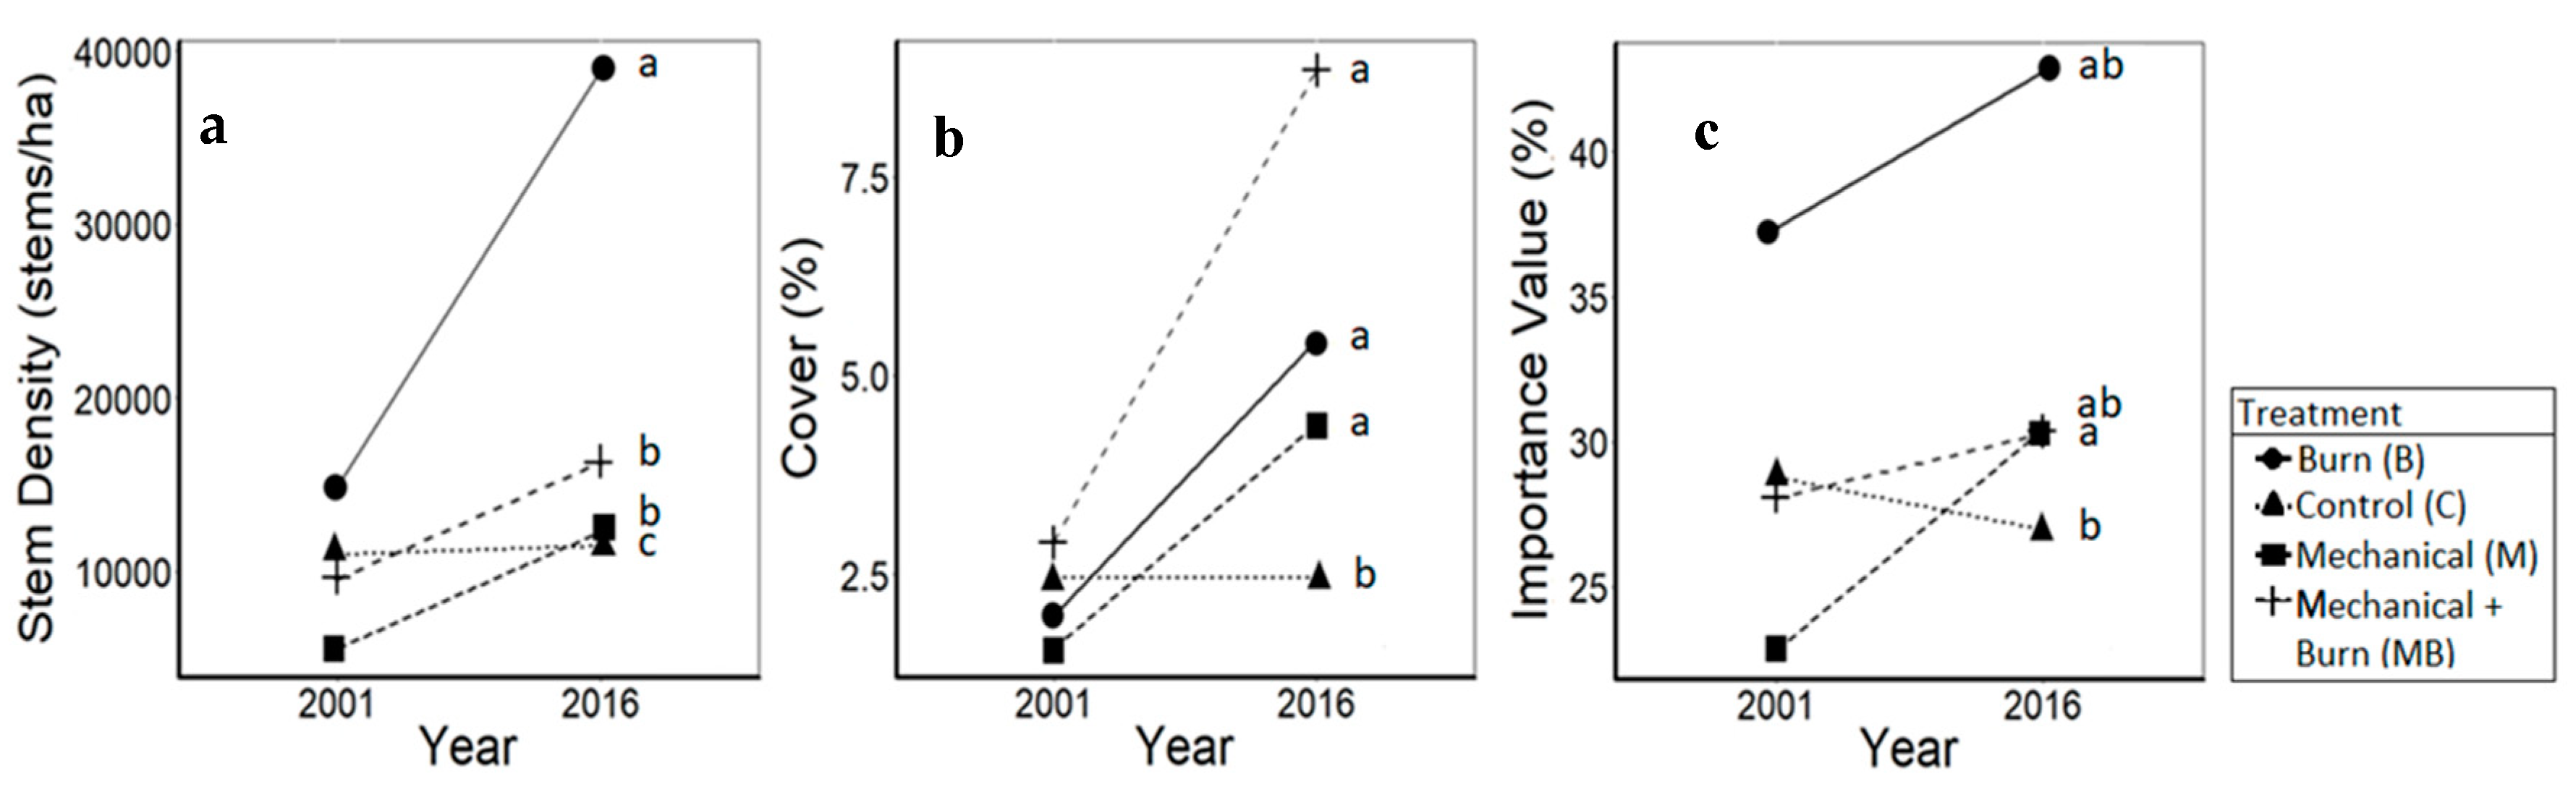
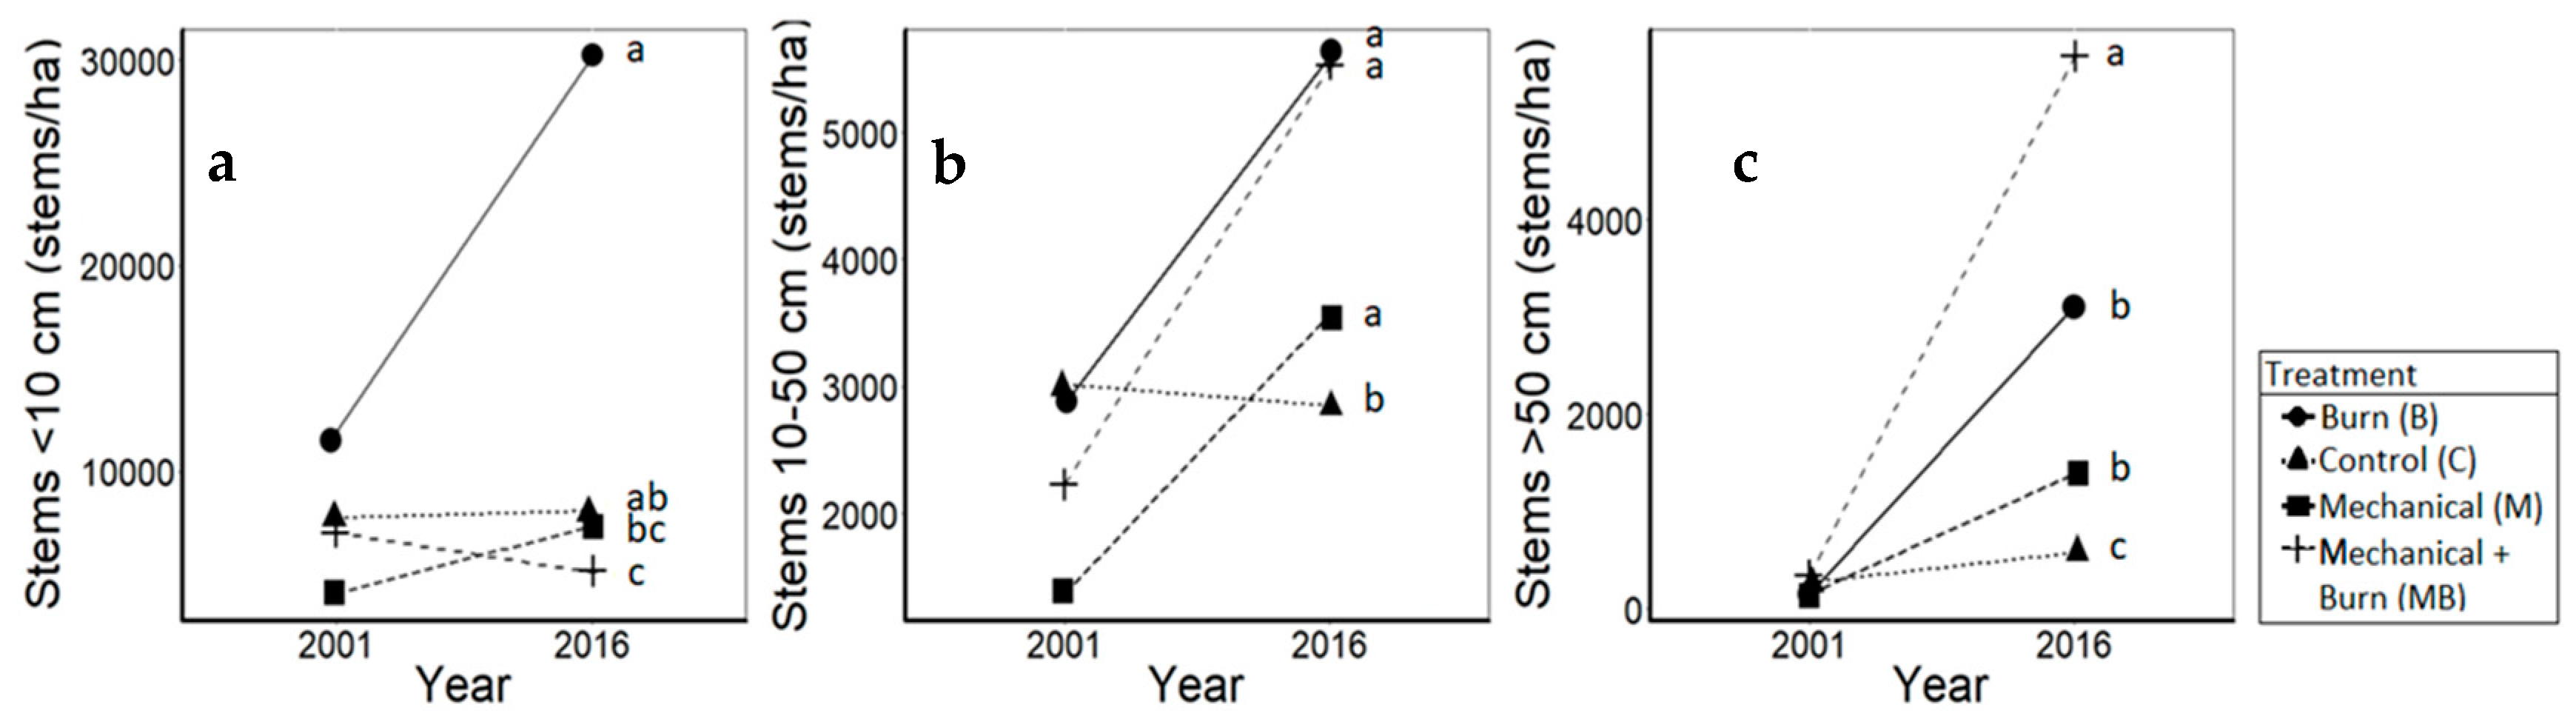
3.1. Oaks
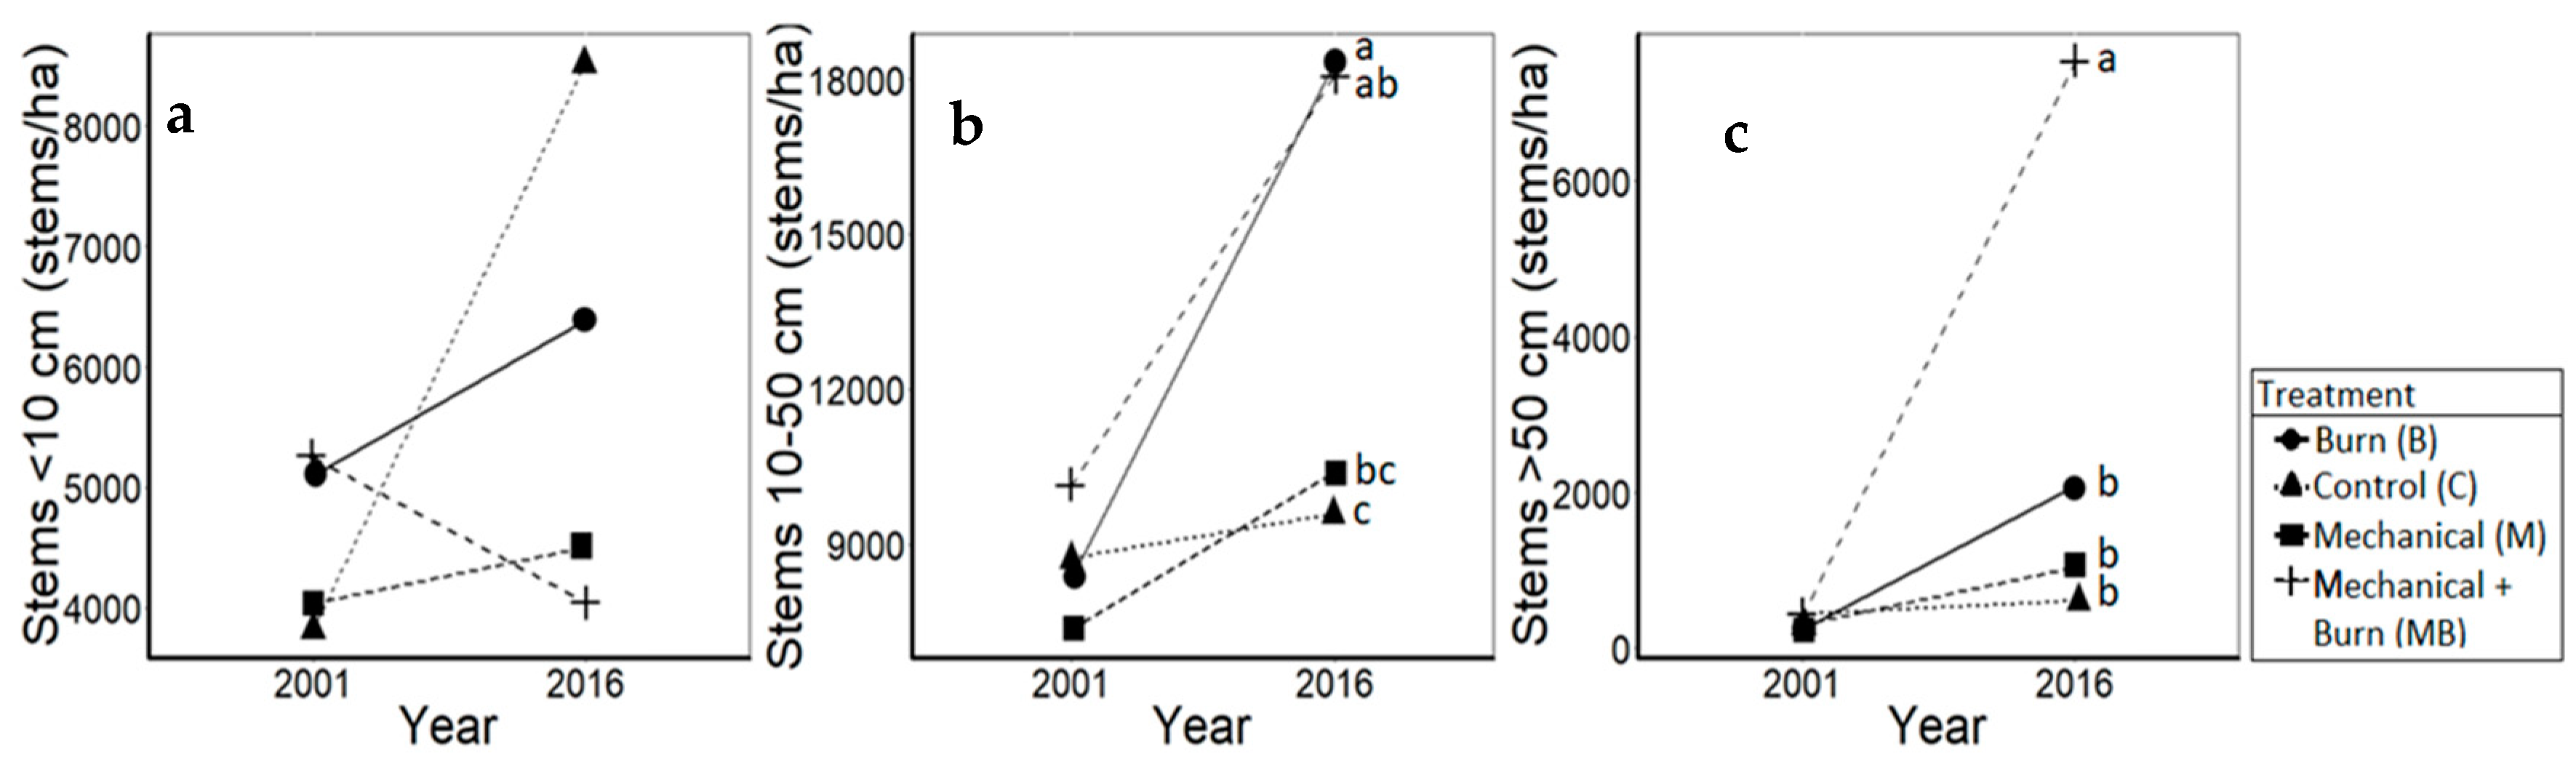
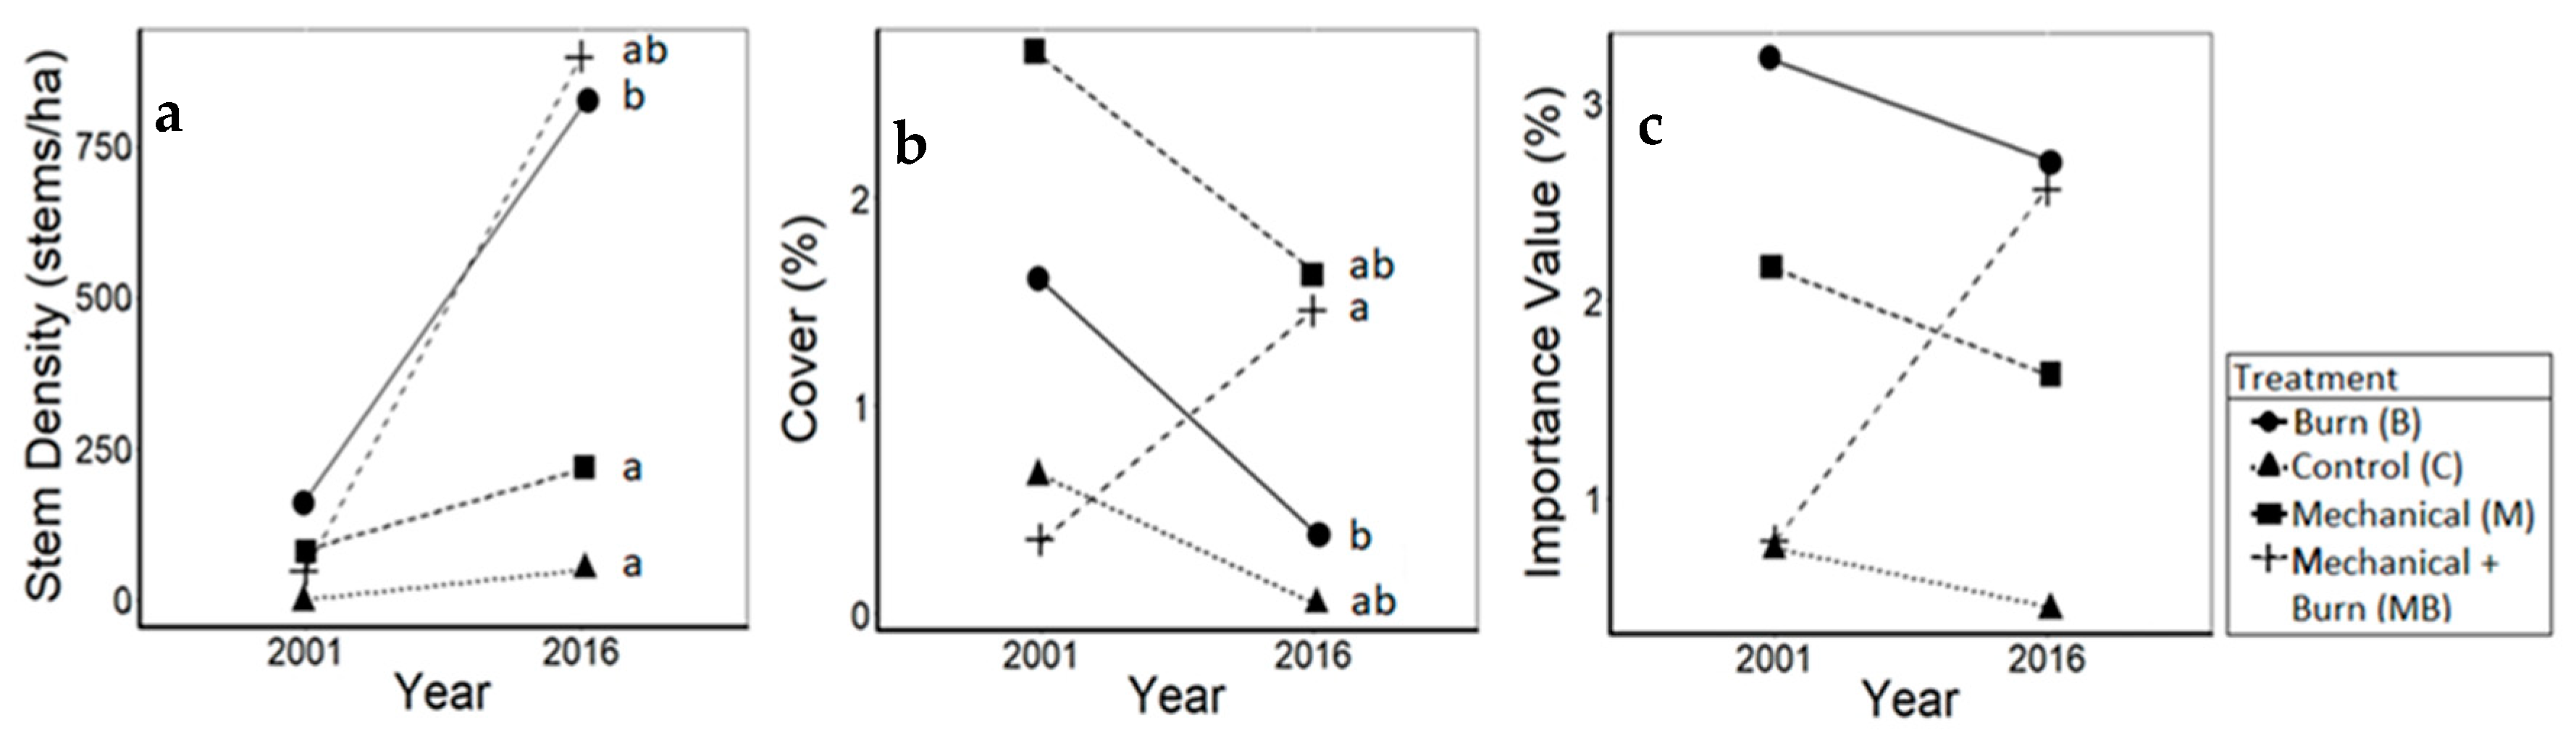
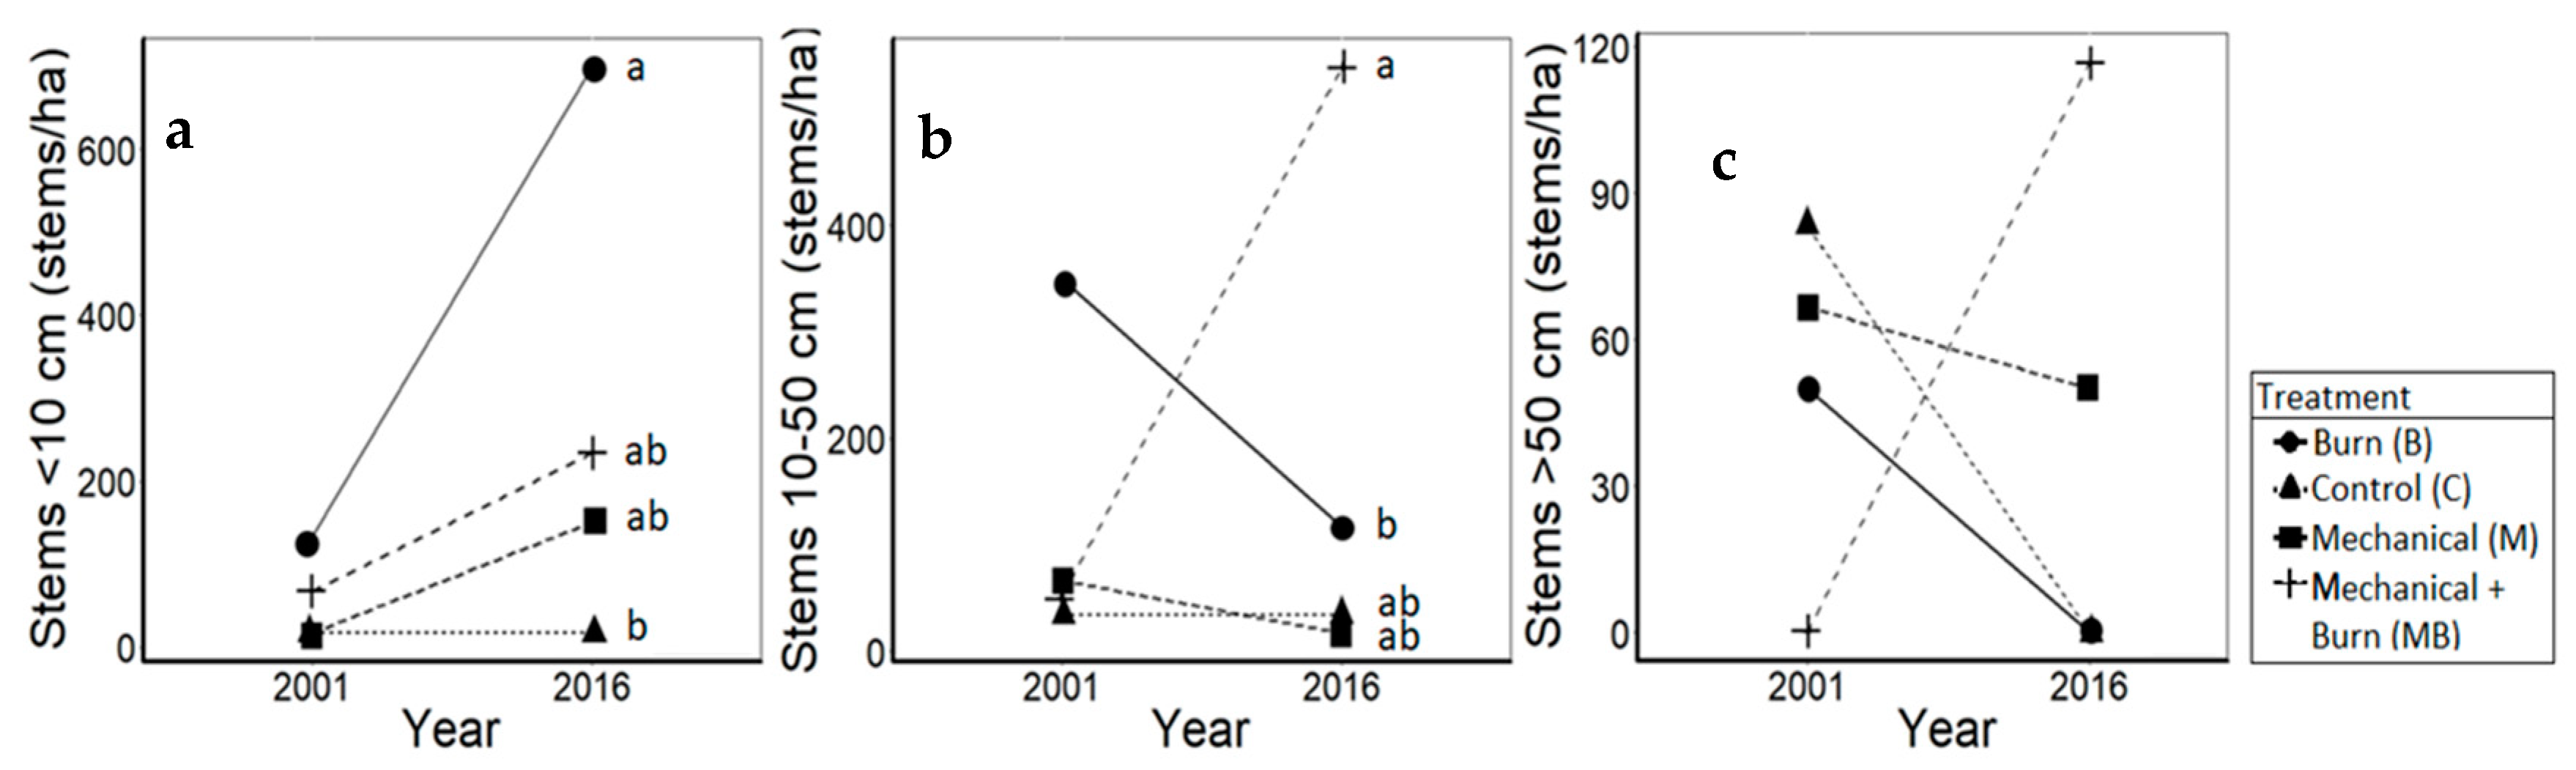
3.2. Pines
3.3. Mesic Hardwoods
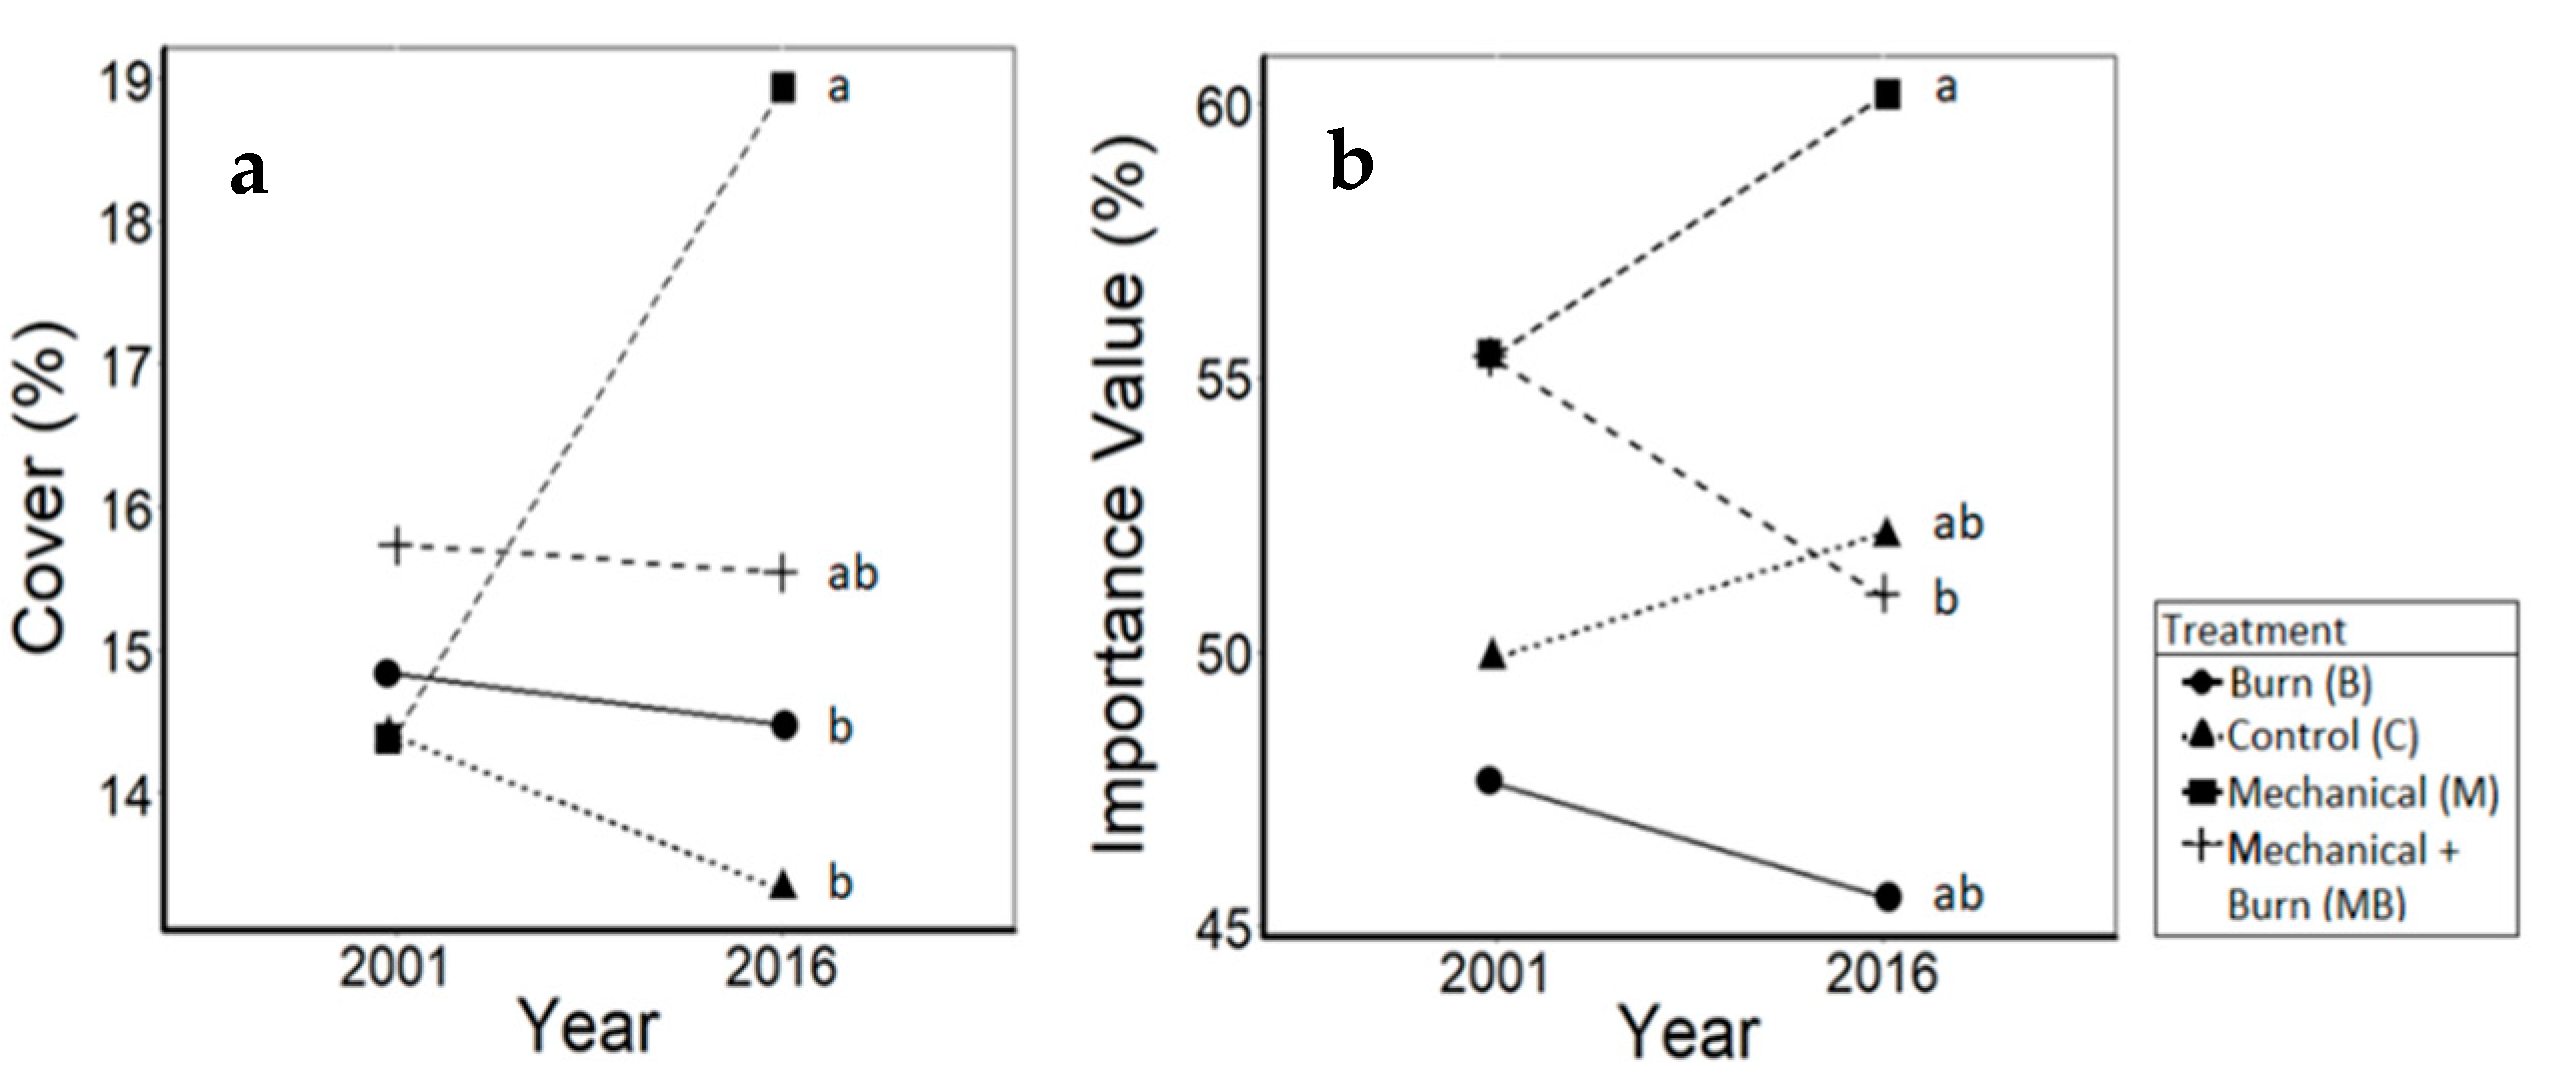
3.4. Shrubs
3.5. Graminoids
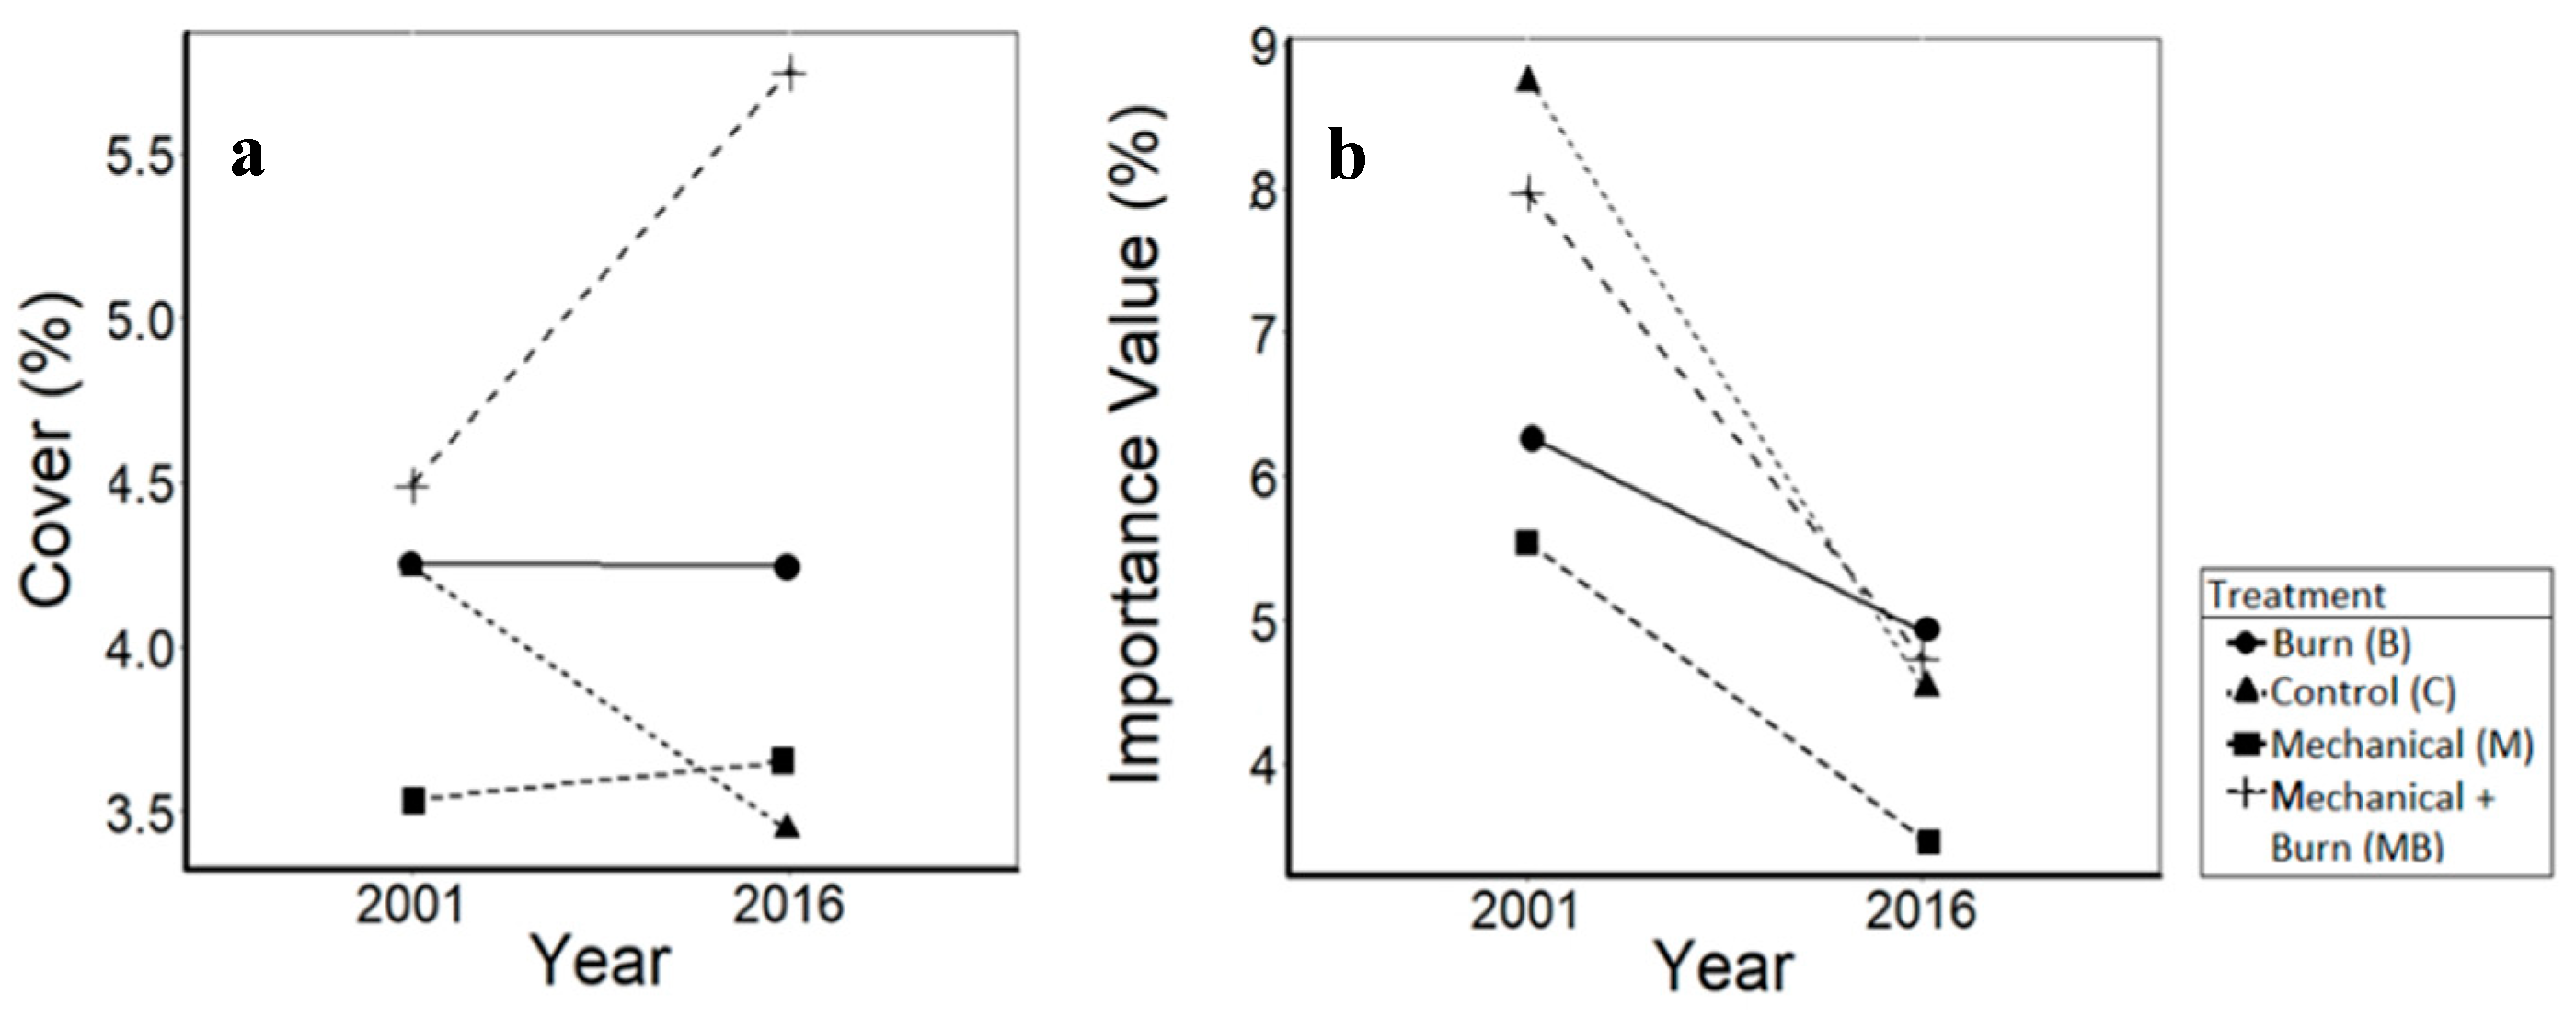
3.6. Forbs
4. Discussion
4.1. Oaks
4.2. Pines
4.3. Mesic Hardwoods
4.4. Shrubs
4.5. Graminoids
4.6. Forbs
5. Conclusions
Author Contributions
Funding
Acknowledgments
Conflicts of Interest
References
- Lorimer, C.G. Causes of the Oak Regeneration Problem; Oak Regeneration: Service General Technical Report SE-84; Southern Research Station: Asheville, NC, USA, 1992.
- Abrams, M.D.; Orwig, D.A.; DeMeo, T.E. Dendrochronology and Successional Dynamics of a Presettlement-Origin White Pine-Mixed Oak Forest in the Southern Appalachians USA. J. Ecol. 1995, 83, 123–133. [Google Scholar] [CrossRef]
- Peterson, D.W.; Reich, P.B.; Wrage, K.J. Plant Functional Group Responses to Fire Frequency and Tree Canopy Cover Gradients in Oak Savannas and Woodlands. J. Veg. Sci. 2007, 18, 3–12. [Google Scholar] [CrossRef]
- Van Lear, D.H.; Waldrop, T.A. History, Use, and Effects of Fire in the Southern Appalachians; USDA Forest Service General Technical Report SE-54; Southeastern Forest Experiment Station: Asheville, NC, USA, 1998.
- Denevan, W.M. The Pristine Myth: The Landscape of the Americas in 1492. Ann. Assoc. Am. Geogr. 1992, 82, 369–385. [Google Scholar] [CrossRef]
- Waldrop, T.A.; Yaussy, D.A.; Phillips, R.J.; Hutchinson, T.F.; Brudnak, L.; Boerner, R.E.J. Fuel Reduction Treatments Affect Stand Structure of Hardwood Forests in Western North Carolina and Southern Ohio, USA. For. Ecol. Manag. 2008, 255, 3117–3129. [Google Scholar] [CrossRef]
- Lafon, C.W.; Naito, A.T.; Grissino-Mayer, H.D.; Horn, S.P.; Waldrop, T.A. Fire History of the Appalachian Region: A Review and Synthesis; USDA Forest Service General Technical Report SRS-219; Southern Research Station: Asheville, NC, USA, 2017.
- Nowacki, G.J.; Abrams, M.D. The Demise of Fire and Mesophication of Forests in the Eastern United States. Bioscience 2008, 58, 123–138. [Google Scholar] [CrossRef]
- Brose, P.H.; Waldrop, T.A. Making Sense Out of Confusion: A Review of Fire-Oak Papers Published in the Past 50 Years. In Proceedings, Wildland Fire in the Appalachians: Discussions among Managers and Scientists; USDA Forest Service General Technical Report SRS-199; Waldrop, T.A., Ed.; Southern Research Station: Asheville, NC, USA, 2014. [Google Scholar]
- Monk, C.D.; McGinty, D.T.; Day, F.P. The Ecological Importance of Kalmia latifolia and Rhododendron maximum in the Deciduous Forest of the Southern Appalachians. Bull. Torrey Bot. Club 1985, 112, 187–193. [Google Scholar] [CrossRef]
- Elliott, K.J.; Vose, J.M. Age and Distribution of an Evergreen Clonal Shrub in the Coweeta Basin: Rhododendron maximum L. J. Torrey Bot. Soc. 2012, 139, 149–166. [Google Scholar] [CrossRef]
- Brose, P.H.; Schuler, T.M.; Van Lear, D.H.; Berst, J. Bringing Fire Back: The Changing Regimes of the Appalachian Mixed Oak Forest. J. For. 2001, 99, 30–35. [Google Scholar]
- Waldrop, T.A.; Hagan, D.; Simon, D.M. Repeated Application of Fuel Reduction Techniques in the Southern Appalachian Mountains, USA: Implications for Achieving Management Goals. Fire Ecol. 2016, 12, 28–47. [Google Scholar] [CrossRef]
- Brose, P.H.; Van Lear, D.H. Responses of Hardwood Advance Regeneration to Seasonal Prescribed Fires in Oak-Dominated Shelterwood Stands. Can. J. For. Res. 1989, 28, 331–339. [Google Scholar] [CrossRef]
- Chalmers, S.R.; Hartsough, B.R. Thinning and Prescribed Fire as Methods to Reduce Fuel Loading—A Cost Analysis. In Thinnings, a Valuable Forest Management Tool Proceedings of an International Conference (CD-ROM); Forest Engineering Research Institute of Canada: Pointe-Claire, QC, Canada, 2001. [Google Scholar]
- Knapp, E.E.; Estes, B.L.; Skinner, C.N. Ecological Effects of Prescribed Fire Season: A Literature Review and Synthesis for Managers; USDA Forest Service General Technical Report PSW-GTR-224; Pacific Southwest Research Station: Albany, CA, USA, 2009.
- Stanturf, J.A.; Wade, D.D.; Waldrop, T.A.; Kennard, D.K.; Achtemeier, G.L. Fire in Southern Forest Landscapes. In Southern Forest Resource Assessment; USDA Forest Service General Technical Report SRS-53; Wear, D.M., Greis, J., Eds.; Southern Research Station: Asheville, NC, USA, 2002. [Google Scholar]
- Olsen, C.S.; Kline, J.D.; Ager, A.A.; Olsen, K.A.; Short, K.C. Examining the Influence of Biophysical Conditions on Wildland-Urban Interface Homeowners’ Wildfire Risk Mitigation Activities in Fire-Prone Landscapes. Ecol. Soc. 2017, 22, 21. [Google Scholar] [CrossRef]
- Van Lear, D.H.; Waldrop, T.A. Prescribed Burning for Regeneration [Chapter 12]. In Forest Regeneration Manual; Duryea, M.L., Dougherty, P.M., Eds.; Kluwer Academic Publishers: Dordrecht, The Netherlands, 1991. [Google Scholar]
- Ryan, K.C.; Knapp, E.E.; Varner, J.M. Prescribed Fire in North American Forests and Woodlands: History, Current Practice, and Challenges. Front. Ecol. Environ. 2013, 11, 15–24. [Google Scholar] [CrossRef]
- Clinton, B.D.; Vose, J.M.; Swank, W.T.; Berg, E.C.; Loftis, D.L. Fuel Consumption and Fire Characteristics During Understory Burning in a Mixed White Pine-Hardwood Stand in the Southern Appalachians; USDA Forest Service Research Paper SRS-RP-012; Southern Research Station: Asheville, NC, USA, 1998.
- Brose, P.H.; Dey, D.C.; Phillips, R.J.; Waldrop, T.A. A Meta-Analysis of the Fire-Oak Hypothesis: Does Prescribed Burning Promote Oak Reproduction in Eastern North America? For. Sci. 2013, 59, 322–334. [Google Scholar] [CrossRef]
- Dolan, B.J.; Parker, G.R. Understory Response to Disturbance: An Investigation of Prescribed Burning and Understory Removal Treatments; USDA Forest Service General Technical Report SRS-73, Southern Research Station: Asheville, NC, USA, 2004. [Google Scholar]
- Clinton, B.D.; Vose, J.M.; Swank, W.T. Site Preparation Burning to Improve Southern Appalachian Pine-Hardwood Stands: Vegetation Composition and Diversity of 13-Year-Old Stands. Can. J. For. Res. 1993, 23, 2271–2277. [Google Scholar] [CrossRef]
- Scudieri, C.A.; Sieg, C.H.; Haase, S.M.; Thode, A.E.; Sackett, S.S. Understory Vegetation Response After 30 years of Interval Prescribed Burning in Two Ponderosa Pine Sites in Northern Arizona, USA. For. Ecol. Manag. 2010, 260, 2134–2142. [Google Scholar] [CrossRef]
- Pavlovic, N.B.; Leicht-Young, S.A.; Grundel, S.A. Short-Term Effects of Burn Season on Flowering Phenology of Savanna Plants. Plant Ecol. 2011, 212, 611–625. [Google Scholar] [CrossRef]
- Youngblood, A.; Metlen, K.L.; Knapp, E.E.; Outcalt, K.W.; Stephens, S.L.; Waldrop, T.A.; Yaussy, D. Implementation of the Fire and Fire Surrogate Study—A National Research Effort to Evaluate the Consequences of Fuel Reduction Treatment. In Balancing Ecosystem Values: Innovative Experiments for Sustainable Forestry—Proceedings of a Conference; USDA Forest Service General Technical Report PNW-GTR-635; Peterson, C.E., Maguire, D.A., Eds.; Pacific Northwest Station: Portland, OR, USA, 2005. [Google Scholar]
- Schwilk, D.W.; Keeley, J.E.; Knapp, E.E.; McIver, J.; Bailey, J.D.; Fettig, C.J.; Fiedler, C.E.; Harrod, R.J.; Moghaddas, J.J.; Outcalt, K.W.; et al. The National Fire and Fire Surrogate Study: Effects of Fuel Reduction Methods on Forest Vegetation Structure and Fuels. Ecol. Appl. 2009, 19, 285–304. [Google Scholar] [CrossRef]
- Keenan, S.C. Soil Survey of Polk County, North Carolina; USDA Natural Resources Conservation Service: Washington, DC, USA, 1998.
- Kuznetsova, A.; Brockhoff, P.B.; Christensen, R.H.B. lmerTest: Tests in Linear Mixed Effects Models; R package Version 2.0-33; R Foundation for Statistical Computing: Vienna, Austria, 2016. [Google Scholar]
- Greenberg, C.H.; Moorman, C.E.; Matthews-Snoberger, C.E.; Waldrop, T.A.; Simon, D.; Heh, A.; Hagan, D. Long-Term Herpetofaunal Response to Repeated Fuel Reduction Treatments. J. Wildl. Manag. 2017, 82, 553–565. [Google Scholar] [CrossRef]
- Phillips, R.J.; Waldrop, T.A. Changes in Vegetation Structure and Composition in Response to Fuel Reduction Treatments in the South Carolina Piedmont. For. Ecol. Manag. 2008, 255, 3107–3116. [Google Scholar] [CrossRef]
- Stephens, S. A National Study of the Consequences of Fire and Fire Surrogate Treatments. In Fire and Fire Surrogate Study Plan; Blodgett Forest Research Station: Georgetown, CA, USA, 2001. [Google Scholar]
- R Core Team. R: A Language and Environment for Statistical Computing; R Foundation for Statistical Computing: Vienna, Austria, 2016. [Google Scholar]
- Iverson, L.R.; Hutchinson, T.F.; Prasad, A.M.; Peters, M.P. Thinning, Fire, and Oak Regeneration Across a Heterogeneous Landscape in the Sastern US: 7-Year Results. For. Ecol. Manag. 2008, 255, 3035–3050. [Google Scholar] [CrossRef]
- Brose, P.H. Long-Term Effects of Single Prescribed Fires on Hardwood Regeneration in Oak Shelterwood Stands. For. Ecol. Manag. 2010, 260, 1516–1524. [Google Scholar] [CrossRef]
- Steiner, K.C.; Finley, J.C.; Gould, P.J.; Fei, S.; McDill, M. Oak Regeneration Guidelines for the Central Appalachians. North. J. Appl. For. 2008, 25, 5–16. [Google Scholar]
- Gilbert, N.L.; Johnson, S.L.; Gleeson, S.K.; Blankenship, B.A.; Arthur, M.A. Effects of Prescribed Fire on Physiology and Growth of Acer rubrum and Quercus spp. Seedlings in an Oak-Pine Forest on the Cumberland Plateau, KY. J. Torrey Bot. Soc. 2003, 130, 253–264. [Google Scholar] [CrossRef]
- Fan, Z.; Ma, Z.; Dey, D.C.; Roberts, S.D. Response of Advance Reproduction of Oaks and Associated Species to Repeated Prescribed Fires in Upland Oak-Hickory Forests, Missouri. For. Ecol. Manag. 2012, 266, 160–169. [Google Scholar] [CrossRef]
- Keyser, T.L.; McDaniel, V.L.; Klein, R.N.; Drees, D.G.; Burton, J.A.; Forder, M.M. Short-Term Stem Mortality of 10 Deciduous Broadleaved Species Following Prescribed Burning in Upland Forests of the Southern US. Int. J. Wildland Fire 2018, 27, 42–51. [Google Scholar] [CrossRef]
- Beck, D.E. Acorns and Oak Regeneration. In Proceedings, Oak Regeneration: Serious Problems, Practical Recommendations; USDA Forest Service General Technical Report SE-84, Southeastern Forest Experiment Station: Asheville, NC, USA, 1993. [Google Scholar]
- Olson, D.F., Jr.; Boyce, S.F. Factors Affecting Acorn Production and Germination and Early Growth of Seedlings and Seedling Sprouts. In Oak Symposium Proceedings; Morgantown, W.V., Ed.; USDA Forest Service, Northeastern Forest Experiment Station: Radnor, PA, USA, 1971. [Google Scholar]
- Wang, G.G.; Van Lear, D.H.; Bauerle, W.L. Effects of Prescribed Fires on First-Year Establishment of White Oak (Quercus alba L.) Seedlings in the Upper Piedmont of South Carolina, USA. For. Ecol. Manag. 2005, 213, 328–337. [Google Scholar] [CrossRef]
- Greenberg, C.H.; Keyser, T.L.; Zarnoch, S.J.; Connor, K.; Simon, D.M.; Warburton, G.S. Acorn Viability Following Prescribed Fire in Upland Hardwood Forests. For. Ecol. Manag. 2012, 275, 79–86. [Google Scholar] [CrossRef]
- Sork, V.L.; Bramble, J.; Sexton, O. Ecology of Mast-Fruiting in Three Species of North American Deciduous Oaks. Ecology 1993, 74, 528–541. [Google Scholar] [CrossRef]
- Pile, L.S.; Waldrop, T.A. Shortleaf Pine and Mixed Hardwood Stands: Thirty-Four Years After Regeneration with the Fell-and-Burn Technique in the Southern Appalachian Mountains; USDA Forest Service Research Paper SRS-56; Southern Research Station: Asheville, NC, USA, 2016.
- Arthur, M.A.; Paratley, R.D.; Blankenship, B.A. Single and Repeated Fires Affect Survival and Regeneration of Woody and Herbaceous Species in an Oak-Pine Forest. J. Torrey Bot. Soc. 1998, 125, 225–236. [Google Scholar] [CrossRef]
- Blankenship, B.A.; Arthur, M.A. Prescribed Fire Affects Eastern White Pine Recruitment and Survival on Eastern Kentucky Ridgetops. J. Appl. For. 1999, 23, 144–150. [Google Scholar]
- Elliott, K.J.; Vose, J.M.; Clinton, B.D. Growth of Eastern White Pine (Pinus strobus L.) Related to Forest Floor Consumption by Prescribed Fire in the Southern Appalachians. South. J. Appl. For. 2002, 26, 18–25. [Google Scholar]
- Graber, R.E. Germination of Eastern White Pine Seed as Influenced by Stratification; USDA Forest Service Research Paper NE-36; Northeastern Forest Experiment Station: Upper Darby, PA, USA, 1965.
- Wendel, G.W.; Smith, H.C. Pinus strobus L. White Pine. In Silvics of North America, Volume 1 Conifers; United States Department of Agriculture: Washington, DC, USA, 1990. [Google Scholar]
- Elliott, K.J.; Vose, J.M. Effects of Understory Prescribed Burning on Shortleaf Pine (Pinus echinata Mill.)/Mixed-Hardwood Forests. J. Torrey Bot. Soc. 2005, 132, 236–251. [Google Scholar] [CrossRef]
- Jenkins, M.A.; Klein, R.N.; McDaniel, V.L. Yellow Pine Regeneration as a Function of Fire Severity and Post-Burn Stand Structure in the Southern Appalachian Mountains. For. Ecol. Manag. 2011, 262, 681–691. [Google Scholar] [CrossRef]
- Drews, M.J.; Fredericksen, T.S. The Effect of Experimental Prescribed Fire on White Pine Regeneration. Open For. Sci. J. 2013, 6, 31–35. [Google Scholar] [CrossRef]
- Vose, J.M.; Swank, W.T.; Clinton, B.D.; Hendrick, R.L.; Major, A.E. Using Fire to Restore Pine/Hardwood Ecosystems in the Southern Appalachians of North Carolina. In Proceedings of the Fire Effects on Rare and Endangered Species and Habitats. International Association of Wildland Fire, Fairfield, WA, USA, 13–16 November 1995. [Google Scholar]
- Waldrop, T.A.; Brose, P.H. A Comparison of Fire Intensity Levels for Stand Replacement of Table Mountain Pine (Pinus pungens Lamb.). For. Ecol. Manag. 1999, 113, 155–166. [Google Scholar] [CrossRef]
- Reilly, M.J.; Outcalt, K.; O’Brien, J.J.; Wade, D. Effects of Repeated Growing Season Prescribed Fire on the Structure and Composition of Pine-Hardwood Forests in the Southeastern Piedmont, USA. Forests 2017, 8, 8. [Google Scholar] [CrossRef]
- Phillips, R.J.; Waldrop, T.A.; Simon, D.M. Third-Year Responses of Understory Woody Regeneration to Fuel Reduction Treatments in the Southern Appalachian Mountains. In Proceedings of the 14th Biennial Southern Silvicultural Research Conference; Asheville, NC, USA, 5–7 March 2010, Stanturf, J.A., Ed.; USDA Forest Service General Technical Report SRS-GTR-121; Southern Research Station: Asheville, NC, USA, 2010; pp. 289–293. [Google Scholar]
- Iverson, L.R.; Hutchinson, T.F.; Peters, M.P.; Yaussy, D.A. Long-Term Response of Oak-Hickory Regeneration to Partial Harvest and Repeated Fires: Influence of Light and Moisture. Ecosphere 2017, 8, 1–24. [Google Scholar] [CrossRef]
- Elliott, K.J.; Hendrick, R.L.; Major, A.E.; Vose, J.M.; Swank, W.T. Vegetation Dynamics After a Prescribed Fire in the Southern Appalachians. For. Ecol. Manag. 1999, 114, 199–213. [Google Scholar] [CrossRef]
- Hutchinson, T.F.; Sutherland, E.K.; Yaussy, D.A. Effects of Repeated Prescribed Fires on the Structure, Composition, and Regeneration of Mixed-Oak Forests in Ohio. For. Ecol. Manag. 2005, 218, 210–228. [Google Scholar] [CrossRef]
- Hammond, D.H.; Varner, J.M.; Kush, J.S.; Fan, Z. Contrasting Sapling Bark Allocation of Five Southeastern USA Hardwood Tree Species in a Fire Prone Ecosystem. Ecosphere 2015, 6, 112. [Google Scholar] [CrossRef]
- Willson, K.G.; Barefoot, C.R.; Hart, J.L.; Schweitzer, C.J.; Dey, D.C. Temporal Patterns of Ground Flora Response to Fire in Thinned Pinus-Quercus Stands. Can. J. For. Res. 2018, 48, 1171–1183. [Google Scholar] [CrossRef]
- Barefoot, C.R.; Willson, K.G.; Hart, J.L.; Schweitzer, C.J.; Dey, D.C. Effects of Thinning and Prescribed Fire Frequency on Ground Flora in Mixed Pinus-Hardwood Stands. For. Ecol. Manag. 2019, 432, 729–740. [Google Scholar] [CrossRef]
- McGinty, D.T. The Ecological Roles of Kalmia latifolia L. and Rhododendron maximum L. in the Hardwood Forests at Coweeta. Master’s Thesis, University of Georgia, Athens, GA, USA, 1972. [Google Scholar]
- Zenner, E.K.; Kabrick, J.M.; Jensen, R.G.; Peck, J.E.; Grabner, J.K. Responses of Ground Flora to a Gradient of Harvest Intensity in the Missouri Ozarks. For. Ecol. Manag. 2006, 222, 326–334. [Google Scholar] [CrossRef]
- Hille Ris Lambers, J.; Clark, J.S.; Lavine, M. Implications of Seed Banking for Recruitment of Southern Appalachian Woody Species. Ecology 2005, 86, 85–95. [Google Scholar] [CrossRef]
- Shiffman, P.M.; Johnson, W.C. Sparse Buried Seed Bank in a Southern Appalachian Oak Forest: Implications for succession. Am. Nat. 1992, 127, 258–267. [Google Scholar] [CrossRef]
- Boerner, R.E.J.; Brinkman, J.A.; Yaussy, D.A. Ecosystem Restoration Treatments Affect Soil Physical and Chemical Properties in Appalachian Mixed-Oak Forests; USDA Forest Service e-General Technical Report SRS-101; Southern Research Station: Asheville, NC, USA, 2007.
- Waldrop, T.A.; Brudnak, L.; Rideout-Hanzak, S. Fuels on Disturbed and Undisturbed Sites in the Southern Appalachian Mountains, USA. Can. J. For. Res. 2007, 37, 1134–1141. [Google Scholar] [CrossRef]
- Ducey, M.J.; Moser, W.K.; Ashton, P.M. Effect of Fire Intensity on Understory Competition and Diversity in a Kalmia-Dominated Oak Forest, New England, USA. Vegetatio 1996, 123, 81–90. [Google Scholar] [CrossRef]


| Treatment | Number of Applications | Months | Years of Applications |
|---|---|---|---|
| Prescribed burn (B) | 4 | February–March | 2003, 2006, 2012, 2015 |
| Mechanical fuel reduction (M) | 2 | November–March | 2001–2002, 2011–2012 |
| Prescribed burn and mechanical fuel reduction (MB) | 4 (B), 2 (M) | November–March | 2001–2002 (M), 2003 (B), 2006 (B), 2011–2012 (M), 2012 (B), and 2015 (B) |
| Vegetation Type | Vegetation Guild | Variable | Data collected | Measurement | Units |
|---|---|---|---|---|---|
| Woody | Oaks | Stem density | Individual count | 1 count per stem | Avg stems/ha |
| Pines | Stem height | Category | <10, 10 – 50, or >50 cm | Avg stems/ha | |
| Mesic Hardwoods | Absolute cover | Cover class1 | 1, 2, 3, 4, 5, 6 | Avg % | |
| Non-woody | Shrubs | Absolute cover | Cover class1 | 1, 2, 3, 4, 5, 6 | Avg % |
| Graminoids | |||||
| Forbs |
| Secondary Vegetation Guild or Species | Treatment | Stems/ha in 2001 | Stems/ha in 2016 | Change in Stems (avg/ha) | |
| White oaks (F3114 = 2.8, p = 0.04) | C | 2500.0 | 14,550.0 | 12,050.0 (± 16,518.0) | ab |
| B | 1633.3 | 14,983.3 | 13,350.0 (± 11,827.9) | b | |
| M | 1750.0 | 8333.3 | 6583.3 (± 8381.1) | a | |
| MB | 2466.7 | 15,083.3 | 12,616.7 (± 12,792.6) | ab | |
| Red oaks (F3,116 = 12.5, p < 0.01) | C | 2400.0 | 4183.3 | 1835.0 (± 2100.0) | a |
| B | 3466.7 | 11,816.7 | 8359.0 (± 7050.0) | bc | |
| M | 3033.3 | 7600.0 | 4565.0 (± 3450.0) | b | |
| MB | 3783.3 | 14,566.7 | 10,785.0 (± 6450.0) | c | |
| Yellow pines (F3114 = 10.3, p < 0.01) | C | 0.0 | 16.7 | 16.7 (± 91.3) | a |
| B | 50.0 | 766.7 | 716.7 (± 1243.5) | b | |
| M | 16.7 | 66.7 | 50.0 (± 201.3) | a | |
| MB | 0.0 | 900.0 | 900.0 (± 2127.0) | b | |
| Eastern white pines (F3116 = 2.0, p = 0.12) | C | 0.0 | 33.3 | 33.3 (± 126.9) | |
| B | 116.7 | 50.0 | −66.7 (± 340.7) | ||
| M | 66.7 | 150.0 | 83.3 (± 437.1) | ||
| MB | 50.0 | 0.0 | −50.0 (± 152.6) | ||
| Red maple (Acer rubrum) (F3114 = 18.1, p < 0.01) | C | 9866.7 | 10,016.7 | 150.0 (± 8273.5) | a |
| B | 13,766.7 | 34,416.7 | 20,650.0 (± 25,490.4) | c | |
| M | 4550.0 | 10,850.0 | 6300.0 (± 9201.4) | b | |
| MB | 8616.7 | 9633.3 | 1016.7 (± 7082.6) | a | |
| Yellow-poplar (Liriodendron tulipifera) (F3114 = 9.5, p < 0.01) | C | 650.0 | 583.3 | −83.3 (± 558.4) | a |
| B | 1050.0 | 5033.3 | 1566.7 (± 2718.8) | b | |
| M | 333.3 | 433.3 | 200.0 (± 783.5) | a | |
| MB | 400.0 | 2550.0 | 2100.0 (± 3521.9) | b | |
| Blackgum (Nyssa sylvatica) (F3116 = 10.0, p < 0.01) | C | 233.3 | 750.0 | 448.5 (± 720.2) | a |
| B | 1183.3 | 4666.7 | 1472.1 (± 1984.8) | a | |
| M | 466.7 | 750.0 | 288.8 (± 805.2) | a | |
| MB | 350.0 | 3633.3 | 3505.5 (± 3531.8) | b | |
| Black birch (Betula lenta) (F3116 = 0.5, p = 0.66) | C | 0.0 | 33.3 | 33.3 (± 126.9) | |
| B | 0.0 | 150.0 | 133.3 (± 730.3) | ||
| M | 0.0 | 0.0 | 0.0 (± 0.0) | ||
| MB | 0.0 | 16.7 | 16.7 (± 91.3) | ||
| American beech (Fagus grandifolia) (F3114.9 = 1.0, p = 0.40) | C | 0.0 | 0.0 | 0.0 (± 0.0) | |
| B | 16.7 | 50.0 | 0.0 (± 0.0) | ||
| M | 16.7 | 16.7 | 0.0 (± 0.0) | ||
| MB | 0.0 | 33.3 | 33.3 (± 182.6) | ||
| Black cherry (Prunus serotina) (F3116 = 1.1, p = 0.34) | C | 266.7 | 250.0 | −17.2 (± 608.6) | |
| B | 433.3 | 850.0 | 230.3 (± 817.2) | ||
| M | 200.0 | 83.3 | −86.4 (± 373.3) | ||
| MB | 166.7 | 266.7 | 63.6 (± 468.6) | ||
| Secondary Vegetation Guild or Species | Treatment | Absolute Cover (%) | Absolute Cover % | Change in Absolute Cover (avg %) | |
| Mountain laurel (Kalmia latifolia) & Rhododendron spp. (F3114 = 7.3, p < 0.01) | C | 16.0 | 18.3 | 2.3 (± 12.0) | a |
| B | 15.0 | 11.8 | −3.1 (± 9.7) | a | |
| M | 15.8 | 25.8 | 10.0 (± 12.5) | b | |
| MB | 15.0 | 15.4 | 0.4 (± 12.0) | a | |
| Other ericaceous shrubs (F3114 = 1.6, p = 0.19) | C | 11.9 | 8.6 | −3.3 (± 7.9) | |
| B | 10.1 | 10.1 | 0.0 (± 7.1) | ||
| M | 11.7 | 12.3 | 0.6 (± 6.4) | ||
| MB | 14.1 | 15.1 | 1.0 (± 8.5) | ||
| Non-ericaceous shrubs (F3114 = 3.1, p = 0.03) | C | 5.6 | 4.4 | −1.2 (± 8.2) | a |
| B | 5.9 | 9.1 | 3.2 (± 8.3) | ab | |
| M | 2.8 | 6.2 | 3.4 (± 12.8) | ab | |
| MB | 7.6 | 13.0 | 5.4 (± 12.1) | b | |
| Annual grasses (F3114 = 0.5, p = 0.69) | C | 0.0 | 0.0 | 0.0 (± 0.1) | |
| B | 0.0 | 0.0 | 0.0 (± 0.0) | ||
| M | 0.0 | 0.6 | 0.6 (± 3.3) | ||
| MB | 0.0 | 0.2 | 0.2 (± 1.0) | ||
| Perennial grasses (F3114 = 31.6, p < 0.01) | C | 1.7 | 3.2 | 1.5 (± 7.4) | a |
| B | 0.7 | 2.4 | 1.7 (± 2.5) | b | |
| M | 0.7 | 0.7 | 0.0 (± 1.9) | a | |
| MB | 0.9 | 3.6 | 2.7 (± 2.7) | c | |
| Sedges (F3116 = 15.4, p < 0.01) | C | 0.4 | 0.2 | −0.2 (± 1.0) | a |
| B | 0.6 | 1.9 | 1.3 (± 2.5) | b | |
| M | 0.7 | 1.0 | 0.3 (± 1.7) | a | |
| MB | 0.5 | 3.0 | 2.5 (± 3.8) | b | |
| Nitrogen-fixing forbs (F3114 = 6.0, p < 0.01) | C | 0.8 | 1.0 | 0.1 (± 2.5) | a |
| B | 0.0 | 0.7 | 0.7 (± 1.7) | a | |
| M | 0.0 | 1.4 | 1.4 (± 3.6) | a | |
| MB | 0.0 | 1.5 | 1.5 (± 2.4) | b | |
| Non-nitrogen-fixing forbs (F3116 = 9.1, p < 0.01) | C | 3.9 | 3.4 | −0.6 (± 2.8) | a |
| B | 3.1 | 4.3 | 1.2 (± 3.1) | bc | |
| M | 3.6 | 3.7 | 0.2 (± 3.7) | ab | |
| MB | 4.3 | 5.7 | 1.3 (± 4.2) | c | |
| Ferns (F3114 = 1.9, p = 0.12) | C | 4.0 | 0.8 | −3.2 (± 8.7) | |
| B | 1.6 | 1.7 | 0.1 (± 4.1) | ||
| M | 1.0 | 1.7 | 0.5 (± 3.2) | ||
| MB | 2.2 | 3.4 | 1.4 (± 6.7) | ||
© 2019 by the authors. Licensee MDPI, Basel, Switzerland. This article is an open access article distributed under the terms and conditions of the Creative Commons Attribution (CC BY) license (http://creativecommons.org/licenses/by/4.0/).
Share and Cite
Oakman, E.C.; Hagan, D.L.; Waldrop, T.A.; Barrett, K. Understory Vegetation Responses to 15 Years of Repeated Fuel Reduction Treatments in the Southern Appalachian Mountains, USA. Forests 2019, 10, 350. https://0-doi-org.brum.beds.ac.uk/10.3390/f10040350
Oakman EC, Hagan DL, Waldrop TA, Barrett K. Understory Vegetation Responses to 15 Years of Repeated Fuel Reduction Treatments in the Southern Appalachian Mountains, USA. Forests. 2019; 10(4):350. https://0-doi-org.brum.beds.ac.uk/10.3390/f10040350
Chicago/Turabian StyleOakman, Emily C., Donald L. Hagan, Thomas A. Waldrop, and Kyle Barrett. 2019. "Understory Vegetation Responses to 15 Years of Repeated Fuel Reduction Treatments in the Southern Appalachian Mountains, USA" Forests 10, no. 4: 350. https://0-doi-org.brum.beds.ac.uk/10.3390/f10040350