Article

Analyzing Visitors’ Preferences and Evaluation of Satisfaction Based on Different Attributes, with Forest Trails in the Akasawa National Recreational Forest, Central Japan

College of Forestry, Shenyang Agriculture University, 120 Donglin Road, Shenhe District, Shenyang 110866, China
*
Author to whom correspondence should be addressed.
Submission received: 26 April 2019 / Revised: 13 May 2019 / Accepted: 16 May 2019 / Published: 19 May 2019
(This article belongs to the Special Issue Forest Landscape Management: From Data to Decision)

Abstract

:
For forest park managers and designers, it is very important to provide forest trails and high–quality forest landscapes that meet visitor’s needs. In this study, based on demographic characteristics, our main purpose is to analyze whether the preferences of visitors for different trails differ, and to discuss whether forest park visitors’ satisfaction is affected when preferences for choosing trails change, mainly in order to improve knowledge about visitors’ needs for forest walking spaces. Through this analysis, we can aid in the planning and management of forest parks to improve visitors’ experiences. We mainly consider five attributes, namely, sex, age, number of visitors, number of visits and duration of stay in the park, in a questionnaire, and use the Kruskal–Wallis Test and Mann–Whitney U Test to analyze multigroup data in “SPSS for Windows”. The results are as follows: (1) Visitors with different attributes exhibit significant differences in terms of their choices of forest trails and the evaluation of visitor satisfaction in the duration of stay. (2) The correlation analysis showed that trail condition factors, such as the degree of difficulty and facility status, affect the satisfaction evaluation of tourists on many levels. In addition, the number of visits by visitors is negatively correlated with the preference for a forest trail based on recreational indicators. (3) Compared to visitors who stay in the forest for a short amount of time, visitors who remain in the forest for longer have a higher satisfaction level. Based on these results, we recommend that parks consider the number of visits (visiting experience) and the duration of stays in the forest when planning walking routes to more effectively plan forest park trails.

1. Introduction

In traditional forestry, the value of forests is mainly reflected in the economic benefits from the direct use of wood. However, in recent decades, people’s understanding of and demand for forests have undergone subtle changes [1]. The health and fitness function, recreational value, and landscape appreciation gained from forest visits have attracted increasing attention [2,3,4,5]. Consequently, more people are enjoying forest tourism in their spare time [6,7,8,9,10,11].
Previous studies have shown that walking in a forest can alleviate stress caused by personal work or activities, and the decompression effect caused by different forest conditions also changes stress levels [12,13,14,15]. In addition, a forest can contribute to recovery from health conditions [16]. For example, patients who can see trees have shorter recovery periods than those who cannot [17].
According to the results of the 2018 editorial survey conducted by the Cabinet Office of Japan, people living in cities prefer to be close to the forest, and there is an increasing demand for closeness to nature among the 20–50-year-old age group [18]. Furthermore, increasing numbers of people in developed European countries are spending their leisure time in forests [19].
Forest tourism can not only protect natural resources but also result in forests that provide better economic benefits [19,20]. In Japan, local governments in some rural and suburban areas have been able to take advantage of this increasing interest in recreational activities to revitalize the regional economy [20]. In addition, according to the statistics of the State Forestry Administration of China, during the 2018 Spring Festival holiday (February 15th–21st), the number of tourists in the country visiting forests exceeded 75.3 million, an increase of 21.8%. In 2016 and 2017, this number was 48.1 million and 61.8 million, respectively [21]. Therefore, this type of green tourism is increasingly valued by governments around the world. Over the period from 1989–2000, 3,708 forest recreational sites have been established in economically developed Japan; in China, by the end of 2015, a total of 826 national forest parks had been established, covering an area of 10,845,491.71 hectares [20,21]. Thus, the global forest tourism industry is receiving increasing attention from governments worldwide, and the number of forest parks is increasing.
With the increase in demand for forest tourism and for forest recreational space, the demand for spatial planning technology is also increasing [20]. However, our knowledge and technology related to the planning and management of forest recreation facilities still need be improved [1]. Investigations regarding forest recreation can improve the planning and management of forest resources [1], especially with respect to forest landscapes, which are among the most important components of forest recreation [20]. Effective trail planning and aesthetic landscape design play an important role in improving the attractiveness of forest parks [20] while supporting forest recreation, such as by mitigating conflicts between users and improving the profitability of operators [1]. Therefore, providing more visitors with forest trails to meet their needs is a very important issue for forest managers and planners.
Furthermore, visitors to a forest park are often diverse, including students, company staff, seniors, and young people, and the purposes of their visits vary. These visitors inevitably come together in forest parks. Therefore, landscape planners must balance the landscape needs and preferences of different groups of people and combine landscape resources with the needs of visitors when planning a forest. To effectively navigate this issue, landscape planners must understand the current status of landscape resources before planning and designing a forest area. At the same time, it is necessary to investigate the needs, landscape preferences, and overall evaluations of different visitors. Through these investigations, planners can determine the preferences and needs of different visitors to a forest area [22].
In earlier studies, based on expert assessments, quantitative methods for examining the visual and physical characteristics of landscapes have been widely used to assess the forest landscape quality [23,24]. However, this method is insufficiently reliable because of its overreliance on experts or professionals, who have only their own knowledge and experience [25]. As people spend more time on forest recreation, visitors have become the main users of forest landscapes. Therefore, visitors have become the subject of forest–landscape perception assessment methods [26,27,28,29]. Daniel [25] noted that a user–based perception evaluation is more reliable than an expert–based evaluation.
In reality, visitors to forest parks are numerous and complex, and some authors believe that visitors’ backgrounds will give rise to different landscape preferences [30,31]. To clarify the preferences of different visitors for forest landscapes, researchers have begun to focus on the landscape preferences and behavioral characteristics of visitors with different attributes [20,32,33,34,35,36,37,38,39,40,41,42,43,44,45,46,47,48]. Most of these studies have focused on the visual experiences of tourists [49], but they have often overlooked the question of whether a visitor’s route to an attraction was reasonable or whether that visitor chose a walking route to the attraction based on visitors’ selection preferences.
Understanding visitors’ preferences for resource conditions (e.g., path conditions), social conditions (e.g., visitor behavior) and managerial conditions (e.g., vegetation and waste management) of a natural environment is valuable for designing effective landscape management strategies [50].
To address this problem, Chiou, Tomczyk and other researchers [51,52,53,54,55] used geographic information systems (GIS) software to study the rationality and suitability of trails under different forest conditions from the perspective of the spatial physical conditions of a forest. Their studies provided a basic program for the optimization of trails.
In addition, Reichhart and Arnberger [50] concluded that tourists’ subjective preference evaluations of walking trails can be divided into recreational facilities and surrounding landscapes [50]. Researchers such as Pena and Sever [11,56,57,58,59] examined the characteristics of forest trails, from the perspective of environmental behavior and environmental psychology, to clarify walkers’ preferences for different forest trails. Moreover, Sever and Verbic [58] noted that survey results demonstrated that visitors’ nonvisual experiences of nature (fresh air and scenic landscapes) are more important than visual experiences in their preferences for recreational routes. Careful planning of trails and car lanes, trees and shrubs in the trail environment, water resources and hills or curves that limit the landscape help to increase visitors’ preferences for trails, while artificial factors also influence preferences for trails [60,61,62,63,64]. In contrast, boring or monotonous routes, unsafe or overly wild conditions and overgrown trails are unappreciated by visitors [63,65,66,67].
As noted above, visitors to forest parks are numerous and diverse, and their preferences for walking paths are varied. However, the preferences for forest trails of visitors with different attributes have not been adequately studied.
A trail is an important landscape corridor in a forest park and plays a role in organizing the landscape space. Well-designed forest trails can enable visitors to enjoy a forest landscape more thoroughly than can poorly-designed trails. For the designer of a forest park, the design work must consider the needs of visitors with different characteristics and meet the needs of people with different attributes.
Therefore, the purpose of this study is to clarify, from the perspective of visitors’ diverse demographic characteristics, the differences in visitors’ preferences for trail attributes and their evaluation of overall satisfaction with their experiences. Specifically, we aim to study the relation between the choice of a given trail and visitor satisfaction.
The details are as follows:
(1)
Analyze whether preferences change when the demographic characteristics of the visitors change;
(2)
Analyze whether different sex, ages, durations of stay, numbers of visitors and numbers of visits, affect the satisfaction of visitors;
(3)
Clarify the relation between the choice of forest trail and visitor satisfaction.
Our research is carried out in the Akasawa Nature Reserve with 8 trails, namely, the Fureainomichi, Komadori, Mukaiyama, Tsumetazawa, Nakatachi, Kamiakasawa, Keiryu and Himemiya trails.
This paper is structured as follows:
(1)
Section one is the introduction presents the paper’s topic and research aims;
(2)
Section two is the methods which include the investigation methods and analysis methods;
(3)
Section three discusses the data in terms of five aspects, namely, sex, age, number of visitors, number of visits and duration of stay, and draws conclusions;
(4)
Section four presents the differences in the preferences and satisfaction of visitors with different attributes regarding forest trails;
(5)
Section five stated the main results and provides recommendations.

2. Materials and Methods

2.1. Study Area

This study took place in Akasawa National Recreational Forest, west of Ue Matsumachi, Muzen District, Nagano Prefecture, Japan. The forest area is approximately 720 ha, and the altitude is 1080–1557 m. This area is considered one of the three most beautiful forests in Japan, and its landscape elements include Chamaecyparis obtusa, which has an average age of 300–350 years, mountain streams, forest terrain and approximately 1200 species of vegetated landscapes. The park is known as “the birthplace of forest bathing”; in addition, it was named one of the “100 Best Heritage Sites in Japan in the 21st Century” by the Forest Culture Association. The park was certified as the “No. 1 Base for Forest Therapy” by the Forest Therapy Society in 2006. The Akasawa National Recreational Forest has a forest railway running along a canyon and has 8 hiking trails (Figure 1), and it has the largest number Forest Therapy Society in Japan with forest trails, which receives 140,000 visitors a year [68]. Therefore, we believe that the Akasawa National Recreational Forest is an ideal research area for this project.

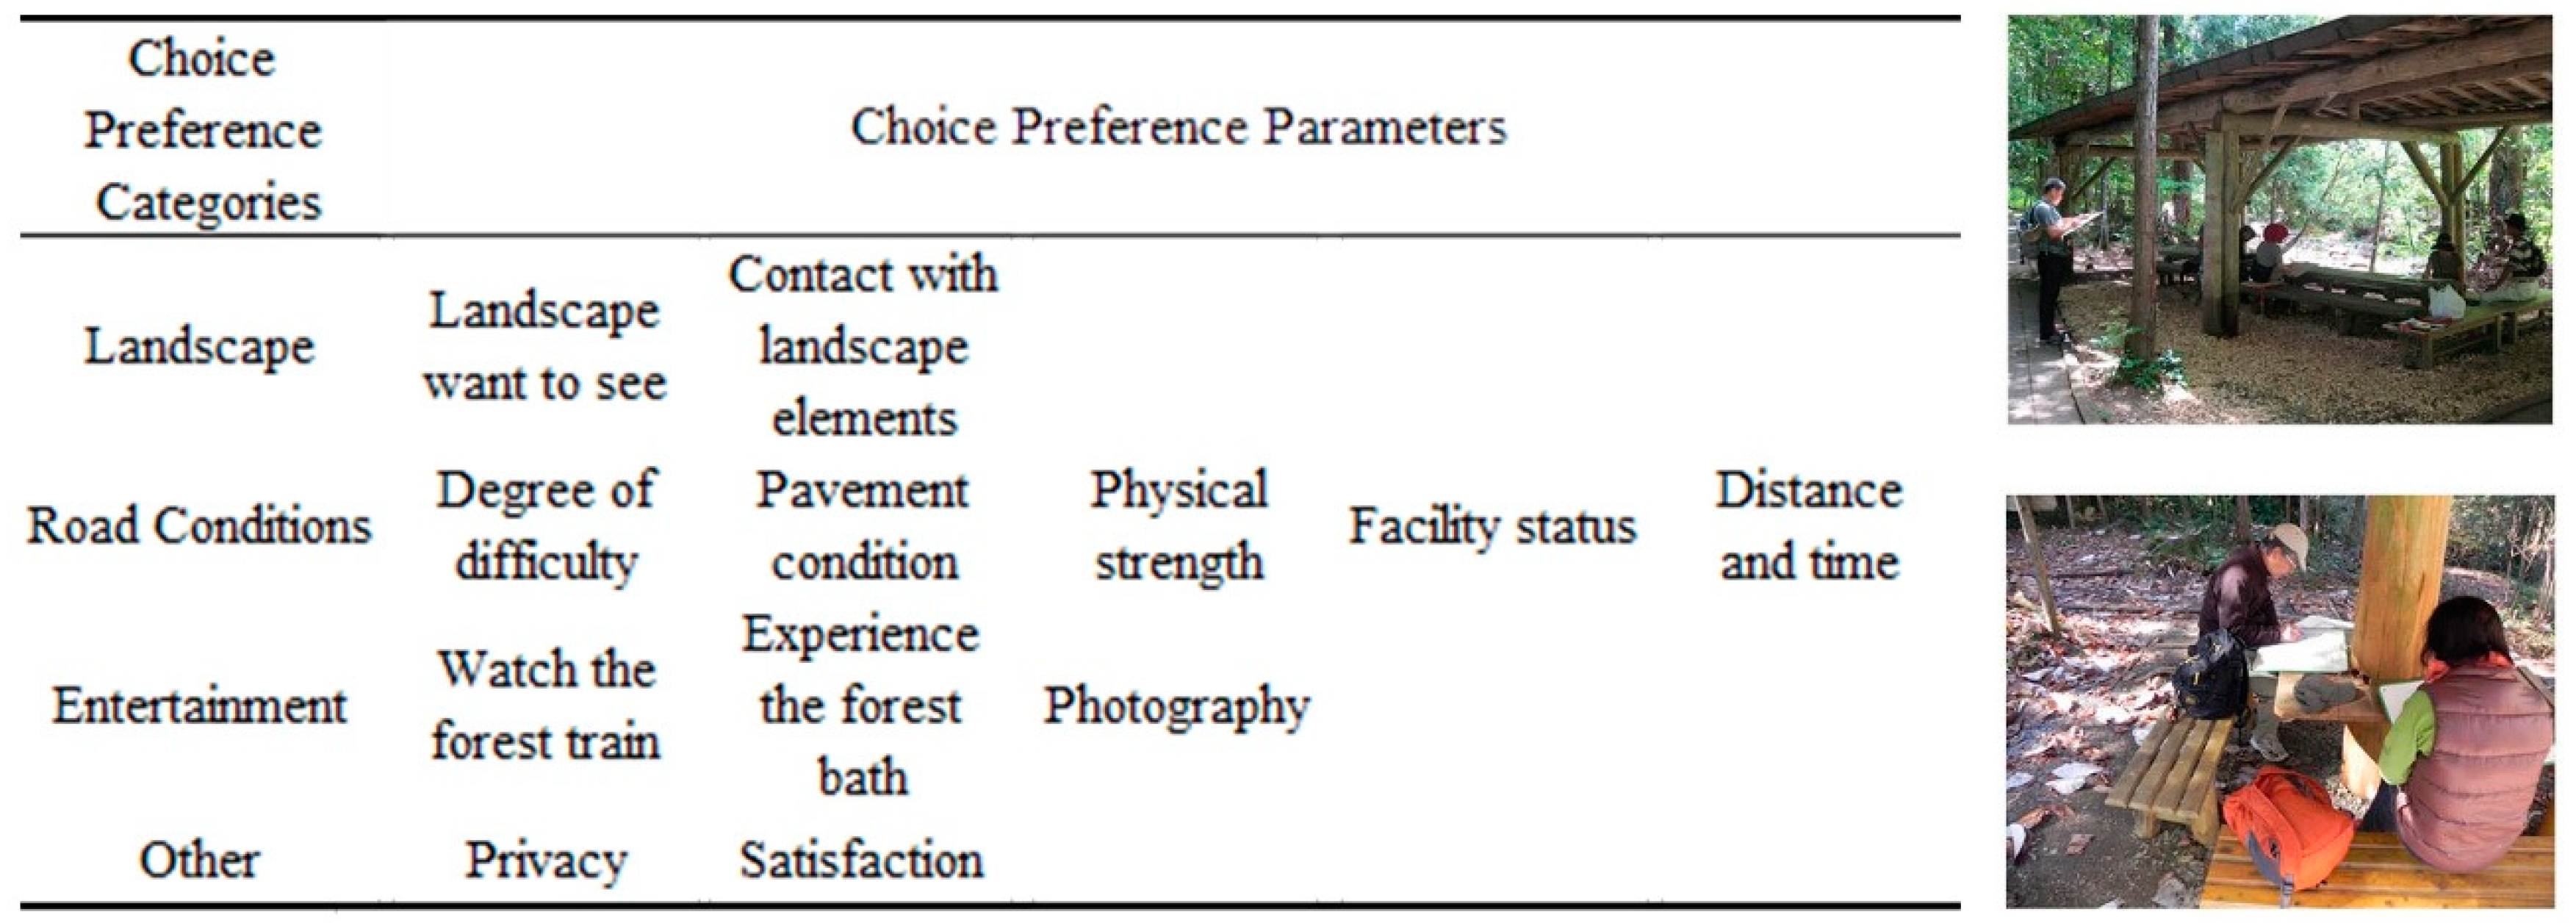
2.2. Selection of Preference Indicators

The differences in the ecological and environmental characteristics of forests are the primary factors that affect visitor preferences [20,23,24,25,26,27,28,29,55,56,57,58]. In the selection of preference indicators, to maintain continuity with previous research, we mainly selected the indicators of the spatial evaluation of visitors investigated in a previous survey [11] and the evaluation indicators used in the previous studies because these indicators are universal and the evaluation system is relatively stable [48,49,50,51,52,53,54,55,56,57,58]. Accordingly, we ultimately chose 4 aspects, namely, the trail conditions, the landscape of the walking space, recreational opportunities and others (Figure 2).
The first set of questions is mainly based on the landscape of the space and addresses the issue of whether there is a landscape to be appreciated and whether there are plants, ancient trees, streams and other landscape elements with which one desires contact. The purpose of these questions is to understand the preferences of different visitors related to the forest landscape. The second set of questions relates to the actual condition of the forest trail and the physical strength of the visitor, and their purpose is to understand the relationship between the trail condition and physical strength when a visitor chooses a trail. The third set of questions is designed to address the recreational value of the trail and contains questions related to the needs of visitors for artificial elements, forest bathing and photography; the purpose of these questions is to understand the relationship between the entertainment value of the space and a visitor’s choice of trail. The last set of questions involve preferences related to overall satisfaction and spatial privacy.

2.3. Investigation Methods

In this study, we presented a survey comprising 18 questions to visitors who passed through the main landscape entry points in the park. The contents of the questionnaire mainly included questions related to sex, purpose of visit, time of stay, number of visitors, walking route, route preferences and satisfaction evaluation. Among these questions, the choice of trail route by visitors was mainly based on the trail conditions, trail landscape, and recreational or entertainment value of the trails. Overall, 12 indicators in 4 groups were evaluated by visitors (Figure 2).
We quantified the 12 indicators using a 7-point Likert-type scale. The scale had two extremes, with 1, meaning “not at all preferred” or “difficult to value” and 7 meaning “very preferred” or “very important” [11,32,68,69].
From August 2013 to November 2014, when the weather was good, the research team surveyed the visitors through the park’s main landscape entry points. The team obtained 791 data points, 765 of which were valid, and the effective rate was 96.71%. The valid questionnaire included 350 male visitors, accounting for 45.75% of the total, and 415 women, accounting for 54.25%. The questionnaire was administered to visitors ranging from 10 years old to over 70 years old.

2.4. Analysis Methods

We used “SPSS 21 for Windows” to analyze the differences among visitors with different attributes and different selection preferences. Specifically, our analytical steps were as follows: (1) We used SPSS to test whether the overall data were normally distributed to determine the appropriate analysis method and differential test. (2) We used previous studies to analyze the different attributes of visitors, given that the above test results show that the data set of the survey follows a normal distribution [11,70]. We selected multiple sets of data for the Kruskal-Wallis test and the Mann–Whitney U test, which were applied to normally distributed data and non–distributed data sets, respectively [71,72,73]. (3) We used Spearman correlation analysis to analyze the relationship between different visitors’ attributes and choice preferences. (4) We analyzed and summarized the selection preferences of the different attributes and visitor routes.

2.5. Classification of Visitors with Different Attributes

According to the visitor questionnaire, we further classified the visitors based on the following attributes: sex, age, number of visits, number of visitors and duration of stay. In the sex classification, we divided visitors into males and females. Based on the age classification, we divided the visitors into those 10–20 years old, 30–40 years old, 50–60 years old and over 70 years old. The number of visits was divided into first visit, second visit and third or higher visit. The number of visitors was divided into 1 person, 2 people, 3–5 people, 6–10 people and more than 10 people. The duration of stay was divided into less than 2 h, 2–4 h, 4–6 h and more than 6 h. We analyzed visitor trail selection preferences according to these attributes.

3. Results

3.1. Visitor Purpose and Attributes

As indicated in Table 1, the purpose of visiting the forest park is to experience and observe the forest environment, with the priorities of experiencing “forest bathing” and “forest walking”, which are determined based on the direction and location of the visitors and account for more than 70% of visitors. With differences in the ages of the visitors, the number of visitors (forms), the duration of stay in the forest park, and the number of visits (experiences), the purposes of the visits also changed. People over 70 years old are similar to people 10–20 years old in that most visitors come to the forest park for “forest bathing”. People aged 30–40 and 50–60 years old are similar in that most of these visitors come to the forest park for “forest walking”. In addition, compared to groups of 6–10 visitors, single visitors tend to visit the forest park for “forest walking”, and groups of more than 10 visitors prefer to visit the forest park to engage in “forest bathing”. Groups of 2 visitors and 3–5 visitors exhibit the same trend in choosing to visit the forest park, or “forest bathing” and “forest walking”. From the perspective of duration of stay, visitors staying for 2 h or less and visitors staying all day (longer than 6 h) prefer the forest park for “forest bathing”. Visitors staying for 2–4 h or for 4–6 h mainly visit the forest park for “forest walking”. Finally, from the perspective of the number of visits, the main purpose of more frequent visitors is “forest walking”, whereas first–time visitors come for “forest bathing” and “forest walking”.

3.2. Differences in the Choices of Visitors with Different Attributes

To clarify whether visitors make different choices about trails according to different levels of attributes, we used the Kruskal–Wallis test and the Mann–Whitney U test to analyze differences in multiple sets of data (Table 2).
First, the 12 indicators, including the overall satisfaction evaluation, are different for the different attribute levels of the visitors.
Second, based on the overall satisfaction level of the interviewee, there is no difference in the satisfaction of the visitors in terms of sex, age, number of visits and number of visitors, whereas a difference exists in terms of the duration of stay. In other words, although everyone’s choice preferences are different, the final evaluation of the results is good. This result also shows that meeting the different needs of multiple visitors is very important for landscape designers.
Nevertheless, based on the results of the analysis of the visitors’ durations of stay, the three selection criteria, which are “whether there is a landscape that you want to see”, “whether you can come into contact with landscape elements such as plants, old trees, and streams”, and “walking distance and time spent”, play different roles in a visitor’s choice of trail. Visitors with different durations of stay have different preferences in terms of these three indicators, and these preferences have an obvious influence on the overall satisfaction of these visitors.

3.3. Trail Selection Preferences for Different Visitor Attributes

To clarify the characteristics of the preferences of visitors who have different attributes in terms of trail selection, we classified and analyzed the visitors with different attributes.

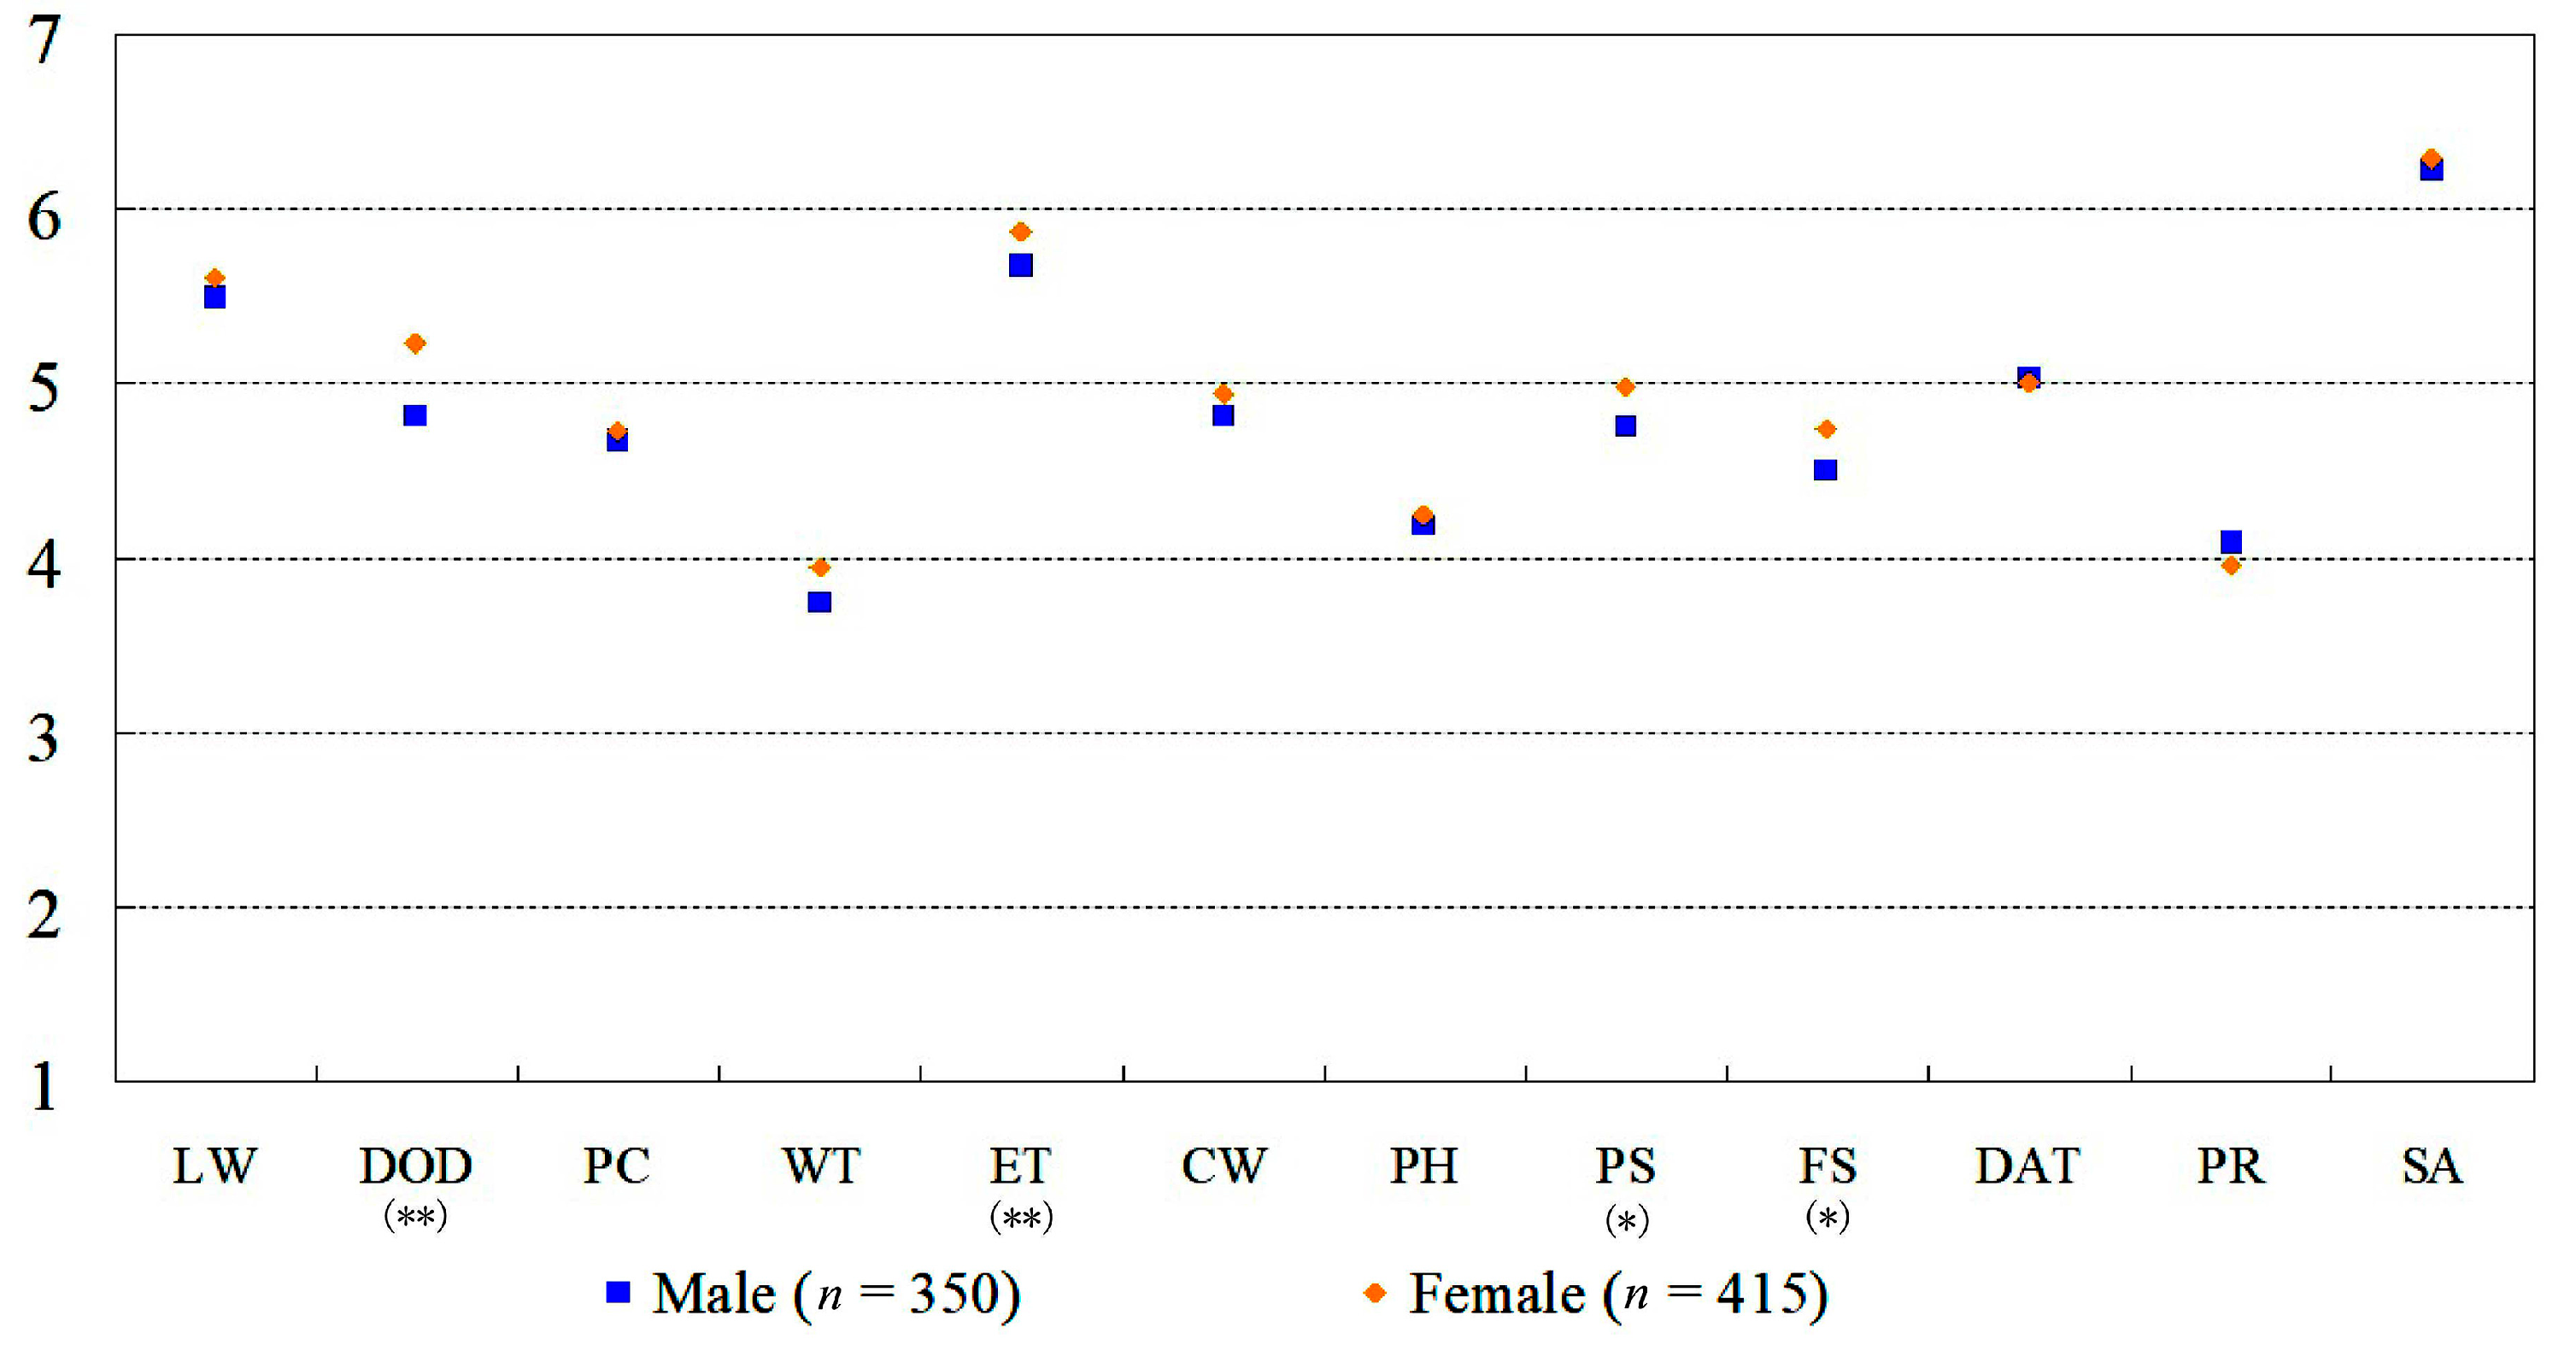
3.3.1. Choice Preferences Based on Different Sexes

From the perspective of the sex attribute overall, both male and female visitors have a strong preference for “whether they want to see the landscape” and “whether one can experience forest bathing” in their choice of trails. There is also a similar tendency in their selection trends, and women are slightly more likely than men to select a trail based on multiple indicators, like the degree of difficulty, experience of forest bathing, physical strength and facility status. In other words, a good forest landscape and a forest bathing experience with high satisfaction are the reasons that most visitors choose a trail. Female visitors pay more attention than male visitors to the elements of selecting trails, and female visitors choose trails according to their own needs (Figure 3).
From the results of the difference tests, the indicators “difficulty of the trail”, “whether one can experience forest bathing”, “physical strength”, and “whether the facilities are in good condition” reveal sex differences. That is, female visitors pay more attention than male visitors to the condition of the trail and the trail’s interestingness when selecting forest trails.

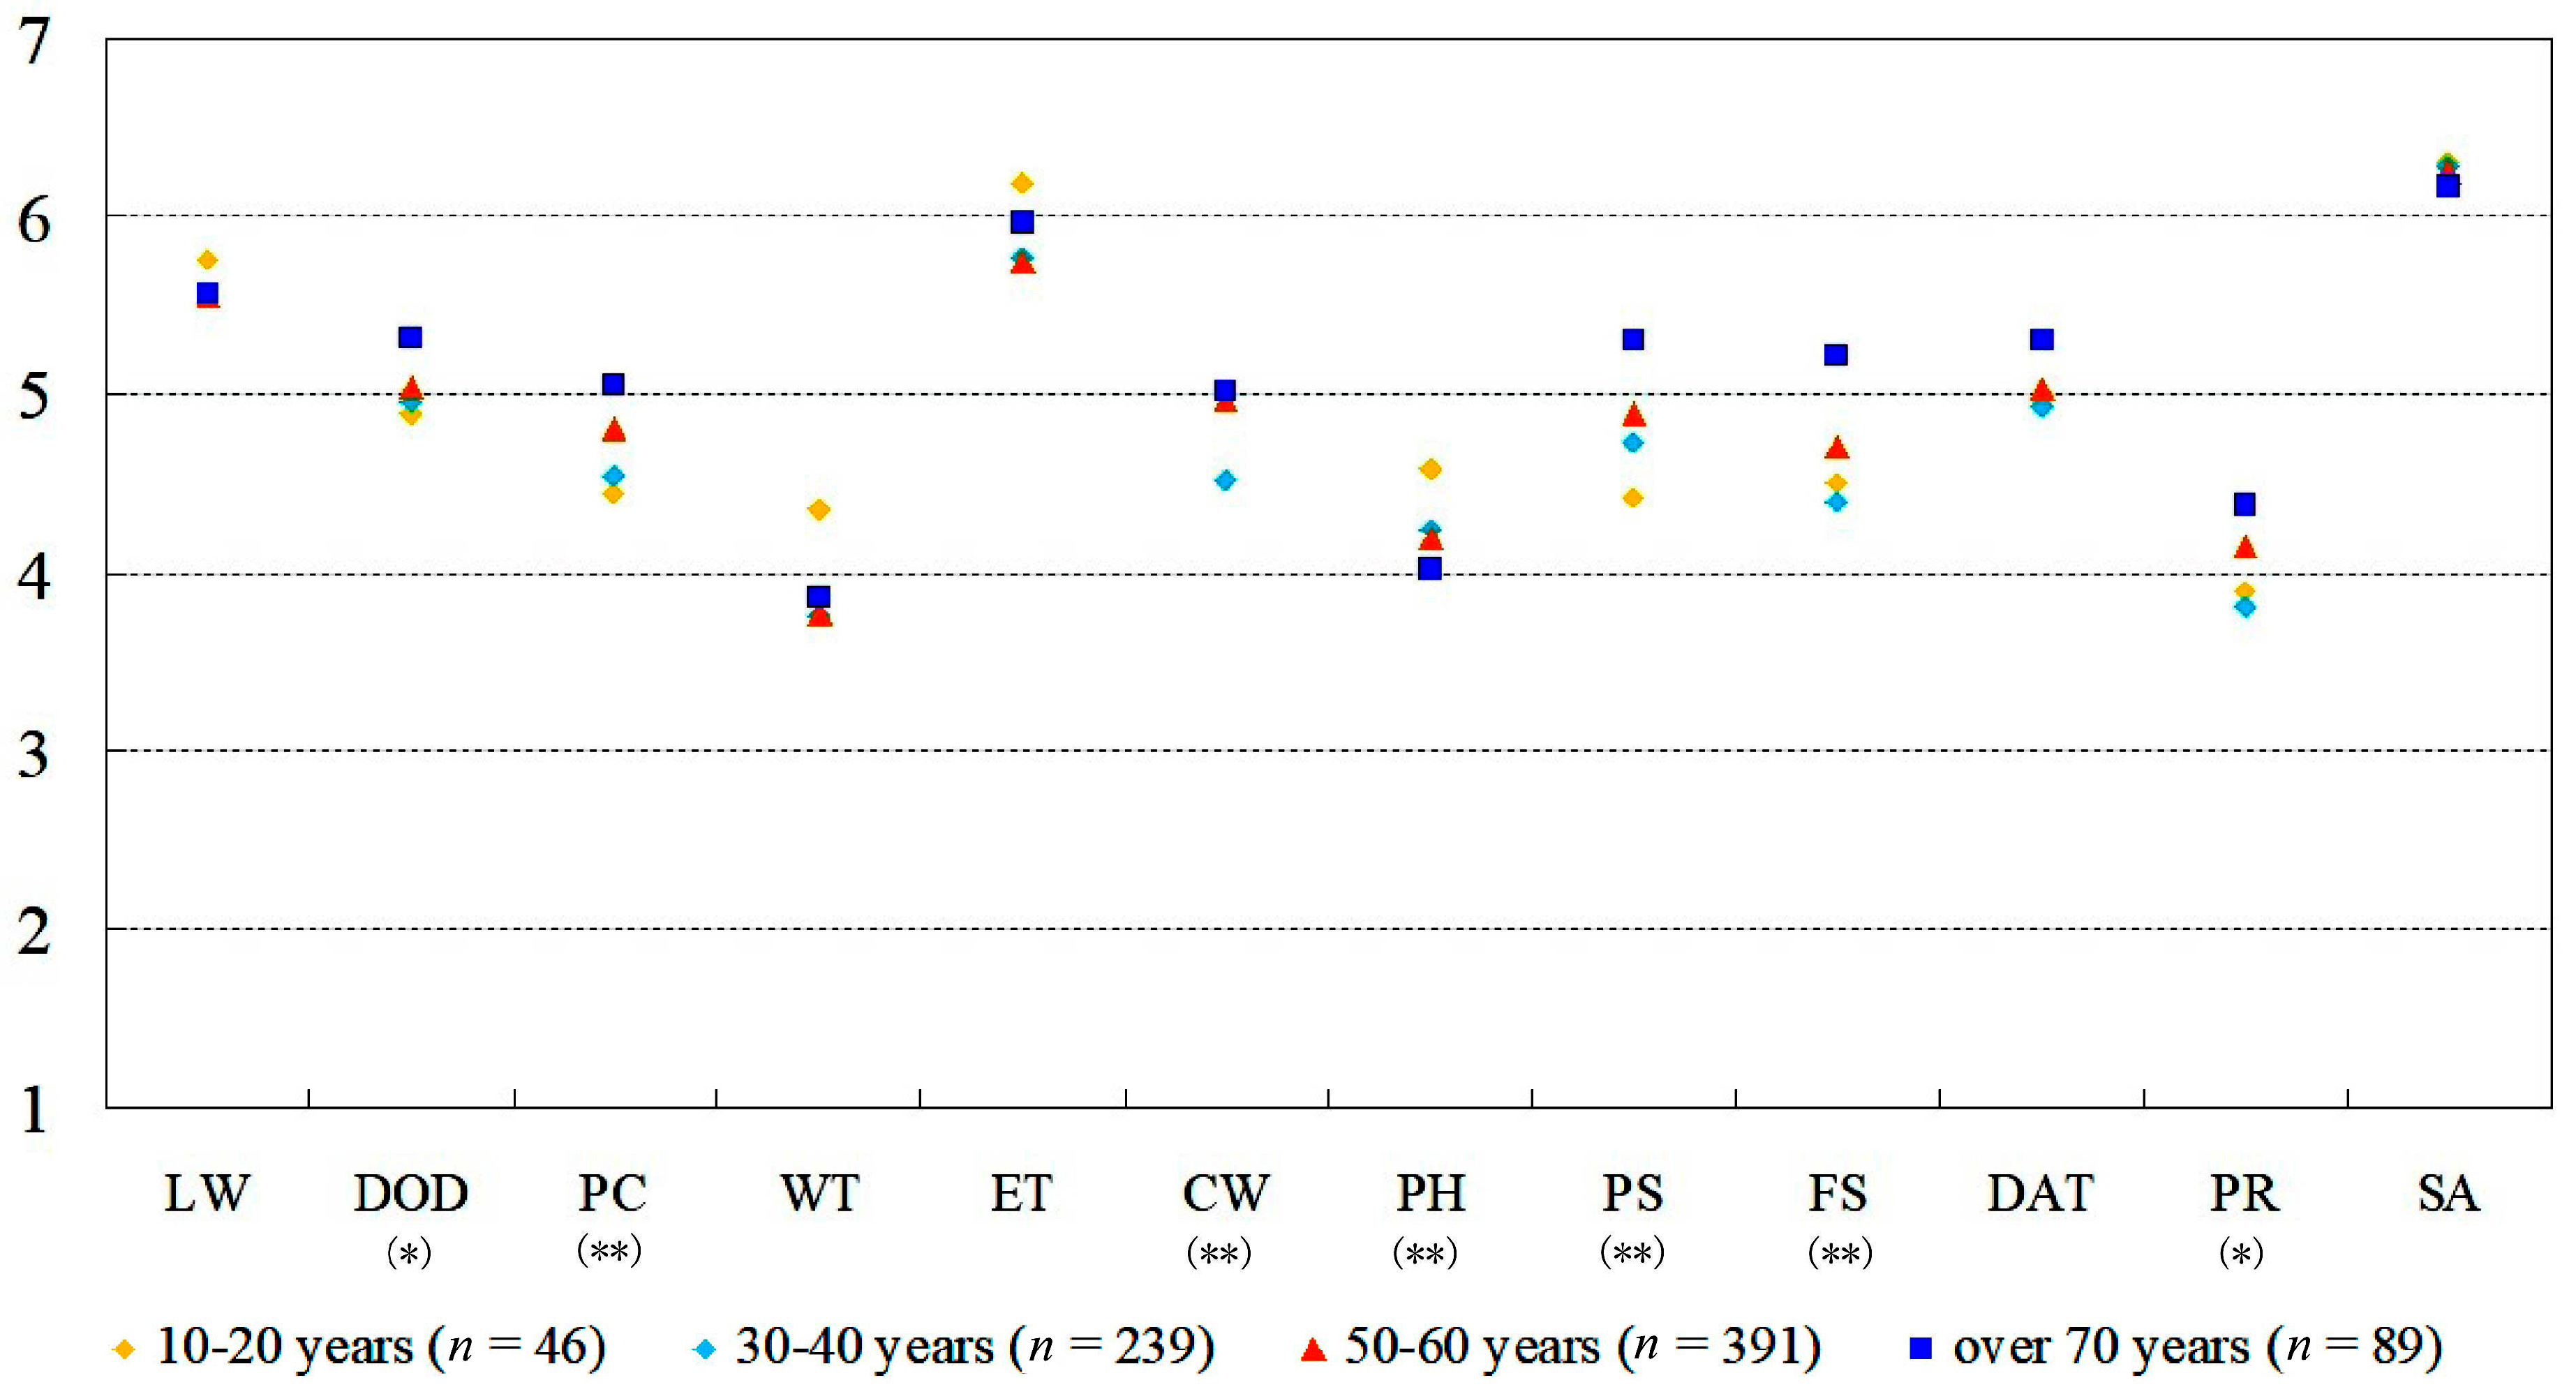
3.3.2. Choice Preferences Based on Age

Overall, there are many differences in the preferences of visitors of different age groups (Figure 4).
Indicators such as “difficulty of the trail”, “pavement condition of the trail”, “physical strength” and “whether the facilities are in good condition”, which are mainly based on the condition of the trail itself, are highly valued among visitors 50–60 years old and visitors over 70 years old. In contrast, visitors from 10 to 20 years old have the lowest tendency to base preferences on the “difficulty of the trail” and “physical strength” when choosing a trail. “Whether you can see the forest train” and “whether you can take a photograph” are the main preferences of visitors aged 10–20 years old when choosing a trail. Thus, middle–aged and elderly visitors mainly consider the condition of the trail surface and their physical strength when choosing a forest trail, indicating that their choice is based on safety. The young visitors mainly base their decision on recreational value when they choose forest trails. These results exhibit the same trends as the results of Oku et al. [19].
In addition, overall satisfaction is high, and the results of the indiscriminate evaluation show that although visitors of different age groups have the same satisfaction results, the meaning of satisfaction is different for each of them.

3.3.3. Choice Preferences Based on Different Numbers of Visitors

Overall, the differences in trail preferences based on the number of visitors tend to be irregular (Figure 5).
From the results of the differences test, the “difficulty of the trail”, “pavement condition of the trail”, “whether you can come into contact with landscape elements such as plants, old trees, water bodies”, “whether you can take photographs”, and “whether the facilities are in good condition” are the five indicators that demonstrate the differences in choice preferences. When there is only one visitor, the indicators “difficulty of the trail”, “pavement condition of the trail” and “whether the facilities are in good condition” are low–choice preferences based on the trail conditions. In contrast, the indicators “whether you can come into contact with landscape elements such as plants, old trees, and streams” and “whether you can take photographs” play a larger role in the preference of trail related to spatial interests.
In addition, “difficulty of the trail”, “pavement condition of the trail” and “whether the facilities are in good condition” are more preferred by groups of 3–5 visitors. Groups of 6–10 people make choices based on “whether you can come into contact with landscape elements such as plants, old trees, and streams” and “whether you can take photographs”, which are recreational activities in the forest park, and “whether the facilities are in good condition” is a high indicator in terms of preference for a trail.
Finally, groups of more than 10 people make choices based on “difficulty of the trail”, “whether you can come into contact with landscape elements such as plants, old trees, and streams” and “physical strength” (although there is no significant difference), but the preference for “whether you can take photographs” is the lowest.
Thus, there are differences in the preferences of visitors in terms of the condition and the entertainment value of the trail, but there is still no difference in the comprehensive evaluation index of overall satisfaction. Overall, regardless of the number of visitors, visitors have high levels of satisfaction.

3.3.4. Choice Preferences Based on Number of Visits

Overall, visitors who have visited the forest park with different numbers of times have similar trends in terms of their choice of trails (Figure 6).
From the results of the differences test, a first–time visitor believes that “whether you can see the forest train” is more important than other preferences, while visitors who have visited 3 or more times are more likely to prefer “whether one can experience forest bathing” and “whether you can come into contact with landscape elements such as plants, old trees, and streams”. However, the last two preferences do not exhibit significant differences.
Visitors who have visited the forest park with different numbers of times make trail choices based on entertainment value. However, combining the number of visits with the visit purpose, the number of visits is mainly related to the interest in experiencing more natural landscape elements for the purpose of a “forest walk”. In comparison to visitors who visited 2 times and 3 or more times, the first–time visitor has a higher preference for “whether you can see the forest train”.

3.3.5. Choice Preferences Based on Duration of Stay

Overall, visitors with different durations of stay also show irregular distribution preferences for their choice of trails (Figure 7).
Visitors who stay in the forest park for over 2 h exhibit a relatively low tendency for any given indicator. Visitors who stay in the forest park for 2–4 h; exhibit a relatively high preference for certain indicators, such as “difficulty of the trail”, “pavement condition of the trail”, “whether one can experience forest bathing”, “whether you can take photographs”, and “walking distance and time spent”.
Visitors who stay 4–6 h have a higher preference for certain indicators, including “difficulty of the trail”, “pavement condition of the trail” and “whether one can experience forest bathing”, but they exhibit a lower preference for “whether you can see the forest train” and “whether privacy is ensured”.
Visitors who stay over 6 h have a relatively high preference for certain indicators, such as “seeing the landscape”, “whether you can see the forest train”, “whether one can experience forest bathing”, “whether you can come into contact with landscape elements such as plants, old trees, and streams”, “whether you can take photographs”, and “whether privacy is ensured”. At the same time, they have a lower tendency to select a trail based on “difficulty of the trail” and “walking distance and time spent”.
Thus, visitors with shorter stays at the forest park have no clear purpose in their choice of trails; they base their decisions mainly on having a simple forest experience. However, those who stay longer exhibit clearer preferences and are more likely to experience entertainment from the forest environment.
In addition, from the results of the differences test, the three indicators “whether you can see the landscape”, “whether you can come into contact with landscape elements such as plants, old trees, and streams”, and “walking distance and time spent” account for the differences in the preferences for choosing a trail.
For the four durations of stay, the highest to lowest preferences for the previous three indicators are as follows: “whether you can see the landscape”: 6 h > 4–6 h > 2–4 h > within 2 h; “whether you can come into contact with landscape elements such as plants, old trees, and streams”: 6 h > 4–6 h > 2–4 h > within 2 h; and “walking distance and time spent”: 2–4 h > 2 h > 4–6 h > over 6 h. In addition, the overall satisfaction of the ranking from highest to lowest is 6 h > 4–6 h > 2–4 h > within 2 h.
In this study, interestingly, the longer the duration of the stay in the forest park, the more attention visitors will pay to the landscape and the experience of natural elements during the walk. In addition, satisfaction is higher with a longer stay. In contrast, the shorter the duration of the stay, the more attention visitors will pay to the trail and time required, whereas they will not pay attention to the landscape and the connection with natural elements. In addition, overall satisfaction is lower.
To obtain deeper insight into this phenomenon, we analyzed the demographic characteristics of visitors with different durations of stay (Table 3). The results revealed differences in the number of visitors and the number of visits (Table 4).
Among them, visitors who stayed for 4–6 h and more than 6 h were mainly in groups of “2 people” and “3–5 people”, accounting for 96.7% and 91.67% of the total, respectively.
According to the number of visits, the proportion of tourists who stayed for more than 6 h among visitors visiting for the second time and those visiting for the third or more time was 62.25%, which was slightly larger than the proportions of visitors who stayed for 2 h and 2–4 h at 51.90% and 41.68%, respectively.
These results indicate that visitors with longer stays are mainly small groups of 2 or 3–5 people, and the number of visits by these visitors is also high. Visitors who stay for less than 2 h and 2–4 h, range from groups of 3–5 people to 10 or more people, and are mainly visiting for the first time.
In our previous research [47], we found that visitors who mainly are in groups of 2 people or 3 to 5 people engage in, relatively free activities. They are primarily self–driving and mainly visit one park, namely, the Akasawa Natural Recreational Forest. Therefore, these visitors are not restricted by time, and can choose forest walks with a large number of walkers.
However, visitors who are visiting multiple parks and have a short duration of stay primarily travel on sightseeing buses or are self–driving. Because these visitors will visit another tourist attraction after Akasawa Natural Recreational Forest, their time in the forest park is restricted.
In other words, the number of visitors, their method of transportation, and their initial travel plans determine or affect tourists’ duration of stay and their walking routes in a forest park to a certain extent.

3.4. Correlation Analysis of Visitor Attributes and Trail Selection

We used SPSS for Windows version 21 to perform Spearman correlation analysis to analyze the correlation between visitor attributes and trail selection preference indicators (Table 4).
First, according to the correlation results of the different attributes, the sex, number of visitors and duration of stay are positively correlated, and the age, number of visitors and number of visits are positively correlated. In addition, the overall satisfaction of visitors, number of visitors and duration of stay are positively correlated. Thus, groups with a large number of visitors with longer stays in the forest park have a higher satisfaction level.
Second, according to the analysis results for the attributes of the visitor and preferences in the choice of trails, indicators, such as “difficulty of the trail”, “physical strength” and “whether the facilities are in good condition”, which are related to the factors of the trail, are positively correlated with the attribute indicators, except for the number of visits, and the overall satisfaction of the visitors.

4. Discussion

4.1. Visitors with Different Attributes Have Different Trail Preferences

Through the analysis of the preferences of the visitors with different demographic characteristics, we found that elderly and female visitors consider the condition of the trail when choosing the trail, while young people aged 10–20 years old consider the recreational landscape elements of the trail, such as the forest train and locations where photography is possible.
Regarding the number of visitors, groups of 3–5 people, 6–10 people and more than 10 people not only pay attention to the condition of the trail, but also focus on their physical strength in addition to the recreational landscape elements of the trail. This finding may be related to the ages of the visitors (most middle–aged people) in these groups.
With respect to the number of visits, visitors who have visited many times prefer to experience forest bathing, whereas visitors on their first visit have a higher preference for “seeing the forest train” than do other visitors.
Finally, with respect to the duration of stay, visitors who stayed more than 6 h have a clear preference for the choice of trails, mainly preferring natural landscape elements. Those with shorter stays exhibit a less clear choice of trails, they mainly considered a suitable walking route for the time available.
Oku and Fukamachi [20] noted that visitor attitudes and perceptions of the surrounding environment are different. Therefore, visitors with different attributes have different visitation patterns and familiarity with the region because of their different perceptions of the landscape and behavioral activities.
Thus, visitors with different attributes have different needs in terms of their choice of trails, and from the perspective of their preferences, visitor landscapes are different. This study shows the same results as previous research [20,32,33,35,45,47].
The findings confirm that the diversity of the population should be considered when planning forest trails in forest parks, and the corresponding trail space should be planned for different groups of people, which will be very important for improving the overall satisfaction levels of different users.

4.2. Visitor Satisfaction will Change Depending on the Attributes of the Visitor

In our study, in most cases, the satisfaction evaluation of visitors did not differ statistically, except with respect to the duration of stay.
From the perspective of duration of stay, visitors who stay longer in a forest park have higher satisfaction, whereas those who stay for a shorter time have a lower satisfaction level. In other words, if visitors have sufficient time and experience rich forest landscapes, the experience improves their overall satisfaction.
However, visitors who stay a shorter time may be limited by their time in the forest park, which may be caused by their travel itinerary on that day. In this scenario, visitors need to leave the park within a specified time, and they may feel unsatisfied with their excursion. This feeling is an important factor affecting the overall satisfaction of visitors to the park.
This feeling is an interesting phenomenon. We hypothesize that as the duration of a visitor’s experience in a forest landscape increases, the visitor’s satisfaction index will show a peak value at a certain time period, after which the peak value will gradually start to decline. This phenomenon is a meaningful topic that will contribute to the design of forest bathing activities and the planning of forest trails.
Our previous research [47] showed that visitors who are in groups of 2 people or 3 to 5 people stayed longer and were not restricted by time, mainly because they visited only the Akasawa Natural Forest and had experience from previous visits, which allowed them to appreciate the forest landscape on their walks. In contrast, those who stayed a short time were restricted by time, mainly because they were going to a subsequent destination (Figure 8). In other words, the number of visitors, their method of transportation, and their travel plans affect the time of stay of tourists and their walking routes in the forest park to a certain extent.
This is a deeper issue is related to the layout of different scenic spots on a geographical scale and the planning of the overall travel routes of visitors.
In addition, combined with the purpose of the visitor’s visit (Table 1), we find that although a visitor’s goal may be mostly “forest bathing” or “forest walking”, the meaning of these terms can be completely different for different tourists.
For tourists with shorter residence time and more diverse methods of transportation, “forest bathing” or “forest walking” represents a simple appreciation of the landscape or the experience of artificial entertainment facilities (such as forest trains). These types of tourists have fewer choices of walking trails and shorter walks. “Forest bathing” or “forest walking” is more passive and simple methods of appreciation for them.
In contrast, “forest bathing” or “forest walking” is an experience for enjoying the forest landscape space for visitors who have a long residence time, mainly in groups of 2 or small groups of 2–3 people. This type of visitor can access a larger number of forest trails and a longer walking distance. “Forest bathing” or “forest walking” is an active learning practice for them. This result is also consistent with our previous survey of visitors’ behaviors during walks [47].
Through these analyses, we find that tourists have two primary requirements for the planning of forest trails. The first is the demand for landscape trail planning that promotes passive viewing, and the second is landscape trail planning that promotes active discovery. Trails promoting the latter experience may receive higher satisfaction ratings because visitors can experience more “small fun” in the forest.
Additionally, through the correlation analysis, we conclude that the indicators of “whether you can see the forest train” and “whether you can take photographs” are two entertainment–oriented indicators representing forest space, but they are negatively correlated with the number of visits (experience). From the perspective of the impact of artificial landscape elements on tourists, this study and previous studies [60,61,62,63,64] which is artificial factors will affect tourists’ preference for the trails shows the same tendency.
Thus, the familiarity of visitors with a forest park affects their choice of forest trails. More experienced visitors have a relatively lower preference for forest trails with strong artificial and recreational landscapes when selecting forest trails. They may prefer to choose forest trails with many natural landscape elements. However, first–time visitors to a forest park may be curious when choosing a trail, and they may prefer to choose the recreational elements of the trail that will bring them more entertainment value.
In addition, visitors’ different visits to the park affect their choice of trails, and different trail selection preferences motivate them to exhibit different behaviors. The results of such behaviors also allow visitors to obtain different levels of satisfaction; high satisfaction is correlated with a longer duration of stay.
The statistics of the demographic characteristics of tourists are relatively simple. However, the analysis of these attributes reveals that the reasons for choosing trails by different groups of people are mainly based on the behaviors of tourists and the inherent differences in their demands for forest landscape resources. These demands include the need for natural landscape elements and for artificially entertaining landscape elements. Of course, there are other means to take a walk through a park, as determined by the travel plans of the tourists that must be considered during the initial park planning and design stage.
In other words, only by understanding the needs of different tourists and the actual situation, can we better promote visitor satisfaction with forest landscape resources.

4.3. Trail Condition Factors, Such as the Degree of Difficulty and Facility Status, Affect Satisfaction Levels of Visitors on Many Levels

Sever and Verbic [58] noted that the condition of a trail is the key factor that influences a visitor’s choice of trail. In our study, from the correlation analysis between the attributes of the visitor and the preferences in choosing a trail (Table 3), we also found that “whether the trails are in good condition” affects the choice of trails among a diverse range of visitors. However, this indicator is not related to the number of visits (experiences) by a visitor. Similarly, boring, unsafe or overgrown trails are not appreciated by tourists [63,65,66,67].
Therefore, in most cases, an appropriate degree of the trail’s difficulty and good facilities can lead visitors to provide a high satisfaction evaluation. However, visitors who visit often and are experienced know more about the park and do not care as much about the difficulty of the trail or the facilities. These visitors are more concerned with whether they can experience forest bathing during a forest walk and whether they can come into contact with landscape elements such as streams, ancient trees, and rocks (Figure 6).
In this survey, the indicator “whether one can experience forest bathing” is the preference of most visitors when choosing a trail. However, from the perspective of spatial planning, the factors that affect visitors’ experience of forest bathing include the density of forests, the diversity of plants in the forest, and the openness of the understory. This issue requires deeper research.
In addition, this study focuses on the differences in preferences of users in the choice of trails and their relationship to visitor satisfaction. However, how these selection indicators affect the overall satisfaction evaluation of visitors, that is, what are the impacts of changes in the landscape of the trail on the satisfaction evaluation of visitors, is also a direction for future research.

5. Conclusions

This study uses the Akasawa National Recreational Forest of Japan as an example. We mainly identify visitor preferences for choosing trails in the forest park. These preferences are based on a statistical analysis of the differences in the preferences of visitors with different attributes when choosing trails. Our results are summarized as follows:
(a)
From the results of the difference analysis and the analysis of the visitors’ preferences, visitors with different attributes exhibit significant differences in terms of their choice of forest trails. Thus, visitors with different attributes have different needs in terms of their choice of trails, and their perceptions of the landscapes are different. This study supports the results reported in previous research [20,32,33,35,45,47].
(b)
The trail condition factors, such as the degree of difficulty and facility status, affect the satisfaction evaluation of a diverse array of visitors. The results of the correlation analysis between the attributes of the visitors and their preferences in trail selection show that trail condition factors such as the degree of difficulty and facility status are positively correlated with several visitor attributes and the overall satisfaction evaluation of the visitor. In other words, in most cases, an appropriate degree of the trail’s difficulty and good facilities can lead visitors to provide a high satisfaction evaluation. That is, in most cases, tourists mainly prefer to consider the condition of the forest trail when selecting forest trails before choosing the trail.
(c)
In our study, in most cases, the satisfaction evaluation of visitors did not differ statistically, except for the analysis of the visitors’ duration of stay. From the perspective of duration of stay, visitors who stay longer in a forest park have higher satisfaction, whereas those who stay for a shorter time have a lower satisfaction level. In other words, for those who love forest walks, if visitors have sufficient time and experience rich forest landscapes, the experience improves their overall satisfaction.
Based on the above results, the trails of the forest park should be planned according to the following suggestions:
(1)
Consider the age of the visitor. In particular, we should consider providing a route for people over the age of 70 with a relatively good trail that has a rich natural landscape. For young people, we should provide a better landscape quality and a landscape suitable for photography or place attractions suitable for photography along the trail.
(2)
Consider the needs of both first–time visitors and repeat visitors. For first–time visitors, we need to provide forest trails that are rich in artificial elements and are slightly more entertaining. For returning visitors, we should provide forest trails that are closer to nature and increase the abundance of natural landscape elements.
(3)
Consider the duration of stay. When organizing forest bathing activities, compared with the short–term forest bathing experience, we should focus the experience on those staying more than 6 h and on groups of more than 10 people to more easily improve the quality of the experience of forest bathing.
In future, we intend to conduct a more in–depth study on the factors affecting visitors from the perspective of environmental behavioral psychology based on different visitors’ durations of stay and combine the characteristics of different forest spaces with the behaviors of visitors.

Author Contributions

T.Z. designed the experiment. T.Z., W.Z., H.M. and Z.Z. conducted the investigation. Z.Z. provided resources. T.Z. collected the data, analyzed the data and wrote the paper.

Funding

This research received no external funding.

Acknowledgments

We would like to thank the Kiso-gun Agematsu-machi Tourism Association in Nagano Prefecture, Japan which give us convenience and support during the investigation. At the same time, we would like to thank Professor Sasaki Kunihiro, Shinshu University in Japan, for his comments about the investigation.

Conflicts of Interest

The authors declare no conflict of interest.

References

  1. Wilkes–Allemann, J.; Pütz, M.; Hanewinkel, M. Forest recreation as a governance problem: Four case studies from Switzerland. Eur. J. For. Res. 2017, 136, 511–526. [Google Scholar] [CrossRef]
  2. Hunziker, M.; Kienast, F. Potential impacts of changing agricultural activities on scenic beauty—a prototypical technique for automated rapid assessment. Landsc. Ecol. 1999, 14, 161–176. [Google Scholar] [CrossRef]
  3. Tahvanainen, L.; Tyrvӓinen, L.; Ihalainen, M.; Vuorela, N.; Kolehmainen, O. Forest management and public perceptions–visual versus verbal information. Landsc. Urban Plan. 2001, 53, 53–70. [Google Scholar] [CrossRef]
  4. Deng, S.Q.; Yin, N.; Guan, Q.W.; Katoh, M. Short–term effects of thinning intensity on scenic beauty values of different stands. J. For. Res. 2013, 18, 209–219. [Google Scholar] [CrossRef]
  5. Gong, L.; Zhang, Z.D.; Xu, C.Y. Developing a quality assessment index system for scenic forest management: a case study from Xishan mountain, suburban Beijing. Forests 2015, 6, 225–243. [Google Scholar] [CrossRef]
  6. Arnberger, A. Recreation use of urban forests: an inter–area comparison. Urban For. Urban Green. 2006, 4, 135–144. [Google Scholar] [CrossRef]
  7. Jim, C.Y.; Chen, W.Y. Ecosystem services and valuation of urban forests in China. Cities 2009, 26, 187–194. [Google Scholar] [CrossRef]
  8. Eriksson, L.; Nordlund, A.M.; Olsson, O.; Westin, K. Recreation in different forest settings: A scene preference study. Forests 2012, 3, 923–943. [Google Scholar] [CrossRef]
  9. Takayama, N.; Korpela, K.; Lee, J.; Morikawa, T.; Tsunetsugu, Y.; Park, B.J.; Li, Q.; Tyrväinen, L.; Miyazaki, Y.; Kagawa, T. Emotional, restorative and vitalizing effects of forest and urban environments at four sites in Japan. Int. J. Environ. Res. Public Health 2014, 11, 7207–7230. [Google Scholar] [CrossRef] [PubMed]
  10. Ochiai, H.; Ikei, H.; Song, C.; Kobayashi, M.; Takamatsu, A.; Miura, T.; Kagawa, T.; Li, Q.; Kumeda, S.; Imai, M.; et al. Physiological and psychological effects of forest therapy on middle–aged males with high–normal blood pressure. Int. J. Environ. Res. Public Health 2015, 12, 2532–2542. [Google Scholar] [CrossRef]
  11. Zhang, T.; Deng, S.Q.; Ma, Q.Q.; Sasaki, K. Evaluations of landscape locations along trails based on walking experiences and distance traveled in the Akasawa forest therapy base, Central Japan. Forests 2015, 6, 2853–2878. [Google Scholar] [CrossRef]
  12. Hartig, T.; Evans, G.W.; Jamner, L.D.; Davis, D.S.; Gӓrling, T. Tracking restoration in natural and urban field settings. J. Environ. Psychol. 2003, 23, 109–123. [Google Scholar] [CrossRef]
  13. Faryadi, S.; Taheri, S. Interconnections of urban green spaces and environmental quality of Tehran. Int. J. Environ. Res. 2009, 3, 199–208. [Google Scholar]
  14. Zhou, C.W.; Yan, L.B.; Yu, L.F.; Wei, H.X.; Guan, H.M.; Shang, C.F.; Chen, F.Y.; Bao, J. Effect of short–term forest bathing in urban parks on perceived anxiety of young–adults: A pilot study in Guiyang, Southwest China. Chin. Geogr. Sci. 2019, 29, 139–150. [Google Scholar] [CrossRef]
  15. Guan, X.M.; Wei, H.X.; He, X.Y.; Ren, Z.B.; An, B.Y. The tree–species–specific effect of forest bathing on perceived anxiety alleviation of young–adults in urban forests. Ann. For. Res. 2017, 60, 327–341. [Google Scholar] [CrossRef]
  16. Ulrich, R.S. Effects of natural view and urban view on human emotion and physiology. Environ. Behav. 1981, 13, 523–556. [Google Scholar] [CrossRef]
  17. Ulrich, R.S. View through a window may influence recovery from surgery. Science 1984, 224, 420–421. [Google Scholar] [CrossRef] [PubMed] [Green Version]
  18. The Cabinet Office, Government of Japan. Forest and life public opinion poll. Available online: http://survey.gov–online.go.jp/h19/h19–sinrin/index.html (accessed on 10 March 2018).
  19. Burgin, S.; Hardiman, N. Extreme sports in natural areas: Looming disaster or a catalyst for a paradigm shift in land use planning? J. Environ. Plan. Manag. 2012, 55, 921–940. [Google Scholar] [CrossRef]
  20. Oku, H.; Fukamachi, K. The differences in scenic perception of forest visitors through their attributes and recreational activity. Landsc. Urban Plan. 2006, 75, 34–42. [Google Scholar] [CrossRef]
  21. China National Forestry and Grassland Administration Government Website. Available online: http://www.forestry.gov.cn/portal/slgy/s/2452/content–862762.html (accessed on 10 March 2018).
  22. Karhu, I.; Kellomaki, S. Vaeston mielipiteet metsanhoidon vaikutuksesta maisemakuvaan Puolangan kunnassa. Silva Fenn. 1980, 14, 409–428. [Google Scholar] [CrossRef]
  23. Litton, R.B. Visual vulnerability of forest landscapes. J. For. 1974, 7, 392–397. [Google Scholar]
  24. Schroeder, H.W.; Daniel, T.C. Progress in predicting the perceived scenic beauty of forest landscapes. For. Sci. 1981, 27, 71–80. [Google Scholar]
  25. Daniel, T.C. Whither scenic beauty? Visual landscape quality assessment in the 21st century. Landsc. Urban Plan. 2001, 54, 267–278. [Google Scholar] [CrossRef]
  26. Daniel, T.C.; Boster, R.S. USDA forest service research paper RM–167. In Measuring Landscape Esthetics: The Scenic Beauty Estimation Method; Rocky Mountain Forest and Range Experiment Station: Fort Collins, CO, USA, 1976; pp. 1–66. [Google Scholar]
  27. Buhyoff, G.J.; Leuschner, W.A. Estimating psychological disutility from damaged forest stands. For. Sci. 1978, 24, 424–432. [Google Scholar]
  28. Buhyoff, G.J.; Leuschner, W.A.; Arndt, L.K. Replication of a scenic preference function. For. Sci. 1980, 26, 227–230. [Google Scholar]
  29. Hull, R.B.; Buhyoff, G.J.; Daniel, T.C. Measurement of scenic beauty: The law of comparative judgment and scenic beauty estimation procedures. For. Sci. 1984, 30, 1084–1096. [Google Scholar]
  30. Silvennoinen, H.; Alho, J.; Kolehmainen, O.; Pukkala, T. Prediction models of landscape preferences at the forest stand level. Landsc. Urban Plan. 2001, 56, 11–20. [Google Scholar] [CrossRef]
  31. Yeiser, J.L.; Shilling, C.L. Student responses to selected terms and scenes in natural resource management. J. For. 1978, 76, 497–498. [Google Scholar]
  32. Takayama, N.; Kawaguchi, T.; Kasetani, T.; Park, B.J.; Kagawa, T. The relation between the measured environmental factors and the evaluation factors extracted from on–site forest environment. Landsc. Res. Jpn. 2009, 72, 669–672. [Google Scholar] [CrossRef]
  33. Oishi, Y.; Hiyane, A.; Taguchi, H.; Murai, H. Analysis for psychology in a forest environment: semantic differential method in the experimental forest of recreational function. Jpn. J. For. Plan. 1994, 23, 33–44. [Google Scholar]
  34. Dramstad, W.E.; Tveit, M.S.; Fjellstad, W.J.; Fry, G.L.A. Relationships between visual landscape preferences and map–based indicators of landscape structure. Landsc. Urban Plan. 2006, 78, 465–474. [Google Scholar] [CrossRef]
  35. Oku, H.; Fukamachi, K. The relationships between experienced landscape types and people’s visiting forms on a trail in a forest. Landsc. Res. Jpn. 2000, 63, 587–592. [Google Scholar] [CrossRef]
  36. Ghimire, R.; Green, G.T.; Poudyal, N.C.; Cordell, H.K. Who recreates where: Implications from a national recreation household survey. J. For. 2016, 114, 458–465. [Google Scholar] [CrossRef]
  37. Mariusz, C.; Krzysztof, S. What do we expect from forests? The European view of public demands. J. Environ. Manag. 2018, 209, 139–151. [Google Scholar] [CrossRef]
  38. Jennings, T.E.; Jean–Philippe, S.R.; Willcox, A.; Zobel, J.M.; Poudyal, N.C.; Simpson, T. The influence of attitudes and perception of tree benefits on park management priorities. Landsc. Urban Plan. 2016, 153, 122–128. [Google Scholar] [CrossRef]
  39. Edwards, D.M.; Jay, M.; Jensen, F.S.; Lucas, B.; Marzano, M.; Montagne, C.; Peace, A.; Weiss, G. Public preferences across Europe for different forest stand types as sites for recreation. Ecol. Soc. 2012, 17, 27. [Google Scholar] [CrossRef]
  40. De Meo, I.; Paletto, A.; Cantianl, M.G. The attractiveness of forests: Preferences and perceptions in a mountain community in Italy. Ann. For. Res. 2015, 58, 145–156. [Google Scholar] [CrossRef]
  41. Paletto, A.; Guerrinr, S.; De Meo, I. Exploring visitors’ perceptions of silvicultural treatments to increase the destination attractiveness of peri–urban forests: A case study in Tuscany Region (Italy). Urban For. Urban Green. 2017, 27, 314–323. [Google Scholar] [CrossRef]
  42. Petucco, C.; Skovsgaard, J.P.; Jensen, F.S. Recreational preferences depending on thinning practice in young even–aged stands of pedunculate oak (Quercus robur L.): Comparing the opinions of forest and landscape experts and the general population of Denmark. J. For. Res. 2013, 28, 668–676. [Google Scholar] [CrossRef]
  43. Shin, W.S. Forest recreationists’ characteristics and their quality of life levels. J. For. Sci. Technol. 2011, 7, 38–41. [Google Scholar] [CrossRef]
  44. Dudek, T. Multi–scale influences of selected features of forests on forest landscape aesthetic value – example of SE Poland. J. Environ. Eng. Landsc. Manag. 2018, 26, 275–284. [Google Scholar] [CrossRef]
  45. Mak, B.K.L.; Jim, C.Y. Linking park users’ socio-demographic characteristics and visit-related preferences to improve urban parks. Cities 2019, 92, 97–111. [Google Scholar]
  46. Karahalil, U.; Baskent, E.Z.; Köse, S. Integrating visitor characteristics and preferences into forest management plans in protected areas: A case study in Köprülü Canyon National Park. eco.mont. 2015, 7, 5–17. [Google Scholar] [CrossRef] [Green Version]
  47. Zhang, T.; Sasaki, K.; Uehara, M. The distribution of evaluation activities by visitors on walks course of nature recreation forest. Landsc. Res. Jpn. 2013, 6, 6–11. [Google Scholar] [CrossRef]
  48. Chiou, C.R.; Tsaia, W.L.; Leung, Y.F. A GIS–dynamic segmentation approach to planning travel routes on forest trail networks in Central Taiwan. Landsc. Urban Plan. 2010, 97, 221–228. [Google Scholar] [CrossRef]
  49. Buchel, S.; Frantzeskaki, N. Citizens’ voice: A case study about perceived ecosystem services by Urban park users in Rotterdam, the Netherlands. Eco. Ser. 2015, 12, 169–177. [Google Scholar] [CrossRef]
  50. Reichhart, T.; Arnberger, A. Exploring the influence of speed, social, managerial and physical factors on shared trail preferences using a 3D computer animated choice experiment. Landsc. Urban Plan. 2010, 96, 1–11. [Google Scholar] [CrossRef]
  51. Tomczyk, A.M.; Ewertowski, M. Planning of recreational trails in protected areas: Application of regression tree analysis and geographic information systems. Appl. Geogr. 2013, 40, 129–139. [Google Scholar] [CrossRef]
  52. Mark, B.; Ori, G.; Catherine, M.P. Recreational trails are an important cause of fragmentation in endangered urban forests: A case–study from Australia. Landsc. Urban Plan. 2014, 130, 112–124. [Google Scholar] [CrossRef]
  53. Sitzia, T.; Rizzi, A.; Cattaneo, D.; Semenzato, P. Designing recreational trails in a forest dune habitat using least–cost path analysis at the resolution of visitor sight distance. Urban For. Urban Green. 2014, 13, 861–868. [Google Scholar] [CrossRef]
  54. Sugimoto, K. Use of GIS–based analysis to explore the characteristics of preferred viewing spots indicated by the visual interest of visitors. Landsc. Res. 2017, 43, 345–359. [Google Scholar] [CrossRef]
  55. Pena, S.B.; Abreu, M.M.; Teles, R.; Espirito–Santo, M.D. A methodology for creating greenways through multidisciplinary sustainable landscape planning. J. Environ. Manag. 2010, 91, 970–983. [Google Scholar] [CrossRef]
  56. Chiang, Y.C.; Nasar, J.L.; Ko, C.C. Influence of visibility and situational threats on forest trail evaluations. Landsc. Urban Plan. 2014, 125, 166–173. [Google Scholar] [CrossRef]
  57. Lee, K.C.; Son, Y.H.; Lee, S.H. Exploring the characteristics of scenic landscapes of between the dulle–gil and the uphill trail in Bukhansan National Park. J. Kor. Soc. R. Plan. 2016, 22, 21–31. [Google Scholar] [CrossRef]
  58. Sever, I.; Verbic, M. Providing information to respondents in complex choice studies: A survey on recreational trail preferences in an urban nature park. Landsc. Urban Plan. 2018, 169, 160–177. [Google Scholar] [CrossRef]
  59. The Agematsu Tourist Association. Introduction of Agematsu Town. Available online: http://www.town.agematsu.nagano.jp/kankou/akasawa/akasawa.html (accessed on 10 March 2015).
  60. Lindsey, G. Use of urban greenways: Insights from Indianapolis. Landsc. Urban Plan. 1999, 45, 145–157. [Google Scholar] [CrossRef]
  61. Wiberg-Carlson, D.; Schroeder, H. Modeling and Mapping Urban Bicyclists Preferences for Trail Environments. Research Paper NC–303; U.S. Department of Agriculture, Forest Service, North Central Forest Experiment Station: St. Paul, MN, USA, 1992.
  62. Reynolds, K.D.; Wolch, J.; Byrne, J.; Chou, C.-P.; Feng, G.; Weaver, S.; Jerrett, M. Trail characteristics as correlates of urban trail use. Am. J. Health Promot. 2007, 21, 335–345. [Google Scholar] [CrossRef] [PubMed]
  63. Schroeder, H. Preferred features of urban parks and forests. J. Arboricult. 1982, 8, 317–322. [Google Scholar]
  64. Shafer, C.S.; Lee, B.; Turner, P.E.S.; Hughart, M. Evaluation of Bicycle and Pedestrian Facilities: User Satisfaction and Perceptions on Three Shared Uses Trails in Texas; Department of Recreation, Park and Tourism Sciences, Texas A&M University & Texas Transportation Institute: College Station, TX, USA, 1999. [Google Scholar]
  65. Jorgensen, A.; Hitchmough, J.; Calvert, T. Woodland spaces and edges: Their impact on perception of safety and preference. Landsc. Urban Plan. 2002, 59, 1–11. [Google Scholar] [CrossRef]
  66. Hands, D.; Brown, R. Enhancing visual preference of ecological rehabilitation sites. Landsc. Urban Plan. 2002, 58, 57–70. [Google Scholar] [CrossRef] [Green Version]
  67. Ravenscroft, N. Tales from the tracks: Discourses of constraint in the use of mixed cycle and walking routes. Int. Rev. Sociol. Sport. 2004, 39, 27–44. [Google Scholar] [CrossRef]
  68. Takayama, N.; Kagawa, T.; Kaseani, T.; Park, B.J.; Tsunetsugu, Y.; Oishi, Y.; Hirano, H.; Miyazaki, Y. The comfortableness of the light/thermal environment for bathing in the forest atmosphere. Landsc. Res. Jpn. 2005, 68, 819–824. [Google Scholar] [CrossRef]
  69. Takayama, N.; Fujisawa, M.; Arakmaki, M.; Tada, Y. Creating an environmental image for the maintenance of comfortable “forest bathing” applied by a ground theory approach. Landsc. Res. Jpn. 2011, 74, 613–618. [Google Scholar] [CrossRef]
  70. Zhang, L.Q. Principles of Kruskal–Wallis test and its empirical analysis. J. Suz. Univ. Sci. Technol. 2014, 31, 14–16. [Google Scholar]
  71. Grant, P.E.; Kurt, F.K. Multi–scale influences of slope aspect and spatial pattern on ecotonal dynamics at upper treeline in the Southern Rocky Mountains, U.S.A. Arc. Ant. Alp. Res. 2010, 42, 45–56. [Google Scholar] [CrossRef]
  72. Jennifer, E.R.; Gregory, S.K. Effects of landscape on behavior of black–tailed prairie dogs (Cynomys ludovicianus) in rural and urban habitats. Southwest. Nat. 2010, 55, 167–171. [Google Scholar] [CrossRef]
  73. Kröger, R.; Littlejohn, K.A.; Pierce, S.C.; Henderson, J.; Brandt, J.; Flora, C.; Poganski, B.H.; Prevost, J.D. Evidence toward sediment accumulation characteristics of slotted inlet pipes as best management practices on agricultural landscapes. Ecol. Eng. 2013, 51, 249–255. [Google Scholar] [CrossRef]
Figure 1. Akasawa National Recreational Forest.
Forests 10 00431 g001
Figure 2. Classification of tourist preferences and the study site.
Forests 10 00431 g002
Figure 3. Choice preferences based on sex. LW: Landscape the visitor wants to see; DOD: Degree of difficulty; PC: Pavement condition; WT: Watch the forest train; ET: Experience the forest bath; CW: Contact with landscape elements; PH: Photography; PS: Physical strength; FS: Facility status; DAT: Distance and time; PR: Privacy; SA: Satisfaction. ** Significant at the 0.01 level. * Significant at the 0.05 level.
Forests 10 00431 g003
Figure 4. Choice preferences based on age. LW: Landscape the visitor wants to see; DOD: Degree of difficulty; PC: Pavement condition; WT: Watch the forest train; ET: Experience the forest bath; CW: Contact with landscape elements; PH: Photography; PS: Physical strength; FS: Facility status; DAT: Distance and time; PR: Privacy; SA: Satisfaction. ** Significant at the 0.01 level. * Significant at the 0.05 level.
Forests 10 00431 g004
Figure 5. Choice preferences based on number of visitors. LW: Landscape the visitor wants to see; DOD: Degree of difficulty; PC: Pavement condition; WT: Watch the forest train; ET: Experience the forest bath; CW: Contact with landscape elements; PH: Photography; PS: Physical strength; FS: Facility status; DAT: Distance and time; PR: Privacy; SA: Satisfaction. ** Significant at the 0.01 level. * Significant at the 0.05 level.
Forests 10 00431 g005
Figure 6. Choice preferences based on number of visits. LW: Landscape the visitor wants to see; DOD: Degree of difficulty; PC: Pavement condition; WT: Watch the forest train; ET: Experience the forest bath; CW: Contact with landscape elements; PH: Photography; PS: Physical strength; FS: Facility status; DAT: Distance and time; PR: Privacy; SA: Satisfaction. ** Significant at the 0.01 level. * Significant at the 0.05 level.
Forests 10 00431 g006
Figure 7. Choice preferences based on duration of stay. LW: Landscape the visitor wants to see; DOD: Degree of difficulty; PC: Pavement condition; WT: Watch the forest train; ET: Experience the forest bath; CW: Contact with landscape elements; PH: Photography; PS: Physical strength; FS: Facility status; DAT: Distance and time; PR: Privacy; SA: Satisfaction. ** Significant at the 0.01 level. * Significant at the 0.05 level.
Forests 10 00431 g007
Figure 8. Different types of walking tourists. (A) Long residence time and long walking distance; (B) Short residence time and short walking distance.
Forests 10 00431 g008
Table 1. Demographics of the respondents.
FBFWFVAAPRFRVFRESVETATPHLE
SexMale (n = 350)114(32.57)134(38.29)32(9.14)1(0.29)19(5.43)016(4.57)2(0.57)19(5.43)6(1.71)6(1.71)
Female (n = 415)150(36.14)142(34.22)34(8.19)2(0.48)14(3.37)3(0.72)25(6.02)2(0.48)24(5.78)2(0.48)7(1.69)
Age10 to 20 years (n = 46)22(47.83)10(21.74)5(10.87)02(4.35)00001(2.17)1(2.17)
30 to 40 years (n= 239)76(31.80)83(34.73)23(9.62)1(0.42)14(5.86)017(7.11)2(0.84)12(5.02)2(0.84)5(2.09)
50 to 60 years (n = 391)129(32.99)151(38.62)26(6.65)1(0.26)17(4.35)3(0.77)24(6.14)2(0.51)28(7.16)2(0.51)6(1.53)
Over 70 years (n = 89)37(41.57)32(35.96)12(13.48)1(1.12)00003(3.37)3(3.37)1(1.12)
Number of visitors1 person (n = 33)8(24.24)19(57.58)1(3.03)00001(3.03)2(6.06)2(6.06)0
2 persons (n = 457)147(32.17)172(37.64)38(8.32)019(4.16)030(6.56)3(0.66)29(6.35)6(1.31)10(2.09)
3 to 5 persons (n = 174)64(36.78)56(32.18)14(8.05)3(1.72)8(4.60)011(6.32)012(6.90)03(1.72)
6 to 10 persons (n = 49)19(38.78)10(20.41)6(12.24)06(12.42)3(6.12)00000
Over 10 persons (n= 52)26(50.00)19(36.54)7(13.46)00000000
Number of visitsOnce (n = 423)144(34.04)136(32.15)39(9.22)1(.024)27(6.38)3(0.71)25(5.91)1(0.24)26(6.15)5(1.18)7(1.65)
Twice (n = 151)54(35.76)59(39.07)14(9.27)05(3.31)09(5.96)2(1.32)4(2.65)2(1.32)2(1.32)
More than 3 times (n = 191)66(34.55)81(42.41)13(6.81)2(1.05)1(0.52)07(3.66)1(0.52)13(6.81)1(0.52)4(2.09)
Duration of stayWithin 2 h (n = 79)40(50.63)19(24.05)4(5.06)06(7.59)03(3.80)1(1.27)3(3.80)2(2.53)1(1.27)
Within 2 to 4 h (n = 571)183(32.05)211(36.95)54(9.46)1(0.18)26(4.55)3(0.53)31(5.43)2(0.35)34(5.95)5(0.88)11(1.93)
Within 4 to 6 h (n = 91)30(32.97)37(40.66)7(7.69)2(2.20)1(1.10)06(6.59)06(6.59)1(1.10)0
Over 6 h (n = 24)11(45.83)9(37.50)1(4.17)0001(4.17)1(4.17)001(4.17)
Integers are the number of visitors; decimal values in parentheses are the percentage of overall visitors. FB: Forest bath; FW: Forest walk; FV: Forest landscape; AAP: Animal and plant inspection; RFR: Ride a forest ramp; VFR: Visit the forest ramp; ESV: Enjoy the stream view; ET: Experience a route not traveled last time; AT: Admire the fall foliage; PH: Photography; LE: Leisure.
Table 2. Differences in visitor selections for different visitor attributes.
LWDODPCWTETCWPHPSFSDATPRSA
Sex(b) Sig.0.0830.000 **0.6510.1250.002 **0.3810.9800.030 *0.011 *0.4990.0830.074
Age(a) Sig.0.8340.045 *0.008 **0.3960.0990.000 **0.002 **0.000 **0.000 **0.3970.023 *0.177
Number of visitors(a) Sig.0.1620.000 **0.000 **0.1640.2320.009 **0.012 *0.2140.001 **0.2110.4800.083
Number of visits(a) Sig.0.5570.7530.3700.004 **0.027 *0.0640.1320.1220.4290.0690.5100.243
Duration of stay(a) Sig.0.021 *0.2610.5220.6440.5400.009 **0.1090.6950.2970.045 *0.3470.000 **
LW: Landscape the visitor wants to see; DOD: Degree of difficulty; PC: Pavement condition; WT: Watch the forest train; ET: Experience the forest bath; CW: Contact with landscape elements; PH: Photography; PS: Physical strength; FS: Facility status; DAT: Distance and time; PR: Privacy; SA: Satisfaction. a. Kruskal–Wallis test; b. Mann–Whitney U test; ** Significant at the 0.01 level; * Significant at the 0.05 level.
Table 3. Demographic characteristics of visitors with different durations of stay.
AgeNumber of VisitorsNumber of Visits
10 to 20 Years30 to 40 Years50 to 60 YearsOver 70 Years1 Person2 People3 to 5 People6 to 10 PeopleOver 10 PeopleOnceTwice3 or More Times
Within 2 h (n = 79)5 (6.33%)20 (25.32%)42 (53.16%)12 (15.19%)9 (11.39%)42 (53.16%)13 (16.46%)3 (3.80%)12 (15.19%)38 (48.10%)21 (26.58%)20 (25.32%)
Within 2–4 h (n = 571)36 (6.30%)171 (29.95%)298 (52.19%)66 (11.56%)19 (3.33%)349 (61.12%)117 (20.49%)46 (8.06%)40 (7.01%)333 (58.32%)109 (19.09%)129 (22.59%)
Within 4–6 h (n = 91)5 (5.49%)37 (40.66%)40 (43.96%)9 (9.89%)3 (3.30%)44 (48.35%)44 (48.35%)0 (0%)0 (0%)43 (47.25%)13 (14.29%)35
(38.46%)
Over 6 h (n = 24)0 (0%)11 (45.83%)11 (45.83%)2 (8.33%)2 (8.33%)22 (91.67%)0 (0%)0 (0%)0 (0%)9 (37.50%)8 (33.33%)7 (29.17%)
Table 4. Correlation analysis between different visitor attributes and trail selection preference indicators.
SexAgeNumber of VisitorsNumber of VisitsDuration of StayLWDODPCWTETCWPHPSFSDATPR
Sex −0.0310.108 **0.0040.086 *0.0630.159 **0.0160.0550.110 **0.0320.0010.078 *0.092 *−0.024−0.063
Age−0.031 0.208 **0.177 **0.026−0.0010.139 **0.120 **−0.020−0.0150.110 **−0.087 *0.161 **0.189 **0.0550.102 **
Number of visitors0.108 **0.208 ** 0.0170.0550.0500.200 **0.091 *0.108 **0.0580.043−0.0340.078 *0.092 *0.000−0.004
Number of visits0.0040.177 **0.017 0.113 **−0.038−0.0180.032−0.100 **0.0210.040−0.072 *0.0410.024−0.0330.031
Duration of stay0.086 *0.0260.0550.113 ** 0.112 **0.123 **0.101 **−0.0220.0590.0520.0360.112 **0.102 **−0.0110.033
Satisfaction0.065−0.0500.099 **0.0310.162 **0.175 **0.127 **0.0400.072 *0.285 **0.202 **0.123 **0.089 *0.103 **−0.0320.090 *
N765765765765765765765765765765765765765765765765
LW: Landscape the visitor wants to see; DOD: Degree of difficulty; PC: Pavement condition; WT: Watch the forest trail ET: Experience the forest bath; CW: Contact with landscape elements; PH: Photography; PS: Physical strength; FS: Facility status; ** Correlation is significant at the 0.01 level (2–tailed). * Correlation is significant at the 0.05 level (2–tailed).

