Diurnal and Seasonal Variations in Soil Respiration of Four Plantation Forests in an Urban Park
by
Mengxun Zhu
1, 
Wanlai Xue
2,
Hang Xu
1,
Yuan Gao
1,
Shengnan Chen
1,
Bin Li
3 and
Zhiqiang Zhang
1,* 1
Key Laboratory of Soil and Water Conservation, the State Forestry and Grassland Administration, College of Soil and Water Conservation, Beijing Forestry University, Beijing 100083, China
2
College of Water Resources and Civil Engineering, China Agricultural University, Beijing 100083, China
3
Gongqing Forest Farm, Beijing 101300, China
*
Author to whom correspondence should be addressed.
Forests 2019, 10(6), 513; https://0-doi-org.brum.beds.ac.uk/10.3390/f10060513
Submission received: 14 March 2019
/
Revised: 24 April 2019
/
Accepted: 13 June 2019
/
Published: 17 June 2019
(This article belongs to the Section Forest Ecology and Management)
Abstract
:Understanding the carbon dynamics of urban trees and forests is one of the key components for developing mitigation strategies for climate change in a fast-paced urbanized world. This study selected four plantation forests composed of poplar, black locust, Chinese pine and mixture of poplar and black locust, located in an urban forest park on a well-drained fluvial plain with same land-use history. The diurnal and seasonal changes in soil respiration (Rs) and biophysical factors were measured from April 2015 to March 2016. At the diurnal scale, Rs varied out of phase with soil temperature (Ts) and the time-lag occurred in May and July when Ts was relatively high and soil moisture (Ms) was low. Strong seasonal variations in Rs were mainly determined by Ts, while the growing-season mean Rs positively correlated with the fine root biomass (FRB), soil organic carbon content (SOC), and total nitrogen content (TN) for all the forests. FRB alone could explain 75% of the among-stand variability. This study concluded that urban forest plantations have similar soil respiration dynamics to forest ecosystems in non-urban settings.
1. Introduction
Urban trees and forests provide tremendous ecosystem services for people living in cities which are expanding significantly across the world in form of urban forest parks [1]. Well-managed urban forest parks not only have the entertainment value for the urban residents, but also have the ecological role in mitigating and adapting to climate change [2,3,4,5]. As unique ecosystems seriously affected by human disturbance, the decomposition of organic carbon in the soil and sequestration of atmospheric carbon in urban forest parks are receiving widespread attention [3,4]. Soil respiration (Rs) is the second largest terrestrial carbon flux in the global carbon cycle [6], thus its small change could considerably affect the concentration of CO2 in the atmosphere [7]. Rs vary greatly among ecosystems and are governed by different biotic and abiotic factors [8,9]. A greater understanding of the changes in soil CO2 efflux in the urban forest parks is needed to assess its role in regional and even global C cycle and other ecosystem services.
Rs from forest ecosystems is governed by multiple biotic and abiotic factors at different scales. Soil temperature (Ts) and soil moisture (Ms) are recognized as the main factors controlling the seasonal variations in Rs of regenerated forests [10,11]. Different tree species exhibited a similar seasonal pattern in Rs, following the trend of Ts, with maximum Rs rate in the summer months, minimum rates in winter both in natural ecosystems or urban forests [4,12,13]. However, at the diurnal scale, Rs and Ts may be decoupled, leading to a hysteresis effect in both secondary and plantation forests [10,14], and such hysteresis are affected by soil moisture conditions [15,16,17]. Lower soil moisture content could enhance this hysteresis relationship [17]. In contrast, Riveros Iregui et al. [18] found hysteresis under higher soil moisture content are more appreciably higher than under low Ms. Detecting and interpreting the decoupling between Rs and Ts in timescales of hours can be significant to explain the mechanisms that drive the Rs changes [15] and to estimate carbon dynamics of urban forest ecosystems more accurately.
Spatial variability of Rs in a forest ecosystem is related to root biomass and soil carbon content [19,20]. Roots may contribute to Rs directly and/or indirectly through heterotrophic organisms and altering the physical and chemical environment of the soil [21]. In addition, soil microbial community, stand structure, soil total nitrogen (TN), pH, bulk density, and total porosity are also considered factors that regulate Rs [20,22,23]. Due to the co-variation and interaction of these drivers, interpretation of spatial variability of Rs in different forest ecosystems is more complicated [24], and this is rarely investigated in urban forests.
Although the same climate, soil, topographical conditions and land use history in urban forest parks provide a unique opportunity for studying the Rs differences in urban forests [25], it remains unclear whether variations and governing factors in Rs within urban forest ecosystems are consistent with natural or plantation forests in non-urban environments [3,26]. Clearly, it is of great significance to elucidate the Rs dynamics with different tree species in urban settings for developing urban forest plans and designing better urban tree and forest management strategies to meet sustainable goals of cities. The authors, therefore, measured Rs and biophysical factors within four urban plantation forests composed by different native tree species in an urban forest park located in Beijing, China. Our specific objectives were: (1) To examine the diurnal variations in Rs of the urban park plantations; (2) to compare the seasonal variations in Rs with the non-urban environment; (3) to determine how the fine root biomass (FRB) and soil properties (Ts, Ms, soil organic carbon content (SOC), TN, pH) governing the Rs variations among the four urban forest plantations.
2. Materials and Methods
2.1. Site Description
This study was conducted in Gongqing Forest Park (40°06′30″ N, 116°42′30″ E, 9 m a.s.l.), one of the largest riverside urban forest parks in the city, located in Shunyi District, Beijing, China. The study site is situated a warm temperate zone and has a continental monsoon climate with hot and humid summers and cold and dry winters. Long-term observations (1981–2010) from the Shunyi Meteorological Station show that the mean annual air temperature is 12.3 °C, with a mean monthly minimum temperature of −4.0 °C in January and a maximum of 31.2 °C in July (Figure 1). The mean annual precipitation is 571 mm and over 80% falls between June and September. Four plantation forests with different species composition, including poplar (Populus euramericana cv.‘I-214’), black locust (Robinia pseudoacacia L.), Chinese pine (Pinus tabuliformis Carrière), and mixed poplar and black locust, were selected. The understory vegetation was dominated by Swida alba (L.) Opiz., Pinus bungeana Zucc. ex Endl., Flos Caryophylli, Sabina vulgaris Antoine, and Gaillardia aristata Pursh. The park is located on the Chao River fluvial plain with well-drained sandy soil. These plantations experienced the same climatic conditions, soil properties, topography, land-use history and management practices. The Chinese pine plantation was established after a clear-cut harvest of a pure poplar plantation in 2007. The characteristics of the plantations are summarized in Table 1.
2.2. Measurement of Soil Respiration, Temperature, and Moisture
The study randomly selected four measurement plots (10 × 10 m quadrats) within each plantation forest and two subsamples (i.e. soil respiration collars) in each plot. All plots were set at least a minimum of 5 m apart to avoid edge effects and polyvinyl chloride (PVC) collars were installed approximately 0.5–0.6 m distance from the trunk. Rs was measured on clear days, biweekly during the growing season and monthly in the winter (defined as the continuous period that mean daily soil surface temperature <0.5 °C) between 09:00 a.m. and 11:00 a.m. from April 2015 to March 2016. Rs data were recorded using an automated soil CO2 flux system (LI-8100, LI-COR, Lincoln, NE, USA) equipped with a portable chamber (Model 8100-103, LI-COR, Lincoln, NE, USA). The efflux rate during the measurement time was assumed to represent the daily average [27]. Additionally, diurnal Rs was measured at four-hour intervals beginning at 07:00 a.m. and ending at 07:00 a.m. the next day on 25 May, 16 June (Chinese pine plots not measured), 14 July, 9 August and 14 September 2015, respectively. One month before the measurements were conducted, at each plot, two PVC collars 20 cm in diameter and 11 cm in height were inserted into the soil to a depth about 4 cm. The litter layer depth was approximately 1 cm, and the PVC collar ensured the stability of the loose sand. There were not many roots in the loose sandy surface, therefore, the injury to topsoil roots during the mechanical insertion of the soil collar was assumed to have no significant influence on Rs [20,23]. The PVC collars were not moved throughout the measurement period. The plants within the collars were regularly clipped to the ground level, and the large litter or branches inside the collars was removed before measurement. Ts at 10 cm depth and volumetric soil water content (Ms) at 5 cm depth were measured by the LI-8100 system along with each Rs measurement. The average of two or three successively measured values (3 min for each cycle) generated from each PVC collars was used for data analysis. In addition, Ts was measured continuously with thermistor probes (TCVA107, CSI) in each plantation during winter (December to February) as well, but Ms was not.
2.3. Root Biomass and Soil Analysis
In October 2015, a soil core sample was collected using a 5 cm diameter stainless steel core from the soil surface (A horizon) down to 30 cm from each plot. A total of four soil cores were collected in each plantation. The SOC content was determined by using the dichromate oxidation method, the TN content by micro-Kjeldahl digestion procedure [28], and the soil pH by a glass electrode in a 1:5 soil solution ratio. A sequential soil coring method was used to investigate the fine root biomass (FRB). The authors considered the FRB in October and March as the biomass of fine roots in the growing season and non-growing season, respectively. A soil core (8 cm in diameter) was collected near the soil collar in each plot at 10 cm intervals to a depth of 30 cm in October 2015 and March 2016. Roots were washed in distilled water and then divided into fine (<2 mm diameter) and coarse components. The fine root samples were oven dried at 65 °C until constant weight.
2.4. Data Analyses and Estimation of Annual and Winter Rs
Rs data were fitted with Ts by an exponential regression function:
where Rs is the soil respiration, Ts the soil temperature at 10 cm, and a and b are the constant coefficients. The temperature sensitivity (Q10) can be estimated from the following equation:
Two approaches were applied to estimate both annual and winter season soil CO2 emissions for each plantation. They were estimated by interpolating the average Rs rate for each measurement day and the time between sampling dates for each month as follows (termed “Interpolated” later) [9,29]:
where RS’ is the amount of accumulation in the measurement season; Fm,k is the average of Rs over the interval (tk-1,tk) recorded; and Δtk is the number of days between each measurement within the month. In addition, annual and winter Rs also were estimated by aggregating Rs in every day for the period from 1 April 2015 to 31 March 2016 using the exponential regression model described above (Equation (1)) between Rs and Ts (termed empirical modelled hereafter), where daily Ts is obtained by an average of 24 hourly continuous measurements with thermistor probes in each plantation.
The regression analysis was used to examine the seasonal relationships between Rs and Ts and Ms. A combination of correlation analysis, linear regression and partial correlation analyses were used to evaluate the potential influencing factors (Ts, Ms, FRB, SOC, TN, pH) that drive the variation in Rs across stands. All analyses were performed using SPSS 20.0.
3. Results
3.1. Diurnal Variations
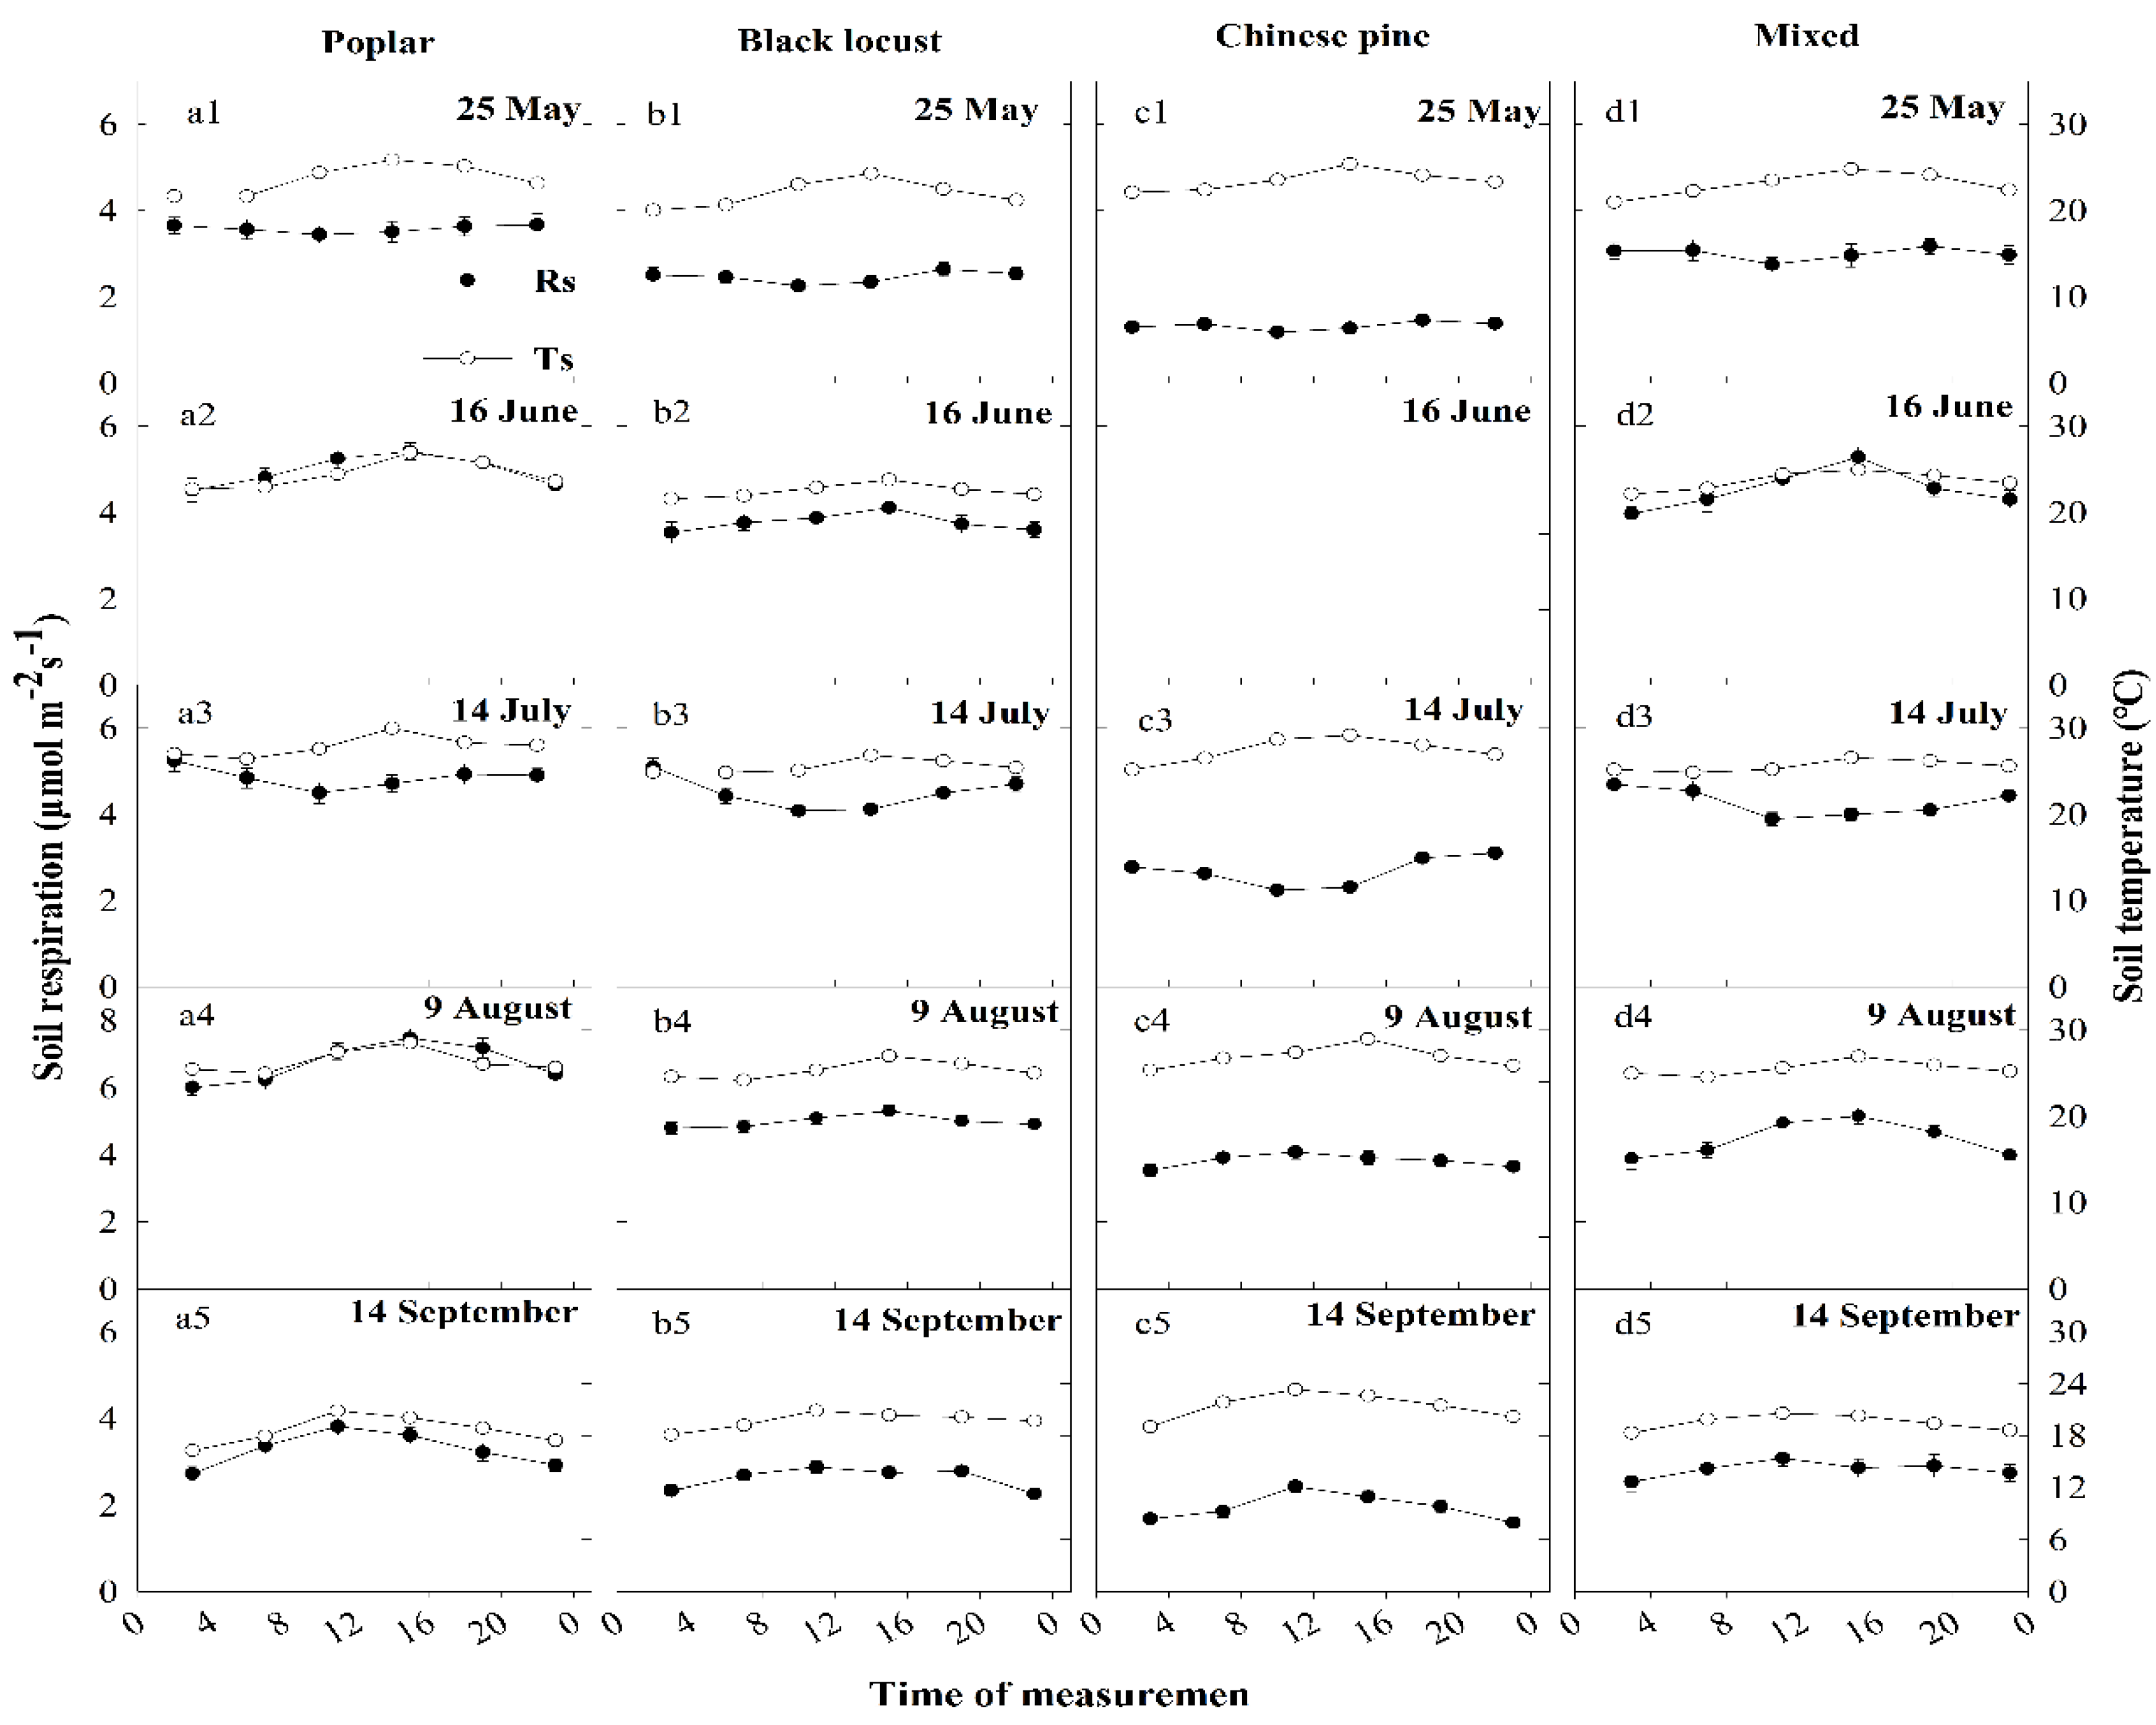
Diurnal variations in Rs show a similar pattern within the same month between four plantations (Figure 2a–d) but differed across different months within the same stand (Figure 2a1–a5, b1–b5; c1–c5 and d1–d5). In 16 June, 9 August and 14 September, Rs reached its daily maximum during 15:00 p.m. or 11:00 a.m., daily minimum during 3:00 a.m. or 23:00 p.m., corresponding to the changes in Ts (Figure 2). In contrast, in 25 May and 14 July, Rs reached its daily minimum during midday (11:00 a.m.) then leveled off and peaked during early morning or dusk (Figure 2). Rs was out of phase with Ts in all stands in 25 May and 14 July, when the Ms was relatively low (Figure 2 and Figure 3). Furthermore, each plantation exhibited a time lag trend between Rs and Ts in 25 May and 14 July (Figure 2).
Diurnal Ts at 10 cm depth also shows a similar trend among four plantations (Figure 2). The highest Ts occurred at approximately 15:00 p.m. or 11:00 a.m. and the lowest at approximately 07:00 a.m. or 03:00 a.m. across the five measuring days, presenting a considerable diurnal variation (Figure 2). The variation in Ms at 5 cm was either small or constant over a day among the patches (Figure 3). In addition, there are large rainfall intervals or small rainfalls before the measuring day in May and July (Figure A1 in Appendix A).
3.2. Seasonal Variations and Annual Soil Respiration Estimates
There was a strong seasonality in Rs (Figure 4a). The highest Rs rate from four stands all occurred in August, while the lowest is in January for poplar plantation or February for the other three (black locust, mixed poplar and Chinese pine). The mean growing season Rs of poplar, black locust, Chinese pine, mixed forests were 3.6 ± 0.3, 3.0 ± 0.2, 1.8 ± 0.1, 3.2 ± 0.3 μmol m−2 s−1 (mean ± SD), respectively (Figure 4). The mean winter Rs ranged from 0.7 to 0.9 μmol m−2 s−1 (Figure 4a), which was 25%–46% of the annual Rs among the four stands. Annual total soil CO2 effluxes were 547–1051 (Interpolated) and 516.9–1041 (Empirically Modeled) g C m−2year−1, winter soil CO2 effluxes were 67.7–82.7 (Interpolated) and 58.8–73.1 (Empirically Modeled) g C m −2, respectively among the stands (Table 2).
Ts peaked in mid-August, and the mean growing season Ts ranged from 17.3–18.2 °C and the mean winter Ts ranged from (−0.8)–(−1.2) °C for the four stands (Figure 4b). The mean growing season Ms was 8.7%, 9.3%, 8.8%, and 8.4% for the poplar, black locust, mixed poplar and black locust, and Chinese pine plantations (Figure 4c).
3.3. The Effects of Biotic and Abiotic Factors on Soil Respiration
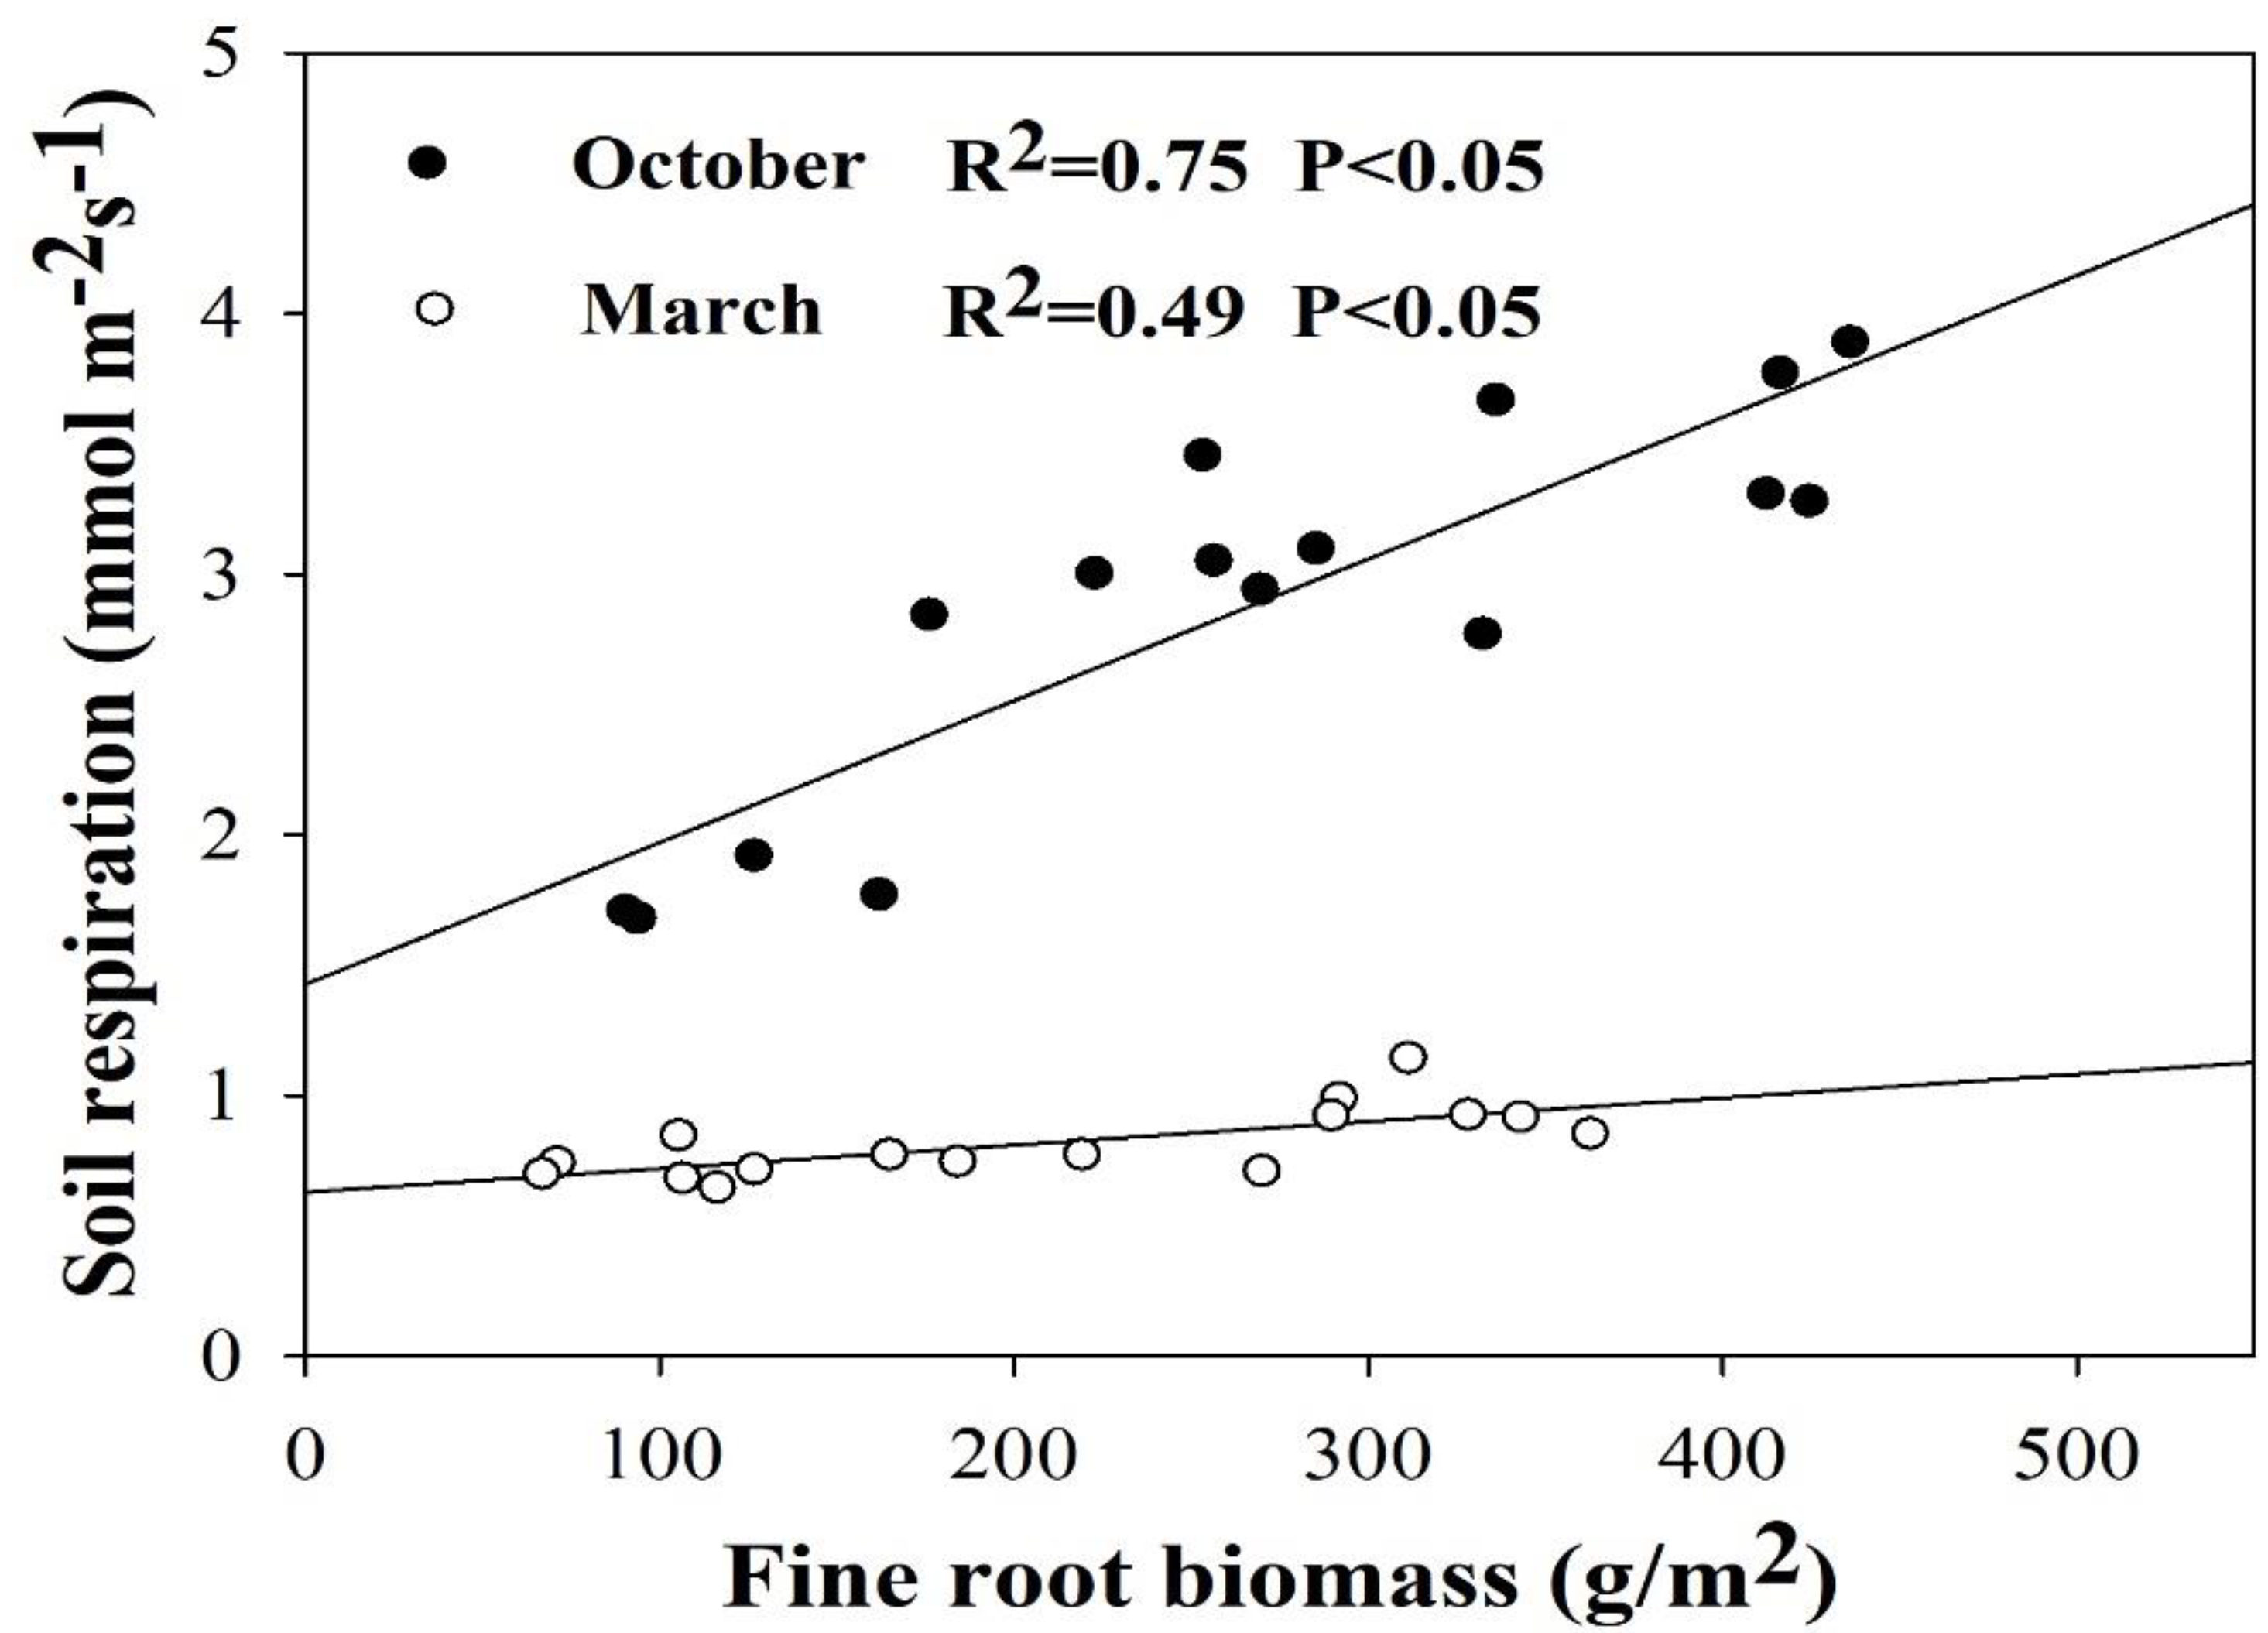
Although Rs was significantly correlated with Ts and Ms (p < 0.01), Ts alone could explain 78%–91% of the seasonal changes in Rs (Figure 5). The sensitivity of Rs to Ts at a 10 cm depth (Q10) was 1.7 ± 0.04, 2.0 ± 0.03, 2.1 ± 0.05, and 2.0 ± 0.05 for Chinese pine, poplar, black locust, and mixed stand, respectively. The averaged FRB of each stand in October was higher than that in March (p < 0.05). The lowest FRB was observed in the Chinese pine plantation. The average Rs during the growing season was significantly and positively correlated with the SOC content (R2 = 0.61), TN content (R2 = 0.66), and FRB (R2 = 0.89) but not with the soil pH, mean Ts and Ms (Table 3) among the four stands. Rs was significantly correlated with FRB when other biotic and abiotic factors were excluded (Table 3).
4. Discussion
4.1. Diurnal Soil Respiration Variation in Relation to Soil Temperature and Soil Moisture
The diurnal response of Rs to Ts was regulated by soil moisture status, even though the diurnal variation in Ms compared with Ts had little or no variation in the measurement day than in five months (Figure 2 and Figure 3) [10]. However, a significant difference (p < 0.05) was observed in Ms among the measurement days in the five months in each tree species (e.g., (9 August > 14 September > 16 June > 14 July > 25 May) (Figure 3). The diurnal variation in Rs followed the Ts when the Ms was relatively high (Ms > 8.3%) in 16 June, 9 August and 14 September (Figure 2). Yet, diurnal Rs oscillated out of the phase with Ts when the Ms was low in 25 May and 14 July, with a time lag (Figure 2 and Figure 3). This was consistent with some studies that have reported diurnal hysteresis between Rs and Ts in different ecosystems, even having similar tree species with our study [10,14,15,16]. The relatively large measurement interval (total six measurements in 24 hours) in Rs may not well capture the hysteresis between Rs and Ts [30]. This study emphasized that when the Ms was limited, the time lag between Rs and Ts will be easier to observe. Wang et al. [17] also reported that the hysteresis between Rs and Ts was negatively affected by low soil moisture conditions. The hysteresis can be explained by two main processes, one is the physical process caused by the heat and CO2 transport in soils, the other is the biological mechanism of carbon supply from photosynthate and changes in the relative contribution of autotrophic and heterotrophic respiration to total Rs [15,18,30]. For our sandy soils with high porosity (Table 1), the effect of low Ms on gas diffusion may be small enough. We inferred that biological processes dominated the diurnal hysteresis in the urban forest park, like in a desert ecosystem with sandy soils [17]. There is hysteresis between canopy photosynthesis and Ts, and the range from hours to weeks. For prolonged drought, heterotrophic respiration suffer more suppressed and a higher contribution of autotrophic respiration (closely related with photosynthesis) to total Rs [30,31]. The independence of Rs from Ts for low Ms was due to the dominant factor transition from temperature to photosynthesis [30,32]. In addition, the Rs declined against the increasing Ts in midday and then plateaued in 25 May and 14 July (Figure 2). The plants’ responses to low Ms by closing partially the leaf stomata, especially under conditions of high air temperature [17], lead to the reduced photosynthesis and root activity and suppressed autotrophic respiration [33].
4.2. The Seasonal Variations in Soil Respiration
Rs exhibited strong seasonal variation in the four plantations that is consistent with the previous studies conducted in non-urban settings for similar needle leaf and broadleaf deciduous tree species forests (Table 4). Rs increased with the rising of Ts in spring, peaked in summer and declined in autumn. Rs peaking between July or August could be attributed to the relatively high Ms and Ts [23] (Figure 4). The measured values of Rs in the urban forest park were in a range comparable with those measured in other non-urban forests (Figure 4 and Table 4). The mean Rs 2.0 (April to October) and 2.2 (May–Oct) μmol m−2 s−1 in the Chinese pine stand were lower than those reported by Ma et al. [34] and Wang et al. [35], but similar to Zhao et al. [36] for the pine plantation in the North and Northeast of China. The higher stem density, age or the different soil properties of the forests may be the reason why they were different from our results. In addition, the mean Rs were 4.1 ± 0.3 (May–Sep) and 4.5 ± 0.2 (May–Oct) μmol m−2 s−1 in the black locust stand higher than those studies from non-urban forest ecosystems (Table 4). The averaged Rs of 4.9 (May–Sep) and 4.5 (May–Oct) μmol m−2 s−1 for poplar plantations were also a little higher than those studies with the similar tree species in different regions (Table 4). This may be attributed to, in our urban forest park, the relatively higher mean annual air temperature and lower stem density. Lower canopy coverage increases Ts [37], and higher Ts could increase soil microbiota activities by effecting the affinity of the enzyme for substrates, and influences on root respiration, resulting in Rs increase [10]. In addition, the three broad-leaved forests are older than the forests in Table 4. Bolstad et al. [38] reported as litter mass accumulates in older age, Rs increased from 24–27 years to 42–48 years old in aspen stands.
It was estimated by model that Rs rates were generally below 0.26 μmolm−2s−1 during the winter with the mean air temperatures from −15 to −5 °C [43]. Due to frozen soil, the average winter Rs (December to February) among the four tree species was similar, ranging from 0.7 to 0.9 μmol m−2 s−1 (Figure 4). Winter respiration in the urban forest park in this study was higher than predicted by several other studies conducted in similar forest types located in the similar latitude [29,44,45]. The differences of winter soil CO2 efflux among those different sites was mainly determined by the subsurface temperature [46]. The mean winter soil temperature ranging from −0.9 to −1.2 °C in our study was higher than −5.71 to −5.34 °C reported by [29]. The warmer soil was most likely conductive to microbial and root respiration even under frozen soil conditions.
The annual soil CO2 efflux estimates by two methods in three broadleaf stands and one coniferous stand were within the range of value reported by previous studies for temperate deciduous forests (603–1258 g C m−2 year−1) and coniferous forests (425–970 g C m−2 year−1) [14,34,35,47]. The estimates of annual soil CO2 effluxes at the urban forest park were similar or higher than the values reported for similar tree species in the non-urban forests (Table 4). The differences in annual emission among different forest ecosystems are driven by different biological and environmental factors. In addition, the contribution of winter Rs to annual soil CO2 efflux in broadleaf (7.3%–8.7% by interpolated or 7.0–7.5 by Empirically Modeled) and coniferous forests (12.7% by interpolated or 11.4% by Empirically Modeled) fell within the reported values (4%–19%) in the non-urban forest ecosystems [9,29,48].
4.3. Seasonal Response of Soil Respiration to Soil Temperature and Soil Moisture
Ts and Ms are two dominant factors controlling the Rs in forest ecosystems [22,39,49], leading to significant seasonal variations (Figure 4). The significant correlations between Rs and Ts, as well as Rs and Ms (p < 0.01), in this urban forest park is similar to those measured in other forest ecosystems [13,35,39]. Ts explained 91%, 89%, 78%, and 89% of the seasonal variation in Rs for the poplar, black locust, Chinese pine, and mixed patches, respectively (Figure 5). The strong exponential relationship between Rs to Ts is supported by numerous studies in different non-urban forest ecosystems with forest types similar to this study [35,41,42]. Very dry soil conditions also significantly affected the Rs [50]. The low moisture content inhibits the Rs at least occasionally for many forest ecosystems [49,51,52]. The lower Ms measured in May (3.4% ± 0.4%) and July (4.9% ± 0.7%) corresponded to the sharp decrease in Rs (Figure 4a,c). Low Ms limits microbial biomass and activity by restricting access to C substrates, reducing the diffusivity of dissolved materials [10], and autotrophic respiration can be nearly zero when the Ms is extremely low for a period of time [39].
The annual Q10 of the four stands were 1.7 ± 0.04 (Chinese pine), 2.0 ± 0.03 (poplar), 2.1 ± 0.05 (black locust), and 2.0 ± 0.05 (the mixed). Temperature increases had less influence on soil respiration rates for Chinese pine stand than on the other three. In addition, the annual Q10 were lower than those reported of natural or planted forests with higher average Ms in other regions [22,47] (Table 4). Similar to this study, lower annual Q10 of black locust forests with relatively lower Ms were also found at Mount Taihang and Loess Plateau in China [23,39]. Lower Ms limited the diffusion of C substrates and root respiration, and masked the sensitivity of Rs to the variations of Ts [53]. Whether this can translate to the lower potential to release CO2 with relatively low annual average Ms under warming climate remains to be explored.
4.4. Among-Stand Variations of the Soil Respiration
In the urban forest park in this study, the mean growth season Rs was significantly correlated with the SOC content, TN content, and FRB, while there were no significant correlations between the Rs and the soil pH, mean growing season Ts, and mean growing season Ms among-stands (Table 3). Some studies across various forest ecosystems indicated that Rs is positively correlated with SOC content, TN content, and FRB [19,20,22]. Furthermore, the partial correlation analysis found that only FRB explained the mean Rs during the growing season among the biotic and abiotic factors in our study (Table 3) [3]. In addition, Wang et al. [49] observed that Rs was higher in forests with higher FRB in temperate zones. These consistent results indicated that plant Photosynth ate plays an important role in regulating Rs. Rs in summer was more strongly correlated with FRB than in winter (Figure 6), probably because the fine roots exhibited considerable phenological seasonality and trees become dormant during winter [39,54].
5. Conclusions
Four widely distributed tree species in an urban forest park in northern China provided a unique opportunity for studying the vegetation and seasonal variations in Rs and its responses to biotic and abiotic factors. For all four forest plantations, the diurnal changes in Rs became decoupled from Ts when Ms was limited during the growing season. Strong seasonal variability of Rs for these urban forests was governed mainly by Ts and Ms, while the spatial variability of the Rs in the urban forest park was significantly correlated with FRB, SOC content and TN content. This study concluded that urban forest plantations have similar soil respiration dynamics with forest ecosystems in non-urban settings, and species selection is critical for urban forest establishment and management to cope with climate change.
Author Contributions
M.Z. designed the field experiments, conducted the data analysis and draft the manuscript; W.X., H.X., Y.G., S.C., B.L. performed the filed experiments; Z.Z. instructed the research and worked on the draft and finalizing the writing of the paper.
Funding
This study was financially supported by the National Science and Technological Development Program (Grant No. 2015BAD07B06-4) and National Special Research Program for Forestry entitled “Forest Management Affecting the Coupling of Ecosystem Carbon and Water Exchange with Atmosphere” (No.201204102). The first author also acknowledges support from the Beijing Education Commission scientific research and postgraduate training project (No.BLCXY2016).
Acknowledgments
We thank Gongqing (Shunyi) urban park for providing the experimental sites. We are grateful to Xin jia and Asko Noormets for constructive and helpful comments on the manuscript. The constructive comments and reviews by two anonymous reviewers are greatly appreciated for improving the original version of the paper.
Conflicts of Interest
The authors declare no conflicts of interest.
Appendix A
Figure A1.
Monthly precipitation during April to November in 2015.

References
- Seto, K.C.; Guneralp, B.; Hutyra, L.R. Global forecasts of urban expansion to 2030 and direct impacts on biodiversity and carbon pools. Proc. Natl. Acad. Sci. USA 2012, 109, 16083–16088. [Google Scholar] [CrossRef] [PubMed] [Green Version]
- Millward, A.A.; Sabir, S. Benefits of a forested urban park: What is the value of Allan Gardens to the city of Toronto, Canada? Landsc. Urban Plan. 2011, 100, 177–188. [Google Scholar] [CrossRef]
- Wu, X.; Yuan, J.; Ma, S.; Feng, S.; Zhang, X.; Hu, D. Seasonal spatial pattern of soil respiration in a temperate urban forest in Beijing. Urban For. Urban Green. 2015, 14, 1122–1130. [Google Scholar] [CrossRef] [Green Version]
- Weissert, L.F.; Salmond, J.A.; Schwendenmann, L. Variability of soil organic carbon stocks and soil CO2 efflux across urban land use and soil cover types. Geoderma 2016, 271, 80–90. [Google Scholar] [CrossRef]
- Li, W.; Bai, Z.; Jin, C.; Zhang, X.; Guan, D.; Wang, A.; Yuan, F.; Wu, J. Science of the Total Environment The in fl uence of tree species on small scale spatial heterogeneity of soil respiration in a temperate mixed forest. Sci. Total Environ. 2017, 590–591, 242–248. [Google Scholar] [CrossRef] [PubMed]
- Raich, J.W.; Schlesinger, W.H. The global carbon dioxide flux in soil respiration and its relationship to vegetation and climate. Tellus Ser. B-Chem. Phys. Meteorol. 1992, 44, 81–99. [Google Scholar] [CrossRef] [Green Version]
- Piao, S.; Fang, J.; Ciais, P.; Peylin, P.; Yao, H.; Sitch, S.; Wang, T. The carbon balance of terrestrial ecosystems in China. Nature 2009, 458, 7241. [Google Scholar] [CrossRef] [PubMed]
- Vesterdal, L.; Elberling, B.; Christiansen, J.R.; Callesen, I.; Schmidt, I.K. Soil respiration and rates of soil carbon turnover differ among six common European tree species. For. Ecol. Manag. 2012, 264, 185–196. [Google Scholar] [CrossRef]
- Shi, W.; Yan, M.; Zhang, J.; Guan, J.; Du, S. Soil CO2 emissions from five different types of land use on the semiarid Loess Plateau of China, with emphasis on the contribution of winter soil respiration. Atmos. Environ. 2014, 88, 74–82. [Google Scholar] [CrossRef]
- Gaumont-Guay, D.; Black, T.A.; Griffis, T.J.; Barr, A.G.; Jassal, R.S.; Nesic, Z. Interpreting the dependence of soil respiration on soil temperature and water content in a boreal aspen stand. Agric. For. Meteorol. 2006, 140, 220–235. [Google Scholar] [CrossRef]
- Khomik, M.; Arain, M.A.; McCaughey, J.H. Temporal and spatial variability of soil respiration in a boreal mixedwood forest. Agric. For. Meteorol. 2006, 140, 244–256. [Google Scholar] [CrossRef]
- Tang, X.; Liu, S.; Zhou, G.; Zhang, D.; Zhou, C. Soil-atmospheric exchange of CO2, CH4, and N2O in three subtropical forest ecosystems in southern China. Glob. Chang. Biol. 2006, 12, 546–560. [Google Scholar] [CrossRef]
- Liu, X.P.; Zhang, W.J.; Hu, C.S.; Tang, X.G. Soil greenhouse gas fluxes from different tree species on Taihang Mountain, North China. Biogeosciences 2014, 11, 1649–1666. [Google Scholar] [CrossRef] [Green Version]
- Jia, X.; Zha, T.; Wu, B.; Zhang, Y.; Chen, W.; Wang, X.; Yu, H.; He, G. Temperature Response of Soil Respiration in a Chinese Pine Plantation: Hysteresis and Seasonal vs. Diel Q10. PLoS ONE 2013, 8, 2. [Google Scholar] [CrossRef] [PubMed]
- Phillips, C.L.; Nickerson, N.; Risk, D.; Bond, B.J.; Tang, J.; Baldocchi, D.D.; Xu, L. Interpreting diel hysteresis between soil respiration and temperature. Glob. Chang. Biol. 2011, 17, 515–527. [Google Scholar] [CrossRef]
- Tang, J.; Baldocchi, D.D.; Xu, L. Tree photosynthesis modulates soil respiration on a diurnal time scale. Glob. Chang. Biol. 2005, 11, 1298–1304. [Google Scholar] [CrossRef]
- Wang, B.; Zha, T.S.; Jia, X.; Wu, B.; Zhang, Y.Q.; Qin, S.G. Soil moisture modifies the response of soil respiration to temperature in a desert shrub ecosystem. Biogeosciences 2014, 11, 259–268. [Google Scholar] [CrossRef] [Green Version]
- Riveros Iregui, D.A.; Emanuel, R.E.; Muth, D.J.; McGlynn, B.L.; Epstein, H.E.; Welsch, D.L.; Pacific, V.J.; Wraith, J.M. Diurnal hysteresis between soil CO2 and soil temperature is controlled by soil water content. Geophys. Res. Lett. 2007, 34, 1–5. [Google Scholar] [CrossRef]
- Wang, H.; Liu, S.; Wang, J.; Shi, Z.; Lu, L.; Zeng, J.; Ming, A.; Tang, J.; Yu, H. Effects of tree species mixture on soil organic carbon stocks and greenhouse gas fluxes in subtropical plantations in China. For. Ecol. Manag. 2013, 300, 4–13. [Google Scholar] [CrossRef]
- Song, X.; Yuan, H.; Kimberley, M.O.; Jiang, H.; Zhou, G.; Wang, H. Soil CO2 flux dynamics in the two main plantation forest types in subtropical China. Sci. Total Environ. 2013, 444, 363–368. [Google Scholar] [CrossRef]
- Kuzyakov, Y.; Cheng, W. Photosynthesis controls of rhizosphere respiration and organic matter decomposition. Soil Biol. Biochem. 2001, 33, 1915–1925. [Google Scholar] [CrossRef]
- Luan, J.; Liu, S.; Zhu, X.; Wang, J.; Liu, K. Roles of biotic and abiotic variables in determining spatial variation of soil respiration in secondary oak and planted pine forests. Soil Biol. Biochem. 2012, 44, 143–150. [Google Scholar] [CrossRef]
- Zeng, X.; Zhang, W.; Shen, H.; Cao, J.; Zhao, X. Soil respiration response in different vegetation types at Mount Taihang, China. Catena 2014, 116, 78–85. [Google Scholar] [CrossRef]
- Adachi, M.; Sakata, Y.; Konuma, A. Required sample size for estimating soil respiration rates in large areas of two tropical forests and of two types of plantation in Malaysia. For. Ecol. Manag. 2005, 210, 455–459. [Google Scholar] [CrossRef]
- Chen, W.; Jia, X.; Zha, T.; Wu, B.; Zhang, Y.; Li, C.; Wang, X.; He, G.; Yu, H.; Chen, G. Soil respiration in a mixed urban forest in China in relation to soil temperature and water content. Eur. J. Soil Biol. 2013, 54, 63–68. [Google Scholar] [CrossRef]
- Bae, J.; Ryu, Y. Spatial and temporal variations in soil respiration among different land cover types under wet and dry years in an urban park. Landsc. Urban Plan. 2017, 167, 378–385. [Google Scholar] [CrossRef]
- Wang, X.; Zhao, J.; Wu, J.; Chen, H.; Lin, Y.; Zhou, L.; Fu, S. Impacts of understory species removal and/or addition on soil respiration in a mixed forest plantation with native species in southern China. For. Ecol. Manag. 2011, 261, 1053–1060. [Google Scholar] [CrossRef]
- Bremner, J.M. Determination of nitrogen in soil by the Kjeldahl method. J. Agric. Sci. 1960, 55, 11–33. [Google Scholar] [CrossRef]
- Wang, W.; Peng, S.; Wang, T.; Fang, J. Winter soil CO2 efflux and its contribution to annual soil respiration in different ecosystems of a forest-steppe ecotone, north China. Soil Biol. Biochem. 2010, 42, 451–458. [Google Scholar] [CrossRef]
- Wang, B.; Zha, T.S.; Jia, X.; Gong, J.N.; Bourque, C.; Feng, W.; Tian, Y.; Wu, B.; Qing Zhang, Y.; Peltola, H. Soil water regulates the control of photosynthesis on diel hysteresis between soil respiration and temperature in a desert shrubland. Biogeosciences 2017, 14, 3899–3908. [Google Scholar] [CrossRef] [Green Version]
- Casals, P.; Lopez-Sangil, L.; Carrara, A.; Gimeno, C.; Nogués, S. Autotrophic and heterotrophic contributions to short-term soil CO2 efflux following simulated summer precipitation pulses in a Mediterranean dehesa. Glob. Biogeochem. Cycles 2011, 25, 3. [Google Scholar] [CrossRef]
- Vargas, R.; Allen, M.F.; Allen, E. Environmental controls and the Influence of vegetation type, fine roots and rhizomorphs on diel and seasonal variation in soil respiration. New Phytol. 2008, 179, 460–471. [Google Scholar] [CrossRef] [PubMed]
- Chaves, M.M.; Pereira, J.S.; Maroco, J.; Rodrigues, M.L.; Ricardo, C.P.P.; Osório, M.L.; Carvalho, I.; Faria, T.; Pinheiro, C. How plants cope with water stress in the field? Photosynthesis and growth. Ann. Bot. 2002, 89, 907–916. [Google Scholar] [CrossRef] [PubMed]
- Ma, Y.; Piao, S.; Sun, Z.; Lin, X.; Wang, T.; Yue, C.; Yang, Y. Stand ages regulate the response of soil respiration to temperature in a Larix principis-rupprechtii plantation. Agric. For. Meteorol. 2014, 184, 179–187. [Google Scholar] [CrossRef]
- Wang, C.; Yang, J.; Zhang, Q. Soil respiration in six temperate forests in China. Glob. Chang. Biol. 2006, 12, 2103–2114. [Google Scholar] [CrossRef]
- Zhao, B.; Cao, J.; Geng, Y.; Zhao, X.; von Gadow, K. Inconsistent responses of soil respiration and its components to thinning intensity in a Pinus tabuliformis plantation in northern China. Agric. For. Meteorol. 2019, 265, 370–380. [Google Scholar] [CrossRef]
- R.McCarthy, D.; Brown, K.J. Soil respiration responses to topography, canopy cover, and prescribed burning in an oak-hickory forest in southeastern Ohio. For. Ecol. Manag. 2006, 237, 94–102. [Google Scholar] [CrossRef]
- Bolstad, P.V.; Davis, K.J.; Martin, J.; Cook, B.D.; Wang, W. Component and whole-system respiration fluxes in northern deciduous forests. Tree Physiol. 2004, 24, 493–504. [Google Scholar] [CrossRef]
- Shi, W.; Zhang, J.; Yan, M.; Yamanaka, N.; Du, S. Seasonal and diurnal dynamics of soil respiration fluxes in two typical forests on the semiarid Loess Plateau of China: Temperature sensitivities of autotrophs and heterotrophs and analyses of integrated driving factors. Soil Biol. Biochem. 2012, 52, 99–107. [Google Scholar] [CrossRef]
- Yan, M.; Zhang, X.; Zhou, G.; Gong, J.; You, X. Temporal and spatial variation in soil respiration of poplar plantations at different developmental stages in Xinjiang, China. J. Arid Environ. 2011, 75, 51–57. [Google Scholar] [CrossRef]
- Tang, J.; Bolstad, P.V.; Martin, J.G. Soil carbon fluxes and stocks in a Great Lakes forest chronosequence. Glob. Chang. Biol. 2009, 15, 145–155. [Google Scholar] [CrossRef] [Green Version]
- Arevalo, C.B.M.; Bhatti, J.S.; Chang, S.X.; Jassal, R.S.; Sidders, D. Soil respiration in four different land use systems in north central Alberta, Canada. J. Geophys. Res. Biogeosci. 2010, 115, 1–12. [Google Scholar] [CrossRef]
- Raich, J.W.; Potter, C.S. Global patterns of carbon dioxide emissions from soils. Glob. Biogeochem. Cycles 1995, 9, 23–36. [Google Scholar] [CrossRef] [Green Version]
- Suzuki, S.; Ishizuka, S.; Kitamura, K.; Yamanoi, K.; Nakai, Y. Continuous estimation of winter carbon dioxide efflux from the snow surface in a deciduous broadleaf forest. J. Geophys. Res. Atmos. 2006, 111, 2156–2202. [Google Scholar] [CrossRef]
- Hubbard, R.M.; Ryan, M.G.; Elder, K.; Rhoades, C.C. Seasonal patterns in soil surface CO2 flux under snow cover in 50 and 300 year old subalpine forests. Biogeochemistry 2005, 73, 93–107. [Google Scholar] [CrossRef]
- Elberling, B. Annual soil CO2 effluxes in the High Arctic: the role of snow thickness and vegetation type. Soil Biol. Biochem. 2007, 39, 646–654. [Google Scholar] [CrossRef]
- Kim, D.-G.; Mu, S.; Kang, S.; Lee, D. Factors controlling soil CO2 effluxes and the effects of rewetting on effluxes in adjacent deciduous, coniferous, and mixed forests in Korea. Soil Biol. Biochem. 2010, 42, 576–585. [Google Scholar] [CrossRef]
- Schindlbacher, A.; Zechmeister-Boltenstern, S.; Glatzel, G.; Jandl, R. Winter soil respiration from an Austrian mountain forest. Agric. For. Meteorol. 2007, 146, 205–215. [Google Scholar] [CrossRef]
- Ngao, J.; Epron, D.; Delpierre, N.; Bréda, N.; Granier, A.; Longdoz, B. Spatial variability of soil CO2 efflux linked to soil parameters and ecosystem characteristics in a temperate beech forest. Agric. For. Meteorol. 2012, 154–155, 136–146. [Google Scholar] [CrossRef]
- Reichstein, M.; Rey, A.; Freibauer, A.; Tenhunen, J.; Valentini, R.; Banza, J.; Casals, P.; Cheng, Y.; Grünzweig, J.M.; Irvine, J.; et al. Modeling temporal and large-scale spatial variability of soil respiration from soil water availability, temperature and vegetation productivity indices. Glob. Biogeochem. Cycles 2003, 17, 11–15. [Google Scholar] [CrossRef]
- Curiel, Y.J.; Janssens, I.A.; Carrara, A.; Meiresonne, L.; Ceulemans, R. Interactive effects of temperature and precipitation on soil respiration in a temperate maritime pine forest. Tree Physiol. 2003, 23, 1263–1270. [Google Scholar]
- Rey, A.; Pegoraro, E.; Tedeschi, V.; De Parri, I.; Jarvis, P.G.; Valentini, R. Annual variation in soil respiration and its components in a coppice oak forest in Central Italy. Glob. Chang. Biol. 2002, 8, 851–866. [Google Scholar] [CrossRef]
- Xu, M.; Qi, Y. Temperature are negatively correlated through a simple linear relationship with R2 values moisture are positively correlated with R2 values Q10. Glob. Biogeochem. Cycles 2001, 15, 687–696. [Google Scholar] [CrossRef]
- Widén, B.; Majdi, H. Soil CO2 efflux and root respiration at three sites in a mixed pine and spruce forest: seasonal and diurnal variation. Can. J. For. Res. 2001, 31, 786–796. [Google Scholar] [CrossRef]
Figure 1.
The mean air temperature and precipitation in different month from 1981 to 2010.

Figure 2.
Diurnal variations in soil respiration (μmol m−2 s−1) and soil temperature (°C) for different stands: poplar (a), black locust (b), Chinese pine (c); and mixed poplar and black locust (d), respectively, in 25 May (a1, b1, c1, d1), 16 June (a2, b2, c2, d2), 14 July (a3, b3, c3, d3), 9 August (a4, b4, c4, d4), and 14 September (a5, b5, c5, d5). The black solid circles represent the soil respiration and hollow circles represent the soil temperature; bars represent standard errors (n = 4).

Figure 3.
Diurnal variations in soil moisture (5 cm deep) for the five selected date in different months: (a) poplar; (b) black locust; (c) Chinese pine; and (d) mixed poplar and black locust. The bars represent standard errors (n = 4).
Figure 3.
Diurnal variations in soil moisture (5 cm deep) for the five selected date in different months: (a) poplar; (b) black locust; (c) Chinese pine; and (d) mixed poplar and black locust. The bars represent standard errors (n = 4).

Figure 4.
The mean monthly changes in (a) soil respiration (μmol m−2 s−1), (b) soil temperature (℃) and (c) soil moisture (%) at each patch from April 2015 to March 2016. March-November is the growing season; December-February is a non-growing season. The bars represent standard errors (n = 4).
Figure 4.
The mean monthly changes in (a) soil respiration (μmol m−2 s−1), (b) soil temperature (℃) and (c) soil moisture (%) at each patch from April 2015 to March 2016. March-November is the growing season; December-February is a non-growing season. The bars represent standard errors (n = 4).

Figure 5.
The relationship between the soil respiration and soil temperature (a) and soil moisture (b) at each of the four plantations during period of April 2015 to March 2016. The solid circle, open circle, solid triangle and open triangle indicate the points of data in the poplar, black locust, Chinese pine and mixed poplar and black locust, respectively. The solid line (y = 0.8518 e0.0702x, R2 = 0.91), dotted line (y = 0.7214 e0.0717x, R2 = 0.89), dashed line (y = 0.6466 e0.0499x, R2 = 0.78) and dashed-dotted (y = 0.8092 e0.0696x, R2 = 0.89) indicate the regression curves of the soil respiration and soil temperature (a), indicate the line regression curves of the soil respiration and soil moisture (b). All the regression relationships were significant at the 1% level.

Figure 6.
The relationship between soil respiration and fine root biomass measured in October 2015 and March 2016 among the four species (n = 16).
Figure 6.
The relationship between soil respiration and fine root biomass measured in October 2015 and March 2016 among the four species (n = 16).


Table 1.
Mean diameter and height, density, age and soil texture, soil organic carbon, total nitrogen, pH and fine root biomass in the four plantation forests. Oct: October, Mar: March.
Table 1.
Mean diameter and height, density, age and soil texture, soil organic carbon, total nitrogen, pH and fine root biomass in the four plantation forests. Oct: October, Mar: March.
| Tree Species | Poplar | Black Locust | Mixed | Chinese Pine | |
|---|---|---|---|---|---|
| Poplar | Black Locust | ||||
| Diameter at breast height (cm) | 26.4 ± 5.7 | 18.7 ± 3 | 30.1 ± 1.7 | 16.5 ± 4.6 | 12 ± 1.1 |
| Tree height (m) | 17.2 ± 1.6 | 10.7 ± 3.5 | 18.5 ± 1.9 | 8.4 ± 2.0 | 3.4 ± 0.5 |
| Age of forest (years) | 36 | 43 | 40 | 40 | 12 |
| Stem density (trees/ha) | 367 | 400 | 367 | 450 | |
| Total soil porosity (0–30 cm) | 46% | 42% | 40% | 38% | |
| Sand (%) | 92 ± 0.3 | 92 ± 0.3 | 94 ± 1 | 93 ± 2 | |
| Silt (%) | 2 ± 1.3 | 3 ± 1.6 | 2 ± 0.3 | 3 ± 1.4 | |
| Clay (%) | 6 ± 1.6 | 5 ± 1.3 | 4 ± 1.4 | 4 ± 1 | |
| Bulk density (g cm−3) | 1.51 ± 0.05 | 1.43 ± 0.04 | 1.45 ± 0.03 | 1.56 ± 0.05 | |
| Soil organic carbon (g kg−1) | 2.79 ± 0.23 | 2.78 ± 0.35 | 3.78 ± 0.3 | 1.94 ± 0.45 | |
| Total nitrogen (g kg−1) | 0.13 ± 0.01 | 0.17 ± 0.03 | 0.14 ± 0.02 | 0.08 ± 0.01 | |
| pH | 8.3 ± 0.3 | 7.7 ± 0.2 | 8.0 ± 0.2 | 8.2 ± 0.3 | |
| Fine root biomass (g/m2) | Oct: 379.4 ± 74.7 | Oct: 238.4 ± 49.3 | Oct: 337.5 ± 70.0 | Oct: 118.1 ± 33.5 | |
| Mar: 318.0 ± 46.3 | Mar: 171.0 ± 42.9 | Mar: 262.8 ± 21.4 | Mar: 87.3 ± 21.4 | ||
Different letters indicate that the values are significantly different (p < 0.05).
Table 2.
Estimation of annual and winter soil respiration by two approaches (interpolating and empirically model) in the four stands.
Table 2.
Estimation of annual and winter soil respiration by two approaches (interpolating and empirically model) in the four stands.
| Stand | Estimated Annual Rs (g C m−2 year−1) | Estimated Winter Rs (g C m−2) | ||
|---|---|---|---|---|
| Interpolated | Empirical Modelled | Interpolated | Empirical Modelled | |
| Polar | 1051 ± 80 | 1041 | 77.3 ± 17 | 73.1 |
| Black Locust | 870 ± 29 | 834.5 | 67.7 ± 5 | 62.2 |
| Chinese Pine | 547 ± 35 | 516.9 | 69.4 ± 7 | 58.8 |
| Mixed | 953 ± 115 | 932.4 | 82.7 ± 11 | 69.9 |
Table 3.
The correlation and the partial correlations between mean soil respiration and the various factors during the growing season. Fine root biomasses are used in October.
Table 3.
The correlation and the partial correlations between mean soil respiration and the various factors during the growing season. Fine root biomasses are used in October.
| Dependent Variable | Type of Analysis | Parameter | Soil Organic Carbon | Total Nitrogen | pH | Mean Soil Temperature | Mean Soil Moisture | Fine Root Biomass |
|---|---|---|---|---|---|---|---|---|
| Rs | Correlation | R | 0.61 ** | 0.66 ** | 0.89 ** | |||
| Partial Correlation | R | 0.79 ** |
** show significant correlation between Rs and the impact parameter Rs a p < 0.01 level, n = 16.
Table 4.
Comparison with reported non-urban forest ecosystems with the similar tree species. The mean annual air temperature (Ta), soil type (CSTS-Chinese Soil Taxonomic System) soil bulk density (g cm−3), stem density (stems ha−1), Ts (numbers in parentheses indicate the measurement depth and the measurement period coincided with the Rs), R2 (exponential relationship between Ts-Rs).
| Tree Species (Age) | Latitude and Longitude | Ta (°C) | Soil Texture/Type | Soil Bulk Density | Stem Density (Stems ha−1) | Mean Rs (μmol m−2 s−1) | Ts (°C) | R2 | Q10 | Estimate Annual Rs (g C m2 year−1) | Rs Variation Tend | Reference |
|---|---|---|---|---|---|---|---|---|---|---|---|---|
| Pine (Larix principis-rupprechtii) (10) | 42°24.7′ N, 117°14.8′ E, 1505 m a.s.l. | −1.4 | sandy | 1.47 | 2640 | 2.6 (May–Oct) | 12.0 (T5) | 0.6 | 2.7 | 423 ± 32 | Increased from May, decreased in Oct, related to changes in Ts rather than changes Ms | Ma et al. (2014) [34] |
| Pine (Larix principis-rupprechtii) (25) | 42°24.7′ N, 117°14.8′ E, 1505 m a.s.l. | −1.4 | sandy | 1.5 | 2640 | 2.6 (May–Oct) | 9.4 (T5) | 0.47 | 2.8 | 446 ± 22 | Increased from May, decreased in Oct, related to changes in Ts | Ma et al. (2014) [34] |
| Pine (Pinus koraiensis) (39) | 45°20′ N, 127°30′ E; 300 m a.s.l. | 2.8 | dark brown soil (CSTS) | 0.6 | 3145 | 2.9 (Apr–Oct) | 11.1 (T10) | 0.84 | 3.1 | 514 ± 26 | Peak Rs occurred between Jul and Aug, strongly correlated to Ts | Wang et al. (2006) [35] |
| Pine (Pinus tabuliformis) (40) | 36°66′ N, 112°12′ E; 1473 m a.s.l. | 9.9 | loam | 1.22 | 2511 | 1.9 (May–Oct) | 11.9 (T10) | - | 2.5 | 323 (May–Oct) | The Rs showed distinct seasonality, positive correlation with Ts | Zhao Bo et al. (2019) [36] |
| Black locust (Robinia pseudoacacia) (20) | 37°52′ N, 114°15′ E; 469 m a.s.l. | 13 | mountainous cinnamon soils | 1.36 | - | 3.4 (Jun–Sep) | 24.6 (T5) | 0.55 | - | 602.7 | Higher during the summer, lowest during the winter, positive correlation with Ts and Ms | Liu et al. (2014) [13] |
| Black locust (Robinia pseudoacacia) (30) | 36°25′ N, 109°31′ E; 1353 m a.s.l. | 10.6 | sandy loam | 1.12 | 1717 | 3.5 (May–Sep) | 18.1 (T6) | -- | 2 (Jan–Dec) | 660–810 | Peak occurred between Jul and Aug, decreased from Sept to its lowest in Dec | Shi et al. (2012) [39] |
| Poplar (Populus balsamifera L) (12) | 43°45′ N,81°09′ E | 6.7–9.9 | sandy loam | 1.2 | 833 | 4.71 (May–Sep) | 20.4 (T5) | 0.76 | 1.86 | -- | The Rs increased from May decreased in September | Yan et al. (2011) [40] |
| Aspen (Populus tremuloides) (26) | 45°94′ N, 90°27′ E, 540 m a.s.l. | 3.9 | sandy loam | - | 4870 | 4.0 (May–Oct) | 15 (T10) | 0.79 | 3.1 | 802 (DOY133–295) | The Rs increased in spring, peaked in June and July, and declined in autumn. | Tang et al. (2009) [41] |
| Poplar (Populus deltoides × Populus) (9) | 54°12′ N, 114°08′ E, 631 m a.s.l. | 3 | loam | 1.43 | 1600 | (May–Sep) | 16.9(T2) | 0.89 | 2.1 | 598 (DOY150-270) | Increasing during the growing season and decline in the fall, increased exponentially with Ts | Carmela et al. (2010) [42] |
| Mixed (Populous davidiana × Betula platyphylla) (55) | 45°20′ N, 127°30′ E; 300 m a.s.l. | 2.8 | dark brown soil (CSTS) | 0.6 | 2817 | 3.4 (Apr–Oct) | 12.1 (T10) | 0.9 | 3.8 | 813 ± 26 | The peak Rs occurred between Jul and Aug, strongly correlated to Ts | Wang et al. (2006) [35] |
© 2019 by the authors. Licensee MDPI, Basel, Switzerland. This article is an open access article distributed under the terms and conditions of the Creative Commons Attribution (CC BY) license (http://creativecommons.org/licenses/by/4.0/).
Share and Cite
MDPI and ACS Style
Zhu, M.; Xue, W.; Xu, H.; Gao, Y.; Chen, S.; Li, B.; Zhang, Z. Diurnal and Seasonal Variations in Soil Respiration of Four Plantation Forests in an Urban Park. Forests 2019, 10, 513. https://0-doi-org.brum.beds.ac.uk/10.3390/f10060513
AMA Style
Zhu M, Xue W, Xu H, Gao Y, Chen S, Li B, Zhang Z. Diurnal and Seasonal Variations in Soil Respiration of Four Plantation Forests in an Urban Park. Forests. 2019; 10(6):513. https://0-doi-org.brum.beds.ac.uk/10.3390/f10060513
Chicago/Turabian StyleZhu, Mengxun, Wanlai Xue, Hang Xu, Yuan Gao, Shengnan Chen, Bin Li, and Zhiqiang Zhang. 2019. "Diurnal and Seasonal Variations in Soil Respiration of Four Plantation Forests in an Urban Park" Forests 10, no. 6: 513. https://0-doi-org.brum.beds.ac.uk/10.3390/f10060513
Note that from the first issue of 2016, this journal uses article numbers instead of page numbers. See further details here.