Effects of Climate Change on Burn Probability of Forests in Daxing’anling

1
Research Institute of Forest Ecology, Environment and Protection, Chinese Academy of Forestry, Key Laboratory of Forest Protection, State Forestry Administration, Beijing 100091, China
2
Ontario Ministry of Natural Resources and Forestry, 70 Foster Drive, Suite 400, Sault Ste Marie, ON P6A 6V5, Canada
*
Author to whom correspondence should be addressed.
Forests 2019, 10(8), 611; https://0-doi-org.brum.beds.ac.uk/10.3390/f10080611
Submission received: 30 May 2019
/
Revised: 21 July 2019
/
Accepted: 22 July 2019
/
Published: 24 July 2019
(This article belongs to the Special Issue Forest Fires under Climate, Social and Economic Changes)
Abstract
:Projecting the burn probability (BP) under future climate scenarios would provide a scientific basis for the implementation of forest fire adaptation technology. This study compared the changes in the climate, fire weather, and burn probability during the fire season in Daxing’anling, China. A burn probability model was established and used to simulate the daily fire occurrence and spread at baseline (1971–2000) and into the 2030s (2021–2050) based on the outputs from five global climate models (GCMs) (GFDL-ESM2M, Had GEM2-ES, IPSL-CM5A-LR, MIROC-ESM-CHEM, and Nor ESM1-M) under four climate scenarios (RCP2.6, RCP4.5, RCP6.0, and RCP8.5). The results showed that the average daily maximum temperature in the fire season will be increased by 2.1 °C (+16.6%) in the 2030s compared with the baseline and precipitation in the fire season will be increased by 7.1%. The average fire weather index (FWI) of the fire season in the 2030s will be increased by 4.2%, but this change is not significant. There will be 39 fires per year in the 2030s, representing an increase of 11.4%. The accuracy of simulated burned areas was 71.2% for the 1991–2010 period. The simulated and observed burned areas showed similar interannual fluctuations during period 1971–2010. The potential burned areas in the 2030s will increase by 18.8% over those in the baseline period and the BP will increase by 19.4%. The implementation of proactive fire management in areas with high predicted BP values will be key for an effective mitigation of future wildfire impacts.
1. Introduction
The effects of climate warming on forest ecosystems are becoming increasingly visible across the globe [1,2]. Changing fire regimes due to climate are among the greatest threats to ecosystems and society [3]. It is widely accepted based on data from the last few decades and model simulations that anthropogenic climate change will cause increased fire activity [4]. Empirical statistical models and process-based simulations agree almost universally [5]. Climate strongly influences global wildfire activity and recent wildfire surges may signal fire weather-induced pyrogeographic shifts [6,7]. The total burned area in United States (US) was 622,000 ha in 2017 compared with a 2008–2016 average of approximately 228,000 ha [8]. The US also experienced an exceptional fire season in California in 2017 and 2018. Since 2000, 15 of the 20 largest fires in California history have occurred [9]. Wildfires in federally managed forests of the western US have increased substantially in recent decades, with large (>1000 acre) fires in the decade through 2012 over five times as frequent (450% increase) and burned areas over 10 times as great (930% increase) as in the 1970s and early 1980s [10].The projected continued growth in the 10-year average cost of fire suppression through 2025 is rising to nearly $1.8 billion [11]. Climate change is only one of the factors driving increased risk from wildfire, but it may already be facilitating fire in regions where it was previously rare and small in scale, such as northern Europe [12] and Greenland [13].
Although these factors may have contributed to fire regime changes at individual sites or specific times, charcoal data indicate an important role of climate, particularly rapid climate change, in determining broad-scale levels of fire activity [4]. Climate change generates higher temperatures and more frequent and intense drought [10]. Fire weather seasons have lengthened across 29.6 million km2 (25.3%) of the Earth’s vegetated surface, resulting in an 18.7% increase in the global mean fire weather season length and a 108.1% increase in the global burnable area from 1979–2013 [6]. There have been substantial documented increases in the frequency of large wildfires in the boreal forests of Canada, Alaska, and Siberia [14], as well as in forests of the western US, particularly in mid-elevation forests of the Northern Rocky Mountains [15]. Abatzoglou et al. estimated that human-caused climate change contributed to an additional 4.2 million ha of forest fire area during 1984–2015, nearly doubling the forest fire area expected in its absence [16].
Wildfire area is predicted to increase with global warming. Future potential wildfire will increase significantly in the United States, South America, central Asia, southern Europe, southern Africa, and Australia [17]. Climate change projections suggest an increase in the number of days conducive to extreme wildfire events by 20% to 50% in these fire-prone landscapes, with sharper increases in the subtropical Southern Hemisphere and European Mediterranean Basin [18]. Climate change is projected to dramatically increase the area burned by wildfires across most of the contiguous US, especially in the West [19]. The mean annual area burned will increase by 77% statewide (US) under a high (Representative Concentration Pathway (RCP) 8.5) global greenhouse emission scenario, while extreme wildfire events will increase in frequency, with fires greater than 10,000 hectares occurring nearly 50% more often by end of the century [20]. Mann et al. assessed the effects of human activity and climate change on fire activity in California and found that the burned area is expected to increase by 2.2% and 5.0% by 2050 under climatic bookend models (Parallel Climate Model (PCM) and Geophysical Fluid Dynamics Laboratory (GFDL) models, respectively) [21]. Parks et al. found that fire regime characteristics in North America are expected to change over the next several decades as a result of anthropogenic climate change [22]. Future fire probability is projected to both increase and decrease (range of −51% to +240%) across a study region encompassing Oklahoma, New Mexico, and Texas [3]. The annual wildfire area burned in coming decades is likely to be highly geographically heterogeneous, reflecting interacting regional and seasonal climate drivers of fire occurrence and spread [23]. Climate change is altering wildfire activity across Alaska, with an increase in the burned area projected for the future. The cumulative area burned predicted between 2006 and 2100 across Alaska averaged 46.7 M ha under five climate models for RCP8.5 and 42.1 M ha for RCP4.5, with estimated cumulative response costs of $1.2–2.1 B and $1.1–2.0 B, respectively (3% discount) [24]. Yue et al. found that for Alaska and western Canada, almost all models predict significant (p < 0.05) increases in the area burned at mid-century (2046–2065) under the A1B scenario, with median values ranging from 150% to 390% depending on the ecoregion [25]. For central and southern Canadian ecoregions, their models predicted increases in the area burned of 45%–90%. The projected changes (IPCC A1B emissions scenario) in fuel and moisture could result in a lengthening of the fire season in the period of 1981–2070 in Mediterranean areas [26]. The burned area in Mediterranean Europe will increase by 40%~100% [27].
The research conducted in Daxing’anling in recent years has mainly focused on the impacts of climate change on fire weather, burned areas, fire density, and human-caused fire occurrence. It is still necessary to better understand changes of fire regime in landscapes, such as fire occurrences, fire intensity, and burn probability. Daxing’anling is the largest natural forest area in China and is subject to many fires every year. The forests in the region are mainly boreal forests, which are sensitive to climate change. The climate of Daxing’anling has shown a tendency of warming and drying since 1988 [28]. The fire season was prolonged during 1961–2005, with more fires occurring in summer [29]. The burned areas in Daxing’anling are expected to increase during 2070–2099 under scenarios A2a and B2a, and the area burned will be doubled [30]. The area burned in the summer fire season will be increased by 1.5 times in the 2080s under A2a scenario compared to that in the baseline period [30]. The fire density in the frigid forests in northeastern China is predicted to increase by 30% (CGCM3 B1 scenario) –230% (HadCM3 A2 scenario) during the period of 2081–2100 [31]. The human-caused fire occurrence will increase by 72.2% under the RCP 2.6 scenario and by 166.7% under the RCP 8.5 scenario in 2050 [32].
Burn probability (BP) models are increasingly used for wildfire risk research under a variety of scenarios. Fire simulation at the landscape scale is an important method for evaluating the effect of fire management measures [33]. Perera et al. developed a spatial simulation model (BFOLDS) to explore large-scale fire regimes and succession in boreal forest landscapes [34]. Dillon et al. use the Fsim model to simulate the BP to depict the relative potential for wildfire that would be difficult to contain with the available suppression resources [35]. Burn-P3 was also used to study the fire regimes under different scenarios [36,37].
Existing BP models characterize the effects of fire suppression very simply if at all. An active forest fire management policy has long been applied in Daxing’anling. We used a BP model to evaluate the effects of climate change on burn probability in the region. The model considered the effects of fire suppression, which is suitable for such intensively managed areas. The previous research mainly focused on the impacts of climate change on fire weather and fire occurrences. They didn’t simulate fire occurrence and spread on daily for different scenarios. The paper will help us to better understand fire regime changes in landscapes. We predicted the annual fires in 2030s (2021-2050) and simulated daily fire occurrences, spread, and suppression based on the information of fuel type, terrain, weather, fire weather indices, fire behavior, and suppression ability in the integrated model. The results will provide a scientific basis for the implementation of forest fire adaptation technology.
2. Methods
2.1. Study Area
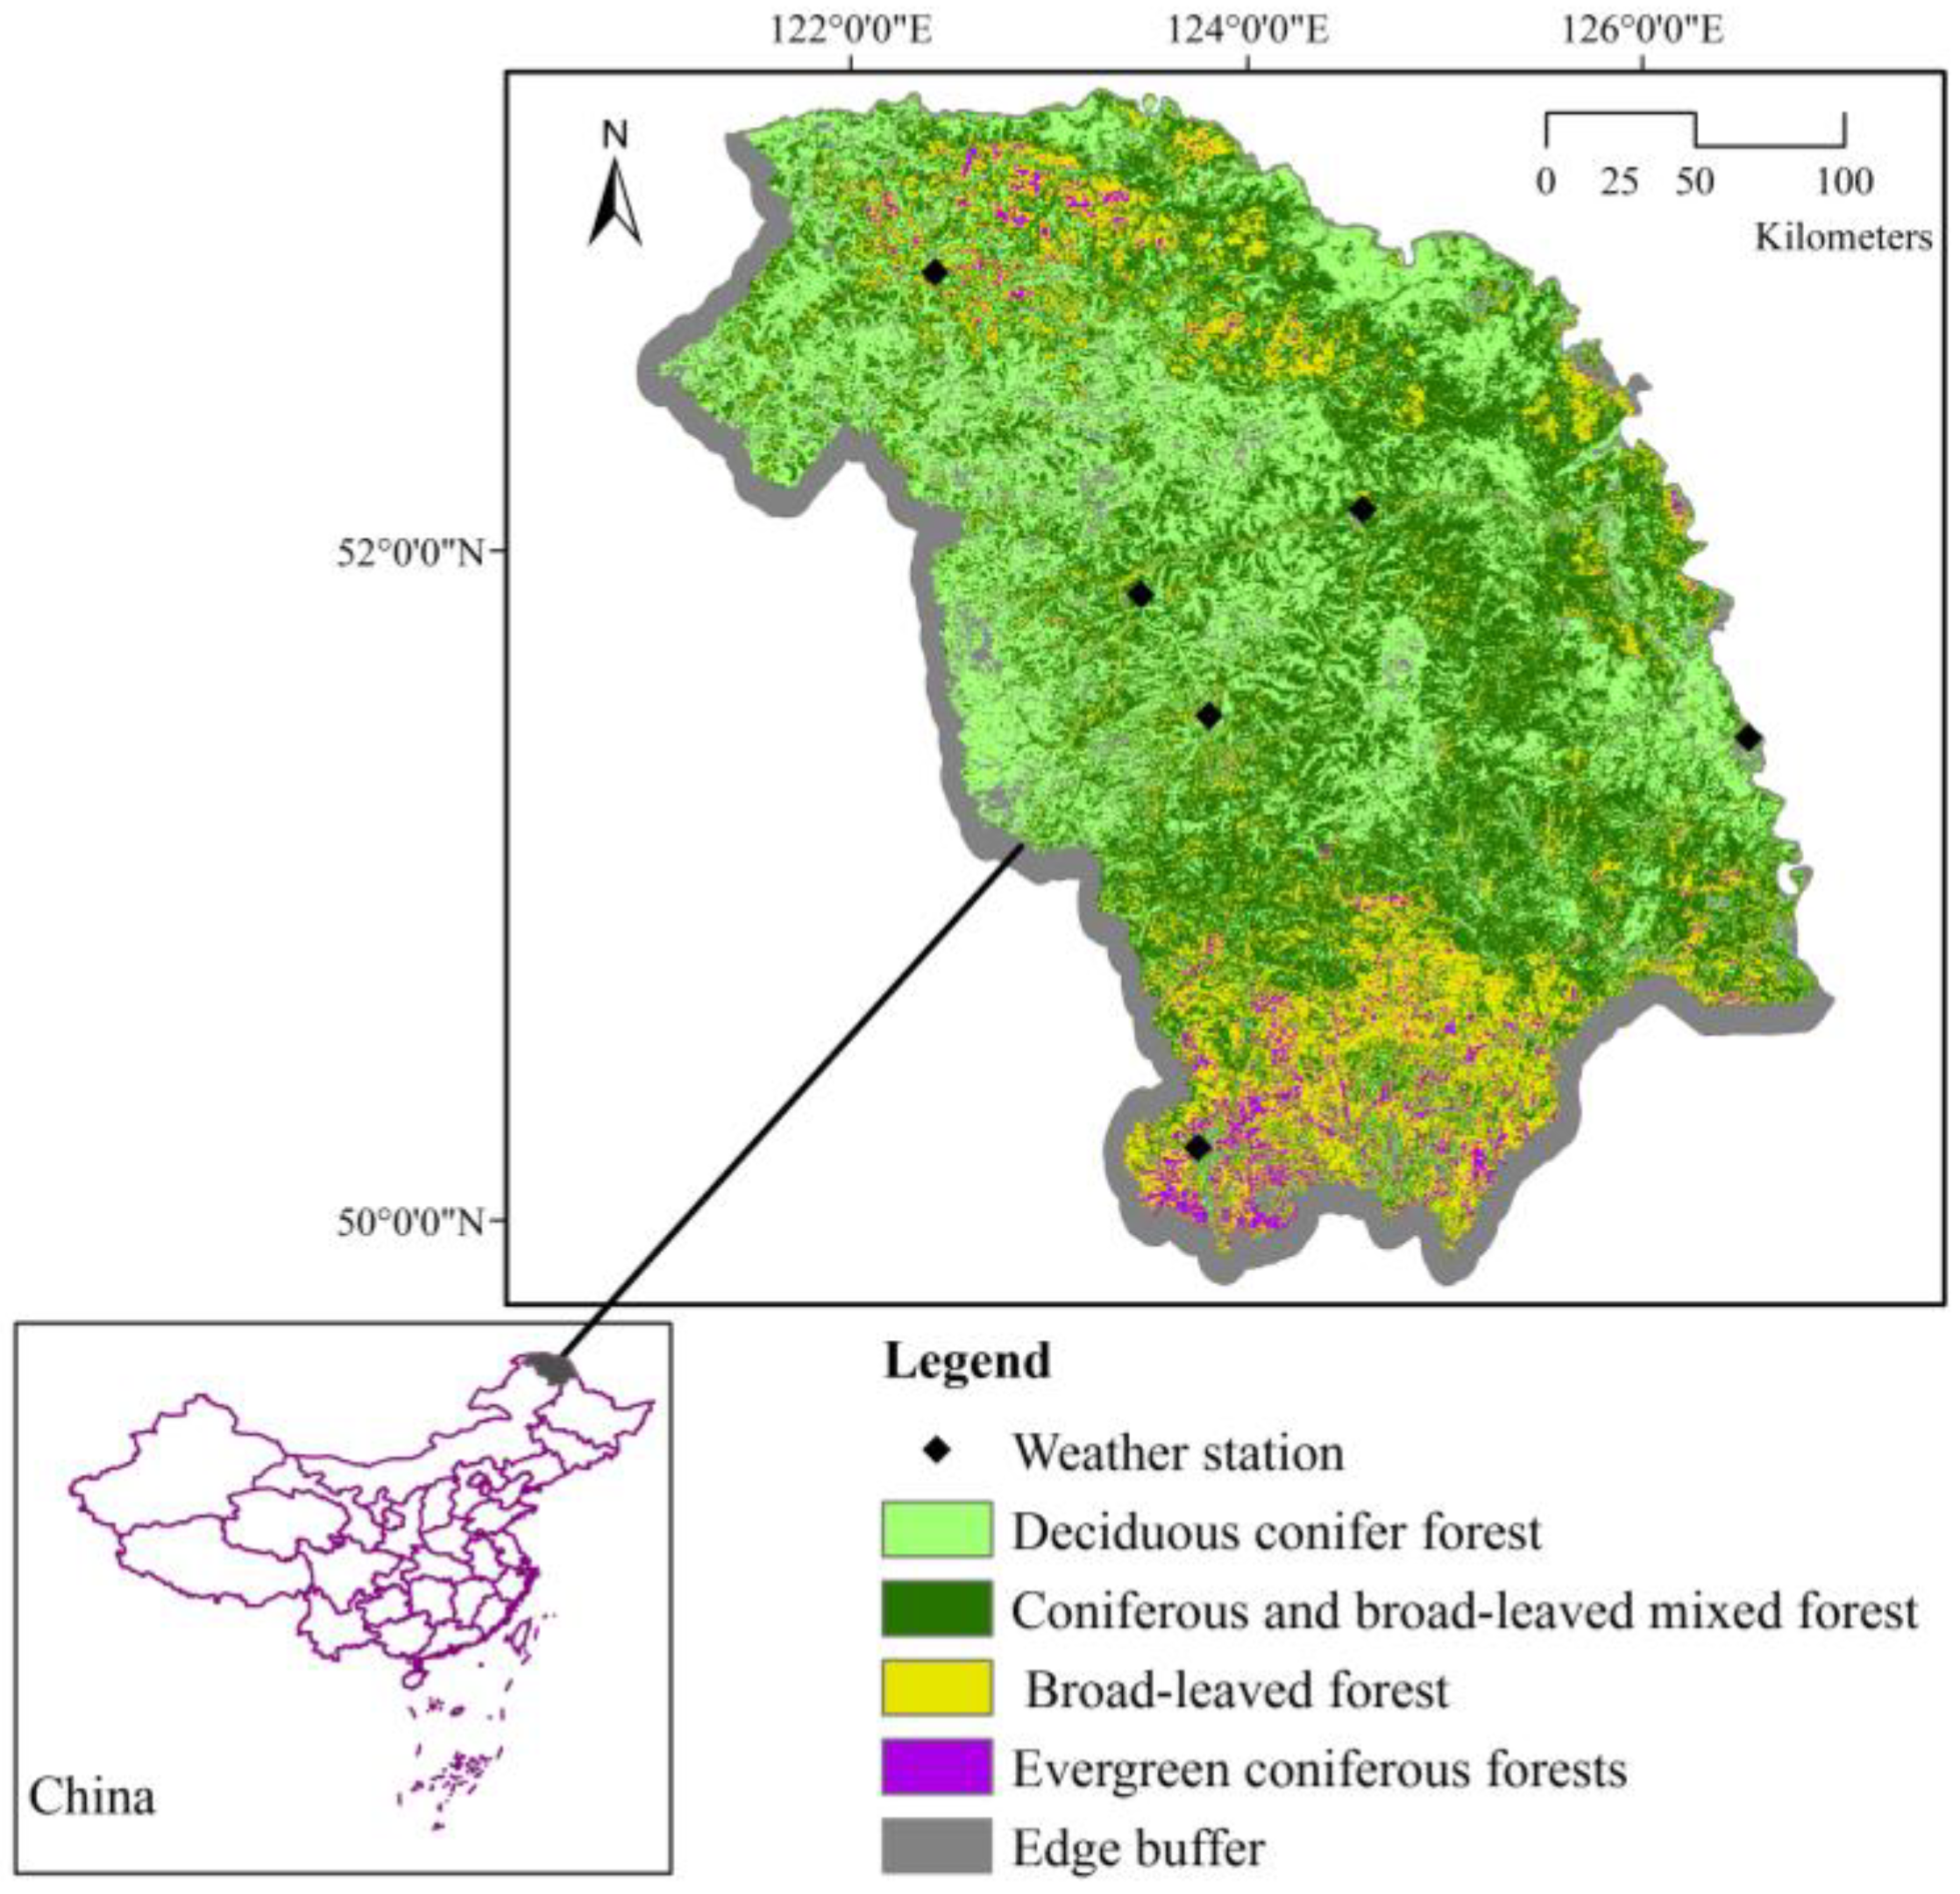
Our study area is located in Daxing’anling, China, with a geographical range of 121°18′–127°02′ E, 50°08′–53°56′ N (Figure 1). The total area of the region is approximately 8,360,887 ha. The topography is undulating, with an average elevation of 573 m above sea level. It has a cold temperate continental monsoon climate. The winter is cold and long; the summer is hot and short. The annual average temperature is −2.8 °C and the annual precipitation is 450–500 mm [38].
The main forest types are deciduous needle-leaved forest and coniferous and broad-leaved mixed forest, which account for 34.1% and 41.7% of the total area, respectively. Deciduous broad-leaved forest, evergreen coniferous forest and grassland account for 15.9%, 3.2%, and 4.3%, respectively. The remaining land cover consists of farmland and bare land (0.7%). The main tree species include Larix gmelinii, Betula platyphylla, Pinus sylvestris, Quercus mongolica, and Populus davidiana. The under-story shrubs consist of Corylus heterophylla, Rhododendron simsii, and Vaccinium vitisidaea. The grasses growing in valleys and marshes mainly include Carex tato, Deyeuxia langsdorffii, Filipendula palmate, and Sangui sorbaofficinalis.
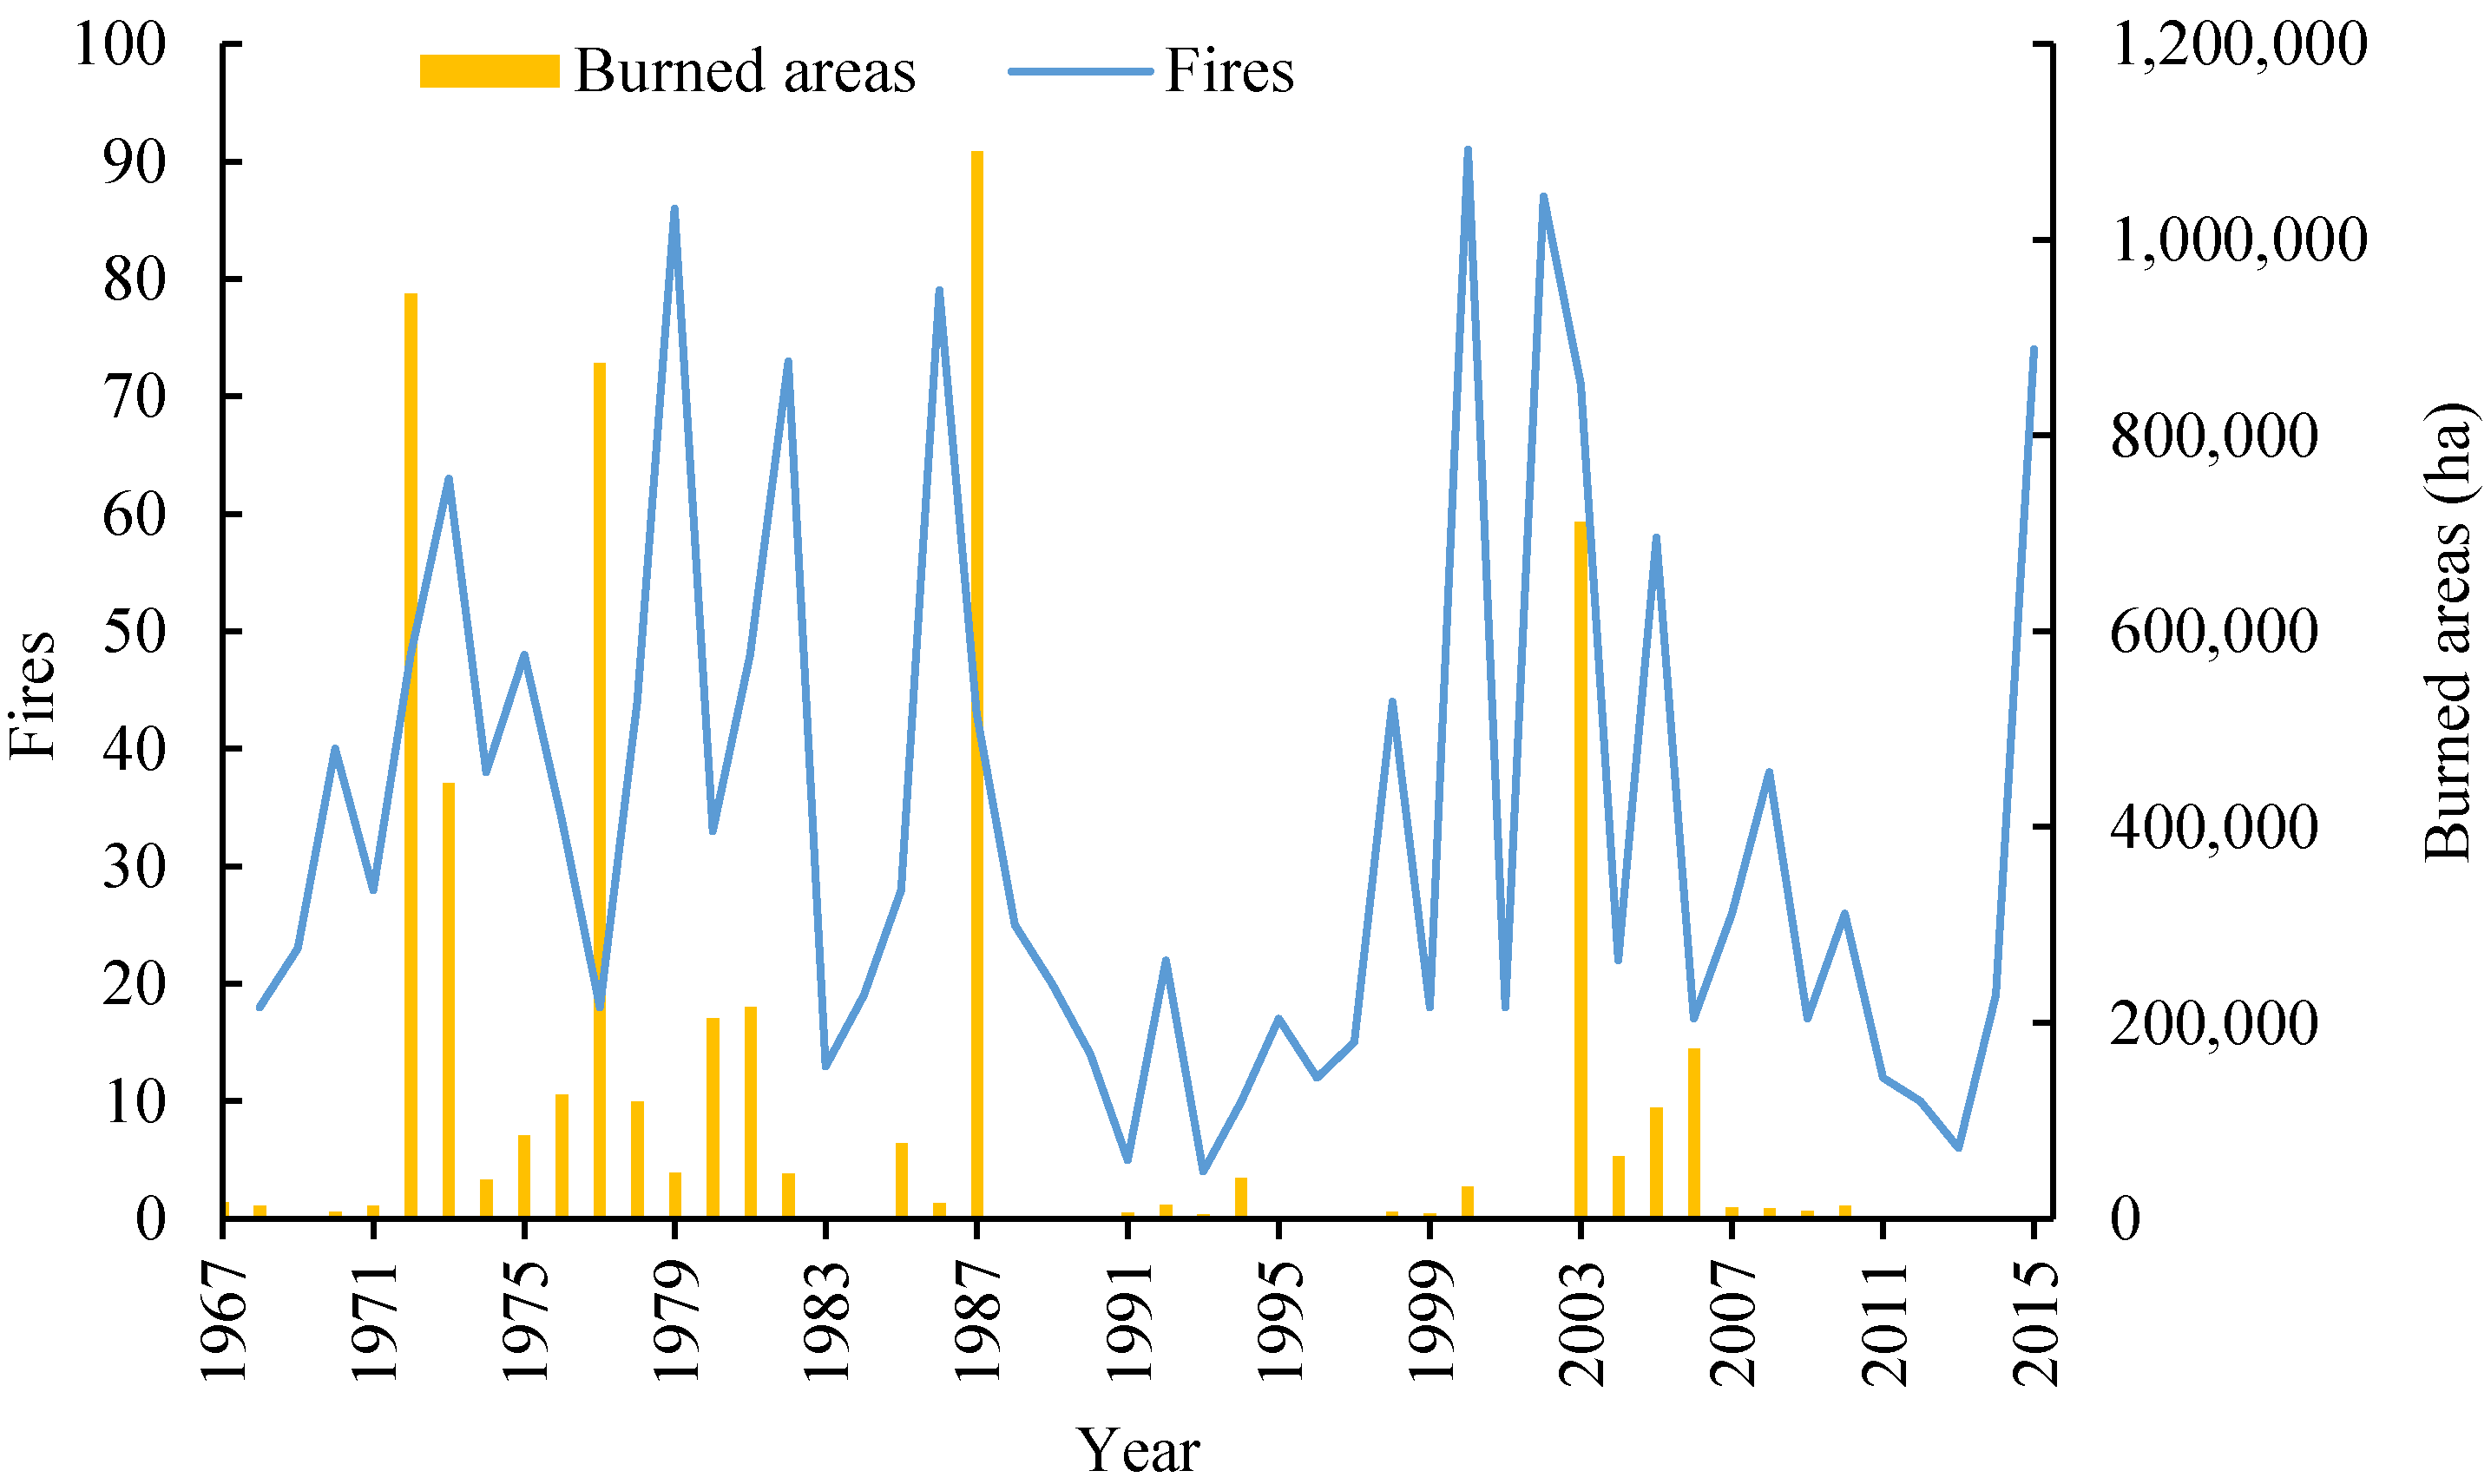
There were 35 fires per year (ranging from 4 to 91 fires) and burn areas 148,935 ha during the baseline period (1971-2000) in the region because of its fire-prone forests. A complete forest fire management system was established in the study area after a conflagration in 1987. All fires are prohibited in the region and will be suppressed as soon as possible. Fire management has improved since 1988. There was an average of 29 fires annually in 1988–2015, which burned 43,866 ha on average (Figure 2). The fires occur mainly in the spring (March–June) and autumn (September–October). Fires occur during the summer only in years with severe drought. According to the fire statistics during the 1988–2015 period, the fires are mainly caused by lightning and human ignitions, which accounted for 67.5% and 27.3% of the fires, respectively. The remaining 5.2% of fires were of unknown cause. The maximum number of fires occurred in 2000 (91 fires), but the maximum burned area occurred in 1987 (324,006 ha). Surface fire is the main fire type, but crown fire behavior often occurs in larch forest.
2.2. Framework of the Burn Probability Model
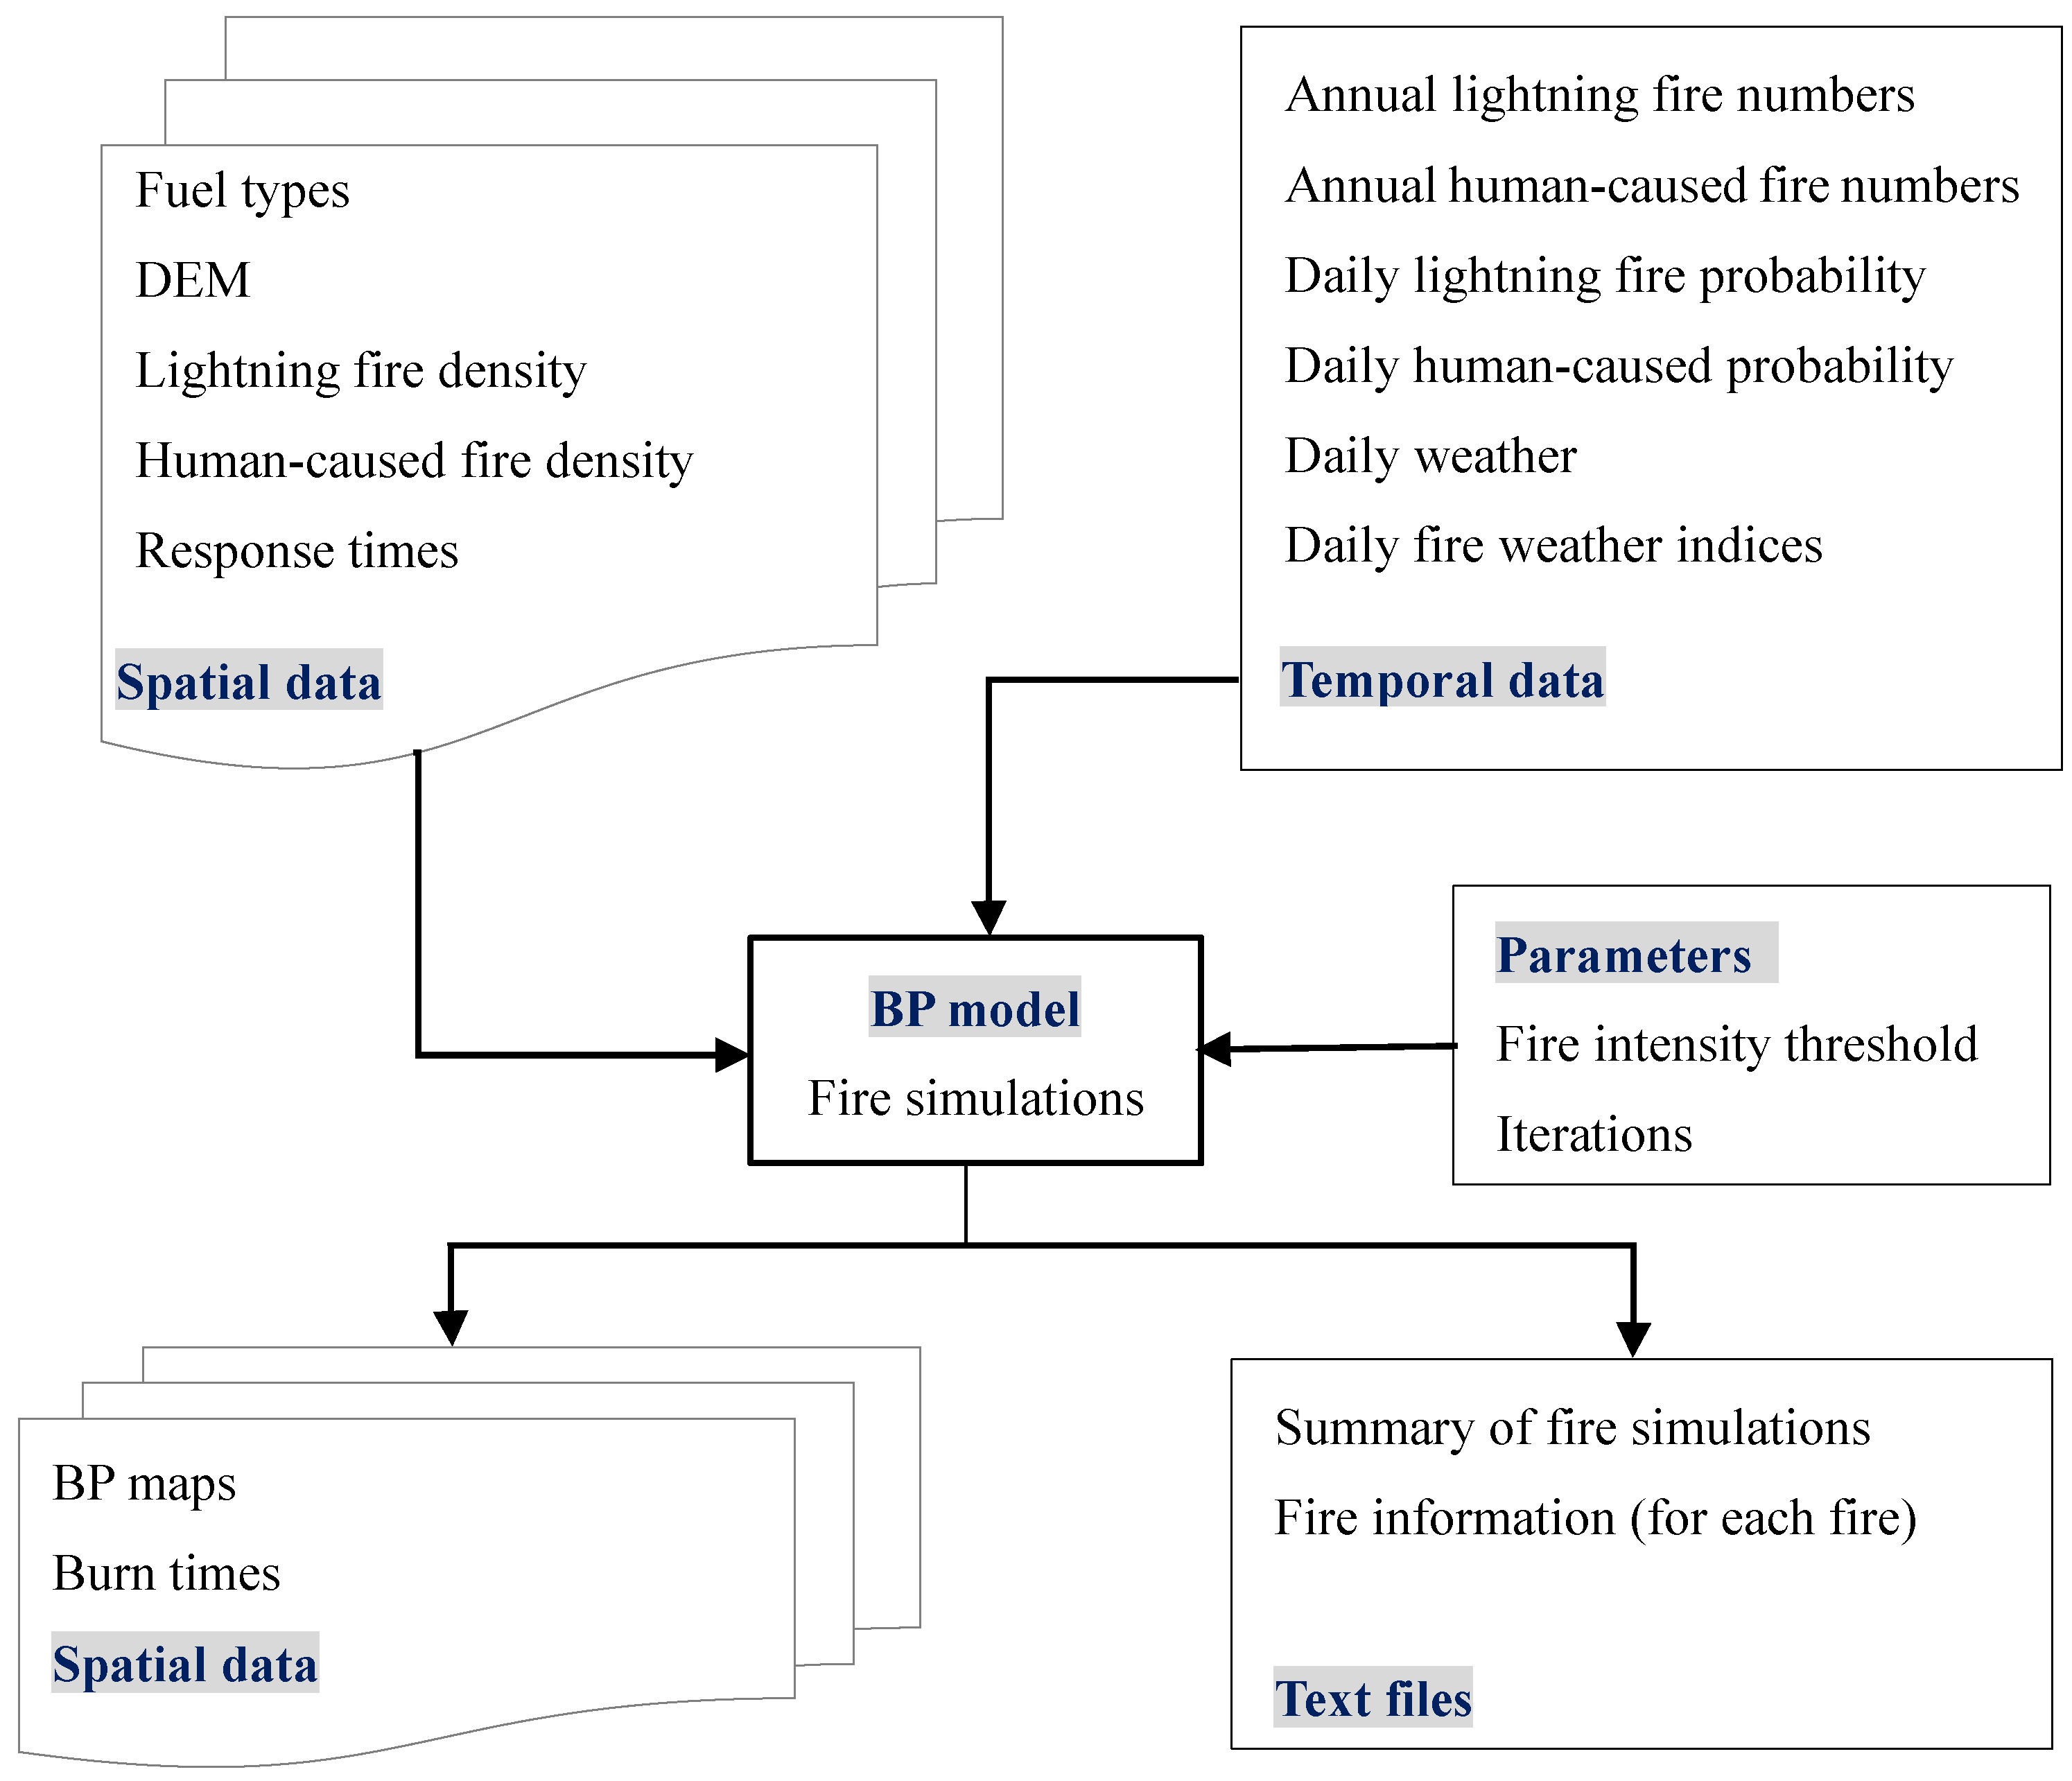
The BP model can simulate daily fire occurrence, spread, and extinction processes over a period or a year. The model simulates the spread of each fire based on the fire growth model (Wildfire) [39]. It is an eight-point cellular fire growth model that uses the Fire Behavior Prediction (FBP) System. The inputs for Wildfire include spatial data (FBP System fuel type, elevation, fire density) and temporal data (annual fire numbers, daily fire occurrence probability, hourly weather, and fire danger indices based on the fire weather index (FWI) Within the same iteration process, the grid will not burn repeatedly. The BP is calculated according to the number of repeated burns in each grid in all simulations (Figure 3).
Fire ignitions in the model are based on the fire occurrence during the simulation period (lightning fires and human-caused fires) and the fire weather indices at the simulated time. The Poisson probability distribution was used to model daily fire occurrence. We assumed that the spatial distribution of fire ignitions in the 2030s would be similar to that at baseline. Fire occurrence generally depends on ignitions and the moisture conditions of the fine fuels on the surface of the forest floor at the simulation time. Lightning-caused fires and human-caused fires exhibit both seasonal and spatial variation. A specific ignition depends on fuel type, fire weather, and time of the day. System). The model is iteratively cycled through years and the number of iterations is determined according to the size of the study area, landscape composition, and fire dynamics.
For each fire, we sample the hour at which a fire occurred between 12:00 pm and 6:00 pm with a Gaussian distribution. The model calculates the probability of sustained flaming for each raster based on the fuel type and the FWIs (fine fuel moisture code (FFMC), duff moisture code (DMC), drought code (DC), initial spread index (ISI), and build-up index (BUI)) [39,40].
The response time and the threshold of fire intensity are indicators reflecting the suppression capability in the model. China applies a very aggressive fire suppression strategy—each fire is to be suppressed as soon as possible while it is still small and fire fighters must ensure that it is completely extinguished after it has been brought under control. The response time (RT) is the period from ignition to the time that fire crew gets to the fire site by ground transportation or air transportation from a fire base. The RT for ground forces includes the times for detection, truck travel, and hiking. The detection time for the whole area is approximately 20 min on average according to the statistics form the local fire agency. The RT for aircraft is based on the average flight time with an average speed of 200 km/h plus 20 min for fire detection time and 1 h for hiking. The integrated response time for the region was derived with the air bases distribution in 2010 (82 fire bridges and 3 airbases) (Figure 3). Based on the fire statistics from the local agency, the local fire brigades can directly put out fires under a height of 3.2 m flame, which amount to the fire intensity 3500 kw/m2. If the fire intensity was below this threshold, we assumed that the fire could be controlled. Otherwise, if the fire was larger than a specified size (one hectare) and the fire intensity was beyond the threshold, the fire would escape from initial attack (IA). The growth of fires that escape IA was simulated using Wildfire. If a fire escapes IA, its continuing spread time depends on the fire’s behavior, which is determined by weather, fuel type, topography, and certainly the level of the continued fire suppression effect. Escaped fires are assumed to burn until either they are slowed down due to a change in weather or their perimeters are contained by natural barriers or fire suppression. If the head fire intensity (HFI) is below the suppression threshold for one day, the fire will be controlled. Thus, we can decide the duration for which a fire burns. We arbitrarily determined that a controlled fire would stop growing before 12:00 pm if its HFI at 1:00 pm was below the head fire intensity threshold on that day.
2.3. Data Sources
Digital elevation data (60 m resolution) (DEM) were derived from Geospatial Cloud Data. The historical daily meteorological data (1971–2010) came from the China Meteorological Science Data Sharing Network, including four weather stations (Mohe, Tahe, Xinlin, and Huma). The daily data included the maximum temperature, average temperature, 24 h precipitation, minimum relative humidity, average wind speed, and wind direction. The statistics on forest fires in Daxing’anling from 1971 to 2015 were provided by the Forest and Grassland Fire Management Office of Heilongjiang Province, which included the fire occurrence date, location, burned area and fire cause.
The simulated climate data (1951–2050) included four climate scenarios (RCP2.6, RCP4.5, RCP6.0, and RCP8.5) and five global climate models (GCMs) (GFDL-ESM2M (Gfd), Had GEM2-ES (Had), IPSL-CM5A-LR (Ips), MIROC-ESM-CHEM (Mir), and Nor ESM1-M (Nor)) provided by ISI-MIP (the Inter-Sectoral Impact Model Intercomparison Project) (https://www.isimip.org/); these data were extracted and converted to ASCII files by the Institute of Environment and Sustainable Development in Agriculture, Chinese Academy of Agricultural Sciences. The horizontal resolution of the data was 0.5° × 0.5°. The data were processed with preliminary interpolation (bilinear interpolation) and correction (based on statistical deviation correction of probability distribution). The daily climate data included the maximum temperature, minimum temperature, precipitation, average relative humidity, and near-surface average wind speed.
2.4. Climate Data Processing
The simulated temperature, precipitation, and wind speed from each model were corrected according to the ground observation data at baseline (1971–2000). The monthly mean difference (or difference ratio) correction method and nonlinear transformation equation method [41] were used to make further corrections to the data for climate scenarios RCP2.6, RCP4.5, RCP6.0, and RCP8.5 in baseline period and 2030s. The revised parameters were determined via differential analysis of the monthly mean values of historical observation data from the meteorological stations and the simulation data for nearby grids.
The frequency of precipitation in the RCP data was adjusted according to the frequency of precipitation during the fire season (from March to October) of the observed precipitation in weather stations. First, all daily precipitation was subtracted from the threshold of the corresponding month and negative values were set to zero for adjusting rainfall frequency. Then the monthly mean difference was used to correct the simulated daily rainfall for the corresponding month.
The relative humidity at noon was calculated based on the daily maximum and minimum temperatures [42]. First, we assumed the minimum temperature as the dew point temperature and used the maximum temperature minus an average difference (2 °C) as the noon temperature. Then, we calculated the relative humidity at noon based on the dew point temperature. First, we calculate the water pressure (e) based on the dew point temperature (td).
where a = 17.2 and b = 35.86. Then, we used the temperature (t) to calculate the saturated water pressure (es):
e = 6.1078exp[a × td/(273 + td-b)]
es = 6.1078exp[a × t/(273 + t-b)]
Finally, we calculate the relative humidity (RH):
RH = e/es × 100%
The calculated monthly RH was also corrected by the monthly mean difference ratio correction method.
The climate scenario data did not include wind direction data. We used a random method to generate daily wind direction data based on historical observations of the daily wind direction database.
2.5. Fire Weather Indices and Predicted Fire Numbers for 2030s
The BP model requires daily weather (temperature, precipitation, relative humidity, wind speed, and wind direction) and fire weather data as inputs. Each of the daily FWI System codes and indices (FFMC, DMC, DC, ISI, BUI, and FWI) was computed based upon noon weather observations of temperature, relative humidity, wind speed, and 24-hour accumulated rainfall and the data calibrated with the climate models [42]. Weather data and FWI indices from the nearest weather station or grid (outputs from global climate models) were used to simulate the behavior (Wildfire growth model) of each fire [39]. The data from weather stations is used for present conditions and from grids for future weather conditions.
There was a significant correlation between annual fire numbers and the fire weather indices (DMC, ISI, and BUI) in the baseline period. The fire numbers for each year from 2030s are predicted based on the relationship.
where Y (annual fire numbers), DMC, ISI, and BUI are the average values of the corresponding fire season.
Y = 0.4081DMC + 0.3279bui + 8.2268isi-36.88 (R2 = 0.4083)
The lightning fire occurrence is related to DMC.
where Y (annual lighting fire numbers) and DMC are the average values of the corresponding fire season.
Y = 1.9773DMC − 37.05 (R = 0.5738)
There were differences in fire numbers calculated from the data of the five GCMs (Gfd, Had, Ips, Nor, and Mir). The average values from the five models in each year were input into the BP model for simulations for the 2030s.
2.6. Fuel Types
The vegetation map was derived from MODIS satellite remote sensing data MODIS-L1B in 2010 (http://www.gscloud.cn/). The vegetation was classified into five fuel types: evergreen pine forest, deciduous coniferous forest (larch forest), broad-leaved forest, mixed broad-leaf conifer, and grass, corresponding to the Canadian fuel types C-5, M-1a, D-1, M-1b, and O-1a (Figure 2) [43]. C5 fuel type is characterized by mature stands of pines. M-1a is used for mixed stands of 25% coniferous and 75% deciduous; M-1b is used for mixed stands of 75% coniferous and 25% deciduous boreal species in the leafless stage. D1 is characterized by pure, semimature trembling aspen stands before bud break in the spring or following leaf fall and curing of the lesser vegetation in the autumn. O-1a is characterized by continuous grass cover in the spring, with only occasional trees or shrub clumps that do not appreciably affect fire behavior [44].
2.7. Burn Probability Simulations
The BP model was used to simulate burn probability for the study area at baseline (simulation data from GCMs and historical observation data) and in the 2030s (simulated data from five GCMs under four climate scenarios). The inputs of the model included raster data and text files. The raster data included fuel types, DEM, lightning ignition density, human-caused ignition density, and response times. These spatial data were based on the baseline data (Figure 4). The indicated fire intensity threshold was used (3500 kW/m). The inputs text files included annual lightning fire numbers and annual human-caused fire numbers in the period, the daily lightning fire and human-caused probability, daily weather (temperature, precipitation, relative humidity, wind speed, and wind direction) and fire weather indices (FFMC, DMC, DC, ISI, and BUI).
The BP model produces both raster (ASCII-format) and text file outputs. The raster outputs included the BP for the period and the burn times in the simulation (in hours). The text file output included important characteristics of each fire for all iterations, such as the iteration identifier, fire causes, start location (X-Y), fire size (ha), start date (Julian date), fire intensity at escape (defining 1 ha as the size of an escaping fire), and fire weather at ignition.
All raster data were used with the same resolution of 100 m and consistent projection. The edge buffer in the study area, except along portions of the country boundary, is 10 km wide to offset the reduced probability of fire spreading at the edges. The simulated burn season was from March 1 to October 31. Each iteration was the simulation of an entire fire season. There were 10,000 iterations for each simulation. We analyzed the effects of iterations on the accuracy of BP simulation and found that 10,000 iterations are appropriate for the study (Appendix A for further details).
3. Results
3.1. Changes in Climate and Fire Weather in the 2030s
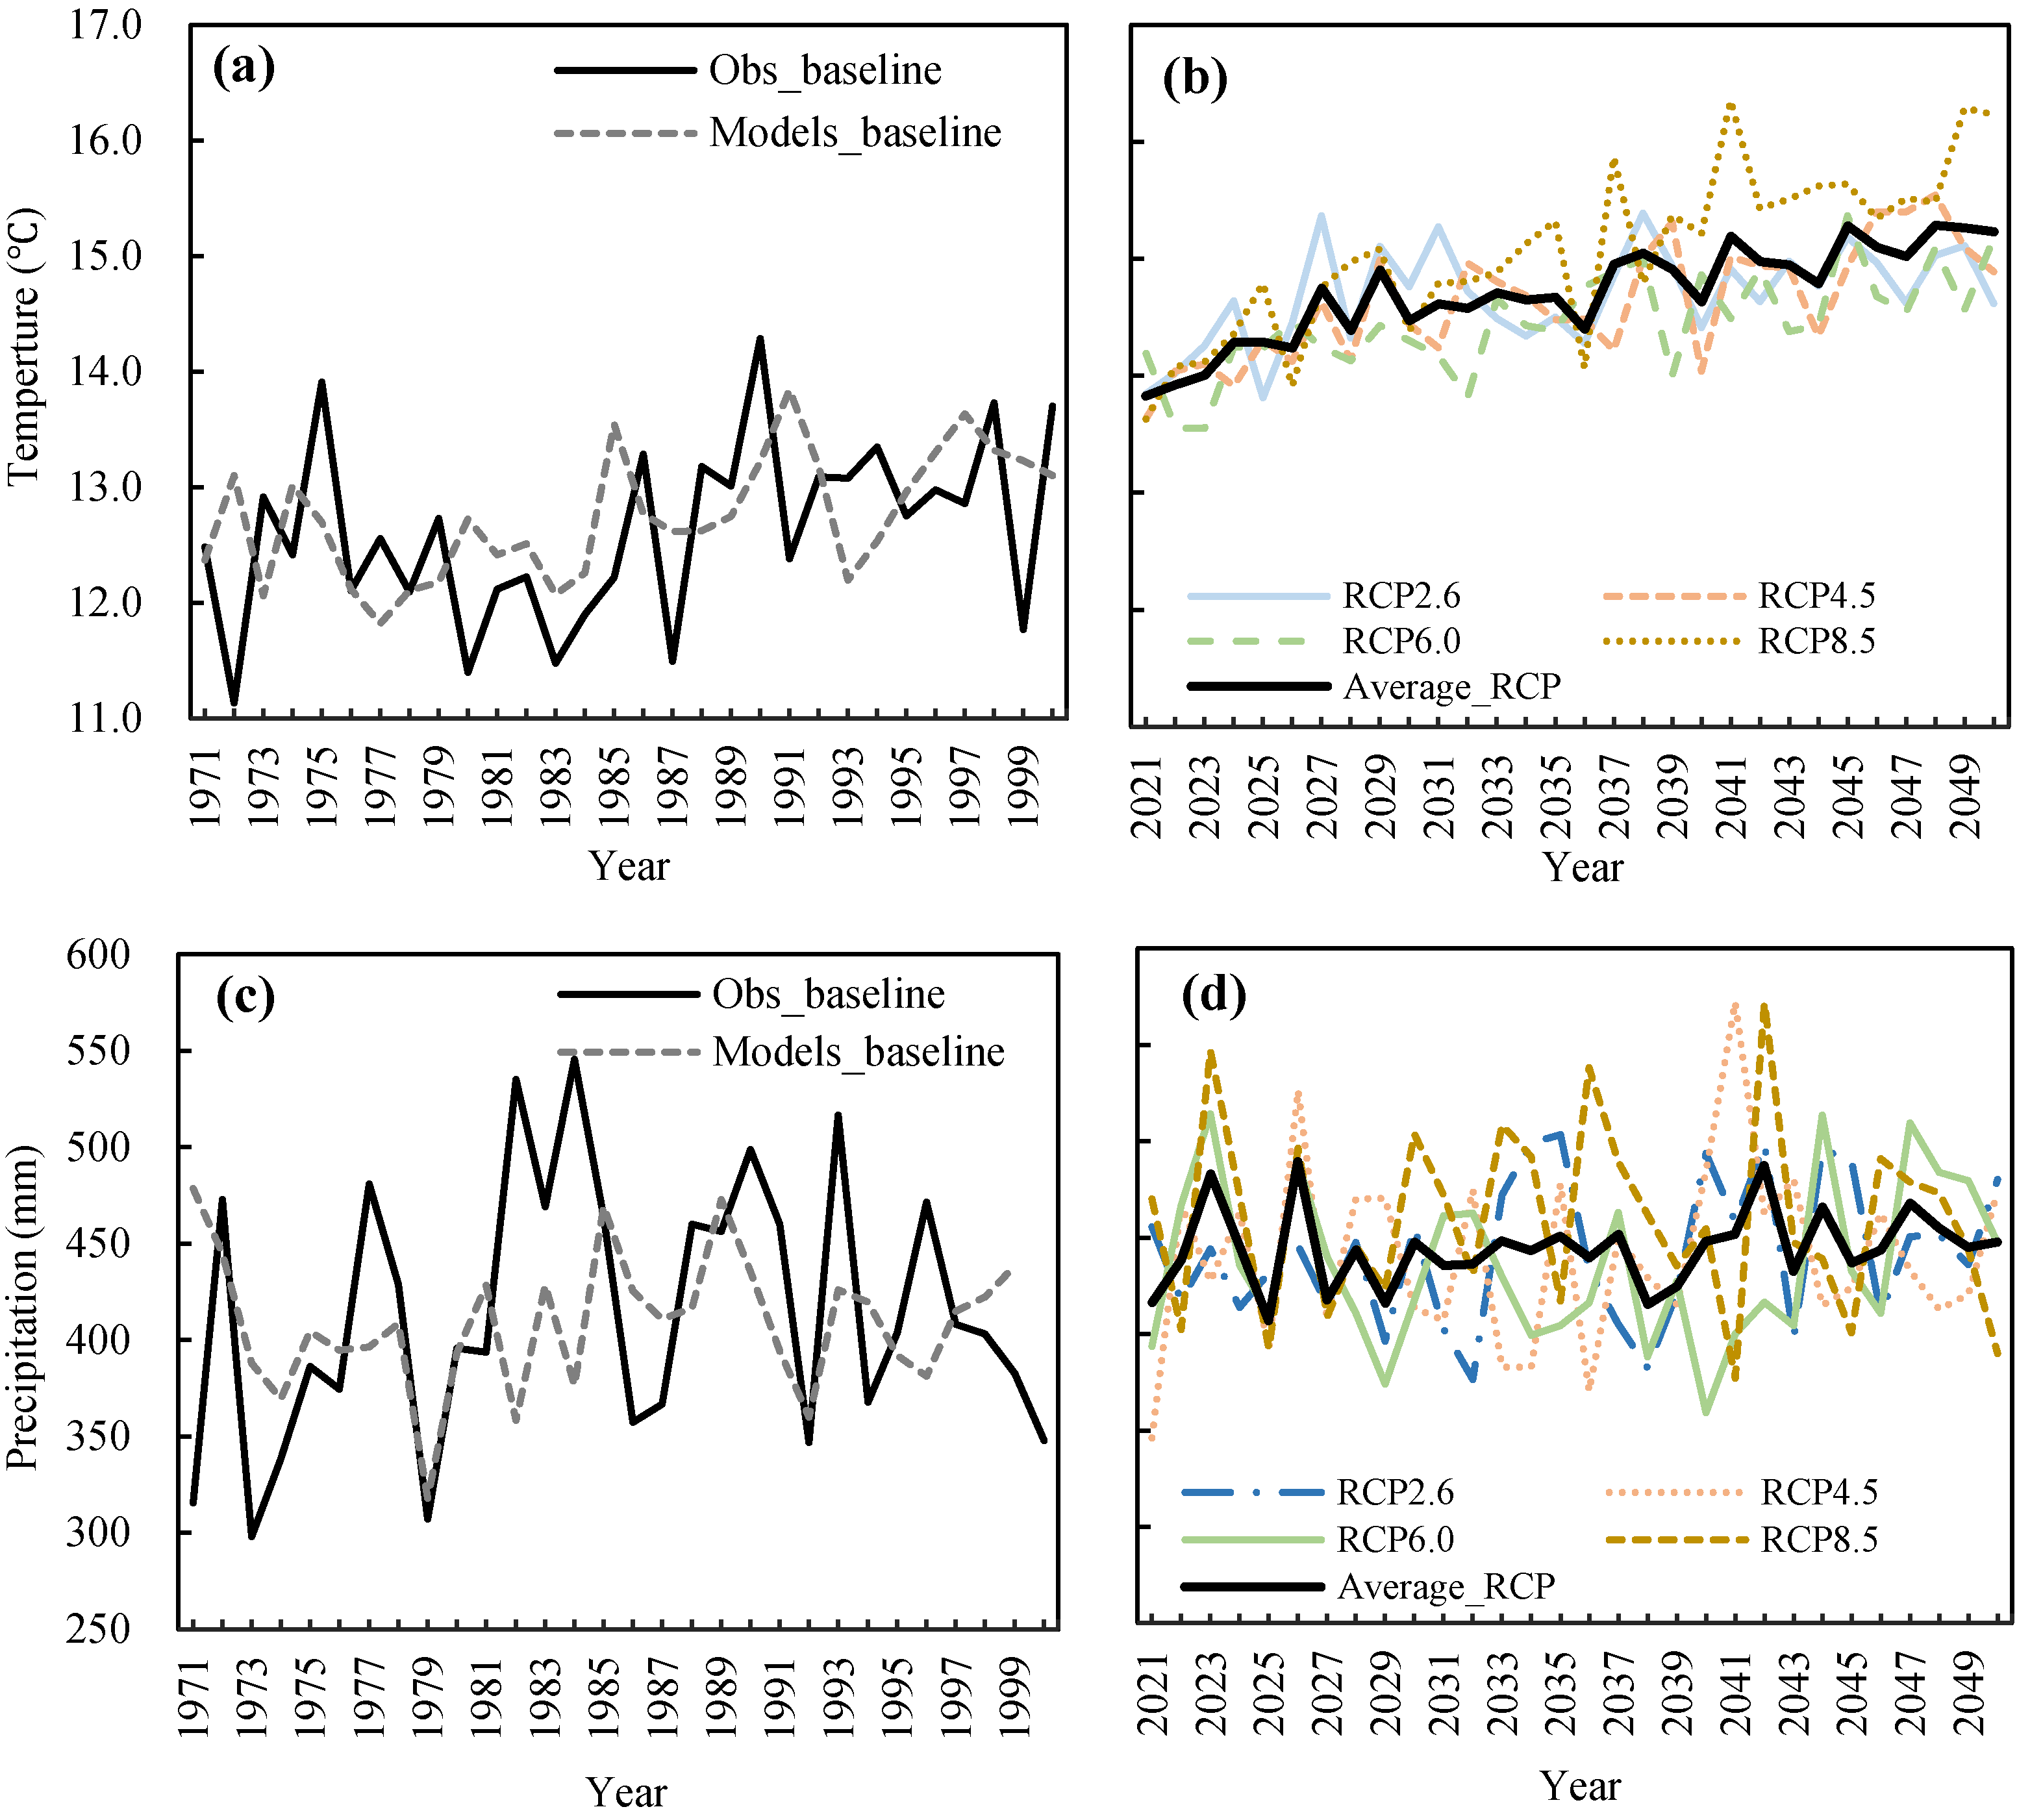
The average daily maximum temperature of the fire season at baseline was 12.6 °C and would be 14.7, 14.6, 14.5, and 15.1 °C in the 2030s under RCP2.6, RCP4.5, RCP6.0, and RCP8.5, respectively (Figure 5). The average maximum temperature would be 14.7 °C in the 2030s, which is 16.6% higher than that at baseline. The increase in temperature was significant (F-test, P = 0.00). The precipitation in the fire season during the baseline was 415 mm and would be 443, 441, 435, and 459 mm for the RCP2.6, RCP4.5, RCP6.0, and RCP8.5 scenarios in the 2030s, respectively. The average precipitation in the fire season in the 2030s would be 444 mm, which is 7.1% higher than that at baseline. The difference in precipitation were not significant.
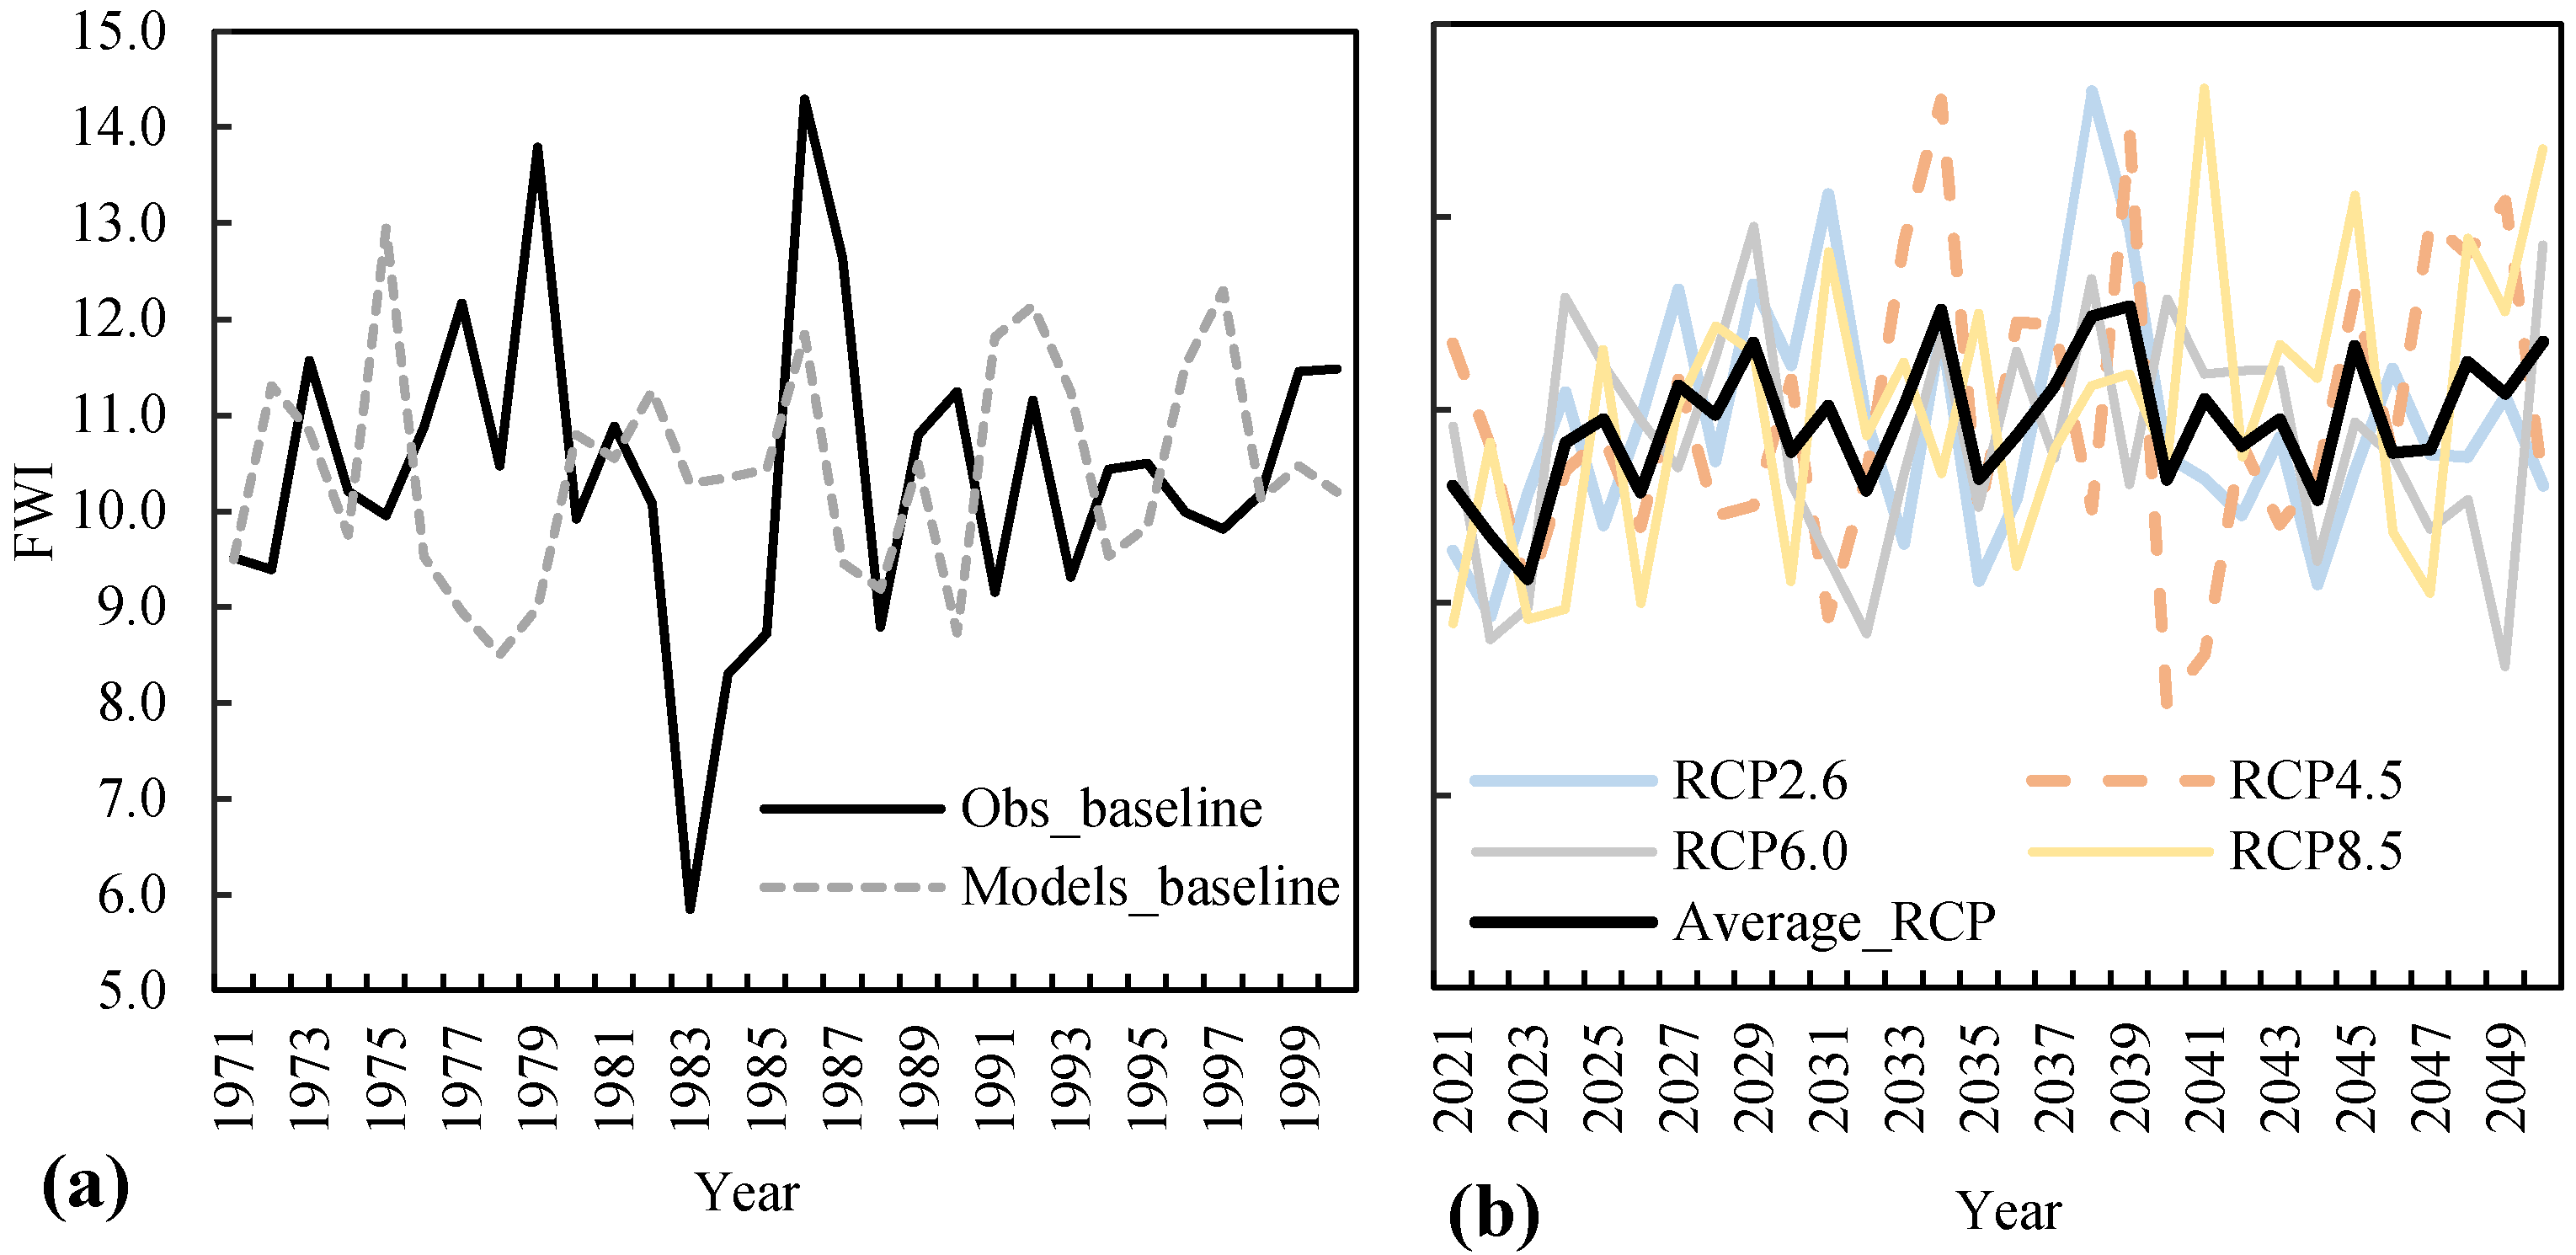
The average FWI of the fire season at baseline would be 10.4 and 10.9 in the 2030s, which is 4.2% higher than that at baseline. The change is not significant (P = 0.5699). The average FWIs of the fire season in the 2030s would be 10.9, 10.9, 10.7, and 11.0 for scenarios RCP2.6, RCP4.5, RCP6.0, and RCP8.5, respectively (Figure 6).
The numbers of annual fires and lightning fires in the 2030s were calculated according to formulas (4) and (5), respectively. The number of fires at baseline was 4–91 per year, including 0–77 lightning fires and 2–61 human-caused fires. If the calculated number of fires was higher than the highest value at baseline, then the maximum number at baseline was used for the model input.
3.2. Burn Probability Simulation for Baseline and the 1991 to 2010 Period
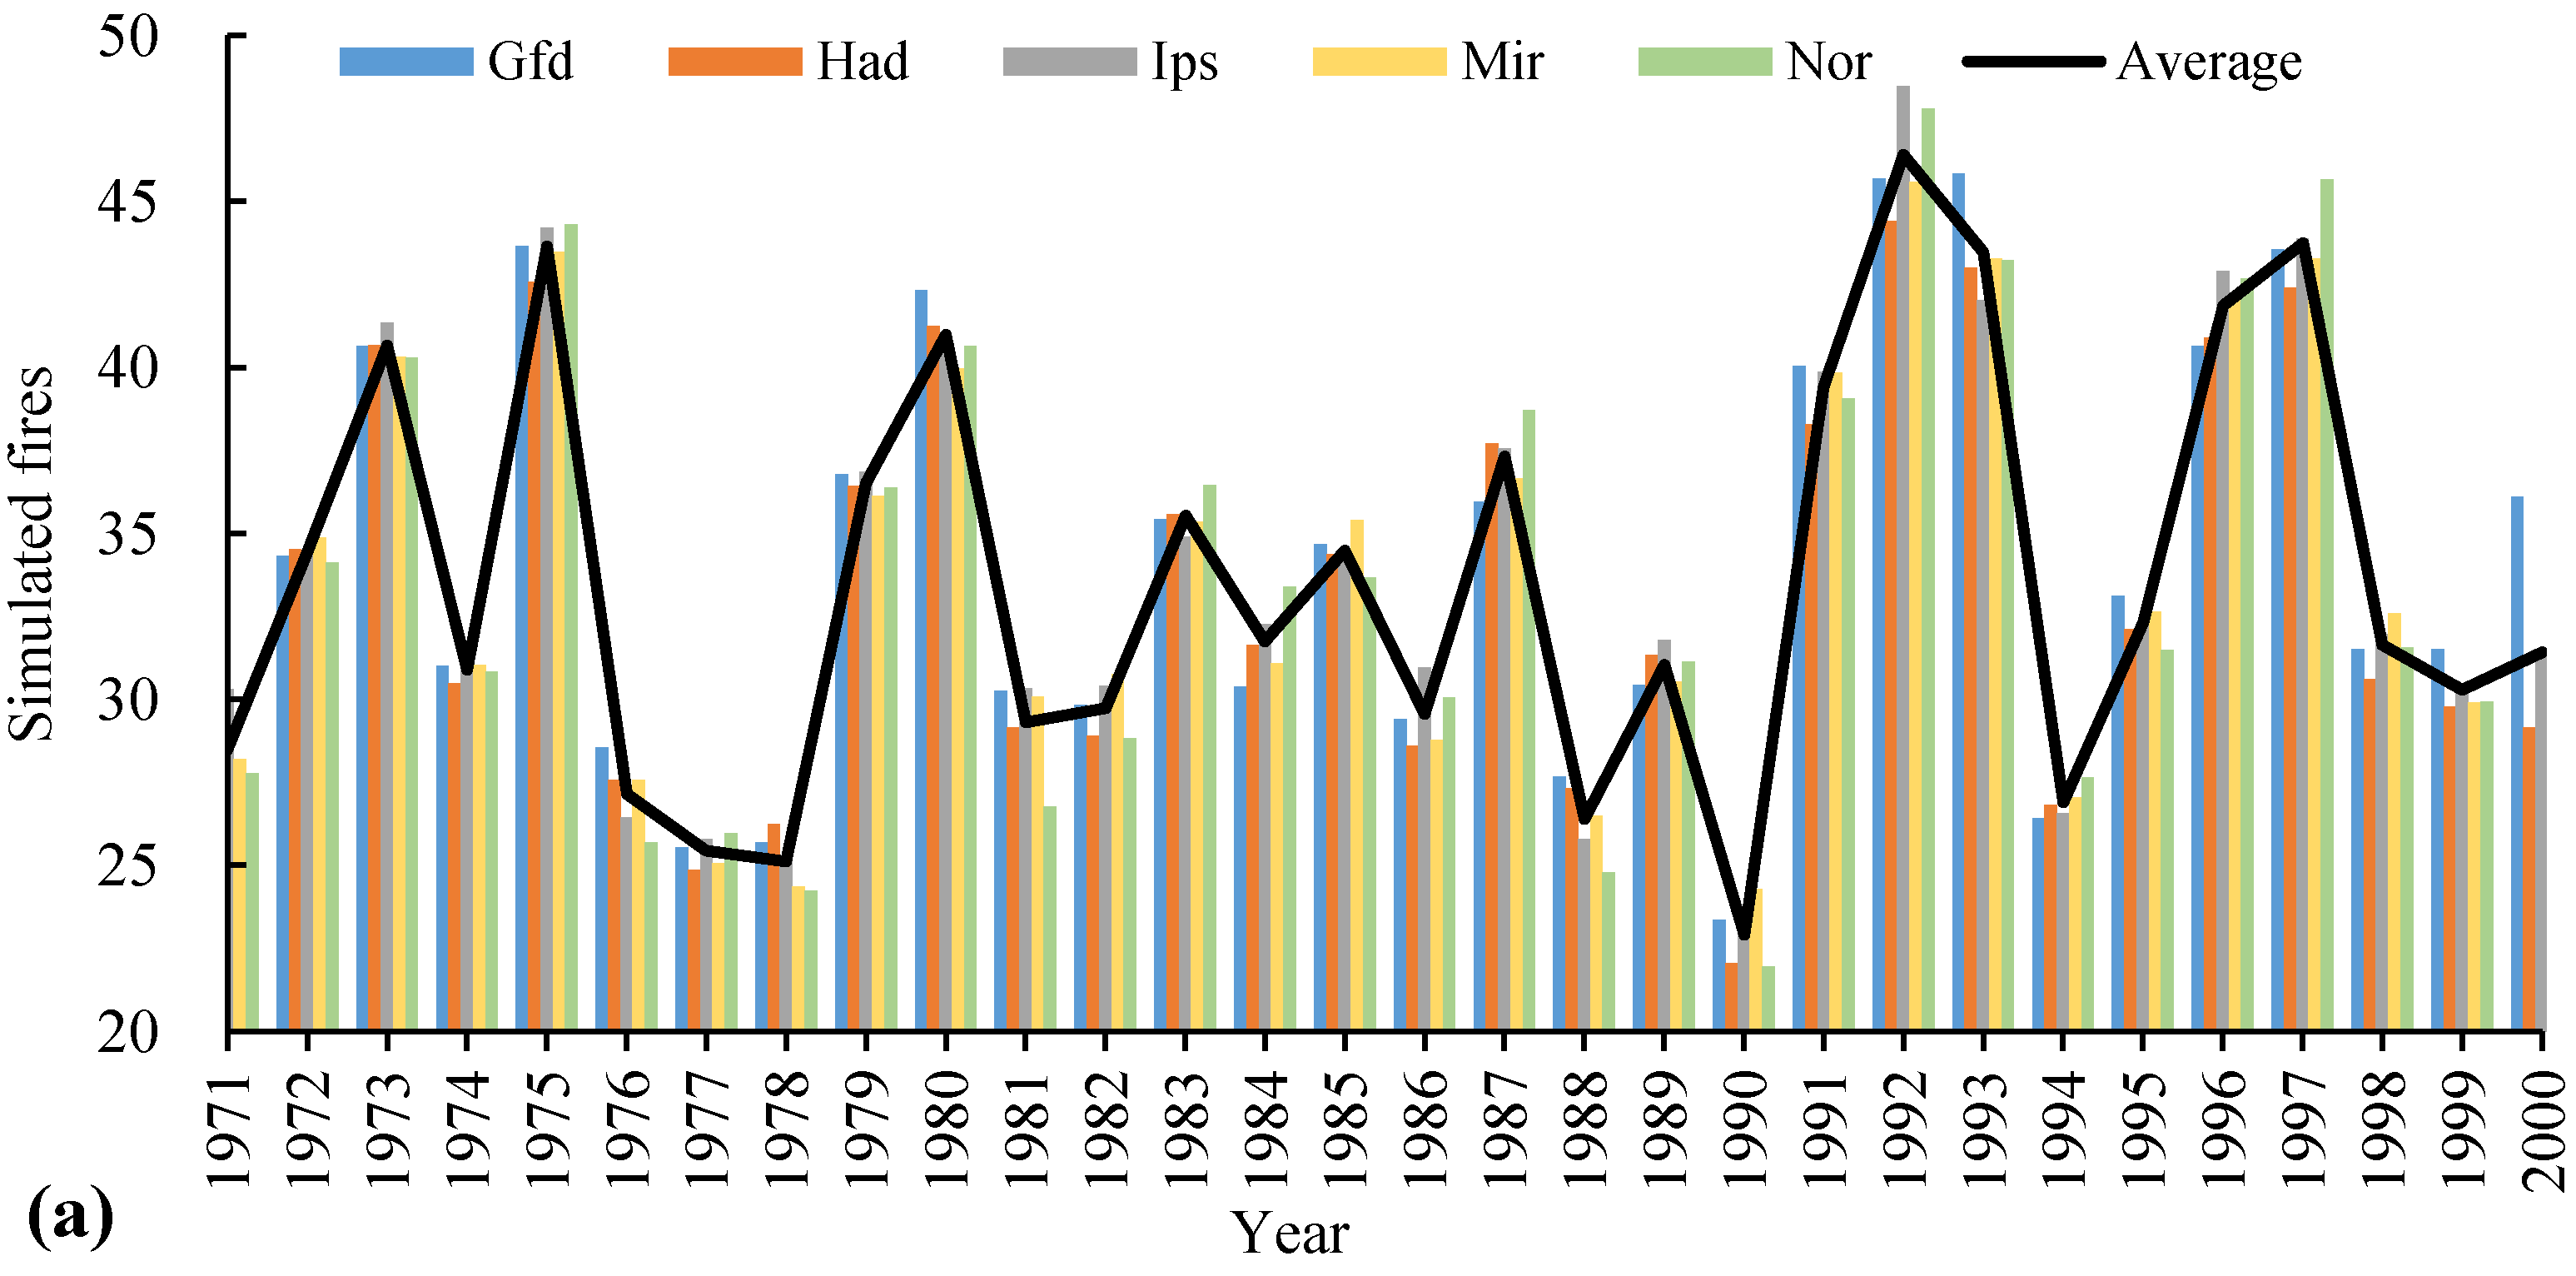
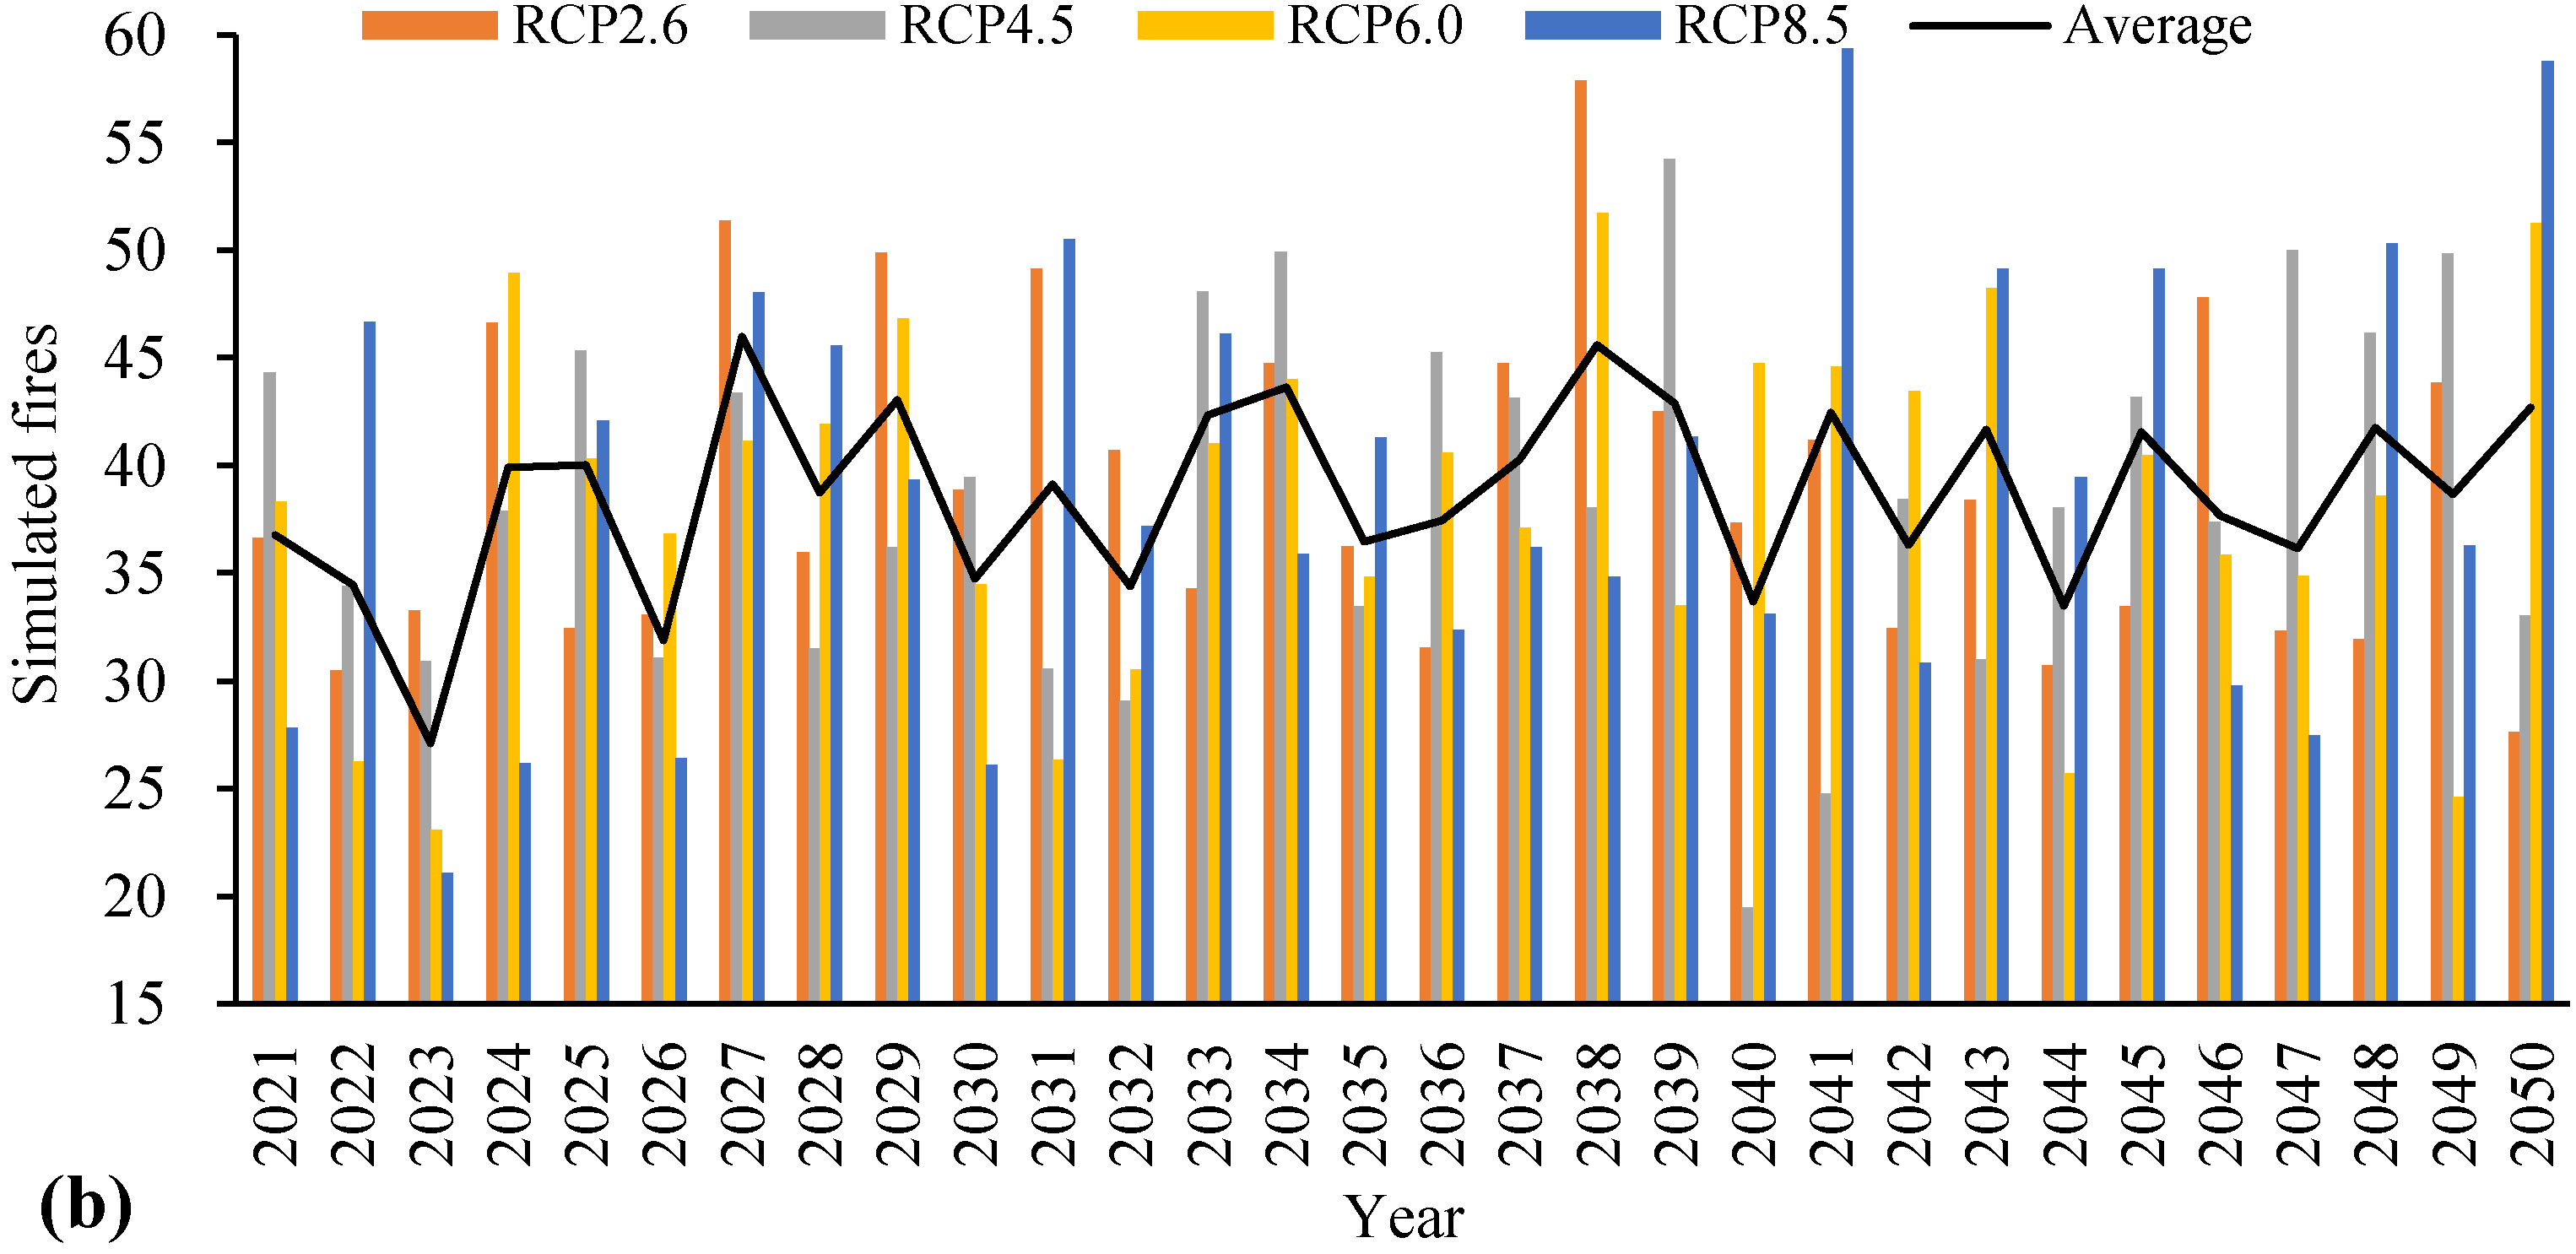
The simulation for the baseline period was performed using fire numbers from historical fire statistics. There were 35 fires on average annual during the baseline period, including 23 lightning fires and 12 human-caused fires. In the 2030s, there would be 39 fires per year on average, including 25 lightning fires and 17 human-caused fires. The minimum number of fires (23) was predicted for 2023 and maximum fires (46) for 2027 (Figure 7).
The numbers of fires calculated from the data of the five GCMs were significantly different (F-test, P = 0.0001) (Figure 8). The predicted average fire numbers per year for the 2030s were 34, 41, 36, 37, and 45 based on the data of GCMs Gfd, Had, Ips, Nor, and Mir, respectively. The fire numbers calculated from the data of the Had and Mir models were relatively high.
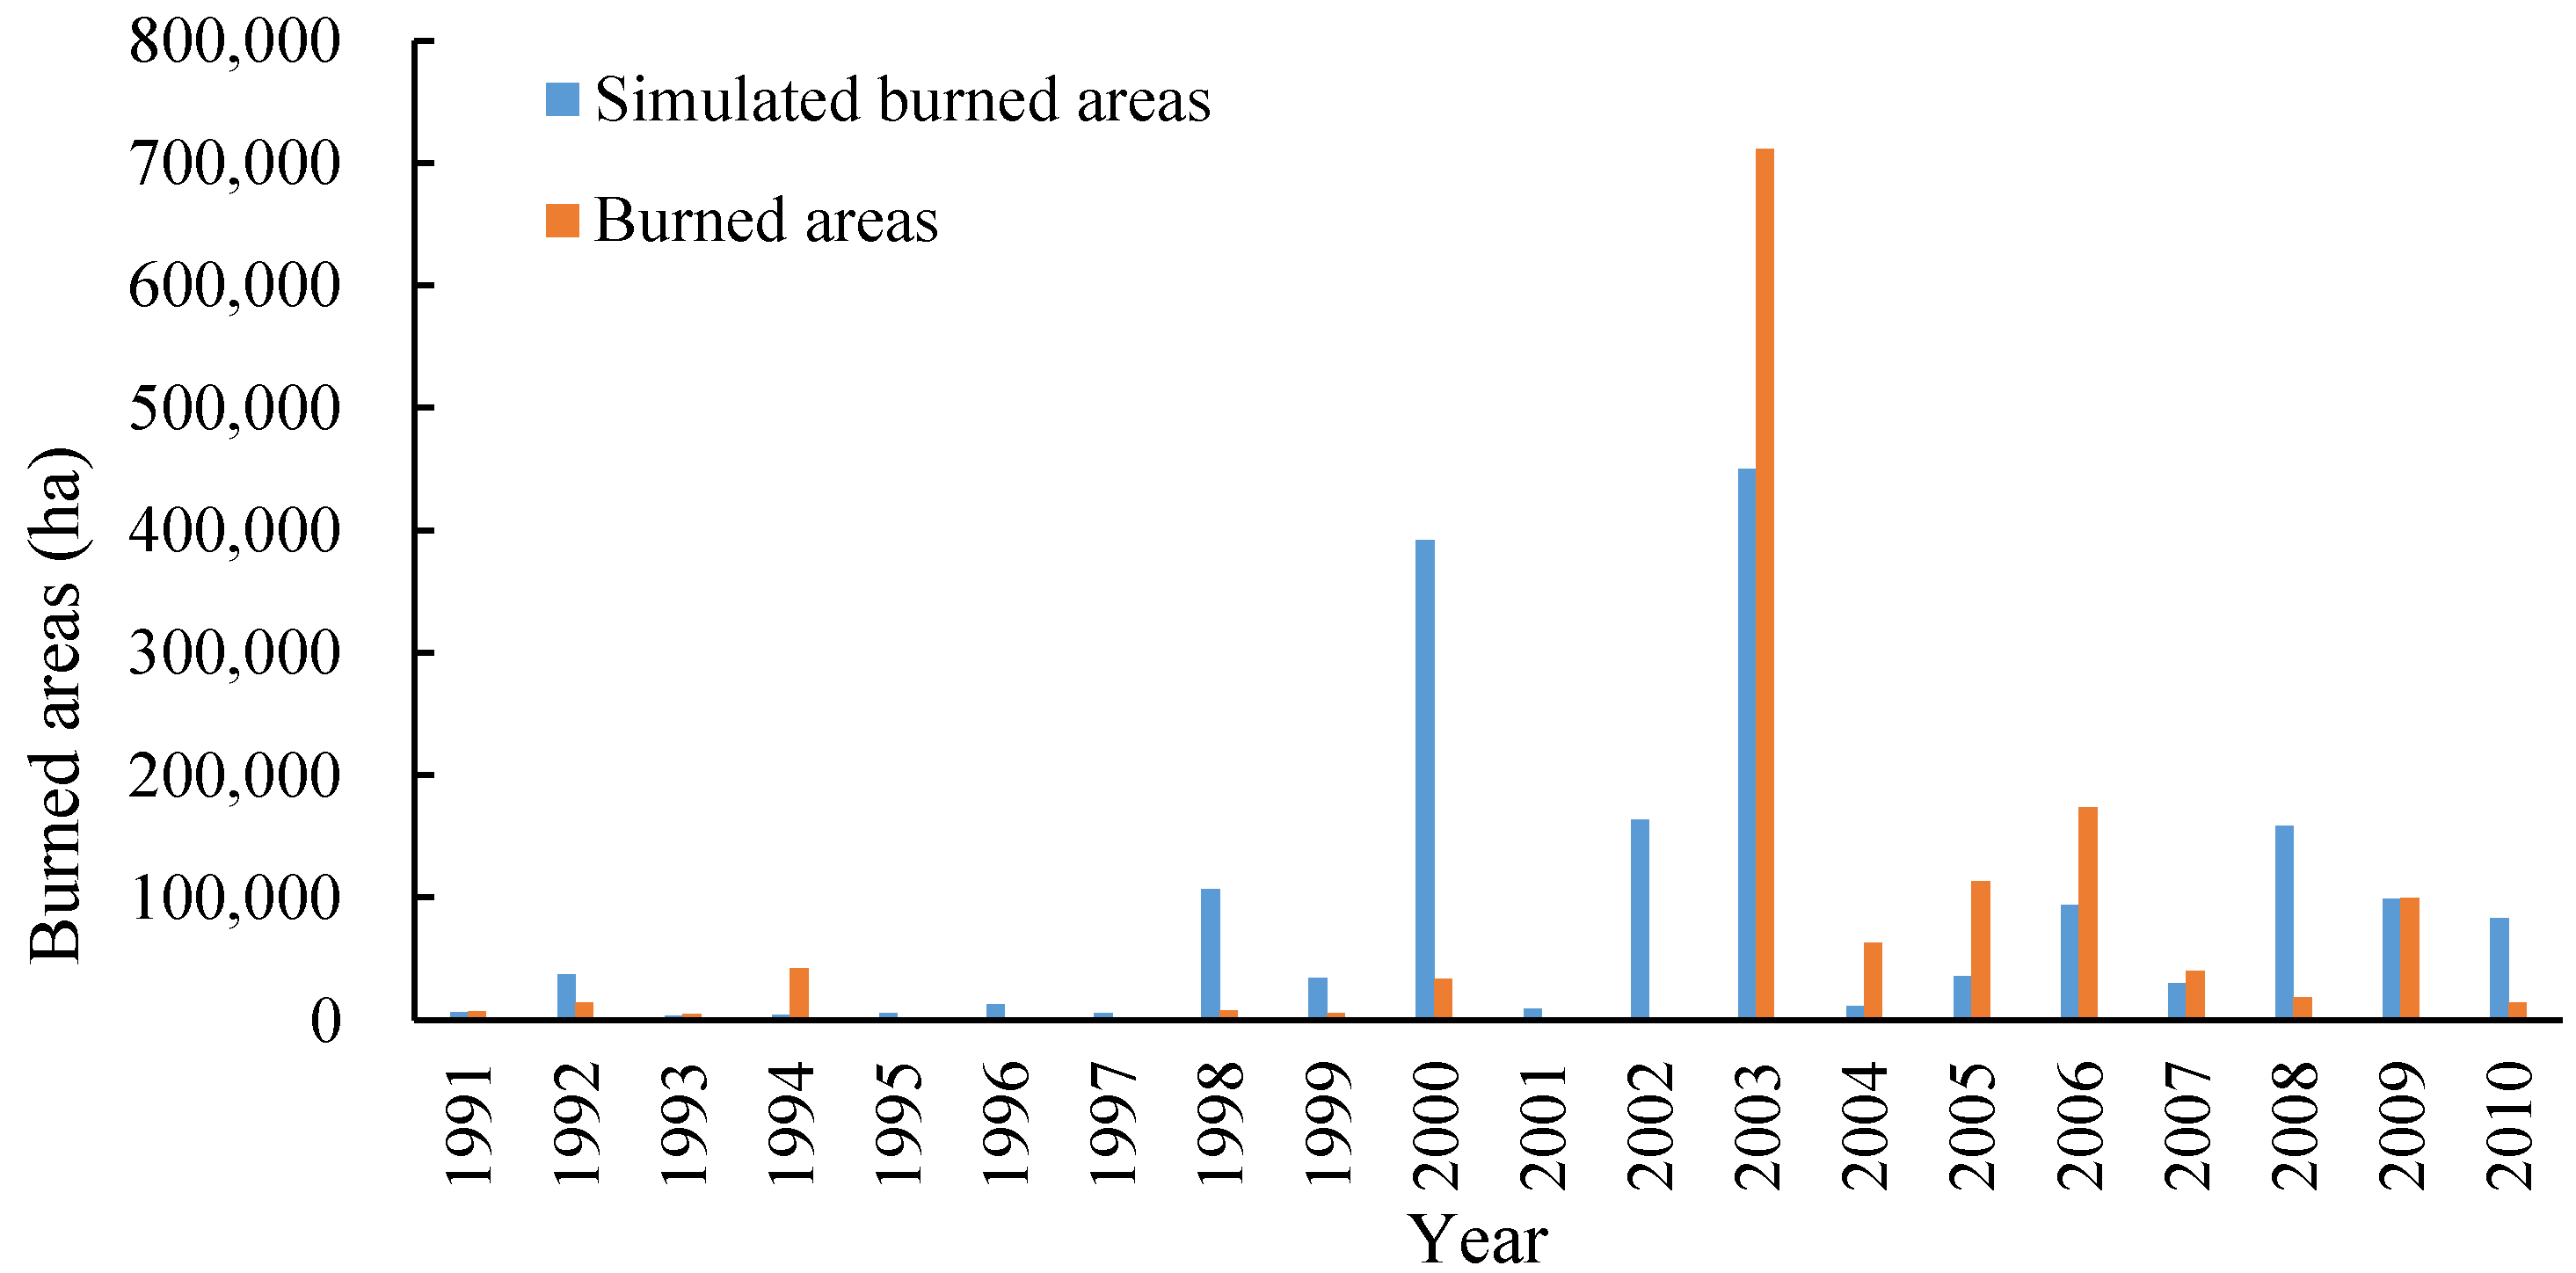
The simulated average annual burned area was 30,209 ha at baseline and the average burned rate was 0.36% (Figure 9). Since there were a clearly change on fire management policy and fire suppression ability in the baseline period, we take fire simulation results in the period 1991–2010 to validate BP model for the region. The simulated burned areas for 1991–2010 showed similar inter-annual fluctuations to the actual burned areas (Figure 10). However, there were obvious differences in individual years such as 2000 and 2002. The occurrence of fire is affected by many factors, such as fire source management, weather, and suppression ability. The simulated ignition locations are random, but the fire source distribution and fire weather may actually vary greatly in each year. Therefore, the BP model can simulate the basic fire conditions in a period or a fire season but cannot exactly predict fire occurrence and burned locations.
3.3. Changes in Burn Probability in 2021–2050
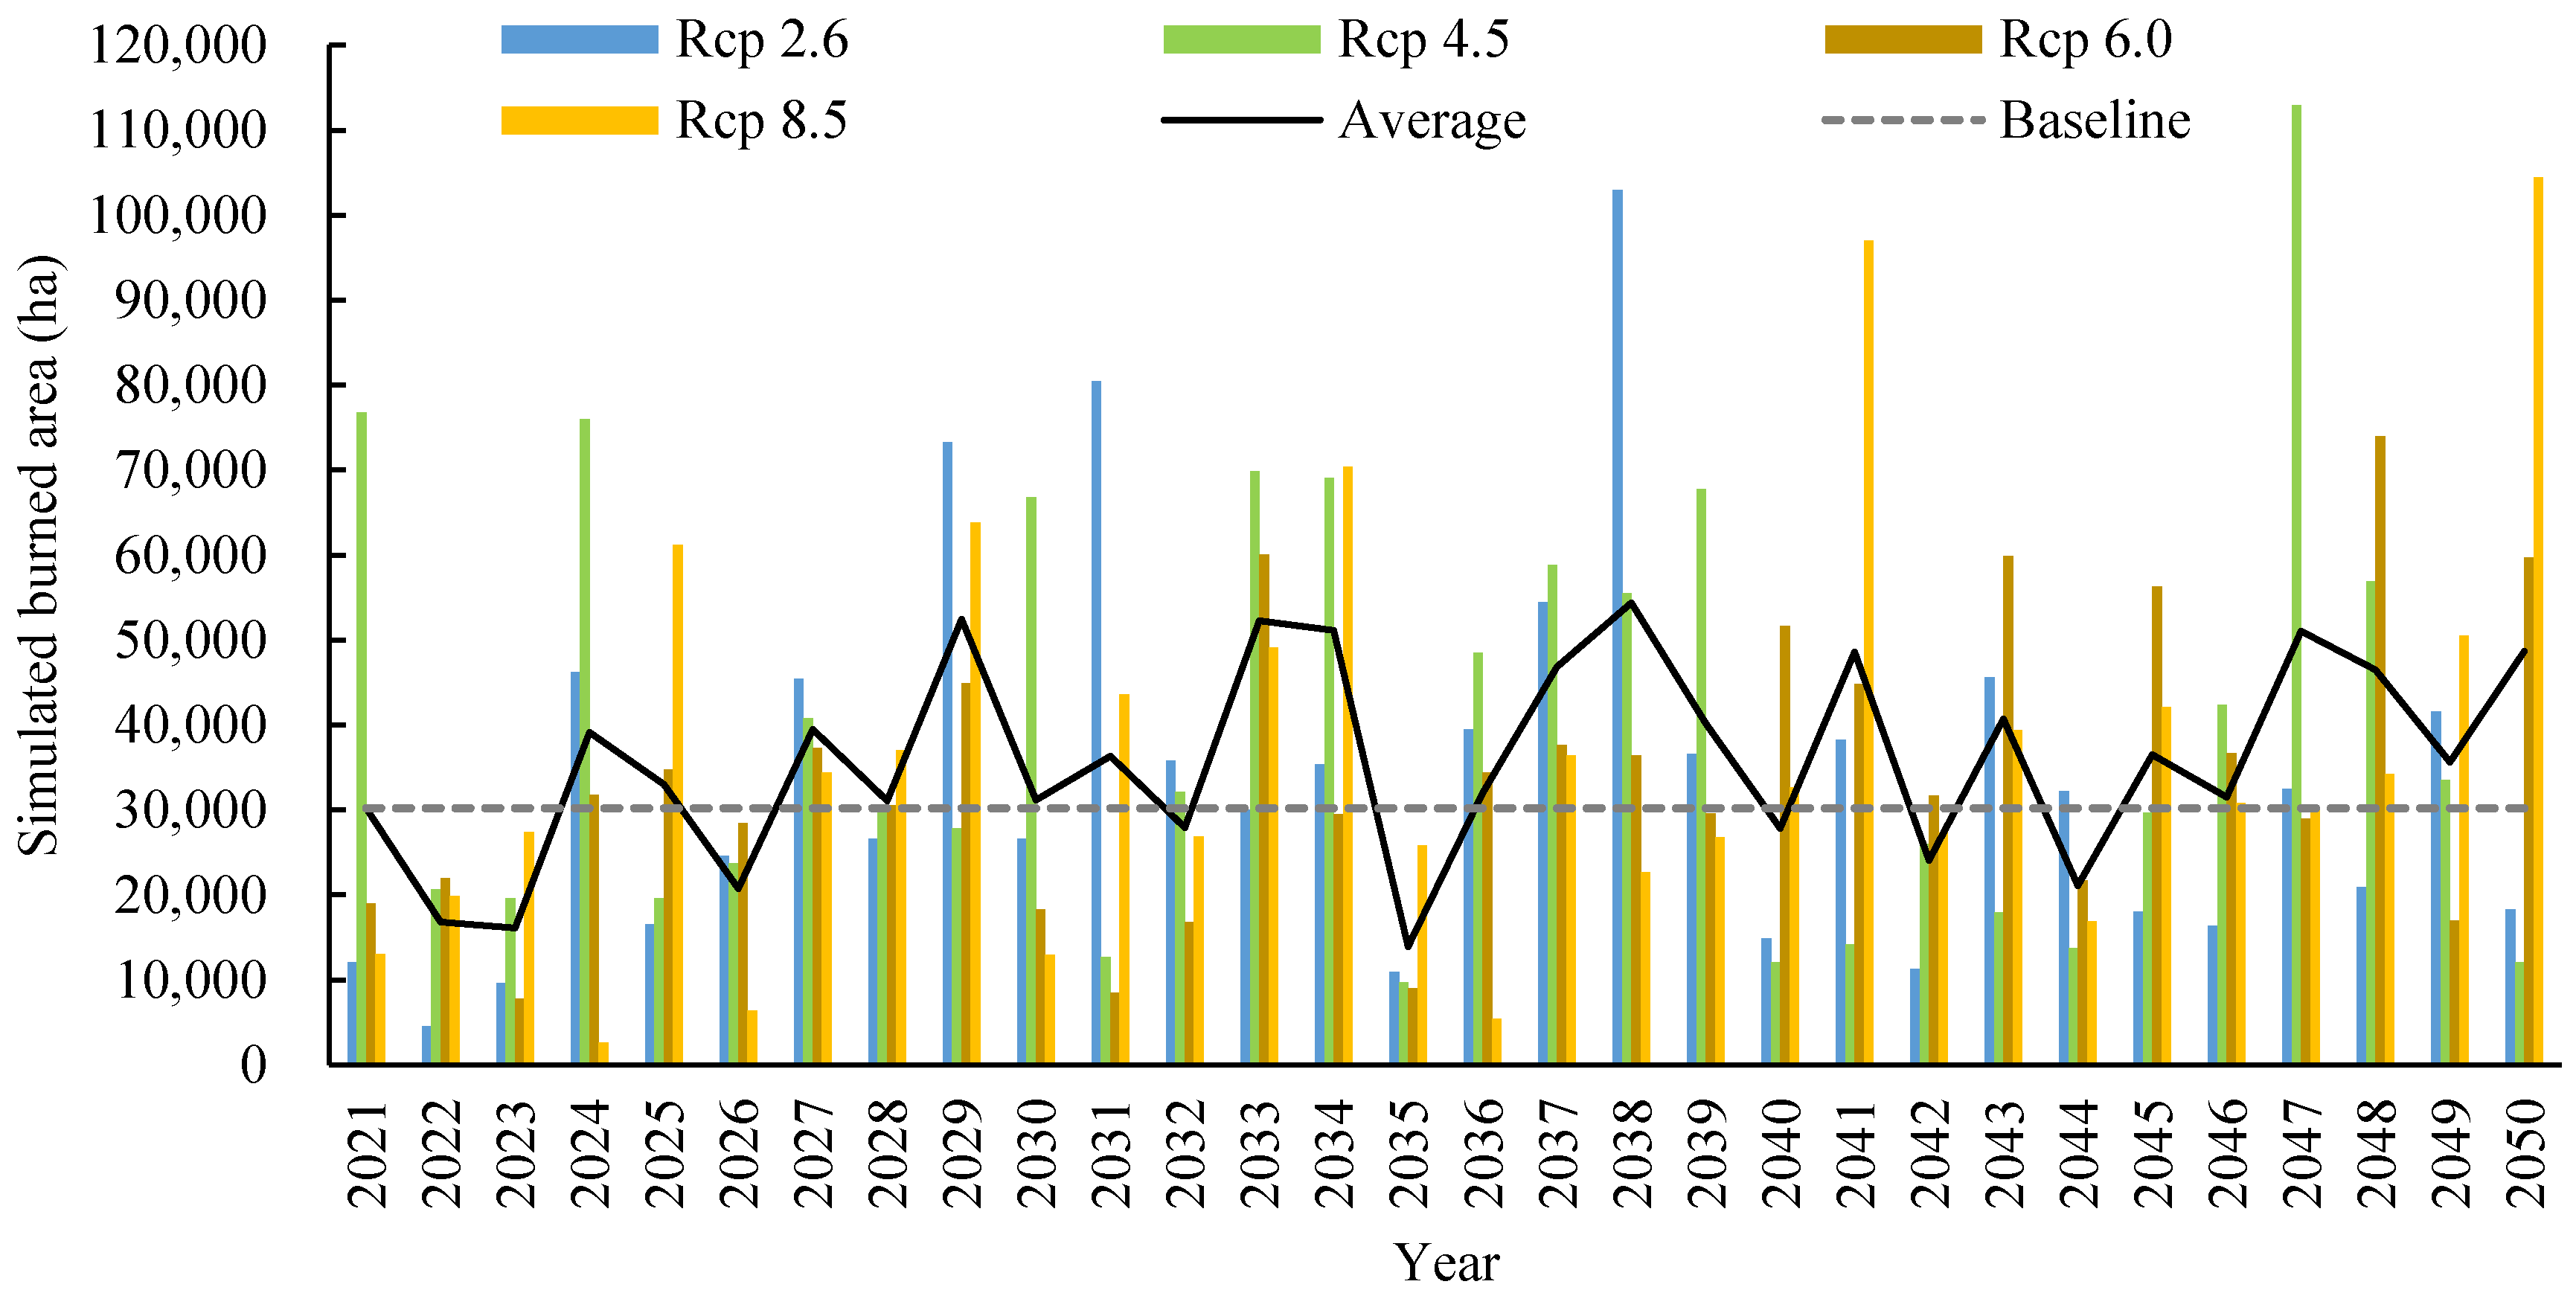
The potential burned areas in the 2030s show an increase of 18.8% over the baseline period. The potential burned areas under the RCP2.6, RCP4.5, RCP6.0, and RCP8.5 scenarios in the 2030s are 33,379, 39,902, 33,954, and 36,362 ha, respectively, which are 10.5%, 32.1%, 12.4%, and 20.4% higher than in the baseline period. The projected burned areas for each year (the averages of the four scenarios) show that the minimum burned area will occur in 2023 (13,870 ha) and the maximum in 2038 (54,389 ha), representing changes of −46.8% and 80.0% compared with the average for the baseline period (Figure 11).
The frequencies of fires with sizes of 1–100, 101–1000, 1001–10,000, and >10,000 ha in the baseline period were 80.2%, 14.5%, 2.3%, 1.7%, and 1.3%, respectively. During the 2030s, the frequencies of fires with sizes of 1–100, 101–1,000, 1001–10,000, and >10,000 ha are predicted to be 77.2%, 16.4%, 2.8%, 2.0%, and 1.6%, respectively, representing increases of −3.0%, 1.9%, 0.5%, 0.2%, and 0.3% over the baseline period (Figure 12). The frequency of fires with all sizes will increase except of the frequency of fires with sizes of 1–100 ha.
Burn probability will increase by 19.4% in the 2030s compared with the baseline period. The average BP values for the study area are 0.0040, 0.0048, 0.0041, and 0.0043 under the RCP2.6, RCP4.5, RCP6.0, and RCP8.5 scenarios, respectively, which are 11.1%, 33.3%, 13.9%, and 19.4% higher than that at baseline.
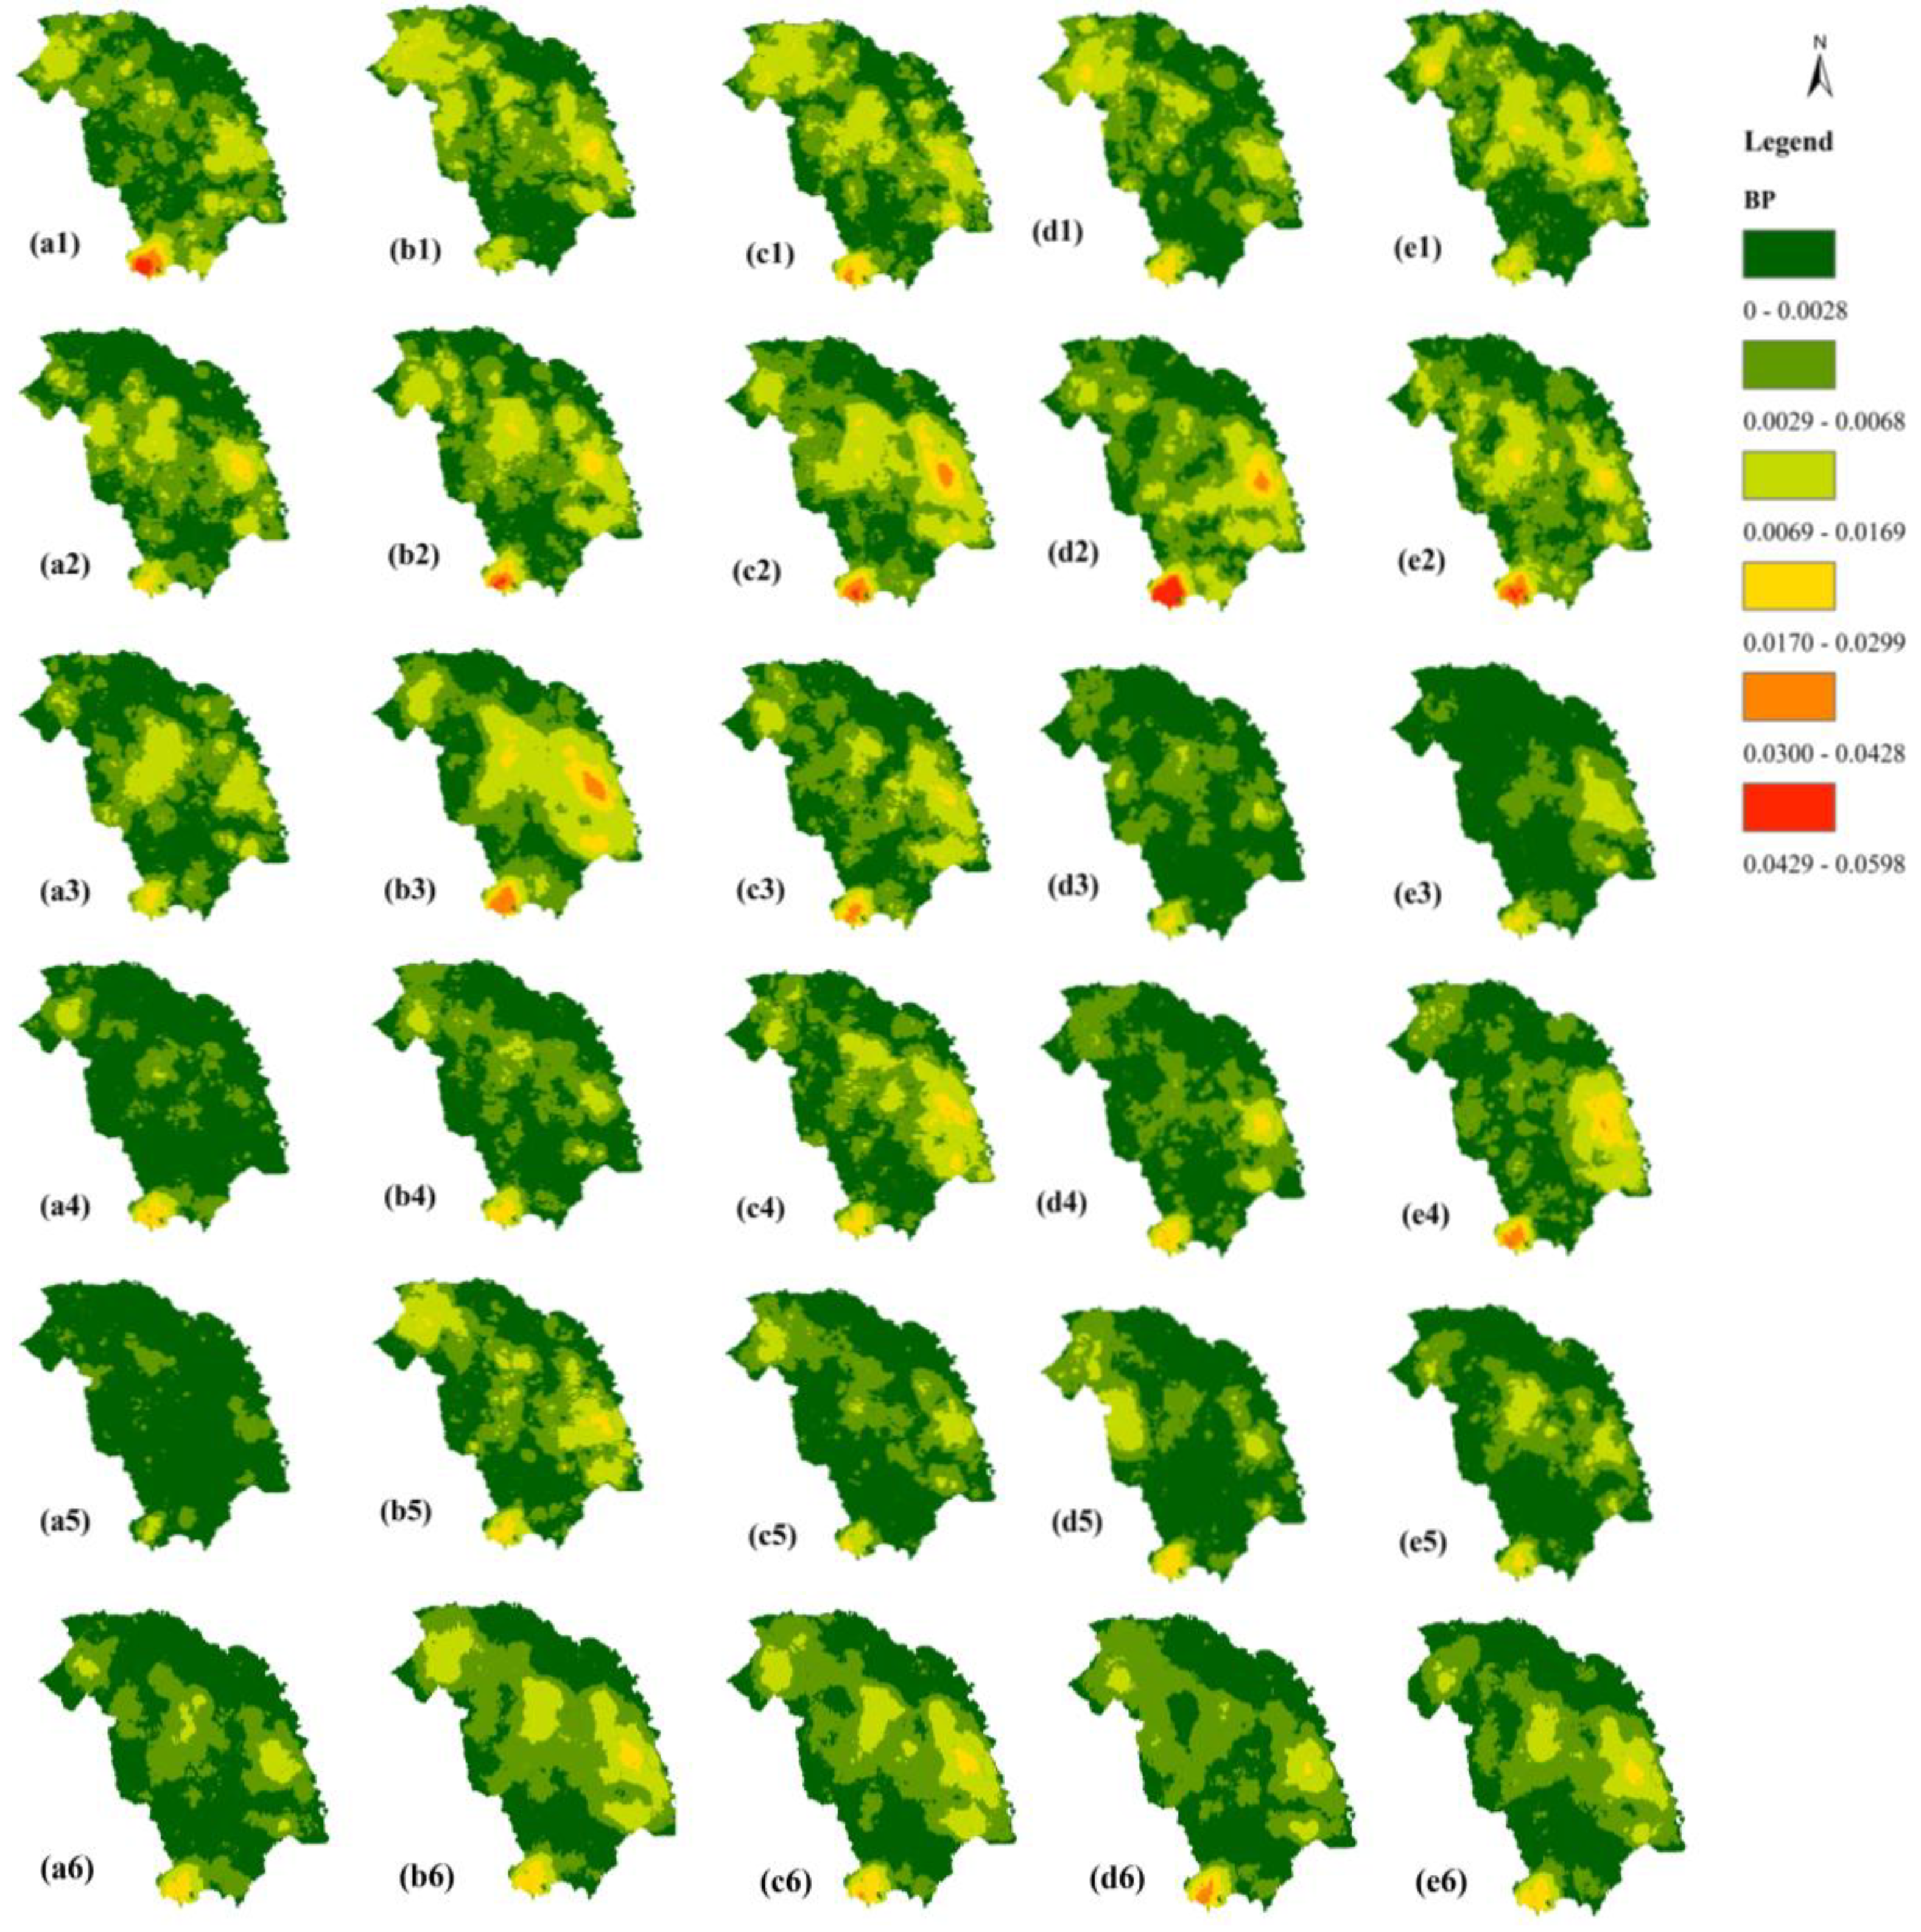
The BP in the southern and eastern parts of the study area showed high values, while that in the north showed low values (Figure 13). The spatial distributions of the BP simulations were different among the results of different models and scenarios. The BP values were clearly high in the southwestern corner and eastern central areas in the results of RCP2.6-Ips (Figure 11-b3), RCP4.5-Had (Figure 11-c2), and RCP6.0-Had (Figure 11-d2).
4. Discussion
The simulated potential burned areas in the 2030s show an increase of 18.8% (range of 10.5% to 32.1%) over those in the baseline period, which is basically consistent with previous research results. The fire danger in the region would increase under the SEARS (special report on emissions scenarios) climate scenario in the future [45,46]. Liu et al. predicted the fire density in cold zone forests in northeastern China during the 2081–2100 period to increase by 30% under the CGCM3 B1 scenario and to decrease by 230% under the HadCM3 A2 scenario, which resulted from simulations of the Landis model [31]. Tian et al. projected that the potential burned areas in northeast China may be increased by 10%–18% in 2071–2100, but this prediction was based on fire weather indices and this methodology was very different from the methods described in this paper for simulating daily fire occurrence and spread in the studied period [45]. Miao and Tian used the Burn-P3 model to simulate BP changes during 2021–2050 under the four climate scenarios, but the study only used data from one GCM (HadGEM2-ES) [37]. The Burn-P3 model does not require the input of specific parameters related to fire suppression and the impact of suppression is mainly reflected in the frequency of fires of different sizes and the days of fire spreading. The Burn-P3 simulation indicated that the average BP during 2021–2050 would be increased by −6.21%, 7.71%, 7.80%, and 19.48% under scenarios RCP2.6, RCP4.5, RCP6.0, and RCP8.5, respectively [37]. The BP simulation results presented in this paper are significantly higher estimates than the results from Burn-P3 simulations. However, the results for the RCP8.5 scenario are similar. The difference occurs for the following reasons:
(1) This study used the daily minimum and maximum temperatures of the GCM outputs to calculate the relative humidity of the day, whereas the earlier study calculated the minimum relative humidity from the average relative humidity. This resulted in the fire weather differences and further affected the fire simulation.
(2) Fire suppression was found to be a key factor affecting fire regime [47,48]. The BP model used in this study uses the parameters of the response time and fire intensity threshold of suppression as inputs to reflect response ability. This simulation process is closer to the actual situation in the study area. The effects of fire suppression are rarely considered in other fire modelling [49].
(3) This study conducted simulations with the data from five GCMs under four scenarios. Taking the averages of all simulations allows accounting for uncertainty of individual models and the results should be more reliable.
Interactions among disturbances, climate, and vegetation influence landscape patterns [45,50]. Predictions of future wildfire areas need to consider not only climate changes and potential changes in drought–fire dynamics but also vegetation changes [5]. The effect of changes in land use or fire management [51,52] and the spatial interaction between fire and vegetation dynamics can definitively affect fire regime [53], as well as possible feedbacks on climate change [54]. Luo et al. indicated that the aboveground biomass in Daxing’anling would increase under climate warming scenarios [55]. However, the simulations described in this paper do not consider the changes in fire sources and fuel types in the future 30 years and the model assumed that the ignition distribution and fuel type would be basically the same as in the baseline period. This is a limitation of this research. If the fire management and fuel types will not have fundamental changes in the next 30 years, a small change in these factors can be considered unlikely to affect the reliability of the conclusion overall. Future studies on fire dynamics should be combined with a vegetation dynamics model for comprehensive analysis. The areas with high BP values should be the key areas that fire management focused in the future. The fuel management measures should be taken in those key areas for adaptation on the climate change.
5. Conclusions
The average daily maximum temperature in the fire season will increase by 2.1 °C (+16.6%) during the 2030s compared with the baseline and precipitation in the fire season will increase by 7.1%. The FWI in the 2030s will increase by 4.2% over that at baseline, but this change is not significant.
The BP model can simulate the basic state of forest fires over a period on a landscape scale. It is estimated that the annual number of fires will increase by 11.4% in the 2030s and that the potential burned areas will increase by 18.8%. The minimum burned area is predicted to occur in 2023 and the maximum in 2038. The BP in the 2030s will be increased by 19.4% compared with that in the baseline period. The southwestern corner and the eastern central parts of the study area show high BP values and will be key areas for fire management in the future.
Author Contributions
X.T. and W.C. conceived and designed the experiments; L.S. contributed some data analysis; X.Z. contributed references collected and manuscript formats; X.T. wrote the paper.
Acknowledgments
This study received financial support from Project (31770695) of the National Natural Science Foundation of China and the National Key Research and Development Plan (2018YFD0600205 and 2017YFD0600106). Mike Wotton from University of Toronto gave helps on the calculation methods for relative humidity.
Conflicts of Interest
The authors declare no conflict of interest. The founding sponsors had no role in the design of the study; in the collection, analyses, or interpretation of data; in the writing of the manuscript, and in the decision to publish the results.
Appendix A
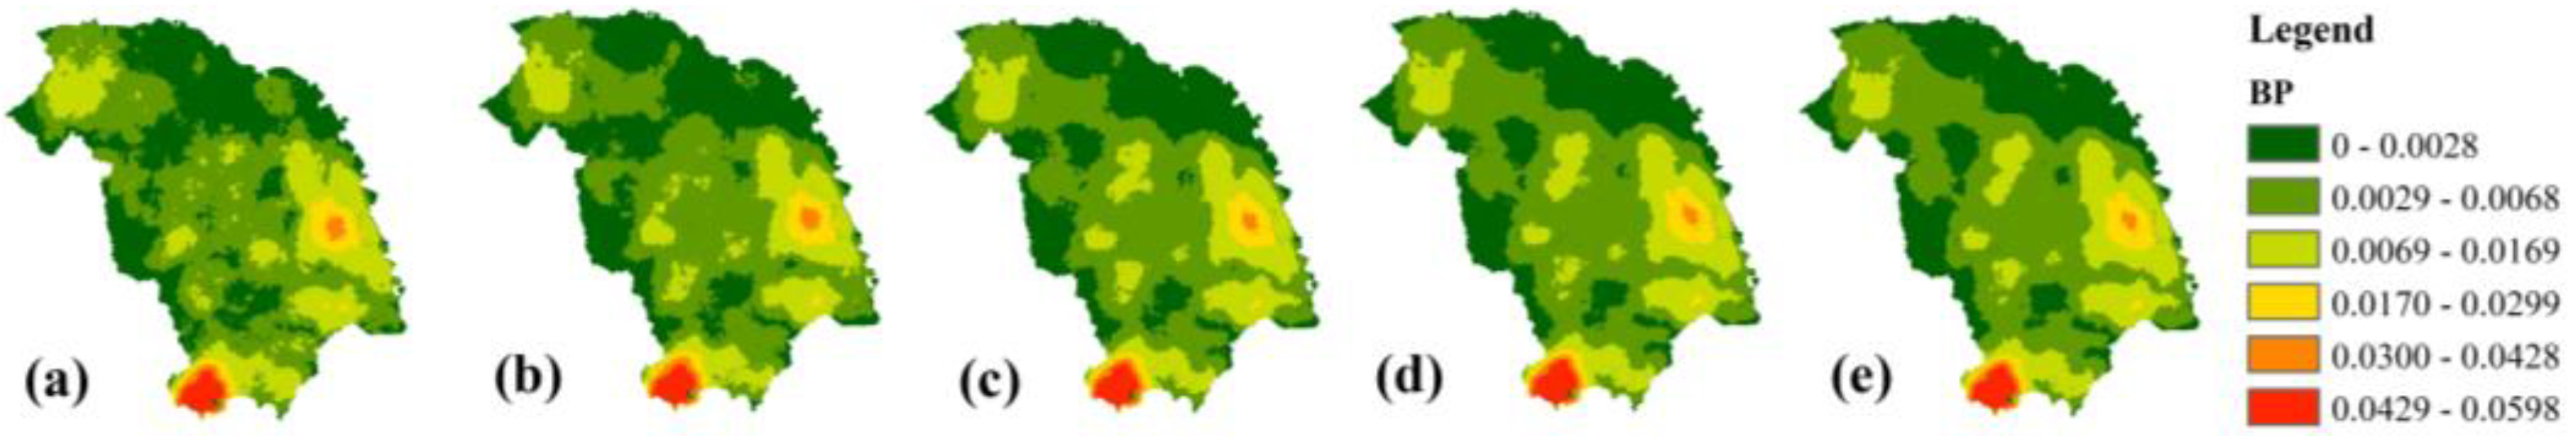
The number of iterations has an impact on the accuracy of BP simulation. Figure 1 shows the results of simulations with 2000, 5000, 10,000, 15,000 and 20,000 iterations for a single scenario (RCP6.0 Had model). The average BP (0.64–0.66, range within 3.1%) for the region may reach a basically stable state when more than 2000 iterations are performed. However, the spatial distribution of BP showed little difference as the number of iterations increased, but the basic features were similar (Figure 1). The average BPs were 0.0022, 0.0024, 0.0024, and 0.0024 for 2000, 5000, 10,000, 15,000, and 20,000 iterations, and the corresponding standard deviations (SD) were 0.0033, 0.0038, 0.0042, and 0.0047, respectively. These averages were very close. However, the maximum values were 0.033, 0.040, 0.044, and 0.048, respectively, representing greater differences. The effect of the iterations on the spatial distribution of BP can be ignored when there are more than 10,000 iterations. The simulation period is also a factor in determining the number of iterations. If the model only simulates one year’s BP, it will obtain stable results with 300 iterations.
Figure A1.
Iterations and simulated BP maps. (a) BP map with 2000 iterations; (b) BP map with 5000 iterations; (c) BP map with 10,000 iterations; (d) BP map with 15,000 iterations; (e) BP map with 20,000 iterations.
Figure A1.
Iterations and simulated BP maps. (a) BP map with 2000 iterations; (b) BP map with 5000 iterations; (c) BP map with 10,000 iterations; (d) BP map with 15,000 iterations; (e) BP map with 20,000 iterations.

References
- Harvey, B.J. Human-caused climate change is now a key driver of forest fire activity in the western United States. Proc. Natl. Acad. Sci. USA 2016, 113, 11649–11650. [Google Scholar] [CrossRef] [PubMed] [Green Version]
- Scheller, R.M.; Kretchun, A.M.; Loudermilk, E.L.; Hurteau, M.D.; Weisberg, P.J.; Skinner, C. Interactions among fuel management, species composition, bark beetles, and climate change and the potential effects on forests of the Lake Tahoe Basin. Ecosystems 2018, 21, 643–656. [Google Scholar] [CrossRef]
- Stambaugh, M.C.; Guyette, R.P.; Stroh, E.D.; Struckhoff, M.A.; Whittier, J.B. Future southcentral US wildfire probability due to climate change. Clim. Change 2018, 147, 617–631. [Google Scholar] [CrossRef]
- Marlon, J.R.; Bartlein, P.J.; Walsh, M.K.; Harrison, S.P.; Brown, K.J.; Edwards, M.E.; Higuera, P.E.; Power, M.J.; Anderson, R.S.; Briles, C.; et al. Wildfire responses to abrupt climate change in North America. Proc. Natl. Acad. Sci. USA 2009, 106, 2519–2524. [Google Scholar] [CrossRef] [PubMed] [Green Version]
- McKenzie, D.; Littell, J.S. Climate change and the eco-hydrology of fire: Will area burned increase in a warming western USA? Ecol. Appl. 2017, 27, 26–36. [Google Scholar] [CrossRef] [PubMed]
- Jolly, W.M.; Cochrane, M.A.; Freeborn, P.H.; Holden, Z.A.; Brown, T.J.; Williamson, G.J.; Bowman, D.M. Climate-induced variations in global wildfire danger from 1979 to 2013. Nat. Commun. 2015, 6, 7537. [Google Scholar] [CrossRef] [PubMed]
- Knorr, W.; Dentener, F.; Hantson, S.; Jiang, L.; Klimont, Z.; Arneth, A. Air quality impacts of European wildfire emissions in a changing climate. Atmos. Chem. Phys. 2016, 16, 5685–5703. [Google Scholar] [CrossRef] [Green Version]
- Change, N.C. Spreading like wildfire. Nat. Clim. Chang 2017, 7, 755. [Google Scholar] [CrossRef]
- Borunda, A. See How a Warmer World Primed California for Large Fires. Available online: https://www.nationalgeographic.com/environment/2018/11/climate-change-california-wildfire/ (accessed on 26 December 2018).
- Westerling, A.; Brown, T.; Schoennagel, T.; Swetnam, T.; Turner, M.; Veblen, T. Briefing: Climate and wildfire in western US forests. In Forest Conservation and Management in the Anthropocene: Conference Proceedings; Proceedings. RMRS-P-71; Sample, V.A., Bixler, R.K., Eds.; US Department of Agriculture, Forest Service. Rocky Mountain Research Station: Fort Collins, CO, USA, 2014; pp. 81–102. [Google Scholar]
- The Rising Cost of Fire Operations: Effects on the Forest Service’s NonFire Work. Available online: https://www.fs.fed.us/sites/default/files/2015-Fire-Budget-Report.pdf (accessed on 10 January 2019).
- AghaKouchak, A.; Huning, L.S.; Chiang, F.; Sadegh, M.; Vahedifard, F.; Mazdiyasni, O.; Mallakpour, I. How do natural hazards cascade to cause disasters? Nature 2018, 561, 458–460. [Google Scholar] [CrossRef] [Green Version]
- Liang, S.; Hurteau, M.D.; Westerling, A.L. Large-scale restoration increases carbon stability under projected climate and wildfire regimes. Front. Ecol. Environ. 2018, 16, 207–212. [Google Scholar] [CrossRef]
- Soja, A.J.; Tchebakova, N.M.; French, N.H.F.; Flannigan, M.D.; Shugart, H.H.; Stocks, B.J.; Sukhinin, A.I.; Parfenova, E.I.; Stackhouse, P.W., Jr. Climate-induced boreal forest change: Predictions versus current observations. Glob. Planet. Change 2007, 56, 274–296. [Google Scholar] [CrossRef] [Green Version]
- Westerling, A.L.; Hidalgo, H.G.; Cayan, D.R.; Swetnam, T.W. Warming and earlier spring increase western US forest wildfire activity. Science 2006, 313, 940–943. [Google Scholar] [CrossRef] [PubMed]
- Abatzoglou, J.T.; Williams A, P. Impact of anthropogenic climate change on wildfire across western US forests. Proc. Natl. Acad. Sci. USA 2016, 113, 11770–11775. [Google Scholar] [CrossRef] [PubMed] [Green Version]
- Liu, Y.; Stanturf, J.; Goodrick, S. Trends in global wildfire potential in a changing climate. For. Ecol. Manag. 2010, 259, 685–697. [Google Scholar] [CrossRef]
- Bowman, D.M.J.S.; Williamson, G.J.; Abatzoglou, J.T.; Kolden, C.A.; Cochrane, M.A.; Smith, A.M. Human exposure and sensitivity to globally extreme wildfire events. Nat. Ecol. Evol. 2017, 1, 16–58. [Google Scholar] [CrossRef] [PubMed]
- Camia, A.; Libertà, G.; San-Miguel-Ayanz, J. Modeling the Impacts of Climate Change on Forest Fire Danger in Europe; EU JRC Tech. Rep.: Brussels, Belgium, 2017; pp. 1–22. [Google Scholar]
- Wildfire Simulations For California’S Fourth Climate Change Assessment: Projecting Changes In Extreme Wildfire Events With A Warming Climate. California’S Fourth Climate Change Assessment. Available online: http://www.climateassessment.ca.gov/techreports/docs/20180827 -Projections_CCCA4-CEC-2018-014.pdf (accessed on 10 January 2019).
- Mann, M.L.; Batllori, E.; Moritz, M.A.; Waller, E.K.; Berck, P.; Flint, A.L.; Flint, L.E.; Dolfi, E. Incorporating anthropogenic influences into fire probability models: Effects of human activity and climate change on fire activity in California. PLoS ONE 2016, 11, e0153589. [Google Scholar] [CrossRef] [PubMed]
- Parks, S.A.; Miller, C.; Abatzoglou, J.T.; Holsinger, L.M.; Parisien, M.A.; Dobrowski, S.Z. How will climate change affect wildland fire severity in the western US? Environ. Res. Lett. 2016, 11, 035002. [Google Scholar] [CrossRef] [Green Version]
- Kitzberger, T.; Falk, D.A.; Westerling, A.L.; Swetnam, T.W. Direct and indirect climate controls predict heterogeneous early-mid 21st century wildfire burned area across western and boreal North America. PLoS ONE 2017, 12, e0188486. [Google Scholar] [CrossRef]
- Melvin, A.M.; Murray, J.; Boehlert, B.; Martinich, J.A.; Rennels, L.; Rupp, T.S. Estimating wildfire response costs in Alaska’s changing climate. Clim. Change 2017, 141, 783–795. [Google Scholar] [CrossRef]
- Yue, X.; Mickley, L.J.; Logan, J.A.; Hudman, R.C.; Martin, M.V.; Yantosca, R.M. Impact of 2050 climate change on North American wildfire: Consequences for ozone air quality. Atmos. Chem. Phys. 2015, 15, 10033–10055. [Google Scholar] [CrossRef]
- Lozano, O.M.; Salis, M.; Ager, A.A.; Arca, B.; Alcasena, F.J.; Monteiro, A.T.; Spano, D. Assessing climate change impacts on wildfire exposure in Mediterranean areas. Risk Anal. 2017, 37, 1898–1916. [Google Scholar] [CrossRef]
- Turco, M.; Rosa-Cánovas, J.J.; Bedia, J.; Jerez, S.; Montávez, J.P.; Llasat, M.C.; Provenzale, A. Exacerbated fires in Mediterranean Europe due to anthropogenic warming projected with non-stationary climate-fire models. Nat. Commun. 2018, 9, 3821. [Google Scholar] [CrossRef] [PubMed]
- Zhang, Y.Q.; Hu, H.Q. Climatic Change and Its Impact on Forest Fire in Daxing’ anling Mountains. J. North. For. Univ. 2008, 36, 29–31. [Google Scholar]
- Zhao, F.J.; Shu, L.F.; Di, X.; Tian, X.R.; Wang, M.Y. Changes in the Occurring Date of Forest Fires in the Inner Mongolia Daxing’anling Forest Region Under Global Warming. Sci. Silvae Sinicae 2009, 45, 166–172. [Google Scholar]
- Yang, G.; Di, X.Y.; Zeng, T.; Shu, Z.; Wang, C.; Yu, H.Z. Prediction of area burned under climatic change scenarios: A case study in the Great Xing’an Mountains boreal forest. J. For. Res. 2010, 21, 213–218. [Google Scholar] [CrossRef]
- Liu, Z.H.; Yang, J.; Chang, Y.; Weisberg, P.J.; He, H.S. Spatial patterns and drivers of fire occurrence and its future trend under climate change in a boreal forest of Northeast China. Glob. Change Biol. 2012, 18, 2041–2056. [Google Scholar] [CrossRef]
- Li, S.; Wu, Z.; Liang, Y.; He, H. Drivers of human-caused fire occurrence and its variation trend under climate change in the Great Xing’an Mountains, Northeast China. Chin. J. Appl. Ecol. 2017, 28, 210–218. [Google Scholar] [CrossRef]
- Stephens, S.L.; Moghaddas, J.J. Experimental fuel treatment impacts on forest structure, potential fire behavior, and predicted tree mortality in a California mixed conifer forest. For. Ecol. Manag. 2005, 215, 21–36. [Google Scholar] [CrossRef]
- Perera, A.H.; Ouellette, M.R.; Cui, W.; Drescher, M.; Boychuk, D. BFOLDS 1.0: A Spatial Simulation Model for Exploring Large Scale Fire Regimes and succession in Boreal Forest Landscapes; Forest Research Report-Ontario Forest Research Institute: Sault Ste. Marie, ON, Canada, 2008. [Google Scholar]
- Dillon, G.; Menakis, J.; Fay, F. Wildland fire potential: A tool for assessing wildfire risk and fuels management needs. In Proceedings of the Large Wildland Fires Conference, Missoula, MT, USA, 19–23 May 2014; Proc. RMRS-P-73. Keane, R.E., Jolly, M., Parsons, R., Riley, K., Eds.; US Department of Agriculture, Forest Service, Rocky Mountain Research Station: Fort Collins, CO, USA, 2015; pp. 60–76. [Google Scholar]
- Wang, X.; Parisien, M.; Taylor, S.W.; Perrakis, D.; Little, J.; Flannigan, M. Future burn probability in south-central British Columbia. Int. J. Wildl. Fire 2016, 25. [Google Scholar] [CrossRef]
- Miao, Q.; Tian, X. Assessment of Burn Probability Assessment in Daxing’anling under Multi-Climatic Scenarios. Sci. Silvae Sinicae 2016, 52, 109–116. [Google Scholar] [CrossRef]
- Xu, H. Forests in Daxing’anling; Science Press: Beijing, China, 1998. [Google Scholar]
- Todd, B. User Documentation for the Wildland Fire Growth Model and the Wildfire Display Program; Canadian Forest Service, Fire Research Network Report 37; Canadian Forest Service: Edmonton, AL, Canada, 1999; Unpublished. [Google Scholar]
- Van Wagner, C.E.; Forest, P. Development and Structure of the Canadian Forest Fire Weather Index System; Forestry Technical Report; Canadian Forestry Service: Ottawa, ON, Canada, 1987. [Google Scholar]
- Hay, L.E.; Wilby, R.L.; Leavesley, G.H. A comparison of Delta change and downscaled GCM scenarios for three mountainous basins in the United States. J. Am. Water Resour. Assoc. 2000, 36, 387–397. [Google Scholar] [CrossRef]
- Xu, X.; Yu, J.; Li, H.; Yang, L. Comparative study on calculation methods of dew-point temperature. J. Meteorol. Environ. 2016, 32, 107–111. [Google Scholar] [CrossRef]
- Van Wagner, C.E.; Stocks, B.J.; Lawson, B.D.; Alexander, M.E.; Lynham, T.J.; McAlpine, R.S. Development and Structure of the Canadian Forest Fire Behavior Prediction System. Forestry Canada Fire Danger Group Information Report ST-X-3; Ottawa, ON, Canada, 1992. Available online: https://www.frames.gov/documents/catalog/forestry_canada_fire_danger_group_1992.pdf (accessed on 23 July 2019).
- De Groot, W.J. Examples of Fuel Types in the Canadian Forest Fire Behavior Prediction (FBP) System; Forestry Canada, Northwest Region, Northern Forestry Centre: Edmonton, AB, Canada, 1993. [Google Scholar]
- Tian, X.; McRae, D.J.; Jin, J.; Shu, L.; Zhao, F.; Wang, M. Wildfires and the Canadian Forest Fire Weather Index system for the Daxing’anling region of China. Int. J. Wildl. Fire 2011, 20, 963–973. [Google Scholar] [CrossRef]
- Yang, G.; Shu, L.F.; Di, X.Y. Prediction on the changes of forest fire danger rating in Great Xing’an Mountain region of Northeast China in the 21st century under effects of climate change. Chin. J. Appl. Ecol. 2012, 23, 3236–3242. [Google Scholar]
- Cumming, S.G. Effective fire suppression in boreal forests. Can. J. For. Res. 2005, 35, 772–786. [Google Scholar] [CrossRef]
- Brotons, L.; Duane, A. Correspondence: Uncertainty in climate-vegetation feedbacks on fire regimes challenges reliable long-term projections of burnt area from correlative models. Fire 2019, 2, 8. [Google Scholar] [CrossRef]
- Ruffault, J.; Mouillot, F. How a new fire-suppression policy can abruptly reshape the fire-weather relationship. Ecosphere 2015, 6, 1–19. [Google Scholar] [CrossRef]
- Loehman, R.A.; Keane, R.E.; Holsinger, L.M.; Wu, Z. Interactions of landscape disturbances and climate change dictate ecological pattern and process: Spatial modeling of wildfire, insect, and disease dynamics under future climates. Landsc. Ecol. 2017, 32, 1447–1459. [Google Scholar] [CrossRef]
- Duane, A.; Aquilué, N.; Canelles, Q.; Morán-Ordoñez, A.; De Cáceres, M.; Brotons, L. Adapting prescribed burns to future climate change in Mediterranean landscapes. Sci. Total Environ. 2019, 677, 68–83. [Google Scholar] [CrossRef]
- Aquilué, N.; Fortin, M.J.; Messier, C.; Brotons, L. The potential of agricultural conversion to shape forest fire regimes in Mediterranean landscapes. Ecosystems 2019, 1–18. [Google Scholar] [CrossRef]
- Pausas, J.G.; Paula, S. Fuel shapes the fire-climate relationship: Evidence from Mediterranean ecosystems. Glob. Ecol. Biogeogr. 2012, 21, 1074–1082. [Google Scholar] [CrossRef]
- Brotons, L.; Aquilué, N.; De Cáceres, M.; Fortin, M.J.; Fall, A. How fire history, fire suppression practices and climate change affect wildfire regimes in Mediterranean landscapes. PLoS ONE 2013, 8, e62392. [Google Scholar] [CrossRef] [PubMed]
- Luo, X.; Wang, Y.; Zhang, J. Simulating the effects of climate change and fire disturbance on aboveground biomass of boreal forests in the Great Xing’an Mountains, Northeast China. Chin. J. Appl. Ecol. 2018, 29, 713–724. [Google Scholar]
Figure 1.
Location of the study area and vegetation types.

Figure 2.
Fire statistics of Daxing’anling during 1971–2015.

Figure 3.
The framework burn probability model.

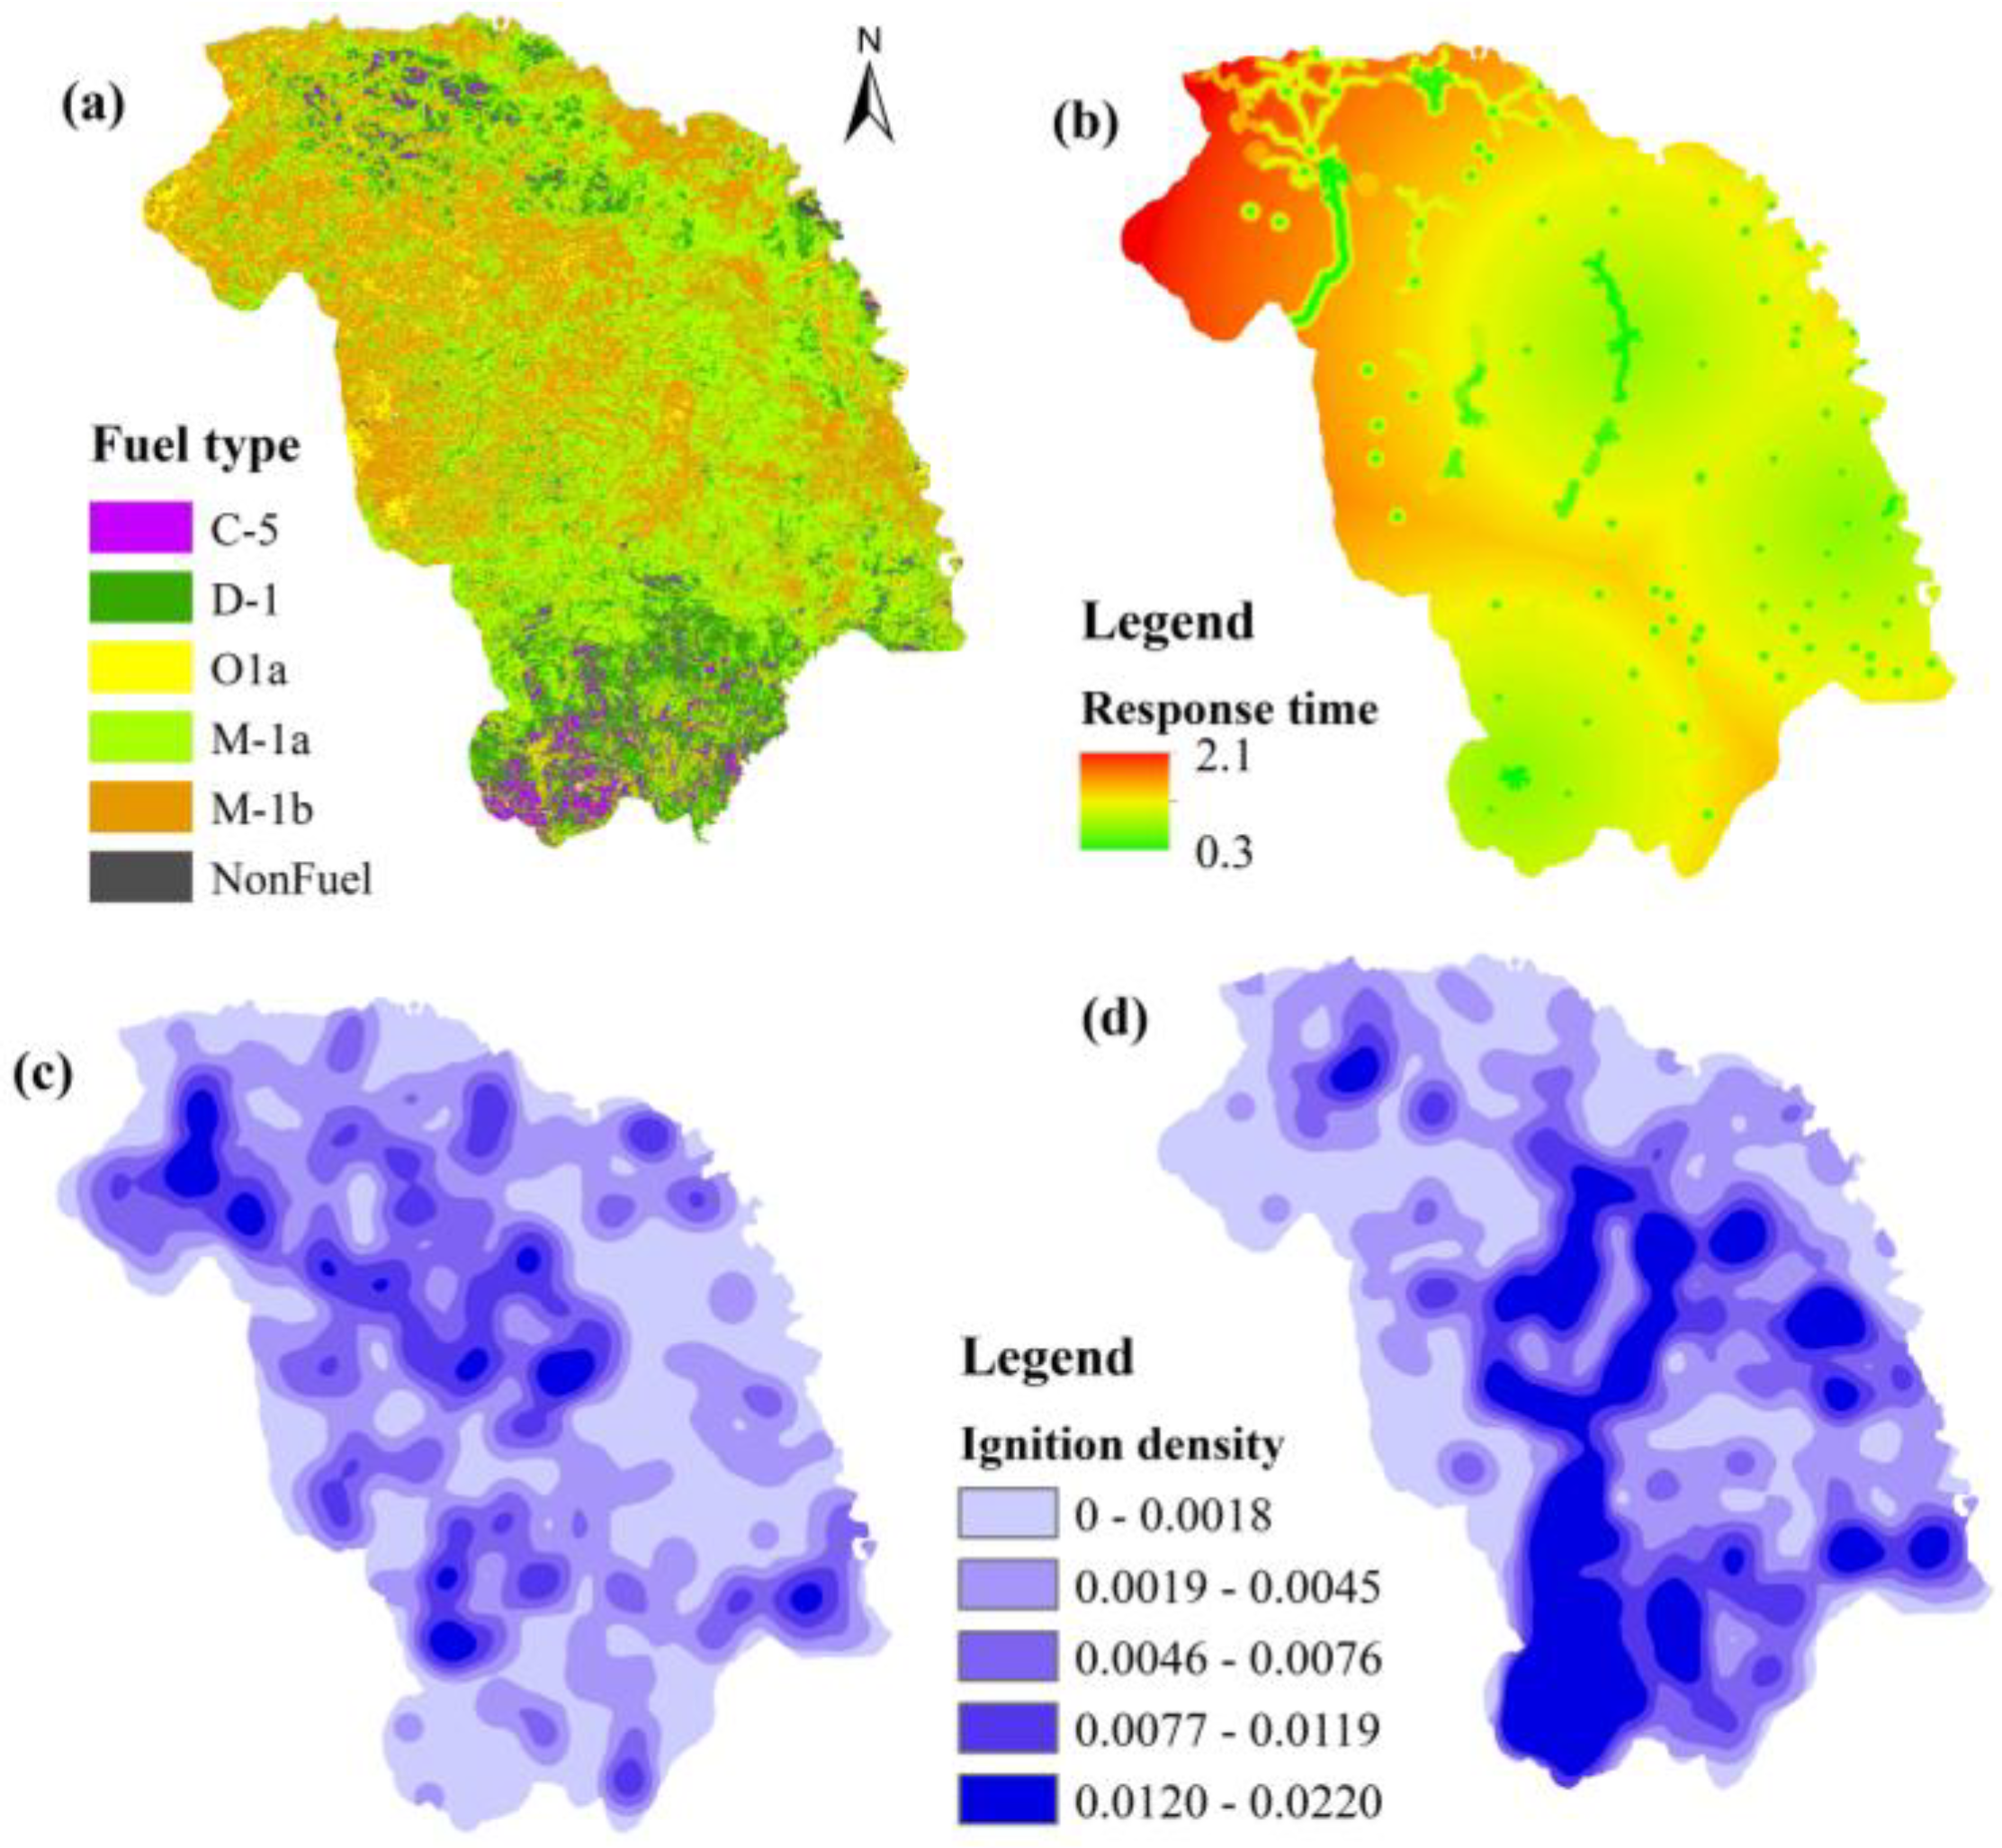
Figure 4.
Spatial data inputs for the burn probability (BP) model. (a) Fuel types; (b) response times (hours); (c) lightning fire density (ignitions per km2); and (d) human-caused fire density (ignitions per km2).
Figure 4.
Spatial data inputs for the burn probability (BP) model. (a) Fuel types; (b) response times (hours); (c) lightning fire density (ignitions per km2); and (d) human-caused fire density (ignitions per km2).

Figure 5.
Changes in average daily maximum temperature and precipitation during the fire season in the 2030s. (a) Average daily maximum temperature at baseline; (b) average daily maximum temperature in 2030s; (c) precipitation during the fire season at baseline; and (d) precipitation during the fire season in the 2030s.

Figure 6.
Fire weather index (FWI) changes in the 2030s. (a) FWI at baseline and (b) FWI in the 2030s.
Figure 6.
Fire weather index (FWI) changes in the 2030s. (a) FWI at baseline and (b) FWI in the 2030s.

Figure 7.
Fire numbers simulated for baseline (a) and the 2030s (b).


Figure 8.
Average number of fires predicted for the 2030s based on data from five global climate models (GCMs).
Figure 8.
Average number of fires predicted for the 2030s based on data from five global climate models (GCMs).

Figure 9.
Simulated burned areas for each year in the baseline period.

Figure 10.
Comparison of simulated burned areas and historical statistics during 1991–2010.

Figure 11.
Simulated potential burned areas during 2021–2050.

Figure 12.
Frequency of fires with different sizes under the four climate scenarios in the 2030s.

Figure 13.
BP simulation results based on five climate models under four climate scenarios for the 2030s. (a1-5) are simulated BP maps based on the Gfd, Had, Ips, Nor, and Mir model outputs in the baseline period, and (a6) is the average of the five models; (b1-5) are simulated BP maps based on the Gfd, Had, Ips, Nor, and Mir model outputs for the 2030s under the RCP2.6 scenario, and (b6) is the average of the five models; (c1-5) are simulated BP maps based on the Gfd, Had, Ipsnf, Nor, and Mir model outputs for the 2030s under the RCP4.5 scenario, and (c6) is the average of the five models; (d1-6) are simulated BP maps based on the Gfd, Had, Ips, Nor, and Mir model outputs for the 2030s under the RCP6.0 scenario; (d6) is the average of the five models; (e1-6) are simulated BP maps based on the Gfd, Had, Ips, Nor, and Mir model outputs for the 2030s under the RCP8.5 scenario; and (e6) is the average of the five models.

© 2019 by the authors. Licensee MDPI, Basel, Switzerland. This article is an open access article distributed under the terms and conditions of the Creative Commons Attribution (CC BY) license (http://creativecommons.org/licenses/by/4.0/).
Share and Cite
MDPI and ACS Style
Tian, X.; Cui, W.; Shu, L.; Zong, X. Effects of Climate Change on Burn Probability of Forests in Daxing’anling. Forests 2019, 10, 611. https://0-doi-org.brum.beds.ac.uk/10.3390/f10080611
AMA Style
Tian X, Cui W, Shu L, Zong X. Effects of Climate Change on Burn Probability of Forests in Daxing’anling. Forests. 2019; 10(8):611. https://0-doi-org.brum.beds.ac.uk/10.3390/f10080611
Chicago/Turabian StyleTian, Xiaorui, Wenbin Cui, Lifu Shu, and Xuezheng Zong. 2019. "Effects of Climate Change on Burn Probability of Forests in Daxing’anling" Forests 10, no. 8: 611. https://0-doi-org.brum.beds.ac.uk/10.3390/f10080611
Note that from the first issue of 2016, this journal uses article numbers instead of page numbers. See further details here.