Article

Spatial Pattern of Climate Change Effects on Lithuanian Forestry

by
Gintautas Mozgeris
1,*,
Vilis Brukas
2,
Nerijus Pivoriūnas
1,
Gintautas Činga
1,
Ekaterina Makrickienė
1,
Steigvilė Byčenkienė
3,
Vitas Marozas
1,
Marius Mikalajūnas
1,
Vadimas Dudoitis
3,
Vidmantas Ulevičius
3 and
Algirdas Augustaitis
1
1
Agriculture Academy, Vytautas Magnus University, Studentų Str. 11, Akademija LT-53361, Kaunas dstr., Lithuania
2
Southern Swedish Forest Research Centre, Swedish University of Agricultural Sciences, Sundsvägen 3, Alnarp SE-23053, Sweden
3
Center for Physical Sciences and Technology, Saulėtekio ave. 3, Vilnius LT-10297, Lithuania
*
Author to whom correspondence should be addressed.
Submission received: 16 July 2019 / Accepted: 15 September 2019 / Published: 17 September 2019

Abstract

:
Research Highlights: Validating modelling approach which combines global framework conditions in the form of climate and policy scenarios with the use of forest decision support system to assess climate change impacts on the sustainability of forest management. Background and Objectives: Forests and forestry have been confirmed to be sensitive to climate. On the other hand, human efforts to mitigate climate change influence forests and forest management. To facilitate the evaluation of future sustainability of forest management, decision support systems are applied. Our aims are to: (1) Adopt and validate decision support tool to incorporate climate change and its mitigation impacts on forest growth, global timber demands and prices for simulating future trends of forest ecosystem services in Lithuania, (2) determine the magnitude and spatial patterns of climate change effects on Lithuanian forests and forest management in the future, supposing that current forestry practices are continued. Materials and Methods: Upgraded version of Lithuanian forestry simulator Kupolis was used to model the development of all forests in the country until 2120 under management conditions of three climate change scenarios. Selected stand-level forest and forest management characteristics were aggregated to the level of regional branches of the State Forest Enterprise and analyzed for the spatial and temporal patterns of climate change effects. Results: Increased forest growth under a warmer future climate resulted in larger tree dimensions, volumes of growing stock, naturally dying trees, harvested assortments, and also higher profits from forestry activities. Negative impacts were detected for the share of broadleaved tree species in the standing volume and the tree species diversity. Climate change effects resulted in spatially clustered patterns—increasing stand productivity, and amounts of harvested timber were concentrated in the regions with dominating coniferous species, while the same areas were exposed to negative dynamics of biodiversity-related forest attributes. Current forest characteristics explained 70% or more of the variance of climate change effects on key forest and forest management attributes. Conclusions: Using forest decision support systems, climate change scenarios and considering the balance of delivered ecosystem services is suggested as a methodological framework for validating forest management alternatives aiming for more adaptiveness in Lithuanian forestry.

Graphical Abstract

1. Introduction

The sensitivity of forests and forestry to climate change has been widely reported [1,2]. With nitrogen deposition, increased temperature, and changes in the growing season and CO2 concentrations as the main factors shaping the impact [3,4,5,6,7,8], the response of forests has been found to be dependent on the geographic region [2,9,10]. For hemi-boreal forests in the northeastern part of Europe, positive effects on forest growth and wood production have been reported [2,11]. More specifically, for Lithuania, the increase in air temperature, precipitation amount, and nitrogen deposition during the vegetative period, and reductions in air SO2, surface ozone concentrations, and sulphur and heavy metals deposition since the late 1970s have been associated with the rapid increase in the growth-intensity of Norway spruce, moderate increase in the growth-intensity of Scots pine, and minimal growth increase of birch species [12,13,14,15,16]. Increasing disturbance risks may have adverse effects [2,17,18]. Extreme climatic conditions [19] and increases in drought stress, due to ongoing climatic changes [20] ultimately result in tree death.
Climate change challenges are often important drivers of social readjustments and innovation. Following the Paris Agreement [21], the European Union (EU) has committed to a 40% domestic reduction in greenhouse-gas emissions compared to 1990 levels by 2030, 25% of which is expected to come from land-use change and forestry [22]. Despite doubts about whether such efforts may have an influence on climate change mitigation [23], they will influence and already have influenced forest management decisions, and, thus, forests and forestry [24]. Forest management has long aimed for a sustainable yield of wood; however, the concept of sustainable forest management has been adjusted to also include ecological and social sustainability requirements [25]. Economic, ecological, and social values of nature are covered by the concept of ecosystem services, which are defined as the benefits that humans obtain from ecosystems [26]. Therefore, we are presented with the questions: To what extent is the sustainable provision of ecosystem services sensitive to forest management, and to what extent does climate change influence the trends and compatibility of different ecosystem services?
Majority of aforementioned studies on climate change impacts on forests and forestry are based on exploring past data; However, to make a forest management decision today, one needs to reduce the uncertainty on the subsequences in the future. To describe the future trends of forest resource development, we use a forest decision support system. The early forest decision support systems were used to facilitate the evaluation of future woody biomass availability and potential timber resources to support policy measures aimed for sustainable timber supply; however, later there are numerous examples available of the successful decision support system application to modeling future trends of other forest ecosystem services, balancing wood production with other forest functions [27,28,29,30,31,32]. After the ratification of the Kyoto Protocol, forest monitoring and resource projections became an important field of forest decision support systems application [33]. The more recent task for decision support systems became dealing with climate change impacts [34,35]. Even though the majority of available decision support systems consider ecological and socioeconomic conditions, estimating the impacts of climate change on forest growth and forestry remains a challenging task [36].
Scenario projections are always related to uncertainties in input data, models, the compilation of models into the decision support system and the scenario assumptions made [37]. However, the number of uncertainties to deal with increases when considering climate change effects in modelling future development of forest and forestry. To account for climate change effects, the long-term projections need to be involved, which necessarily increases the uncertainty. The sources of uncertainty are related to climate change models (temperature, precipitation, abiotic and biotic disturbances), characterization of forest response to changed growing conditions (input-output data, growth, resistance, mortality, tree species suitability, regeneration), expectations of society and behavior of forest managers, including the efforts to mitigate climate change (policies, demand and prices of forest products), methodological aspects and knowledge gaps to put all these aspects together [31,37,38,39,40]. Many of those challenges are related to the difficulties in modelling stochastic events [37], and the need to use spatially-explicit data at different geographic scales [36]. Nevertheless, many of currently available decision support systems include functionality which may to some extent simulate climate change impacts on forest and forestry. For instance, seven out of nine European decision support systems used in H2020 project ALTERFOR currently contain features addressing the effects of climate change [36]. Usually, climate change projection data are used to affect the stand growth by tree species—this refers to Remsoft Woodstock used in Ireland, InVEST and VALE (Italy), EFISCEN-space (the Netherlands), Heureka and HoldSim (Sweden) and partly to SADfLOR (Portugal). Two decision support systems consider single tree growth potential—SILVA (Germany) and Sibyla (Slovakia). Even though the mentioned decision support systems were found to be suitable as support for forest policies, the need for more data and models is usually reported when attempting to estimate the impacts of climate change on biomass production and other forest ecosystem services [36]. Instead of aiming for unattainable optima, the ALTERFOR project suggests, that ideally the decision support system should be capable of modelling climate change in terms of its impact on tree growth, tree mortality and tree species suitability and under different global climate change and market scenarios and taking forest owner behavior into account [36].
Potential timber supply in the future has been questioned in several national-level studies in Lithuania, like the assessment of Lithuanian forest growing stock potential and its usage applying the simulator Kupolis at the whole country [41] and state forest enterprise [42,43] levels. The potential effects of increased domestic wood use on employment, the economic performance of national forestry, and carbon sequestration were analyzed using the European Forest Information Scenario Model (EFISCEN) [44]. Forest biomass potential for Lithuania’s energy pathways was discussed using the Landscape simulation and Ecological Assessment tool and the modeling framework for medium- to long-term energy system planning, energy policy analysis, and scenario development (MESSAGE) [45]. To the best of our knowledge, the national decision support system-driven studies did not consider the effects of climate change on forest growth and forestry.
There are two objectives of the study described in this paper. First, we validate decision support system-driven solution to include global climate change, timber demand and price scenarios in simulating future trends of forest ecosystem services as a support for forest policies at the local level. We demonstrate how forest decision support system without inbuilt climate models, i.e., the Lithuanian simulator Kupolis [36], may be adopted for the modeling of climate change effects on growth rates. The solution is based on adjusting the growth functions and forest regeneration characteristics by the user. The second objective is to determine the effects of climate change on Lithuanian forests and forestry, and its sustainability in terms of the deliveries of some ecosystem services in the future, assuming that current forest management practices are continued. More specifically, we aimed to map the factors that shape forestry in the country, and its regions under changing management conditions, questioning whether there are any geographic patterns of climate change effects in a small country like Lithuania. We elaborate on the importance of considering the spatial dynamics of climate change, as having a strong impact on potential forest management decisions and one of the pre-conditions for more adaptive forest management.

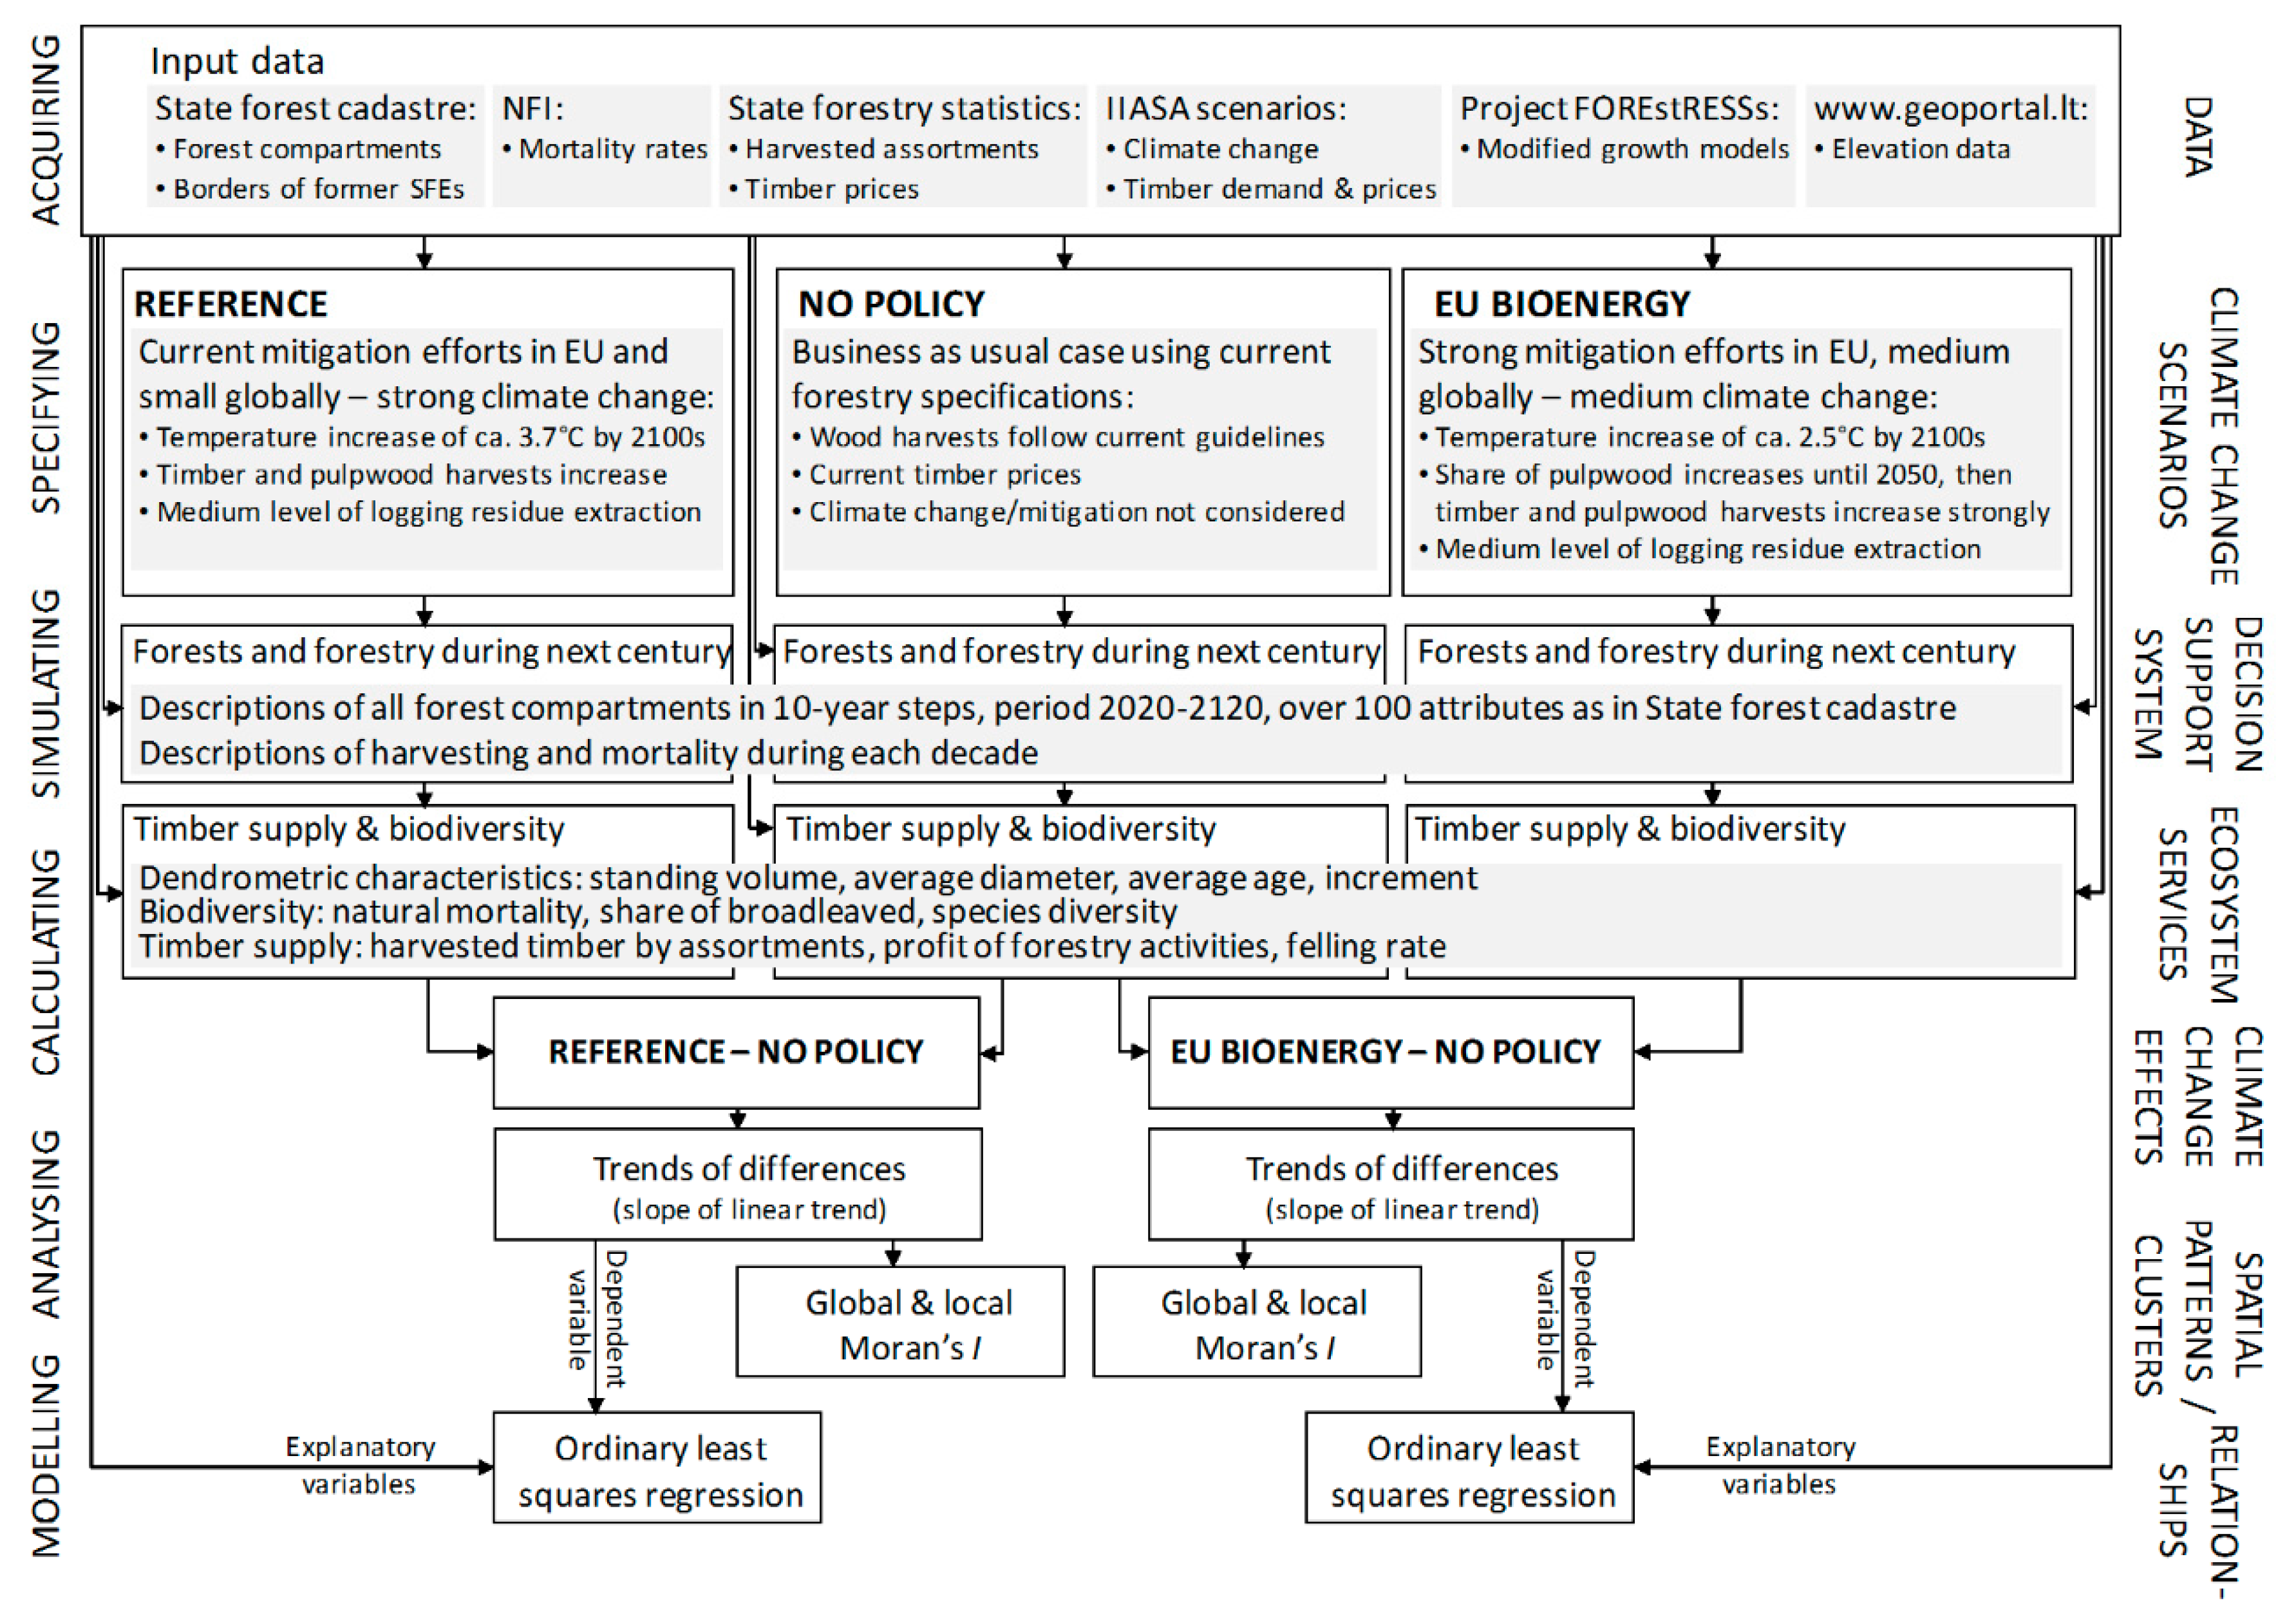
2. Materials and Methods

The analytical steps of our study include:
(1)
Specifying alternative future scenarios, considering human efforts to mitigate climate change and, therefore, different forest growth, timber demand, and price trends;
(2)
Modeling forest resource development and forest use under alternative future scenarios and assuming that current forest management practices are continued;
(3)
Quantifying selected ecosystem services and analyzing their spatial and temporal development at the regional branch level of the State forest enterprise. The focus has been on timber supply and biodiversity-related ecosystem services;
(4)
Examining the mechanisms of climate change effects on Lithuanian forests and forestry;
(5)
Discussing how decision support systems may contribute to more adaptive forest management.
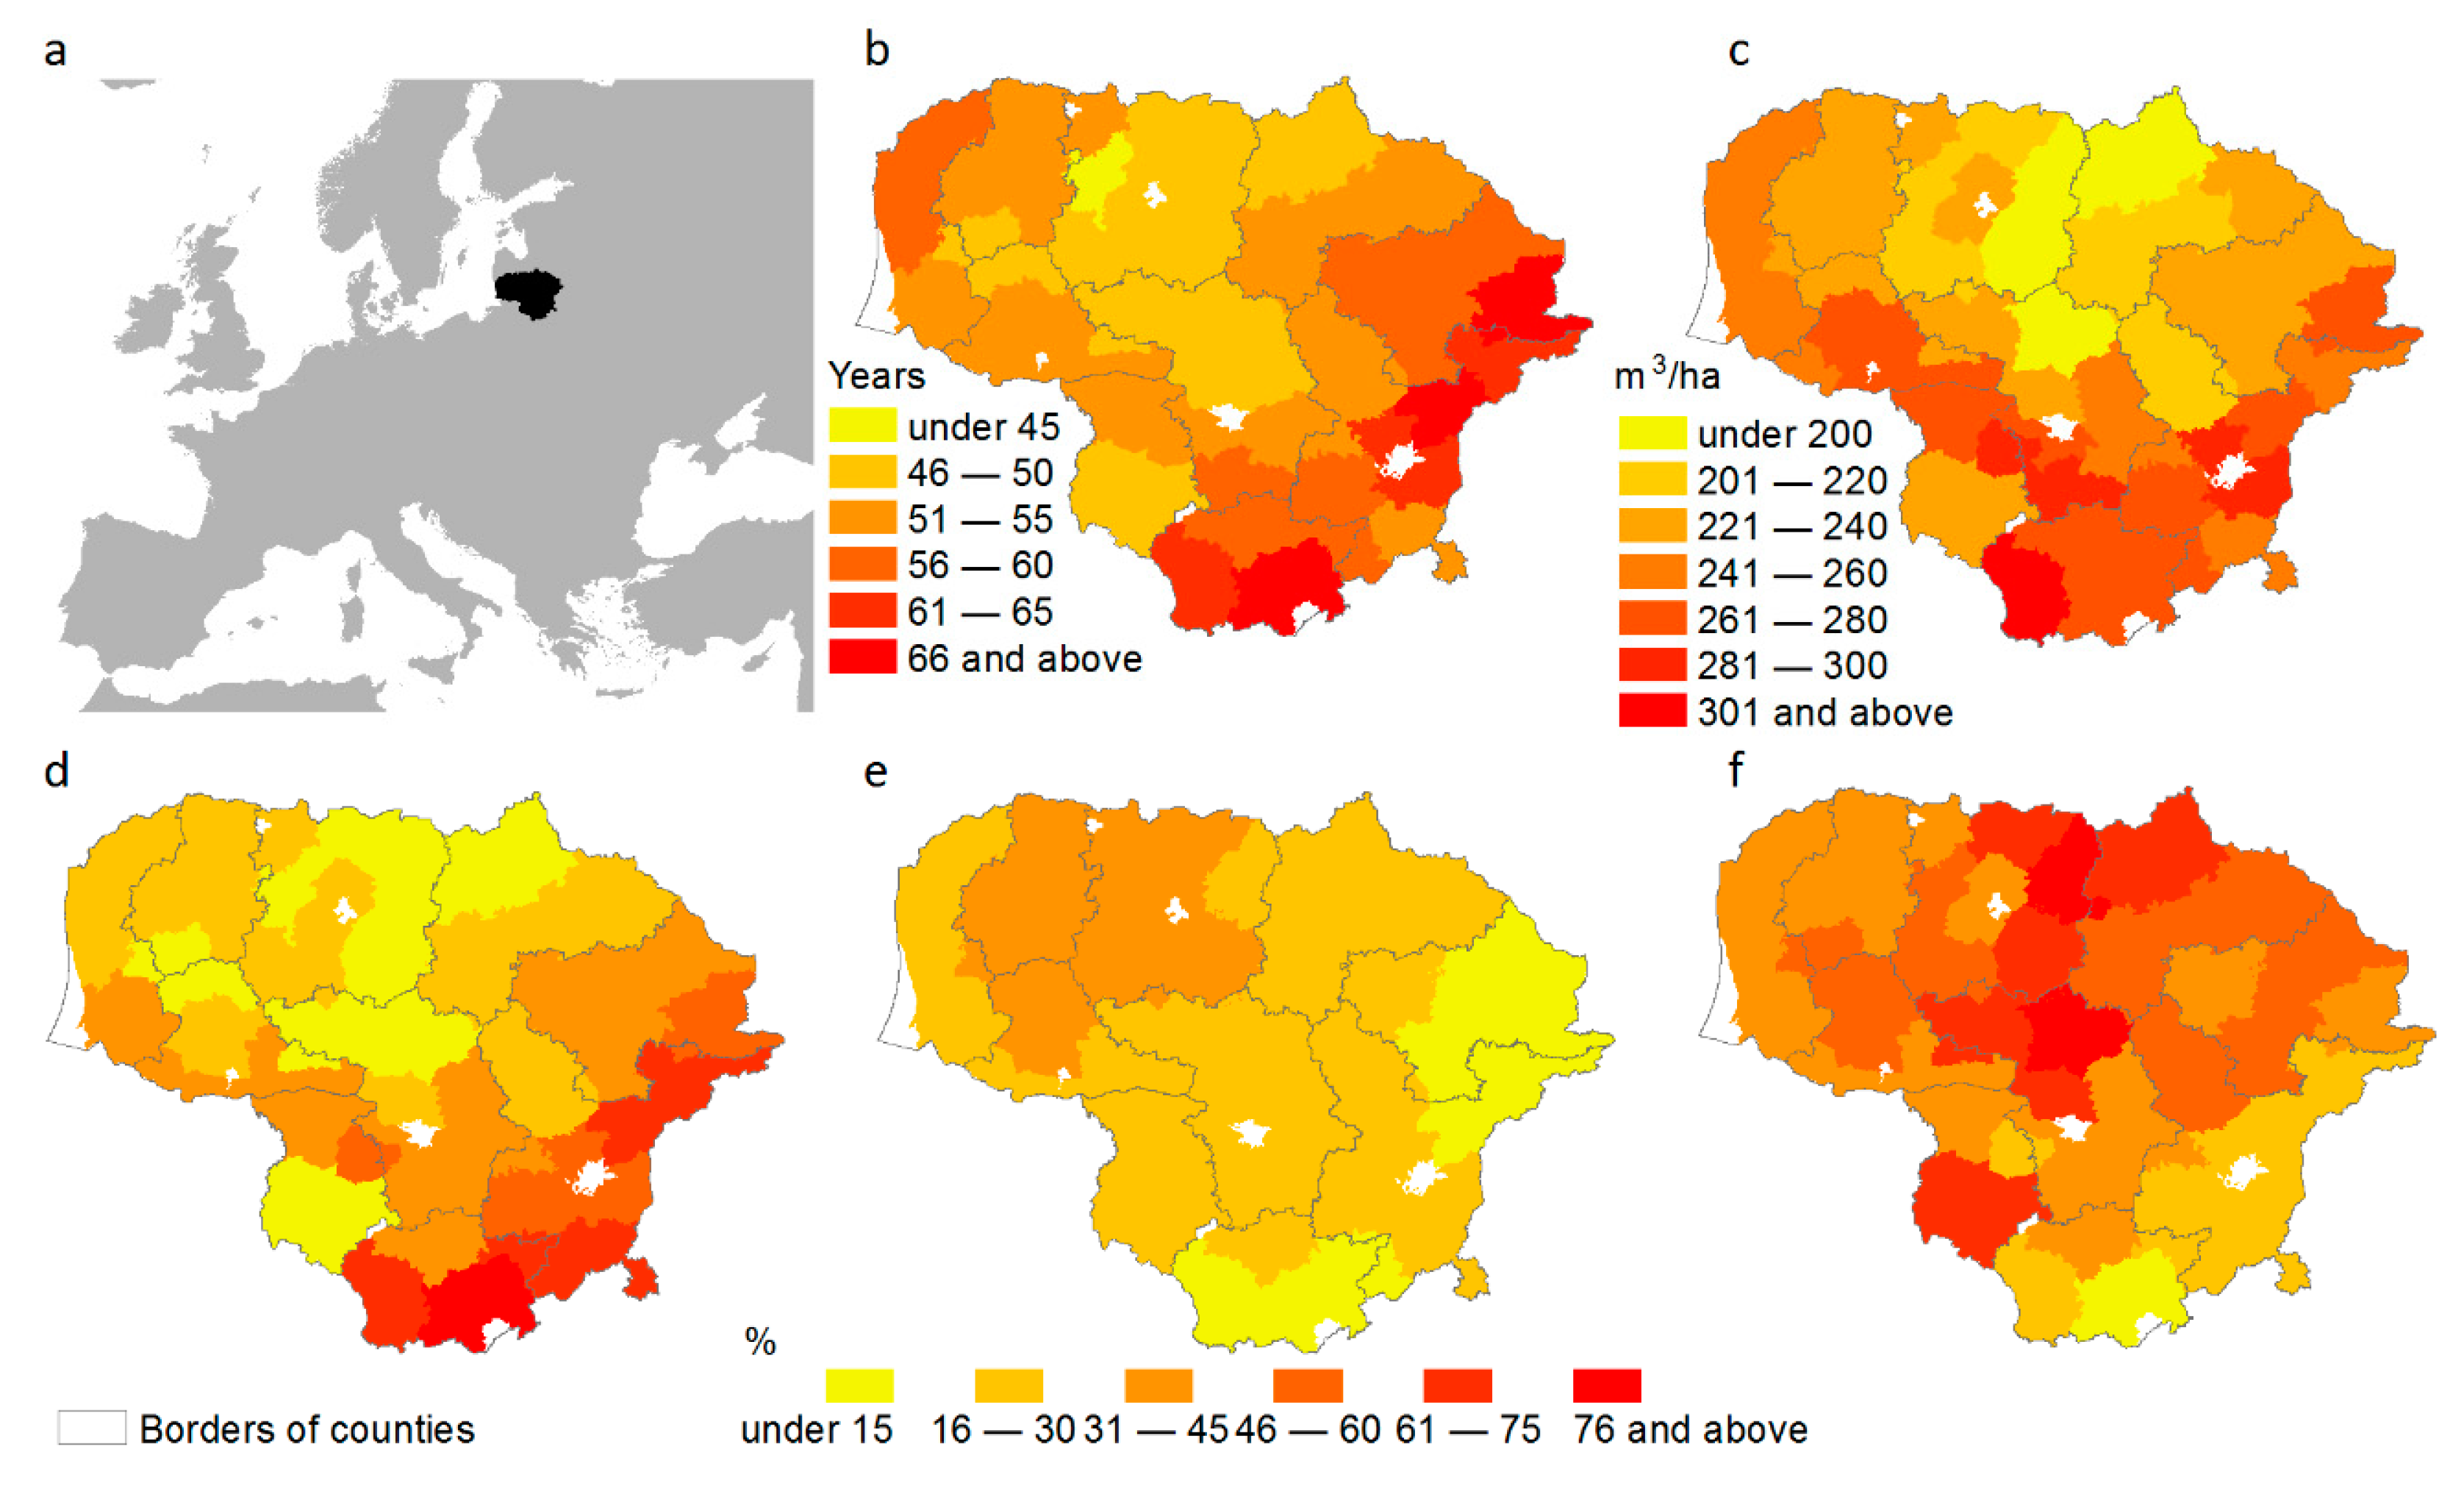
Even though all steps contribute to validating the use of forest decision support system to assess climate change impacts on the sustainability of forest management, the steps from (1) to (3) refer more to Objective 1 of current study, while the steps from (3) to (5) primarily contribute to Objective 2.

2.1. Study Area

Our study covers all forests of Lithuania—a country situated in Central Europe with a total land area of 65,200 km2 and central coordinates of 55°10′ N, 23°39′ E (Figure 1a). Lithuanian forests are categorized as the European hemi-boreal mixed broadleaved-coniferous forest type in the transitional zone between the boreal coniferous and the nemoral broadleaved forests [46,47,48]. Forests cover 33.5% of the country’s area, of which 50% are owned by the state, 40% are owned by private forest owners, and the remaining 10% are reserved for restitution, meaning they are currently practically without active forest management [49]. Scots pine dominates in the southeast, Norway spruce in the west, and deciduous tree species in the north-central parts of the country (Figure 1d–f). The average growing stock volume in all forests was 256 m3/ha (260 m3/ha in the state and 253 m3/ha in other forests), and the average age was 54 years (57 years in the state and 51 years in other forests) based on the Lithuanian Statistical Yearbook of Forestry 2018 [49].

2.2. Climate Change and Market Scenarios

We used scenarios developed by the International Institute for Applied Systems Analysis (IIASA) for the project ALTERFOR [51]. The scenarios differentiate between different climate mitigation efforts and the resulting climate change on a global scale, linked to different trends in timber demand and prices. Scenarios consider the policy targets for the EU [52], combined with the Representative Concentration Pathways and Shared Socioeconomic Pathways developed for the International Panel for Climate Change [53]. The scenarios used in this study are:
(1)
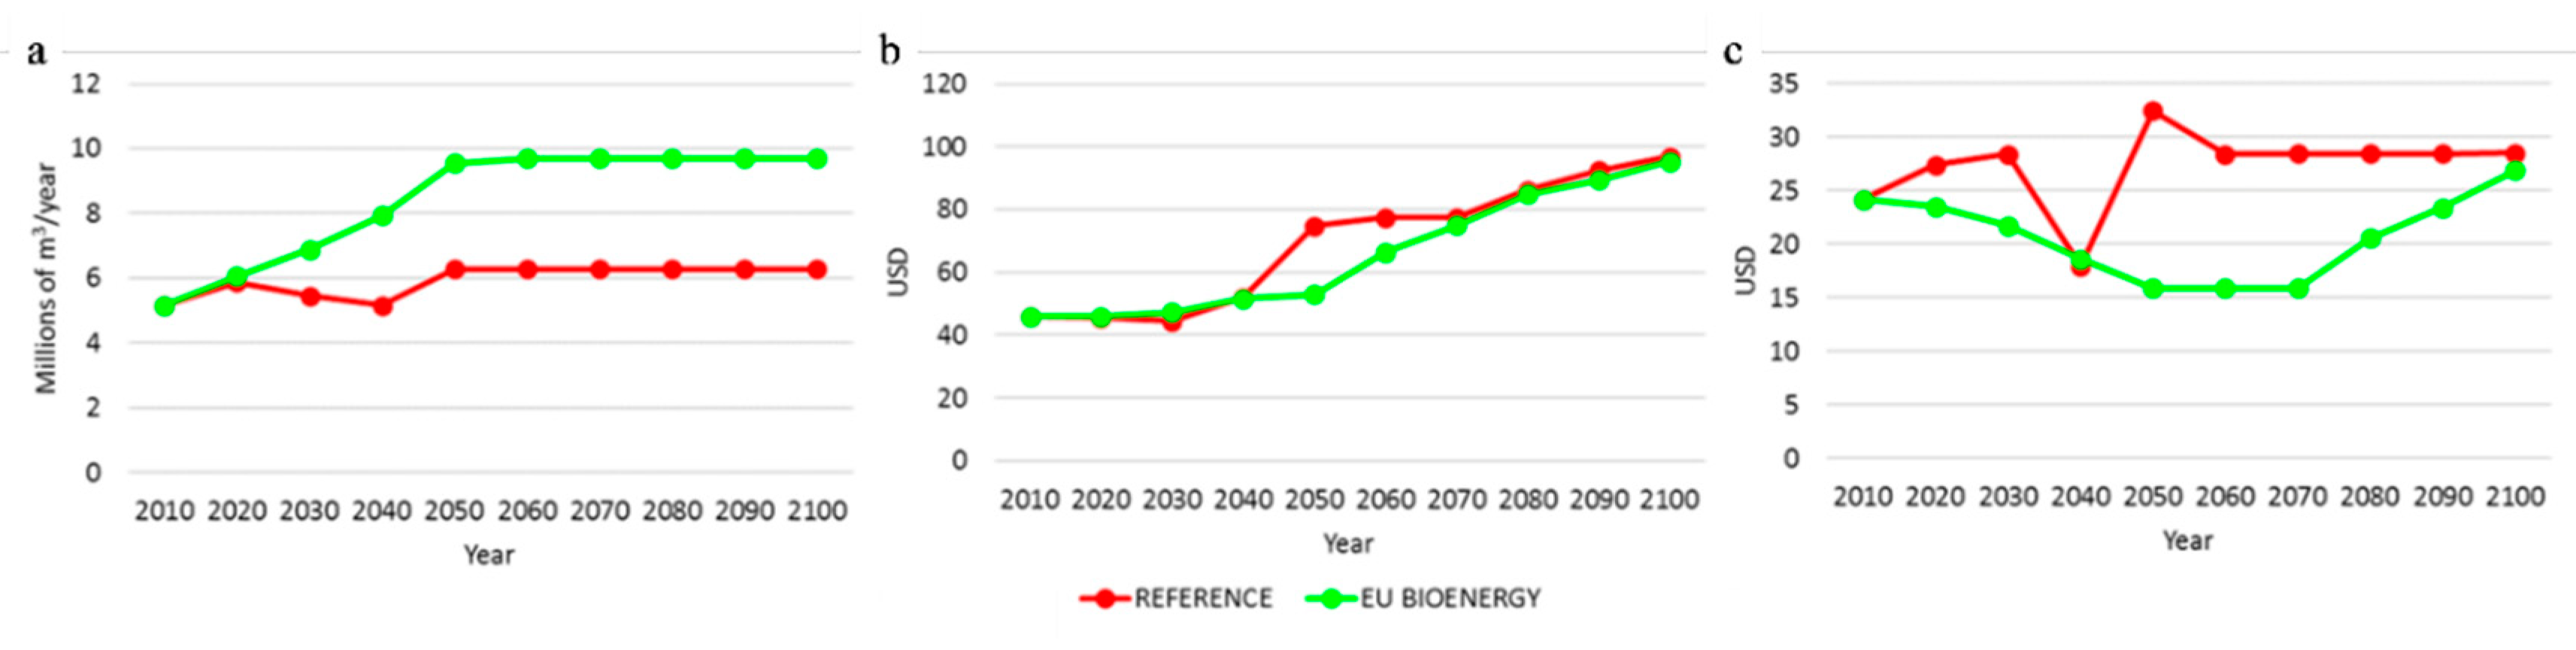
REFERENCE—a continuation of the current development in the EU and only small efforts globally, followed by strong climate change (temperature increase of ca. 3.7 °C by 2100 compared to pre-industrial values). Both timber and pulpwood harvests are expected to increase, with relatively unchanged proportions, and a medium level of logging residue extraction;
(2)
EU BIOENERGY—strong EU policies and medium policies in the rest of the world, potentially resulting in medium climate change (temperature increase of ca. 2.5 °C by 2100 compared to pre-industrial values). The share of pulpwood increases until 2050, but thereafter, both timber and pulpwood harvests increase strongly. The logging residue extraction remains at a medium level;
(3)
NO POLICY—wood harvests are expected to follow the current national guidelines and impacts from climate change, or its mitigation policies are not considered, including the impact on timber demand and prices.
Land uses are expected to remain unchanged under all scenarios. The dynamics of timber demand and prices are represented in Figure 2. The scenarios do not consider the development of disturbing factors, such as wind storms, attacks of pests, diseases, etc.

2.3. Modeling of Forest Resource Development under Changing Climate Conditions

Simulations were conducted for 2020–2120 in 10-year steps using the Kupolis simulator, which is a nationally developed decision support system for modeling forest resource development [37]. Kupolis simulates the development of forest and use of wood resources in a forest stand by modelling the growth of trees by tree species, accounting for natural versus artificial regeneration, natural mortality, thinnings, and salvage cuttings. The final harvest volumes for the coming decade are estimated at the management unit level, which in our case was the regional branch of state forest enterprise and distributed by stands of mature age [41]. Volumes of final harvesting are aimed for continuous and sustainable timber use, smoothing of age class structure, and balance between cutting volume and the increment. For this study, Kupolis was enhanced to enable modifications of forest growth parameters accounting for climate change in our scenarios. All other forestry principles (e.g., the choice of tree species in regeneration, thinning definitions, site productivity interpretation, harvesting regimes, etc.) remained unchanged. We made the following assumptions regarding forest growth under changing climate conditions. First, the average temperature was assumed to be about 0.8 °C cooler in the pre-industrial period than now. We assumed that the average temperature was ~0.3 °C cooler during 1960–1990 than was captured in the models currently used in Kupolis [54]. The average temperature was expected to grow linearly in the future until 2030 under all scenarios to hit the point of the IIASA REFERENCE scenario in 2100 (temperature increase of ca. 3.7 °C by 2100 compared to pre-industrial values). However, after 2030, the trajectory of temperature increase was changed for the EU BIOENERGY scenario to hit 2.5 °C by 2100. The same trajectories were followed later by adjusting the diameter, height, and stem volume increment, due to increased temperatures, following Augustaitis et al. [15]. On average, the stem volume increment was increased by 39% and 30% for spruce, 21% and 16% for pine, and 4% and 3% for deciduous tree species in 2120, assuming REFERENCE and EU BIOENERGY scenarios, respectively. Proportionally, mean diameters were adjusted by tree species. Therefore, climate change impacts were directly associated with changed growth by tree species, resulting in changes in tree dimensions and then leading to changed stand characteristics, volumes of mortality and cuttings. No temperature increase or forest growth adjustments were considered under the NO POLICY scenario.
For the simulations, we used data from stand-wise forest inventories conducted during the 2010s [50]. The total number of simulated compartments was 1,434,552 covering 2,034,488.9 ha. The simulated forest management units amounted to 42, matching the number of state forest enterprises before the reform in 2018. Areas with dominating urban forests and strict nature reserves were removed from the analysis. The number of compartments ranged from 12,076 in the smallest forest management unit to 73,068 in the largest unit. No afforestation or deforestation was assumed. Forest management regime in Kupolis was defined, aiming to emulate current forest management practices in Lithuania [42,43]. As the starting point, we used the year 2020; thus, we modeled the development of forest resources from the date of forest inventory until 2020 using the IIASA scenario-specific considerations.

2.4. Assessed Attributes Describing Forests and Forestry

Kupolis simulates forest management at the stand level, with outputs containing detailed stand descriptions of all tree species remaining in forest and harvested during the simulation period. A set of attributes describing the development of Lithuanian forests and forestry was extracted from the simulated data, referring to each decade starting from 2020. The full list of assessed attributes is provided in Table A1. Forestry-related expenses used to estimate the costs of silvicultural activities are listed in Table A2.
To estimate the revenues from forestry activities, timber prices were differentiated depending on the IIASA scenario. As a starting point, the sawlog and pulpwood, as well as other round wood prices, were collected from the official statistics, referring to the year 2010. Then, the structures of the assortments were estimated for final and intermediate cutting separately, considering the average diameter of trees cut. Considering the shares of each assortment type in the total amount of harvested volume, the weighted average price for 1 m3 was estimated for major tree species (pine, spruce, oak, ash, birch, black alder, aspen, and grey alder). Then, the prices were adjusted for each decade assumed in IIASA scenarios, considering the changing ratio of sawlogs and pulpwood (Table A3). The profit was calculated as the difference between estimated revenues and silvicultural costs.

2.5. Mapping and Evaluating Climate Change Effects

To quantify the impact of climate change on specific forest attributes, we subtracted the value achieved in the NO POLICY scenario from the corresponding values of REFERENCE and EU BIOENERGY scenarios for each time point (i.e., 2020, 2030, …, 2120) or decade (i.e., 2020–2030, 2030–2040, …, 2110–2120) used in simulations. To detect the presence of a monotonic increasing or decreasing trend in the differences during the entire simulation period, we performed the nonparametric Mann–Kendall test and then estimated the slope of a linear trend with the nonparametric Sen’s method using the MAKESENS tools developed by the Finnish Meteorological Institute [55].
The slope was estimated and plotted on a map for all forest management units—management areas of the regional branch of the state forest enterprise. Global Moran’s I was used to assess the global spatial autocorrelation of the slope. Anselin Local Moran’s I enabled us to identify statistically significant hot spots, cold spots, and spatial outliers in the mapped slope values.
To better understand the mechanisms of climate change effects on forests and forestry, we searched for ordinary least square regression models that explain the variance of the slope parameter introduced above. We checked all possible combinations of the input candidate explanatory variables describing current forest conditions. Characteristics describing current forest conditions were used as the explanatory variables, including average age, height, dbh, standing volume, and volume of trees that die through natural mortality (m3/ha/year); average probability of mortality, due to competition, wind, and diseases; share of broadleaved tree species in the standing volume; proportion of the volume of pine, spruce, birch, black alder, aspen, and grey alder; average soil fertility and humidity grade, based on soil typology and the average site index used in Lithuanian forest inventories [56]; and minimum, maximum, mean, and standard deviation values of elevation (based on GDR250LT—geo-referential spatial data set at scale 1:250,000 of the territory of the Republic of Lithuania (www.geoportal.lt)). The number of explanatory variables ranged from two to five. The following conditions were used to consider the model as passing: Only those explanatory variables whose coefficients were statistically significant at the 95% confidence level and whose variance inflation factor was under 7.5 were used to avoid multicollinearity; the minimum acceptable Jarque Bera p-value was 0.1 to test whether the model residuals were normally distributed; and, finally, model residuals were tested for spatial clustering using Global Moran’s I (maximum value allowed 0.1) for the cases that passed all the above search criteria. Geographic information system (GIS) processing and exploratory regression investigations were conducted using ArcGIS v10.6 (Esri Inc., Redlands, CA, USA).
The overall structure of our study is summarized in Figure 3.

3. Results

The results are presented in three sections. First, we demonstrate our approach to incorporate climate change and its mitigation impacts on forest growth, global timber demands and prices for simulating future trends of forest ecosystem services. The overall figures on forest resource development and timber harvesting until 2120 are introduced in Section 3.1. In Section 3.2, we investigate the temporal trends and spatial patterns of climate change effects on Lithuanian forests and forestry. Finally, in Section 3.3, we analyze the factors influencing the shape and magnitude of some climate change effects on forest resources and the delivery of selected ecosystem services.

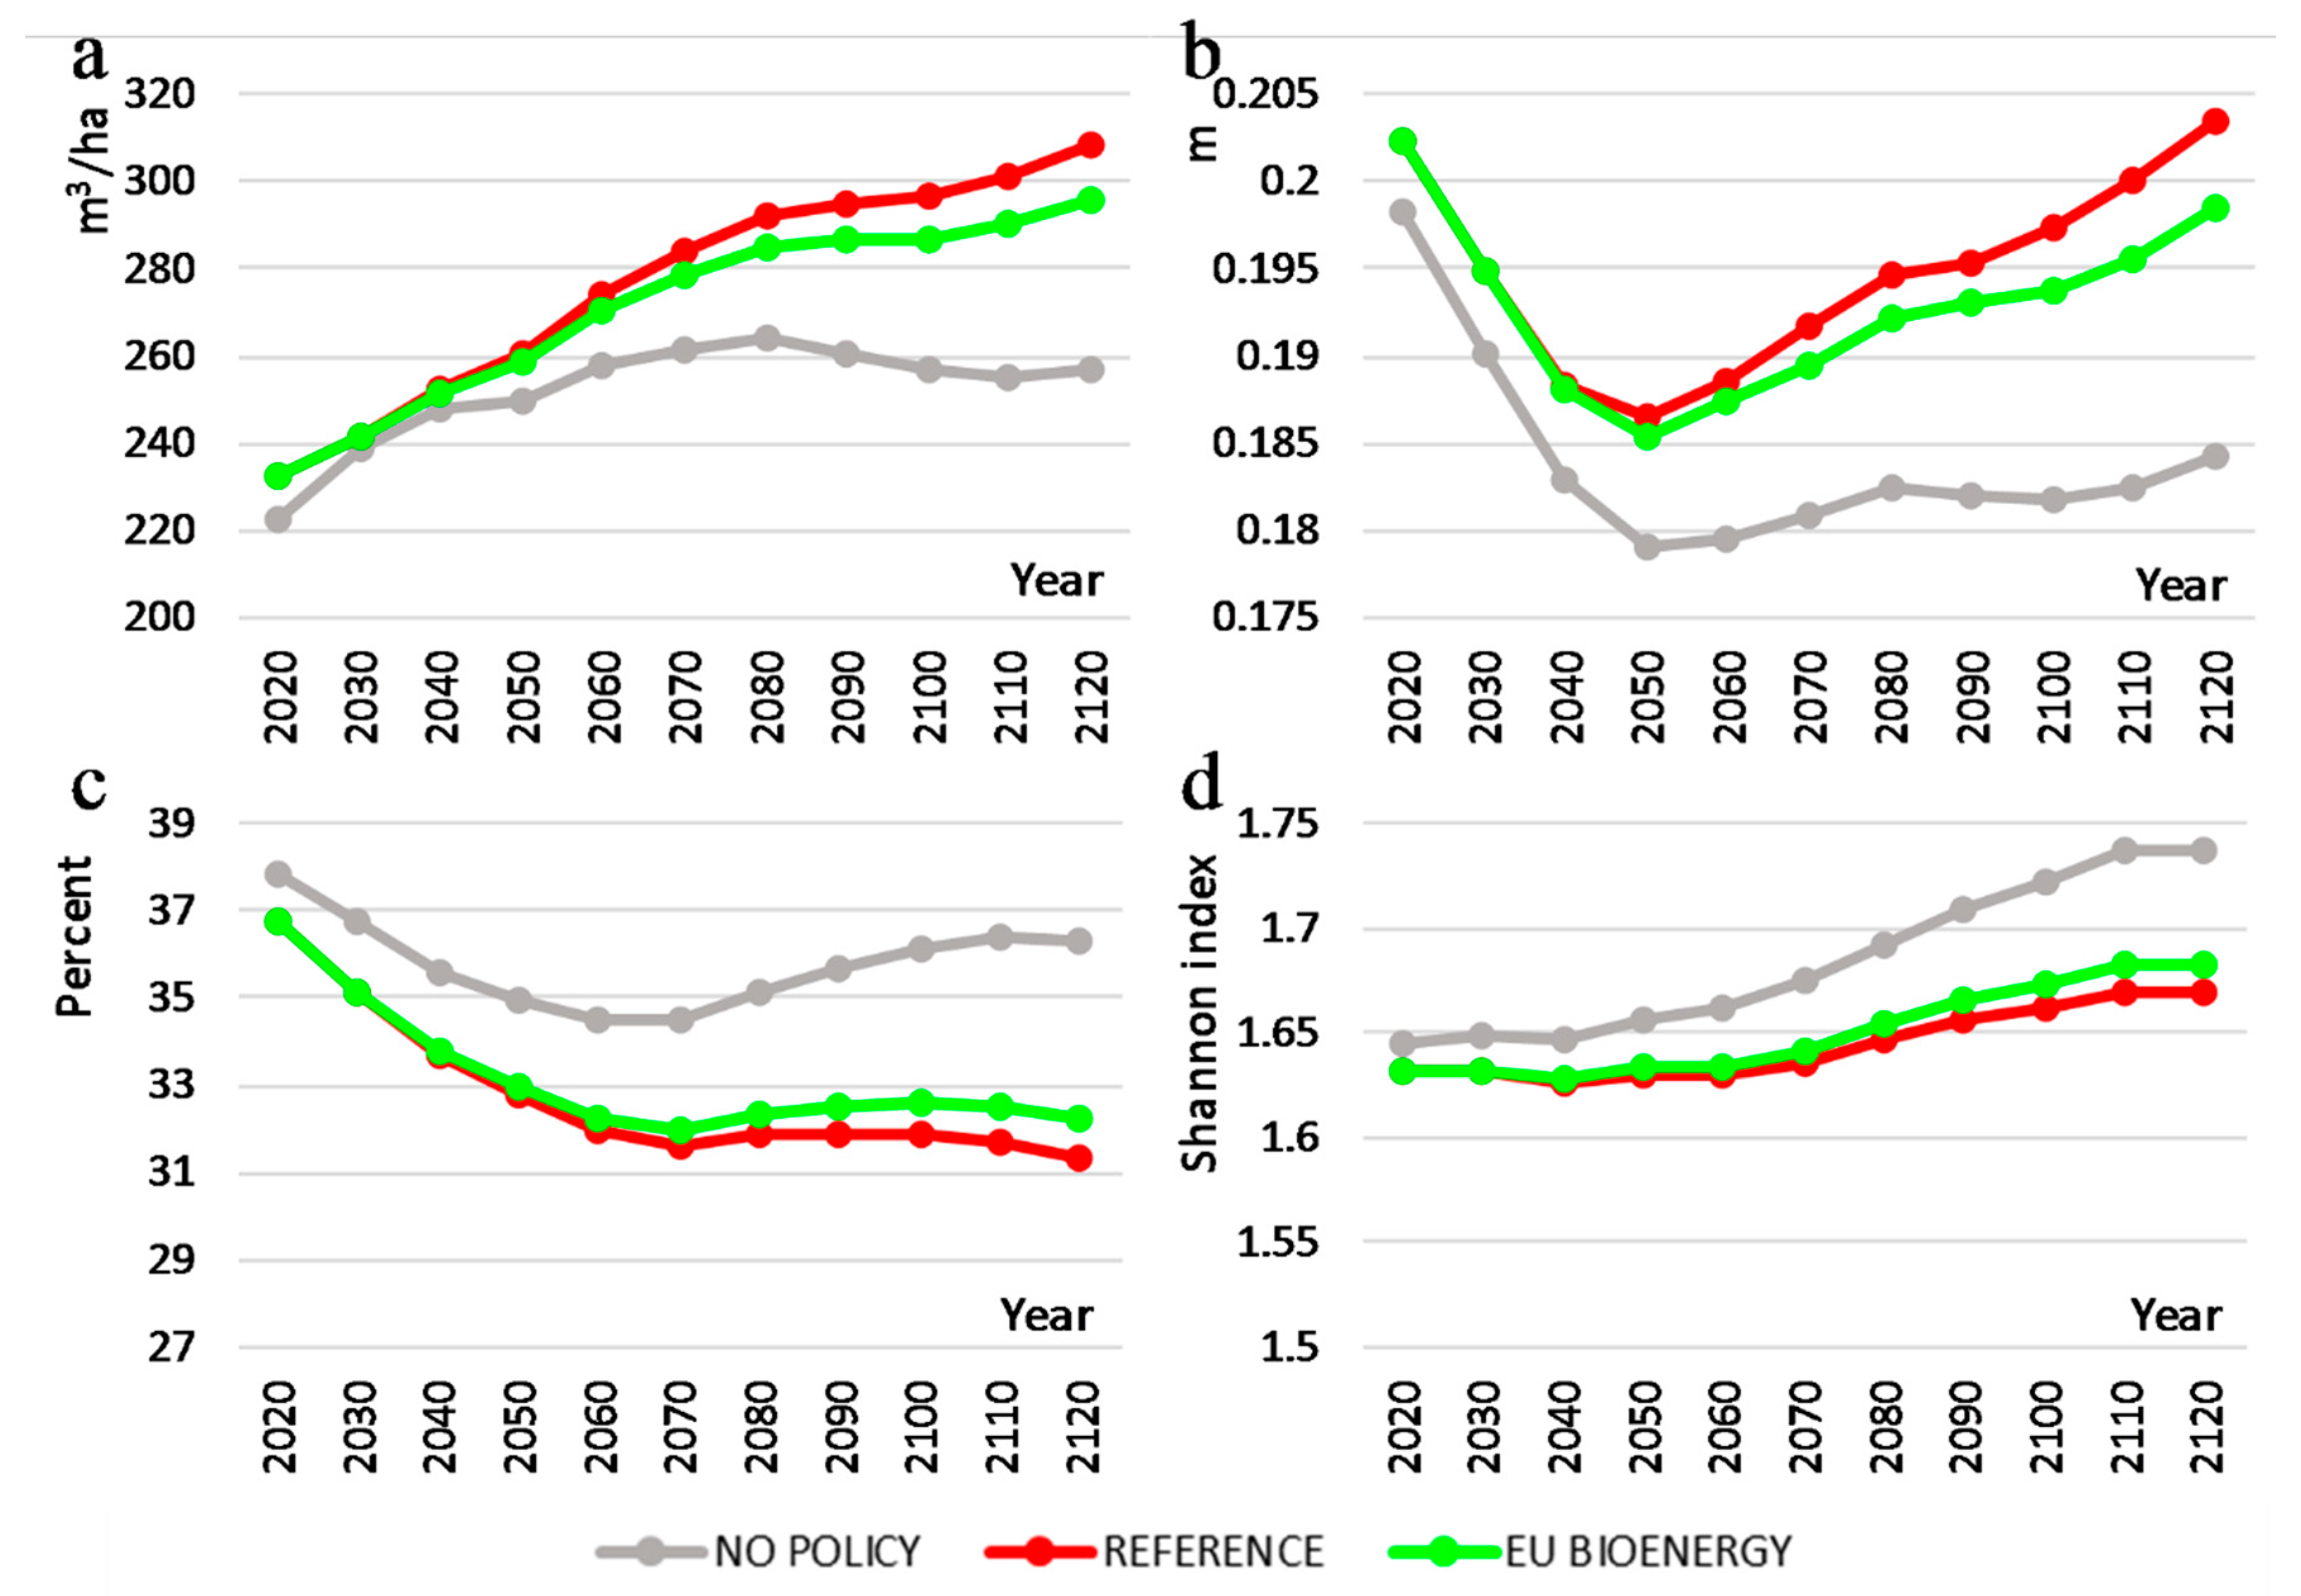
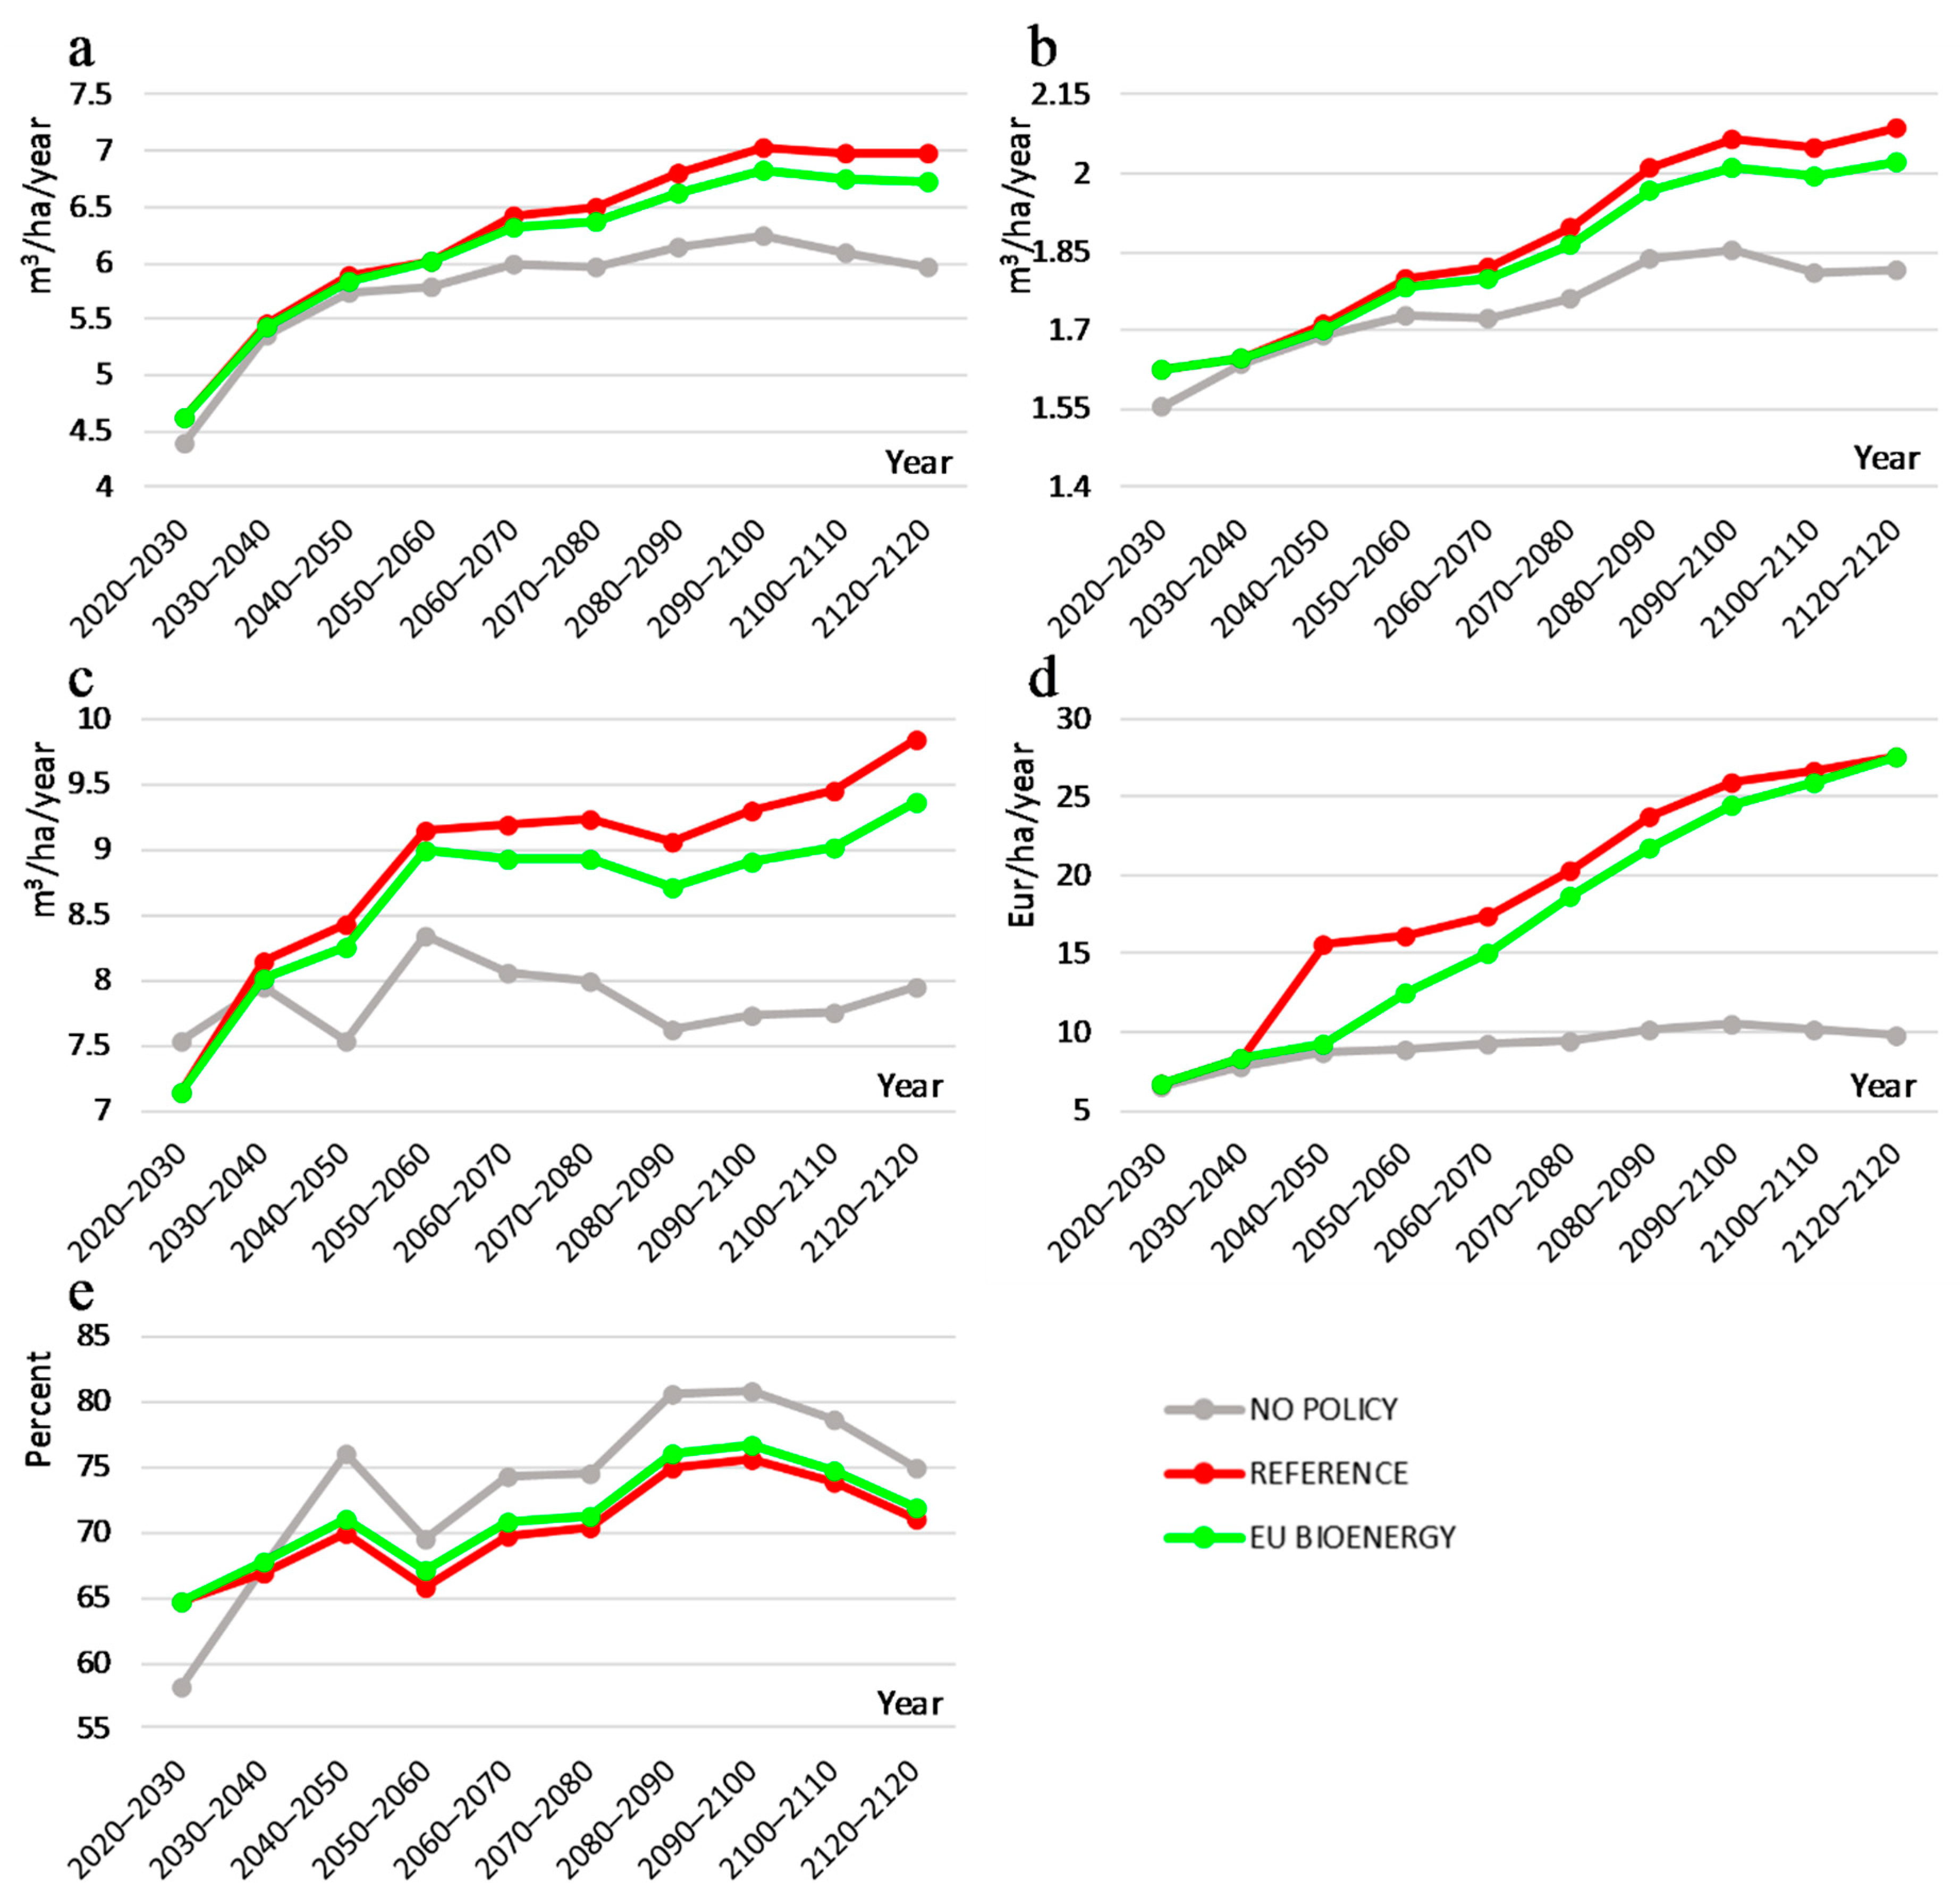
3.1. Development of Forest Resources and Forestry in Lithuania during the Next Century

The majority of attributes describing forests and forestry are expected to increase or remain at similar levels in Lithuania during the coming century (Figure 4 and Figure 5, more detailed results are introduced in Table S1). However, trajectories of many attributes change in the middle of the 21st century. The trends under scenarios that consider climate change effects are usually more different from the NO POLICY case than each other.
More specifically, standing volume in 1 ha is expected to increase during the whole simulation period; however, it stabilizes and even decreases for the NO POLICY scenario, i.e., if the potentially increasing yields, due to warmer temperatures are not considered (Figure 4a). The average diameter of all stands seems to be decreasing until ~2050 (Figure 4b) and stabilizes afterwards for the NO POLICY case or slightly increases for the other two scenarios, due to the adjusted diameter increase used in simulations. The relative share of broadleaved tree species in the standing volume (Figure 4c), as one of the proxies for biodiversity, is expected to decrease by the midpoint of the simulation period before it stabilizes or even increases. Tree species diversity is expected to increase during the whole simulation period, with less steep trends if climate change effects are included in the simulations (Figure 4d). Average age remains rather stable (52.5–54.5 years) during the whole simulation interval with some drop-down around the year 2050 (Table S1). No climate change effects were assumed on the age of stands, because of specifics of current forest management practices applied in Lithuania and of the Kupolis simulator.
Current forest management, if continued during the next century, is expected to deliver increasing harvested timber volumes. They get stable or even declining towards the end of the simulation period (Figure 5a). A common feature for the amounts of harvested timber is the potential volume increase, due to climate change, regardless of human mitigation efforts. Annual natural mortality is simulated to increase, due to the death of trees of larger dimensions (Figure 5b). The annual wood volume increment, if not adjusted for the yield increase, due to climate change, remains rather stable during the whole simulation period (Figure 5c). A sudden drop-down at 2050 is observed, which is explained by the vast mature pine forests planted after WWII changing into young stands.
If climate change effects are considered, the annual wood volume increment increase is steeper during the first half of the simulation period, despite the larger yields expected later, due to higher temperatures assumed in REFERENCE and EU BIONERGY scenarios. The NO POLICY scenario suggests relatively small, but slightly increasing profits during the whole simulation period (Figure 5d). However, if climate change effects are included in the simulation, profits from forestry activities are expected to increase rapidly during the whole simulation period, suggesting, in principle, climate change benefits for Lithuanian forestry if only timber supply is considered, neglecting other ecosystem services. Additionally, profits under the EU BIOENERGY scenario, which involves additional human efforts to mitigate climate change, reach the profits of the REFERENCE scenario by the end of the simulation period. Finally, the felling rate (Figure 5e) is always simulated to remain under the margin (i.e., 95%) assumed for a “good” rating following the criteria for sustainable forestry by FOREST EUROPE, the United Nations Economic Commission for Europe, and the Food and Agriculture Organization of the United Nations [57]. Increased yields under climate change with current forest management approaches usually result in lower felling rates, even though they are increasing during the largest part of the simulation period, before starting to decrease during the last four decades.

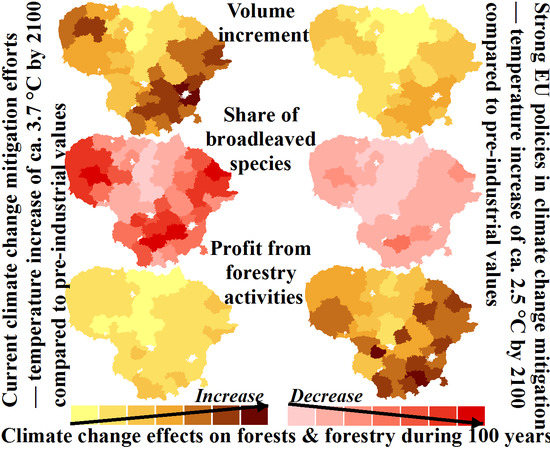
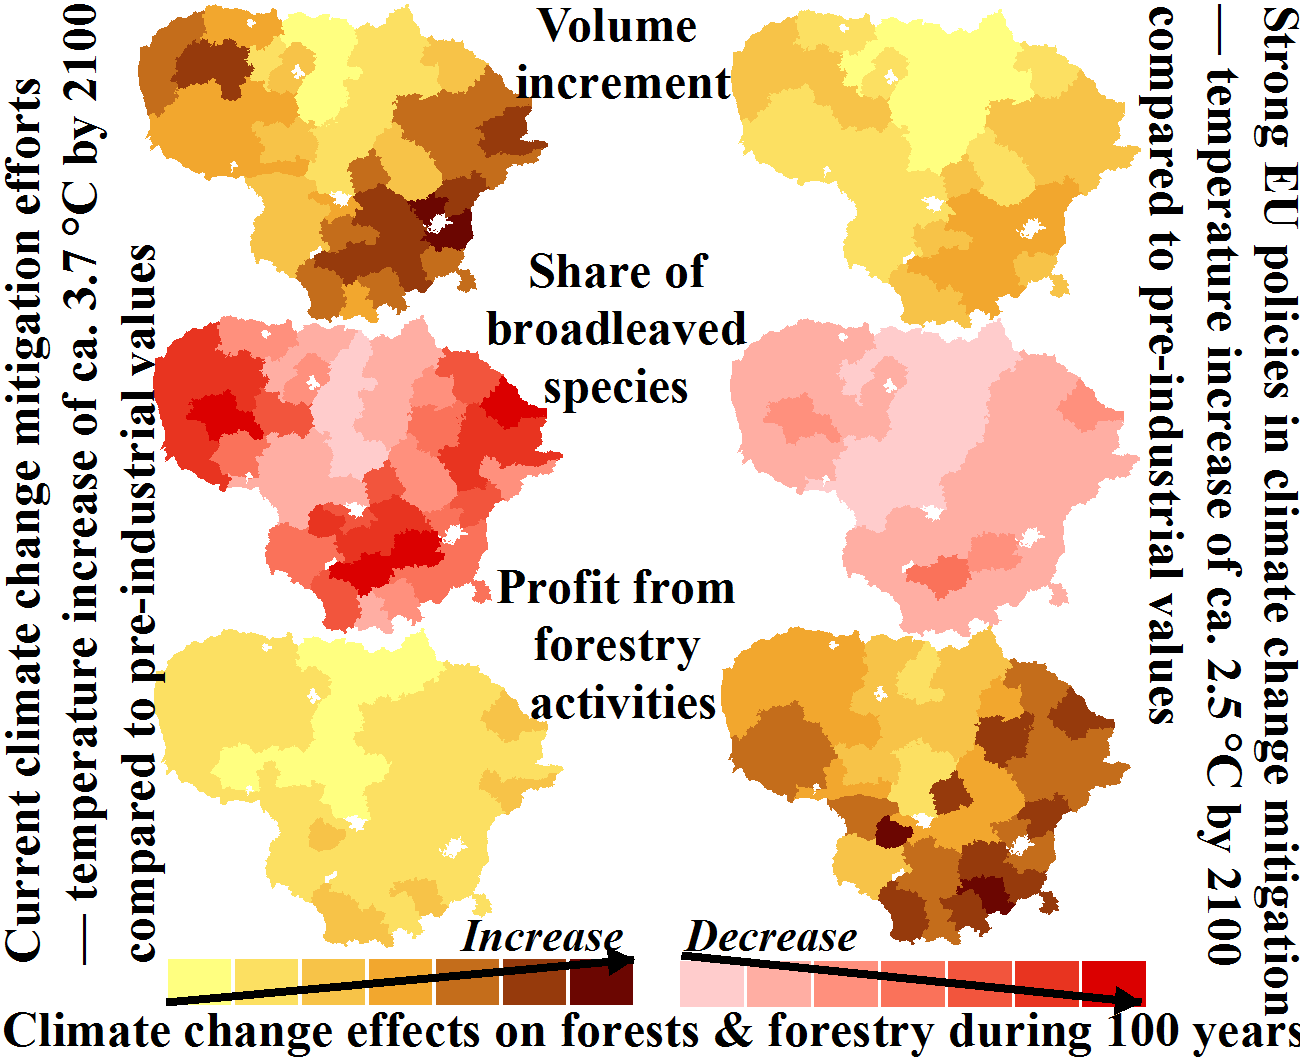
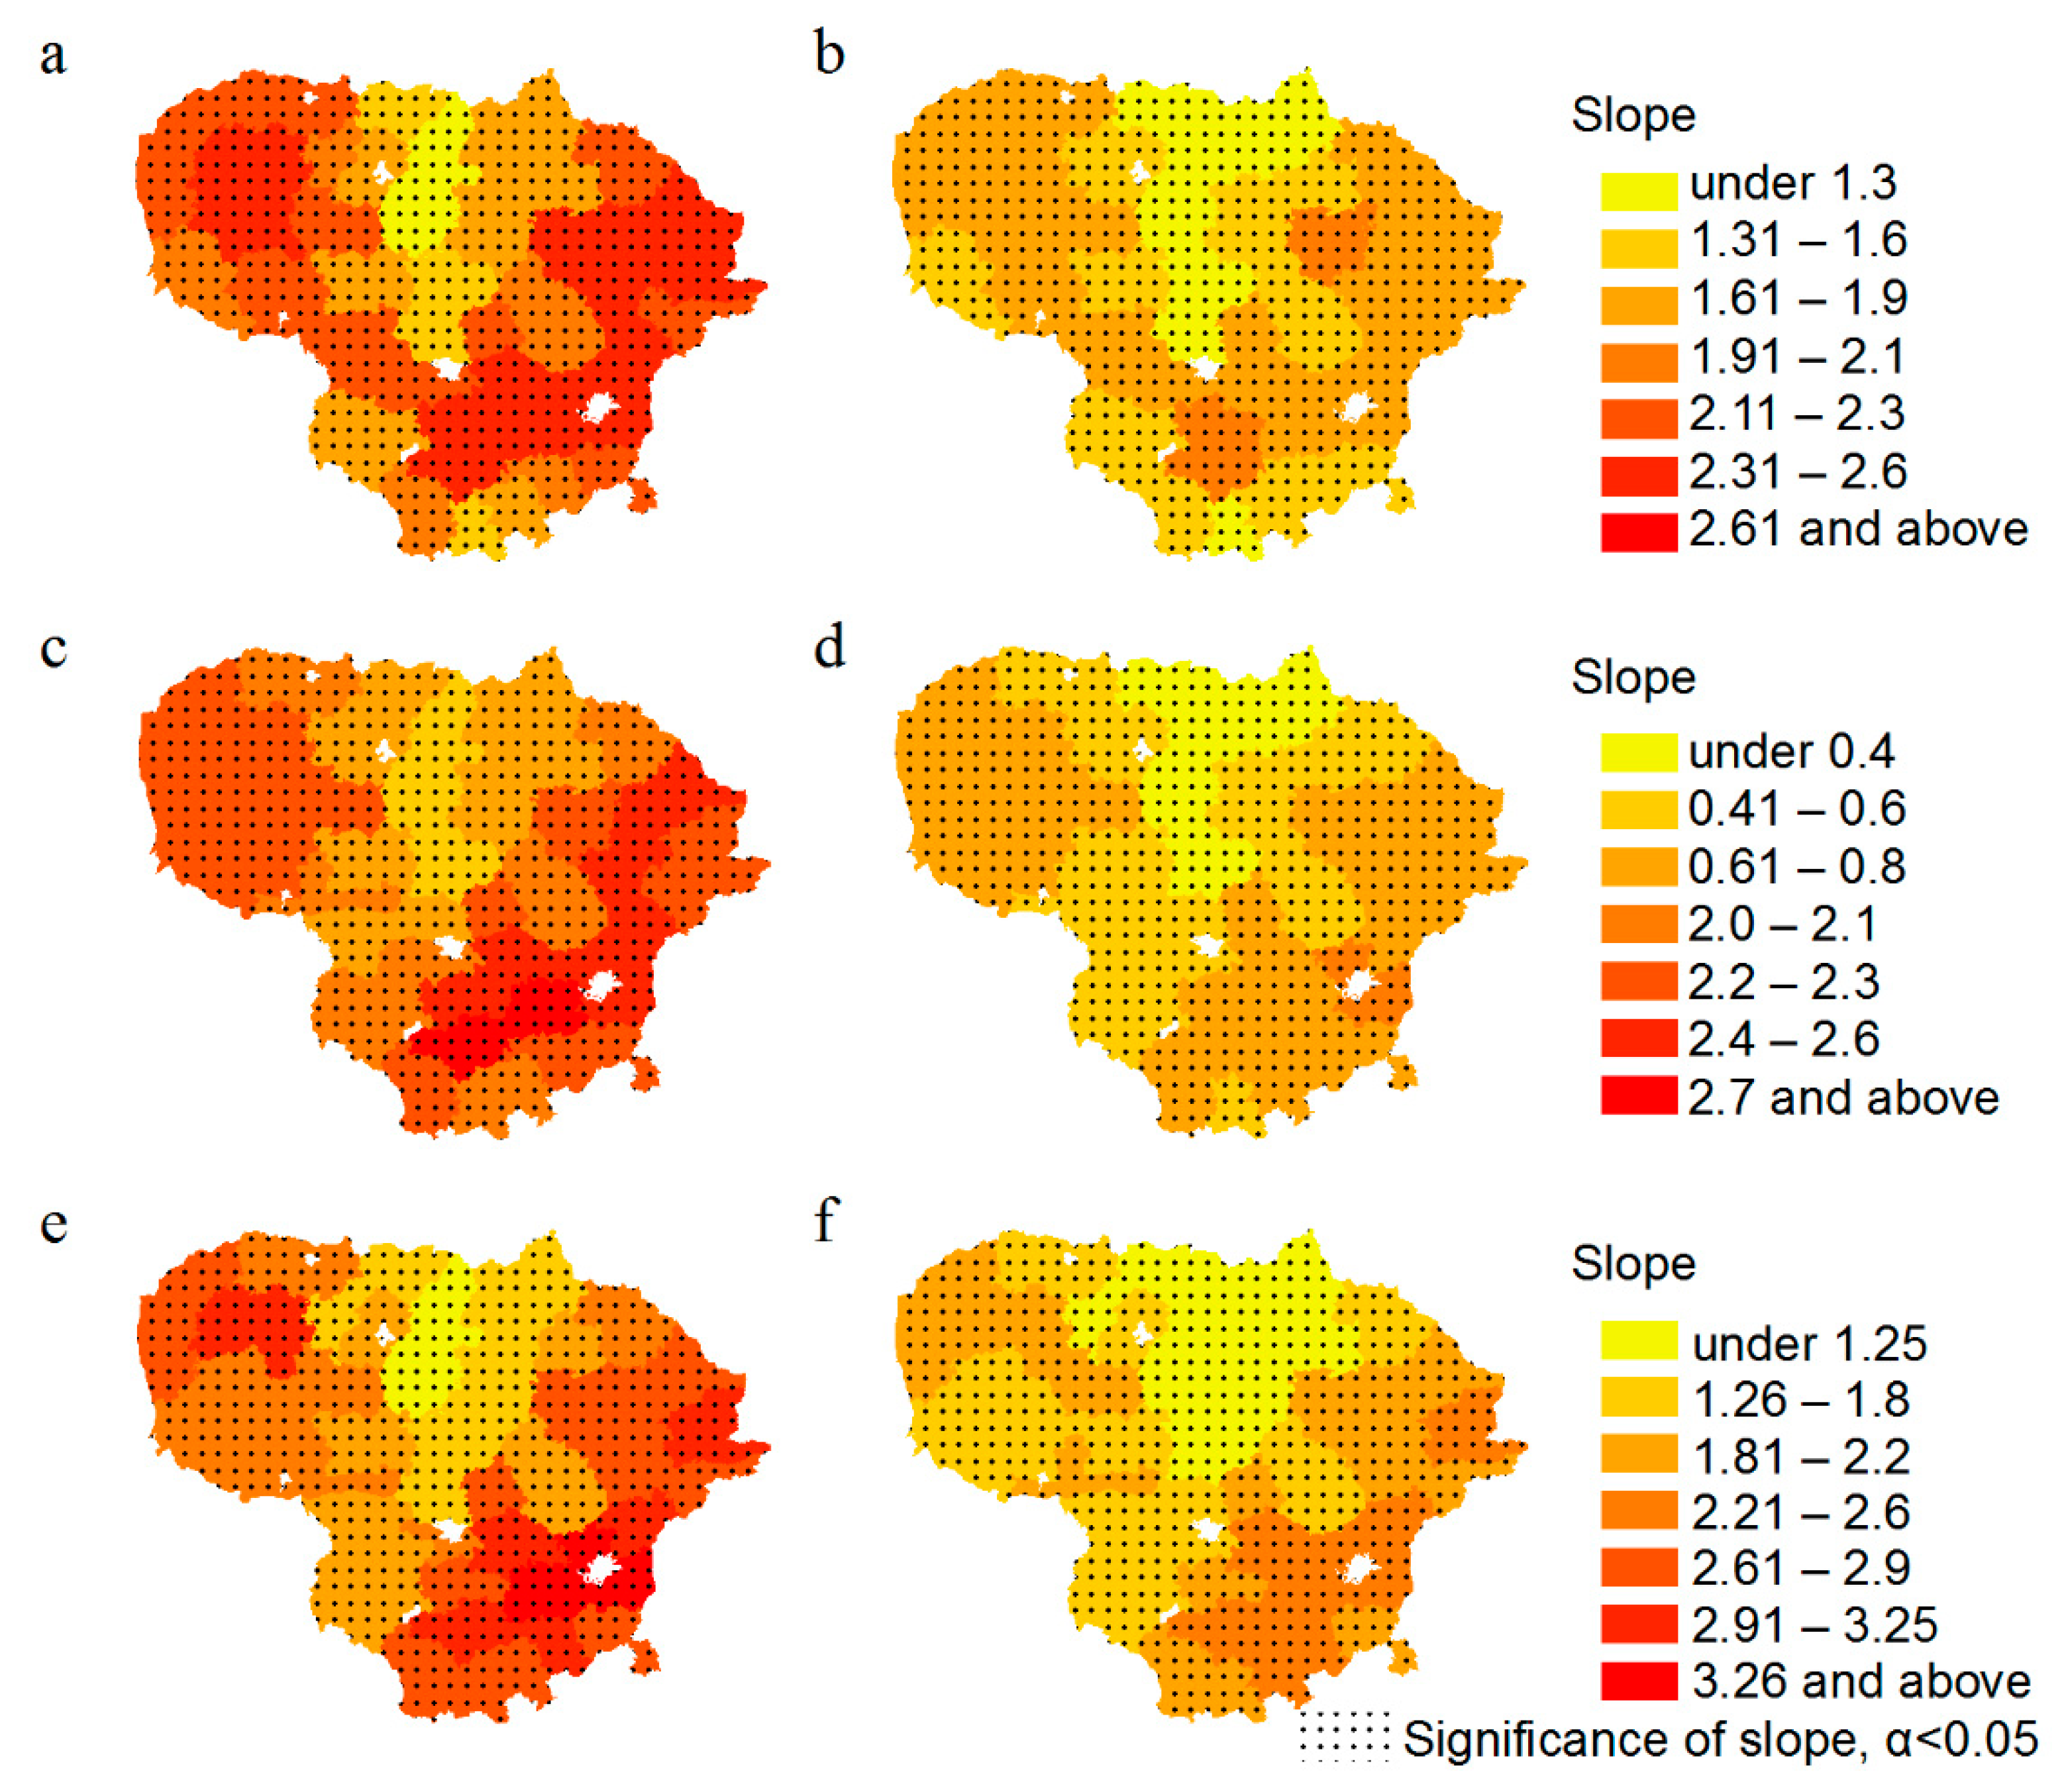
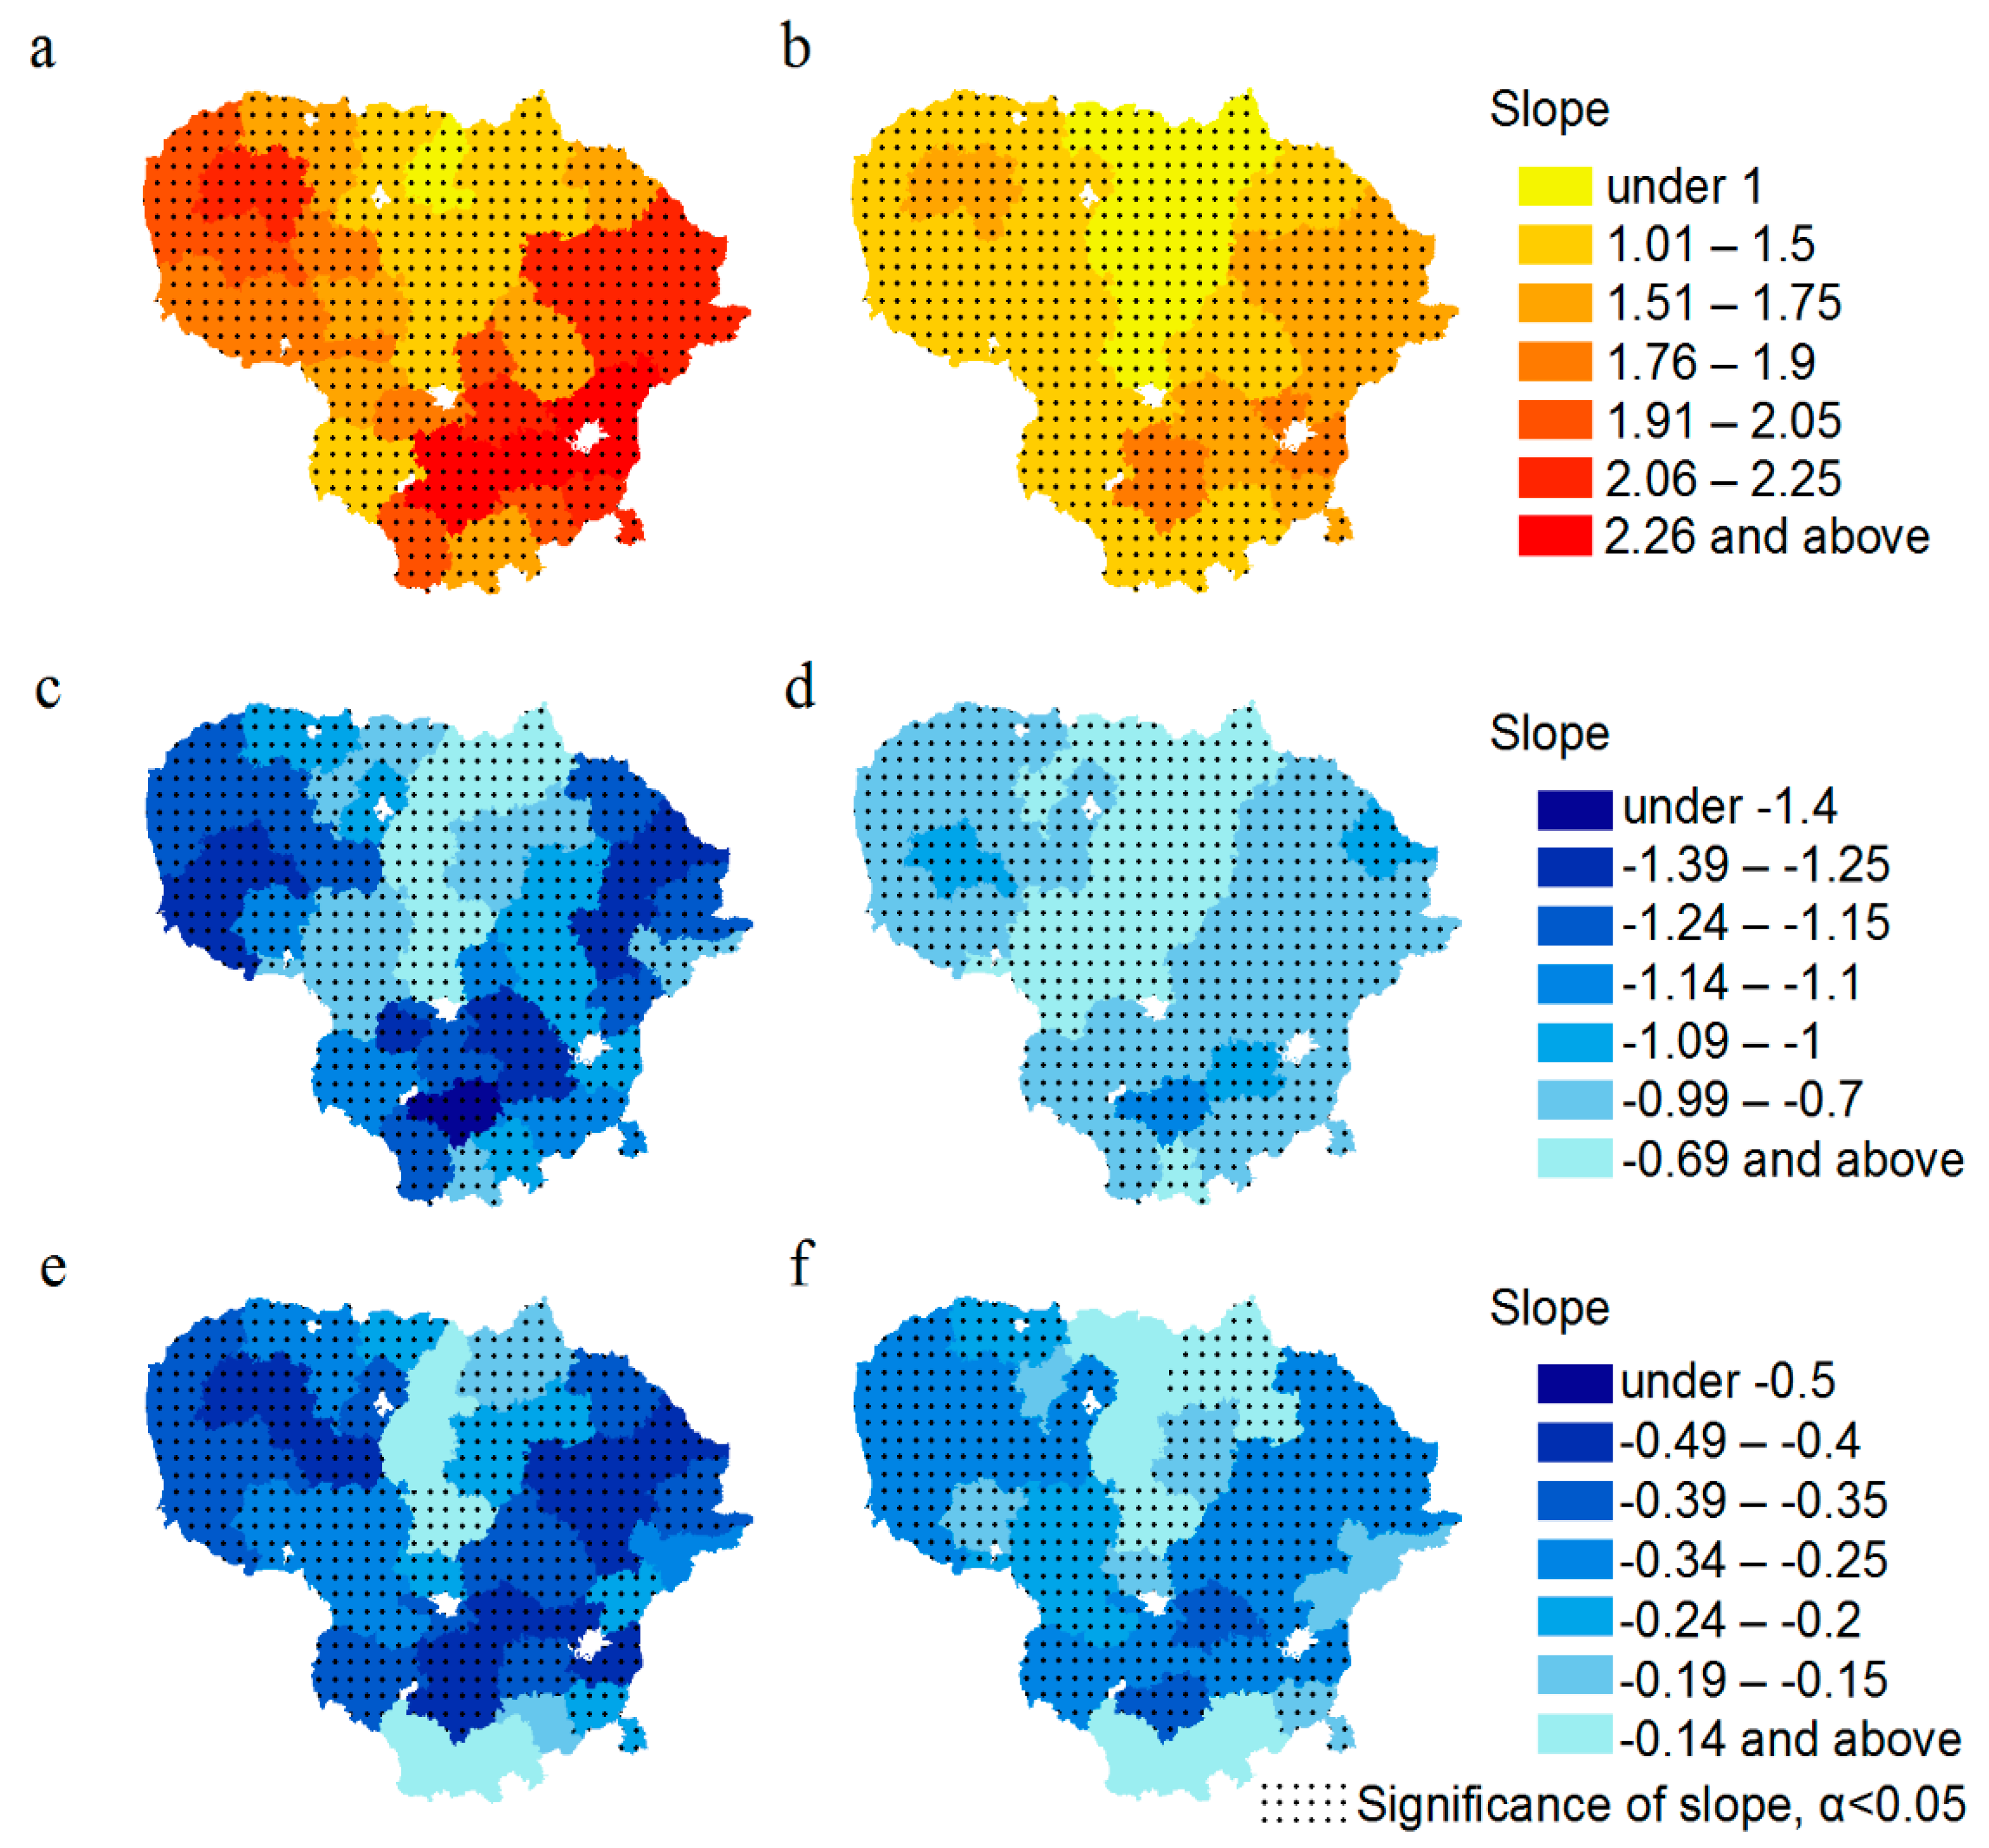
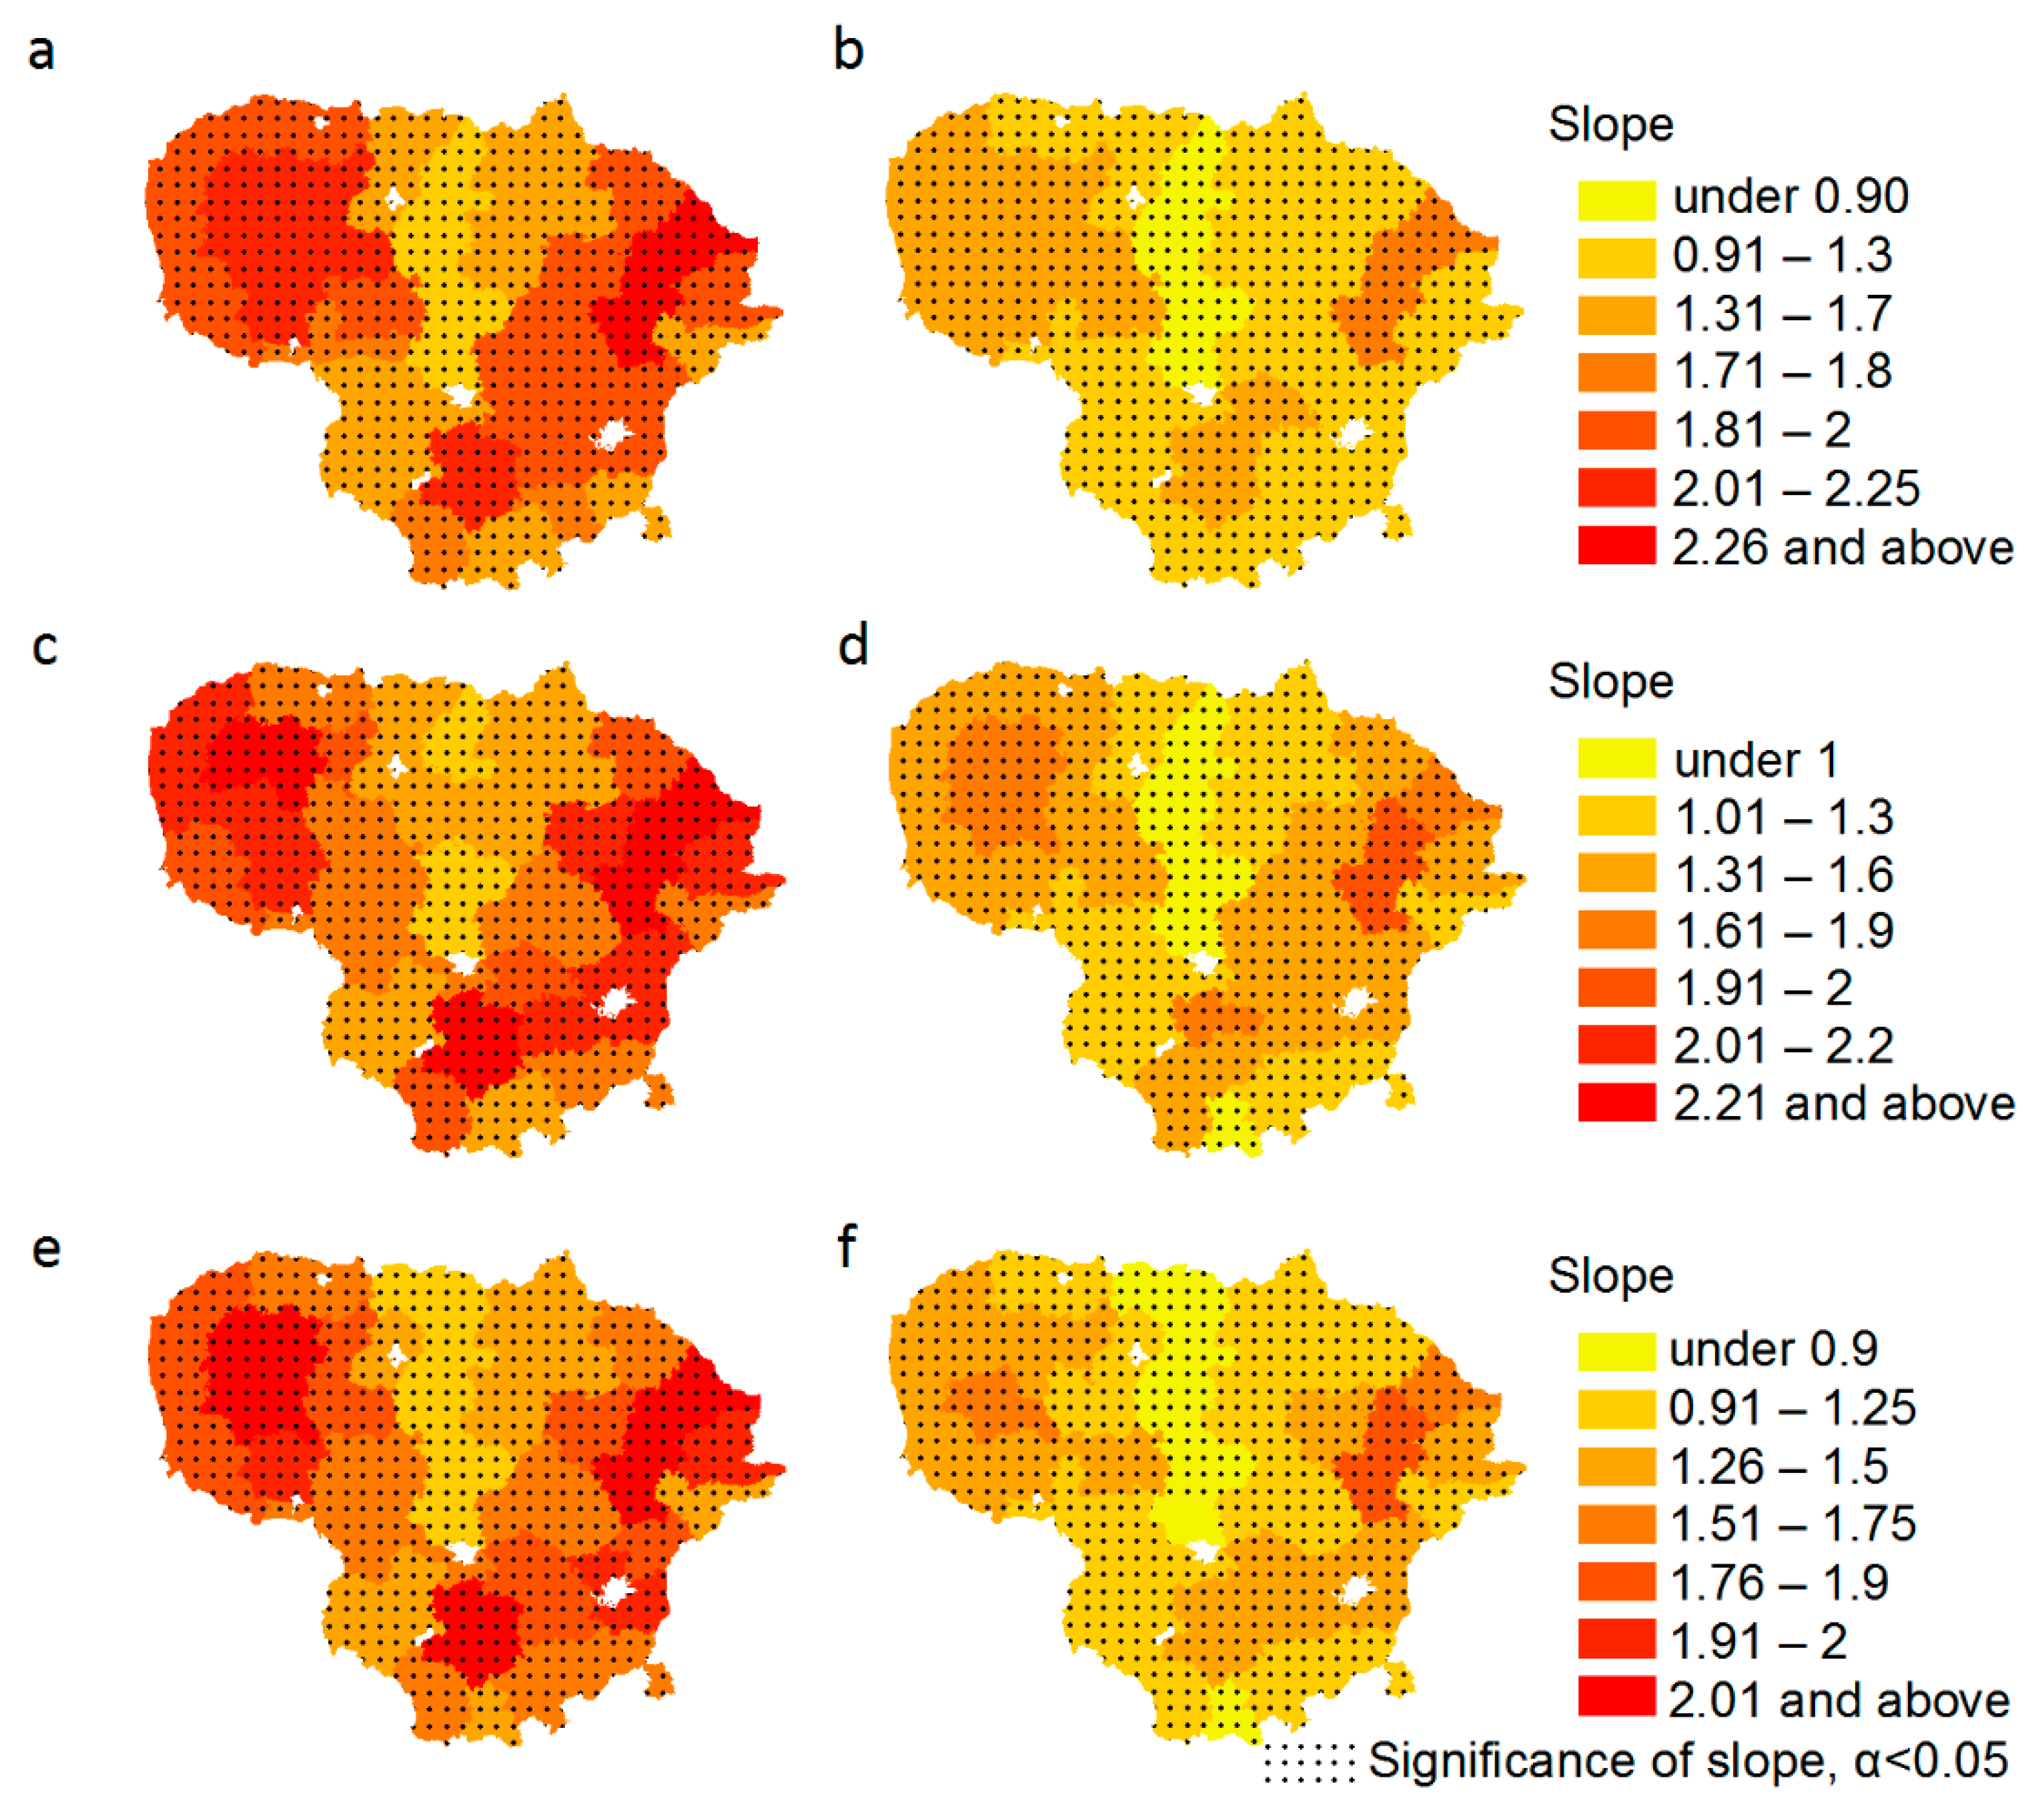
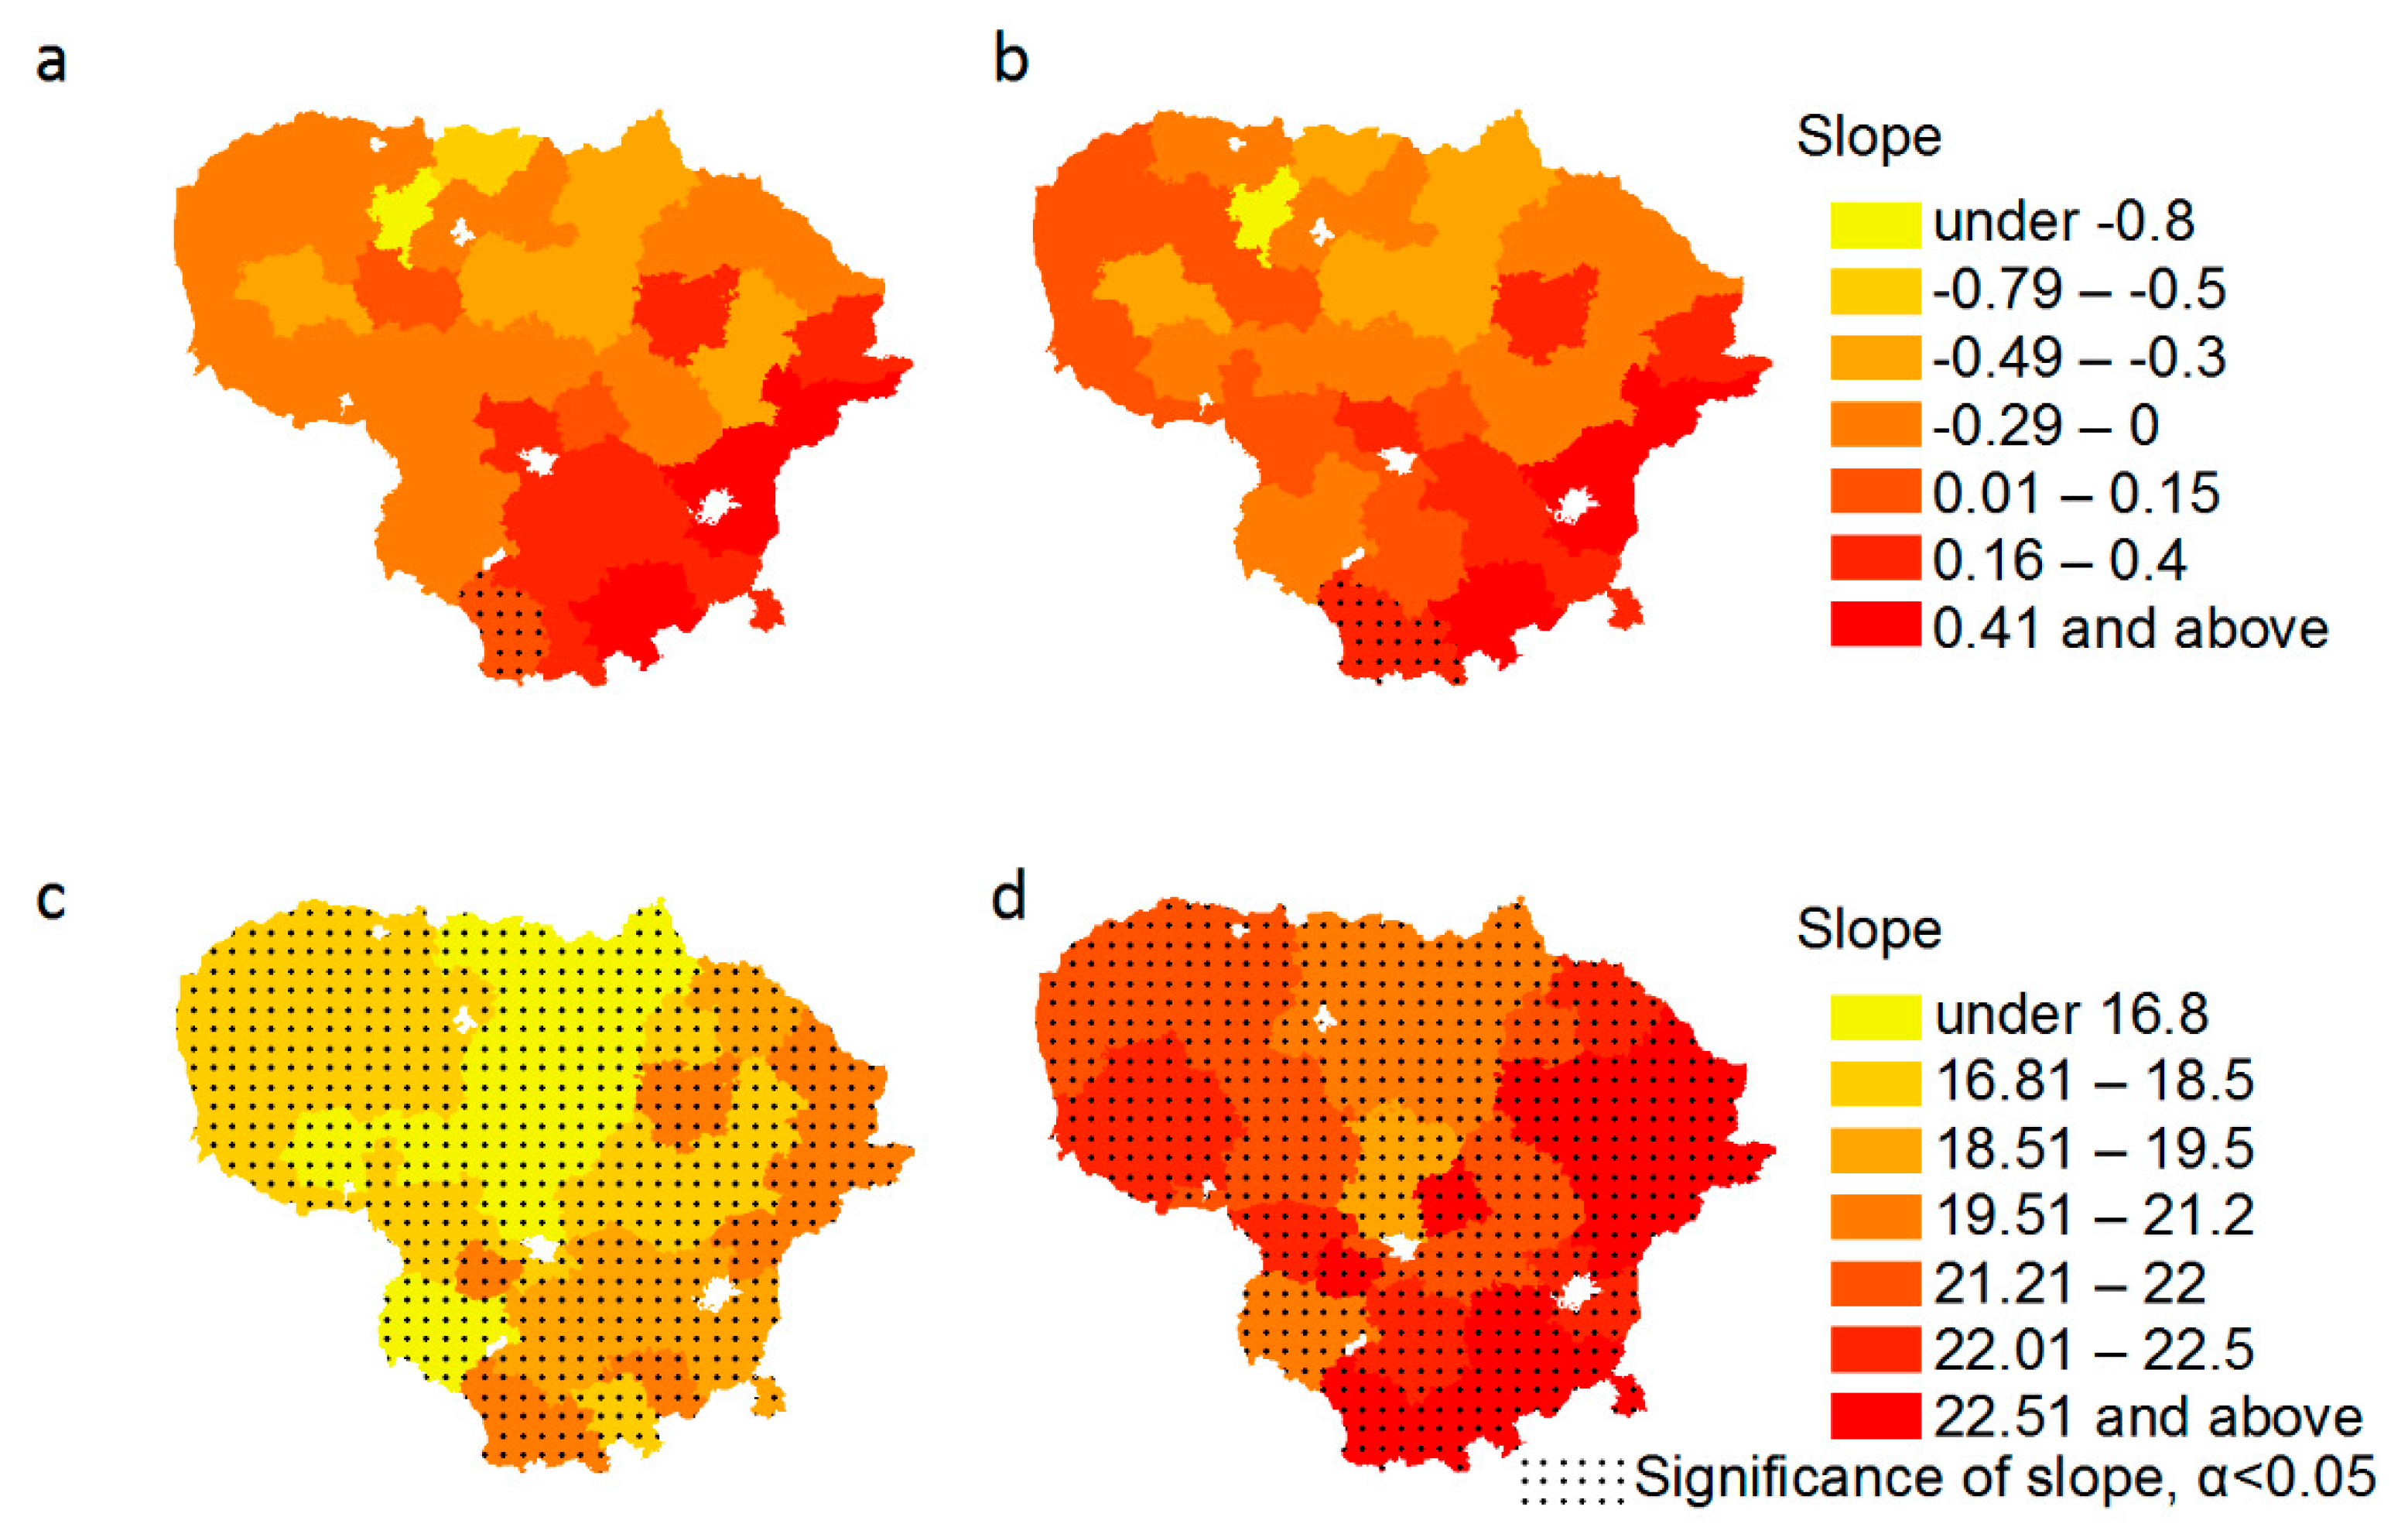
3.2. Spatial Pattern of Selected Climate Change Impacts on the Development of Forest Resources and Forestry

The magnitude of climate change effects on selected forest attributes and the increasing or decreasing impact trajectories over time, are presented in Figure 6, Figure 7, Figure 8 and Figure 9. The hue of color used in the figures below is associated with the positive or “good” (red) and negative or “bad” (blue) interpretation of climate change effects on specific attributes, whereas the color value reflects the strength of the effect, with dark meaning “strong” and light indicating “weak”.
The presence of a statistically significant trend (α < 0.05) in slope values is observed in practically all cases discussed, except for species diversity in areas with a dominance of deciduous tree species and the felling rate, where the differences between the outputs from NO POLICY and the two other scenarios remain stable over time. The values of the slope, estimated and mapped by polygons corresponding to management areas of regional branches of state forest enterprise, exhibit a clustered pattern (Global Moran’s I is usually relatively high) in practically all cases, which cannot be the result of random chance (p-value is usually much less than 0.05—Table A4). Usually, the north-central and south-eastern parts of the country stand out. This is confirmed by the cluster and outlier analysis that identified spatial clusters, as shown in Figure 10.
More specifically, greater climate change (REFERENCE scenario) is expected to yield larger average tree dimensions, volumes per 1 ha, and annual increments compared to medium change (EU BIOENERGY scenario), especially in the south-eastern and western parts of the country, as shown in Figure 6. The increase in attributes is relatively smaller in the deciduous-dominated north-central part of Lithuania. A warmer climate may cause a further decrease in the share of broadleaves and slow-down the rise of species diversity (Figure 7). The influence is smaller in the north-central part of Lithuania with dominating deciduous tree species; however, it is also low in the extreme south of the country, where pine dominates. No significant temporal trends of effects on species diversity were detected in the most deciduous and pine-dominated areas. EU BIOENERGY is the most favorable scenario for biodiversity attributes.
A relatively warmer climate seems to have a stronger impact on increasing the volumes of harvested assortments (Figure 8) and, in general, geographic patterns of increasing dendrometric attributes and increment are here followed. However, even though the statistically significant global clustered spatial pattern is maintained (i.e., the p-value remains less than 0.05), the values of the slope in some polygons start standing out, not yet yielding spatial outliers.
The impact of climate change on the felling rate during the simulation period is relatively low, usually resulting in an insignificant slope (Figure 9). However, spatial clustering is even stronger. The final felling rate is expected to decrease slightly in the south-eastern part of Lithuania and, in contrast, to increase in the northern part, outside the area dominated by deciduous tree species.
Climate change effect on profit from forestry activities is stronger under the conditions of the EU BIOENERGY scenario (Figure 9). This could be explained by the steadily increasing profit during the whole simulation period under the EU BIOENERGY scenario and a sudden jump in profit during the initial simulation steps followed by a slower increase later under the REFERENCE scenario (Figure 5d), which both reach the same point in 2120. Irrespective of scenario, climate change increases the profit least in the north-central area of Lithuania with abundant deciduous species, while the relatively largest increase is seen in pine-dominated Southeast Lithuania.

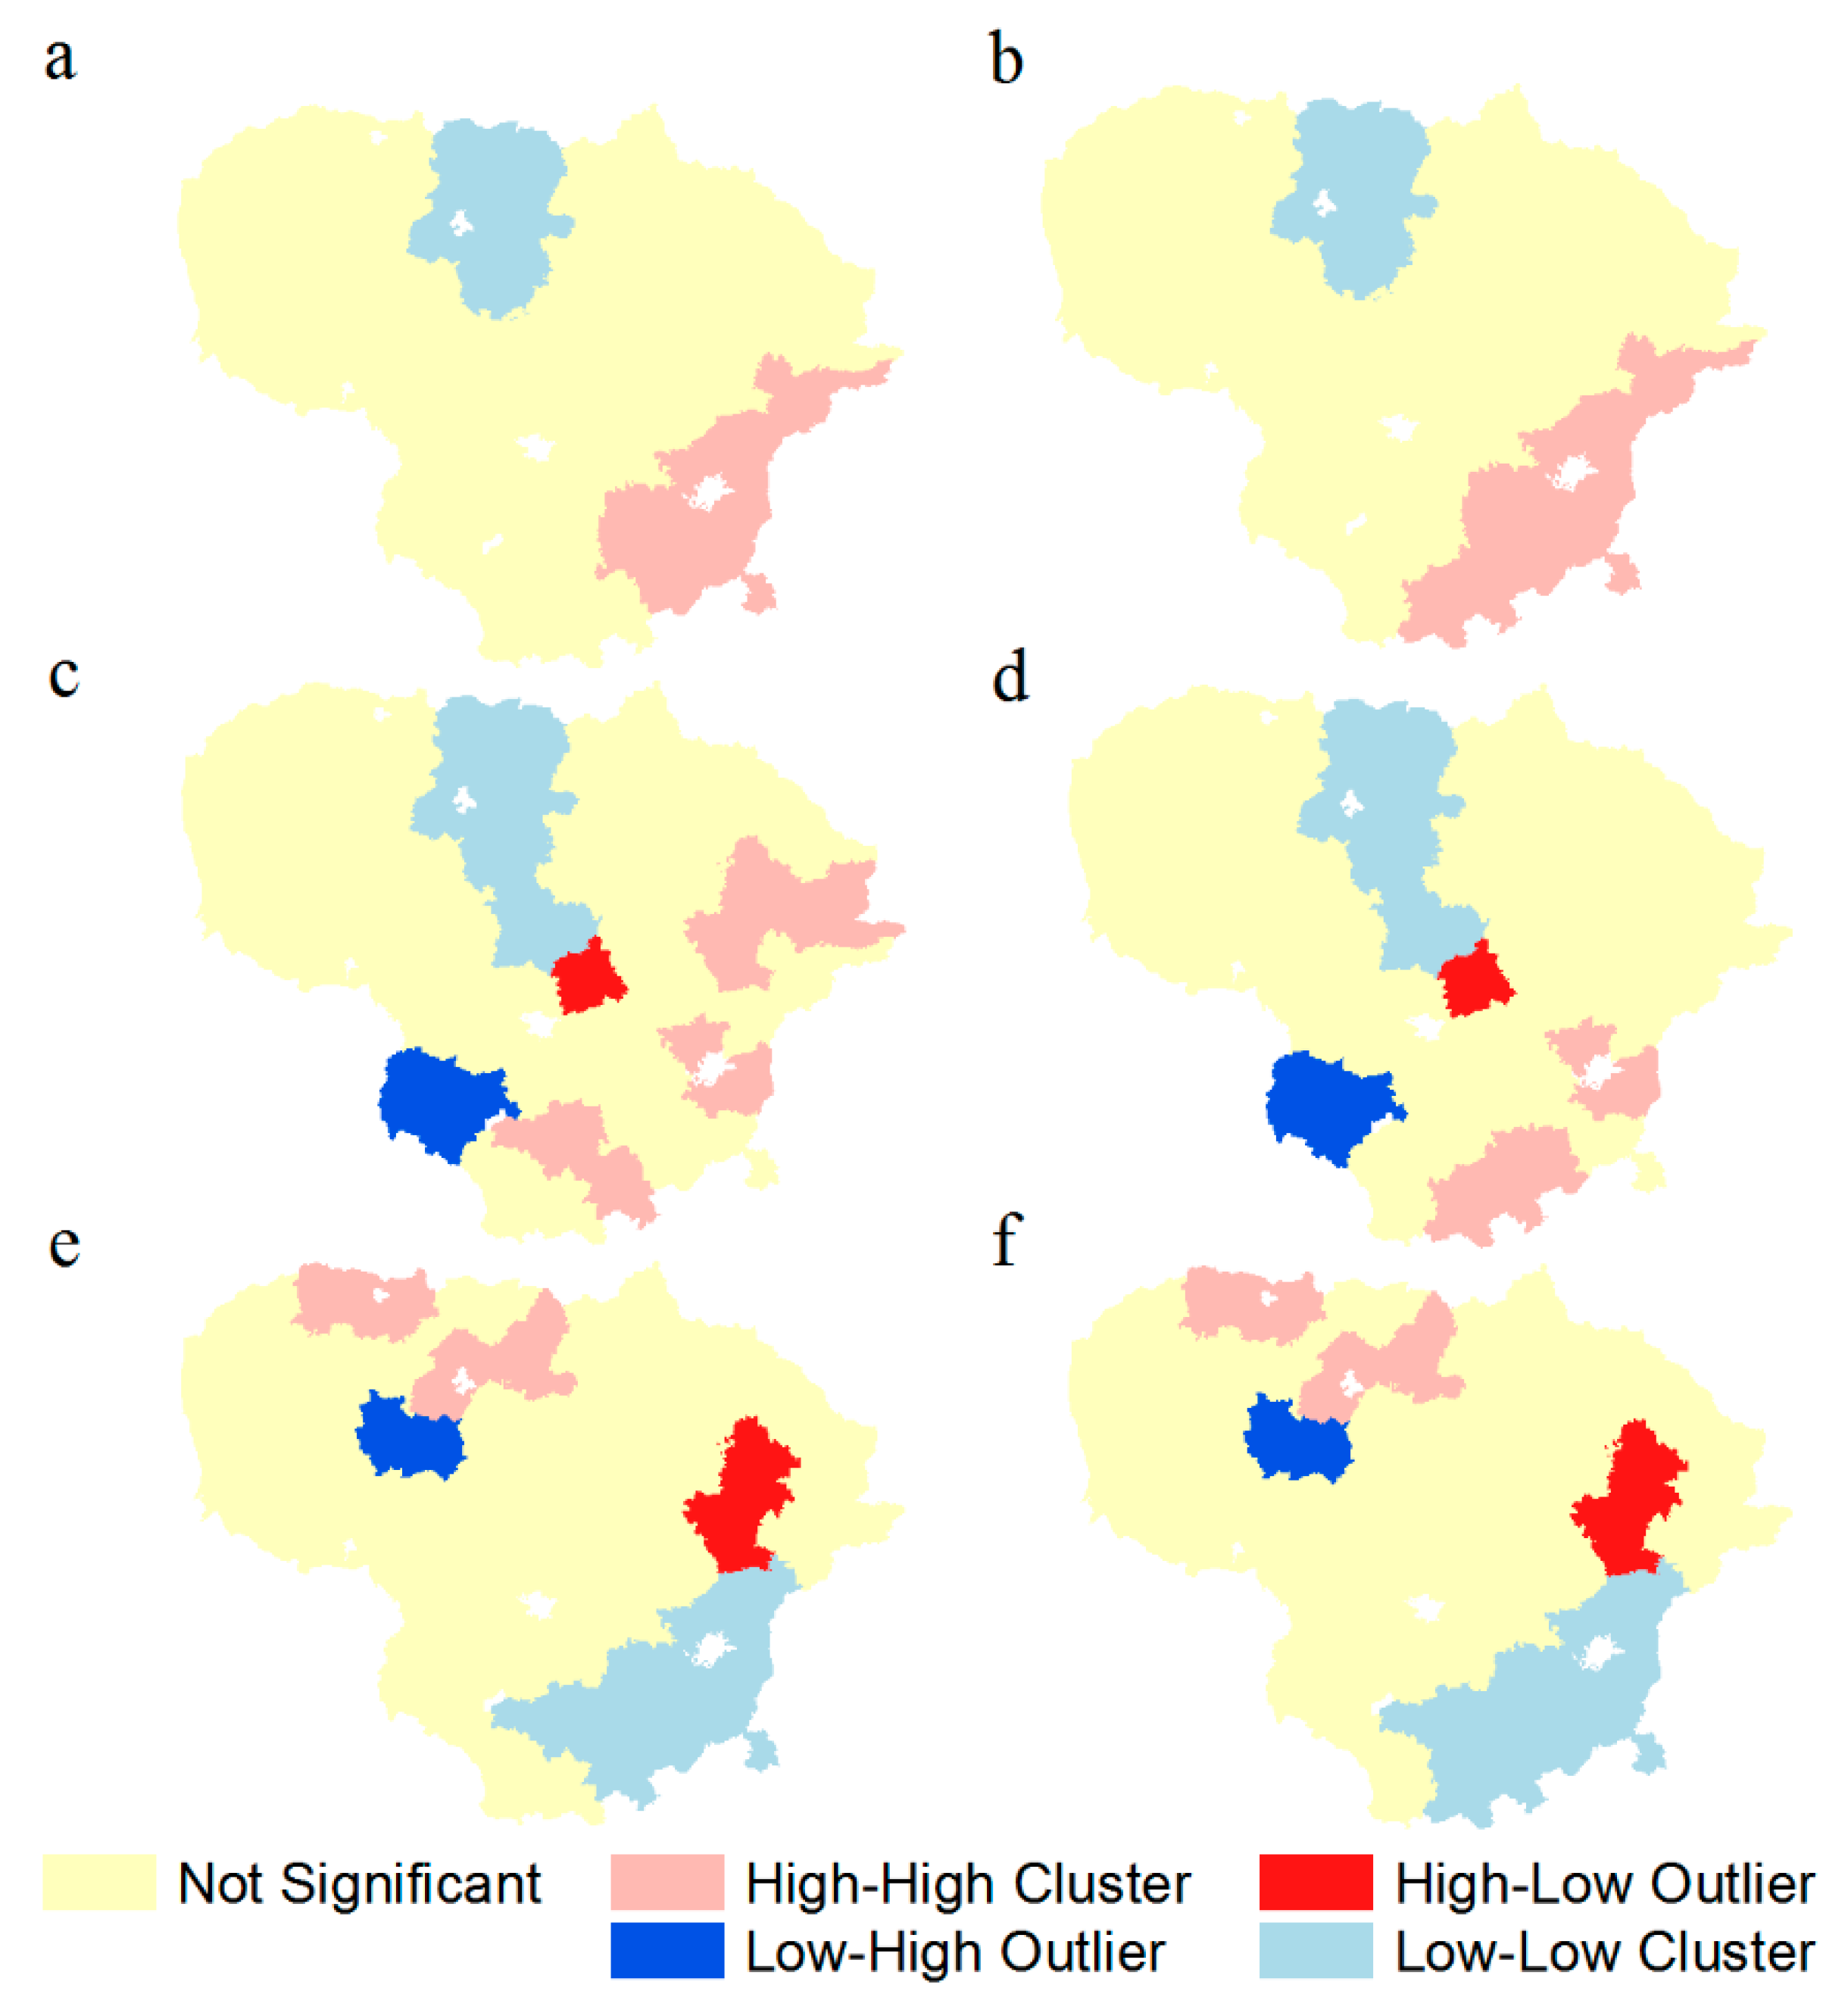
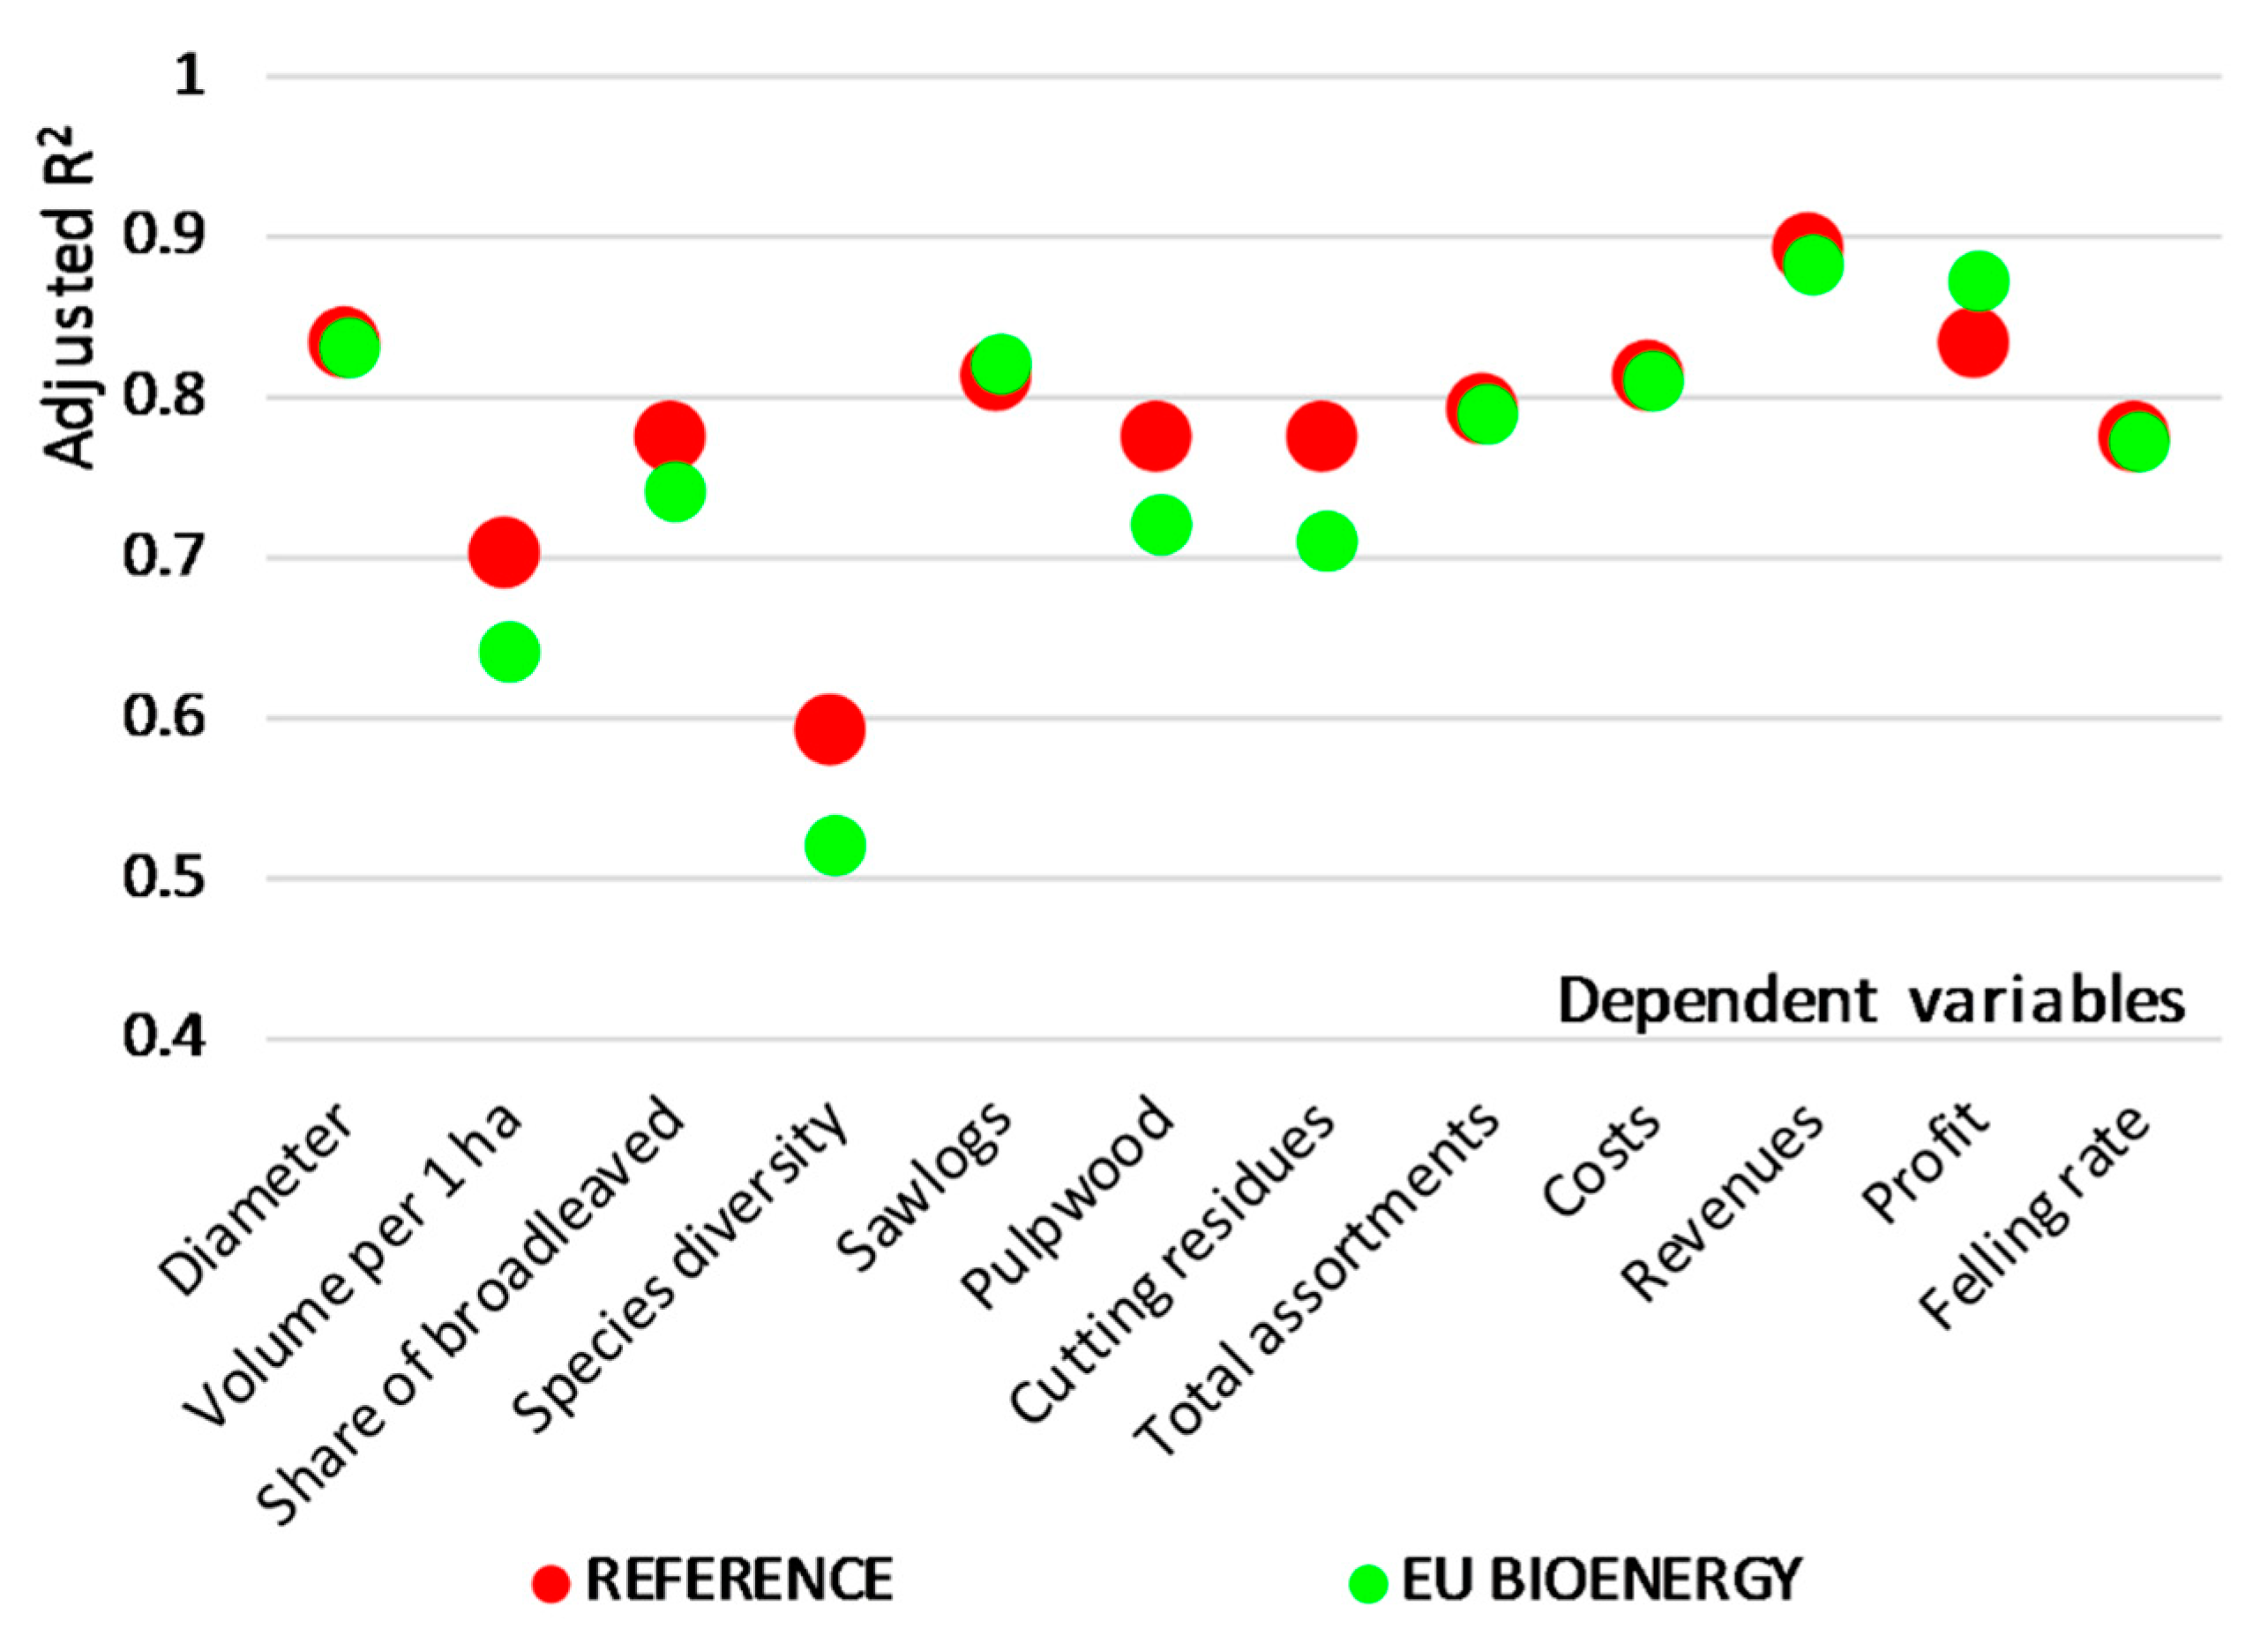
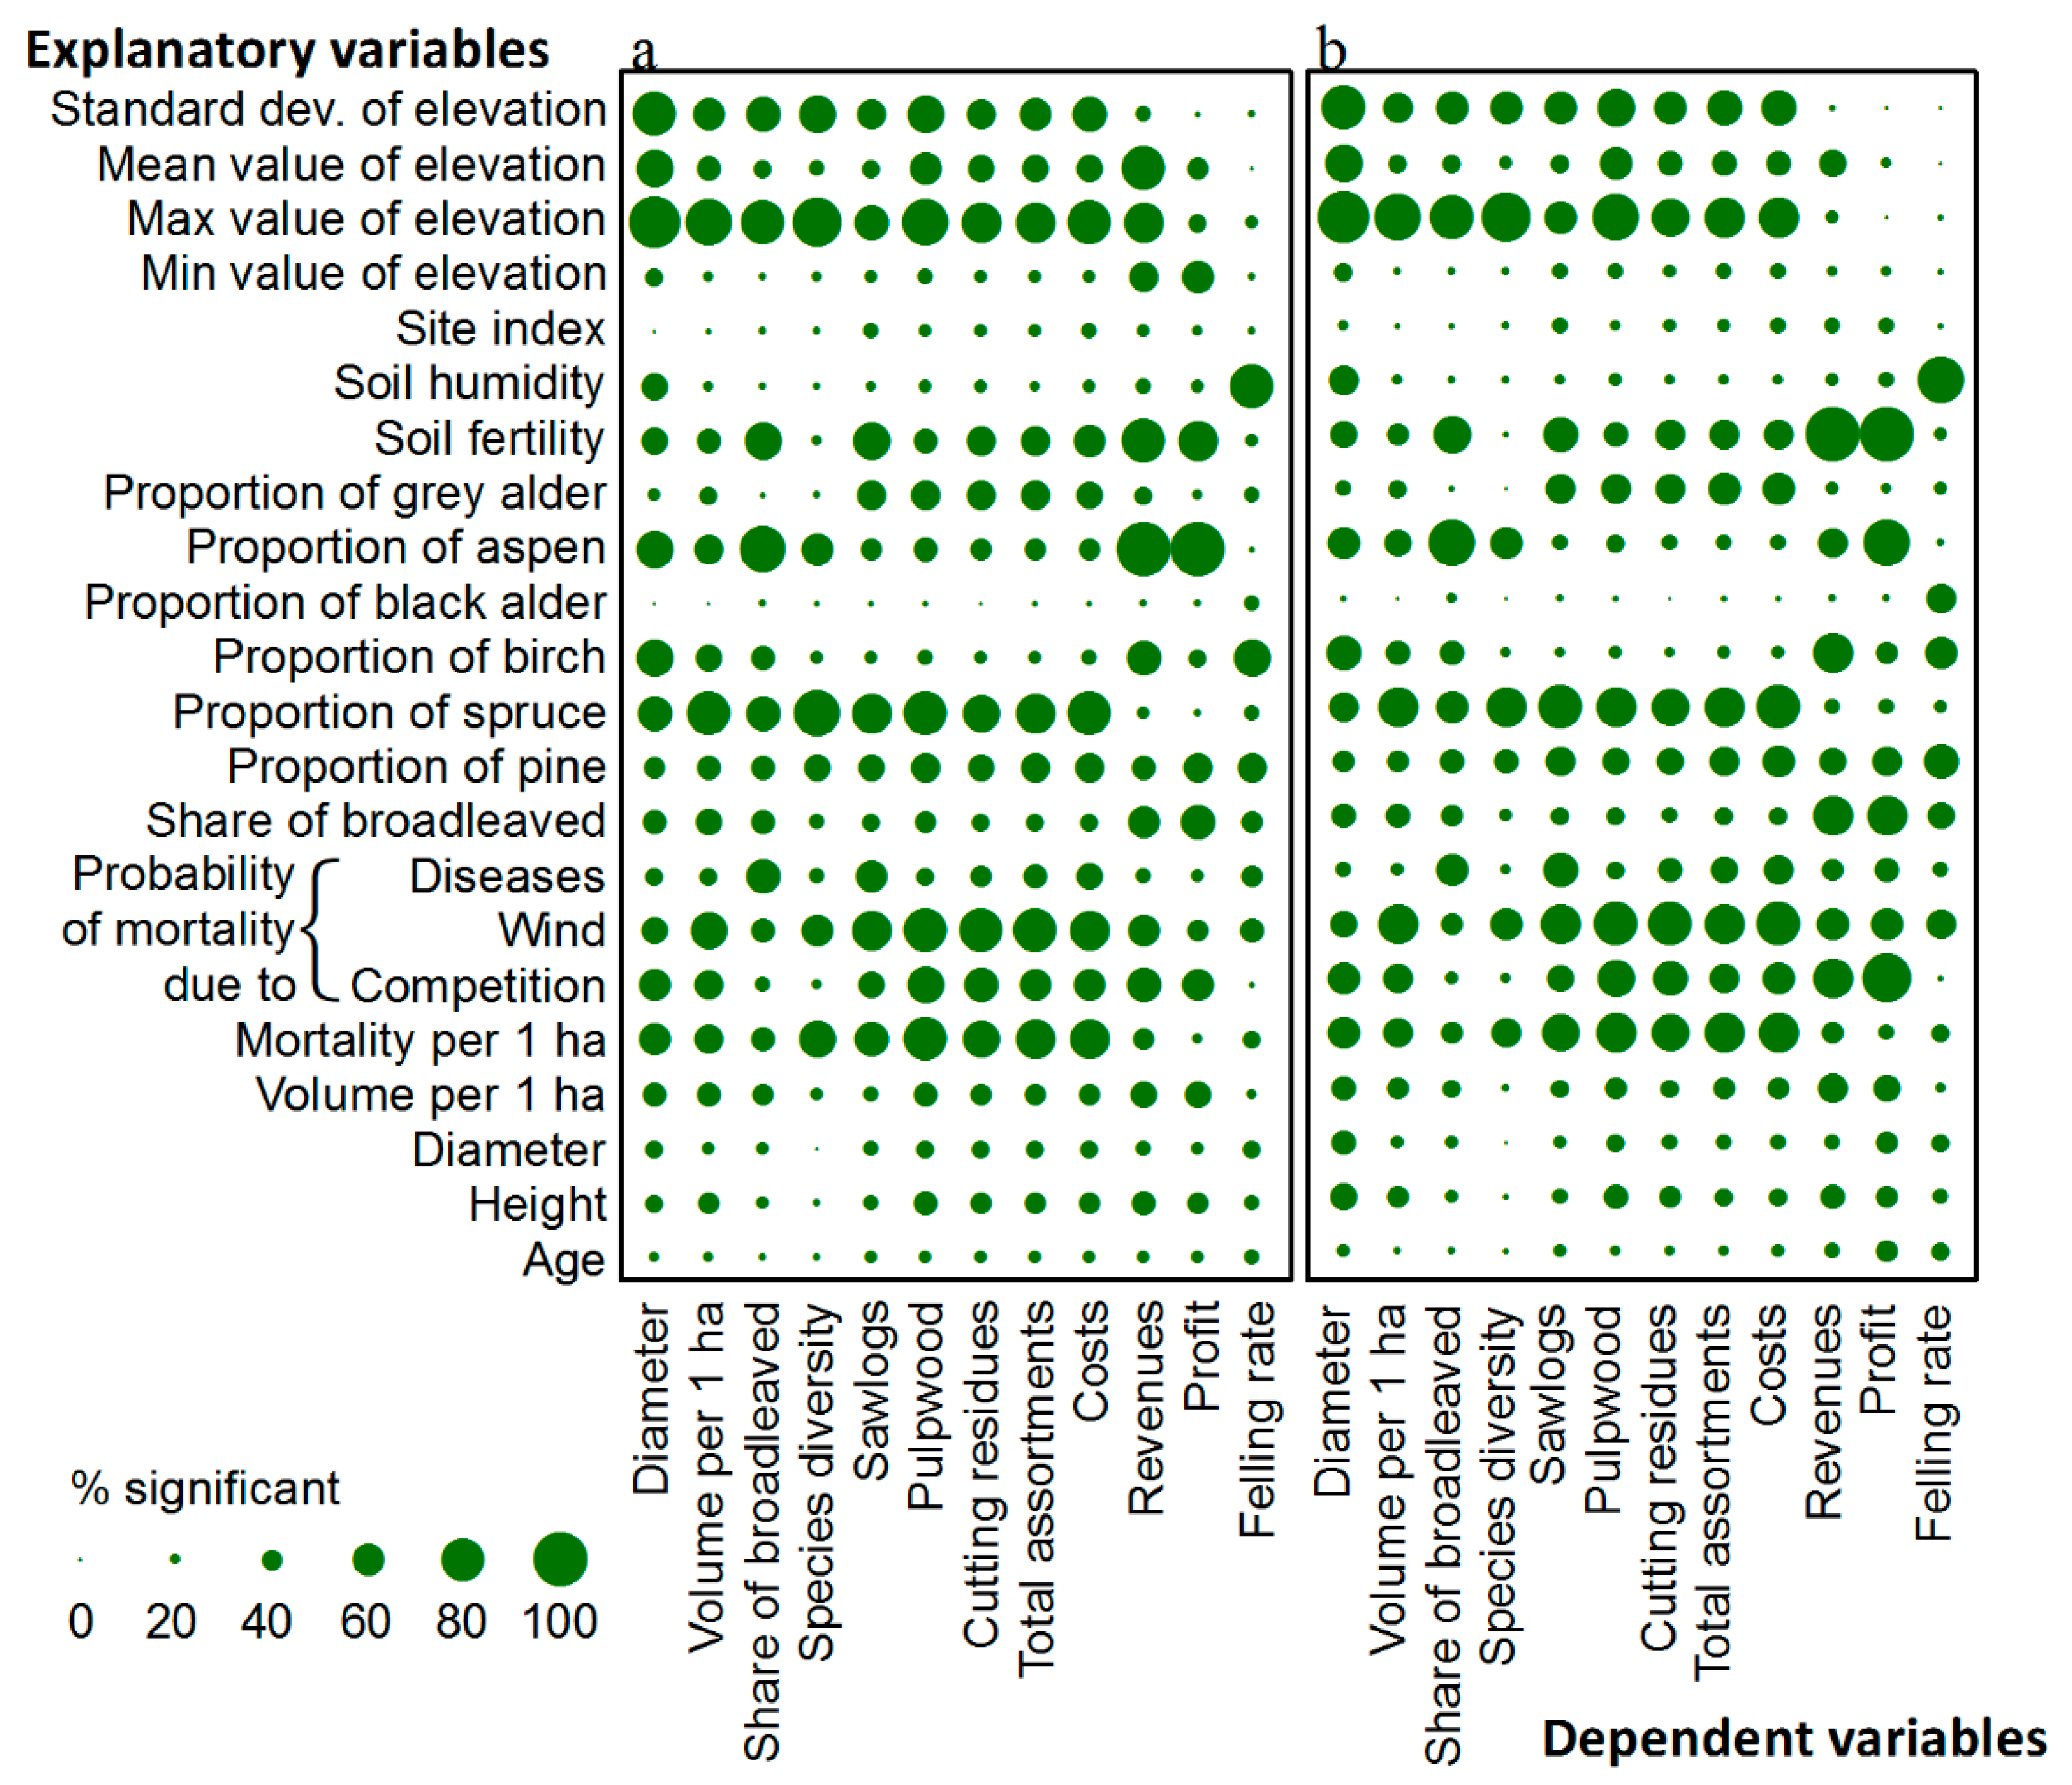
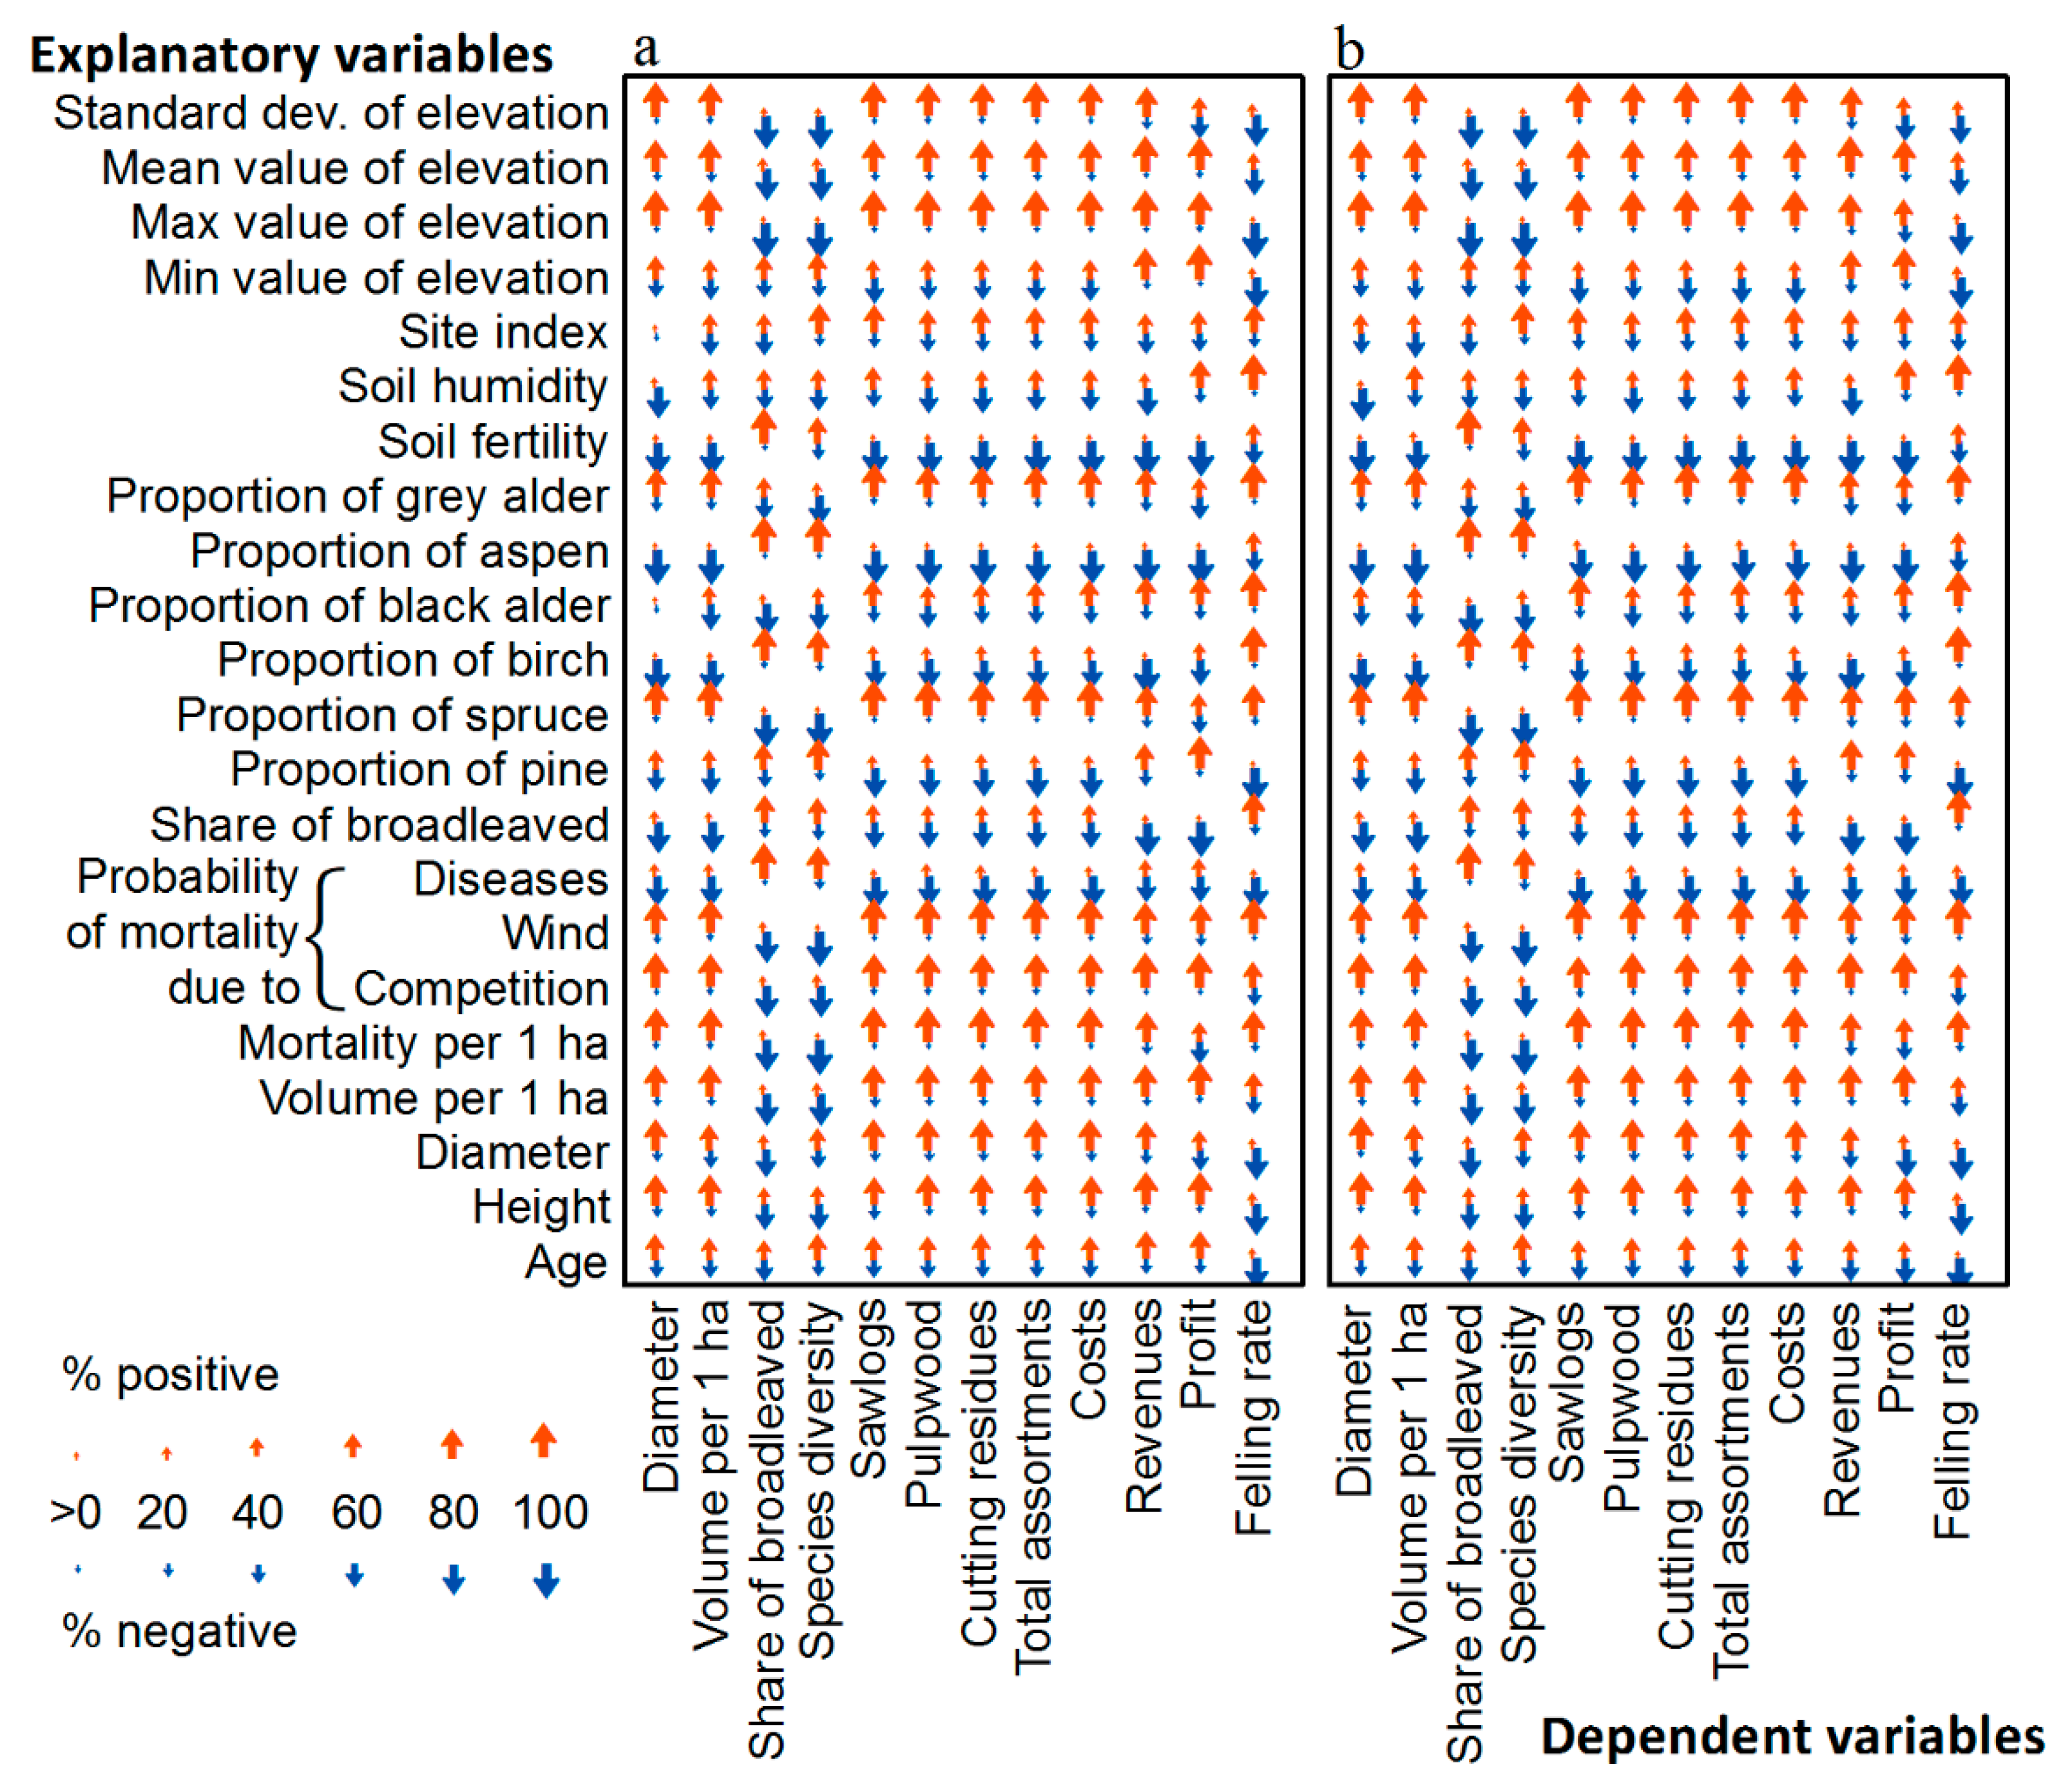
3.3. Factors Influencing Climate Change Effects on Lithuanian Forests and Forestry

Generally, a high proportion of variance in changing development trajectories of key forest attributes, due to climate change impacts is explained by current forest conditions (Figure 11). Adjusted R2 parameters for most of the dependent variables are above 0.7. Better models are generally achieved for all forests than for just the state forests. Best regression models explaining the effects of climate change on selected forest attributes are given in Table S2.
The proportions of times that each candidate explanatory variable was found to be statistically significant during the tests of all potential variable combinations are illustrated in Figure 12. The proportion of spruce trees in current forests seems to be an important factor for all scenario cases. The tested increase in spruce growth is expected to be the largest, relatively, due to climate warming. The share of spruce in current forests is also responsible for changes in harvested timber in state forests. Elevation, especially the presence of hilly landscapes in the management area, is an important variable in many models. The vulnerability of current forests to catastrophic events, as expressed by the probability of mortality, may be responsible for changes in volumes of harvested products, due to climate change. The two climate change scenarios do not differ much; however, the proportion of aspen seems to be relatively more important for revenues and profits under the REFERENCE scenario, whereas the same is true for all broadleaved species under the EU BIOENERGY case.
The explanatory variable may have different effects on the changing trajectories of forest development under climate change. Information on the consistency of the relationships of explanatory and dependent variables in regression models is provided in Figure 13. So, the greater the dominance of spruce in current forests, the larger the impacts on the increase in forest productivity-related characteristics. However, spruce causes decreasing biodiversity-related characteristics, like the proportion of broadleaved tree species and species diversity. Opposite impacts are associated with the current proportion of broadleaved species, birch, and aspen. Elevation-related variables indicate positive effects, except for the primarily negative effect on the change of species diversity, the share of broadleaved species and the felling rate.

4. Discussion

The current study was aimed, first, to validate modelling approach which combines global framework conditions in the form of climate and policy scenarios with the use of decision support system and considering local and national forest governance aspects. Our predictions cannot eliminate all uncertainties about future conditions of forests and forestry, but they can rather reduce uncertainty in current forest management decisions. Thus, we discuss the results of our validations first comparing the approach and achieved figures with the findings of other national and international studies. Second, we evaluate the modelling approach considering its suitability to disclose the effects of climate change on Lithuanian forests and forestry and potential use as support for forest policies, i.e., how well the second objective of our study has been met.

4.1. Incorporating Climate Change Effects in Decision Support System Simulations

Even though forest management decisions are adopted for the future, examples of using decision support systems in Lithuanian forestry remain rare, and their theoretical basis is weak. Nevertheless, our projections developed under the NO POLICY scenario do not contradict the findings of previous national studies, even though the objectives and methodological approaches are different. The volume of felled trees in our simulations increases during the three initial decades, but then rather stabilizes and remains under 13 million m3, meaning approximately 10.7 million m3 of merchantable timber, using the definitions of Lithuanian practical forestry. This is in line with forecasts by Petrauskas and Kuliešis [41], where projected harvest levels reach 10 million m3 during the 21st century in protective and commercial (Groups 3 and 4) forests. If approximately 6% of additional timber is made available from Groups 1 (strict reserve) and 2 (special purpose) forests [49], then we obtain compatible findings. Near identical results were achieved using data from sampling based on the national forest inventory of Lithuania and modeling forest development applying European forestry dynamics model EFDM [58]. Jasinevičius et al. [44] projected harvest levels in Lithuania that did not exceed 10 million m3; however, they only considered timber products. As some bias in simulated results is inevitable, we obtain comparable results for several forestry simulation studies in Lithuania. Therefore, harvesting levels above 10 million m3 annually should be considered as unrealistic for Lithuania. The major difference between our study and all other forestry simulation studies conducted in Lithuania is that none of the previous exercises has incorporated the potential impact of climate change on forest growth and forest management. Disregarding this factor, we may face a significantly larger bias than, due to methodological simulation issues. For example, in our study, the average increase in standing volume in 1 ha of all forests during the simulation period without considering potential climate change effects (NO POLICY scenario) was about 15%, while considering the climate yielded 18%–20%. We determined a 5% increase of the annual wood volume increment during the coming 100 years in the NO POLICY scenario, but a 23% or 27% increase under warmer conditions (EU BIOENERGY and REFERENCE scenarios, respectively). Assuming that the models need to be evaluated according to the level of reduced uncertainty in management decisions, we emphasize the importance of climate change in forestry simulations.
Some of the globally available decision support systems incorporate climate effects on forest growth and forestry [36]; however, Kupolis does not explicitly include climate models. The approach used in the current study was employed to consider climate change by adjusting growth rates under different scenarios of average annual temperature changes. In fact, all the changes are related to changed growth, tree dimensions, and, thus, relevant forest characteristics, like volumes of the growing stock, naturally dying trees and harvested timber, tree species proportions, etc. For instance, increased spruce productivity under warmer climate may result in decreasing share of broadleaved species, or larger basal area may influence changes in thinning regimes and harvested timber volumes (total, by tree species, by assortment types), however, climate change has no impact on the age of stands, which is the key parameter for final harvesting and is predefined by the principles of current forest management practices. We do not discuss the IIASA scenarios, considering they have already been well-introduced [52,53]. However, the main problem in our study is the lack of data on climate change effects on growth in Lithuania apart from expert opinions. Therefore, the study by Augustaitis et al. [15], which discusses the growth changes of main tree species retrospectively in changing environments, is, in principle, the only source of information we used to adjust the growth models used in Kupolis. We think further studies that deliver more information on forest reactions to climate change will be able to improve the simulations. We do consider the trends revealed in the current study to be sufficiently reliable to provide guesses about Lithuanian forestry under the changing climate.
An increasing number of studies addressing climate change impacts on forest growth and forest management suggests the importance of geographic aspect in interpreting the results. Numerous studies, involving the use of decision support systems, suggest changing forest productivity in the long-term. However, the direction of changes may be radically different. Reduced forest growth, basically, due to increased temperatures and decreased precipitation is reported in the Mediterranean and Atlantic countries of Europe—Spain [59], France [60], Ireland [40,61,62], Denmark [63] also in Central Europe—Austria [64] and Slovakia [62]. Both increasing [62,65] and decreasing [62] trends may be observed for Germany, depending on the region, climate change patterns and characteristics of forest and forest management. Nevertheless, countries neighboring to Lithuania geographically—Sweden [61,63], Norway [63] and Finland [63,66,67], usually report increased forest productivity, due to climate change impacts. This is completely in line with our findings, suggesting larger wood volume increment and timber harvesting potential in the scenario with less climate change mitigation efforts, and thus, faster increasing temperatures. An Irish study [40] with a similar methodological approach to ours and compatible climate change scenarios, suggested changing timber prices to have more effects on forest management than climate change growth impacts. Climate change may have geographic region-specific effects on other components, which need to be considered aiming for sustainable forestry. For instance, H2020 project ALTERFOR suggested [62] better outcomes for biodiversity under current climate change mitigation efforts in Europe and low globally (cf. our REFERENCE scenario) in Germany, Slovakia and Italy, but worse in Sweden and Lithuania, usually associating them with growth rates. The same study concluded that global climate change scenarios did not have a substantial impact on the vulnerability of landscapes to catastrophic events, such as fires or wind, however, some country-specific outputs were reported, underlining methodological limitations in the functionality of used decision support systems. Warmer climate was suggested to offer the most advantages from a carbon sequestration perspective. So, the geographic context and spatial scale are important in relation to both incorporating climate change effects in decision support systems and suggesting adjustments to forest management. Our study elaborates on that more—even though Lithuania is a relatively small country and uniform climate change scenarios have been used for its whole area, we obtain spatially clustered results of climate change impacts on forest and forestry development. Different forest management strategies could be created for regions with different forest characteristics, and such aspects are currently disregarded in forest policy and management.
Climate change scenarios used in our study do not consider the development of disturbing factors, such as wind storms, attacks of pests, and diseases. The predictions achieved here are aimed to support strategic or long-term forest planning. Climate change-induced long-term changes in forest growth; however, are considered to have a more significant impact on forest conditions than both harvesting and natural disturbances [68]. We test only current forest management approaches, i.e., forest management specifications in Kupolis have been defined by best describing current forest management practices in Lithuania [41,42,43], or more precisely, as they have been during the last one to two decades. Lithuania has a strictly centralized forest management system, denying decision freedom of forest managers and owners and involving detailed planning, legal prescriptions, and scrupulous control [69,70]. Forestry is built around the concept of a normal forest, aimed at maximizing the even flow of timber implemented via forestland zoning by forest functions, strict rotation ages, and area control of age classes [71]. This makes the consideration of climate change in our projections easier; however, forestry becomes more vulnerable to management decisions made based on biased assumptions about the future. The EU BIOENERGY and REFERENCE scenarios developed by IIASA predict a higher demand for forest products and higher prices, reflecting the human effort to mitigate climate change. In our study, the supply from Lithuanian forests (the felling rate) is bound to the current forest management principles with rigid planning and fixed allowable rotations. Thus, we limited the positive economic effects of the markets to higher revenues following higher prices, but disregarded the potential for more intensive harvests. Increased growth results in larger volumes of harvested assortments and changing forest characteristics, including the ability to provide ecosystem services other than timber supply. Thus, all subsequent interpretations need to be considered in the context of current forest management approaches. The result would change if forest governance and management in Lithuanian becomes less rigidly regulated and more adaptive to future socio-economic contexts and climatic conditions.

4.2. Effects of Climate Change on Forests and Forestry

Summarizing the potential effects of climate change on Lithuanian forestry, we note both positive and negative impacts. First, the tree dimensions increase, resulting in a larger average diameter, the volume of growing stock, harvested assortments, and annual wood volume increment, consequently leading to higher profits of forestry activities. Some attributes that can be considered as proxies for biodiversity—the share of broadleaved tree species in the standing volume, the tree species diversity, and the felling rate—have smaller values under REFERENCE and EU BIOENERGY scenarios. This is a result of differences in increasing stand growth processed through forestry simulator. The development trajectories of some modeled attributes change from approximately the 2050–2070s. We associate this with historical facts of Lithuanian forestry: Large-scale afforestation with pine in the first post-WWII decades and the prioritization of spruce plantations since the 1970s [70], which will result in a huge amount of forest stands reaching a mature age in near future; and the ideological imprint of the normal forest theory from the classical German school on forest management principles aimed at volume accumulation. After the second half of the 21st century, positive changes occur in the trends of biodiversity-related attributes. The increases in forest productivity and timber harvesting-related attributes become less intensive compared to the nearest future, but the profit from forestry activities continues to grow because of increasing sawlog prices, as suggested in the IIASA scenarios.
To proceed with more detailed analyses of climate change effects on Lithuanian forestry, simulation results at a forest management unit level are used. Following the Law on Forests of the Republic of Lithuania [72], a five-year norm for the cutting area and maximum amount of harvested merchantable timber is approved by the Lithuanian Government for all state forests, which is estimated and distributed by regional branches of the state forest enterprise. State forest management practices are defined by a forest management plan for 10 years, which includes detailed management provisions, such as sequencing stands for thinning and final felling [70]. Forest management planning also includes adjusting the annual final cut area by prevailing tree species for each regional branch for the next five years, considering both the characteristics of available forests and provisions of norms for the cutting area by the Lithuanian Government. The annual cut area should guarantee stable harvesting by tree species during the next two decades. Therefore, in principle, this makes the regional branch of the state forest enterprise the most suitable unit for forecasts in state forests. Management of private forests in Lithuania is independent of state forest management, even though it is under the same ideological and legal forestry framework as state forests [73]. We discuss the development trends and the climate impacts aggregating all forests that geographically located inside the management area of the regional branch of the state forest enterprise. All official forestry statistics in Lithuania usually assign private forests to the corresponding management area of the state forest enterprise to geographically represent the data [49].
The relatively low forest felling rate in Lithuania has been associated in previous studies with current forest management practices, aimed at volume accumulation and strong disagreement of different stakeholders’ groups about whether it must be increased or even decreased [70,74]. Even though the potential to increase the timber supplies from Lithuanian forests without negative effects on other ecosystem services is significant [43,44,70], the potential increase in felling rate in the nearest future is debated, due to ideological imprints and political realities [70]. Our findings suggest that the felling rate, on average, can be lower under changing climate, under the condition that current forest management practices are continued. However, climate change effects on felling rate at the management unit level can vary considerably, also involving its increase in some areas. We obtained a statistically insignificant value of the slope at the individual management unit level, but a strongly clustered pattern if looking at the whole country. The felling rate is expected to decrease, due to climate effects in Southeast Lithuania, while it may increase in some northern management units, suggesting the need for a careful investigation if suggesting forest management strategies for these areas.
As the principles of management for volume shape much of the Lithuanian forestry, economic variables describing forestry development have been estimated as a post-modeling exercise using data of simulated amounts of harvested timber and the prices of assortments by tree species, elaborated separately, i.e., outside Kupolis. Optimizing the profits from forestry has never been among the tasks of the decision support system’s simulation under conditions of current forest management models. The current study has demonstrated the importance of economic variables in making the final judgement regarding the simulation outputs, e.g., no matter the larger increment and volumes of timber produced under the REFERENCE scenario, the larger positive increase in profits may be expected under the EU BIOENERGY scenario with less productivity, but steadily increasing prices of timber during the whole simulation period.
Numerous characteristics of current forests were tested as potential variables to explain the changing trajectories of forest development under climate change. We do not discuss the multiple regression models in detail as they were developed for modeled parameters. According to our findings, the terrain inside the management unit is a significant explanatory variable for practically all examined dependent variables, even though Lithuania is a relatively flat country. The proportion of Norway spruce—the species the most influenced by a warmer climate [15]—is another important variable. The third group of important explanatory variables is the probability of mortality, which is determined for current forests and incorporates several forest characteristics, like diameter and height, which are seldom significant if used individually. The best regression models developed (having the highest adjusted R2, Table S2), often involved the factors in principle slowing down the increasing effect of climate change (e.g., the proportion of aspen, grey alder, birch, or all broadleaved species), but missing those directly responsible for positive impacts, like the proportion of Norway spruce.

5. Conclusions

With this study, we validated decision support system-driven solution without inbuilt climate models to include global climate change, timber demand and price scenarios in simulating future trends of forest ecosystem services as a support for formulating long-term forest policies. The overall picture of future forests without the above-mentioned factors was demonstrated to be biased, consequently, leading to higher uncertainty in forest management decisions. We confirmed the geographic context and spatial scale to be important, considering both incorporating climate change effects in decision support system and suggesting adjustments to forest management. Notably, considerable spatial patterns of climate change impacts on forests and forestry development have been observed for a relatively small country like Lithuania.
In this study, which to our knowledge was the first national attempt to consider climate change effects in forest decision support system, we demonstrated some opportunities and risks for Lithuanian forestry. Climate change and human mitigation efforts may have both positive and negative effects. Basically, the increased forest productivity under a warmer climate results in larger tree dimensions, increasing volume of growing stock and harvested assortments, consequently leading to higher profits of forestry activities. A warmer climate is associated with a lower felling rate as, according to the current restrictive policies, moderate harvesting volumes would be maintained despite increased increment. However, negative impacts have been detected for the biodiversity-related attributes, i.e., the share of broadleaved tree species in the standing volume and the tree species diversity. Climate change effects, if they are analyzed at the level of management unit corresponding to the area of the regional branch of the state forest enterprise, result in spatially clustered patterns. The positive effects related to increases in stand productivity, and amount of harvested timber are concentrated in the regions with dominating coniferous species, while the same areas are exposed to stronger negative impacts on dynamics of biodiversity-related attributes. Current forest characteristics explain 70% or more of the variance of climate change effects on key forest and forestry attributes. Important characteristics of current forests in this aspect are related to the terrain in the management unit area and proportions of tree species and mortality probabilities. The potential to use all the advantages of climate change in Lithuania is limited by the current forest management concepts focused on volume accumulation.

Supplementary Materials

The following are available online at https://0-www-mdpi-com.brum.beds.ac.uk/1999-4907/10/9/809/s1, Table S1: Potential development of attributes, characterizing Lithuanian forests and forestry, during the period from 2020 until 2120, depending on future scenarios, Table S2: Best ordinary least square regression models explaining the effects of climate change on selected forest attributes.

Author Contributions

Conceptualization, G.M. and A.A.; Formal analysis, G.M. and N.P.; Investigation, G.M., N.P., G.Č., E.M., M.M. and A.A.; Methodology, G.M.; Project administration, G.M. and A.A.; Software, G.M.; Writing—original draft, G.M.; Writing—review and editing, V.B., N.P., G.Č., E.M., S.B., V.M., M.M., V.D., V.U. and A.A.

Funding

The study was implemented within the frames of two projects: (1) project ALTERFOR within the Horizon 2020 research and innovation program under grant agreement No 676754 and (2) the National Research Program “Sustainability of agro-, forest, and water ecosystems” project FOREstRESS (No. SIT-3/2015).

Conflicts of Interest

The authors declare no conflict of interest.

Appendix A

Table A1. Assessed forest attributes.
AttributeUnitsExplanationReferences
Standing volumem3/haGross remaining wood volume of the living trees after harvest and mortality in the preceding period
The relative share of broadleaved tree species in the standing volumePercent
Area-weighted average height of stands at the unit of forest managementm
Area-weighted average diameter at breast heightm
Area-weighted average ageYears
Tree species diversity at the end of each simulation stepShannon diversity indexThe index was calculated considering the volume proportions of all available tree species at forest management unit[75]
Gross volume of the trees that died, due to natural mortality during the preceding periodm3/haTo obtain the figures on mortality rates, we used data from permanent sample plots of the Lithuanian national forest inventory (NFI) referring to three 5-year inventory cycles in 1998–2016. Using detailed information on volumes of trees that died, were harvested, and remained growing on the NFI sample plots, annual mortality models were developed by the State Forest Service for nine main tree species[76]
Probability of tree mortality, due to wind, diseases, and competitionPercentBinary logistic regression models for the mortality were developed using data from permanent sample plots of Lithuanian NFI and following the approaches described in references. Soil fertility gradient, soil humidity gradient, age, height, and diameter of prevailing tree species in the stand; mean height and diameter of the stand; site index; ownership; and forest group (forest group defines the forest management regime) were the variables used as model predictors. Models were developed for eight tree species groups (pine, spruce, birch, black alder, aspen, grey alder, oak, and ash), all of which were statistically significant. Probability of tree mortality was used to describe current forest conditions only[77,78]
Volume of harvest residues and sawlogs, pulpwood, and logs remaining in the forest during the simulation periodm3/ha/yearThe distribution of harvested timber by assortments and their prices were taken from the state forestry statistics of the last five years from 2013 to 2018. To reduce the number of assortment categories, the pulpwood volume also included the volume of roundwood for particleboard and firewood[79]
Net volume incrementm3/ha/yearVolume Increment [t + 1] = (Standing Volume [t + 1]—Standing Volume [t] + Harvest Volume [t + 1] + Mortality Volume [t + 1])/10where t and t + 1 are two subsequent points of time (e.g., t: 2020, t + 1: 2030)
Felling ratesPercentFelling as percent of net annual increment
Costs, revenues, and profits from forestry activities during each simulation periodEur
Eur/ha
Total values and values per 1 ha of the forested area at forest management unit
Table A2. Types of forestry-related expenses used to estimate the costs of silvicultural activities.
Type of CostsUnitsExplanationReferences
Afforestation and reforestation costsEur/haCosts are based on the figures available from the “Order of payments for afforestation, forest tending and protection” by National Paying Agency. The same source was used to estimate all other costs per ha, including the pre-commercial thinning costs[80]
Costs to support natural regenerationEur/haCalculated for all natural pine, oak, and ash stands with an age of 10 years or less at the end of each simulation period
Tending costsEur/haEstimated for young stands up to seven years for coniferous (three occasions of tending) and noble deciduous, and five for the remaining deciduous tree species (two occasions)
Costs of pre-commercial thinningEur/m3Estimated based on the volume cut and the thinning intensity
Commercial thinning and final harvesting costsEur/m3Estimated based on volumes of merchantable timber to be harvested and expert-based knowledge of commercial harvesting costs, supported by direct timber harvesting, extraction, and transportation, as well as selling administration costs in the Lithuanian State forestry sector during 2014–2016.
Table A3. Average timber price (in Eur/m3) by tree species, IIASA scenarios, and cutting type during the simulation period.
Tree SpeciesPrice by Decades
201020202030204020502060207020802090210020102020
REFERENCE, final cutting
Pine40.4040.8540.3443.3062.3163.3063.3269.4073.7676.8179.8682.91
Spruce35.2236.1436.0235.8150.6450.4650.4854.3157.0558.9860.9062.82
Oak93.0792.4690.67103.61142.95147.55147.61162.68173.47181.01188.55196.09
Ash34.5634.3733.8137.8850.2651.7051.7256.4659.8662.2364.6066.97
Birch37.4938.3438.2537.9051.1450.9350.9454.3056.7158.4060.0961.77
Black alder24.1624.0423.7126.1233.4534.3134.3237.1239.1340.5441.9443.35
Aspen18.3818.6218.5518.7523.5423.5823.5924.9225.8726.5427.2127.88
Grey alder10.8910.8710.7911.3112.8813.0613.0713.6714.1014.4014.7015.00
EU BIOENERGY, final cutting
Pine40.4040.3640.8543.1643.5552.9658.8966.7170.4975.3680.2485.11
Spruce35.2235.0635.0235.8635.5641.4845.2151.0553.9957.7561.5065.26
Oak93.0793.3595.51102.90105.36128.68143.36160.24168.08178.28188.49198.70
Ash34.5634.6535.3337.6638.4345.7750.3955.6958.1661.3764.5867.79
Birch37.4937.3337.2737.9537.6542.8446.1251.3153.9457.2960.6564.00
Black alder24.1624.2124.6125.9926.4530.7933.5336.6738.1340.0341.9343.83
Aspen18.3818.3518.3718.7418.7120.7722.0723.9824.9326.1527.3728.59
Grey alder10.8910.9010.9911.2811.3812.3112.9013.5713.8814.2914.7015.11
REFERENCE, intermediate cutting
Pine36.7037.1136.6439.3356.6057.5057.5263.0467.0069.7772.5475.31
Spruce21.8322.4022.3222.1931.3831.2831.2933.6635.3636.5537.7438.93
Oak67.7067.2665.9675.37103.99107.34107.38118.34126.19131.68137.17142.65
Ash27.7727.6127.1630.4340.3741.5341.5545.3648.0849.9951.9053.80
Birch29.5030.1830.1029.8340.2540.0840.0942.7444.6345.9647.2948.62
Black alder17.3017.2116.9718.7023.9524.5624.5726.5828.0229.0230.0331.03
Aspen16.2816.4916.4316.6020.8520.8820.8922.0722.9123.5024.1024.69
Grey alder8.388.378.318.719.9210.0610.0610.5210.8511.0911.3211.55
EU BIOENERGY, intermediate cutting
Pine36.7036.6737.1139.2139.5648.1153.4960.5964.0368.4672.8877.31
Spruce21.8321.7321.7022.2222.0425.7128.0231.6433.4635.7938.1240.45
Oak67.7067.9169.4874.8676.6493.61104.29116.57122.27129.70137.12144.55
Ash27.7727.8428.3830.2530.8736.7640.4844.7446.7249.3051.8854.46
Birch29.5029.3829.3329.8729.6333.7236.2940.3842.4545.0947.7350.37
Black alder17.3017.3317.6218.6118.9322.0424.0026.2527.3028.6630.0231.38
Aspen16.2816.2516.2716.6016.5718.3919.5421.2422.0823.1624.2425.32
Grey alder8.388.398.468.698.769.489.9310.4510.6911.0011.3211.63
Table A4. Results of tests for the presence of global spatial autocorrelation of the slope.
Forest AttributeResults of Tests by Climate Change Scenario
REFERENCEEU BIOENERGY
Moran’s I Index Valuez-Scorep-ValueMoran’s I Index Valuez-Scorep-Value
Standing volume in 1 ha0.5114.2050.0000.4974.0850.000
Average diameter of all forest stands0.5984.8940.0000.6345.1690.000
Annual wood volume increment0.6555.3300.0000.6725.4480.000
Annual natural mortality0.6084.9450.0000.5864.7740.000
Relative share of broadleaved tree species in the standing volume0.4223.3520.0000.4153.4660.000
Tree species diversity0.3532.9790.0030.3232.7410.006
Volume of sawlogs harvested annually0.4193.4990.0000.3723.1390.002
Volume of pulpwood harvested annually0.4173.4580.0010.3873.2290.001
Annual volume of harvesting residues0.4203.5000.0000.3803.1860.001
Felling rate0.5364.3910.0000.4954.0750.000
Profit from forestry activities0.4263.5210.0000.3212.7330.000

References

  1. Walther, G.R. Plants in a warmer world. Perspect. Plant Ecol. 2003, 6, 169–185. [Google Scholar] [CrossRef]
  2. Lindner, M.; Maroschek, M.; Netherer, S.; Kremer, A.; Barbati, A.; Garcia-Gonzalo, J.; Seidl, R.; Delzon, S.; Corona, P.; Kolström, M.; et al. Climate change impacts, adaptive capacity, and vulnerability of European forest ecosystems. Ecol. Manag. 2010, 259, 698–709. [Google Scholar] [CrossRef]
  3. De Vries, W.; Solberg, S.; Dobbertin, M.; Sterbad, H.; Laubhannd, D.; van Oijene, M.; Evansf, C.; Gunderseng, P.; Krosa, J.; Wamelinka, G.W.W.; et al. The impact of nitrogen deposition on carbon sequestration in European forests and heathlands. For. Ecol. Manag. 2009, 258, 1814–1823. [Google Scholar] [CrossRef]
  4. Solberg, S.; Dobbertin, M.; Reinds, G.J.; Lange, H.; Andreassen, K.; Fernandez, P.G.; Hildingsson, A.; De Vries, W. Analyses of the impact of changes in atmospheric deposition and climate on forest growth in European monitoring plots: A stand growth approach. Ecol. Manag. 2009, 258, 1735–1750. [Google Scholar] [CrossRef]
  5. Dobbertin, M.; Neumann, M.; Schroeck, H.-W. Tree Growth Measurements in Long-Term Forest Monitoring in Europe. Persistent Org. Pollut. Asia Sources Distrib. Transp. Fate 2013, 12, 183–204. [Google Scholar]
  6. Augustaitis, A. Impact of Meteorological Parameters on Responses of Pine Crown Condition to Acid Deposition at Aukštaitija National Park. Balt. For. 2011, 17, 205–214. [Google Scholar]
  7. Juknys, R.; Augustaitis, A.; Venclovienė, J.; Kliučius, A.; Adomas, V.; Bartkevičius, E.; Jurkonis, N. Dynamic response of tree growth to changing environmental pollution. Eur. J. For. Res. 2014, 133, 713–724. [Google Scholar] [CrossRef]
  8. Vuorenmaa, J.; Augustaitis, A.; Beudert, B.; Clarke, N.; de Wit, H.A.; Dirnböck, T.; Frey, J.; Forsius, M.; Indriksone, I.; Kleemola, S.; et al. Long-term sulphate and inorganic nitrogen mass balance budgets in European ICP Integrated Monitoring catchments (1990–2012). Ecol. Indic. 2017, 76, 15–29. [Google Scholar] [CrossRef]
  9. De Vries, W.; Posch, M. Modelling the impact of nitrogen deposition, climate change and nutrient limitations on tree carbon sequestration in Europe for the period 1900–2050. Environ. Pollut. 2011, 159, 2289–2299. [Google Scholar] [CrossRef]
  10. De Vries, W.; Dobbertin, M.H.; Solberg, S.; Van Dobben, H.F.; Schaub, M. Impacts of acid deposition, ozone exposure and weather conditions on forest ecosystems in Europe: An overview. Plant. Soil 2014, 380, 1–45. [Google Scholar] [CrossRef]
  11. Augustaitis, A.; Augustaitiene, I.; Mozgeris, G.; Juknys, R.; Vitas, A.; Jasinevičiene, D. Growth patterns of Scots pine (Pinus sylvestris L.) under the current regional pollution load in Lithuania. iFor.-Biogeosc. For. 2015, 8, 509–516. [Google Scholar] [CrossRef]
  12. Augustaitis, A.; Augustaitienė, I.; Činga, G.; Mažeika, J.; Deltuvas, R.; Juknys, R.; Vitas, A. Did the Ambient Ozone Affect Stem Increment of Scots Pines (Pinus sylvestris L.) on Territories under Regional Pollution Load? Step III of Lithuanian Studies. Sci. World J. 2007, 7, 58–66. [Google Scholar] [CrossRef] [PubMed]
  13. Augustaitis, A.; Augustaitienė, I.; Kliučius, A.; Pivoras, G.; Šopauskienė, D.; Girgždienė, R. The seasonal variability of air pollution effects on pine conditions under changing climates. Eur. J. For. Res. 2010, 129, 431–441. [Google Scholar] [CrossRef]
  14. Augustaitis, A.; Šopauskienė, D.; Baužienė, I. Direct and Indirect Effects of Regional Air Pollution on Tree Crown Defoliation. Balt. For. 2010, 16, 23–34. [Google Scholar]
  15. Augustaitis, A.; Augustaitienė, I.; Baumgarten, M.; Bičenkienė, S.; Girgždienė, R.; Kulbokas, G.; Linkevičius, E.; Marozas, V.; Mikalajūnas, M.; Mordas, G.; et al. Tree-ring formation as an indicator of forest capacity to adapt to the main threats of environmental changes in Lithuania. Sci. Total Environ. 2018, 615, 1247–1261. [Google Scholar] [CrossRef] [PubMed]
  16. Bringmark, L.; Lundin, L.; Augustaitis, A.; Beudert, B.; Dieffenbach-Fries, H.; Dirnböck, T.; Grabner, M.T.; Hutchins, M.; Kram, P.; Lyulko, I.; et al. Trace Metal Budgets for Forested Catchments in Europe—Pb, Cd, Hg, Cu and Zn. Water Air Soil Pollut. 2013, 224, 1502. [Google Scholar] [CrossRef]
  17. Carpenter, S.; Walker, B.; Anderies, J.M.; Abel, N. From Metaphor to Measurement: Resilience of What to What? Ecosystems 2001, 4, 765–781. [Google Scholar] [CrossRef]
  18. Augustaitis, A. Pine sawfly (Diprion pini L.)—Related changes in Scots pine crown defoliation and possibilities of recovery. Pol. J. Environ. Stud. 2007, 16, 363–369. [Google Scholar]
  19. Vanoni, M.; Bugmann, H.; Nötzli, M.; Bigler, C. Drought and frost contribute to abrupt growth decreases before tree mortality in nine temperate tree species. Ecol. Manag. 2016, 382, 51–63. [Google Scholar] [CrossRef] [Green Version]
  20. Allen, C.D.; Breshears, D.D.; McDowell, N.G. On underestimation of global vulnerability to tree mortality and forest die-off from hotter drought in the Anthropocene. Ecosphere 2015, 6, 1–55. [Google Scholar] [CrossRef]
  21. Paris Agreement, FCCC/CP/2015/10/Add.1. United Nations Framework Convention on Climate Change. 2015. Available online: https://unfccc.int/files/meetings/paris_nov_2015/application/pdf/paris_agreement_english_.pdf (accessed on 27 November 2018).
  22. Grassi, G.; House, J.; Dentener, F.; Federici, S.; Elzen, M.D.; Penman, J. The key role of forests in meeting climate targets requires science for credible mitigation. Nat. Clim. Chang. 2017, 7, 220–226. [Google Scholar] [CrossRef]
  23. Luyssaert, S.; Marie, G.; Valade, A.; Chen, Y.-Y.; Djomo, S.N.; Ryder, J.; Otto, J.; Naudts, K.; Lansø, A.S.; Ghattas, J.; et al. Trade-offs in using European forests to meet climate objectives. Nat. Cell Boil. 2018, 562, 259–262. [Google Scholar] [CrossRef] [PubMed]
  24. Blennow, K.; Persson, J.; Tome, M.; Hanewinkel, M. Climate Change: Believing and Seeing Implies Adapting. PLoS ONE 2012, 7, 50182. [Google Scholar] [CrossRef] [PubMed]
  25. United Nations. Non-Legally Binding Authoritative Statement of Principles for a Global Consensus on the Management, Conservation and Sustainable Development of All Types of Forests; United Nations: New York, NY, USA, 1992. [Google Scholar]
  26. Millennium Ecosystem Assessment. Ecosystems and Human Well-Being: A Framework for Assessment; Island Press: Washington, DC, USA, 2005. [Google Scholar]
  27. Rauscher, H. Ecosystem management decision support for federal forests in the United States: A review. Ecol. Manag. 1999, 114, 173–197. [Google Scholar] [CrossRef]
  28. Reynolds, K.M. Integrated decision support for sustainable forest management in the United States: Fact or fiction? Comput. Electron. Agric. 2005, 49, 6–23. [Google Scholar] [CrossRef]
  29. Twery, M.J.; Knopp, P.D.; Thomasma, S.A.; Rauscher, H.M.; Nute, D.E.; Potter, W.D.; Maier, F.; Wang, J.; Dass, M.; Uchiyama, H.; et al. NED-2: A decision support system for integrated forest ecosystem management. Comput. Electron. Agric. 2005, 49, 24–43. [Google Scholar] [CrossRef] [Green Version]
  30. Reynolds, K.; Twery, M.; Lexer, M.; Vacik, H.; Ray, D.; Shao, G.; Borges, J. Decision support systems in natural resource management. In Handbook on Decision Support Systems. Springer, International Handbooks on Information Systems Series, Handbook on Decision Support System; Burstein, F., Holsapple, C., Eds.; Springer: Berlin, Germany, 2008; pp. 499–534. [Google Scholar]
  31. Biber, P.; Borges, J.; Moshammer, R.; Barreiro, S.; Botequim, B.; Brodrechtová, Y.; Brukas, V.; Chirici, G.; Cordero-Debets, R.; Corrigan, E.; et al. How sensitive are ecosystem services in European forest landscapes to silvicultural treatment? Forests 2015, 6, 1666–1695. [Google Scholar] [CrossRef]
  32. Orazio, C.; Cordero Montoya, R.; Régolini, M.; Borges, J.; Garcia-Gonzalo, J.; Barreiro, S.; Botequim, B.; Marques, S.; Sedmák, R.; Smrĕcek, R.; et al. Decision Support Tools and Strategies to Simulate Forest Landscape Evolutions Integrating Forest Owner Behaviour: A Review from the Case Studies of the European Project, INTEGRAL. Sustainability 2017, 9, 599. [Google Scholar] [CrossRef]
  33. Packalen, T.; Sallnas, O.; Sirkia, S.; Korhonen, K.; Salminen, O.; Vidal, C.; Robert, N.; Colin, A.; Belouard, T.; Schadauer, K.; et al. The European Forestry Dynamics Model.: Concept, Design and Results of First Case Studies; Publications Office of the European Union: Brussels, Belgium, 2014; EUR 27004. [Google Scholar]
  34. Reyer, C.; Lasch-Born, P.; Suckow, F.; Gutsch, M.; Murawski, A.; Pilz, T. Projections of regional changes in forest net primary productivity for different tree species in Europe driven by climate change and carbon dioxide. Ann. For. Sci. 2014, 71, 211–225. [Google Scholar] [CrossRef]
  35. Schelhaas, M.-J.; Nabuurs, G.-J.; Hengeveld, G.; Reyer, C.; Hanewinkel, M.; Zimmermann, N.E. Alternative forest management strategies to account for climate change-induced productivity and species suitability changes in Europe. Reg. Environ. Chang. 2015, 15, 1581–1594. [Google Scholar] [CrossRef] [Green Version]
  36. Nordström, E.-M.; Nieuwenhuis, M.; Başkent, E.Z.; Biber, P.; Black, K.; Borges, J.G.; Bugalho, M.N.; Corradini, G.; Corrigan, E.; Eriksson, L.O.; et al. Forest decision support systems for the analysis of ecosystem services provisioning at the landscape scale under global climate and market change scenarios. Eur. J. For. Res. 2019, 138, 561–581. [Google Scholar] [CrossRef]
  37. Barreiro, S.; Schelhaas, M.J.; Kändler, G.; Antón-Fernández, C.; Colin, A.; Bontemps, J.D.; Alberdi, I.; Condés, S.; Dumitru, M.; Ferezliev, A.; et al. Overview of methods and tools for evaluating future woody biomass availability in European countries. Ann. For. Sci. 2016, 73, 823–837. [Google Scholar] [CrossRef] [Green Version]
  38. Nobre, S.; Eriksson, L.-O.; Trubins, R. The use of decision support systems in forest management: Analysis of FORSYS country reports. Forests 2016, 7, 72. [Google Scholar] [CrossRef]
  39. Vacik, H.; Lexer, M.J. Past, current and future drivers for the development of decision support systems in forest management. Scand. J. For. Res. 2014, 29, 2–19. [Google Scholar] [CrossRef]
  40. Lundholm, A.; Corrigan, E.; Nieuwenhuis, M. Implementing climate change and associated future timber price trends in a decision support system designed for Irish forest management and applied to Ireland’s Western Peatland forests. Forests 2019, 10, 270. [Google Scholar] [CrossRef]
  41. Petrauskas, E.; Kuliešis, A. Scenario-based analysis of possible management alternatives for Lithuanian forests in the 21st century. Balt. For. 2004, 10, 72–82. [Google Scholar]
  42. Mozgeris, G.; Brukas, V.; Stanislovaitis, A.; Kavaliauskas, M.; Palicinas, M. Owner mapping for forest scenario modelling—A Lithuanian case study. For. Policy Econ. 2017, 85, 235–244. [Google Scholar] [CrossRef]
  43. Mozgeris, G.; Kavaliauskas, M.; Brukas, V.; Stanislovaitis, A. Assessment of timber supply under alternative contextual scenarios. For. Policy Econ. 2019, 103, 36–44. [Google Scholar] [CrossRef]
  44. Jasinevičius, G.; Lindner, M.; Verkerk, P.J.; Aleinikovas, M. Assessing Impacts of Wood Utilisation Scenarios for a Lithuanian Bioeconomy: Impacts on Carbon in Forests and Harvested Wood Products and on the Socio-Economic Performance of the Forest-Based Sector. Forests 2017, 8, 133. [Google Scholar] [CrossRef]
  45. Pang, X.L.; Trubins, R.; Lekavicius, V.; Galinis, A.; Mozgeris, G.; Kulbokas, G.; Mörtberg, U. Forest bioenergy feedstock in Lithuania—Renewable energy goals and the use of forest resources. Energy Strategy Rev. 2018, 24, 244–253. [Google Scholar] [CrossRef]
  46. Bohn, U.; Gollub, G.; Hettwer, C.; Weber, H.; Neuhäuslová, Z.; Raus, T.; Schlüter, H. Karte der Natürlichen Vegetation Europas/Map of the Natural Vegetation of Europe. Maßstab/Scale 1:2,500,000; Landwirtschaftsverlag: Münster, Germany, 2003. [Google Scholar]
  47. Laasimer, L.; Kuusk, V.; Tabaka, L.; Lekavičius, A. Flora of the Baltic Countries: Compendium of Vascular Plants; Institute of Zoology and Botany, Estonian Agricultural University: Tartu, Estonia, 1993; Volume 1. [Google Scholar]
  48. Karazija, S. Lietuvos Miško Tipai [Forest Types in Lithuania]; Mokslas: Vilnius, Lithuania, 1998; pp. 46–48. (In Lithuanian) [Google Scholar]
  49. Lithuanian Statistical Yearbook of Forestry 2018, Ministry of Environment, State Forest Service. Available online: http://www.amvmt.lt/index.php/leidiniai/misku-ukio-statistika/2018 (accessed on 6 May 2019).
  50. State Forest Service. 2018; Miškų Kadastras Forest Cadastre. Available online: http://www.amvmt.lt/index.php/kadastras (accessed on 27 November 2018).
  51. Forsell, N.; Korosuo, A. Milestone 6—Global and Country Specific Prospective Scenarios. Project ALTERFOR Report. 2016, p. 20. Available online: https://www.alterfor-project.eu/files/alterfor/download/Deliverables/MS%206%20Global%20and%20country%20specific%20scenarios_1.pdf (accessed on 27 November 2018).
  52. Forsell, N.; Korosuo, A.; Havlík, P.; Valin, H.; Lauri, P.; Gusti, M.; Kindermann, G.; Obersteiner, M.; Böttcher, H.; Hennenberg, K.; et al. Study on Impacts on Resource Efficiency of Future EU Demand for Bioenergy (ReceBio); Final Report. Project: ENV.F.1/ETU/2013/0033; Publications Office of the European Union: Luxembourg, 2016; 43p. [Google Scholar]
  53. Fricko, O.; Havlik, P.; Rogelj, J.; Klimont, Z.; Gusti, M.; Johnson, N.; Kolp, P.; Strubegger, M.; Valin, H.; Amann, M.; et al. The marker quantification of the Shared Socioeconomic Pathway 2: A middle-of-the-road scenario for the 21st century. Environ. Chang. 2017, 42, 251–267. [Google Scholar] [CrossRef] [Green Version]
  54. Kuliešis, A. Lietuvos Medynų Prieaugio ir jo Panaudojimo Normatyvai Forest Yield Models and Tables in Lithuania; Girios Aidas: Kaunas, Lithuania, 1993; 383p. [Google Scholar]
  55. Salmi, T.; Anu Määttä, A.; Anttila, P.; Ruoho-Airola, T.; Amnell, T. Detecting Trends of Annual Values of Atmospheric Pollutants by the Mann-Kendall Test and Sen’s Slope Estimates—The Excel Template Application MAKESENS. Finnish Meteorological Institute, Air Quality Research, Publications on Air Quality No. 31, Report Code FMI-AQ-31. 2002. Available online: https://www.researchgate.net/publication/259356944 (accessed on 9 December 2018).
  56. State Forest Service. Miškotvarkos Darbų Vykdymo Instrukcija Specifications of Forest Management Planning. 2010. Available online: https://www.e-tar.lt/portal/lt/legalAct/TAR.44E2BF82EF29/WIPCyylDED (accessed on 7 January 2019).
  57. Forest Europe; Liaison Unit Oslo. State of Europe’s Forests 2011. Status and Trends in Sustainable Forest Management in Europe. In Proceedings of the Ministerial Conference on the Protection of Forests in Europe, Oslo, Norway, 14–16 June 2011; Forest Europe: Madrid, Spain; Liaison Unit Oslo: Madrid, Spain, 2011. [Google Scholar]
  58. Aleksandras Stulginskis University. Project Development for a Forest Management and Land Use Scenario Modeling Subsystem within the National Forest Inventory Information System; Final Report; Research Project is Implemented Following the Conditions of the Agreement between Aleksandras Stulginskis University and State Forest Service No. 22 from 26 May 2016; Aleksandras Stulginskis University: Akademija, Lithuania, 2017; 411p. [Google Scholar]
  59. Martínez-Vilalta, J.; López, B.C.; Adell, N.; Badiella, L.; Ninyerola, M. Twentieth century increase of Scots pine radial growth in NE Spain shows strong climate interactions. Glob. Chang. Biol. 2008, 14, 2868–2881. [Google Scholar] [CrossRef] [Green Version]
  60. Loustau, D.; Bosc, A.; Colin, A.; Ogée, J.; Davi, H.; François, C.; Dufrêne, E.; Déqué, M.; Cloppet, E.; Arrouays, D.; et al. Modeling climate change effects on the potential production of French plains forests at the sub-regional level. Tree Physiol. 2005, 25, 813–823. [Google Scholar] [CrossRef] [PubMed] [Green Version]
  61. Cabrera Berned, A.; Nieuwenhuis, M. The potential impact of intensification on forest productivity under different climate change scenarios. Irish For. 2017, 74, 40–60. [Google Scholar]
  62. Biber, P.; Nieuwenhuis, M.; Black, K.; Borga, M.; Borges, J.-G.; Felton, A.; Hoogstra-Klein, M.; Lindbladh, M.; Zoccatelli, D. Deliverable 3.2—Synthesis Report: Discrepancies between ES needs and ES Outputs under Current FMMs. 2018. Available online: https://alterfor-project.eu/files/alterfor/download/Deliverables/D3.2%20Synthesis%20report.pdf (accessed on 6 July 2019).
  63. Bergh, J.; Freeman, M.; Sigurdsson, B.; Kellomäki, S.; Laitinen, K.; Niinistö, S.; Peltola, H.; Linder, S. Modelling the short-term effects of climate change on the productivity of selected tree species in Nordic countries. For. Ecol. Manag. 2003, 183, 327–340. [Google Scholar] [CrossRef]
  64. Lexer, M.; Hönninger, K.; Scheifinger, H.; Matulla, C.; Groll, N.; Kromp-Kolb, H.; Schadauer, K.; Starlinger, F.; Englisch, M. The sensitivity of Austrian forests to scenarios of climatic change: A large-scale risk assessment based on a modified gap model and forest inventory data. For. Ecol. Manag. 2002, 162, 53–72. [Google Scholar] [CrossRef]
  65. Fürstenau, C.; Badeck, F.W.; Lasch, P.; Lexer, M.J.; Lindner, M.; Mohr, P.; Suckow, F. Multiple-use forest management in consideration of climate change and the interests of stakeholder groups. Eur. J. For. Res. 2007, 126, 225–239. [Google Scholar] [CrossRef]
  66. Briceno-Elizondo, E.; Garcia-Gonzalo, J.; Peltola, H.; Matala, J.; Kellomäki, S. Sensitivity of growth of Scots pine, Norway spruce and silver birch to climate change and forest management in boreal conditions. For. Ecol. Manag. 2006, 232, 152–167. [Google Scholar] [CrossRef]
  67. Garcia-Gonzalo, J.; Peltola, H.; Briceño-Elizondo, E.; Kellomäki, S. Effects of climate change and management on timber yield in boreal forests, with economic implications: A case study. Ecol. Model. 2007, 209, 220–234. [Google Scholar] [CrossRef]
  68. Boulanger, Y.; Taylor, A.R.; Price, D.T.; Cyr, D.; Sainte-Marie, G. Stand-level drivers most important in determining boreal forest response to climate change. J. Ecol. 2018, 106, 977–990. [Google Scholar] [CrossRef]
  69. Makrickiene, E.; Mozgeris, G.; Brukas, V.; Brodrechtova, Y.; Sedmak, R.; Salka, J. From command-and-control to good forest governance: A critical comparison between Lithuania and Slovakia. For. Policy Econ. 2019. (Submitted Manuscript). [Google Scholar]
  70. Brukas, V.; Kuliešis, A.; Sallnäs, O.; Linkevičius, E. Resource availability, planning rigidity and Realpolitik in Lithuanian forest utilization. Nat. Resour. Forum 2011, 35, 77–88. [Google Scholar] [CrossRef]
  71. Brukas, V. New World, Old Ideas—A Narrative of the Lithuanian Forestry Transition. J. Environ. Policy Plan. 2015, 17, 495–515. [Google Scholar] [CrossRef]
  72. Seimas of the Republic of Lithuania. Lietuvos Respublikos Miškų Įstatymas Law on Forests of the Republic of Lithuania. 1994. Available online: https://www.e-tar.lt/portal/lt/legalAct/TAR.5D6D055CC00C/vyZMmKTQnZ (accessed on 7 January 2019).
  73. Stanislovaitis, A.; Brukas, V.; Kavaliauskas, M.; Mozgeris, G. Forest owner is more than her goal: A qualitative typology of Lithuanian owners. Scand. J. 2015, 30, 1–14. [Google Scholar] [CrossRef]
  74. Brukas, V.; Weber, N. Forest Management after the Economic Transition—At the Crossroads between German and Scandinavian Traditions. For. Policy Econ. 2009, 11, 586–592. [Google Scholar] [CrossRef]
  75. Begon, M.; Townsend, C.A.; Harper, J.L. Ecology: From Individuals to Ecosystems, 4th ed.; Blackwell Publishing: Oxford, UK, 2006; 738p. [Google Scholar]
  76. Kuliešis, A.; Kasperavičius, A.; Kulbokas, G. Lithuania (Book Chapter) National Forest Inventories: Assessment of Wood Availability and Use; Springer: Cham, Switzerland, 2016; pp. 521–547. [Google Scholar]
  77. Borges, J.G.; Tomé, M.; Garcia-Gonzalo, J.; Marques, S.; Botequim, B.; Oliveira, M. A three-step approach to post-fire mortality modelling in maritime pine (Pinus pinaster Ait) stands for enhanced forest planning in Portugal. For. Int. J. 2011, 84, 197–206. [Google Scholar]
  78. Marques, S.; Garcia-Gonzalo, J.; Botequim, B.; Ricardo, A.; Borges, J.G.; Tomé, M.; Oliveira, M.M. Assessing wildfire occurrence probability in Pinus pinaster Ait. stands in Portugal. For. Syst. 2012, 21, 111–120. [Google Scholar] [CrossRef]
  79. State Company State Forest Enterprise. 2018. Available online: https://www.vivmu.lt/lt/ (accessed on 27 November 2018).
  80. National Paying Agency. Order of Payments for Afforestation, Forest Tending and Protection. Available online: https://www.nma.lt/index.php/parama/12?date_from=&date_to=&program=8661&measure=&tab=1&filters=1 (accessed on 7 January 2019).
Figure 1. Basic characteristics of the study area to date: (a) Location of Lithuania in Europe, (b) average age of all forest stands, (c) average standing volume in 1 ha, (d) volume proportion of Scots pine, (e) volume proportion of Norway spruce, and (f) volume proportion of deciduous trees (produced based on data from forest state cadaster [50]).
Forests 10 00809 g001
Figure 2. Some parameters of the International Institute for Applied Systems Analysis (IIASA) scenarios: (a) Industrial roundwood demand, total harvest, in millions of m3/year, under bark; (b) sawlog prices, national average price per m3 (exchange rate in 2010), at the industry gate; (c) pulpwood prices, national average price per m3 (exchange rate in 2010), at the industry gate.
Forests 10 00809 g002
Figure 3. Flowchart summarizing the overall structure of the study.
Forests 10 00809 g003
Figure 4. Selected attributes of Lithuanian forests at specific time points, depending on future scenarios: (a) Standing volume in 1 ha, (b) average diameter of all forest stands, (c) relative share of broadleaved tree species in the standing volume, and (d) tree species diversity.
Forests 10 00809 g004
Figure 5. Selected attributes of Lithuanian forests during certain simulation steps, depending on future scenarios: (a) Volume of annually harvested timber, (b) annual natural mortality, (c) annual wood volume increment, (d) profit from forestry activities, and (e) felling rate.
Forests 10 00809 g005
Figure 6. Pattern of climate change effects on selected dendrometric attributes in Lithuanian forests during next 100 years from 2020 to 2120: (a) Standing volume in 1 ha, REFERENCE scenario, (b) standing volume in 1 ha, EU BIOENERGY scenario, (c) average diameter of all forest stands, REFERENCE scenario, (d) average diameter of all forest stands, EU BIOENERGY scenario, (e) annual wood volume increment, REFERENCE scenario, (f) annual wood volume increment, EU BIOENERGY scenario.
Forests 10 00809 g006
Figure 7. Pattern of climate change effects on selected biodiversity-related attributes in Lithuanian forests during the next 100 years from 2020 to 2120: (a) Annual natural mortality, REFERENCE scenario, (b) annual natural mortality, EU BIOENERGY scenario, (c) relative share of broadleaved tree species in the standing volume, REFERENCE scenario, (d) relative share of broadleaved tree species in the standing volume, EU BIOENERGY scenariI (e) tree species diversity, REFERENCE scenario, (f) tree species diversity, EU BIOENERGY scenario.
Forests 10 00809 g007
Figure 8. Pattern of climate change effects on volumes of major assortments of harvested timber in Lithuanian forests during the next 100 years from 2020 to 2120: (a) Volume of sawlogs harvested annually, REFERENCE scenario, (b) volume of sawlogs harvested annually, EU BIOENERGY scenario, (c) volume of pulpwood harvested annually, REFERENCE scenario, (d) volume of pulpwood harvested annually, EU BIOENERGY scenIo, (e) annual volume of harvesting residues, REFERENCE scenario, (f) annual volume of harvesting residues, EU BIOENERGY scenario.
Forests 10 00809 g008
Figure 9. Pattern of climate change effects on harvesting intensity and economic efficiency of forestry in Lithuanian forests during the next 100 years from 2020 to 2120: (a) Felling rate, REFERENCE scenario, (b) felling rate, EU BIOENERGY scenario, (c) profit from forestry activities, REFERENCE scenario, (d) profit from forestry activities, EU BIOENERGY scenario.
Forests 10 00809 g009
Figure 10. Hot spots, cold spots, and spatial outliers of climate change effects on selected key forestry attributes in Lithuanian forests during the next 100 years from 2020 to 2120: (a) Annual wood volume increment, REFERENCE scenario, (b) annual wood volume increment, EU BIOENERGY scenario, (c) profit from forestry activities, REFERENCE scenario, (d) profit from forestry activities, EU BIOENERGY sIario, (e) felling rate, REFERENCE scenario, (f) felling rate, EU BIOENERGY scenario.
Forests 10 00809 g010
Figure 11. Highest proportions of variance explained in ordinary least square regression models describing the change of key forest and forestry characteristics, due to climate change.
Forests 10 00809 g011
Figure 12. The proportions of times that each candidate explanatory variable was statistically significant when testing all potential regression models: (a) REFERENCE scenario, (b) EU BIOENERGY scenario.
Forests 10 00809 g012
Figure 13. The stability of candidate explanatory variables in tested regression models: (a) REFERENCE scenario, (b) EU BIOENERGY scenario.
Forests 10 00809 g013

