Evaluating Greenery around Streets Using Baidu Panoramic Street View Images and the Panoramic Green View Index


1
Aerospace Information Research Institute, Chinese Academy of Sciences, Beijing 100101, China
2
University of Chinese Academy of Sciences, Beijing 101400, China
3
Sanya Institute of Remote Sensing, Sanya 572029, China
*
Author to whom correspondence should be addressed.
Forests 2019, 10(12), 1109; https://0-doi-org.brum.beds.ac.uk/10.3390/f10121109
Submission received: 25 October 2019
/
Revised: 1 December 2019
/
Accepted: 2 December 2019
/
Published: 4 December 2019
(This article belongs to the Section Forest Inventory, Modeling and Remote Sensing)
Abstract
:Urban street-side greenery, as an indispensable element of urban green spaces, is beneficial to residents’ physical and mental health. As readily available internet data, street view images have been widely used in urban green spaces research. While the relevant research using multiple images from different directions at a sampling point, researchers need to calculate the index of visible vegetation cover for many times. However, one Baidu panoramic street view image can cover the 360° view similar to that of a pedestrian. In this study, we selected 9644 points at 50-m intervals along the street lines in the central district of Sanya city, China, and acquired panoramic images via the Baidu application programming interface (API). The sky pixels were detected within the Baidu panoramic street view images using a proposed reflectance indicator. The green vegetation was extracted according to the Back Propagation (BP) neural-network method. Our proposed method was validated by comparing the results of the manual recognition and PSPNet method, and the accuracy met the requirements of the study. The Panoramic Green View Index (PGVI) was proposed to quantitatively evaluate greenery around streets. The authors found that the highest frequency value in the distribution was 0.075, which accounted for 32% of the total sample points, and the average PGVI value in this study area was low; the PGVI values between different roads varied greatly, and primary roads tended to have higher PGVI values than other roads. This case study proved that the PGVI is well suited for evaluating greenery around streets. We suggest that the PGVI derived from Baidu panoramic street view images may be a useful tool for city managers to support urban green spaces planning and management.
1. Introduction
Urbanization, in terms of both population and spatial extent, transforms a landscape from natural cover types to impervious urban land and consequently causes large environmental problems [1,2]. Urban green spaces (UGSs) have been recognized as critical landscape design factors in urban environments [3]. UGSs not only reduce residents’ physical and mental stress, but also regulate urban microclimates [4], improve air quality [5,6], increase urban biodiversity [7,8], weaken the urban heat island effect, and reduce noise [9,10,11], all of which are considered as necessary conditions for good urban ecological environment [12]. Urban street-side greenery, as an indispensable element of UGSs, makes an important contribution to the attractiveness and walkability of residential streets [13,14,15]. Many previous urban landscape studies have indicated that walking with a view of vegetation usually increases people’s esthetic rating of urban scenes [16,17,18].
With the continuous improvement of spatial resolution, remote sensing (RS), as a technology that can easily and timely acquire large-scale images, has been used in urban greenery research for many years [19,20]. From multiscale RS data, percentage greenery and per capita green area are the most commonly used indicators for calculating urban greenery [21]. However, the RS measurement method has its limitations because the data are taken by sensors from above. The typical pedestrian view of greenery around streets is a profile, which is different from the overhead view captured by most RS methods [22]. Some shrubs and grasslands are difficult to capture with satellite sensors due to the occlusion of the canopy. To establish a method of quantifying the amount of green environment perceived by pedestrians, researchers took pictures at specific locations after randomly sampling sites along streets. Aoki et al. [23] analyzed the relation between their impressions and the ratio of green within the frame of vision. They found that the proportion of green within the field of vision determined by a 28-mm focal distance provided an efficient measure of the respondent’s impression of the amount of greenery as viewed from a fixed position. Yang et al. [22] evaluated the visibility of urban forests through a combination of field surveys and photography interpretation. They developed the Green View Index (GVI) and used four pictures taken in four directions (north, south, east, and west) to evaluate the street greenery in the study area. However, the way these methods acquire and process data require a long time because the whole procedure is conducted manually. Moreover, the methods may be susceptible to weather conditions and may be difficult to apply to large-scale studies. Based on this, Li et al. [24] used free Google Street View (GSV) images (which have view angles similar to those of pedestrians and open access) to assess the profile of street-level urban greenery. The results showed that GSV images were qualified and efficient measurements of street-level greenery. Li et al. [25] further examined the relationships between the spatial distributions of residential street greenery and some socioeconomic variables in different block groups of Hartford, Connecticut, USA, and found that people with higher incomes tended to live in places with more street greenery. Stubbings et al. [26] applied a hierarchical two-level modeling approach to derive a sophisticated street-level tree score using GSV images combined with the Mapillary dataset. The results show a remarkable degree of correspondence capturing similar percentages of urban trees per area.
Due to strategic and business policies, researchers could not obtain GSV images in China. However, several Chinese internet companies, such as Baidu and Tencent, have launched urban street view services. Researchers have used these data to conduct urban street greenery research. Long et al. [27] collected over one million Tencent Street View pictures, calculated the GVI for each picture, and found that the aggregated GVI at the municipal level matched the approved National Garden Cities of China. Dong et al. [28] employed the GVI as a quantitative indicator to quantify street greenery in the area within the six-ring road in Beijing, analyzed the relationship between road parameters and the GVI, and compared the visual greenery of different road types. Yu at al. [29] proposed a Baidu Green View Index (BGVI) to describe the street-side profile greenery. The results demonstrated that green vegetation could be efficiently distinguished from Baidu Street View images.
The literature review found that when using Google or Tencent and Baidu Street View images, researchers selected multiple images from the perspective of pedestrians in several directions to represent the observation of greenery, and the index of visible vegetation cover should be calculated for many times at a sampling point. However, one Baidu panoramic street view image can cover the 360° view similar to that of a pedestrian. This study tried to use Baidu panoramic street view images that fully reflected the whole view of pedestrians at a specific location and proposed the Panoramic Green View Index (PGVI) to demonstrate the effectiveness of the images in evaluating greenery around streets. Taking the central district of Sanya city of China as a case study, the spatial distribution characteristics of street-side greenery were analyzed at both the point and the street levels. Moreover, the differences between different road types were explored by comparing the values. This study indicated that the PGVI is well suited for evaluating greenery around streets.
2. Materials and Methods
2.1. Study Area
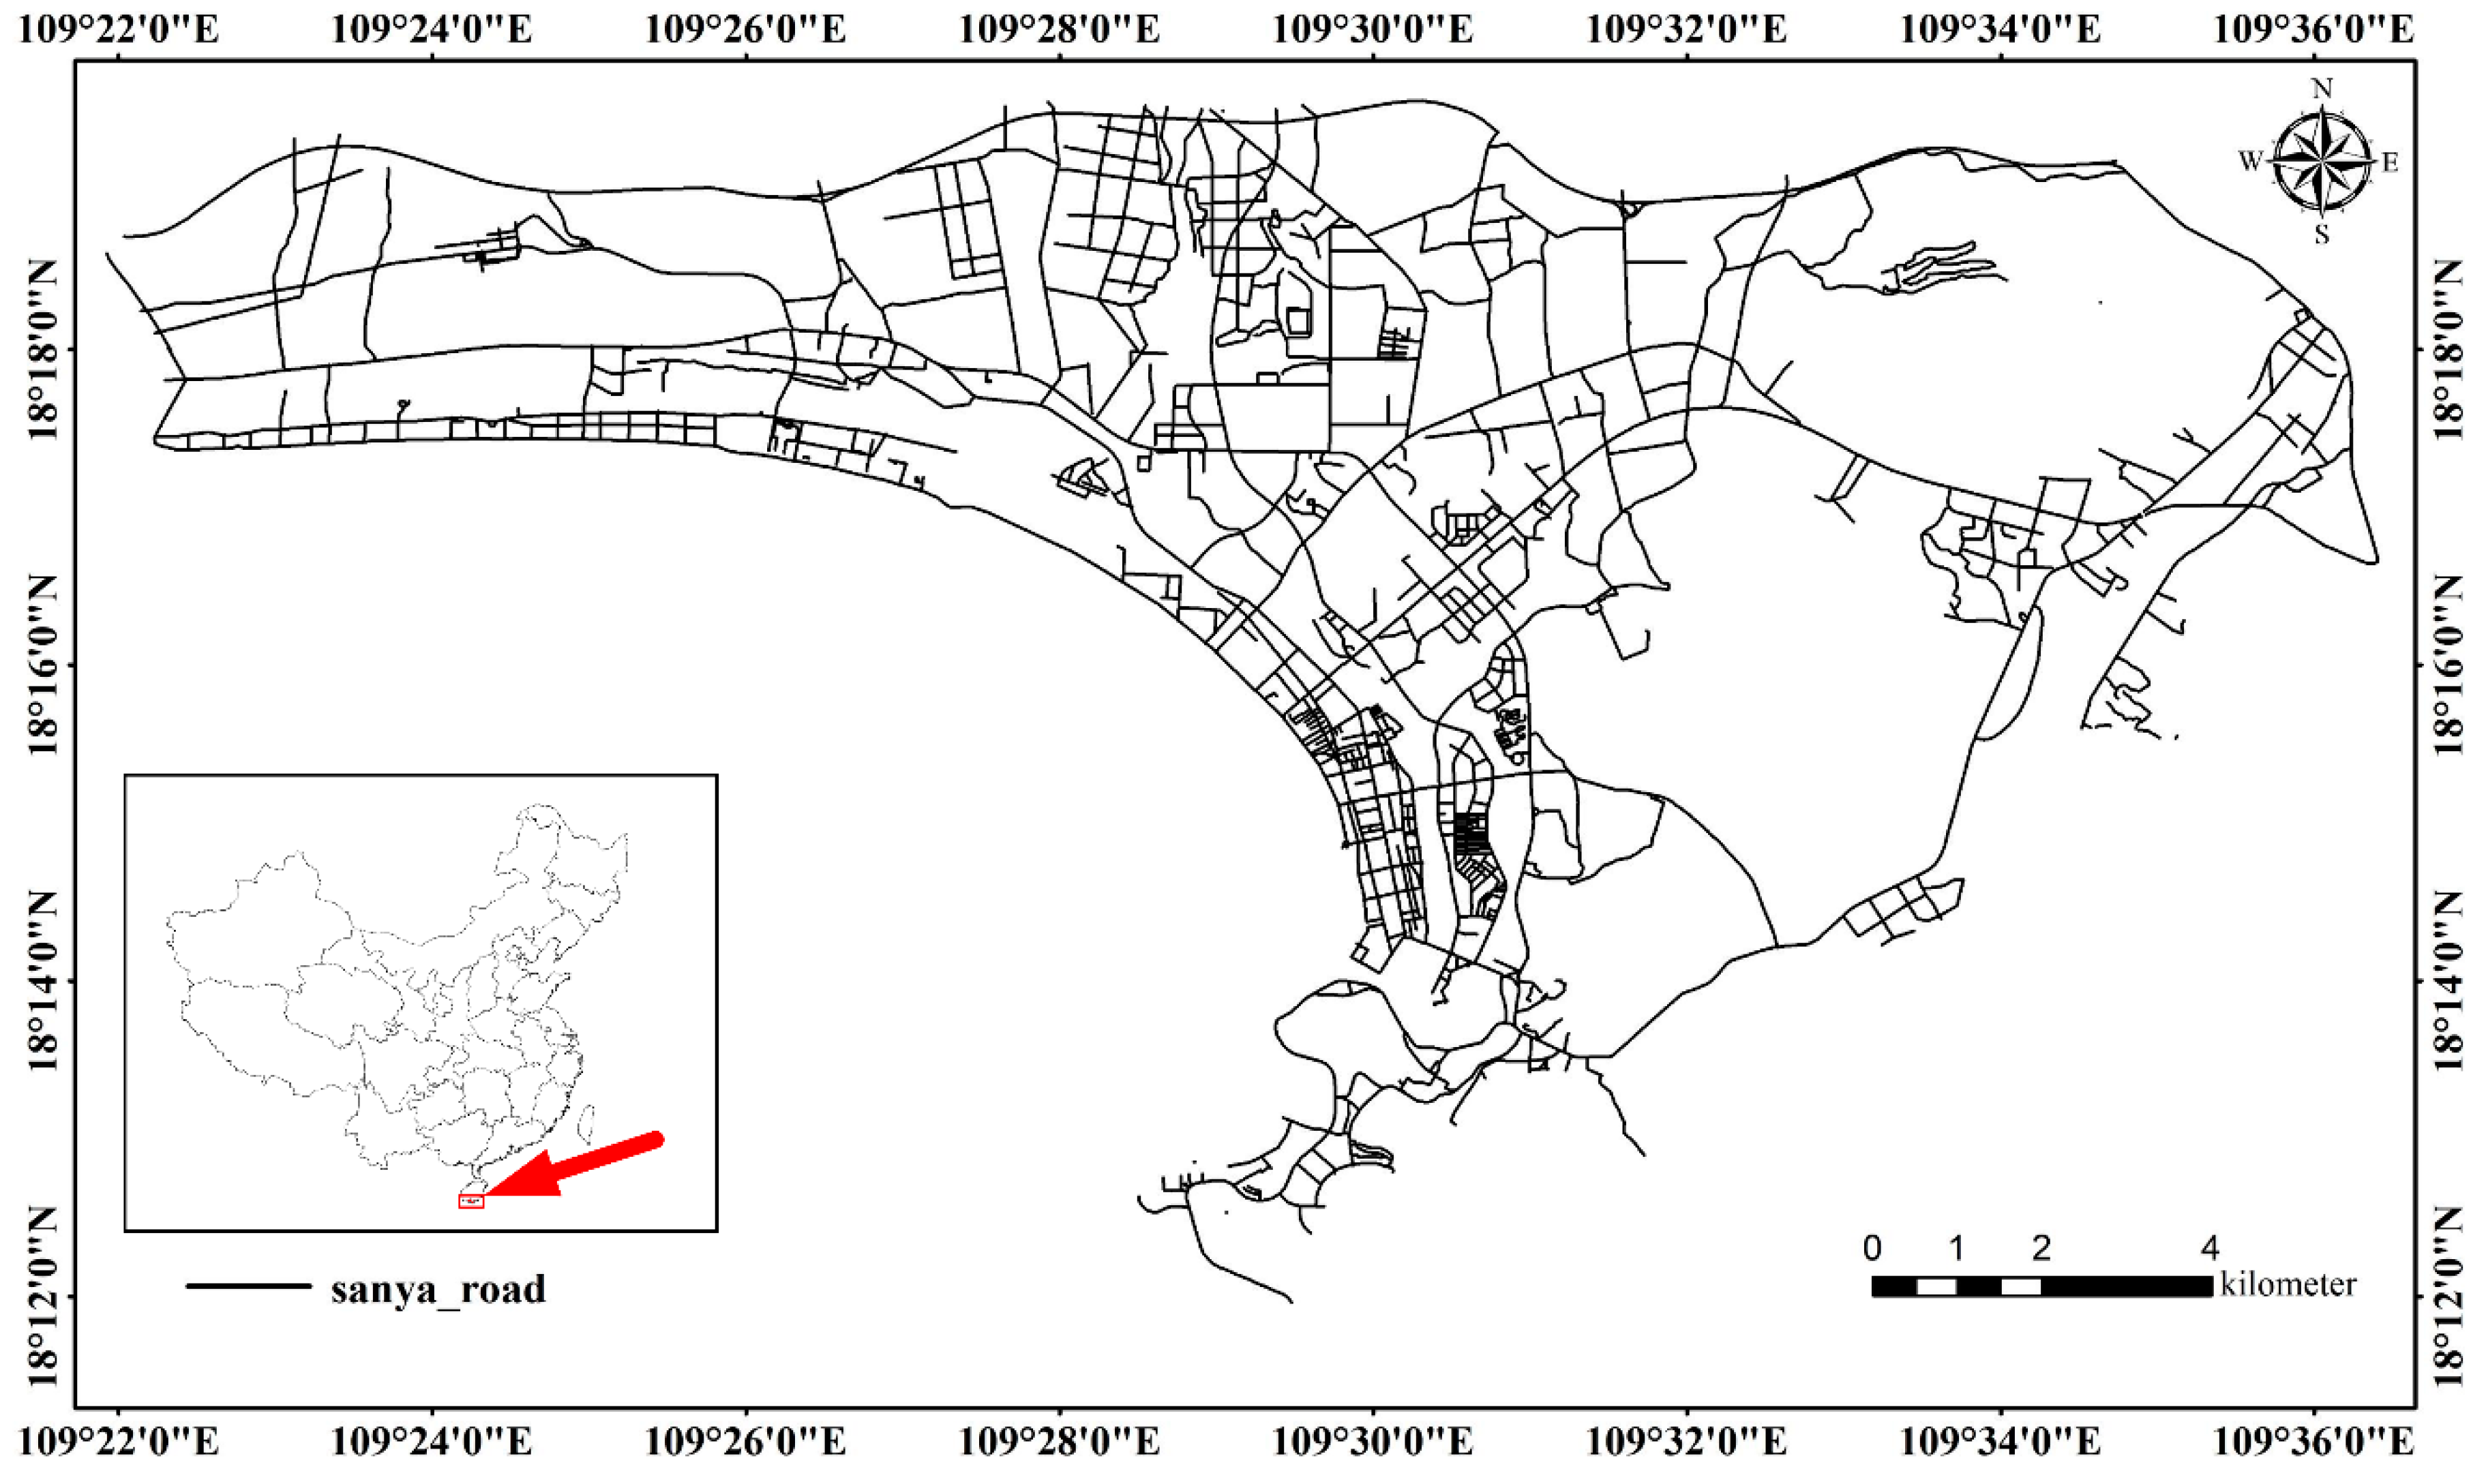
Through the analysis of Baidu panoramic image data set, it is found that the acquisition time of Baidu panoramic street view image dataset of Chinese cities is mostly in winter. And in this season, the vegetation of many cities is in the deciduous period. Because of the geographical location, climatic conditions, and vegetation types in Sanya, the street-side greenery is obvious in Baidu panoramic street view image, which is also conducive to the extraction of street-side vegetation, making the analysis results more rational. Located at the southernmost tip of Hainan Island, Sanya is the second largest city and the central transportation hub of southern Hainan Province, China. Sanya is a tropical maritime monsoon climate zone with an annual average temperature of 25.7 °C, and it is located between 18°09′34′′–18°37′27′′ N and 108°56′30′′–109°48′28′′ E (Figure 1). The total land area of Sanya is 1919.58 square kilometers, and the total sea area is 6000 square kilometers. In 2016, the Chinese Academy of Sciences released the “Research Report on Livable Cities in China” [30]. The Sanya livable index ranks third among 40 cities in the country. A more scientific analysis of the urban street greenery is conducive to urban planning and management.
2.2. Collecting Baidu Panoramic Street View Images
The street network of Sanya was obtained from the Open Street Map (OSM) website (Figure 1). The acquired vector data needed to be processed to meet the requirements. The main steps are explained below:
- (a)
- Because the Baidu map uses the BD09 coordinate system and the OSM uses the WGS84 coordinate system, the layer coordinate system must be transformed to make the two coordinate systems consistent.
- (b)
- Cropping the study area with vector.
- (c)
- Simplifying the bidirectional parallel vectors of the same street into a single vector and connecting the discontinuous streets.
- (d)
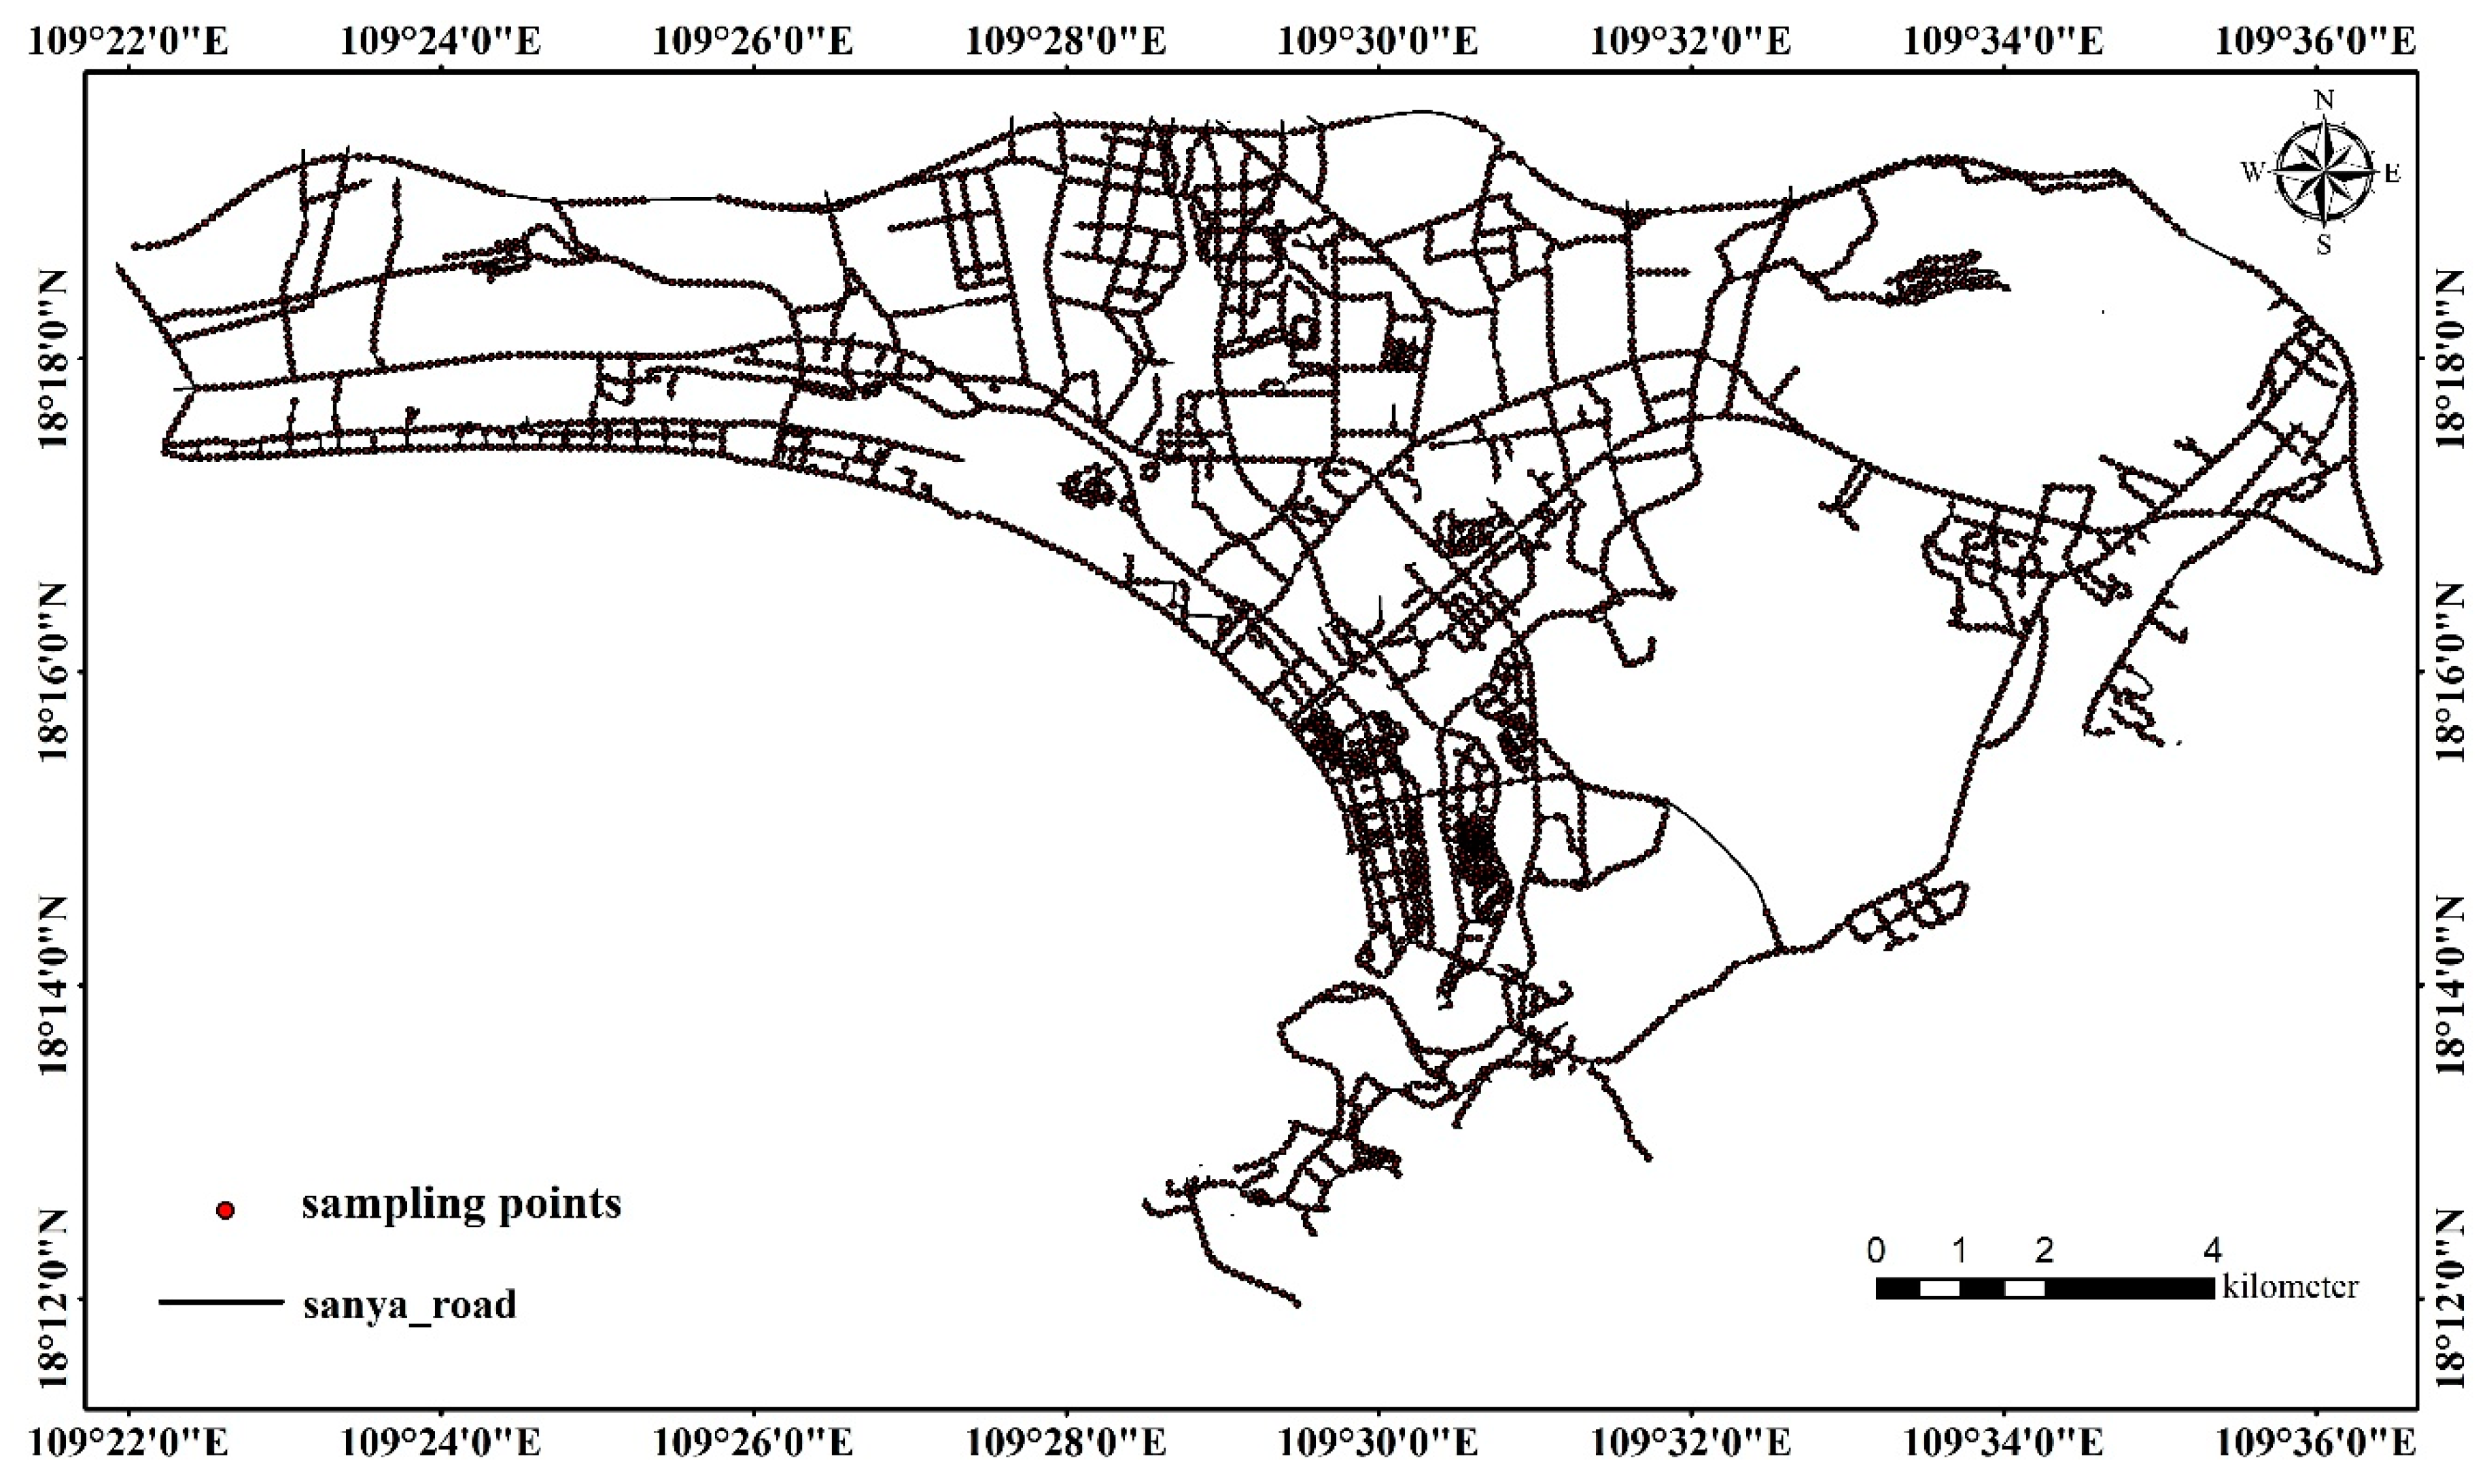
- Sampling points at 50-m intervals along the street lines shown in Figure 2, using GIS software. To ensure the accuracy of the PGVI calculation results, the tunnel points were deleted. There were 9644 sample points in the study area.
The Baidu panoramic street view image is a 360° picture generated from the eight original images captured by the cameras on a mobile vehicle. We collected Baidu panoramic street view images for all the sampled points by defining the URL parameters sent through a standard HTTP request using the Baidu street view images application programming interface (API). An example of requesting a Baidu panoramic street view image is shown below [31].
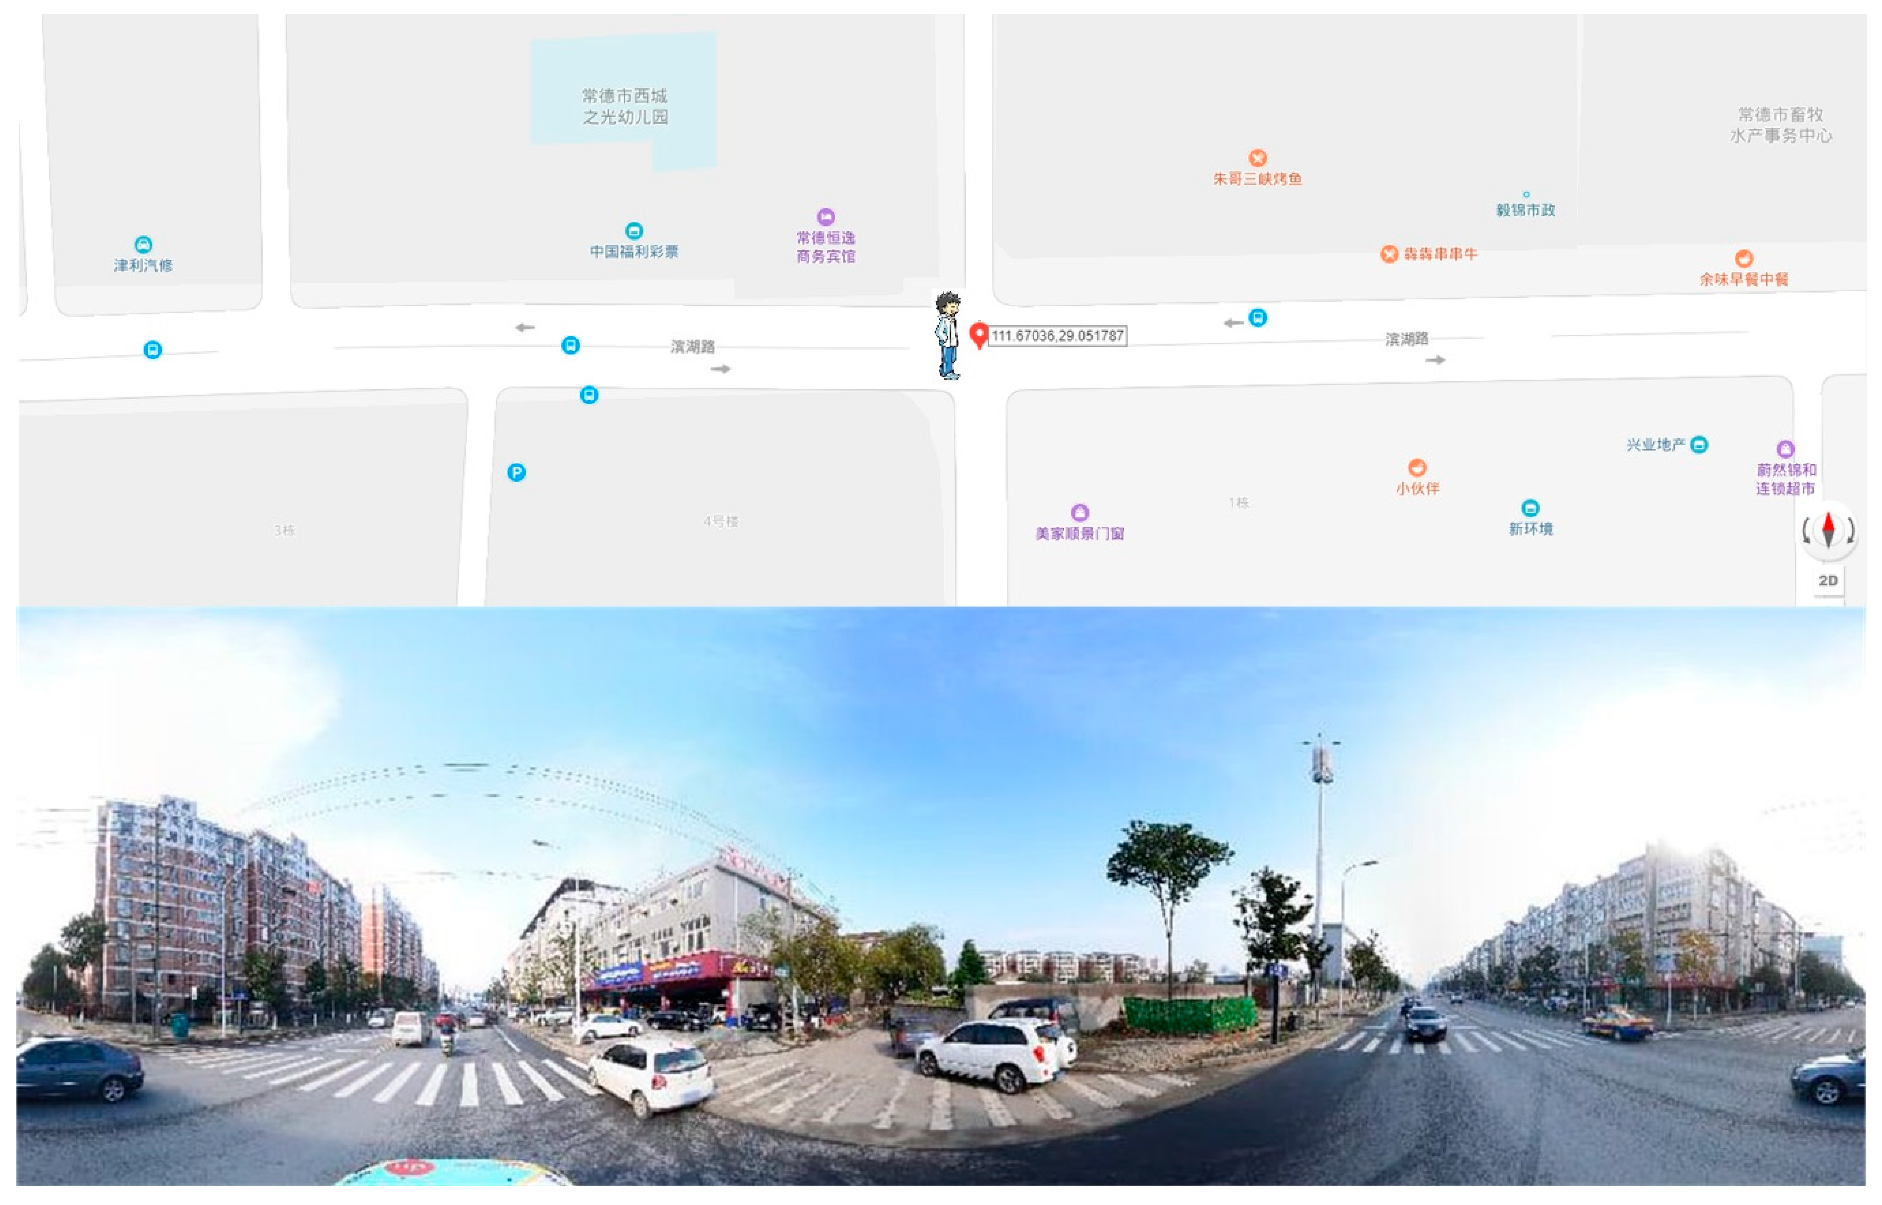
Figure 3 shows the requested Baidu panoramic street view image. In the example, parameter ak is the Baidu API key, width and height specify the output size of the requested image, location provides the image’s geo-location in the WGS-84 coordinate system, and fov determines the horizontal field of view of the image (360 represents a panoramic image).
2.3. Extraction of Green Area Based on the Multichannel Combination Threshold Method
We proposed a classification method for automatically extracting urban environmental elements (vegetation, sky, and building) from Baidu panoramic street view images in the Python 2.7 environment. Based on the analysis of the spectral information of these elements on the images, we found that the reflectance of sky in the blue band was higher than that in the green and red bands and that the brightness of sky was always brighter than the two other elements. Additionally, the green vegetation had a higher reflectance value in the green band than that in blue and red bands. Considering the analysis, a workflow was built for extracting urban environmental elements based on the natural colors of the Baidu panoramic street view images. The workflow was mainly composed of the following steps (Table 1). First, the GrabCut segmentation algorithm was used to split images into different regions [32]. Second, the adjusted brightness of images was calculated as stated in Formula (1) to differentiate sky pixels from other pixels. However, in Baidu panoramic street view images, some pixels of non-sky elements have a similar spectral reflectance to that of sky pixels. If we use only the brightness rule to extract sky pixels, the outcome is not satisfied. To avoid such misclassifications, an additional rule in which the pixel values in the blue band were larger than a threshold was added. Then, the green vegetation was extracted according the Back Propagation (BP) neural-network method [33]. Last, the remaining pixels were classified as buildings after all pixels of sky and vegetation were extracted.
Brightness = (0.5 × red + 0.5 × green + 2 × blue)/3
In the workflow, the optimum threshold of brightness was found by Otsu’s method [34]. Otsu’s method finds the threshold of the image by maximizing the variance between different classes. In addition, the image that was classified by the above steps was further refined to remove the “salt and pepper” effect by an iterative trimmed median filter [35].
2.4. PGVI Calculation
The conception of “Green View Index (GVI)” was first proposed by Aoki at al. [23] in 1985 and was calculated according to the ratio of green within the frame of vision. Yang at al. [22] then evaluated the visibility of urban forests while defining the ratio of green area to the total area of the four pictures taken at a specific location, as calculated using Formula (2).
where areagreen_i refers to the pixels of green vegetation in the image taken in the ith direction, and areaall_i refers to the total pixels of the image taken in the ith direction.
Furthermore, to effectively represent the vision of pedestrians, Li et al. [24] proposed the modified GVI, which used six GSV images covering the horizontal surroundings and three GSV images covering the vertical surroundings to calculate the greenness. The modified GVI was calculated by Formula (3).
where is the number of green pixels in one GSV image, and is the total number of pixels in the image.
Although the modified GVI considers the horizontal and vertical directions, some green vegetation information is still omitted. The Baidu panoramic street view image is a single image that can represent the entire 360° around the visual environment at a specific location (Figure 3). We proposed the PGVI to evaluate greenery around streets, as described by Formula (4).
where areagreen is the area of green vegetation in a Baidu panoramic street view image, and areaall is the total area of the image.
3. Results
3.1. Green Vegetation Extraction Result
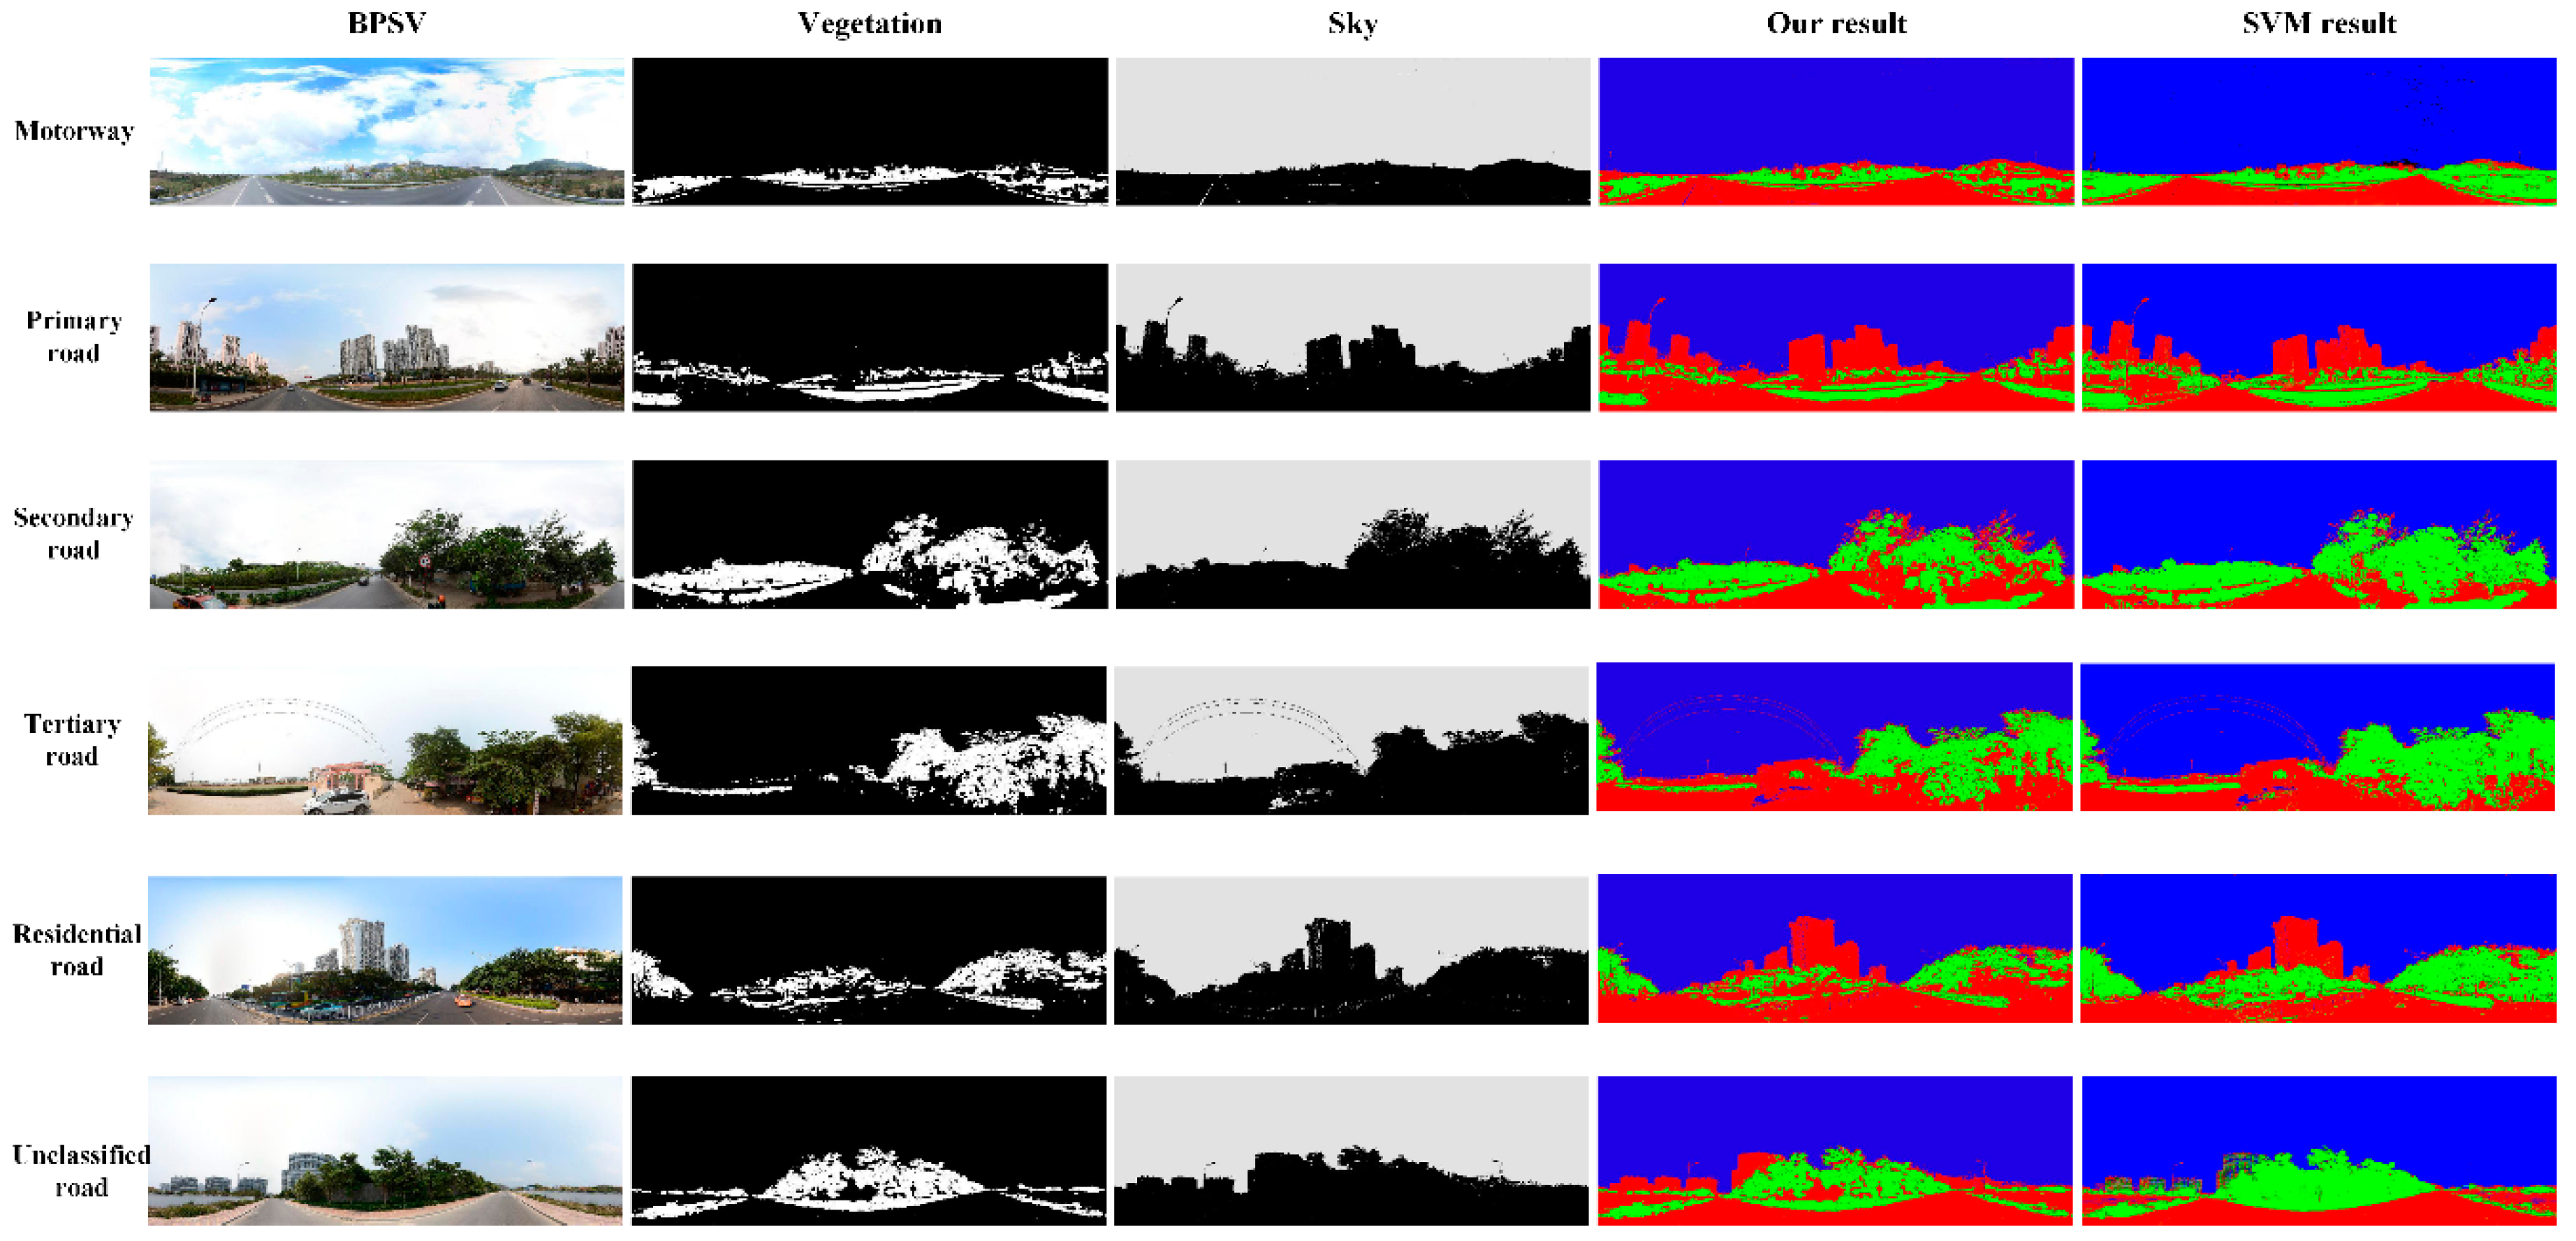
According to the street network data downloaded from the OSM website, we know that the types of roads comprised six different categories in the study area, which are motorway, primary road, secondary road, tertiary road, residential road, and unclassified road. Figure 4 shows the urban elements sample extraction results of these six types of roads in the study area. The first column of the picture matrix in Figure 4 shows the original Baidu panoramic street view images; the second and third columns show the green vegetation and sky, respectively, extraction by the classification method proposed in Section 2.3 (white pixels); the fourth column shows the urban elements extraction; the last column shows the results extracted by the support vector machine (SVM) method [36]. Compared with the SVM results, we found that the phenomenon of some buildings being wrongly classified as vegetation was avoided.
To further verify the accuracy of the extraction results, the authors randomly selected 400 points from the database and estimated green vegetation pixels with manual and PSPNet methods. We used two evaluation metrics to compare greenery extraction: mean intersection over union (IoU) for measuring the accuracy of the location of vegetation pixels and mean absolute error (MAE) for measuring the accuracy in estimating overall PGVI. These measures are commonly used to assess the accuracy of classification outcomes.
The mean IoU was calculated by Formula (5).
where n is the number of images, TPi is true positive identified vegetation pixels of image i, FPi is false positive identified vegetation pixels of image i, and FNi is false negative rejected vegetation pixels of image i.
The MAE was calculated by Formula (6).
where n is the number of images, M is the number of pixels in a single image, Vi is binary variable for pixel i (1 indicates actual vegetation, 0 indicates actual non-vegetation), Ui is binary variable for pixel i (1 indicates predicted vegetation, 0 indicates predicted non-vegetation).
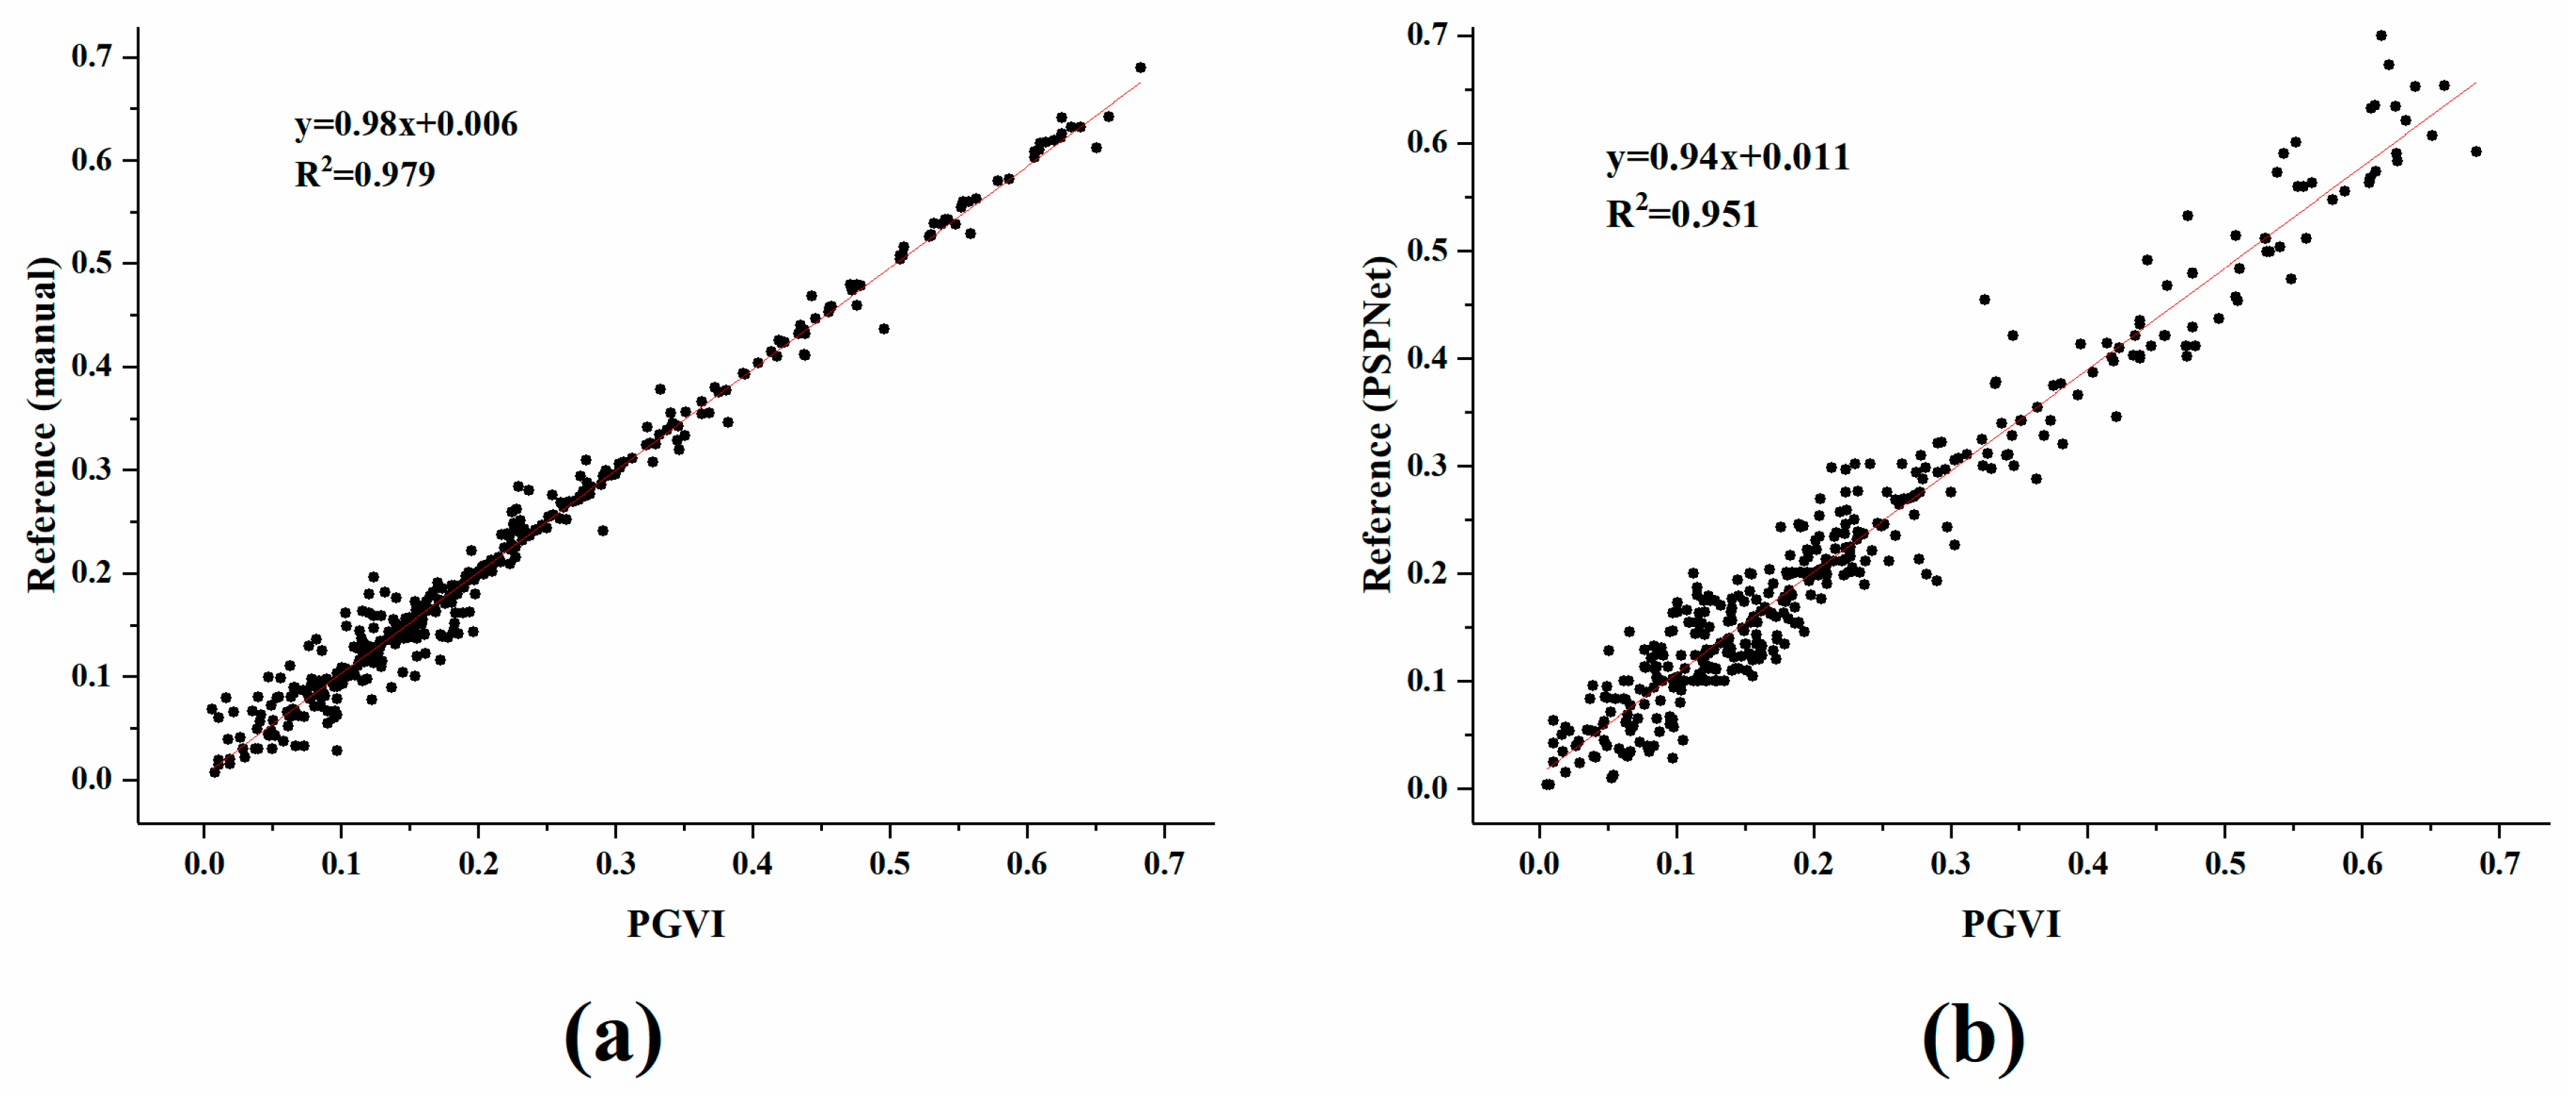
Table 2 shows the metrics results comparison between the three methods. We find that the values of mean IoU and MAE between the three methods are near. The method proposed in this paper has a higher mean IoU and the highest MAE, while PSPNet has the highest mean IoU, and manual has the lowest MAE. Then, we compared the results of the ratio of green vegetation using the manual and PSPNet methods with the PGVI by linear regression. The scatter plots (Figure 5) show the relationship between the PGVI values and the corresponding values calculated with the manual and PSPNet methods, and the red lines in Figure 5 are the fitting lines between them. Figure 5a shows that the regression line is very close to the diagonal line, and the correlation coefficient is 0.98, with R2 = 0.979, indicating the variables have a strong correlation. Similarly, Figure 5b shows the fitting line between the PGVI values calculated by the authors’ method and by PSPNet, and the correlation coefficient is 0.94, with R2 = 0.951, which means that the two variables have a significant positive correlation. The results show that the PGVI values calculated by the authors’ method are consistent with both the manual extraction and the PSPNet methods, which means that the results calculated by the proposed automatic classification method in this paper are of high quality.
3.2. Distribution of PGVI in the Study Area
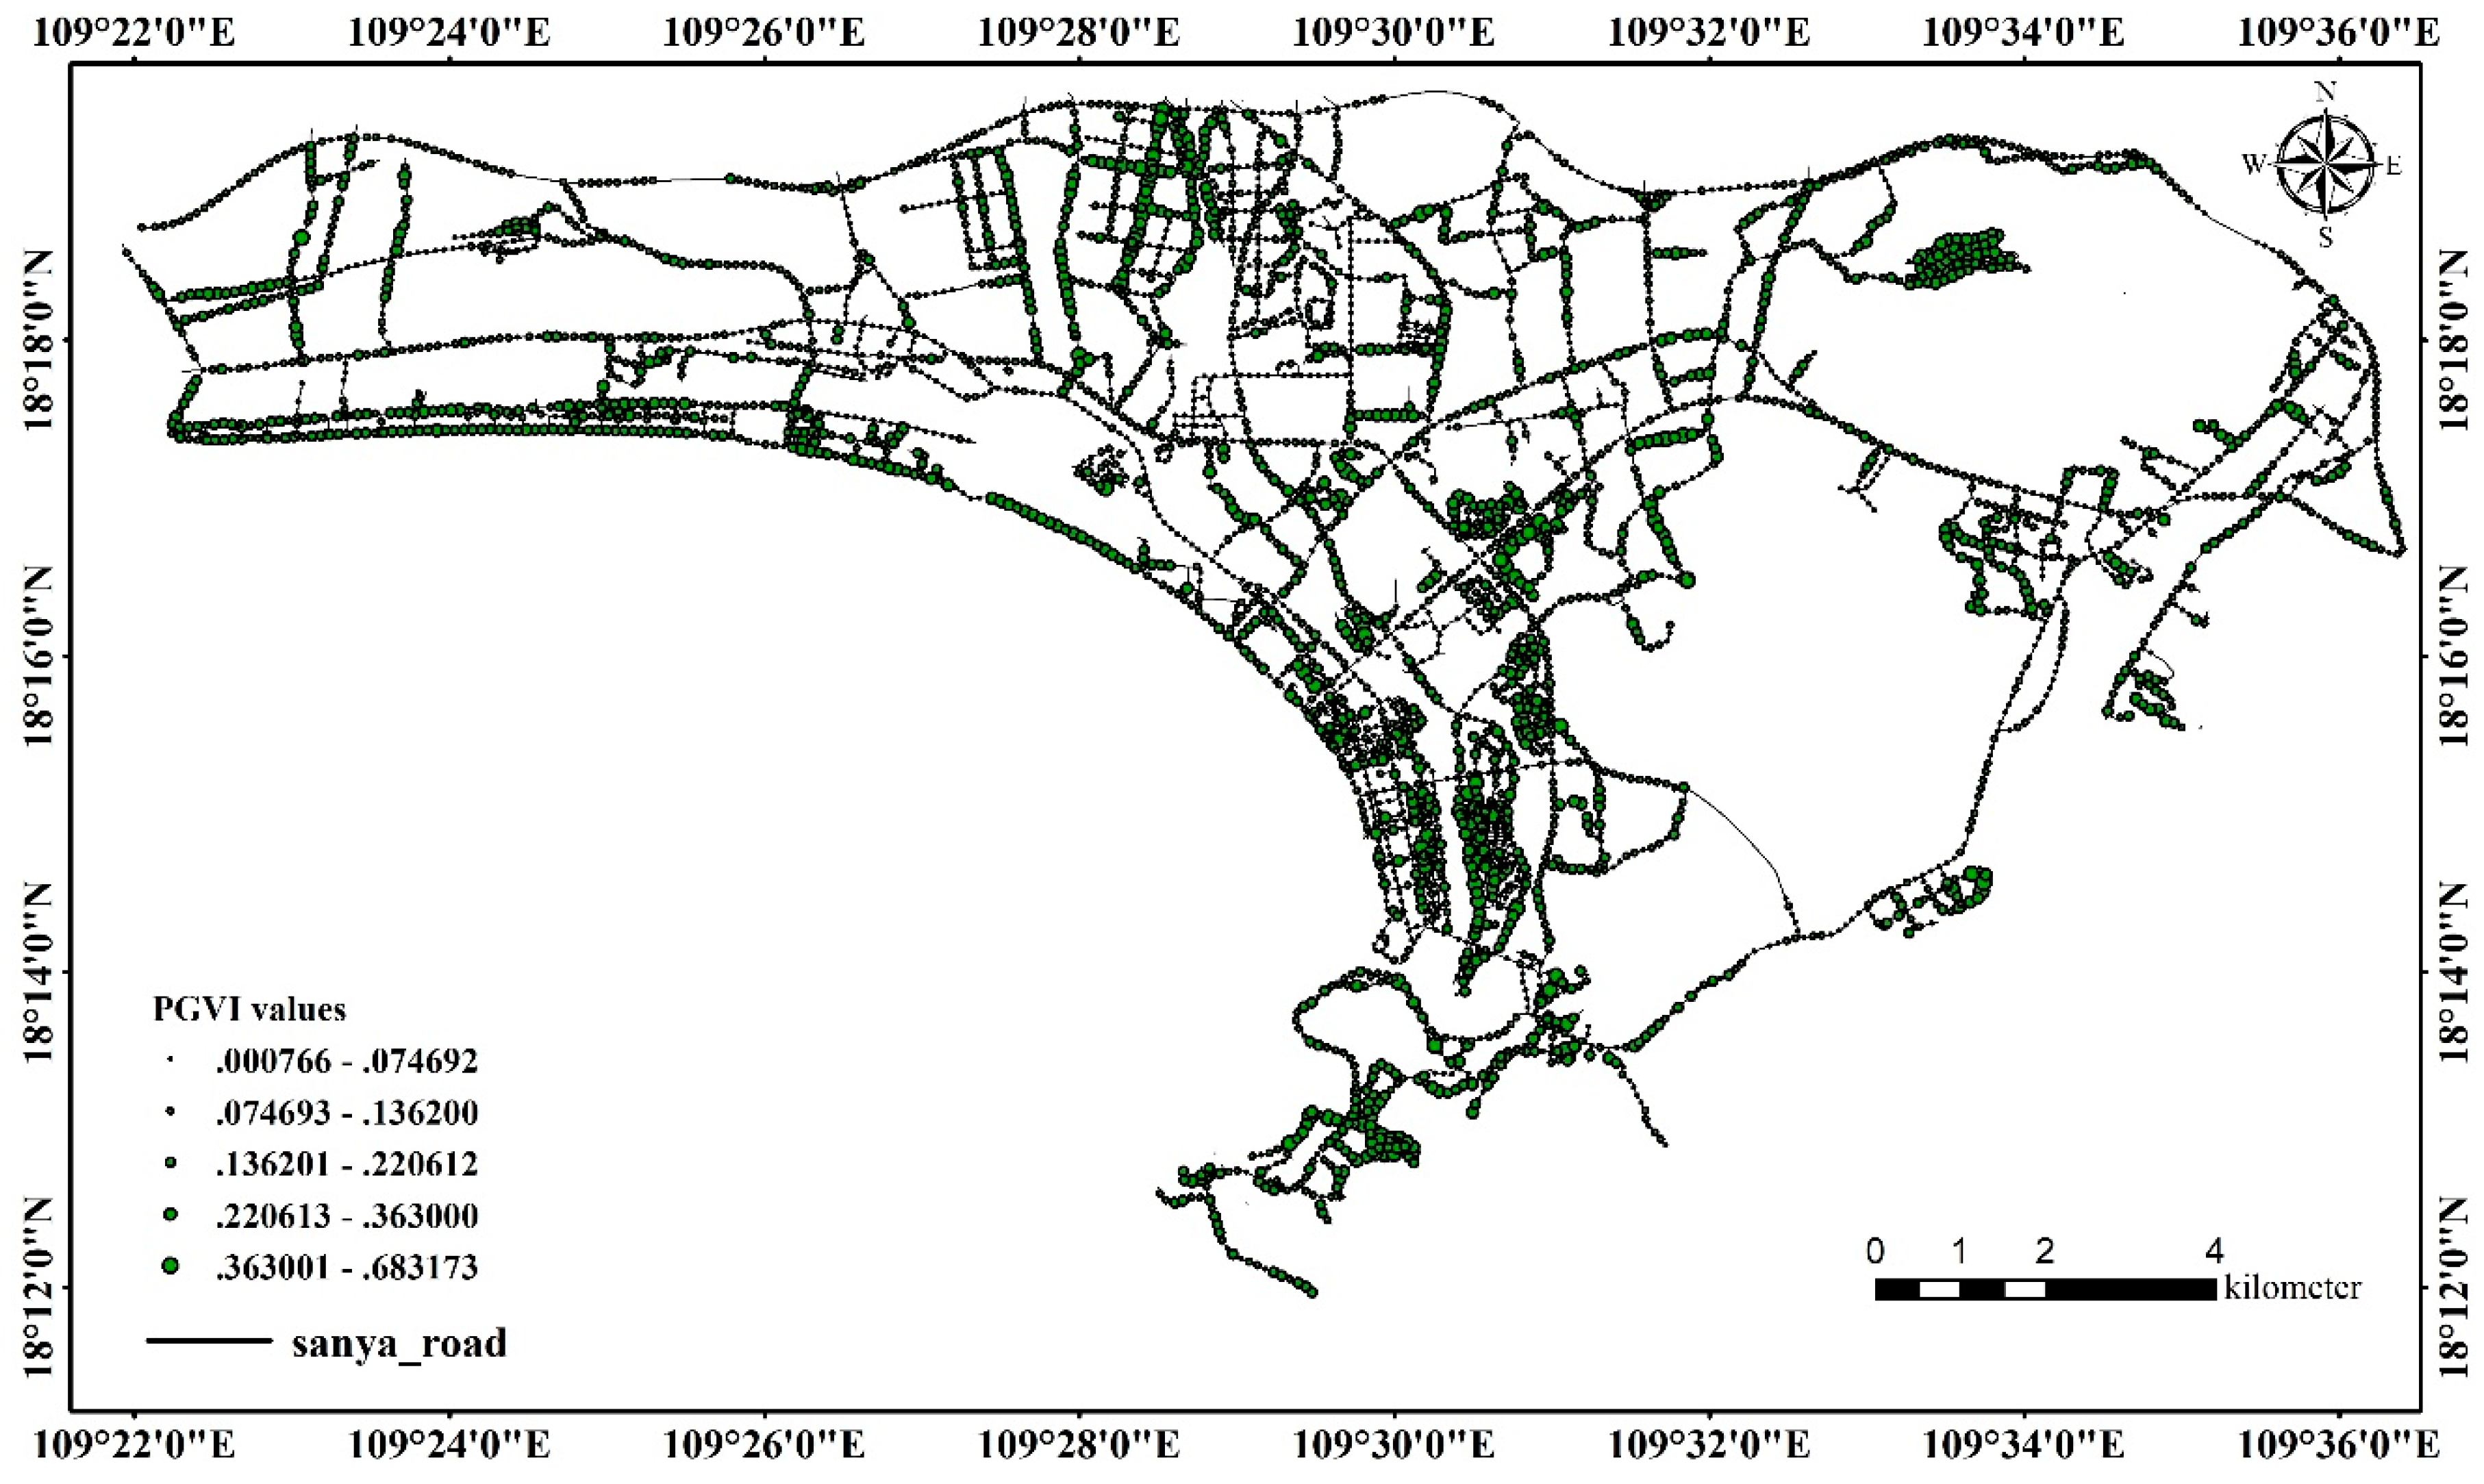
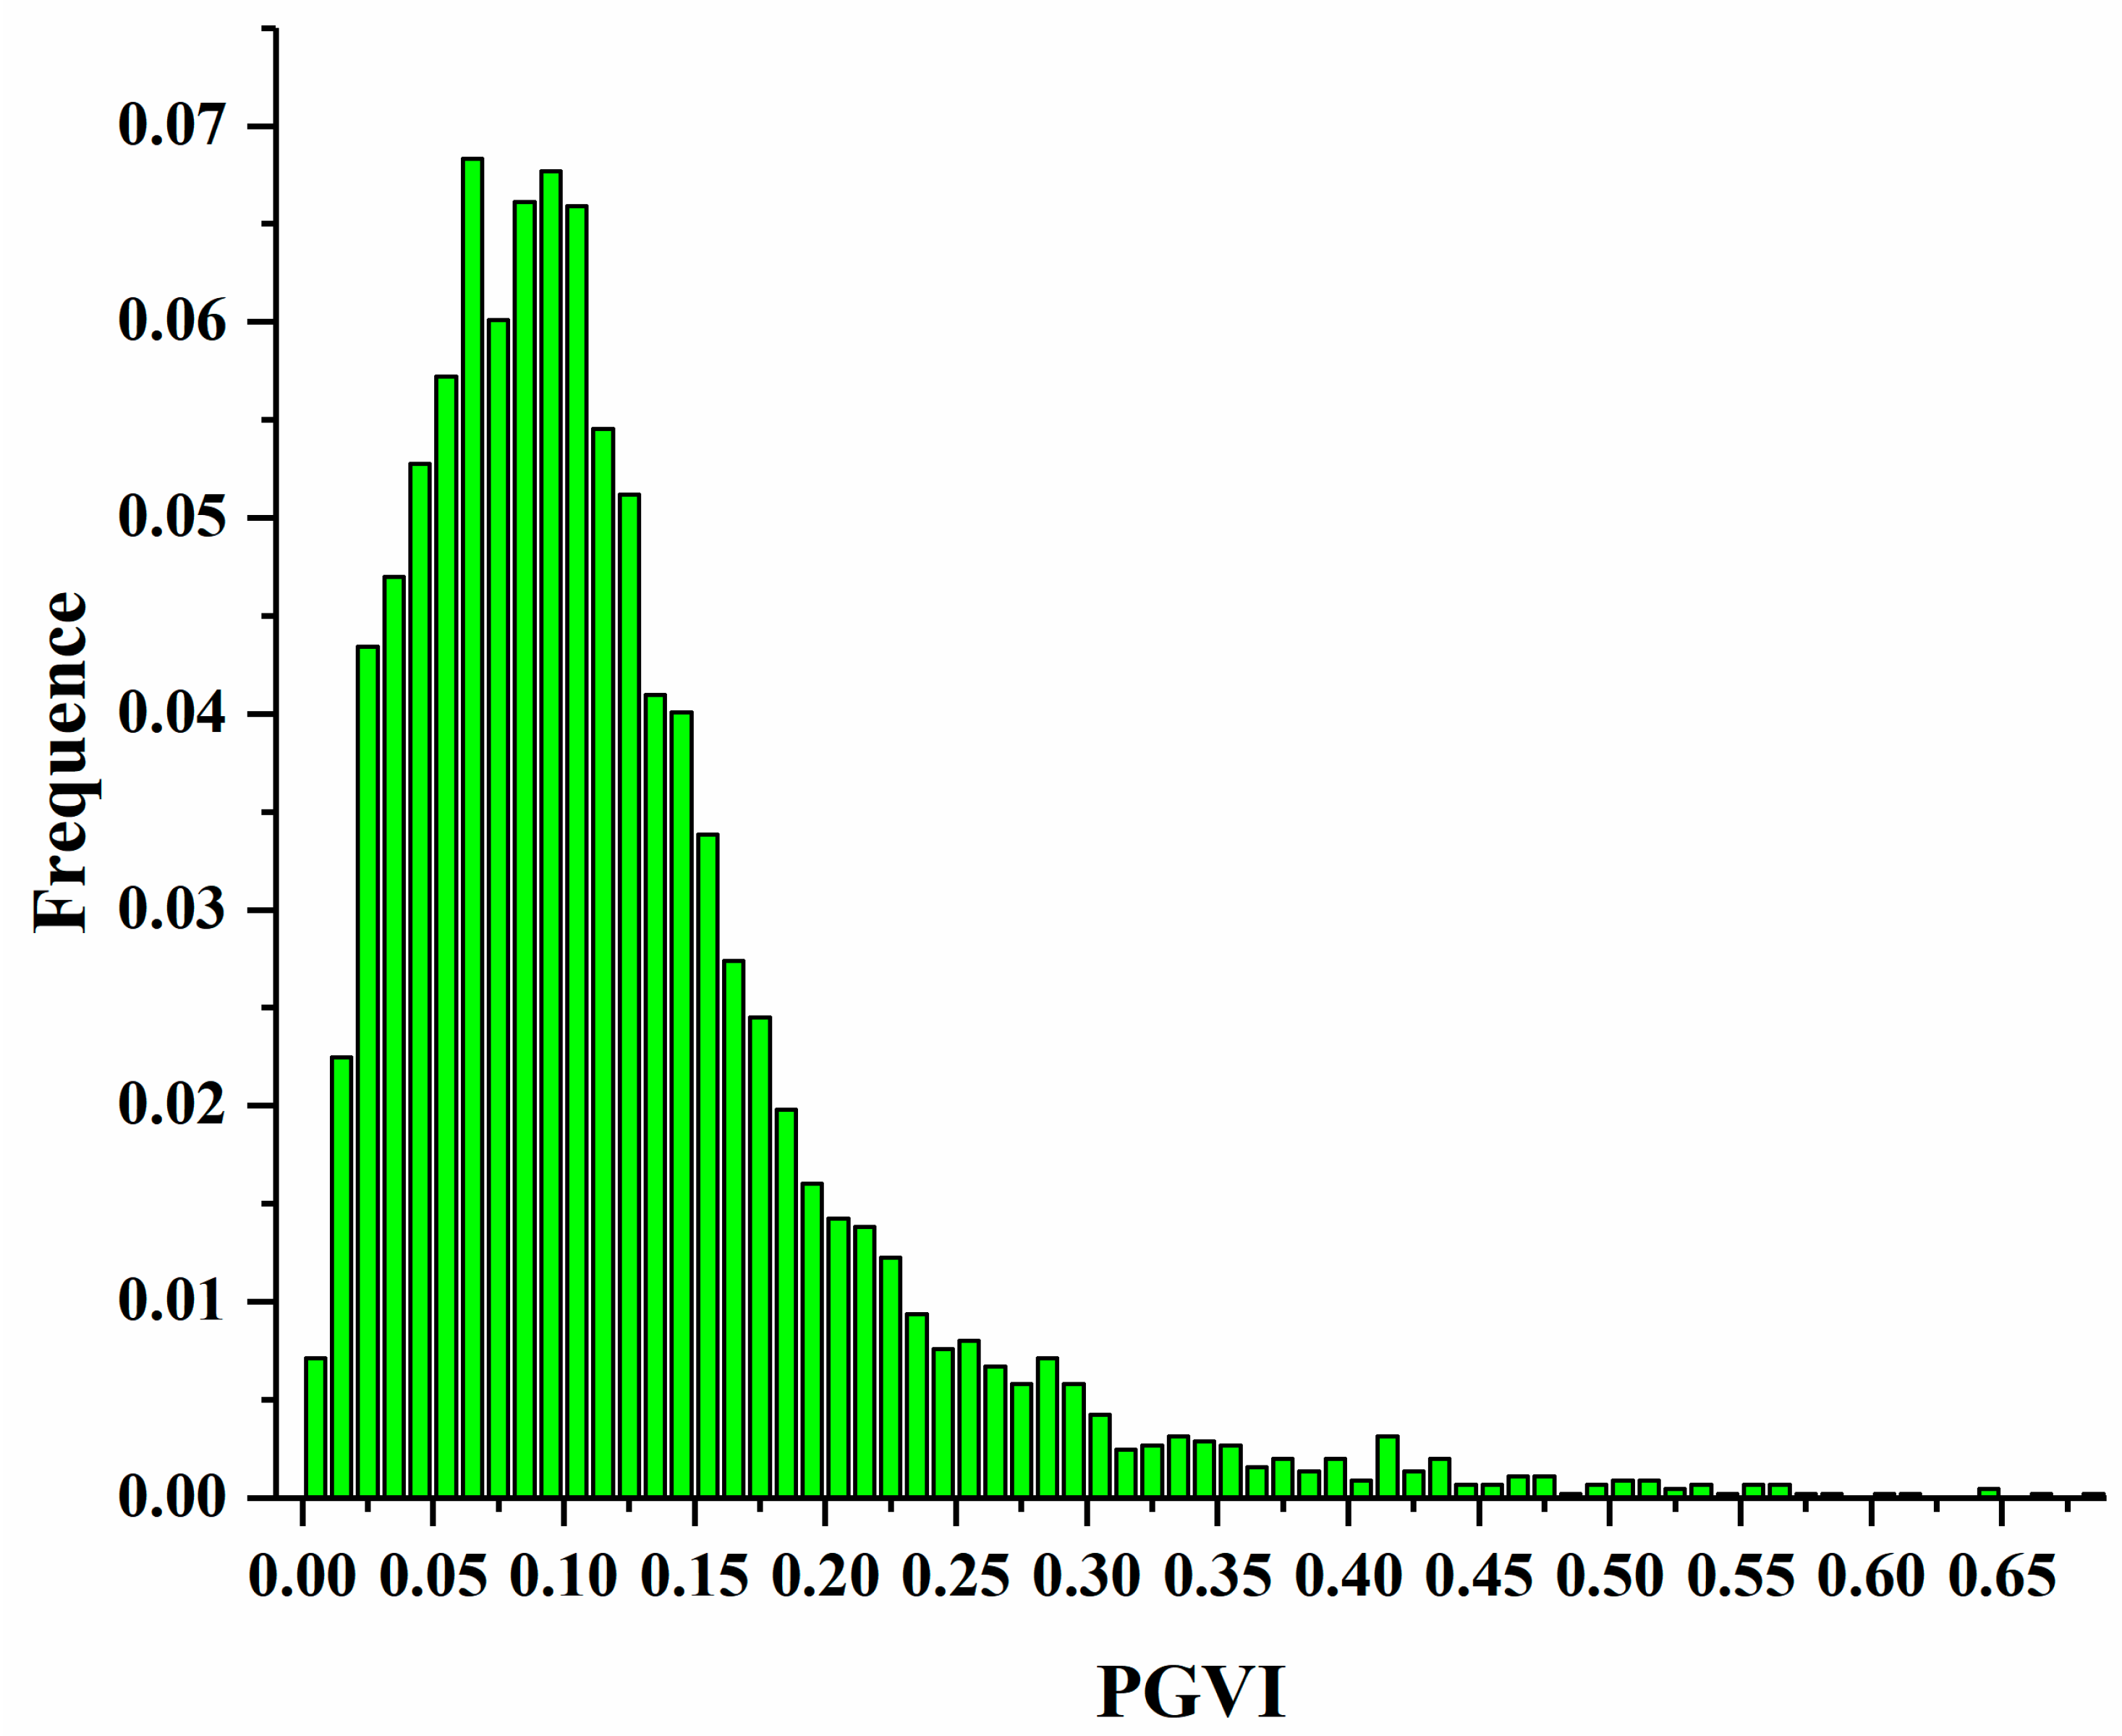
Figure 6 shows the PGVI values at all sampling points calculated using Formula (3) in the study area. The PGVI values range from 0.0007 to 0.6832, with a mean of 0.1205 and a squared deviation of 0.0868. This result means that the greenery around streets is not “green” enough, and the overall difference is not obvious. Figure 6 shows that the sample points with high PGVI values are located in the middle region of the study area. This location means that the streets of the middle region may look “greener” than those in other areas from the perspective of pedestrians. Furthermore, based on the natural break method [37], the PGVI values are separated into five intervals: (0.00766, 0.74692), (0.074693, 0.1362), (0.136201, 0.220612), (0.220613, 0.363), and (0.363001, 0.683173). Figure 7 shows the frequency distribution histogram of the PGVI values. The proportions of the above five intervals are 29.8%, 36.6%, 23.1%, 8.1%, 2.4%, respectively. Through the mathematical analysis of the PGVI values, it is found that the total greenery situation of the study area is not satisfactory and needs to be improved.
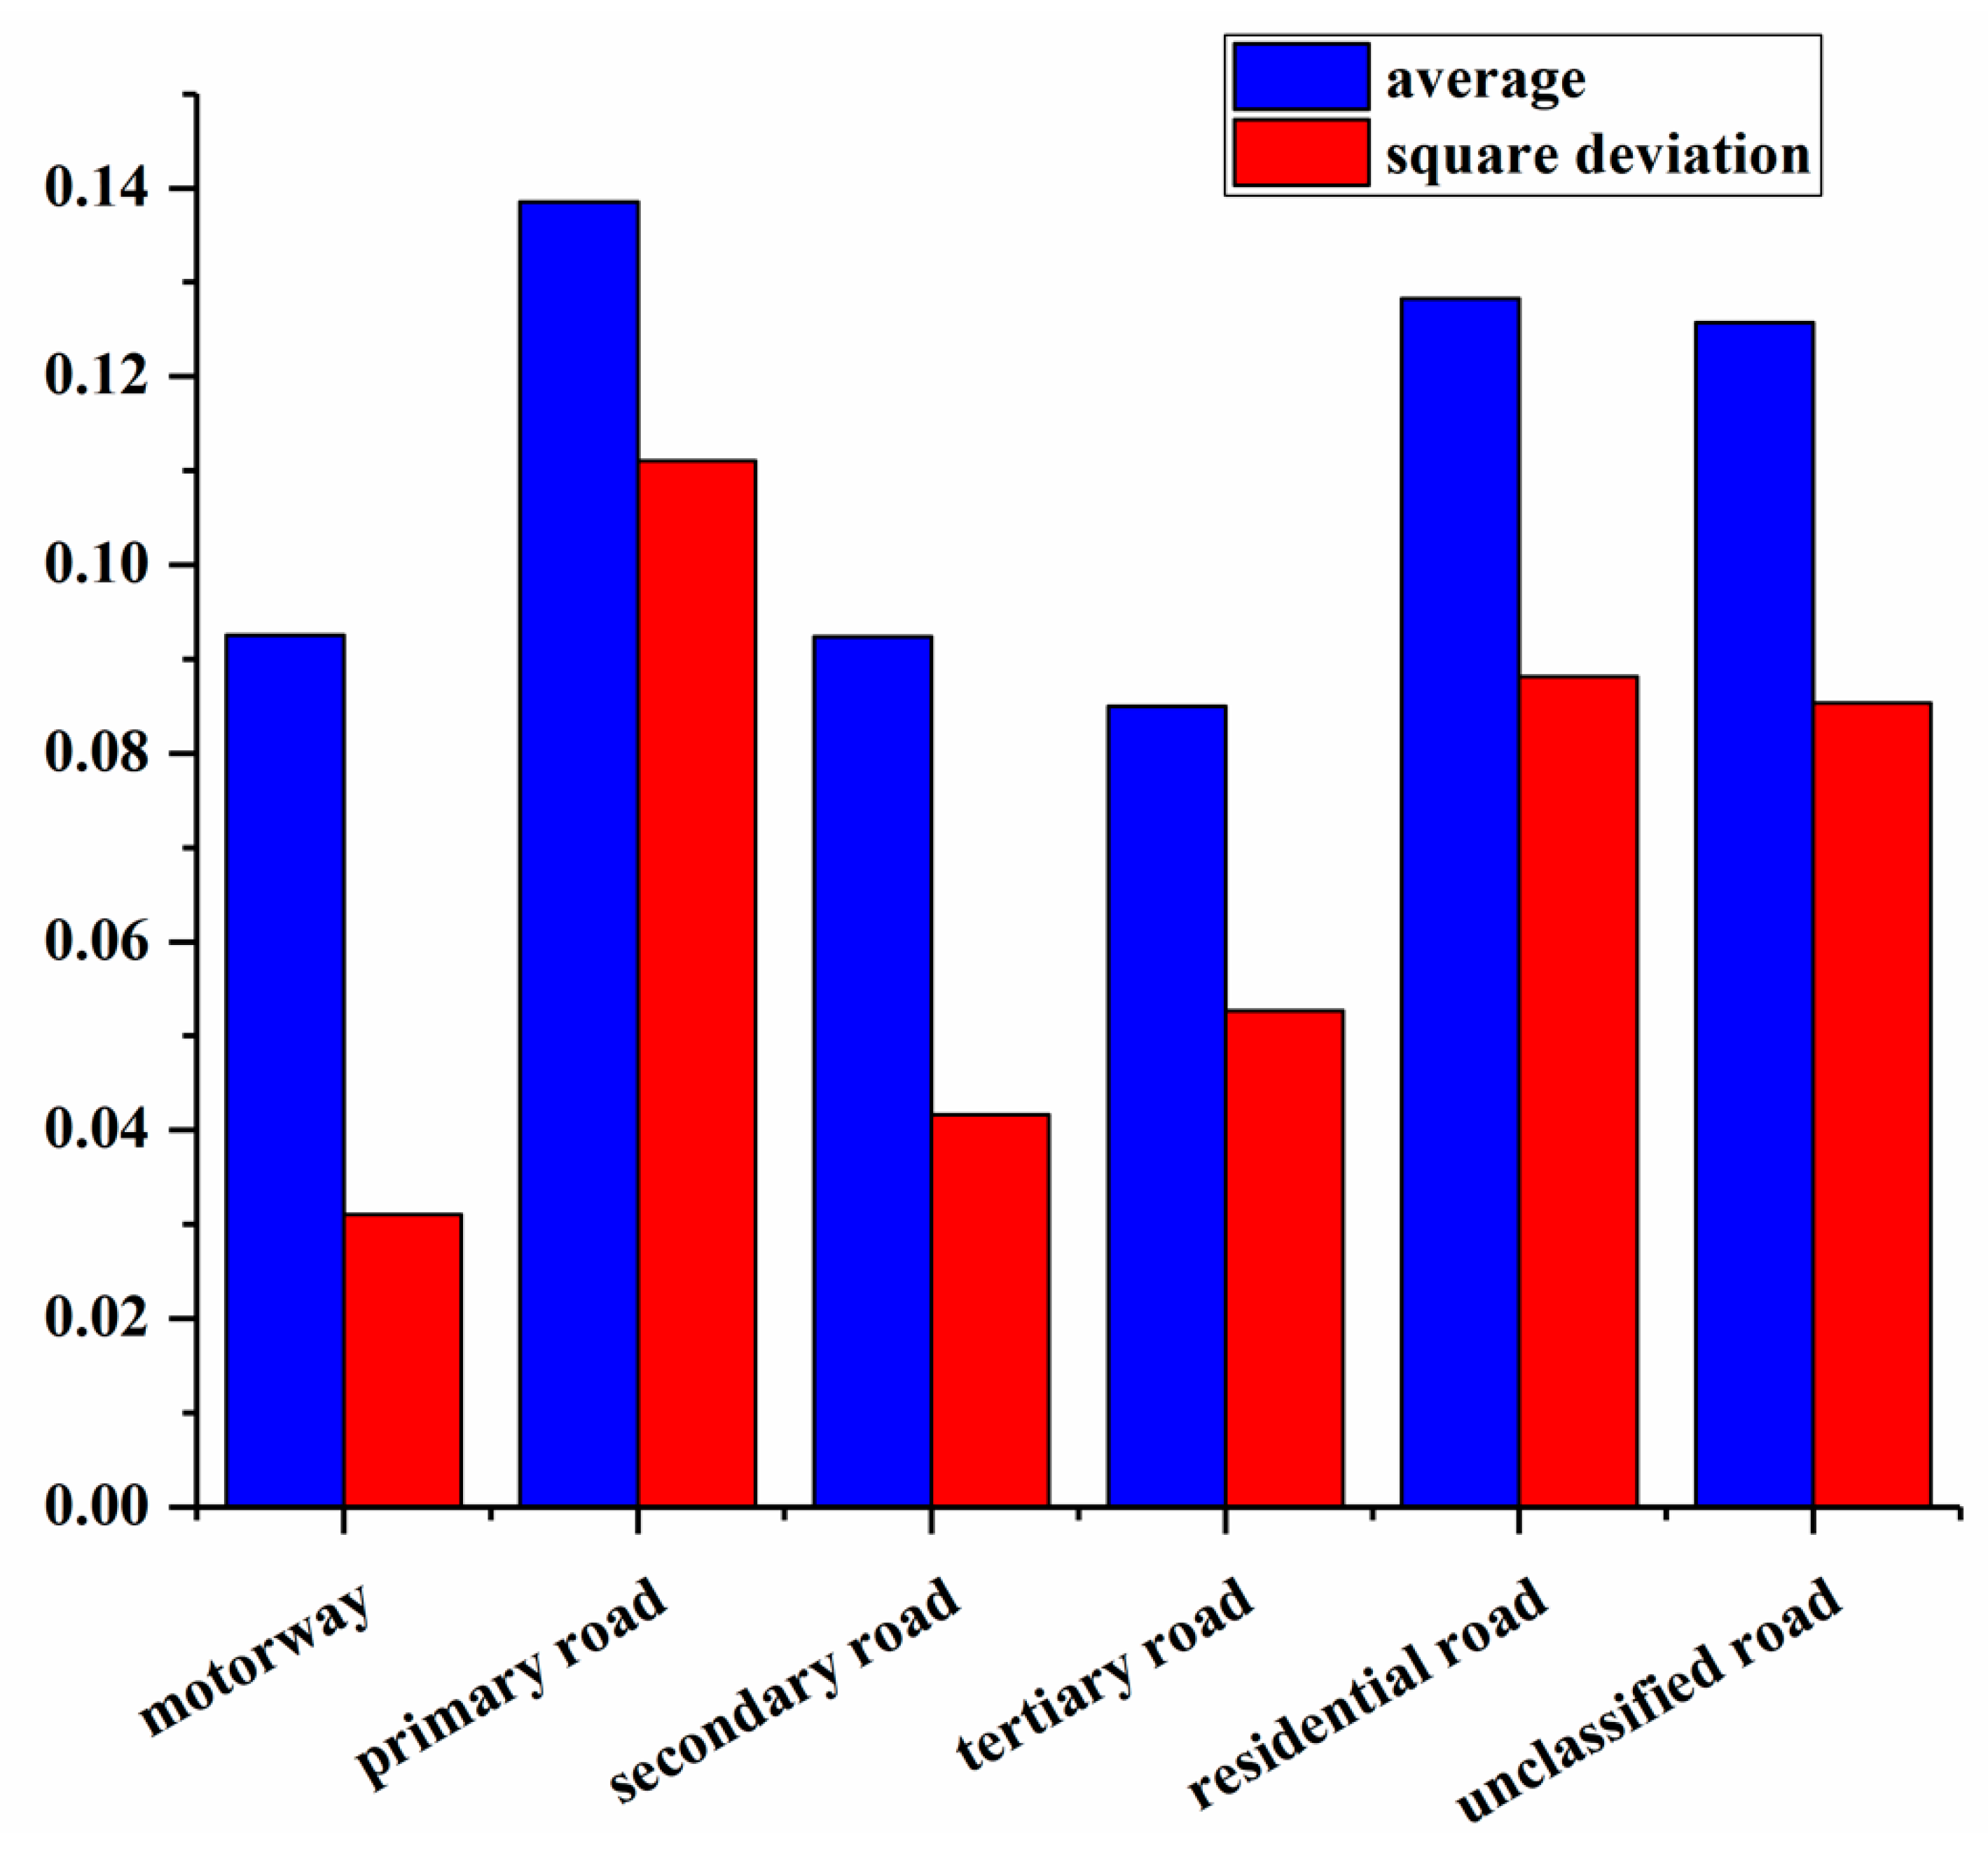
To further study the distribution of urban street greenery in the study area, we calculated the distribution of the PGVI values at the street level through the data space interpolation method using the sampling point data obtained in the previous section. Figure 8 shows the statistical PGVI values of the different types. As shown in Figure 8, the primary road has the highest average PGVI value of 0.138, while the tertiary road has the lowest average PGVI value of 0.085. Between these maximum and minimum average PGVI values, the average PGVI values of motorway, secondary road, residential road, and unclassified road are 0.093, 0.092, 0.128, and 0.126, respectively. These statistical results can provide a reference for urban road greenery management and planning that could improve pedestrians’ perceptions of more natural greenery. More greenery around the street could increase the aesthetics of the streets and motivate more residents to go out for exercise. Therefore, for roads with lower PGVI values, some effective operations should be performed to improve the current situation. Planting tall trees with has large canopies would be an appropriate method to block the vision of drivers and effectively increase the road greenery. The Baidu panoramic street view image dataset in this study offers an easily obtained tool that can be used to quantify the greenery around streets.
4. Discussion
4.1. Comparing the PGVI and the Modified GVI Results
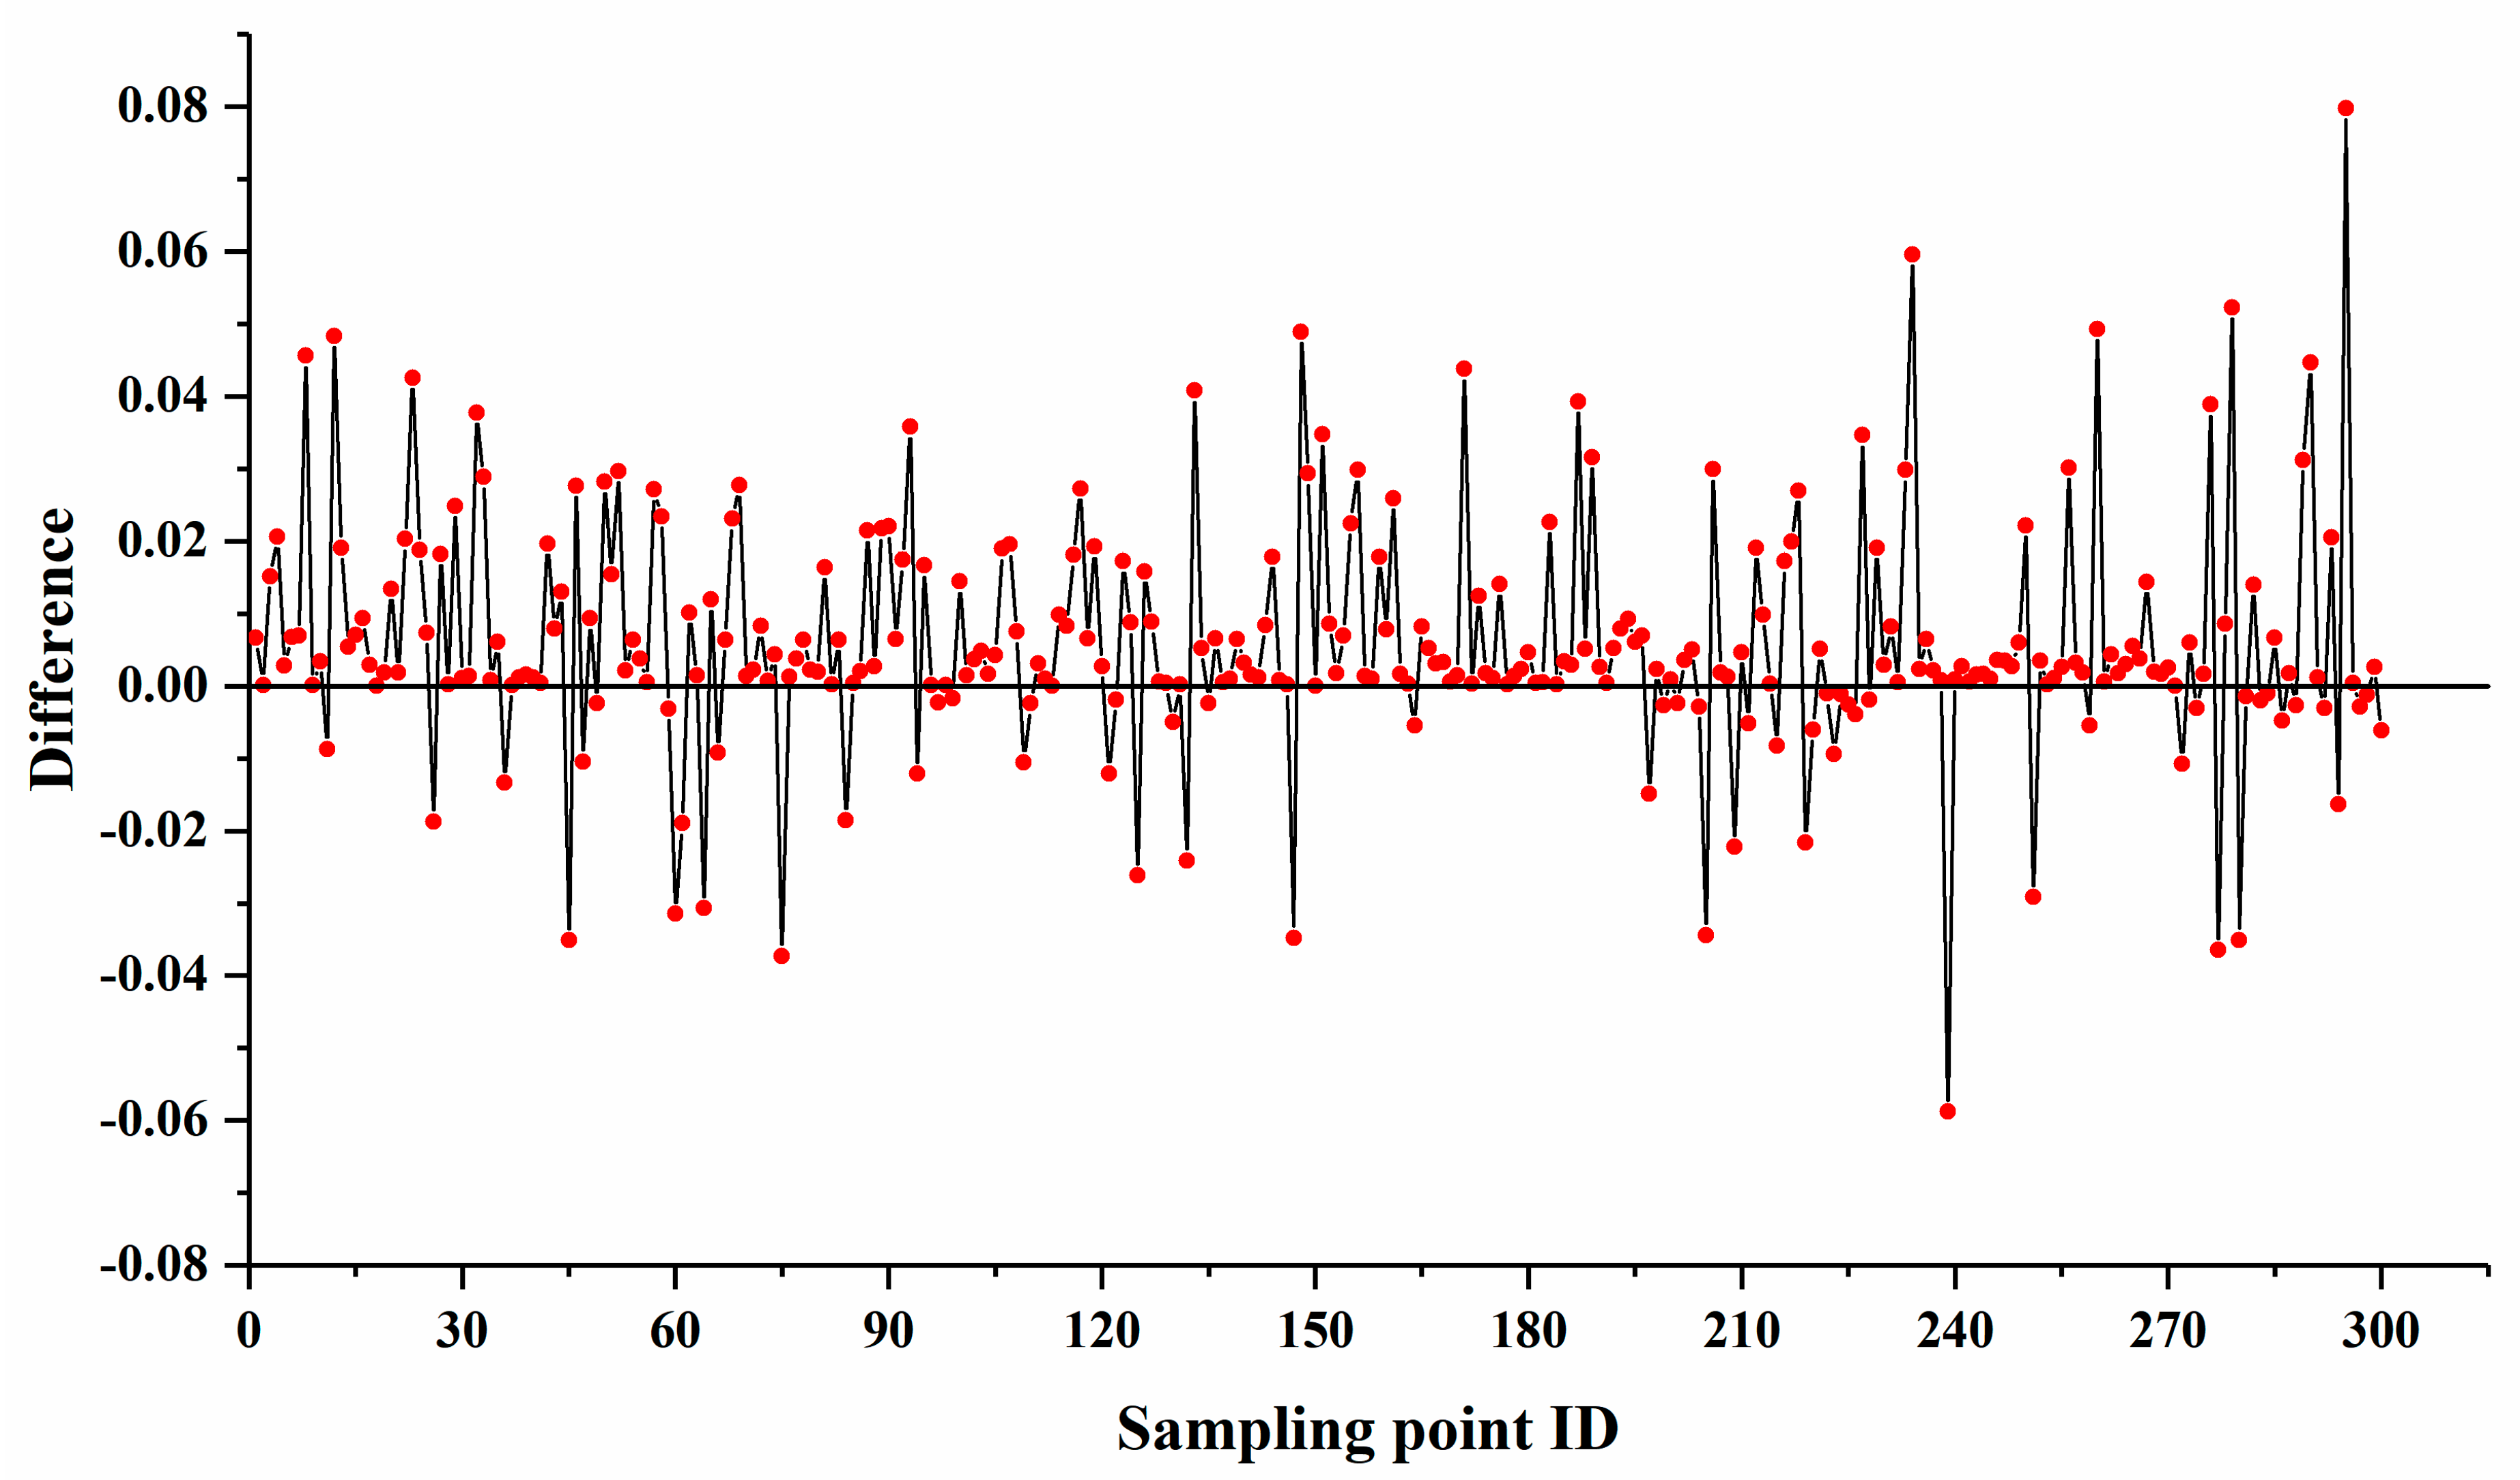
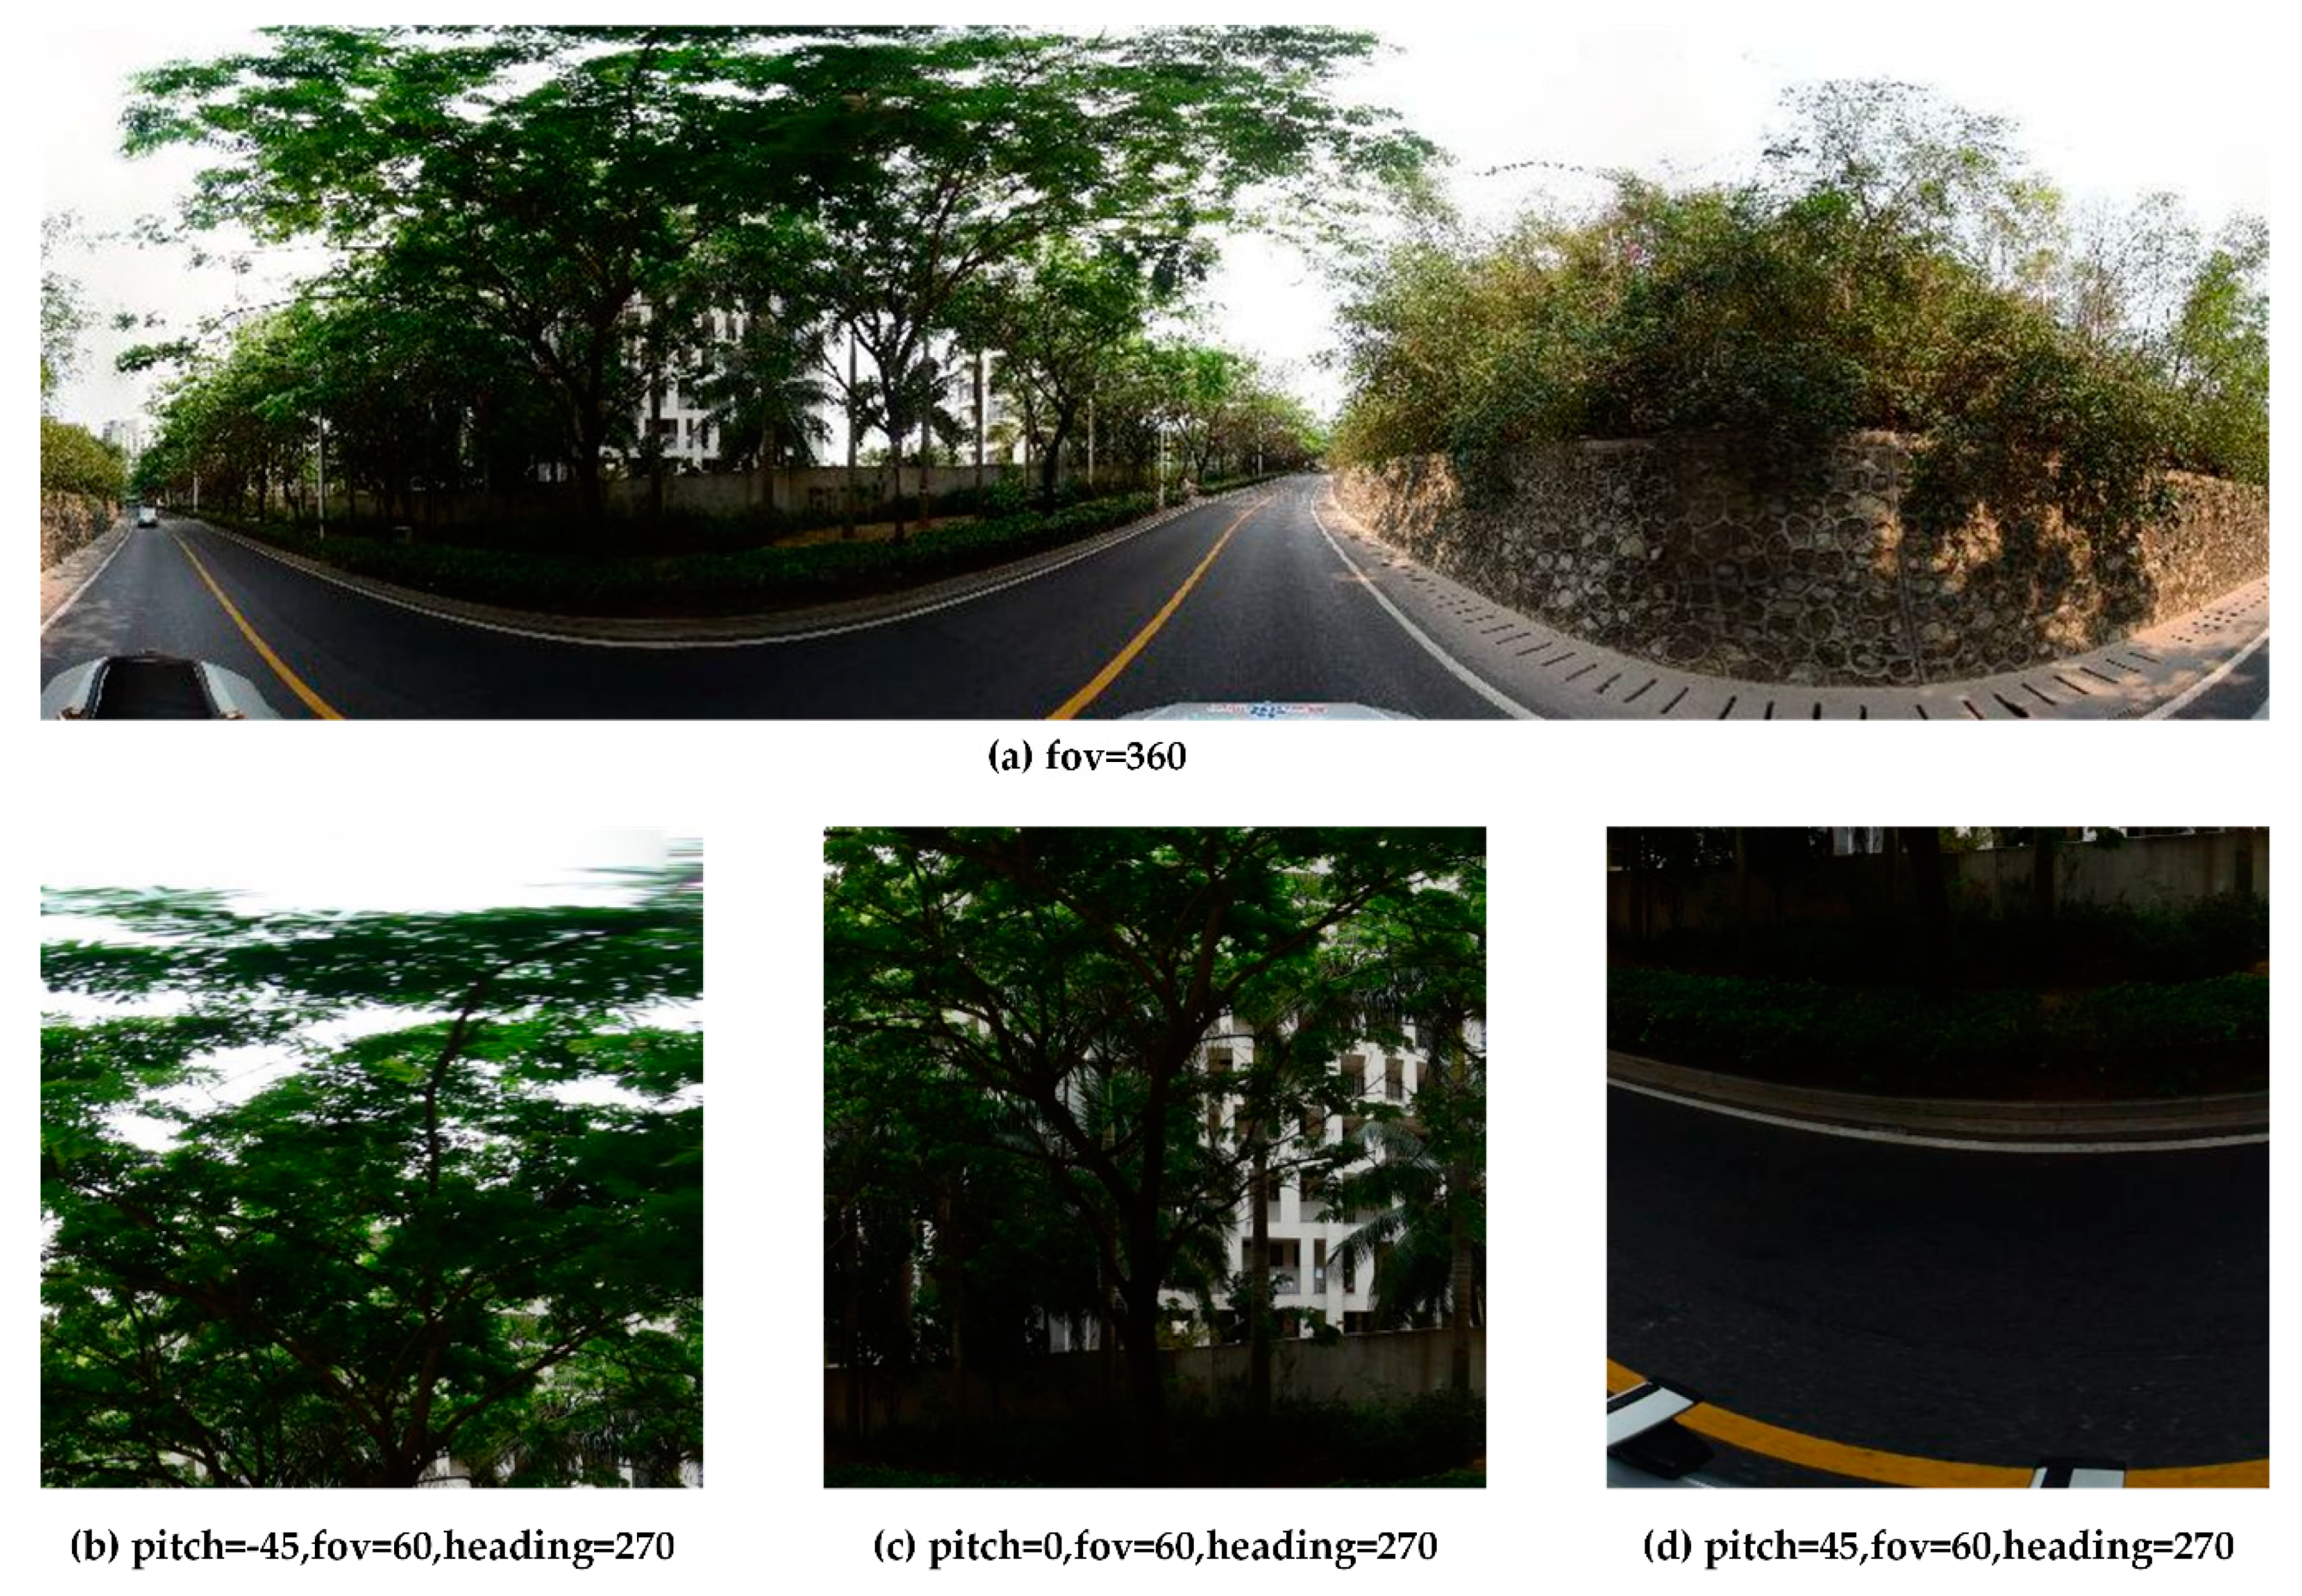
The authors randomly selected 300 points from the sampling points to compare the PGVI and the modified GVI [24]. The modified GVI values were calculated using Formula (3). Figure 9 shows the value differences between the PGVI and the modified GVI values, in which the difference is equal to the modified GVI value minus the PGVI value. As shown in Figure 9, most of the points have values greater than zero, which means that the values of the modified GVI are higher than those of the PGVI, and the root mean squared error (RMSE) is 0.017. The number of points with a PGVI value higher than that of the modified GVI is only 59. Some reasons contribute to the occurrence of value differences between the PGVI and the modified GVI. Compared with the PGVI, the modified GVI is based on images captured at six horizontal angles and three vertical angles. Figure 10 shows the Baidu street view images of a site where the modified GVI value is much higher than the PGVI value. Figure 10a shows the Baidu panoramic street view image, which is used to calculate the PGVI value. Figure 10b–d show the Baidu street view images at three different vertical view angles toward the west direction, where the size is 400 × 400 pixels, which is used to calculate the modified GVI value. It is easily found that the same area of vegetation appears in different vertical angle images, causing the pixels of vegetation to be repeatedly calculated for the modified GVI and making the value too high. Meanwhile, the Baidu panoramic street view image (Figure 10a) is a single image that covers the whole view of pedestrians and has no recurring areas. In this case, when the different vertical angle images contain the same area of vegetation, the modified GVI tends to overestimate the real greenery around streets. However, when there are no tall trees in the vertical direction and when the greenery in the horizontal direction is perfect, the modified GVI values are relatively lower than those of the PGVI because the Baidu street view images used to calculate the modified GVI miss some vegetation information in the horizontal direction.
4.2. Limitation and Future Research
In this study, we demonstrate that the Baidu panoramic street view images are suitable for evaluating urban greenery at the street level. Additionally, the authors believe there are still several limitations that need to be improved. First, the Baidu panoramic street view images captured for calculating the PGVI did not cover all areas; thus, they could not evaluate the greenery of all streets in the study area. This limitation is because some streets in the city cannot be reached with vehicles, resulting in the lack of street view images and the inability to study street greenery through the PGVI. With the advancement of Street View technology and the updating of capture equipment, the missing data of these streets will be supplemented in the future. By using the PGVI to evaluate the greenery of urban streets, the results will be more comprehensive. Second, the time the Baidu panoramic street view images captured was a certain moment, which only indicated the urban greenery around streets at that moment. For the urban greenery system, it is a dynamic ecosystem that is susceptible to external factors that will vary at any time. In addition, when the Baidu panoramic street view image acquisition time is winter, part of the vegetation in the urban greenery system is in the deciduous period, the PGVI results will lose the significance of urban greenery evaluation and reduce in reliability, which also limits the promotion and application of the PGVI. At present, Baidu is working to add the time series of captured street view images, and an online query system has been added to the “time machine” function. Users can view the street scene images at different points in time, but these data are still not available through the user API access. This issue also exists in other map companies in China. In the future, the time series problem may be solved by making the time of street view images accessible. Third, the accuracy of the classification method proposed in this paper could be further improved, for example, some greenery information may be covered by “blocking objects” or shadows. Several models have been developed to solve the problems based on some dataset, such as the Mapillary dataset or Cityscapes dataset [26,38]. Unfortunately, these datasets do not include Sanya city. However, we believe that with the growth of these datasets, in the future, we can combine them and Baidu panoramic street view images to improve the accuracy of urban street greenery extraction. Finally, in this study, we set the distance interval between the sampling points to 50 m to ensure that Baidu panoramic street view images were available on every street in the study area, assuming that this resolution would be consistent with the urban greenery seen from a pedestrian’s perspective. In previous studies of urban environments using different street view images, the distance intervals were set to 30-m or 100-m [24,29]. The impact of different distance intervals on the index and how long to set an interval are topics to be considered in future research.
5. Conclusions
This study attempts to evaluate urban street-level greenery from the perspective of pedestrians using Baidu panoramic street view images. We conducted a case study to evaluate street-level greenery using the PGVI in the central district of Sanya city of China. Results show that the Baidu panoramic street view images are qualified for assessing the distribution of greenery on both sides of the street. Compared to the GVI using multiple images from different directions at a sampling point, the calculation of PGVI is simplified because one Baidu panoramic street view image can cover the 360° view similar to that of a pedestrian. We argue that the PGVI can be regarded as a reliable tool for evaluating urban greenery around streets, helps city managers to further understand the urban green spaces, and provides a decision-making basis for giving full play to urban greening, which is beneficial to residents’ physical and mental health. However, the current research still has limitations that should be addressed in future studies.
Author Contributions
Conceptualization, X.C. and Q.M.; methodology, X.C.; validation, D.H. and L.Z.; formal analysis, X.C. and D.H.; writing—original draft preparation, X.C.; writing—review and editing, Q.M., D.H., L.Z. and J.Y.; project administration, Q.M. and J.Y.; funding acquisition, Q.M. and J.Y.
Funding
This research was funded by [Finance Science and Technology Project of Hainan Province, Remote Sensing Retrieval of Soil Moisture Based on GF-3 and Multispectral Satellite Data] grant number [2018NK08], [Hainan Province Natural Science Foundation of China, Study on Remote Sensing Extraction and multi temporal and spatial characteristics of urban impervious surface—Haikou as an example] grant number [417218], [the Major Projects of High Resolution Earth Observation Systems of National Science and Technology] grant number [05-Y30B01-9001-19/20-1], [Finance Science and Technology Project of Hainan Province] grant number [2018YD10].
Conflicts of Interest
The authors declare no conflict of interest.
References
- Feyisa, G.L.; Meilby, H.; Jenerette, G.D.; Pauliet, S. Locally optimized separability enhancement indices for urban land cover mapping: Exploring thermal environmental consequences of rapid urbanization in Addis Ababa, Ethiopia. Remote Sens. Environ. 2016, 175, 14–31. [Google Scholar] [CrossRef]
- Xian, G.; Crane, M.; Steinwand, D. Dynamic modeling of tampa bay urban development using parallel computing. Comput. Geosci. 2005, 31, 920–928. [Google Scholar] [CrossRef]
- Dillen, S.; de Vries, S.; Groenewegen, P.; Spreeuwenberg, P. Greenspace in urban neighbourhoods and residents’ health: Adding quality to quantity. J. Epidemiol. Community Health 2011, 66, e8. [Google Scholar] [CrossRef] [PubMed] [Green Version]
- Bowler, D.E.; Buyung-Ali, L.; Knight, T.M.; Pullin, A.S. Urban greening to cool towns and cities: A systematic review of the empirical evidence. Landsc. Urban Plan. 2010, 97, 147–155. [Google Scholar] [CrossRef]
- Janhäll, S. Review on urban vegeation and particle air pollution—Deposition and dispersion. Atmos. Environ. 2015, 105, 130–137. [Google Scholar] [CrossRef]
- Litschke, T.; Kuttler, W. On the reduction of urban particle concentration by vegetation—A review. Meteorol. Z. 2008, 17, 229–240. [Google Scholar] [CrossRef]
- Farinha-Marques, P.; Lameiras, J.; Fernandes, C.; Silva, S.; Guilherme, F. Urban biodiversity: A review of current concepts and contributions to multidisciplinary approaches. Innov. Eur. J. Soc. Sci. Res. 2011, 24, 247–271. [Google Scholar] [CrossRef]
- Nielsen, A.; van den Bosch, M.; Maruthaveeran, S.; Konijnendijk van den Bosch, C. Species richness in urban parks and its drivers: A review of empirical evidence. Urban Ecosyst. 2013, 17, 305–327. [Google Scholar] [CrossRef]
- Lafortezza, R.; Carrus, G.; Sanesi, G.; Davies, C. Benefits and well-being perceived by people visiting green spaces in periods of heat stress. Urban For. Urban Green. 2009, 8, 97–108. [Google Scholar] [CrossRef]
- Onishi, A.; Cao, X.; Ito, T.; Shi, F.; Imura, H. Evaluating the potential for urban heat-island mitigation by greening parking lots. Urban For. Urban Green. 2010, 9, 323–332. [Google Scholar] [CrossRef]
- Renterghem, T.; Botteldooren, D. View on outdoor vegetation reduces noise annoyance for dwellers near busy roads. Landsc. Urban Plan. 2016, 148, 203–215. [Google Scholar] [CrossRef] [Green Version]
- Derkzen, M.L.; van Teeffelen, A.J.; Verburg, P.H. Quantifying urban ecosystem services based on high-resolution data of urban green space: An assessment for Rotterdam, the Netherlands. J. Appl. Ecol. 2015, 52, 1020–1032. [Google Scholar] [CrossRef]
- Wolf, K. Business district streetscapes, trees, and consumer response. J. For. 2005, 103, 396–400. [Google Scholar]
- Lu, Y.; Sarkar, C.; Xiao, Y. The effect of street-level greenery on walking behavior: Evidence from Hong Kong. Soc. Sci. Med. 2018, 208, 41–49. [Google Scholar] [CrossRef]
- Kaczynski, A.T.; Henderson, K.A. Environmental correlates of physical activity: A review of evidence about parks and recreation. Leis. Sci. 2007, 29, 315–354. [Google Scholar] [CrossRef]
- Balram, S.; Dragievi, S. Attitudes toward urban green spaces: Integrating questionnaire survey and collaborative gis techniques to improve attitude measurements. Landsc. Urban Plan. 2005, 71, 147–162. [Google Scholar] [CrossRef]
- Camacho-Cervantes, M.; Schondube, J.; Castillo, A.; MacGregor-Fors, I. How do people perceive urban trees? Assessing likes and dislikes in relation to the trees of a city. Urban Ecosyst. 2014, 17, 761–773. [Google Scholar] [CrossRef]
- Humpel, N.; Owen, N.; Leslie, E. Environmental factors associated with adults’ participation in physical activity: A review. Am. J. Prev. Med. 2002, 22, 188–199. [Google Scholar] [CrossRef]
- Qian, Y.; Zhou, W.; Yu, W.; Pickett, S.T.A. Quantifying spatiotemporal pattern of urban greenspace: New insights from high resolution data. Landsc. Ecol. 2015, 30, 1165–1173. [Google Scholar] [CrossRef]
- Ruangrit, V.; Sokhi, B.S. Remote sensing and gis for urban green space analysis—A case study of jaipur city, rajasthan. Inst. Town Plan. India J. 2004, 1, 55–67. [Google Scholar]
- Faryadi, S.; Taheri, S. Interconnections of urban green spaces and environmental quality of Tehran. Int. J. Environ. Res. 2009, 3, 199–208. [Google Scholar]
- Yang, J.; Zhao, L.; McBride, J.; Gong, P. Can you see green? Assessing the visibility of urban forests in cities. Landsc. Urban Plan. 2009, 91, 97–104. [Google Scholar] [CrossRef]
- Aoki, Y.; Yasuoka, Y.; Naito, M. Assessing the impression of street-side greenery. Landsc. Res. 1985, 10, 9–13. [Google Scholar] [CrossRef]
- Li, X.-J.; Zhang, C.; Li, W.; Ricard, R.; Meng, Q.; Zhang, W. Assessing street-level urban greenery using google street view and a modified green view index. Urban For. Urban Green. 2015, 14, 675–685. [Google Scholar] [CrossRef]
- Li, X.; Zhang, C.; Li, W.; Kuzovkina, Y.A.; Weiner, D. Who lives in greener neighborhoods? The distribution of street greenery and its association with residents’ socioeconomic conditions in Hartford, Connecticut, USA. Urban For. Urban Green. 2015, 14, 751–759. [Google Scholar] [CrossRef]
- Stubbings, P.; Rowe, F.; Arribas-Bel, D. A hierarchical urban forest index using street-level imagery and deep learning. Remote Sens. 2019, 11, 1395. [Google Scholar] [CrossRef] [Green Version]
- Long, Y.; Liu, L. How green are the streets? An analysis for central areas of Chinese cities using tencent street view. PLoS ONE 2017, 12, e0171110. [Google Scholar] [CrossRef] [Green Version]
- Zhang, Y.; Dong, R. Impacts of street-visible greenery on housing prices: Evidence from a hedonic price model and a massive street view image dataset in Beijing. Int. J. Geo Inf. 2018, 7, 104. [Google Scholar] [CrossRef] [Green Version]
- Yu, X.; Zhao, G.; Chang, C.; Yuan, X.; Heng, F. Bgvi: A new index to estimate street-side greenery using baidu street view image. Forests 2018, 10, 3. [Google Scholar] [CrossRef] [Green Version]
- Zhang, W. Research Report on Livable Cities in China; Social Sciences Academic Press: Beijing, China, 2016. [Google Scholar]
- Baidu map open platform. A Baidu panoramic street view image at a specific position. Available online: http://api.map.baidu.com/panorama/v2?ak=E4805d16520de693a3fe707cdc962045&width=1024&height=320&location=111.67036,29.051787&fov=360 (accessed on 4 December 2019).
- Rother, C.; Kolmogorov, V.; Blake, A. Grabcut: Interactive foreground extraction using iterated graph cuts. ACM Trans. Graph. 2004, 23, 309–314. [Google Scholar] [CrossRef]
- Pacifici, F.; Del Frate, F.; Solimini, C.; Emery, W. An innovative neural-net method to detect temporal changes in high-resolution optical satellite imagery. Geosci. Remote Sens. IEEE Trans. 2007, 45, 2940–2952. [Google Scholar] [CrossRef]
- Otsu, N. A threshold selection method from gray-level histogram. Automatica 1975, 11, 285–296. [Google Scholar] [CrossRef] [Green Version]
- Narayanan, S.A.; Arumugam, G.; Bijlani, K. Trimmed median filters for salt and pepper noise removal. Int. J. Emerg. Trends Technol. Comput. Sci. 2013, 2, 35–40. [Google Scholar]
- Gualtieri, J.A.; Cromp, R.F. Support vector machines for hyperspectral remote sensing classification. Proc. SPIE 1999, 3584, 221–232. [Google Scholar]
- Chen, J.; Yang, S.; Li, H.W.; Zhang, B.; Lv, J. Research on geographical environment unit division based on the method of natural breaks (jenks). ISPRS Int. Arch. Photogramm. Remote Sens. Spat. Inf. Sci. 2013, XL-4/W3, 47–50. [Google Scholar] [CrossRef] [Green Version]
- Cai, B.Y.; Li, X.J.; Seiferling, I.; Ratti, C. IEEE. Treepedia 2.0: Applying deep learning for large-scale quantification of urban tree cover. In The 2018 IEEE International Congress on Big Data; IEEE: New York, NY, USA, 2018; pp. 49–56. [Google Scholar]
Figure 1.
Location and road network of the study area.

Figure 2.
The street network and sampling points of the study area.

Figure 3.
Baidu panoramic street view image in a specific location.

Figure 4.
Urban elements extraction results of the six types of road.

Figure 5.
The accuracy inspection of the Panoramic Green View Index (PGVI). PGVI refers to the values calculated with the proposed method; Reference (manual: (a)) refers to the ratio of green vegetation calculated with the manual method; Reference (PSPNet: (b)) refers to the ratio of green vegetation calculated with the PSPNet method.

Figure 6.
PGVI values at sampling points calculated using Formula (3) in the study area. The sizes of the solid dots represent the magnitudes of the PGVI values.
Figure 6.
PGVI values at sampling points calculated using Formula (3) in the study area. The sizes of the solid dots represent the magnitudes of the PGVI values.

Figure 7.
The frequency distribution histogram of the PGVI values.

Figure 8.
The statistical PGVI values of different road types; the blue columns represent the PGVI average values, and the red columns represent the PGVI square deviation values.
Figure 8.
The statistical PGVI values of different road types; the blue columns represent the PGVI average values, and the red columns represent the PGVI square deviation values.

Figure 9.
Value differences between the PGVI and the modified GVI values (GVI – PGVI).

Figure 10.
The Baidu street view images of a site (Lat = 109.497586, Lon = 18.217932). (a) The Baidu panoramic street view image, fov = 360. (b) The Baidu street view image with pitch = −45, fov = 60 and heading = 270. (c) The Baidu street view image with pitch = 0, fov = 60 and heading = 270. (d) The Baidu street view image with pitch = 45, fov = 60 and heading = 270.


Table 1.
Rules for automatically extracting urban environmental elements (vegetation, sky, and building) from Baidu panoramic street view images.
Table 1.
Rules for automatically extracting urban environmental elements (vegetation, sky, and building) from Baidu panoramic street view images.
| Step 1: Use the GrabCut segmentation algorithm to split images into different regions |
| Step 2: Calculate the Brightness of each pixel as stated in Formula (1) |
| Step 3: Find the threshold in the Brightness and blue band by Otsu’s method |
| Step 4: Extract the sky pixels from the image for each pixel [i, j]: if [i, j] > thresholdBrightness and [i, j] > thresholdblue mark [i, j] as a sky pixel |
| Step 5: Extract vegetation pixels from the image according the BP neural-network method |
| Step 6: Define the remaining pixels as building |
| Step 7: Remove the “salt and pepper” effect by an iterative trimmed median filter |
Table 2.
Evaluation metrics results of the three methods.
| Method | Mean IoU (%) | MAE (%) |
|---|---|---|
| Manual | 63.9 | 4.78 |
| Method proposed in this paper | 64.2 | 5.02 |
| PSPNet | 65.4 | 4.81 |
© 2019 by the authors. Licensee MDPI, Basel, Switzerland. This article is an open access article distributed under the terms and conditions of the Creative Commons Attribution (CC BY) license (http://creativecommons.org/licenses/by/4.0/).
Share and Cite
MDPI and ACS Style
Chen, X.; Meng, Q.; Hu, D.; Zhang, L.; Yang, J. Evaluating Greenery around Streets Using Baidu Panoramic Street View Images and the Panoramic Green View Index. Forests 2019, 10, 1109. https://0-doi-org.brum.beds.ac.uk/10.3390/f10121109
AMA Style
Chen X, Meng Q, Hu D, Zhang L, Yang J. Evaluating Greenery around Streets Using Baidu Panoramic Street View Images and the Panoramic Green View Index. Forests. 2019; 10(12):1109. https://0-doi-org.brum.beds.ac.uk/10.3390/f10121109
Chicago/Turabian StyleChen, Xu, Qingyan Meng, Die Hu, Linlin Zhang, and Jian Yang. 2019. "Evaluating Greenery around Streets Using Baidu Panoramic Street View Images and the Panoramic Green View Index" Forests 10, no. 12: 1109. https://0-doi-org.brum.beds.ac.uk/10.3390/f10121109
Note that from the first issue of 2016, this journal uses article numbers instead of page numbers. See further details here.