Article

Litter Management as a Key Factor Relieves Soil Respiration Decay in an Urban-Adjacent Camphor Forest under a Short-Term Nitrogen Increment

1
Faculty of Life Science and Technology, Central South University of Forestry and Technology, Changsha 410004, China
2
National Engineering Laboratory for Applied Forest Ecological Technology in Southern China, Changsha 410004, China
3
Laboratory of Urban Forest Ecology of Hunan Province, Changsha 410004, China
4
Guangxi Academy of Forestry, Nanning 530002, China
*
Authors to whom correspondence should be addressed.
Submission received: 14 December 2019 / Revised: 31 January 2020 / Accepted: 11 February 2020 / Published: 14 February 2020
(This article belongs to the Section Forest Ecology and Management)

Abstract

:
Increases in bioavailable nitrogen (N) level can impact the soil carbon (C) sequestration in many forest ecosystems through its influences on litter decomposition and soil respiration (Rs). This study aims to detect whether the litter management can affect the influence of N addition on Rs. We conducted a one-year field experiment in a camphor forest of central-south China to investigate the responses of available N status and soil Rs to N addition and litter manipulation. Four N addition plots (NH4NO3; 0, 5, 15, 30 g N m−2 year−1 as N0, N1, N2, N3, respectively) were established with three nested litter treatments: natural litter input (CK), double litter input (LA), and non-litter input (LR). We found a short-lived enhancement effect of N addition on soil (NO3-N) and net nitrification (RN), but not on (NH4-N), net ammonification (RA), or mineralization (RM). N addition also decreased Rs in CK spots, but not in LA or LR spots, in which the negative effects of N additions on Rs were alleviated by either litter addition or reduction. A priming effect was also observed in LA treatments. A structural equation modeling analysis showed that litter treatments had direct positive effects on soil available N contents and Rs, which suggested that litter decomposition may benefit from litter management when N is not a limiting factor in subtropical forests.

1. Introduction

The anthropogenic input of reactive nitrogen (N) has increased 3- to 5-fold on a global scale [1], mainly through fossil-fuel burning and artificial nitrogen fertilizer applications [2]. The increased N input has led to many ecological effects in terrestrial ecosystems [3], such as soil acidification [4], nutrient imbalance [5], biodiversity loss [6,7], greenhouse gas emission [8], and global climate change [9]. In the subtropical forests of Southern China, N-saturated caused by elevated N deposition was usually quantified by nitrate leaching measurements [10]. Yet, whether the altered soil N status that resulted from the increased N level can influence soil carbon (C) dynamics in forest ecosystems is not well understood.
Soil respiration (Rs), an essential component of the C cycle, is the primary pathway of carbon dioxide (CO2) flux from soil to atmosphere [11]. As the increasing concern about the effects of globally reactive N deposition on Rs [12], the responses of Rs to the altered N status remain controversial [13] and could either increase [14,15], decrease [12,16], or not change [17,18] in different terrestrial ecosystems. In forests, one possible reason for the highly variable response of Rs is mainly attributed to background soil N status before N addition. For example, in an N limited ecosystems, N addition could stimulate root biomass [19] and soil microbial biomass or activity [20], and thereby raise the Rs. In contrast, with increasing N deposition rate and duration, effects on soil microbial growth, composition, and function can be negative [21] as a result of increased acid cation toxicity [22] and alterations in predominant microbial life-history strategies [23]. Moreover, enzymatic activities and the decomposition of soil organic matter (SOM) and litter would be inhibited by the soil acidification from excessive N and thus reduce Rs [12].
On the other hand, the elevated soil N availability of forest ecosystems usually increases aboveground net primary production [24], thereby changing both the quality and quantity of litter input to soil [25]. Meanwhile, the increasing decomposition of litter inputs may directly impact Rs [26] or indirectly affect Rs through stimulating the mineralization of resident SOM, which was defined as “priming effects” [27]. However, there is still no consensus on the responses of Rs to litter management in different forest ecosystems [28]. In particular, the effects of incremental N deposition on litter decomposition usually show greater C stabilization through an inhibition of microbial and enzyme activity [29]. Therefore, it is crucial to detangle the effect of litter manipulation on Rs under N additions [30], especially for those of N saturated systems.
In this study, we performed a field experiment in an urban-adjacent camphor (Cinnamomum camphora (L.) Presl) forest with different N addition levels and litter manipulations. We examined soil CO2 efflux, hydrothermal factors, and the soil N transformation process to address two questions: (1) How did the combination of N addition and litter manipulation affect the available N status and soil Rs? (2) Of those, which was the key factor determining the Rs?

2. Materials and Methods

2.1. Study Site

The study site was located in an urban-adjacent camphor tree plantation at Hunan Forest Botany Park, Changsha, Hunan Province, China (113°02′~01′ E, 28°06′~07′ N, elevation of 46–114 m, site slope of 5–15°). The climate of this region is a typical subtropical moist monsoon with a mean annual temperature of 17.4 °C, in which the lowest temperature is in January (4.7 °C) and the highest is in July (29.4 °C). The range of annual precipitation is from 1200 mm to 1700 mm, most of which occurs from April to August. The basic soil characteristics of the experiment site are shown in Table 1. The mean value (2006–2016) of wet N deposition was about 3.92 (g N m−2 year−1) in the study area [31]. Most of the camphor trees were planted in 1982 with an initial tree density of 2 m × 3 m. Understory consisted of Quercus fabri, Paulowwnia tomaentosa, Castanopsis sclerophylla, Symplocos caudata, Clerodendron cyrtophyllum, Nephrolepis auriculata, Lophantherum gracile, and Phytolacca acinosa.

2.2. Experimental Design

In May 2010, twelve 20 m × 20 m plots were established with a >3 m buffer zone between each other. Plots were divided into four N treatments: N0 (no N input), N1 (5 g N m−2), N2 (15 g N m−2), N3 (30 g N m−2) and each treatment replicated three times following a completely randomized design in study site (Figure S1). N fertilizer was performed as a one-time treatment with NH4NO3 that was dissolved in 20 L of water and evenly spread in each plot. N0 plots were sprayed with the same amount of deionized water. Within each plot, three spots were selected for soil respiration measurements, at intervals of more than 3 m, and treated as one of three ways: natural litter input (control, CK), non-litter input (litter removal, LR), and double litter input (litter addition, LA, Figure S1). For each LR spot, a fishing net (3 m × 4 m) made of anti-static polyester with 1 mm mesh, was installed about 0.8 m above the forest floor (all litter materials were removed at the beginning time) to prevent litter falling. At the end of each month, all of those collected litter were distributed evenly into the LA treatment of the same plot. In total, there were 36 measurement points (4 N treatments × 3 litter treatments × 3 replicates).

2.3. Resin-Core Preparation and Incubation

The in situ incubation in the 0 to 10 cm soil depth was carried out four times (July and October in 2010, January and April in 2011) during the one year experiment that followed them using the resin-core technique [32]. At each time, we inserted two open PVC tubes (4.2 cm in diameter and 12 cm in height) into the soil and kept the litters and upper layer soil (0–10 cm) in each tube. One of the tubes was directly transported to a laboratory for nutrient analysis (inorganic N, pH, organic C (TOC), Total N (TN), and soil water content). For another, 2 cm of bottom layer was excavated and replaced with a combination of filter paper, an anion exchange resin bag (5 g beads in nylon stockings, 717#, produced by the Huizhi resin Plant of Shanghai), more filter paper, and then a cylindrical block of gypsum (in that order, from top to bottom, the total height of resin bag and plaster is about 2 cm) [33]. After that, the assembled tubes were returned to the original position and left for in situ incubation for about 30 days.

2.4. Soil and Resin Bags Analyses

All soil samples (initial and incubation) and resin bags were stored at 4 °C overnight until the next stage of processing. Soil from tubes were removed using a screwdriver, immediately weighed, and then homogenized and sieved through a 2 mm screen after stones and plant roots were removed. Inorganic N of soil samples (resin bags) were extracted by 10 g fresh (5 g resin beats) subsamples with 50 mL of 2 M KCl shaken for 1 h and filtered through Whatman No. 2 filter paper. Soil ammonium content (NH4-N) was measured by Nessler’s reagent colorimetric method, whereas nitrate (NO3-N) was measured by an ultraviolet spectrophotometry method [34]. Another fresh soil subsample (10 g) was used to measure soil water content (SWC), which was determined gravimetrically by oven-drying at 105 °C for 24 h. Soil temperature (ST) at 10 cm of depth was measured with a soil thermocouple probe (LI-COR 8100-201 Omega) in soil sampling days. Soil bulk density was measured using the core method. The remaining soil samples were air dried and then used to measure pH, TOC, and TN. The soil pH values were determined in water (water: soil = 2.5:1) suspension. The TOC concentrations were analyzed using the potassium oxidation method (H2SO4–K2Cr2O7) [35]. The TN concentrations were measured using the Semimicro–Kjeldahl method [36].

2.5. Soil Respiration Measurement

Rs rate was measured using a portable infra-red gas analyzer LI-COR 8100 with a soil chamber (LI-COR Inc., Lincoln, NE, USA). Two PVC collars (21 cm in diameter and 8 cm in height, leaving 4 cm protruding above the soil surface) were inserted into every sampling spot in May 2010 and kept in place through the entire study (Figure S1). In order to minimize the effects of soil disturbance, two months later, measurements were conducted during the resin-core incubation periods (twice a month on the initial and incubation sampling day) in July and October in 2010 and January and April in 2011, respectively. The value of Rs at each sampling spots was the mean of the two PVC observation points, which were expressed as μmol m−2 s−1.

2.6. Data Analysis

N mineralization rates were determined by comparing variations between the values of in-site incubation soil cores and the initial concentrations. The rates of soil net ammonification (RA), nitrification (RN), and mineralization (RM) were calculated as:
RA = [(NH4-N)t − (NH4-N)0]/Δt
RN = [(NO3-N)t +(NO3-N) resin − (NO3-N)0}/Δt
RM = (RA + RN)/Δt
where Δt is the time of incubation (30 days), (NH4-N)t and (NO3-N)t are the N content (NH4+ or NO3) after the incubation, (NH4-N)0 and (NO3-N)0 are the N content at the start time of incubation, and (NO3-N) resin is the nitrate absorbed by the resin bags.
The relationships between soil temperature and soil respiration were calculated by an exponential equation:
Rs = a × exp b × ST
where ST is the soil temperature, Rs is the soil respiration rate at the given soil temperature, and a and b are fitted parameters. Then, the temperature sensitivity (Q10) values were calculated by inserting the parameter b [37]:
Q10 = exp 10 × b
Priming effects (PE) via litter treatments were estimated by the following equations:
Rlitter = RCK − RLR
Rexpected = RCK + Rlitter
PE = (RLA − Rexpected)/Rexpected × 100%
where RCK, RLA, and RLR are measured Rs in CK, LA, and LR spots, Rlitter is the calculated litter respiration from the decomposition from aboveground litter, assuming that the litter respiration remains constant and, Rexpected is the expected Rs in double litter treatment.
The assessment of data normality was examined using the Kolmogorov-Smirnov test with the R package “dgof” before analysis, and ln-transformation was used if necessary. A three-way ANOVA analysis was applied to determine the main and interactive effects of N fertilizers, litters inputs, and season on the Rs, CRs, (NH4-N), (NO3-N), RA, RN, and RM. A Duncan’s test (‘agricolae’ package) was used to identify the differences in the measured variables when the main or interactive effects were significant at p < 0.05. A linear regression analysis was also employed to evaluate the correlations of the changes in Rs with hydrothermal factors (ST and SWC) and net N mineralization processes (RA, RN, and RM).
In addition, we applied a structural equation modeling (SEM) approach to evaluate hypothetical pathways (Figure S2) of N fertilizers, litter inputs, and seasonal effects on Rs, both directly and indirectly, via hydrothermal factors and soil available N status (NH4-Nand NO3-N). We tested how Rs responds to the changes in environmental variables (ST, SWC, NH4-N and NO3-N) and their interactions under the two different treatments and seasonal variations in the first model. An alternative (available N status independent) model on Rs was also conducted under N and litter treatments, as the effects of soil nutrient variables on Rs might be obscured by the high correlation between Rs and ST. The model with the lowest AIC (Akaike’s information criterion) was accepted as the optimal model. The SEM analyses were performed with a piecewise SEM package (2.0.2) using the maximum likelihood estimation method [38]. All analyses were conducted in R 3.6.0 (R Project for Statistical Computing; http://www.R-project.org) and were visualized by Origin 2018 (Originlab, Northampton, MA, USA).

3. Results

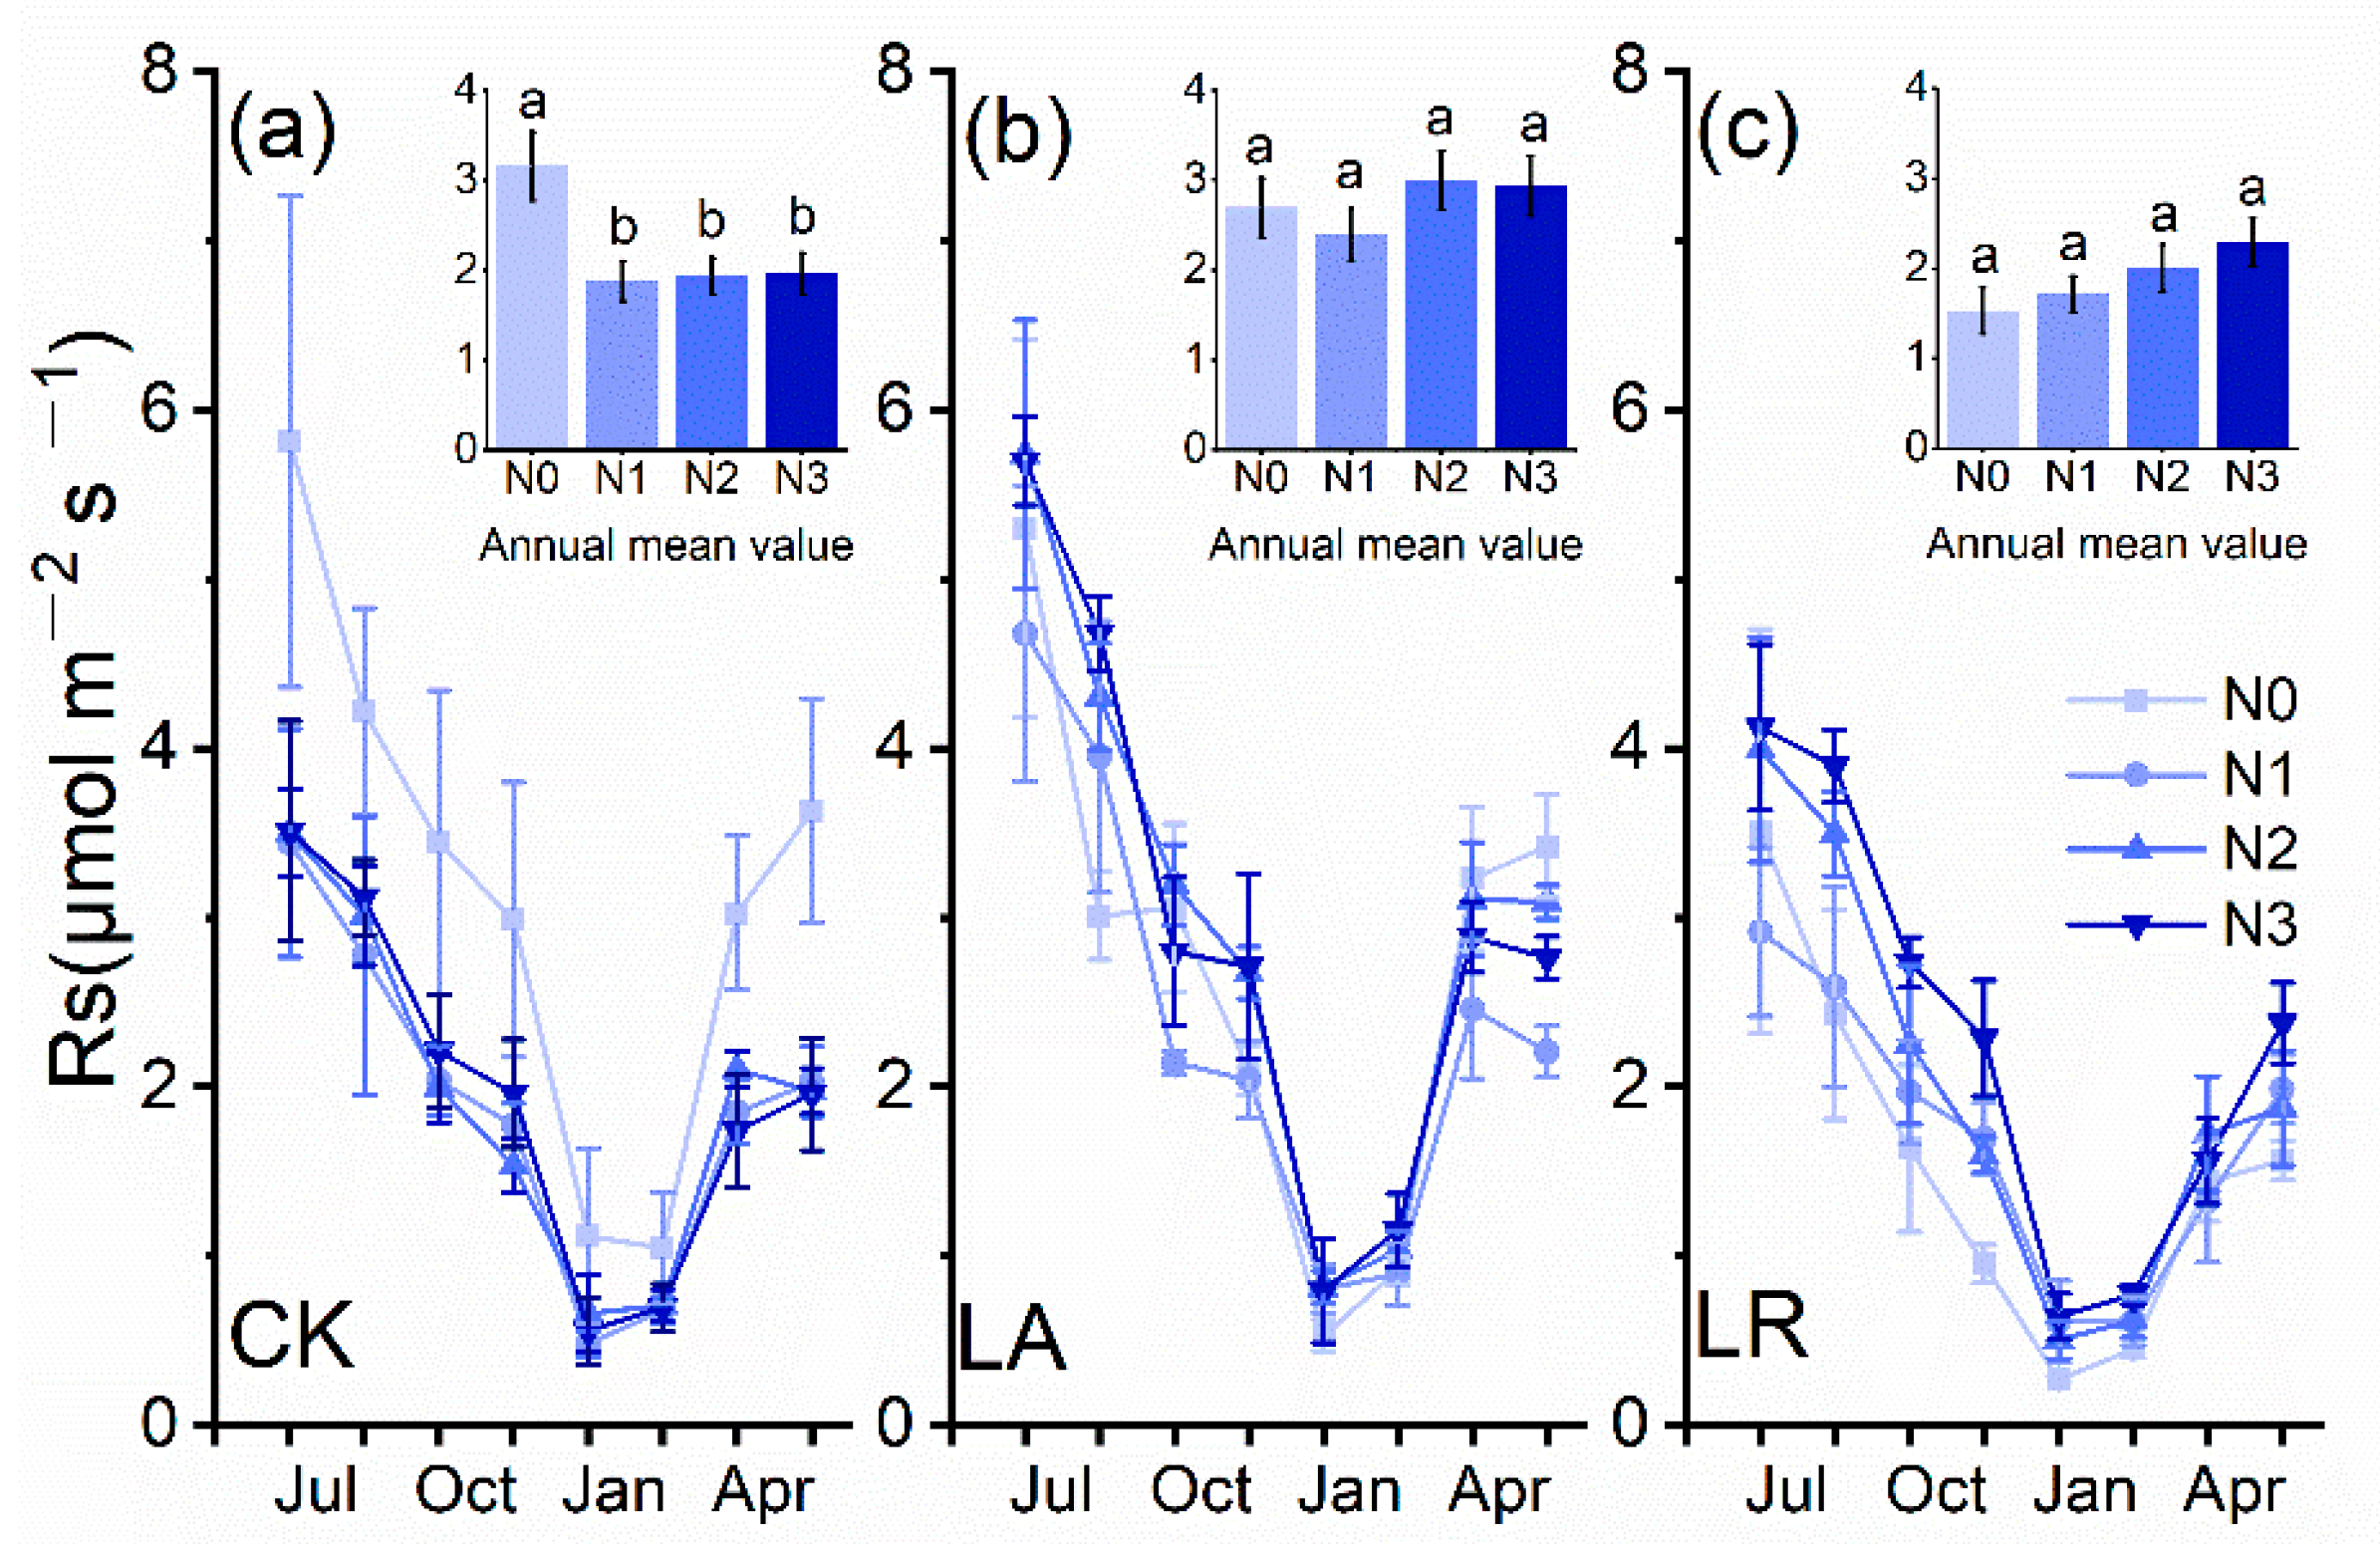
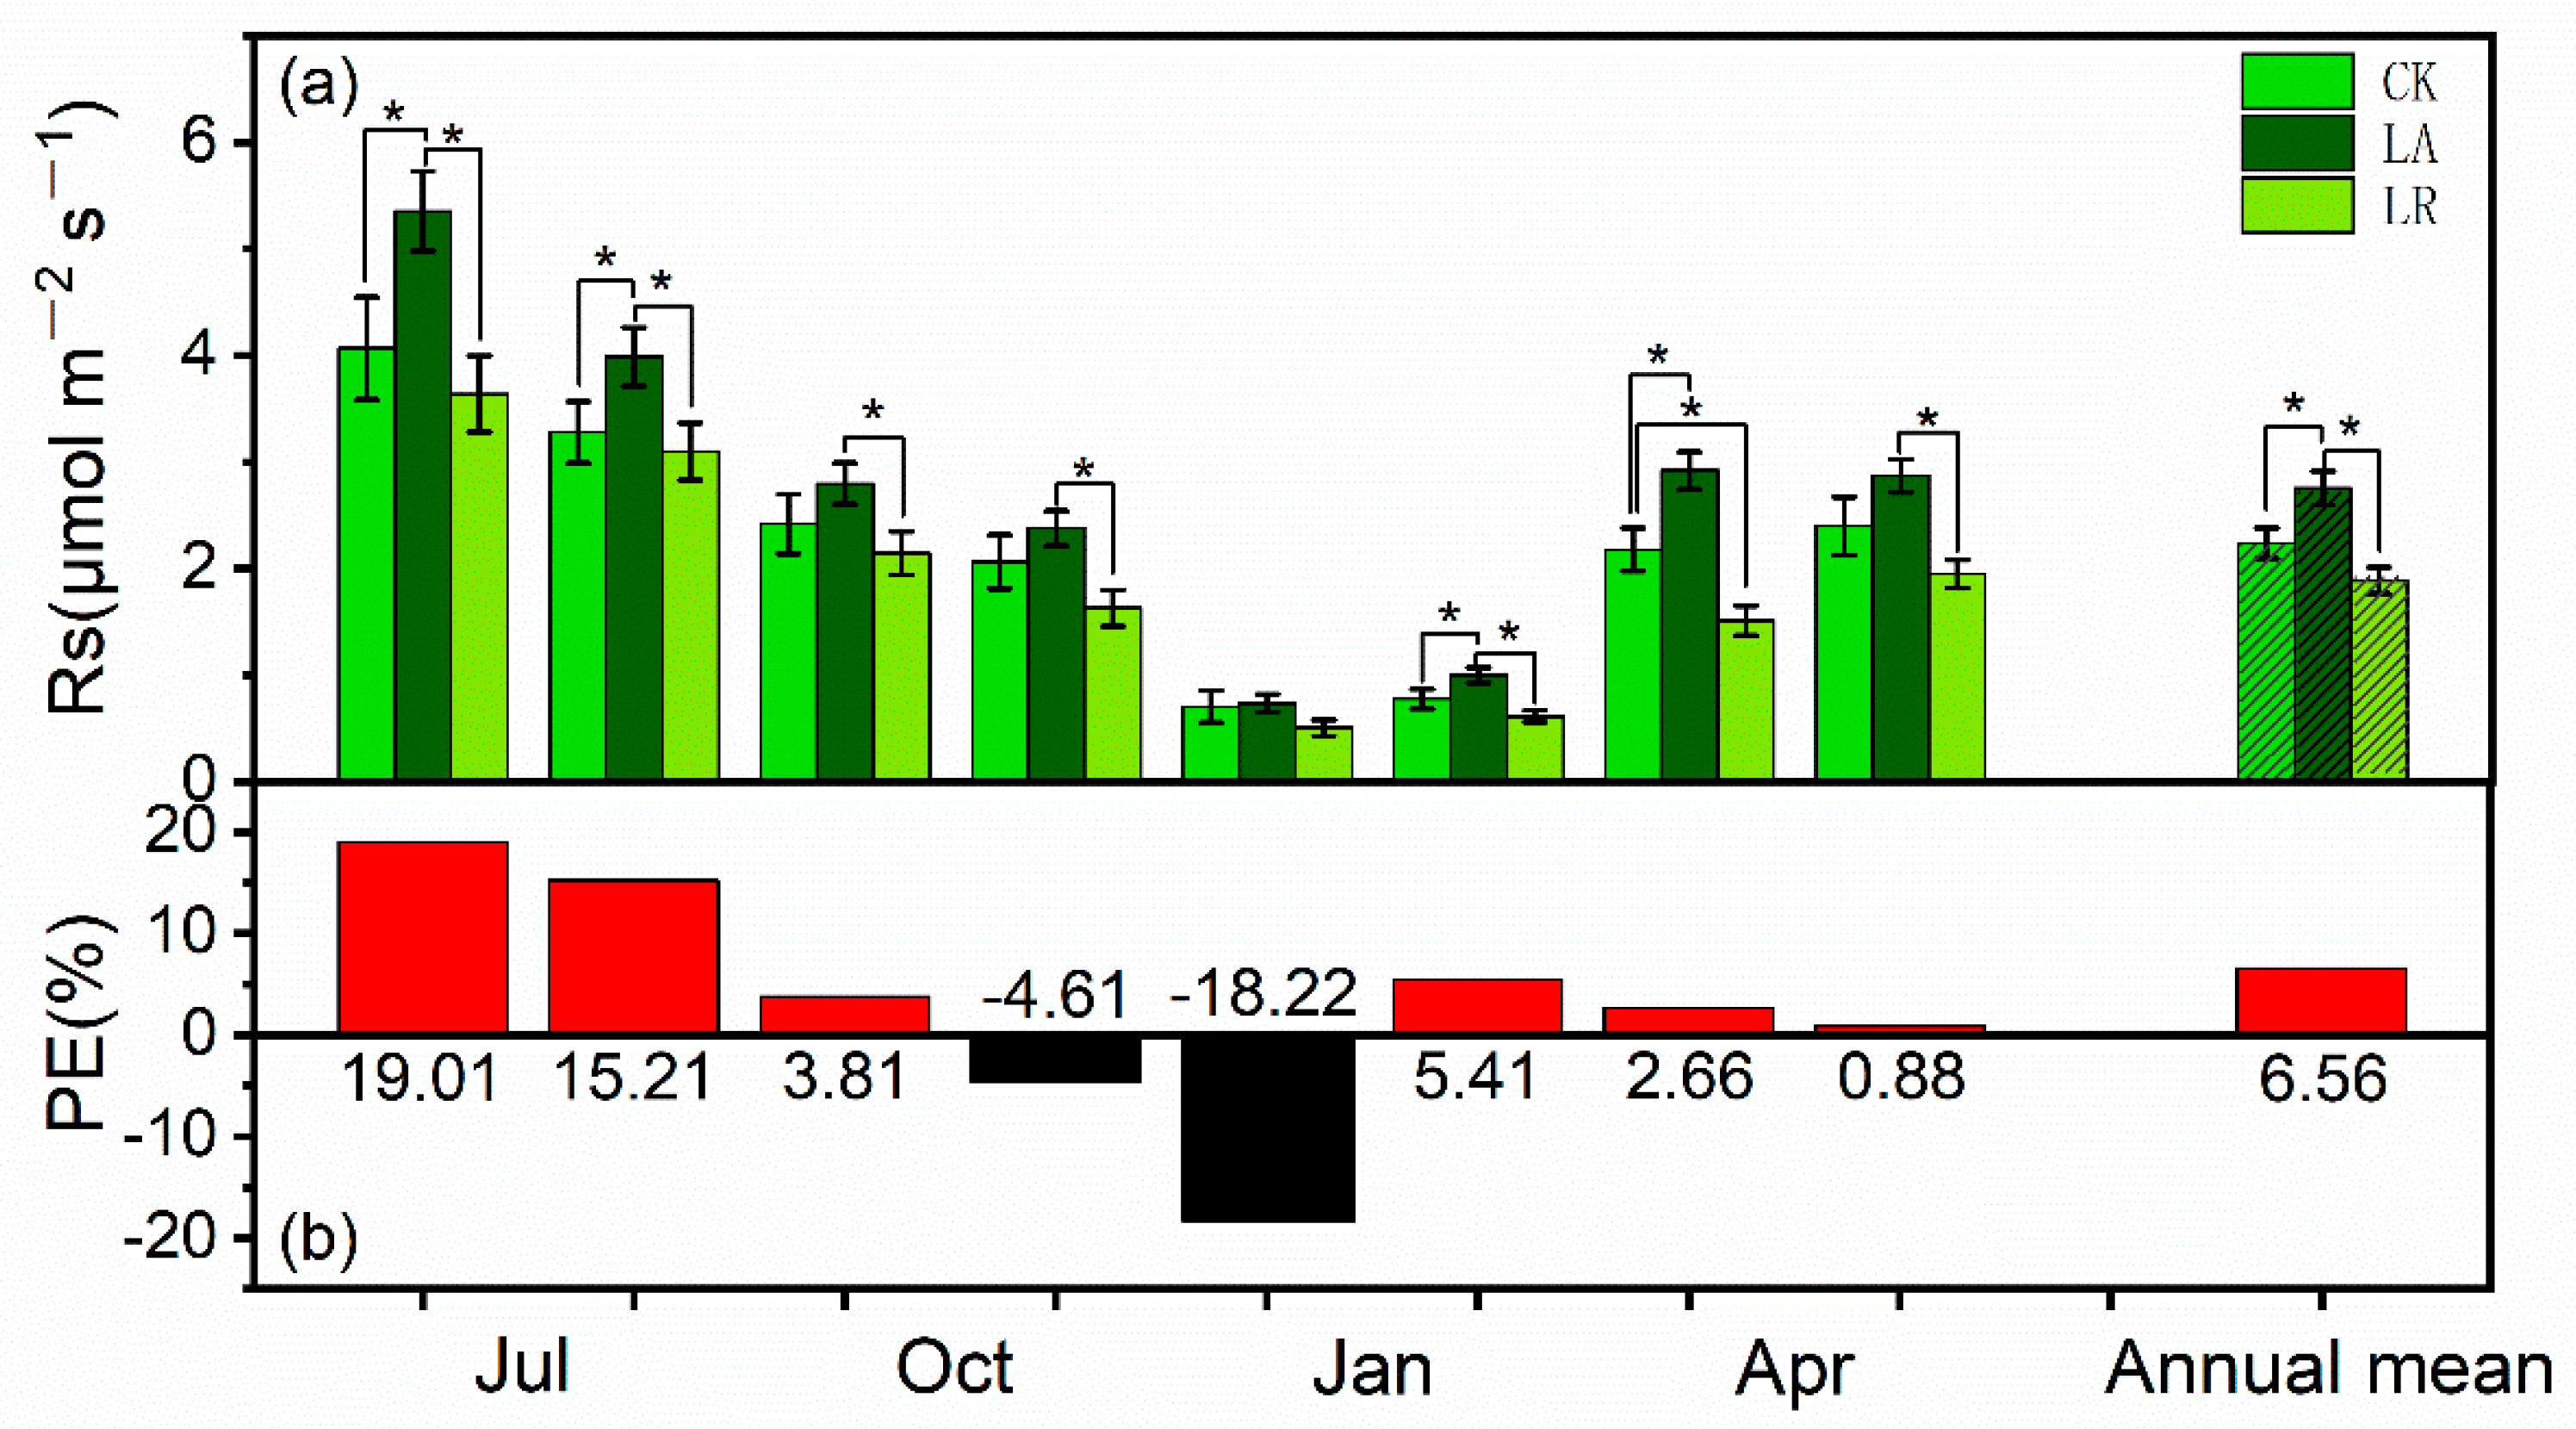
3.1. Soil Respiration (Rs) Rates and Priming Effects (PE)

Generally, only litter treatment and seasonal change had significant effects on Rs (both p < 0.001), while N addition had no significant effect (p = 0.841, Table 2). Rs in all treatments exhibited similarly seasonal patterns with the highest fluxes in summer time (July) and the lowest fluxes in winter (January) (Figure 1). Variations of Rs were significantly positively associated with ST (R2 = 0.54, p < 0.001), but not with SWC (R2 = 0.004, p = 0.266, Figure S3). The Q10 values were also affected by litter changes, which was 2.08 for CK, 2.16 for LA, and 2.28 for LR treatment, respectively (Table S1).
Compared to the N0 treatment, the mean annual Rs was significantly suppressed by 40.4% for N1, 38.8% for N2, and 37.7% for N3, respectively (p < 0.05), but no significant differences were found among the three N-treated plots (N1, N2 and N3) (Figure 1a). However, under the LA and LR treatments, the inhibiting effects of N addition on Rs were no longer significant (Figure 1b,c).
When the Rs of the N0-N3 levels were averaged, LA treatments promoted Rs, whereas the LR suppressed in all incubation periods compared to the CK (Figure 2a). However, litter treatment effects on Rs varied in months that the highest positive PE was exhibited in July (19.01%), the lowest negative PE was presented in January (−18.22%), and the annual mean PE was 6.56% (Figure 2b).

3.2. Soil Inorganic N and Net N Mineralization

A three-way ANOVA analysis showed that seasonal changes affect all of the soil’s inorganic N and its transformation processes (Table 2). N fertilizers had significant effects on (NO3-N) (p < 0.001) and RN (p < 0.001), whereas litter inputs affects (NH4-N) (p = 0.001) and (NO3-N) (p = 0.028, Table 2).
(NH4-N) of LA spots in all N plots were higher than those of the CK and LR spots, and the annual means of (NH4-N) were 12.97 ± 1.07 for CK, 17.50 ± 1.38 for LA, and 12.21 ± 1.13 mg kg−1 for LR, respectively (Figure 3a). (NO3-N) contents were significantly enhanced by N addition in initial time, but these effects were weakly enhanced later on (Figure 3b). Moreover, N addition with litter treatment showed a significant interaction effect on (NO3-N), which meant that the mean value of CK (16.34 ± 3.60 mg kg−1) and LA (18.23 ± 4.54 mg kg−1) in N3 plots was significantly higher than the other N treatments. Furthermore, the mean value of N0-N3 in the LA spots was significantly higher than that of the LR spots (Figure 3b).
In July, RN of N3 (0.89 ± 0.05 mg kg−1 d−1) treatment was significantly higher than N0-N2 treatments (0.02 ± 0.09 to 0.16 ± 0.01 mg kg−1 d−1) (Figure 4a). However, in the April of the following year, all the N addition treatments significantly increased RN compared to the N0 treatment (Figure 4a). The highest mean RA was 0.81 ± 0.08 mg kg−1 d−1 in October, but negative values were found in other incubation periods (Figure 4b). Similar patterns were also found for RM processes across the experimental treatments (Figure 4c).

3.3. Effects of N Availability on Soil Respiration

Statistically significant positive linear relationships were found in RN (R2 = 0.109, p < 0.001, Figure 5a) and RM (R2 = 0.040, p = 0.009, Figure 5c) with Rs. However, RA was not significantly correlated with Rs (R2 = 0.002, p = 0.579, Figure 5b).
The SEM model (Fisher’s C = 17.21, p = 0.51, AIC = 65.21) showed that all predictor variables together accounted for 61% of the variation of Rs, ST was the most significantly direct predictors of Rs, and that litter treatments (positive) and seasonal changes (negative) also had significant direct effects on Rs. However, the non-significant effects of (NH4-N) and (NO3-N) on Rs were found in the model (Figure 6a, Table S2). Thus, an alternative model was conducted without ST, SWC, or seasonal factors to detect the effects of N availability on Rs, which accounted for 14% of the variation of Rs (Fisher’s C = 1.34, p = 0.51, AIC = 27.34) (Figure 6b, Table S3). Litter treatments were the direct positive predictors, (NH4-N)and (NO3-N) were also turned to be the direct factors in this model for Rs. Noticeably, litter treatments exerted a positive effect on (NH4-N) and (NO3-N), which also indirectly affected Rs.

4. Discussion

4.1. Soil Nitrogen Status in Response to N Fertilizers

We observed that N fertilizers did not affect the soil (NH4-N) (Table 2), only N3 treatments increased (NO3-N), and RN significantly increased after N fertilizers (two months later) (Table 2, Figure 3b and Figure 4a). The results were similar to some previous N fertilizer studies in N-saturated subtropical forests, as (NO3-N) was negligibly retained in the soil [39] and (NH4-N) was immobilized or mineralized rapidly by increasing nitrification [40]. Thus, the significantly high level of (NO3-N) by N additions (N1-N3, Figure 3b) was probably due to the stimulation of nitrification (Figure 4a) from retained (NH4-N) [40]. The short-lived high (NO3-N) concentration could be accelerated by N leaching [8] because the amount of wet N deposition (~3.92 g N m−2 year−1) in our study site was beyond the N leaching threshold (2.6~3.6 g N m−2 year−1) reported by Yu, et al. [10]. Moreover, the RM and RA were not significantly influenced by N addition in entire periods (Table 2). This suggests that there were no significant changes in the potential of net N mineralization and no net available N obtained in soil from N inputs [41,42]. Therefore, we assumed that the ambient N condition in our study site was N-saturated, and N addition may lead to further saturation.

4.2. Soil Respiration in Response to Incremental N Gradients

We found that annual Rs (Figure 1a) were significantly decreased (37.7%~40.4%) but were not amplified by incremental N addition levels, which ranged from 21% to 57% of the meta-analysis [12]. Some studies suggested that N input may change the temperature control on Rs [43,44], and the temperature sensitivity (Q10) could vary with soil initial fertility levels and climate conditions [45]. However, this possibility could be dismissed in our study, because ST (Figure 6a) and Q10 (Table S1) were not affected by N addition but rather contributed to the closed canopy [46,47].
Thus, examining soil N status under N fertilizers are necessary for understanding the effects of N deposition on Rs. Chen, et al. [48] found that N addition increased Rs under low input levels (LN, ≤6 g N m−2 year−1), whereas high levels of N (HN, ≥12 g N m−2 year−1) performed a negative effect. In addition, they suggested that the effects of N addition on Rs depended on soil N status, as the decreasing pattern was represented in all N-rich subtropical forests [48]. Similarly, in our study, all N addition treatments (>5 g N m−2 year−1) decreased Rs, which suggests that our experimental site reached N-saturation. Some studies reported that the reduction of Rs caused by the decreases of microbial biomass, fine roots, and/or shifts in the microbial community and enzyme functions through excessive N inputs [12,21,29,43]. Actually, the microbial biomass and fine root biomass in the same site decreased after N addition [31], which supported our statement. Meanwhile, those effect of N addition on Rs in our study were probably due to the acceleration of N leaching [49], which was also found by some other investigations [30,50].
Lower Rs under higher available N or N mineralization was usually attributed to lower heterotrophic respiration and microbial activity, whereas the higher Rs were generally found in N-limited ecosystems [15,16]. In contrast to other N-saturated ecosystems [12], our study showed that Rs positively correlated with RN and RM (Figure 5). The mechanism for this phenomenon is not clear, but one probable explanation is that some other nutrient elements (i.e., C and P) from litter become limited factors when N was satisfied [51]. Furthermore, Zhang, et al. [52] reported that carbon hydrolysis and polyphenol oxidase activities were positively correlated with (NH4-N), which was only influenced by litter treatments. Thus, litter may play an important role in this experiment.

4.3. Impacts of Litter Manipulation on N-Saturated Soil

Previous studies confirmed that N fixation and the redistribution of forest ecosystems were mainly determined by internal sources of systems rather than N deposition [53]. Therefore, the decomposition of organic matter (e.g., litter) through plant–soil–microbe systems should be emphasized [54]. In our N-saturated system, litter manipulation had an immediate effect on soil N pool, such as direct positive effects on (NH4-N) and (NO3-N) concentration (Table 2, Figure 3 and Figure 6). Similar to previous studies, the results suggested that litter decomposition increased the (NH4-N) pool [55], being retained in the soil litter layer, partitioned differently than mineral N fertilizer ‘deposition’ [56,57]. Furthermore, (NO3-N) of CK and LA in N3 plots showed the significantly higher mean values than other treatments (Figure 3b), which suggests that litter, to some extent, could mitigate the (NO3-N) leaching [58].
We also found that Rs was only affected by litter manipulation rather than N addition (Table 2). Although Rs was decreased by excessive N addition in natural litterfall (CK) treatment (Figure 1a), there were no significant differences in the Rs in LA and LR spots across N treatments (Figure 1b,c). It was easier to infer that the negative effects of N enrichment on litter-derived heterotrophic respiration were dissolved by litter removal [22,30]. Thus, LR treatment may depress the negative effect of N addition on Rs. Furthermore, the positive response of Q10 to litter removal was also found in this site (Table S1), which was similar with the meta-analysis of Chen, et al. [59]. On the other hand, LA treatment increased Rs in N addition plots, which was probably due to the enhanced dissolved organic carbon [55], soil C:N [60], and the carbon use efficiency of the microbial community [58]. In addition, our results show significantly positive annual mean PE (6.56%) of LA on Rs (Figure 2), which suggested that increasing litter input, even in N-saturated system, can stimulate the decomposition of older stored soil carbon [27]. SEM showed that litter input treatments could directly affect soil available N and soil CO2 emission and indirectly influence Rs due to the positive effect on (NH4-N) and (NO3-N) (Figure 6). These results further confirm that soil C and N cycles, especially in our study soils, were strongly dependent on litter manipulation [55]. Therefore, the negative effects of incremental N levels, especially for those N-saturated forests, could be mitigated by litter manipulation.

5. Conclusions

Our study reveals how litter manipulation impacts Rs under a short-term incremental N levels in a subtropical camphor tree plantation. N enrichment increased (NO3-N) levels and RN in the initial time but did not influence (NH4-N), RA, or RM, which was mainly due to the increased N losses through (NO3-N) leaching and favored nitrification in the N-saturated forest. We also found that litter manipulation could alleviate the suppression of N addition on Rs. Therefore, litter management (addition or removal) may have great potential to affect the turnovers of soil C and N pools, especially those in N deposition/N-saturated subtropical forests.

Supplementary Materials

The following are available online at https://0-www-mdpi-com.brum.beds.ac.uk/1999-4907/11/2/216/s1; Figure S1: Experimental design. Figure S2: All plausible interaction pathways in the structural equation model. Figure S3: The linear relationships between Rs and ST (a) or SWC (b) under different N fertilizer and litter input treatments. Table S1: The exponential relationship between Rs and ST, and Q10 under different N fertilizer and litter input treatments. Table S2: Path coefficients for the best-fit model (Figure 6a). Table S3: Path coefficients for the best-fit model (Figure 6b).

Author Contributions

X.Z., C.N., W.Z. and W.Y. conceived and designed the field experiment; X.Z., W.Z., D.Z. and Z.L. conducted the field experiments and laboratory sample analyses; X.Z., C.N. and Y.L. analyzed the data; Y.L. and W.Y. contributed reagents/materials/analysis tools; X.Z. and C.N. drafted the manuscript and all authors contributed to manuscript revision. All authors have read and agreed to the published version of the manuscript.

Funding

This research was funded by Chinese Forestry Specific Research Grant for Public Benefits (No 200804030), program of National Key (cultivating) Disciplines in Central South University of Forestry and Technology.

Acknowledgments

We gratefully acknowledge the Hunan Forest Botany Park for granting us access to the Park as study site to carry out the study. We appreciated valuable comments and insights from Yakov Kuzyakov, Wenhua Xiang, Yinping Wang, and Shuguang Liu.

Conflicts of Interest

The authors declare no conflict of interest.

References

  1. Solomon, S.; Qin, D.; Manning, M.; Averyt, K.; Marquis, M. Climate Change 2007-the Physical Science Basis: Working Group I Contribution to the Fourth Assessment Report of the IPCC; Cambridge University Press: Cambridge, UK, 2007; Volume 4. [Google Scholar]
  2. Galloway, J.N.; Townsend, A.R.; Erisman, J.W.; Bekunda, M.; Cai, Z.; Freney, J.R.; Martinelli, L.A.; Seitzinger, S.P.; Sutton, M.A.J.S. Transformation of the nitrogen cycle: Recent trends, questions, and potential solutions. Science 2008, 320, 889–892. [Google Scholar] [CrossRef] [Green Version]
  3. Gruber, N.; Galloway, J.N. An Earth-system perspective of the global nitrogen cycle. Nature 2008, 451, 293. [Google Scholar] [CrossRef]
  4. Tian, D.; Niu, S. A global analysis of soil acidification caused by nitrogen addition. Environ. Res. Lett. 2015, 10. [Google Scholar] [CrossRef]
  5. Zheng, M.; Zhang, W.; Luo, Y.; Li, D.; Wang, S.; Huang, J.; Lu, X.; Mo, J. Stoichiometry controls asymbiotic nitrogen fixation and its response to nitrogen inputs in a nitrogen-saturated forest. Ecology 2018, 99, 2037–2046. [Google Scholar] [CrossRef]
  6. Phoenix, G.K.; Hicks, W.K.; Cinderby, S.; Kuylenstierna, J.C.I.; Stock, W.D.; Dentener, F.J.; Giller, K.E.; Austin, A.T.; Lefroy, R.D.B.; Gimeno, B.S. Atmospheric nitrogen deposition in world biodiversity hotspots: The need for a greater global perspective in assessing N deposition impacts. Glob. Chang. Biol. 2006, 12, 470–476. [Google Scholar] [CrossRef]
  7. Cao, J.; Pang, S.; Wang, Q.; Williams, M.A.; Jia, X.; Dun, S.; Yang, J.; Zhang, Y.; Wang, J.; Lü, X.; et al. Plant–bacteria–soil response to frequency of simulated nitrogen deposition has implications for global ecosystem change. Funct. Ecol. 2019. [Google Scholar] [CrossRef]
  8. Song, L.; Tian, P.; Zhang, J.; Jin, G. Effects of three years of simulated nitrogen deposition on soil nitrogen dynamics and greenhouse gas emissions in a Korean pine plantation of northeast China. Sci. Total Environ. 2017, 609, 1303–1311. [Google Scholar] [CrossRef] [PubMed]
  9. Reay, D.S.; Dentener, F.; Smith, P.; Grace, J.; Feely, R.A. Global nitrogen deposition and carbon sinks. Nat. Geosci. 2008, 1, 430. [Google Scholar] [CrossRef]
  10. Yu, Q.; Duan, L.; Yu, L.; Chen, X.; Si, G.; Ke, P.; Ye, Z.; Mulder, J. Threshold and multiple indicators for nitrogen saturation in subtropical forests. Environ. Pollut. 2018, 241, 664–673. [Google Scholar] [CrossRef]
  11. Bond-Lamberty, B.; Thomson, A. Temperature-associated increases in the global soil respiration record. Nature 2010, 464, 579. [Google Scholar] [CrossRef]
  12. Janssens, I.A.; Dieleman, W.; Luyssaert, S.; Subke, J.A.; Reichstein, M.; Ceulemans, R.; Ciais, P.; Dolman, A.J.; Grace, J.; Matteucci, G.; et al. Reduction of forest soil respiration in response to nitrogen deposition. Nat. Geosci. 2010, 3, 315–322. [Google Scholar] [CrossRef]
  13. Chen, Z.; Xu, Y.; He, Y.; Zhou, X.; Fan, J.; Yu, H.; Ding, W. Nitrogen fertilization stimulated soil heterotrophic but not autotrophic respiration in cropland soils: A greater role of organic over inorganic fertilizer. Soil Biol. Biochem. 2018, 116, 253–264. [Google Scholar] [CrossRef]
  14. Luo, Q.; Gong, J.; Zhai, Z.; Pan, Y.; Liu, M.; Xu, S.; Wang, Y.; Yang, L.; Baoyin, T.-T. The responses of soil respiration to nitrogen addition in a temperate grassland in northern China. Sci. Total Environ. 2016. [Google Scholar] [CrossRef] [PubMed]
  15. Xu, W.; Cai, Y.P.; Yang, Z.F.; Yin, X.A.; Tan, Q. Microbial nitrification, denitrification and respiration in the leached cinnamon soil of the upper basin of Miyun Reservoir. Sci. Rep. 2017, 7, 42032. [Google Scholar] [CrossRef] [PubMed]
  16. Bae, K.; Fahey, T.J.; Yanai, R.D.; Fisk, M. Soil Nitrogen Availability Affects Belowground Carbon Allocation and Soil Respiration in Northern Hardwood Forests of New Hampshire. Ecosystems 2015, 18, 1179–1191. [Google Scholar] [CrossRef]
  17. Samuelson, L.; Mathew, R.; Stokes, T.; Feng, Y.; Aubrey, D.; Coleman, M. Soil and microbial respiration in a loblolly pine plantation in response to seven years of irrigation and fertilization. For. Ecol. Manag. 2009, 258, 2431–2438. [Google Scholar] [CrossRef]
  18. Koehler, B.; Corre, M.D.; Veldkamp, E.; Sueta, J. Chronic nitrogen addition causes a reduction in soil carbon dioxide efflux during the high stem-growth period in a tropical montane forest but no response from a tropical lowland forest on a decadal time scale. Biogeosciences 2009, 12, 2973–2983. [Google Scholar] [CrossRef]
  19. Tu, L.-H.; Hu, T.-X.; Zhang, J.; Li, X.-W.; Hu, H.-L.; Liu, L.; Xiao, Y.-L. Nitrogen addition stimulates different components of soil respiration in a subtropical bamboo ecosystem. Soil Biol. Biochem. 2013, 58, 255–264. [Google Scholar] [CrossRef]
  20. Xu, Y.; Fan, J.; Ding, W.; Bol, R.; Chen, Z.; Luo, J.; Bolan, N. Stage-specific response of litter decomposition to N and S amendments in a subtropical forest soil. Biol. Fertil. Soils 2016, 52, 711–724. [Google Scholar] [CrossRef]
  21. Zhang, T.; Chen, H.Y.H.; Ruan, H. Global negative effects of nitrogen deposition on soil microbes. ISME J. 2018, 12, 1817–1825. [Google Scholar] [CrossRef] [Green Version]
  22. Li, Y.; Sun, J.; Tian, D.; Wang, J.; Ha, D.; Qu, Y.; Jing, G.; Niu, S. Soil acid cations induced reduction in soil respiration under nitrogen enrichment and soil acidification. Sci. Total Environ. 2017, 615, 1535–1546. [Google Scholar] [CrossRef] [PubMed]
  23. Fierer, N.; Lauber, C.L.; Ramirez, K.S.; Zaneveld, J.; Bradford, M.A.; Knight, R. Comparative metagenomic, phylogenetic and physiological analyses of soil microbial communities across nitrogen gradients. ISME J. 2012, 6, 1007–1017. [Google Scholar] [CrossRef] [PubMed] [Green Version]
  24. Maeda, Y.; Tashiro, N.; Enoki, T.; Urakawa, R.; Hishi, T. Effects of species replacement on the relationship between net primary production and soil nitrogen availability along a topographical gradient: Comparison of belowground allocation and nitrogen use efficiency between natural forests and plantations. For. Ecol. Manag. 2018, 422, 214–222. [Google Scholar] [CrossRef]
  25. Månsson, K.F.; Falkengren-Grerup, U. The effect of nitrogen deposition on nitrification, carbon and nitrogen mineralisation and litter C:N ratios in oak (Quercus robur L.) forests. For. Ecol. Manag. 2003, 179, 455–467. [Google Scholar] [CrossRef]
  26. Wang, Q.; Wang, S.; He, T.; Liu, L.; Wu, J. Response of organic carbon mineralization and microbial community to leaf litter and nutrient additions in subtropical forest soils. Soil Biol. Biochem. 2014, 71, 13–20. [Google Scholar] [CrossRef]
  27. Kuzyakov, Y. Priming effects: Interactions between living and dead organic matter. Soil Biol. Biochem. 2010, 42, 1363–1371. [Google Scholar] [CrossRef]
  28. Prescott, C.E. Litter decomposition: What controls it and how can we alter it to sequester more carbon in forest soils? Biogeochemistry 2010, 101, 133–149. [Google Scholar] [CrossRef]
  29. Ning, C.; Mueller, G.; Egerton-Warburton, L.; Wilson, A.; Yan, W.; Xiang, W. Diversity and Enzyme Activity of Ectomycorrhizal Fungal Communities Following Nitrogen Fertilization in an Urban-Adjacent Pine Plantation. Forests 2018, 9, 99. [Google Scholar] [CrossRef] [Green Version]
  30. Gao, Q.; Bai, E.; Wang, J.; Zheng, Z.; Xia, J.; You, W. Effects of litter manipulation on soil respiration under short-term nitrogen addition in a subtropical evergreen forest. For. Ecol. Manag. 2018, 429, 77–83. [Google Scholar] [CrossRef]
  31. Yan, W.-D.; Chen, X.-Y.; Peng, Y.-Y.; Zhu, F.; Zhen, W.; Zhang, X.-Y. Response of Soil Respiration to Nitrogen Addition in Two Subtropical Forest Types *1. Pedosphere 2017. [Google Scholar] [CrossRef]
  32. Zou, X.; Valentine, D.W.; Sanford, R.L.; Binkley, D. Resin-core and buried-bag estimates of nitrogen transformations in Costa Rican lowland rainforests. Plant Soil 1992, 139, 275–283. [Google Scholar] [CrossRef]
  33. Liu, X.-R.; Dong, Y.-S.; Ren, J.-Q.; Li, S.-G. Drivers of soil net nitrogen mineralization in the temperate grasslands in Inner Mongolia, China. Nutr. Cycl. Agroecosyst. 2009, 87, 59–69. [Google Scholar] [CrossRef]
  34. Deng, H.P.; Wang, G.J.; Geng, G. Response of nitrogen mineralization to litter addition and exclusion in soils of Cinnamomum camphora plantation. J. Beijing For. Univ. 2010, 32, 47–51. [Google Scholar]
  35. Nelson, D.W.; Sommers, L.E. Total carbon, organic carbon, and organic matter. In Methods of Soil Analysis Part 3. Chemical Methods; Soil Science Society of America Book Series No. 5; Soil Science Society of America, Inc.: Madison, WI, USA, 1996. [Google Scholar]
  36. Jackson, M.L. Soil Chemical Analysis—Advanced Course; University of Wisconsin: Madison, WI, USA, 1979. [Google Scholar]
  37. Meyer, N.; Welp, G.; Amelung, W. The Temperature Sensitivity (Q10) of Soil Respiration: Controlling Factors and Spatial Prediction at Regional Scale Based on Environmental Soil Classes. Glob. Biogeochem. Cycles 2018, 32, 306–323. [Google Scholar] [CrossRef]
  38. Lefcheck, J.S.; Freckleton, R. piecewiseSEM: Piecewise structural equation modelling inr for ecology, evolution, and systematics. Methods Ecol. Evol. 2016, 7, 573–579. [Google Scholar] [CrossRef]
  39. Isobe, K.; Ikutani, J.; Fang, Y.; Yoh, M.; Mo, J.; Suwa, Y.; Yoshida, M.; Senoo, K.; Otsuka, S.; Koba, K. Highly abundant acidophilic ammonia-oxidizing archaea causes high rates of nitrification and nitrate leaching in nitrogen-saturated forest soils. Soil Biol. Biochem. 2018, 122, 220–227. [Google Scholar] [CrossRef]
  40. Yu, L.; Kang, R.; Mulder, J.; Zhu, J.; Dörsch, P. Distinct fates of atmogenic NH4+ and NO3 in subtropical, N-saturated forest soils. Biogeochemistry 2017, 133, 279–294. [Google Scholar] [CrossRef]
  41. Lovett, G.M.; Goodale, C.L. A new conceptual model of nitrogen saturation based on experimental nitrogen addition to an oak forest. Ecosystems 2011, 14, 615–631. [Google Scholar] [CrossRef]
  42. Niu, S.; Classen, A.T.; Dukes, J.S.; Kardol, P.; Liu, L.; Luo, Y.; Rustad, L.; Sun, J.; Tang, J.; Templer, P.H.; et al. Global patterns and substrate-based mechanisms of the terrestrial nitrogen cycle. Ecol. Lett. 2016, 19, 697–709. [Google Scholar] [CrossRef] [Green Version]
  43. Mo, J.; Zhang, W.E.I.; Zhu, W.; Gundersen, P.E.R.; Fang, Y.; Li, D.; Wang, H.U.I. Nitrogen addition reduces soil respiration in a mature tropical forest in southern China. Glob. Chang. Biol. 2008, 14, 403–412. [Google Scholar] [CrossRef]
  44. Sun, Z.; Liu, L.; Ma, Y.; Yin, G.; Zhao, C.; Zhang, Y.; Piao, S. The effect of nitrogen addition on soil respiration from a nitrogen-limited forest soil. Agric. For. Meteorol. 2014, 197, 103–110. [Google Scholar] [CrossRef]
  45. Sun, Q.; Wang, R.; Wang, Y.; Du, L.; Zhao, M.; Gao, X.; Hu, Y.; Guo, S. Temperature sensitivity of soil respiration to nitrogen and phosphorous fertilization: Does soil initial fertility matter? Geoderma 2018, 325, 172–182. [Google Scholar] [CrossRef]
  46. Peng, Y.; Thomas, S.C. Influence of Non-nitrogenous Soil Amendments on Soil CO2 Efflux and Fine Root Production in an N-Saturated Northern Hardwood Forest. Ecosystems 2010, 13, 1145–1156. [Google Scholar] [CrossRef]
  47. Fan, H.; Wu, J.; Liu, W.; Yuan, Y.; Huang, R.; Liao, Y.; Li, Y. Nitrogen deposition promotes ecosystem carbon accumulation by reducing soil carbon emission in a subtropical forest. Plant Soil 2014, 379, 361–371. [Google Scholar] [CrossRef]
  48. Chen, H.; Li, D.; Gurmesa, G.A.; Yu, G.; Li, L.; Zhang, W.; Fang, H.; Mo, J. Effects of nitrogen deposition on carbon cycle in terrestrial ecosystems of China: A meta-analysis. Environ. Pollut. 2015, 206, 352–360. [Google Scholar] [CrossRef]
  49. Lohse, K.A.; Matson, P. Consequences of nitrogen additions for soil processes and solution losses from wet tropical forests. Ecol. Appl. 2005, 15, 1629–1648. [Google Scholar] [CrossRef]
  50. Bowden, R.D.; Davidson, E.; Savage, K.; Arabia, C.; Steudler, P. Chronic nitrogen additions reduce total soil respiration and microbial respiration in temperate forest soils at the Harvard Forest. For. Ecol. Manag. 2004, 196, 43–56. [Google Scholar] [CrossRef]
  51. Treseder, K.K. Nitrogen additions and microbial biomass: A meta-analysis of ecosystem studies. Ecol. Lett. 2008, 11, 1111–1120. [Google Scholar] [CrossRef] [Green Version]
  52. Zhang, C.; Zhang, X.-Y.; Zou, H.-T.; Kou, L.; Yang, Y.; Wen, X.-F.; Li, S.-G.; Wang, H.-M.; Sun, X.-M. Contrasting effects of ammonium and nitrate additions on the biomass of soil microbial communities and enzyme activities in subtropical China. Biogeosciences 2017, 14, 4815–4827. [Google Scholar] [CrossRef] [Green Version]
  53. Cleveland, C.C.; Houlton, B.Z.; Smith, W.K.; Marklein, A.R.; Reed, S.C.; Parton, W.; Del Grosso, S.J.; Running, S.W. Patterns of new versus recycled primary production in the terrestrial biosphere. Proc. Natl. Acad. Sci. USA 2013, 110, 12733–12737. [Google Scholar] [CrossRef] [Green Version]
  54. Rennenberg, H.; Dannenmann, M. Nitrogen Nutrition of Trees in Temperate Forests—The Significance of Nitrogen Availability in the Pedosphere and Atmosphere. Forests 2015, 6, 2820–2835. [Google Scholar] [CrossRef]
  55. Miao, R.; Ma, J.; Liu, Y.; Liu, Y.; Yang, Z.; Guo, M. Variability of Aboveground Litter Inputs Alters Soil Carbon and Nitrogen in a Coniferous–Broadleaf Mixed Forest of Central China. Forests 2019, 10, 188. [Google Scholar] [CrossRef] [Green Version]
  56. Riaz, M.; Mian, I.A.; Cresser, M.S. Litter effects on ammonium dynamics in an acid soil under grassland. Geoderma 2010, 159, 198–208. [Google Scholar] [CrossRef]
  57. Nair, R.K.; Perks, M.P.; Mencuccini, M. Decomposition nitrogen is better retained than simulated deposition from mineral amendments in a temperate forest. Glob. Chang. Biol. 2017, 23, 1711–1724. [Google Scholar] [CrossRef] [Green Version]
  58. Joly, F.-X.; Fromin, N.; Kiikkilä, O.; Hättenschwiler, S. Diversity of leaf litter leachates from temperate forest trees and its consequences for soil microbial activity. Biogeochemistry 2016, 129, 373–388. [Google Scholar] [CrossRef]
  59. Chen, X.; Chen, H.Y.H. Global effects of plant litter alterations on soil CO2 to the atmosphere. Glob. Chang. Biol. 2018, 24, 3462–3471. [Google Scholar] [CrossRef]
  60. Eberwein, J.R.; Oikawa, P.Y.; Allsman, L.A.; Jenerette, G.D. Carbon availability regulates soil respiration response to nitrogen and temperature. Soil Biol. Biochem. 2015, 88, 158–164. [Google Scholar] [CrossRef]
Figure 1. Seasonal variations and annual mean values of soil respiration (Rs) rates in natural litter input (CK) (a), double litter input (LA) (b), and non-litter input (LR) (c) spots with different nitrogen (N) levels. The error bar indicates mean ± SE (n = 3). Different letters above the bars indicate significant differences (ANOVA followed by Duncan’s tests, p < 0.05).
Forests 11 00216 g001
Figure 2. The average Rs of the N0-N3 plots in different litter treatments (a) and priming effects (PE) (b) in different incubation periods. The error bar indicates mean ± SE (n = 12). Asterisks (*) indicate significant differences (p < 0.05). The red and black columns show the positive and negative PE.
Forests 11 00216 g002
Figure 3. Seasonal variations and annual mean values of soil (NH4-N) (a) in different litter input treatments and (NO3-N) (b) in different N fertilizers and litter inputs treatments. Spline curves indicate mean ± SE (n = 12 for NH4-N, n = 3 for NO3-N). Asterisks (*) indicate significant differences (ANOVA followed by Duncan’s tests, p < 0.05).
Forests 11 00216 g003
Figure 4. Seasonal variations of soil net nitrification (RN, a) in different N fertilizer treatments, soil net ammonification (RA, b), and mineralization (RM, c). The error bar indicates mean ± SE (n = 9 for RN, n = 36 for RA and RM). Different letters above the bars indicate significant differences (ANOVA followed by Duncan’s tests, p < 0.05).
Forests 11 00216 g004
Figure 5. The linear relationships between soil respiration (Rs) rates and net nitrification (RN) rates (a), ammonification (RA) rates (b), and mineralization (RM) rates (c) under different N fertilizer and litter input treatments (n = 144).
Forests 11 00216 g005
Figure 6. Structural equation models (SEM) depicting the influence of N fertilizers, litter management, and inorganic nitrogen with (a) or without hydrothermal factors (b) on soil respiration (Rs) rates. The solid lines refer to significant relationships, whereas the dashed lines refer to nonsignificant relationships (p < 0.05). The arrows represent the directional influence of one variable upon another, whereas the double-headed arrow lines exhibited the relationship between two variables, which is not presumed to be causal and unidirectional. The black arrows show positive effects and red represent the negatives. Numbers beside the line are standardized coefficients. R2 values associated with response variables indicate the proportion of variation explained by the relationships with other variables.
Forests 11 00216 g006
Table 1. Basic soil characteristics in the studied camphor forest.
Basic Soil Characteristics (n = 36)
Soil bulk density (g cm−3)1.50 ± 0.11
Soil pH3.98 ± 0.22
Total organic carbon (mg g−1)13.97 ± 1.70
Total nitrogen (mg g−1)1.34 ± 0.14
C/N10.43
Litter layer thickness1–2 cm
Annual litterfall production (kg m−2 year−1)0.45 ± 0.03
Values are mean ± SE.
Table 2. Summary of the results (p-value) of the three-way factorial ANOVA on the effects of N fertilizers (N), litter inputs (L) and seasonal variation (S) and their interactions with soil respiration (Rs) rates, cumulative CO2 flux (CRs), ammonium(NH4-N), nitrate concentration(NO3-N), net ammonification rates (RA), nitrification rates (RN), and N mineralization rates (RM).
Rs(NH4-N)(NO3-N)RARNRM
N fertilizers (N)0.5350.490<0.001 a0.561<0.001 a0.161
Litter inputs (L)<0.001 a0.001 a0.028 a0.8410.0610.287
Seasonal (S)<0.001 a<0.001 a0.012 a0.015 a0.009 a<0.001 a
N × L0.4490.6990.003 a0.9830.2560.581
N × S0.2840.059<0.001 a0.112<0.001 a0.584
L × S0.5050.095<0.001 a0.5510.6720.451
N × L × S0.8920.102<0.001 a0.5090.9240.509
a Significant at the 0.05 probability level.

