Article

Magnitude and Edaphic Controls of Nitrous Oxide Fluxes in Natural Forests at Different Scales

1
Institute of Wetland Research, Chinese Academy of Forestry, Beijing 100091, China
2
Beijing Key Laboratory of Wetland Services and Restoration, Beijing 100091, China
3
Sichuan Zoige Wetland Ecosystem Research Station, Tibetan Autonomous Prefecture of Aba 624500, Sichuan, China
4
Key Laboratory of Ecosystem Network Observation and Modeling, Institute of Geographic Sciences and Natural Resources Research, Chinese Academy of Sciences, Beijing 100101, China
*
Author to whom correspondence should be addressed.
Submission received: 2 February 2020 / Revised: 22 February 2020 / Accepted: 23 February 2020 / Published: 25 February 2020
(This article belongs to the Collection Forests Carbon Fluxes and Sequestration)

Abstract

:
Forest nitrous oxide (N2O) emission plays an important role in the greenhouse gas budget of forest ecosystems. However, spatial variability in N2O fluxes complicates the determination of key factors of N2O fluxes at different scales. Based on an updated database of N2O fluxes and the main edaphic factors of global forests, the magnitude of N2O fluxes from forests and the relationships between edaphic factors and N2O fluxes at different scales were analyzed. According to the results, the average annual N2O flux of the global forest was 142.91 ± 14.1 mg N m−2 year−1. The range of total forest estimated N2O emission was 4.45–4.69 Tg N in 2000. N2O fluxes from forests with different leaf traits (broadleaved and coniferous) have significant differences in magnitude, whereas the leaf habit (evergreen and deciduous) was an important characteristic reflecting different patterns of N2O seasonal variations. The main factors affecting N2O fluxes on the global scale were ammonium (NH4+) and nitrate (NO3) concentrations. With an increasing scale (from the site scale to the regional scale to the global scale), the explanatory power of the five edaphic factors to N2O flux decreased gradually. In addition, the response curves of N2O flux to edaphic factors were diversified among different scales. At both the global and regional scales, soil hydrothermal condition (water filled pore space (WFPS) and soil temperature) might not be the main spatial regulation for N2O fluxes, whereas soil nutrient factors (particularly NO3 concentration) could contribute more on N2O flux spatial variations. The results of site-control analysis demonstrated that there were high spatial heterogeneity of the main N2O controls, showing N2O fluxes from low latitude forests being more likely associated with soil WFPS and temperature. Thus, our findings provide valuable insights into the regulatory edaphic factors underlying the variability in N2O emissions, when modeling at different scales.

Graphical Abstract

1. Introduction

Nitrous oxide (N2O) is one of the main greenhouse gases. N2O not only makes substantial contributions to global warming (it has about a 298 times higher global warming potential than that of CO2 [1]), but also greatly contributes to the destruction of ozone in the stratosphere [2]. Since the pre-industrial period, the global average N2O concentration has increased by approximately 121%, at an unprecedented rate, over the decades to millennia [3]. Forest soils are the principle source of N2O emissions to the atmosphere, accounting for approximately 15%–55% of the total N2O emissions [4,5,6,7].
N2O is mainly emitted by forest soils through nitrification and denitrification processes. Nitrification is a process in which nitrifying microorganisms in soil convert ammonia (NH3) or ammonium (NH4+) into nitrite (NO2) or nitrate (NO3) under aerobic conditions, and N2O is produced as a by-product. Denitrification is a chain reaction in which NO3 is finally converted to nitrogen (N2) [8]. Both processes take place under different circumstances and the combination of these processes determines the flux of N2O. Nitrification and denitrification can take place in a soil simultaneously and are sensitive to the soil’s physical/chemical conditions, which possibly results in the large heterogeneity that can be found in soils [9], and N2O flux is spatially and temporally variable, which substantially contributes to the uncertainties in the global N2O budget.
Due to the spatio-temporal variability of soil N2O emissions, we can only obtain a limited knowledge of the critical factors from field research. In addition, relatively small changes in environmental factors can significantly change the N2O emission rate of the soil [10]. There is a need for more information on the effects of environmental variables to identify the controlling factors that are responsible for such large differences, so that it is possible to quantify the N2O emissions from natural ecosystems. However, spatial variability in environmental conditions and nitrification and denitrification processes, complicates the determination of key factors of N2O fluxes at different scales. New approaches for up-scaling processes and fluxes from a microbial scale to soil micro-sites, fields, entire landscapes and regions are still required, despite the recent progress [11]. Research by, for example, Pilegaard et al. [12] has shown the parameters normally explaining most of the temporal variation within a single site had less influence on the mean annual emission rates at the regional scale.
A better understanding of the edaphic factors affecting N2O flux in forest soils at different scales will help to control or regulate N2O emissions, thereby maintaining environmental quality, especially in the case of human disturbance and climate change. In addition, knowledge of the relations between fluxes and edaphic variables will help to scale up the emissions of N2O. In this study, to better research the magnitude and edaphic controls at different scales, we compiled a database of N2O fluxes and the main edaphic and biotic factors of global forests. Based on the database, we aimed at examining the magnitude patterns of N2O fluxes across global forests classified by different biotic groups and identifying the main controls regulating N2O fluxes at different scales.

2. Data and Method

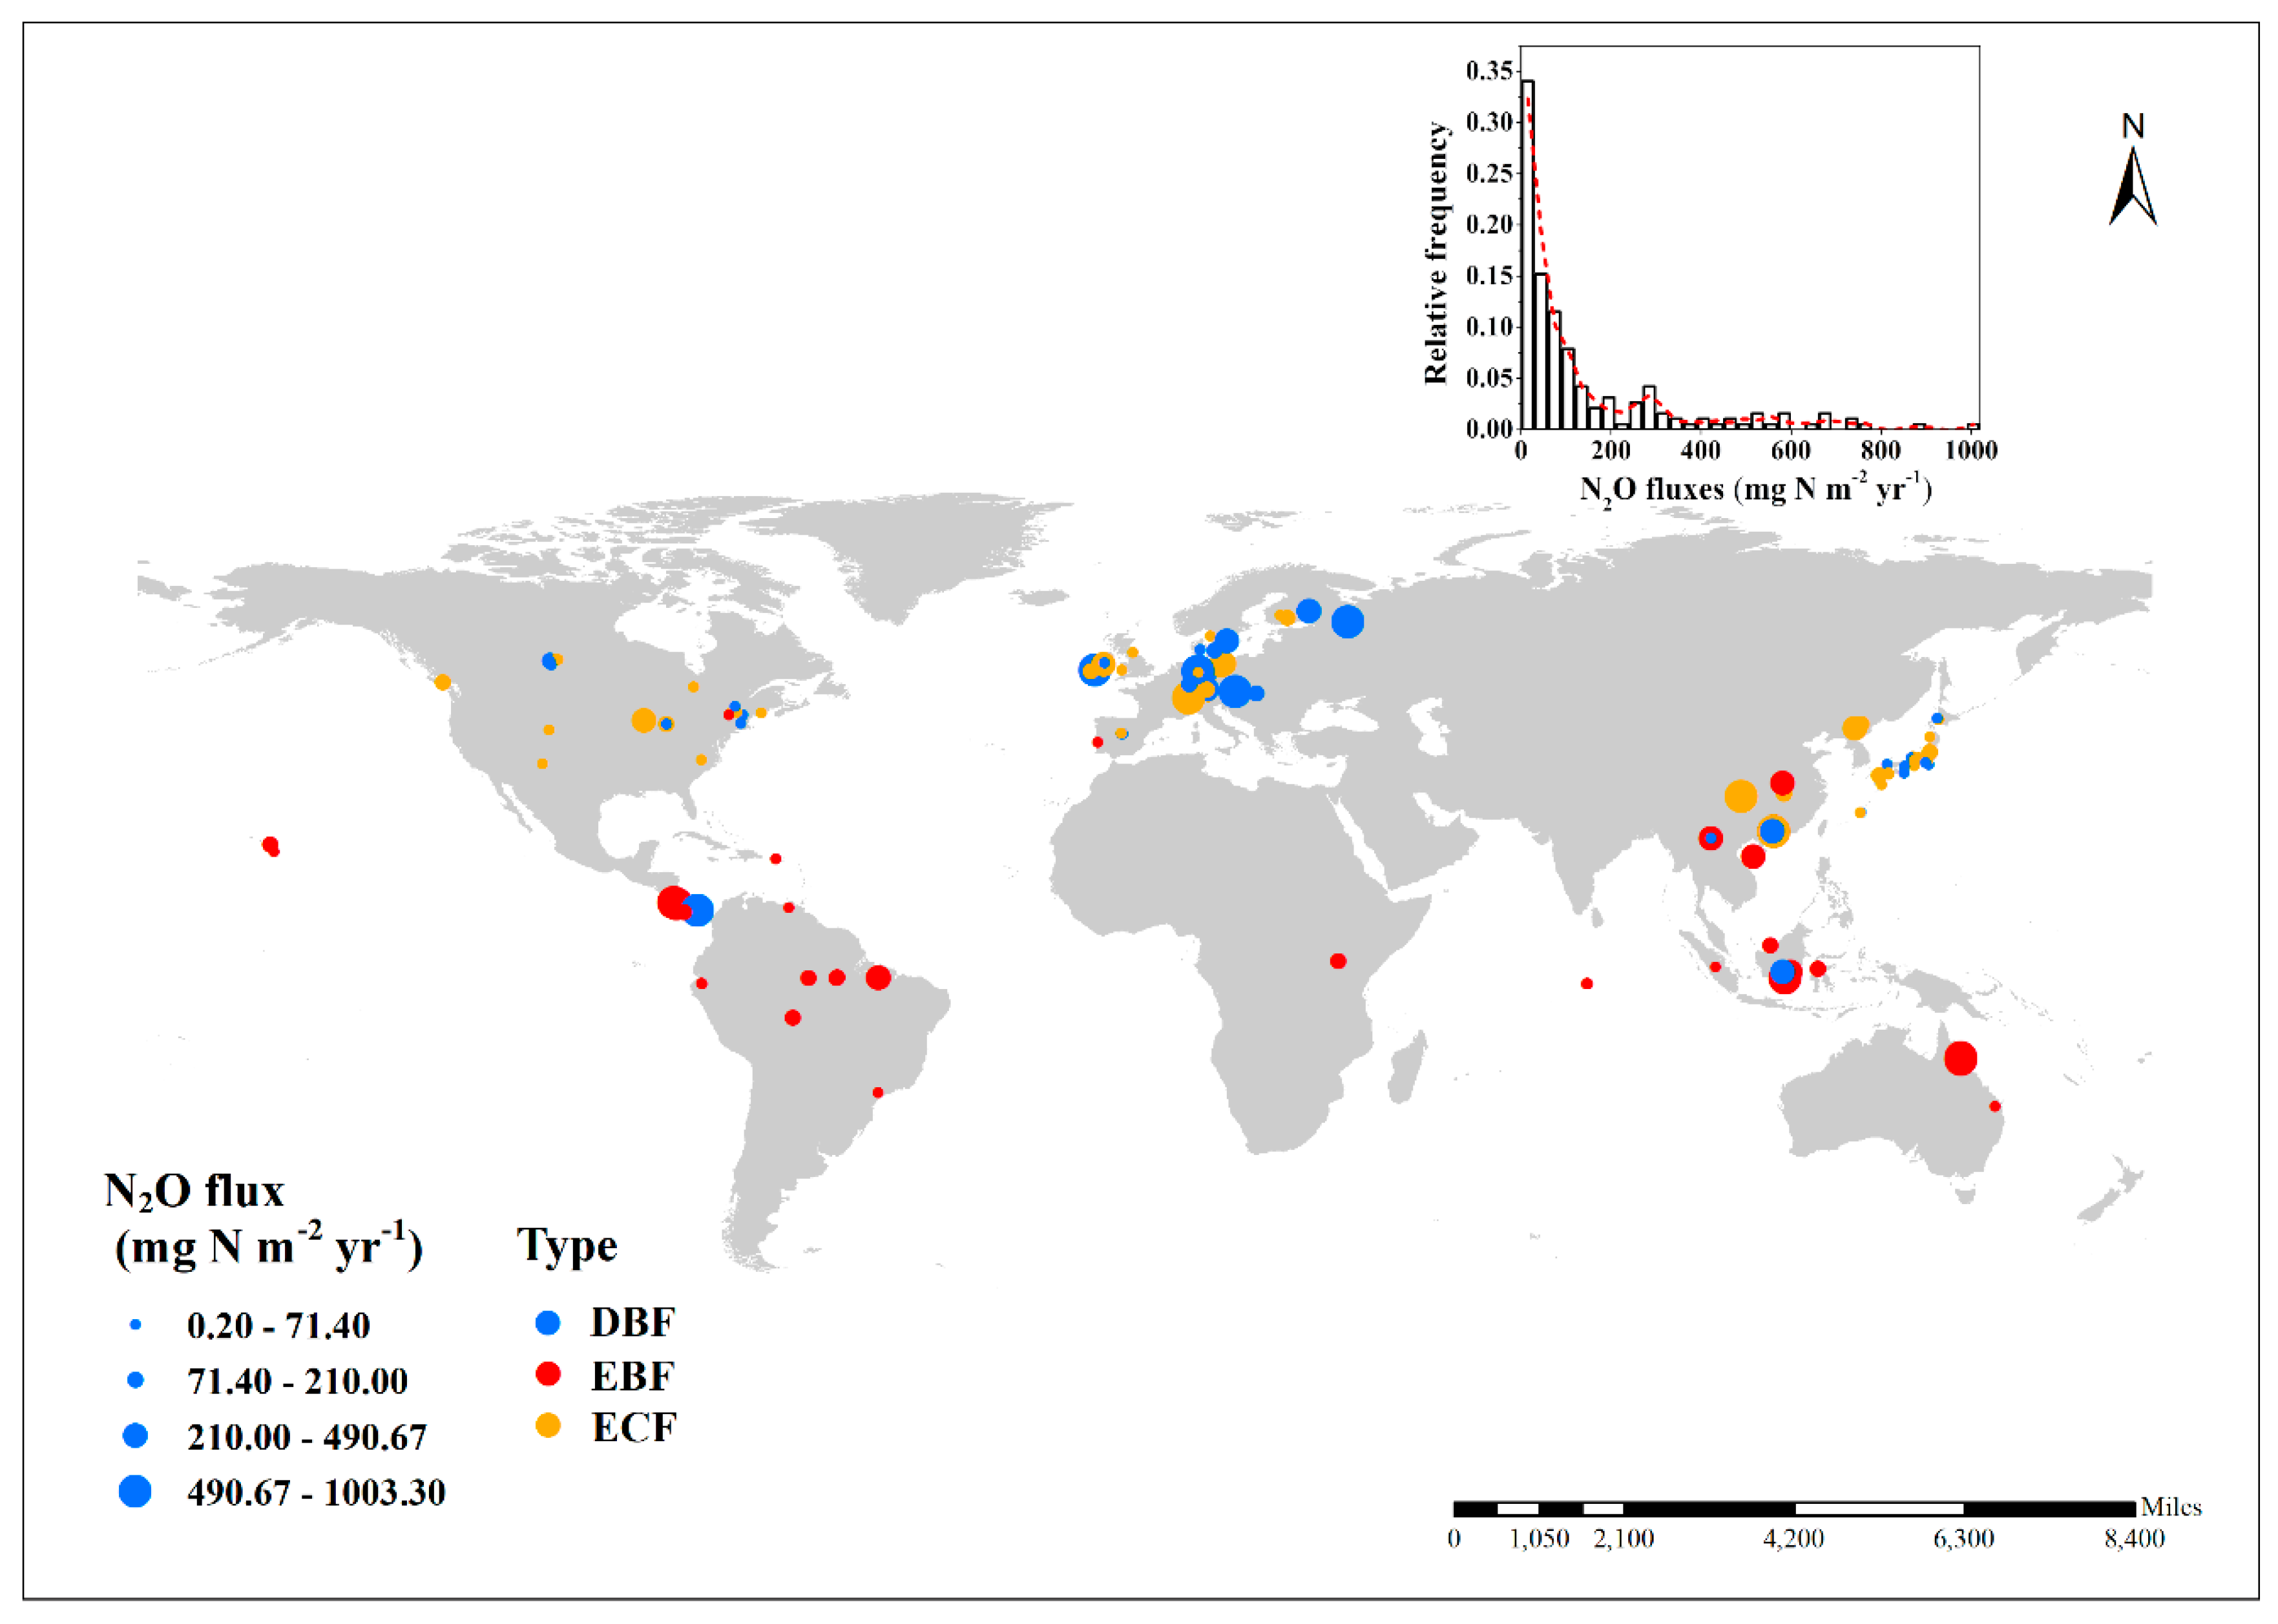
2.1. Field Measurement Data Compilation

The database of N2O fluxes was constructed from the published literature that was searched for using the keywords “nitrous oxide flux” and “forests” in the database of ISI (Science Citation Index) Web of Science. The site-level N2O flux data were compiled from articles published until 2018. The sites consist of natural or semi-natural forests, and samplings from economic forests were rejected to avoid the influence of human activity, and laboratory studies were not included. In addition, the chamber method was only selected in this database to avoid the uncertainties caused by different measurement techniques. Ultimately, a total of 191 records of annual N2O fluxes from 99 published literatures were collected to form our database. Moreover, 112 sites in the database have monthly N2O flux data, totaling 2053 records (Supplementary data).
The species in our database were classified into different biotic forest groups (leaf traits (i.e., broad and coniferous, LT) and leaf habits (evergreen and deciduous, LH)), according to the information selected from corresponding articles (e.g., dominant species). Geographic, climatic, vegetation, including latitude, longitude, soil type, vegetation type, climate variables (i.e., mean annual temperature and mean annual precipitation), and edaphic factors (e.g., soil dissolved organic carbon (DOC), ammonium concentration (NH4+), nitrate concentration (NO3), water filled pore space (WFPS) and soil temperature), were also collected from the corresponding articles. For each site, we calculated the means of annual N2O fluxes during the observation period, and the monthly values of N2O fluxes were calculated based on the average of two or three daily fluxes obtained from the corresponding articles. The daily N2O flux dataset was extracted from the published figures and tables using GetData Graph Digitizer, Version 2.24 [13]. The locations and geographical distribution of all the sites are illustrated in Figure 1.

2.2. Data Analysis

Kruskal–Wallis ANOVA (Analysis of Variance) or a Mann–Whitney U test was used to compare the differences in N2O fluxes among leaf traits (coniferous and broadleaf) and leaf habits (evergreen and deciduous), and was followed by a Dunn–Bonferroni test for post hoc comparisons. The statistical analyses were performed with predictive analytics software SPSS 16.0 (SPSS Inc., Chicago, IL, USA). Univariate regression analyses were performed to investigate the influence of edaphic factors on N2O fluxes, and the desirable regression curve were selected according to a smaller Akaike’s information criterion (AIC) [14]. Regression analyses were performed in R 3.6.1 [15]. All N2O flux data were log-transformed before analyses to improve the data normality, while before the log-transformation, a constant value of 2.0 was added to all monthly fluxes to avoid negative values. The total budget of forest N2O emissions were calculated, based on the product of the mean annual flux and total area, the corresponding area data were estimated according to the study of Li et al. [16]. For the regional scale, the spatial control analysis for regional scale were conducted using the mean annual data within the corresponding regions. We conducted the monthly control analysis using monthly data within the corresponding regions, separated the monthly data into 12 groups (12 months), and then analyzed the controls for each month.

3. Results

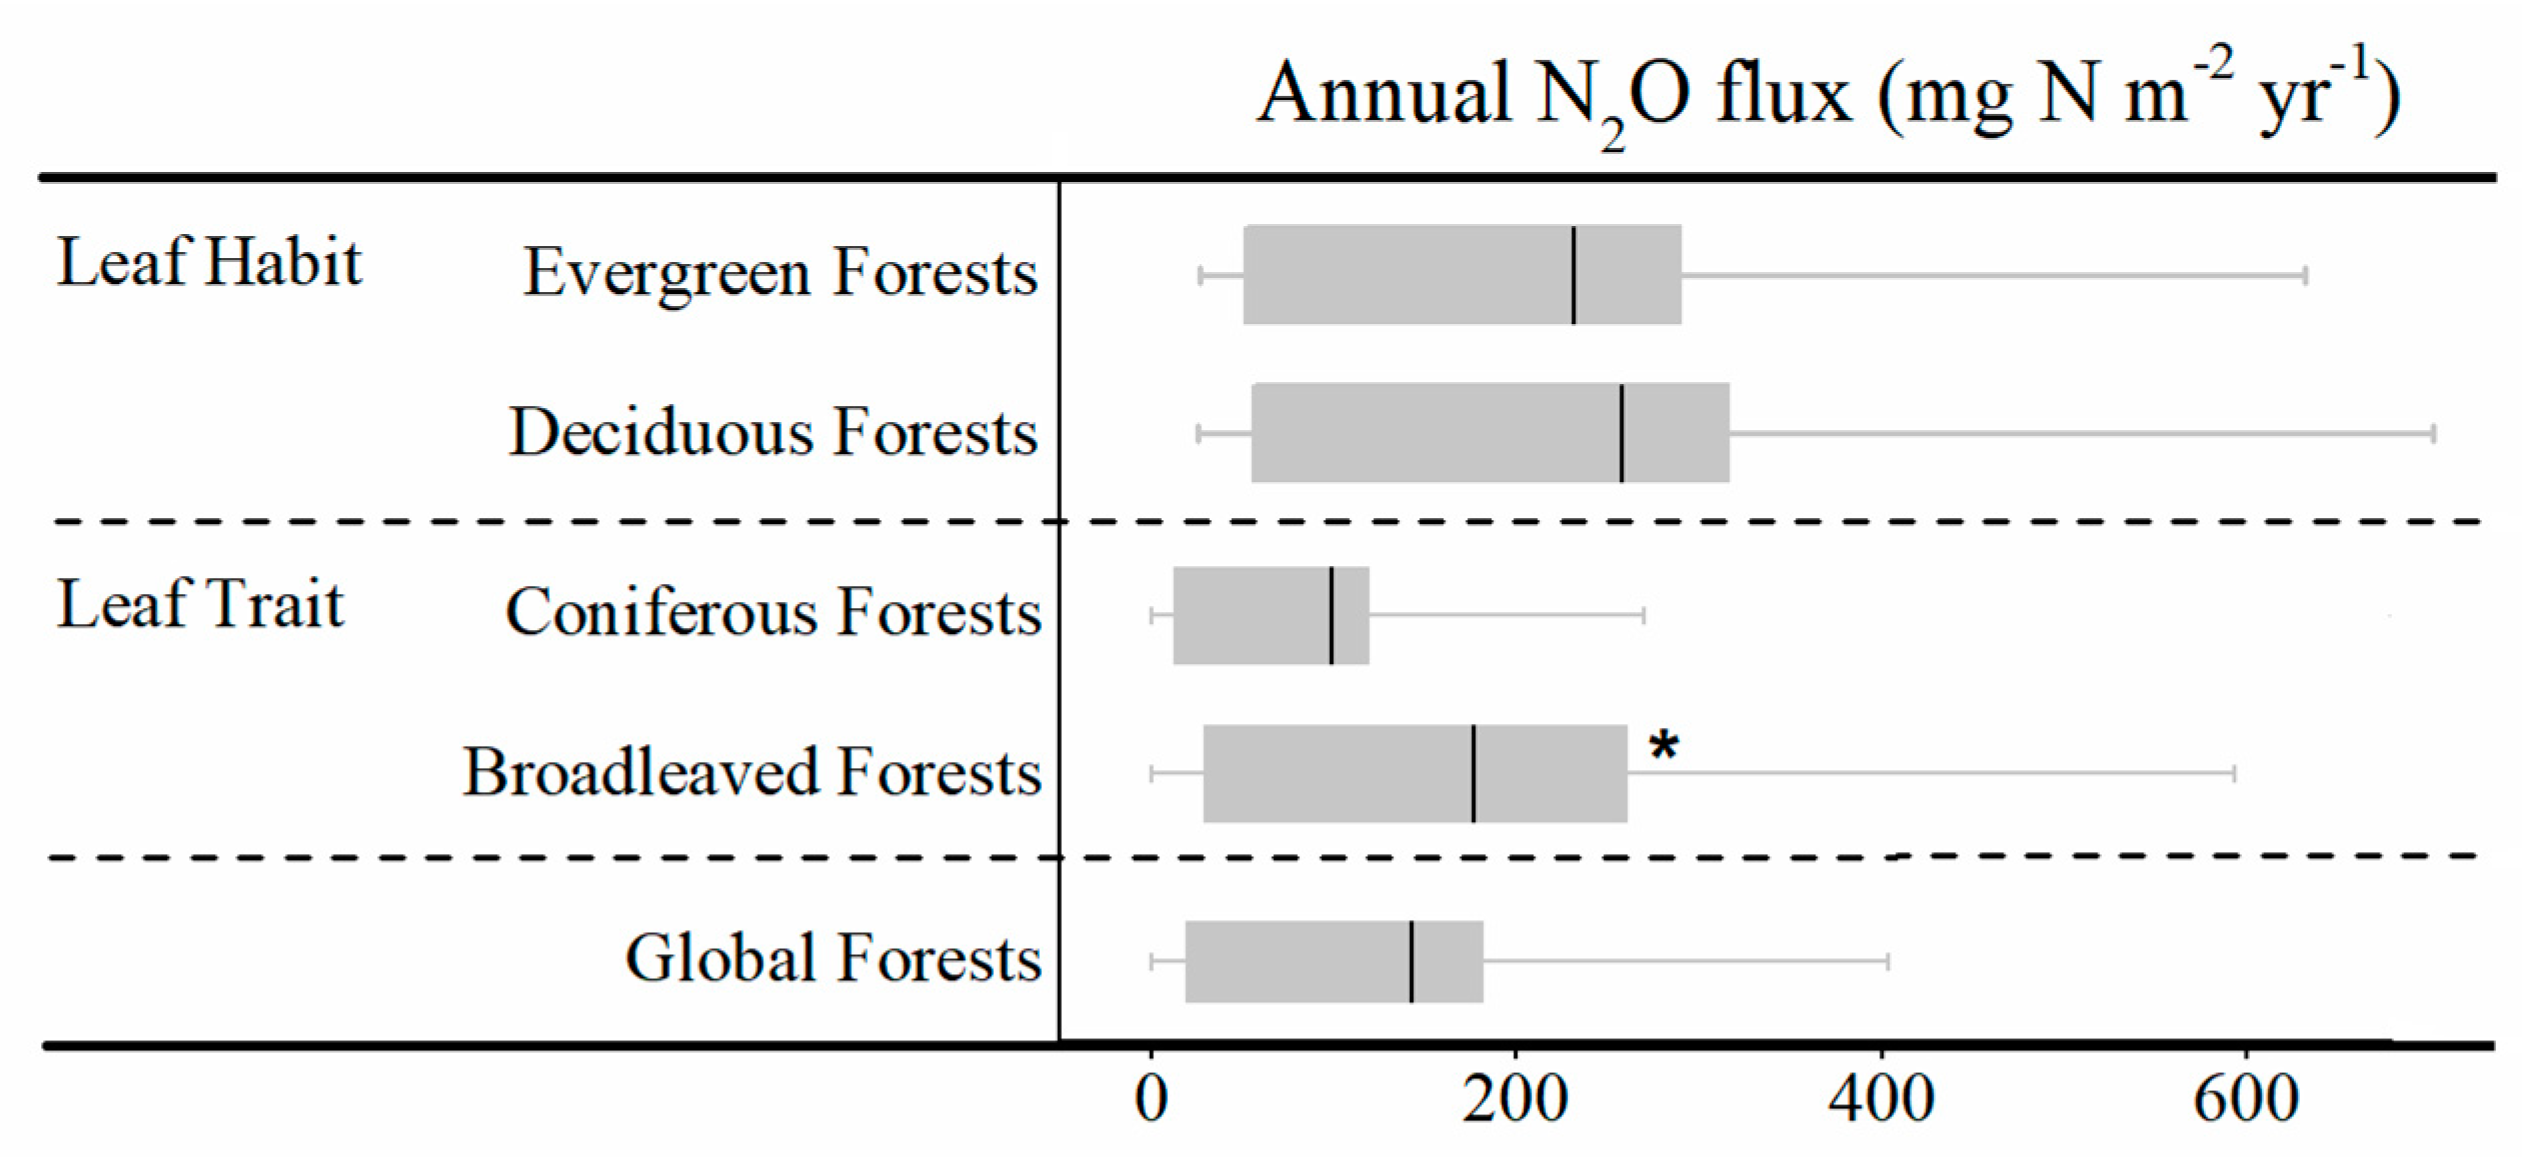
3.1. Annual N2O Fluxes and N2O Emission Budget of Global Forests and Forest Classified by Different Biotic Groups

The average annual N2O flux of the global forest was 142.91 ± 14.1 (standard error, SE) mg N m−2 year−1, ranging from 0.20 to 1003.30 mg N m−2 year−1. Combined with Figure 1, more than 60 percent of the collected sites had low N2O fluxes (<75 mg N m−2 year−1). Among leaf habits, the mean annual N2O fluxes were 137.63 ± 15.83 mg N m−2 year−1 and 154.74 ± 28.87 mg N m−2 year−1 from evergreen and deciduous forests, respectively (Table S1). For different leaf traits groups, the average annual N2O flux of global broadleaved forests was up to about two times higher than that of coniferous forests, with values of 176.99 ± 21.42 mg N m−2 year−1 and 98.57 ± 15.37 mg N m−2 year−1, respectively. Furthermore, remarkable differences were only found between the leaf trait groups (p < 0.05), while the broadleaved forests exhibited larger variations and uncertainties compared to the coniferous forests (Figure 2). The total emission of N2O from evergreen and deciduous forests were estimated to be approximately 2.85 Tg N and 1.63 Tg N, amounting to about 63.6% and 36.4% of the N2O emission from total global forests, respectively (Table S1). Due to the smaller forest area and N2O flux, the estimated N2O emission from coniferous forests was 1.04 Tg N, which was much lower than that from evergreen forests (3.65 Tg N). In addition, the range of total forest N2O emission was 4.45–4.69 Tg N, based on the estimation of different forests groups.

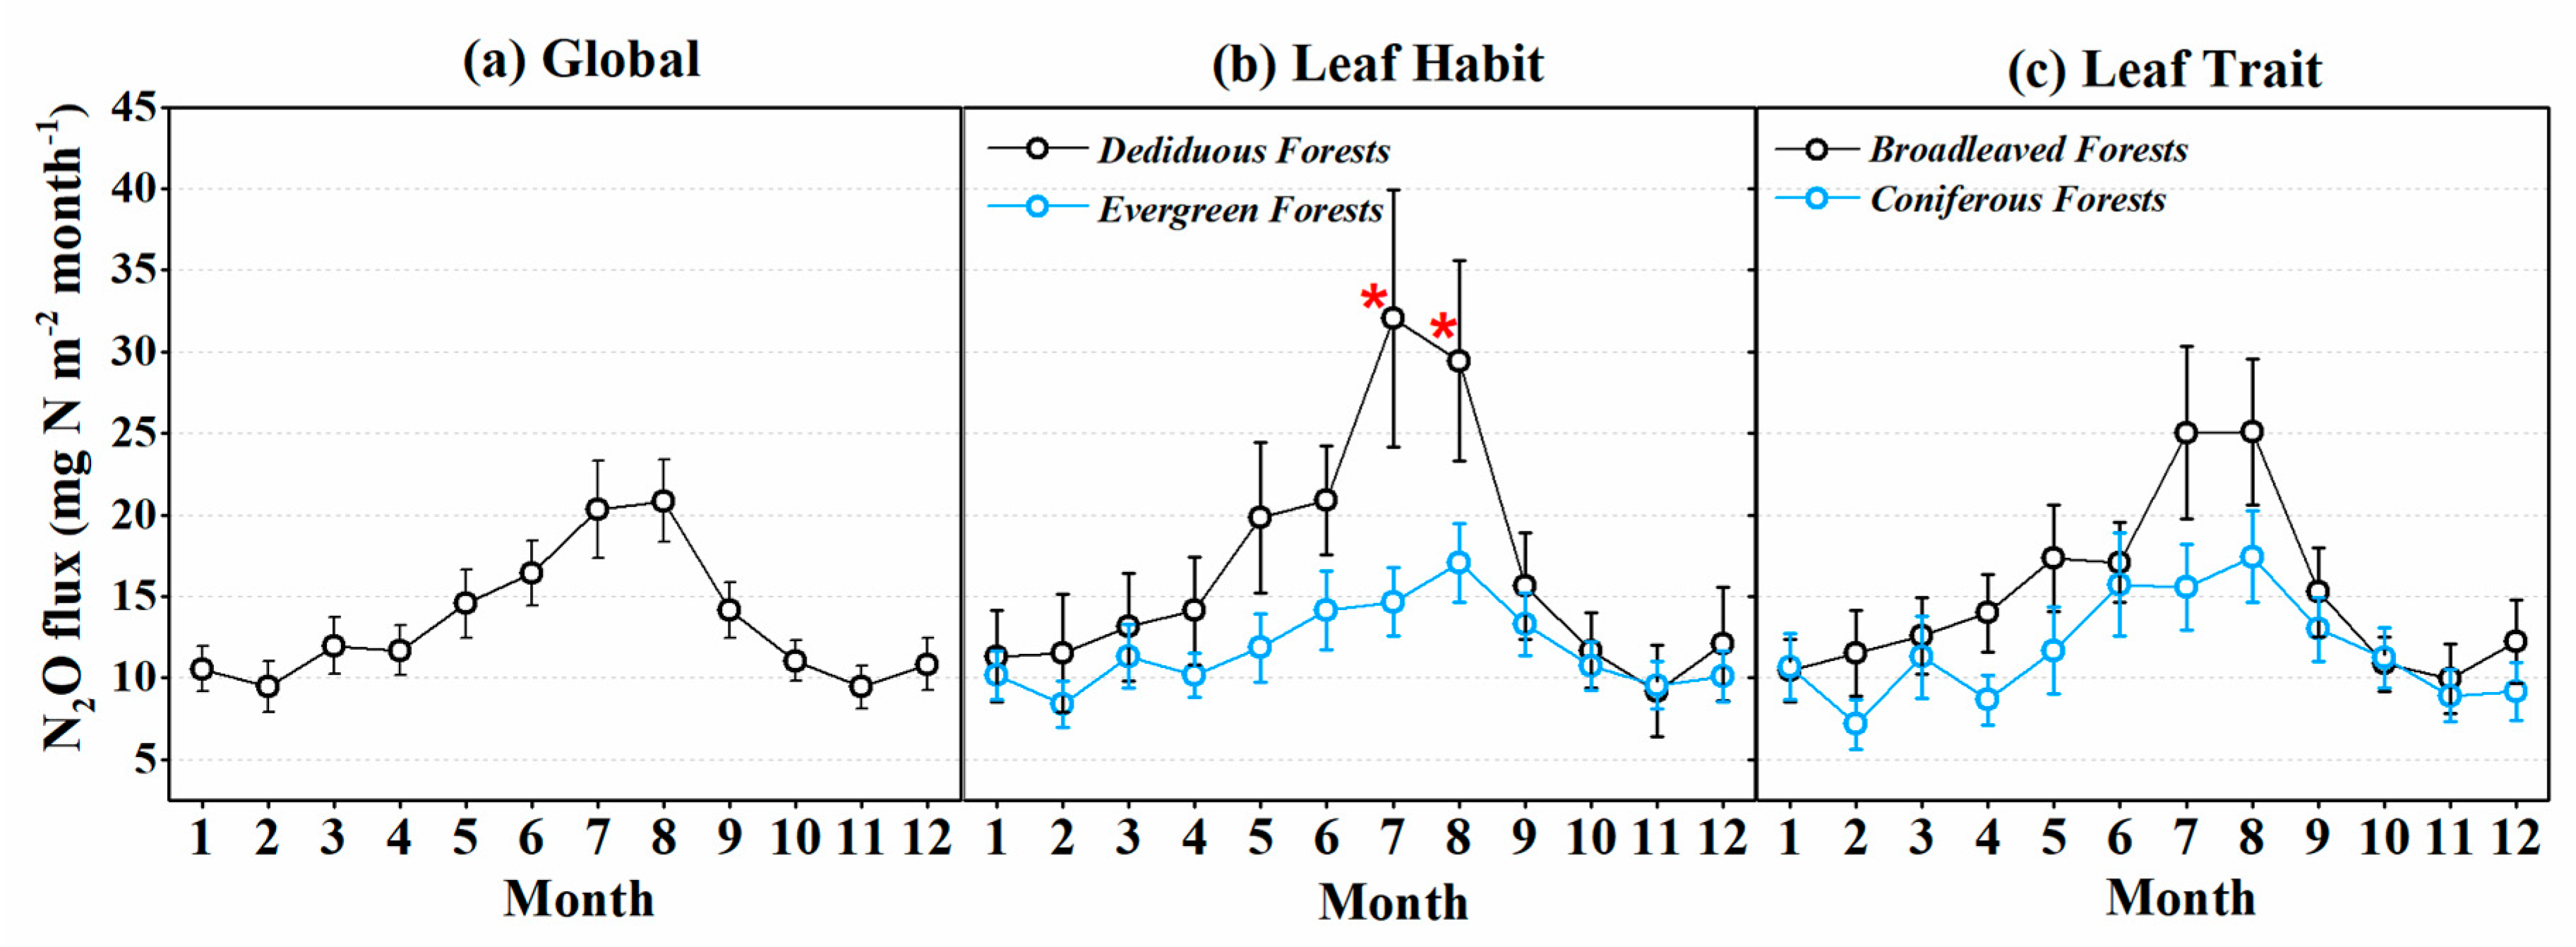
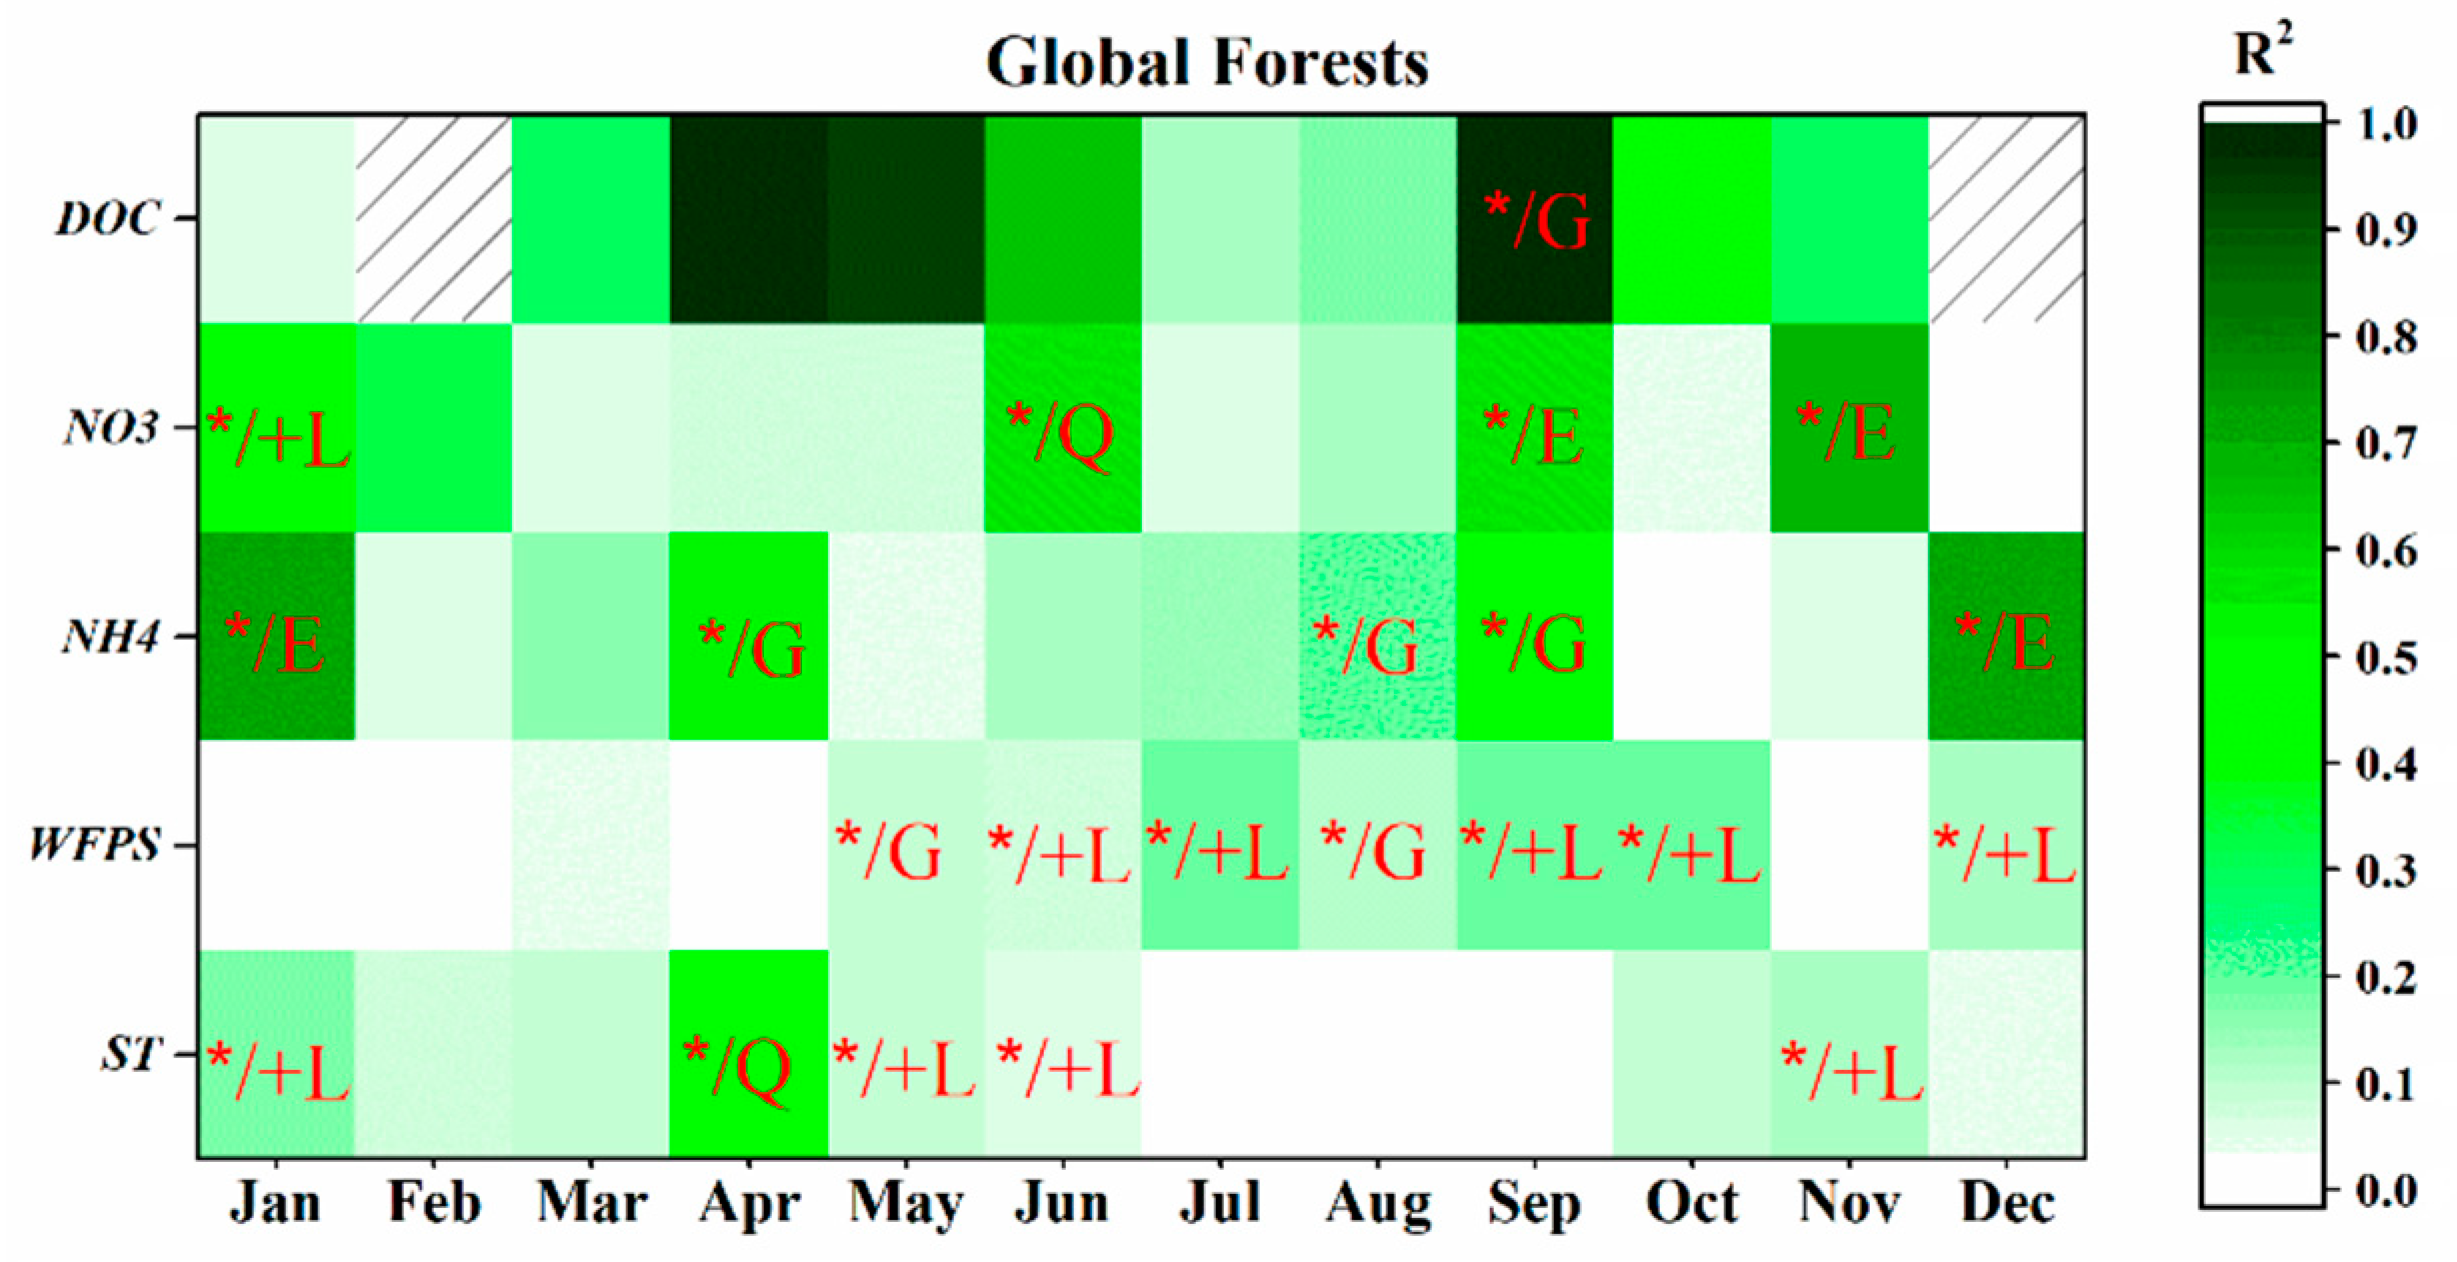
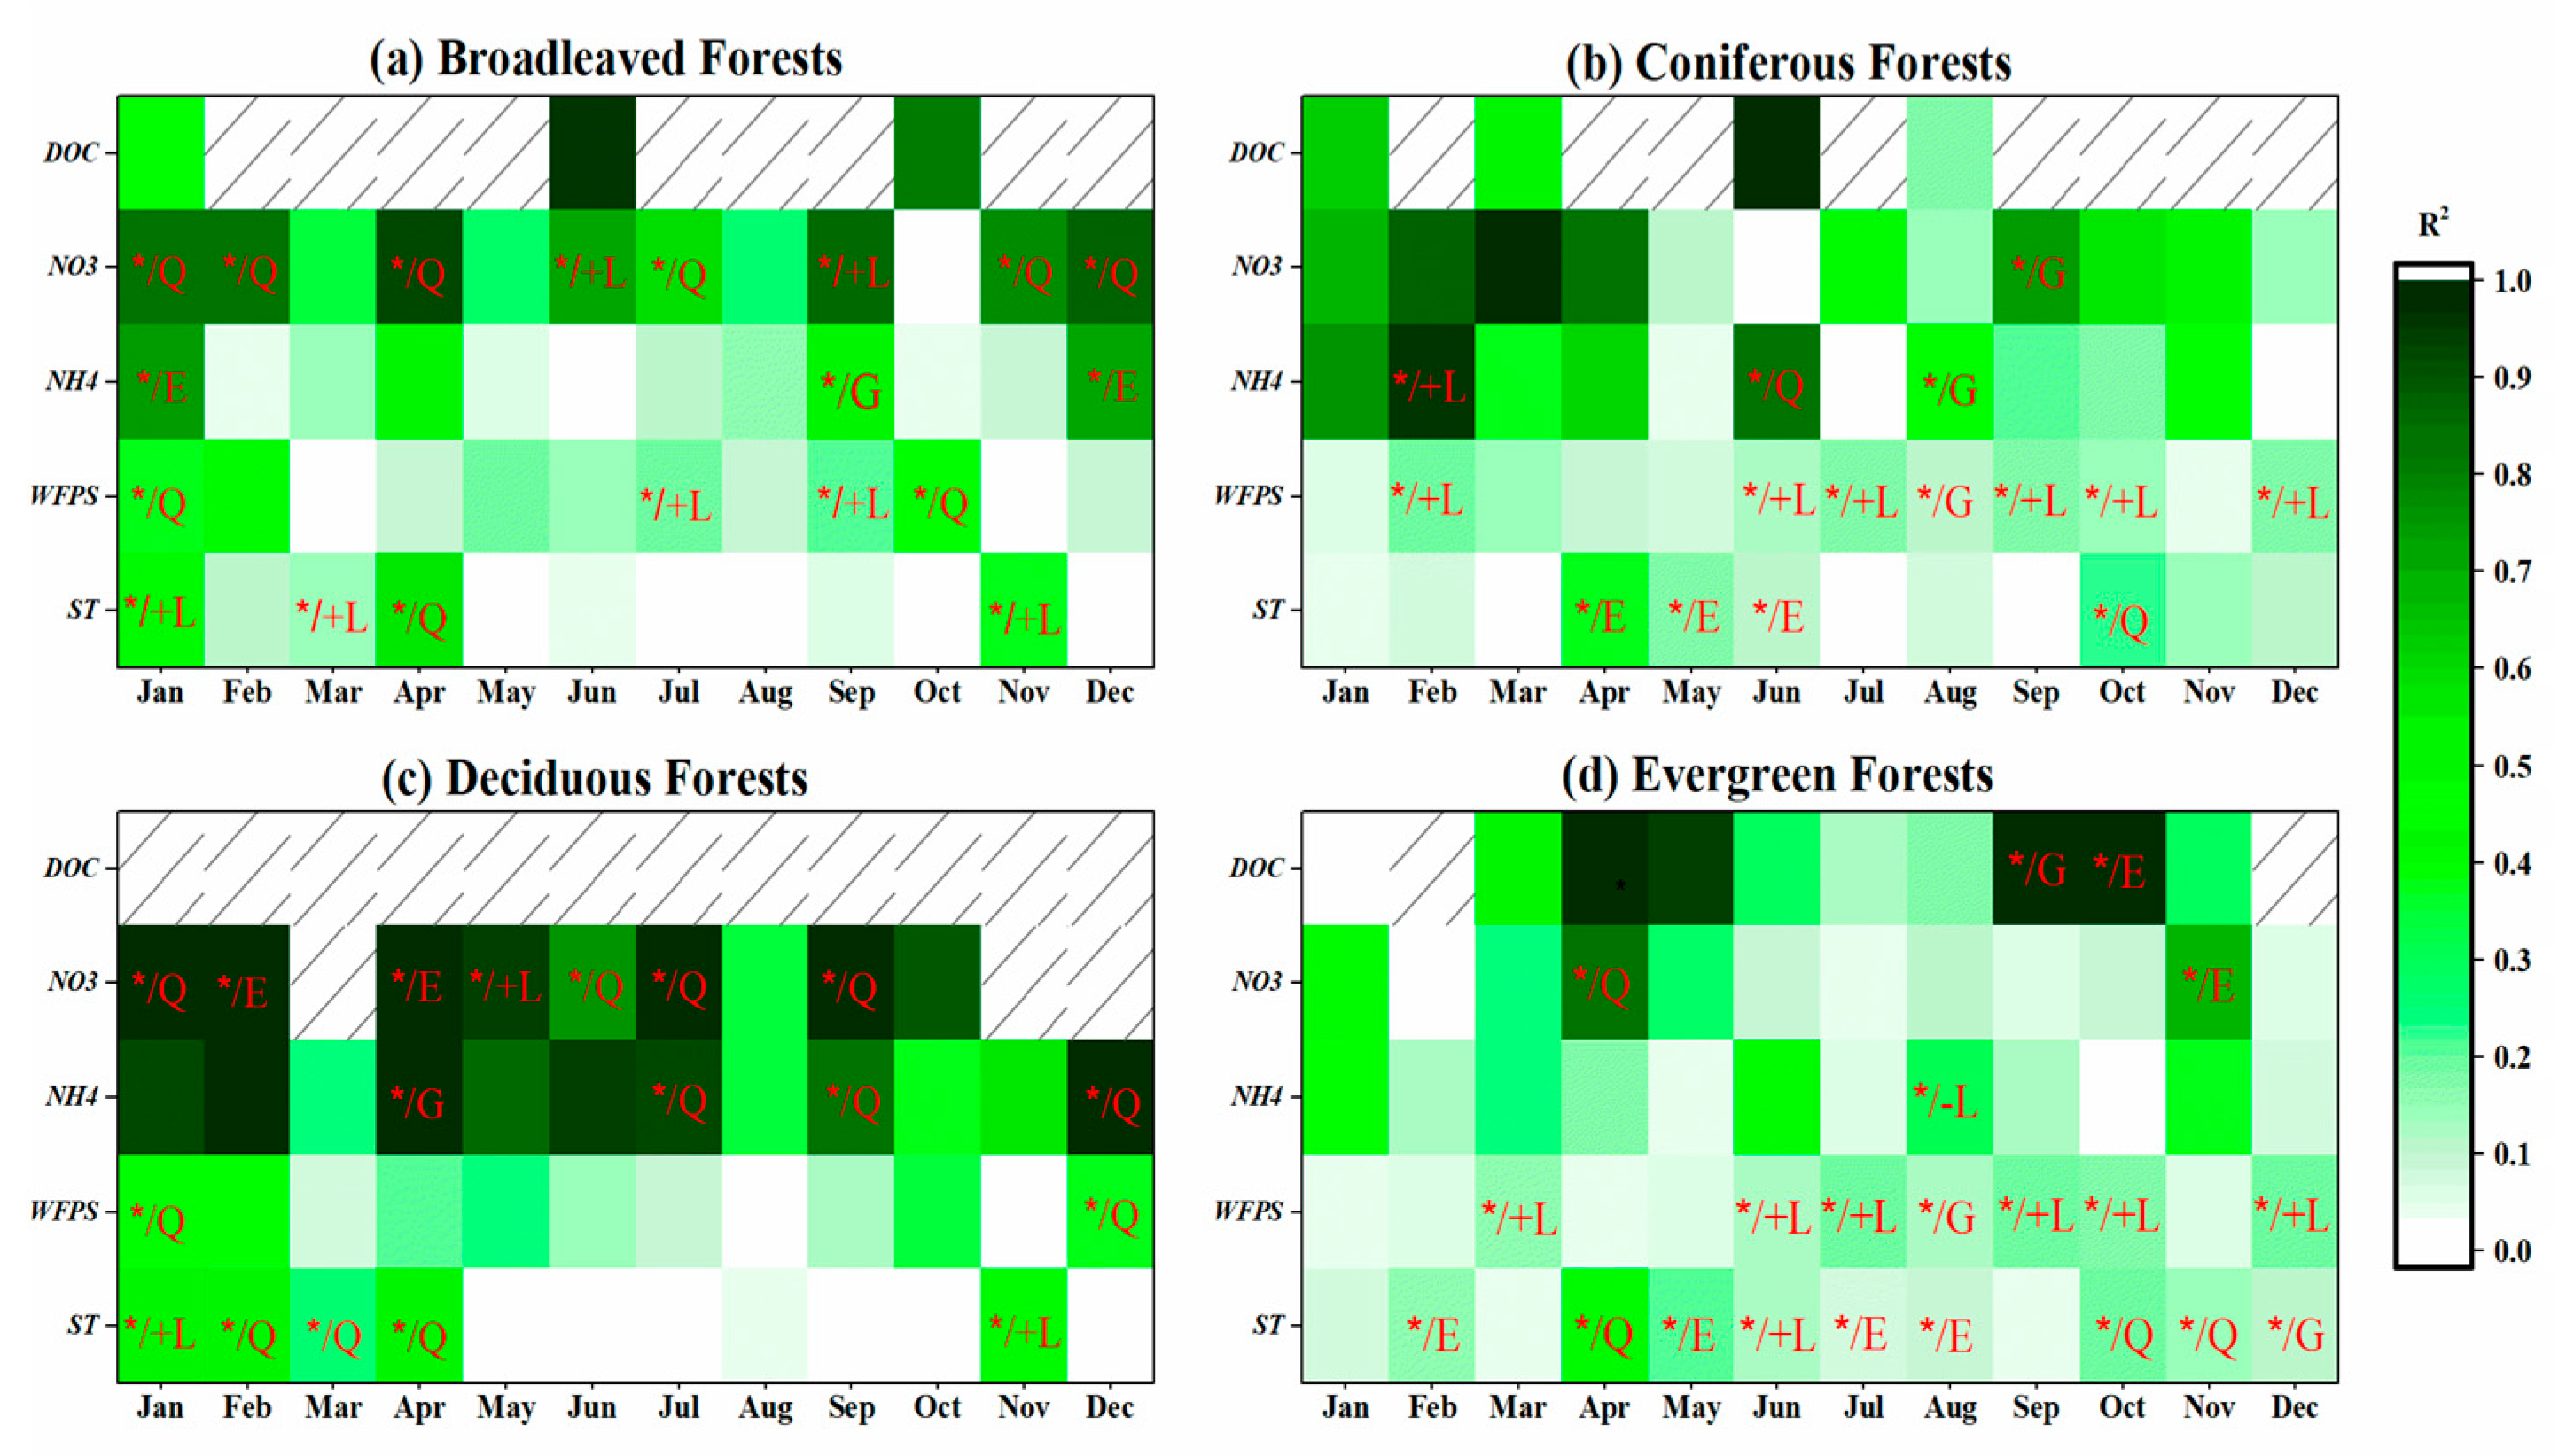
3.2. Seasonal Variation of N2O Fluxes of Global Forests and Forest Classified by Different Biotic Groups

Figure 3 shows the seasonal variation of N2O fluxes of global forests and forests classified as different biotic groups. Global forests had an obvious seasonal variation of N2O fluxes, with a maximum value of 20.85 ± 2.55 mg N m−2 month−1 in August and a minimum value of 9.43 ± 1.33 mg N m−2 month−1 in November. The seasonal variation of N2O flux in deciduous forest was larger than that in evergreen forest, and it showed the relatively higher N2O fluxes in the majority of months, compared to the evergreen forests, except for some months that had low levels of N2O flux. Two larger monthly N2O fluxes occurred in July and August, with values of 32.05 ± 7.91 mg N m−2 month−1 and 29.43 ± 6.15 mg N m−2 month−1, respectively, which were both significantly higher than that of evergreen forests. For broadleaved and coniferous forest groups, they had similar monthly trends, with slight fluctuations among different months, both of which peaked in August with a value of 25.07 ± 4.50 mg N m−2 month−1 and 17.42 ± 2.80 mg N m−2 month−1, respectively. Among all monthly observations, the largest N2O flux was measured in deciduous forests during July, while the smallest one occurred in coniferous forests during February.

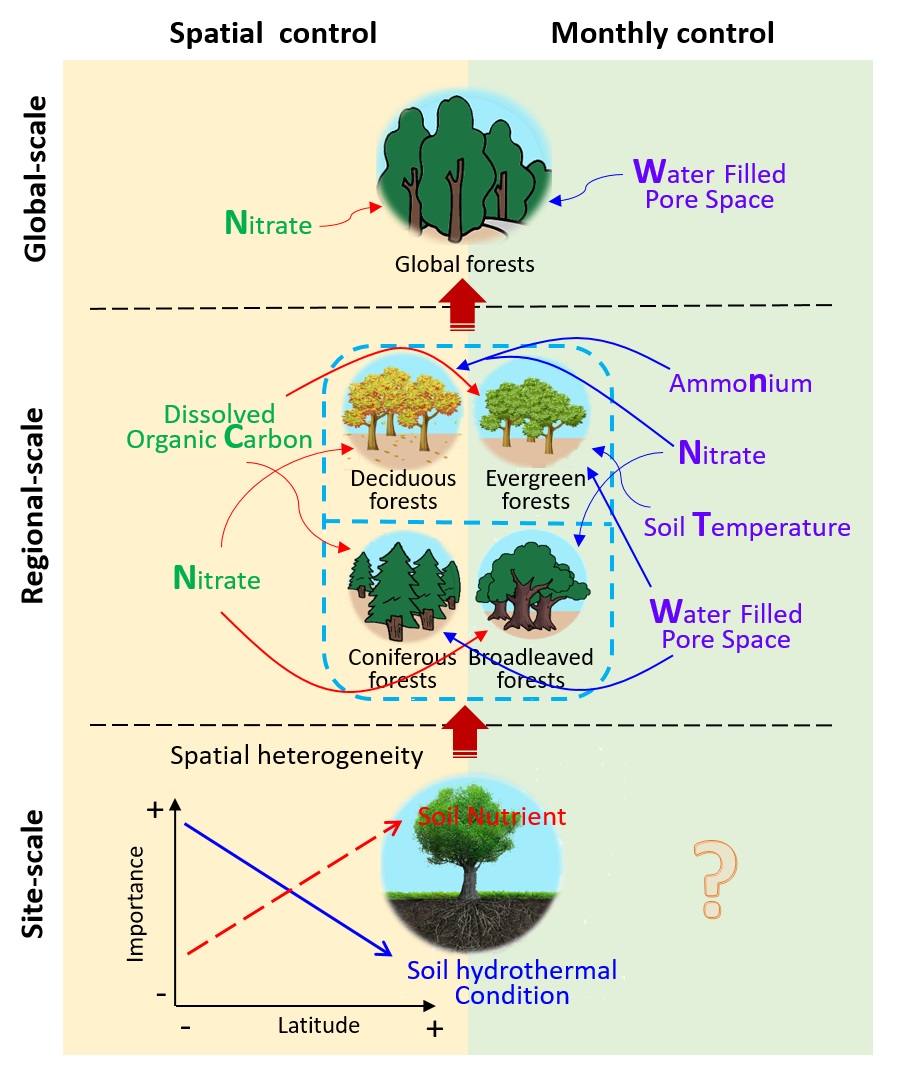
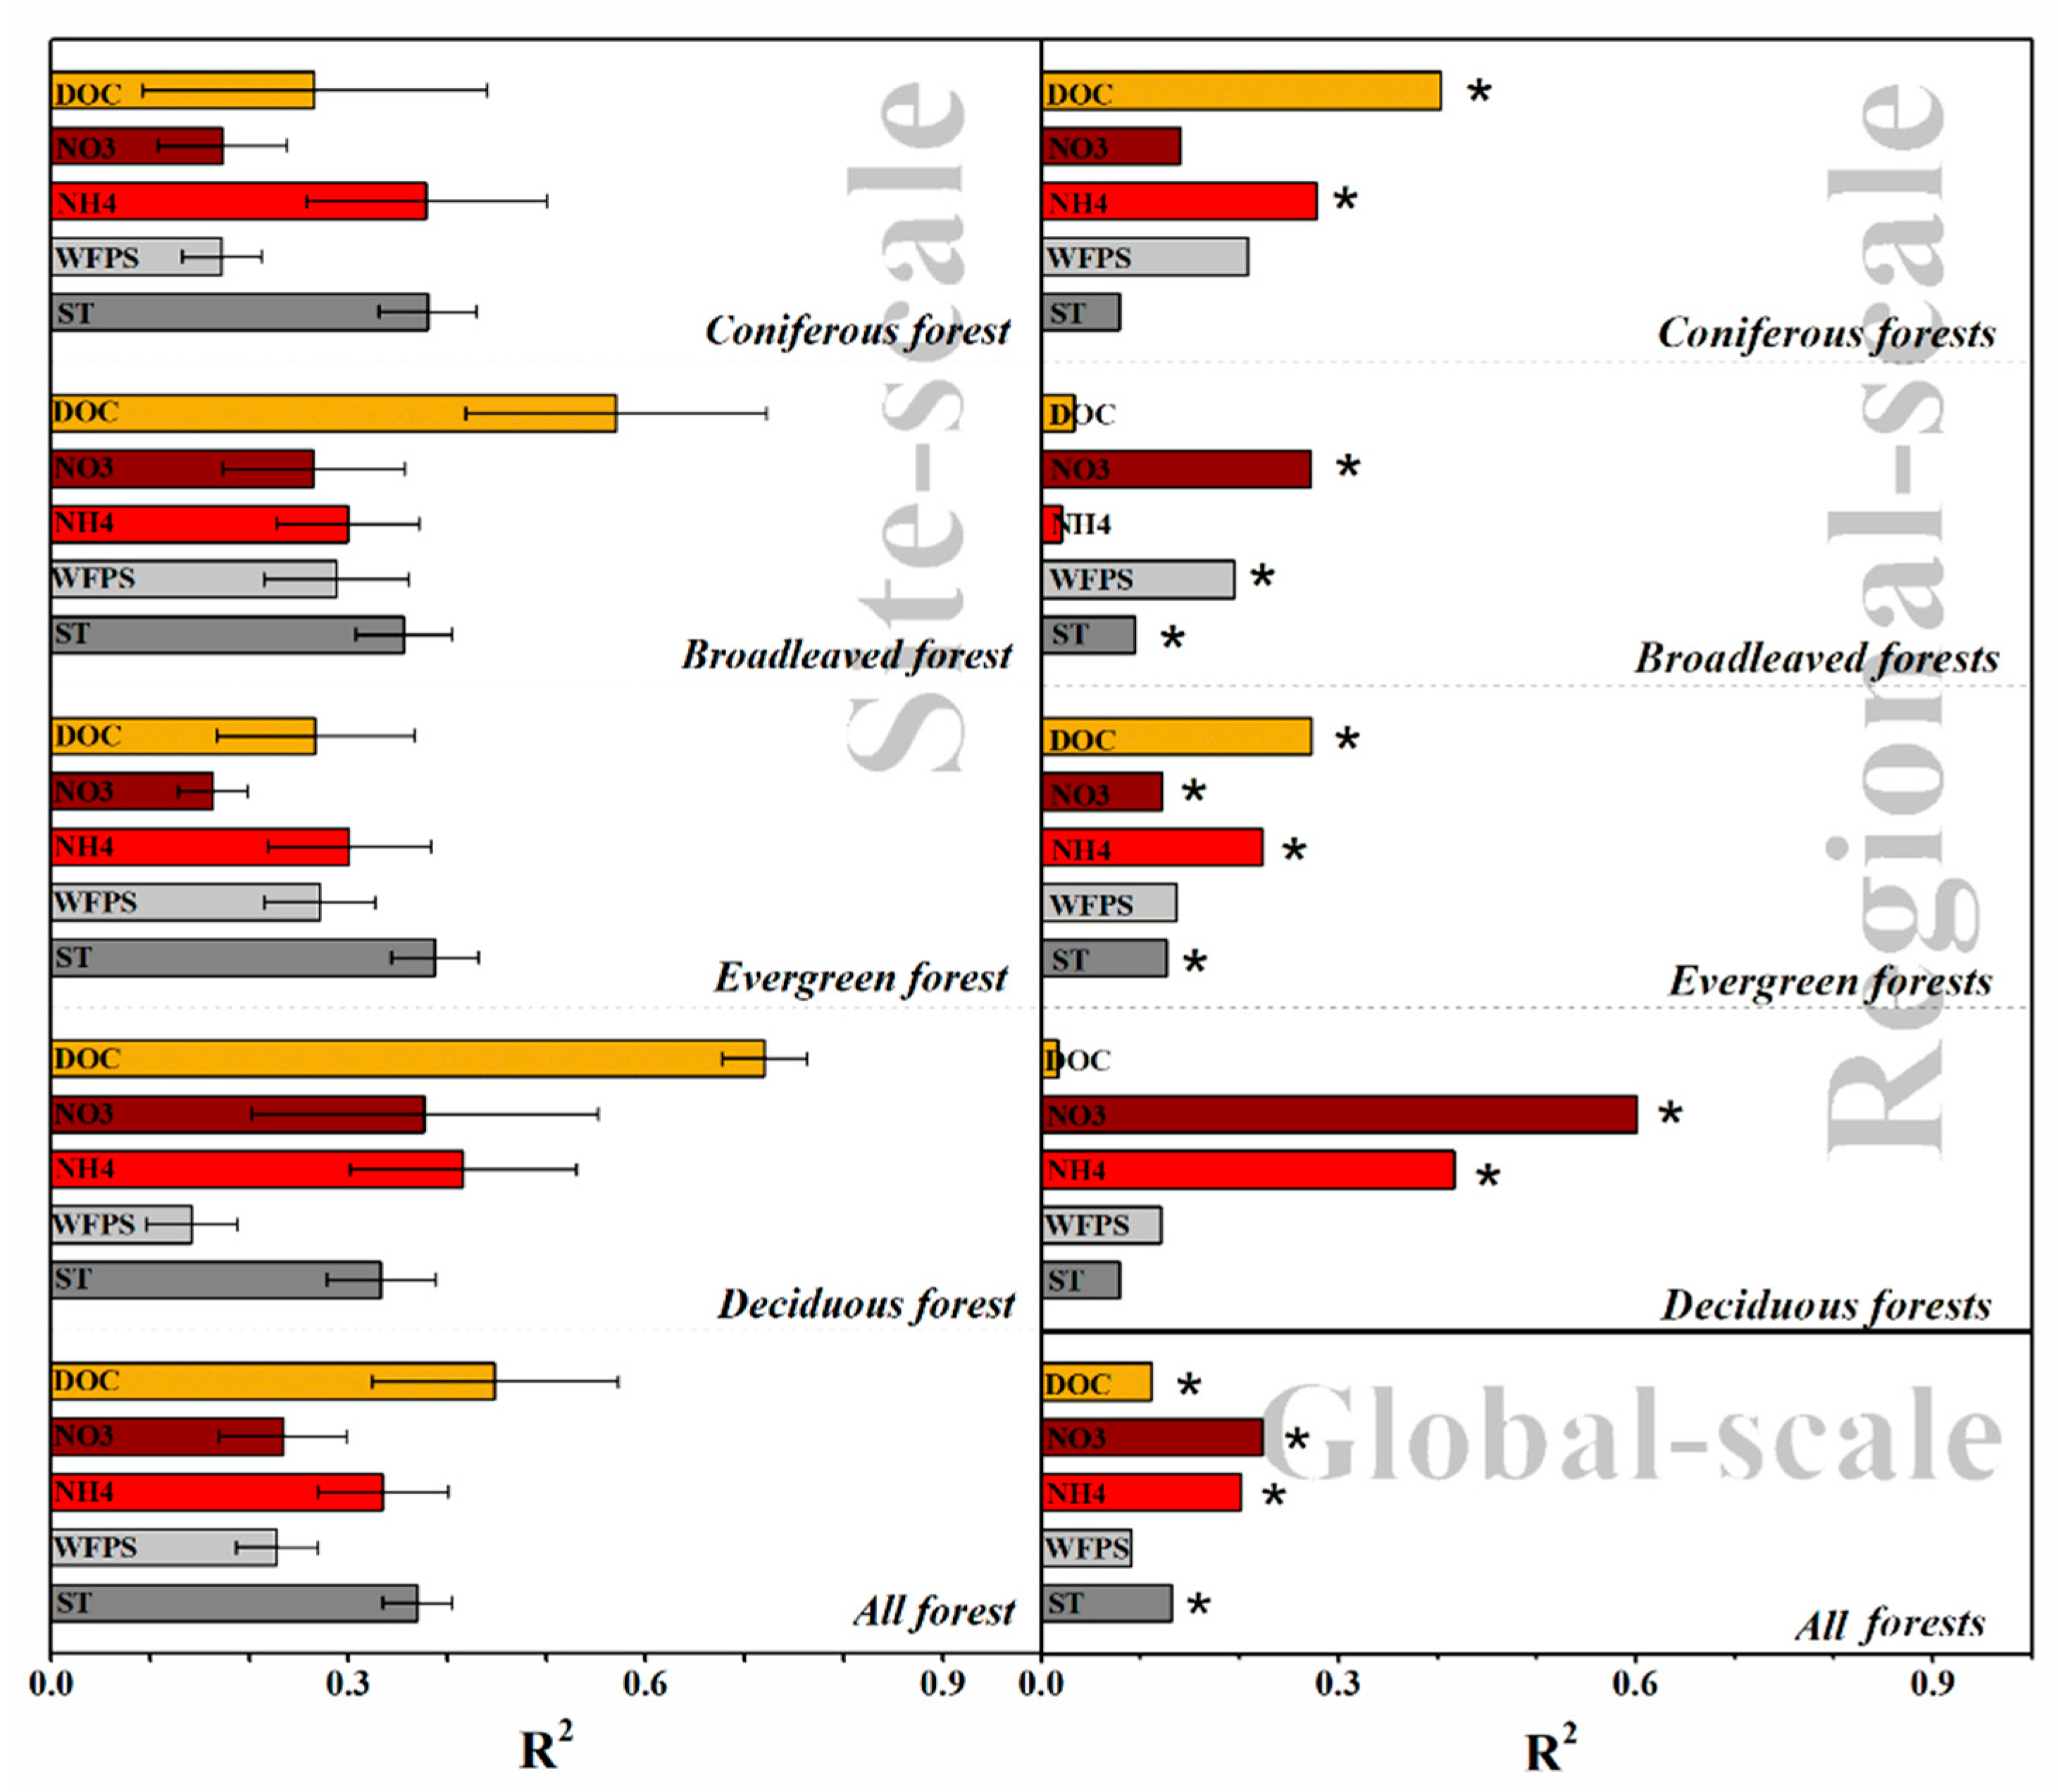
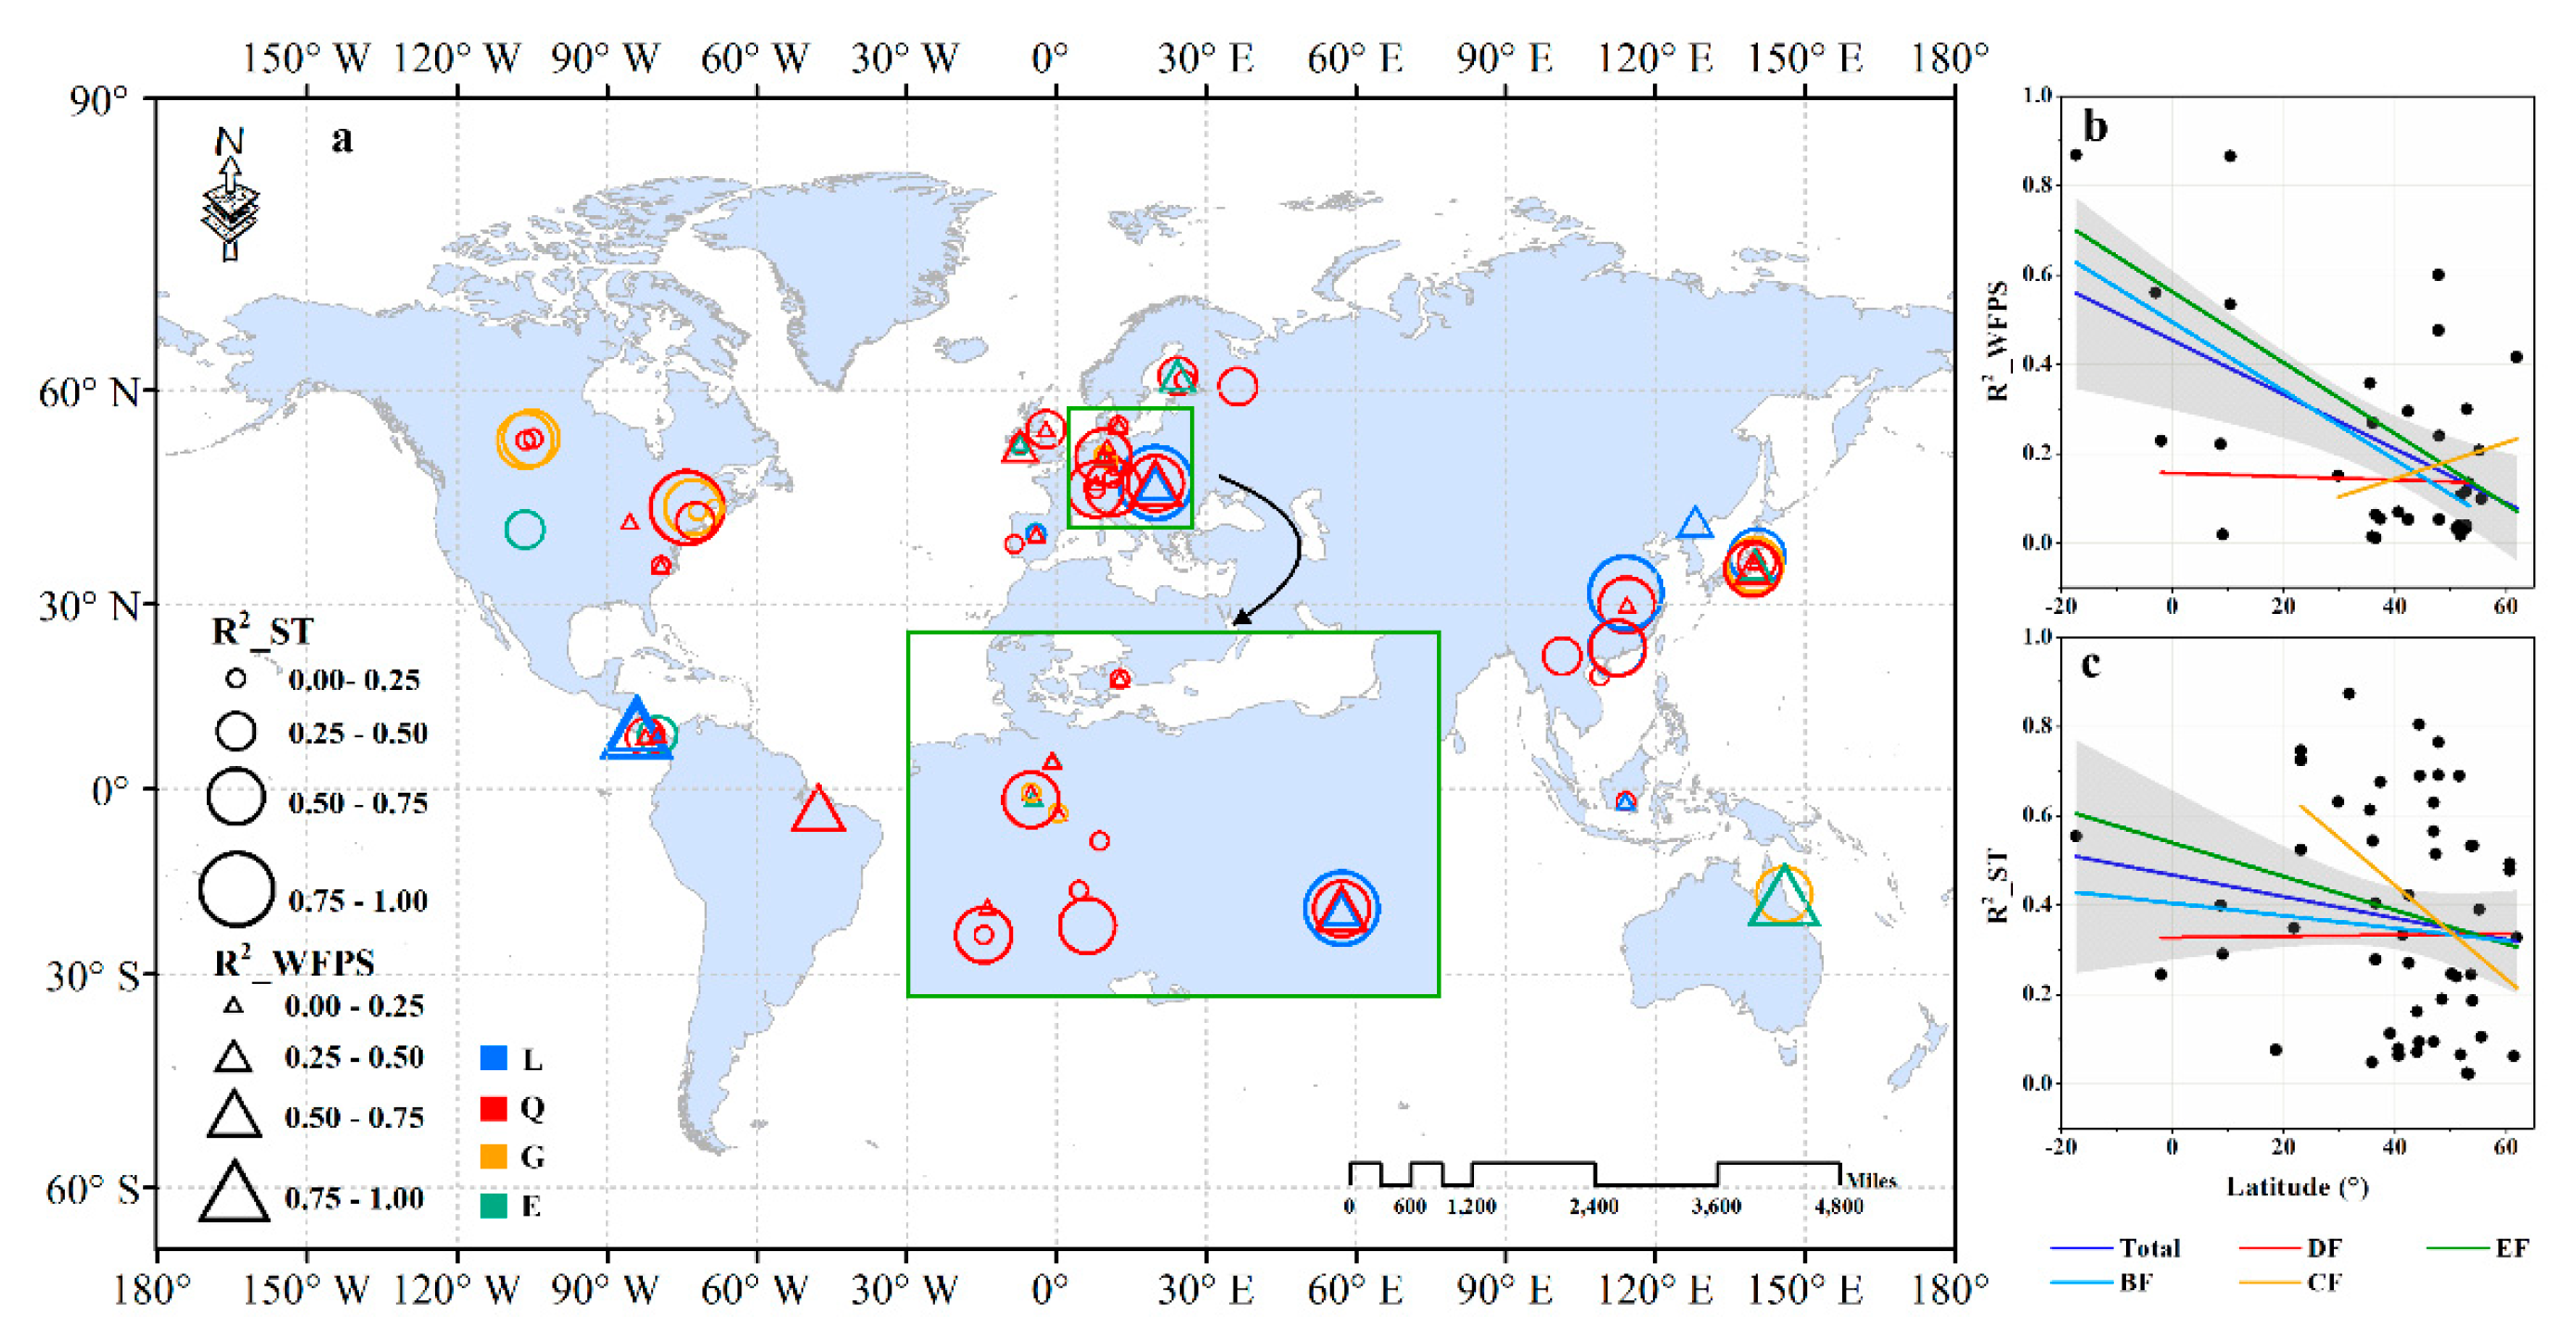
3.3. Edaphic Factors Involved in Controlling N2O Fluxes on Global, Regional, and Site Scales

3.3.1. Global-Scale

Figure 4 shows the relationship between N2O and edaphic factors (i.e., soil temperature, WFPS, pH, and NH4+, NO3, and DOC concentration) for global forests. Except for WFPS, other factors, including NO3 concentration, NH4+ concentration, soil temperature, and DOC concentration, were found to be significantly correlated with N2O fluxes, performing logarithmic (R2 = 0.223, n = 51), quadratic (R2 = 0.202, n = 47), logarithmic (R2 = 0.132, n = 82), and linear (R2 = 0.111, n = 61) relations, respectively. Figure 5 shows the effect of five edaphic factors on N2O flux in different months, on the global scale. Significant linear correlations were found between soil temperature and N2O flux in January, May, June, and November, of which N2O fluxes in months with relatively low soil temperature (i.e., January and November) was more sensitive to the variation of soil temperature. From May to October, N2O flux was significantly related to WFPS, with an R2 range of 0.079–0.198. Though there was no regular seasonal variations for the influence of soil mineral nitrogen level (NH4+ and NO3 concentration) on N2O flux, the soil mineral nitrogen could explain the relatively larger variations of N2O fluxes in the months of January, April, June, August, September, November, and December (R2 = 0.212–0.715).

3.3.2. Regional-Scale
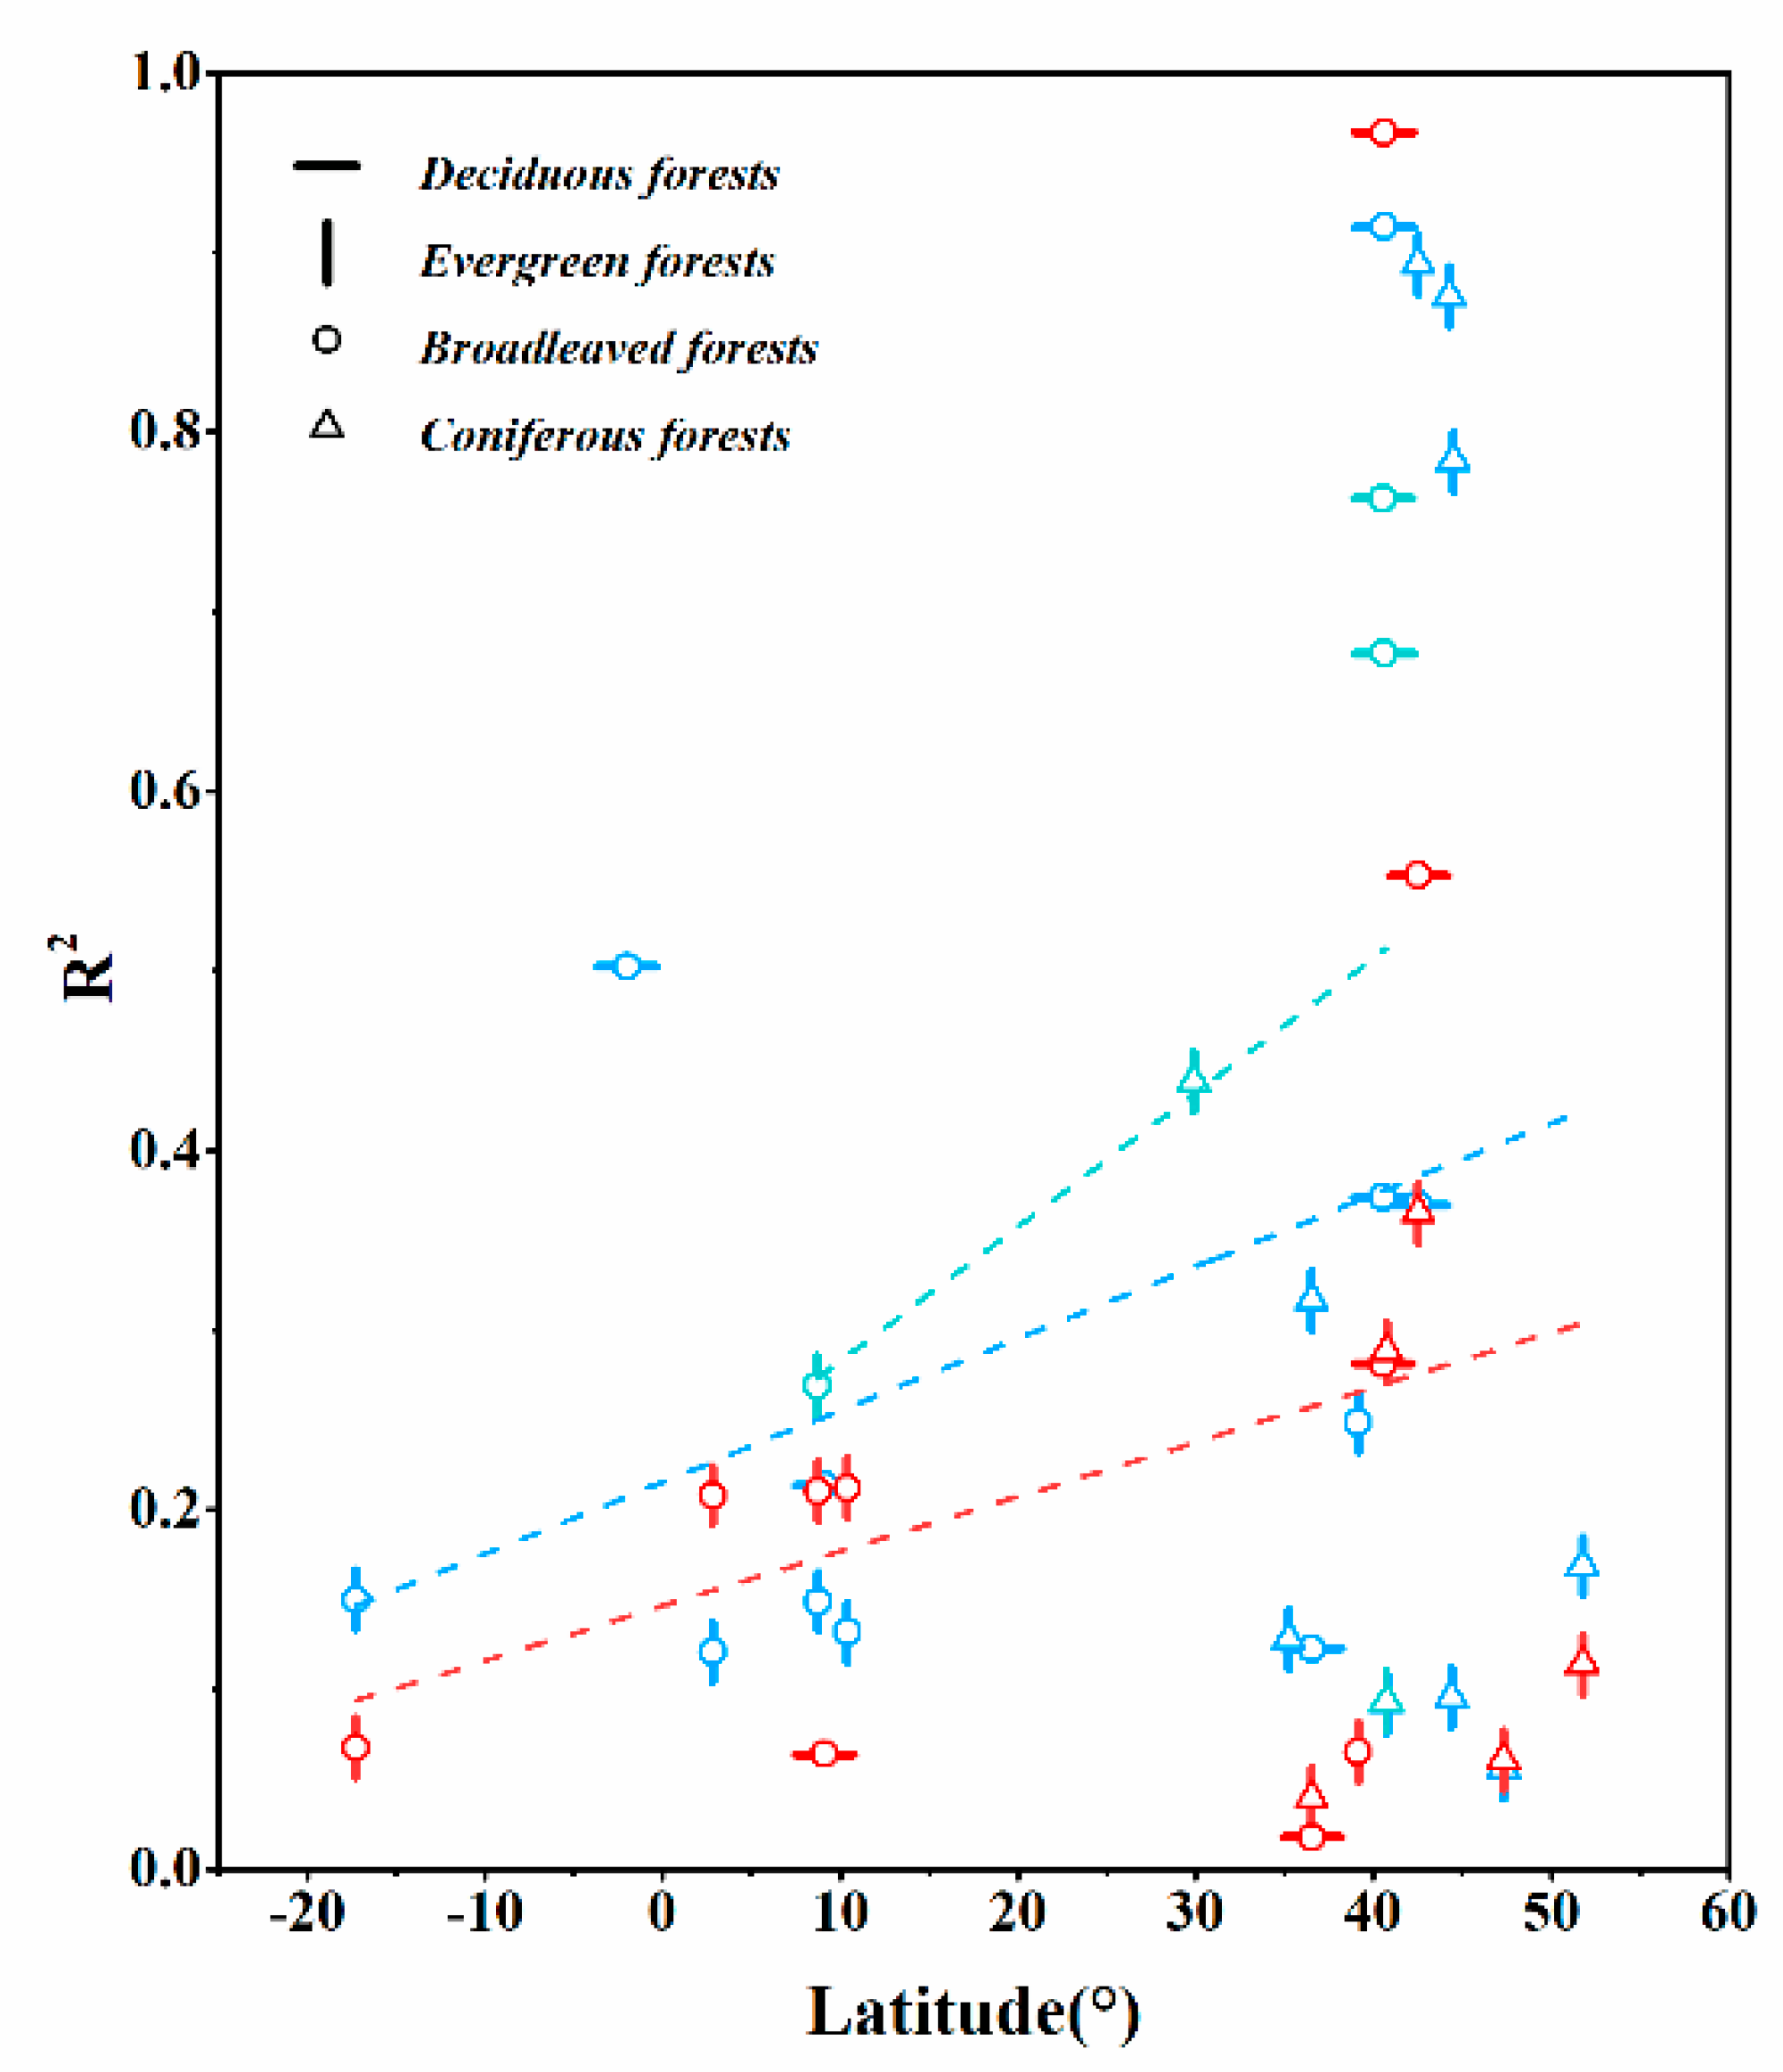
For leaf traits forest groups, the order of edaphic factor explanations to N2O emissions variation were as follows for broadleaved forests—R2_NO3 (0.272, p < 0.01, n = 36) > R2_WFPS (0.195, p < 0.05, n = 2) > R2_ST (0.094, p < 0.05, n = 49) > R2_DOC (0.033, p > 0.05, n = 39) > R2_NH4 (0.021, p > 0.05, n = 16). However, the DOC concentration became the most relevant factor influencing N2O fluxes from coniferous forests (R2 = 0.404, p < 0.01, n = 22). Furthermore, NH4+ concentration, which had little effect on N2O fluxes from broadleaved forests, became the second remarkable influencing factor for N2O fluxes from coniferous forests (R2 = 0.278, p < 0.05, n = 16), and it showed a negative linear correlation to N2O fluxes. For the leaf habit forest groups, soil mineral nitrogen concentration were important factors influencing N2O fluxes from deciduous forests (R2 = 0.601, p < 0.01, n = 12 and R2 = 0.417, p < 0.05, n = 12 for NO3 and NH4+ concentration, respectively), while soil DOC concentration was the most effective control of N2O fluxes from evergreen forests (R2 = 0.272, p < 0.01, n = 41). In addition, N2O flux was also found to be significantly correlated with NH4+ and NO3 concentration and soil temperature in evergreen forests.
Figure 6 illustrates the relationships between five critical edaphic factors and N2O flux of each month on the regional scale. For broadleaved forests, the explanation rate of NO3 concentration to N2O flux variation was higher in the majority of months, except for March, May, August, and October. The effect of soil temperature on N2O flux in January (R2 = 0.406), March (R2 = 0.145), April (R2 = 0.556), and November (R2 = 0.369) were significant. For coniferous forests, there was a significant correlation between WFPS and N2O flux from June to October (R2 = 0.108–0.174). Except for September, the N2O flux in the other months had no significant correlation with NO3 concentration.
For evergreen forests, we found that WFPS in March, June, July, September, October, and December had a significant positive correlation with N2O flux for evergreen forests, with R2 at the range of 0.132–0.197, and the variation of N2O flux in March and July showed a greater water-sensitivity. Except for January, March, and September, the N2O flux in other months were found to be significantly correlated to soil temperature (R2 = 0.070–0.404). In addition, except for the significant correlation between NO3 concentration and N2O flux in April (R 2= 0.832) and November (R2 = 0.667), the influence of NO3 and NH4+ on N2O was weak in other months. For deciduous forests, the significant effect of soil temperature on N2O flux was only reflected in the lower temperature months (for the Northern Hemisphere), and its explanation rate for N2O flux variation was between 26%–52%, showing a positive linear or quadratic function correlation. The significant effect of WFPS on N2O flux was only reflected in January and December, and the explanation rate of N2O flux variations were 39% and 37%, respectively. In addition, the concentration of NO3- and NH4+ had a strong effect on N2O, in the majority of months.
Overall, the main controls of N2O flux from deciduous forest and evergreen forests differed in months. In most months, soil nutrient might be dominant for N2O emission from deciduous forests, while soil temperature and WFPS were the main factors regulating N2O emission from evergreen forests. Coniferous forest and broadleaved forests did not show significant seasonal differences among these factors. Moreover, without considering the seasonal variation of factors, there was no significant correlation between WFPS and N2O flux from coniferous or evergreen forests, while it was found that WFPS and N2O flux were significantly correlated in coniferous and evergreen forests, among different months.

3.3.3. Site-Scale

We further analyzed the relationship between N2O fluxes and five edaphic factors (i.e., soil temperature, WFPS, NH4+, NO3-, and DOC concentration), for each site with sufficient data (Figure 4). On a site scale, the relationship between soil temperature and N2O flux (with the mean R2_ST of 0.370) was stronger than that between WFPS and N2O fluxes (with a mean R2_ST of 0.228) for the majority of individual forest plots, globally. Particularly, soil temperature was the dominant factor for N2O fluxes from evergreen forests and coniferous forests, with a mean R2_ST of 0.387 and 0.380, respectively. However, the effect of soil nutrients on N2O fluxes was stronger than that of soil hydrothermal conditions for deciduous forests, in site scale. According to Figure 6a, the best-fit curve for WFPS/soil temperature and N2O fluxes differed in global forest sites, and WFPS and soil temperature could explain from approximately 1.1 to 85.6 percent and 2.2 to 87.4 percent of the variance in N2O fluxes, respectively. Strong positive linear correlation (R2_WFPS > 0.50) between WFPS and N2O fluxes appeared in tropical evergreen broadleaved forests. Figure 7b,c show the relationship between R2_WFPS and R2_ST and latitude, respectively. Among all sites, the value of N2O flux variability explained by WFPS decreased significantly as latitude increased (Figure 7b, R2 = 0.27, p < 0.01), and the same trends were found in evergreen forests and broadleaved forests, except that the R2_WFPS of coniferous forests increased slightly with an increase in latitude. The explanation of soil temperature to the variation of N2O flux also decreased slightly with the increase of latitude, for the different forest groups, but not significantly. Furthermore, neither R2_WFPS nor R2_ST of deciduous forests changed greatly with latitude.
Figure 8 shows the coefficient of determination of the best-fit regression model of linear, quadratic, logarithmic, or exponential function between N2O fluxes and NH4+ concentration (R2_NH4), NO3- concentration (R2_NO3), and DOC concentration (R2_DOC), for each forest site, along the latitude gradient. With an increase in latitude, R2_NH4, R2_NO3, and R2_DOC all showed a trend of increase. Comparing R2_ST and R2_WFPS in forest sites where both WFPS and soil temperature data were available, four-fifth of the forest sites showed that the contribution of soil temperature to the variation of N2O fluxes was higher than that of WFPS (Table S2). Comparing R2_NH4 and R2_NO3 in forest sites where both NH4+ and NO3 concentration data were available, the number of sites with larger R2_NH4 (8/15) was almost equal to that with larger R2_NO3 (7/15) and there was no obvious regional boundary (Table S2).
Overall, the relationship between N2O fluxes and each edaphic factor could be expressed in a quadratic function for the majority of forests around the world. The contribution of soil physical properties (i.e., WFPS and soil temperature in this study) to N2O fluxes from forests in higher latitudes was smaller than that in lower latitudes. Conversely, the contribution of soil chemical properties (i.e., NH4+, NO3, and DOC concentrations in this study) to N2O fluxes from forests in higher latitudes was larger than that in lower latitudes. In addition, the soil temperature or DOC concentration could be the main site-control factor determining N2O fluxes from different types of forest groups.

4. Discussion

4.1. Comparison of Total N2O Budget with Previous Studies

In this study, the range of total N2O emission from natural forests was 4.45–4.69 Tg N, based on the estimation of different forests groups, and this result was within a reasonable range, compared to other studies (Table 1). Based on estimation through an empirical climate-driven soil respiration model [17], Xu et al. [18] reported global N2O emission rates of 6.99 Tg N per year for forests, from 2000 to 2008. The budget of Xu et al. [18] was higher than the estimation in this study. As an alternative, Tian et al. [19] and Zhang et al. [6] calculated smaller values of 4.28 Tg N and 3.62 Tg N per year N2O emissions from global forests by means of the simulation of process-based models of the DLEM (The Dynamic Land Ecosystem Model) [20] and the TRIPLEX-GHG model [21], respectively, as compared to this study. Moreover, Zhuang et al. [7] reported a value of 1.3 Tg N per year from forests, which were extrapolated from field measurements by using an artificial neural network approach. The N2O emissions estimated by Zhuang et al. [7] were much lower than those estimated in this study, and this amount was equivalent to approximately one-thirds of the estimated value in this study.

4.2. Distal Biotic Drivers of Soil N2O Flux

According to the results, remarkable differences were only found between broadleaved and coniferous forests, that is, the leaf trait made it easier to distinguish the magnitude of N2O fluxes than the leaf habit. On the one hand, coniferous species differ from broadleaf species in many functional traits, such as the leaf structure, photosynthetic capacity, hydraulic network, tissue composition and litter chemistry. These differences might affect ecosystem functioning (e.g., litter decomposition, followed by the accumulation of organic carbon in soil) [22,23]. Leaf trait has been proved to be positively associated with nitrification potential, suggesting that high-quality litter (plant tissue N) inputs could increase soil nitrate and rates of nitrification [24]. High-quality litter can stimulate more recalcitrant litter decomposition. Conversely, a mixture of low-quality litter can slow down the litter decomposition [25,26,27]. Therefore, litter decomposition rates of plants with a high specific leaf area (SLA) and high leaf N content [28] tend to be faster, in addition to higher rates of mineralization, and nitrification; that is, coniferous litter has a slower litter composition rate than broadleaved tree litter [29,30,31], which might result in a relatively low level of soil nutrient (e.g., NO3 concentration, Table S3), and thus, low N2O fluxes in coniferous forests. On the other hand, the differences in the magnitude of N2O fluxes between broadleaved and coniferous forests might also be due to the significant differences in temperature between the living environment of the broadleaved and coniferous forests (Table S3). Similar results were found in a laboratory experiment, for example, Cheng et al. [32] carried out a short-term laboratory experiment on subtropical soils in China. Their study showed that the temporal pattern of N2O emissions was significantly different for both broadleaved and coniferous forest soils, which, due to the effects of temperature on soil N2O emission rates, varied between broadleaved and coniferous forest soils. Moreover, different turnover rates of organic material due to differences in C/N ratios of litter, species-specific differences in the composition of soil microbial populations due to differences in litter quality, and root exudation, represent other possible reasons for the significant differences in the magnitude of N2O fluxes [33,34].
Based on the comparison of seasonal patterns of N2O flux, the leaf habit was an important characteristic, reflecting different patterns of N2O seasonal variations. Deciduous and evergreen species have evolved different leaf phenologies, which change the temporal pattern of nutrient demands for leaf growth. Previous studies reported that there are seasonal differences between evergreen and deciduous trees in terms of nitrogen use, water use, and photosynthesis. For example, a study by Ellsworth and Sternberg [35] reported that deciduous trees would keep low N uptake rates during the whole seasons, while evergreen species maintained a high nutrient uptake activity, even when water availability was relatively low in the dry season [35]. Therefore, the differences in timing and the efficiency of N uptake and water use strategies between evergreen and deciduous trees would probably result in the differences in edaphic environment for N2O production, thus, leading to different seasonal patterns of N2O fluxes.
These findings underscore the urgent need to consider the impacts of leaf habits or leaf traits when predicting N2O fluxes, and has important implications for the ability of earth system models to accurately simulate N2O fluxes, since most of such models rely mainly on parameterization of plant functional types, defined by leaf habit and leaf traits.

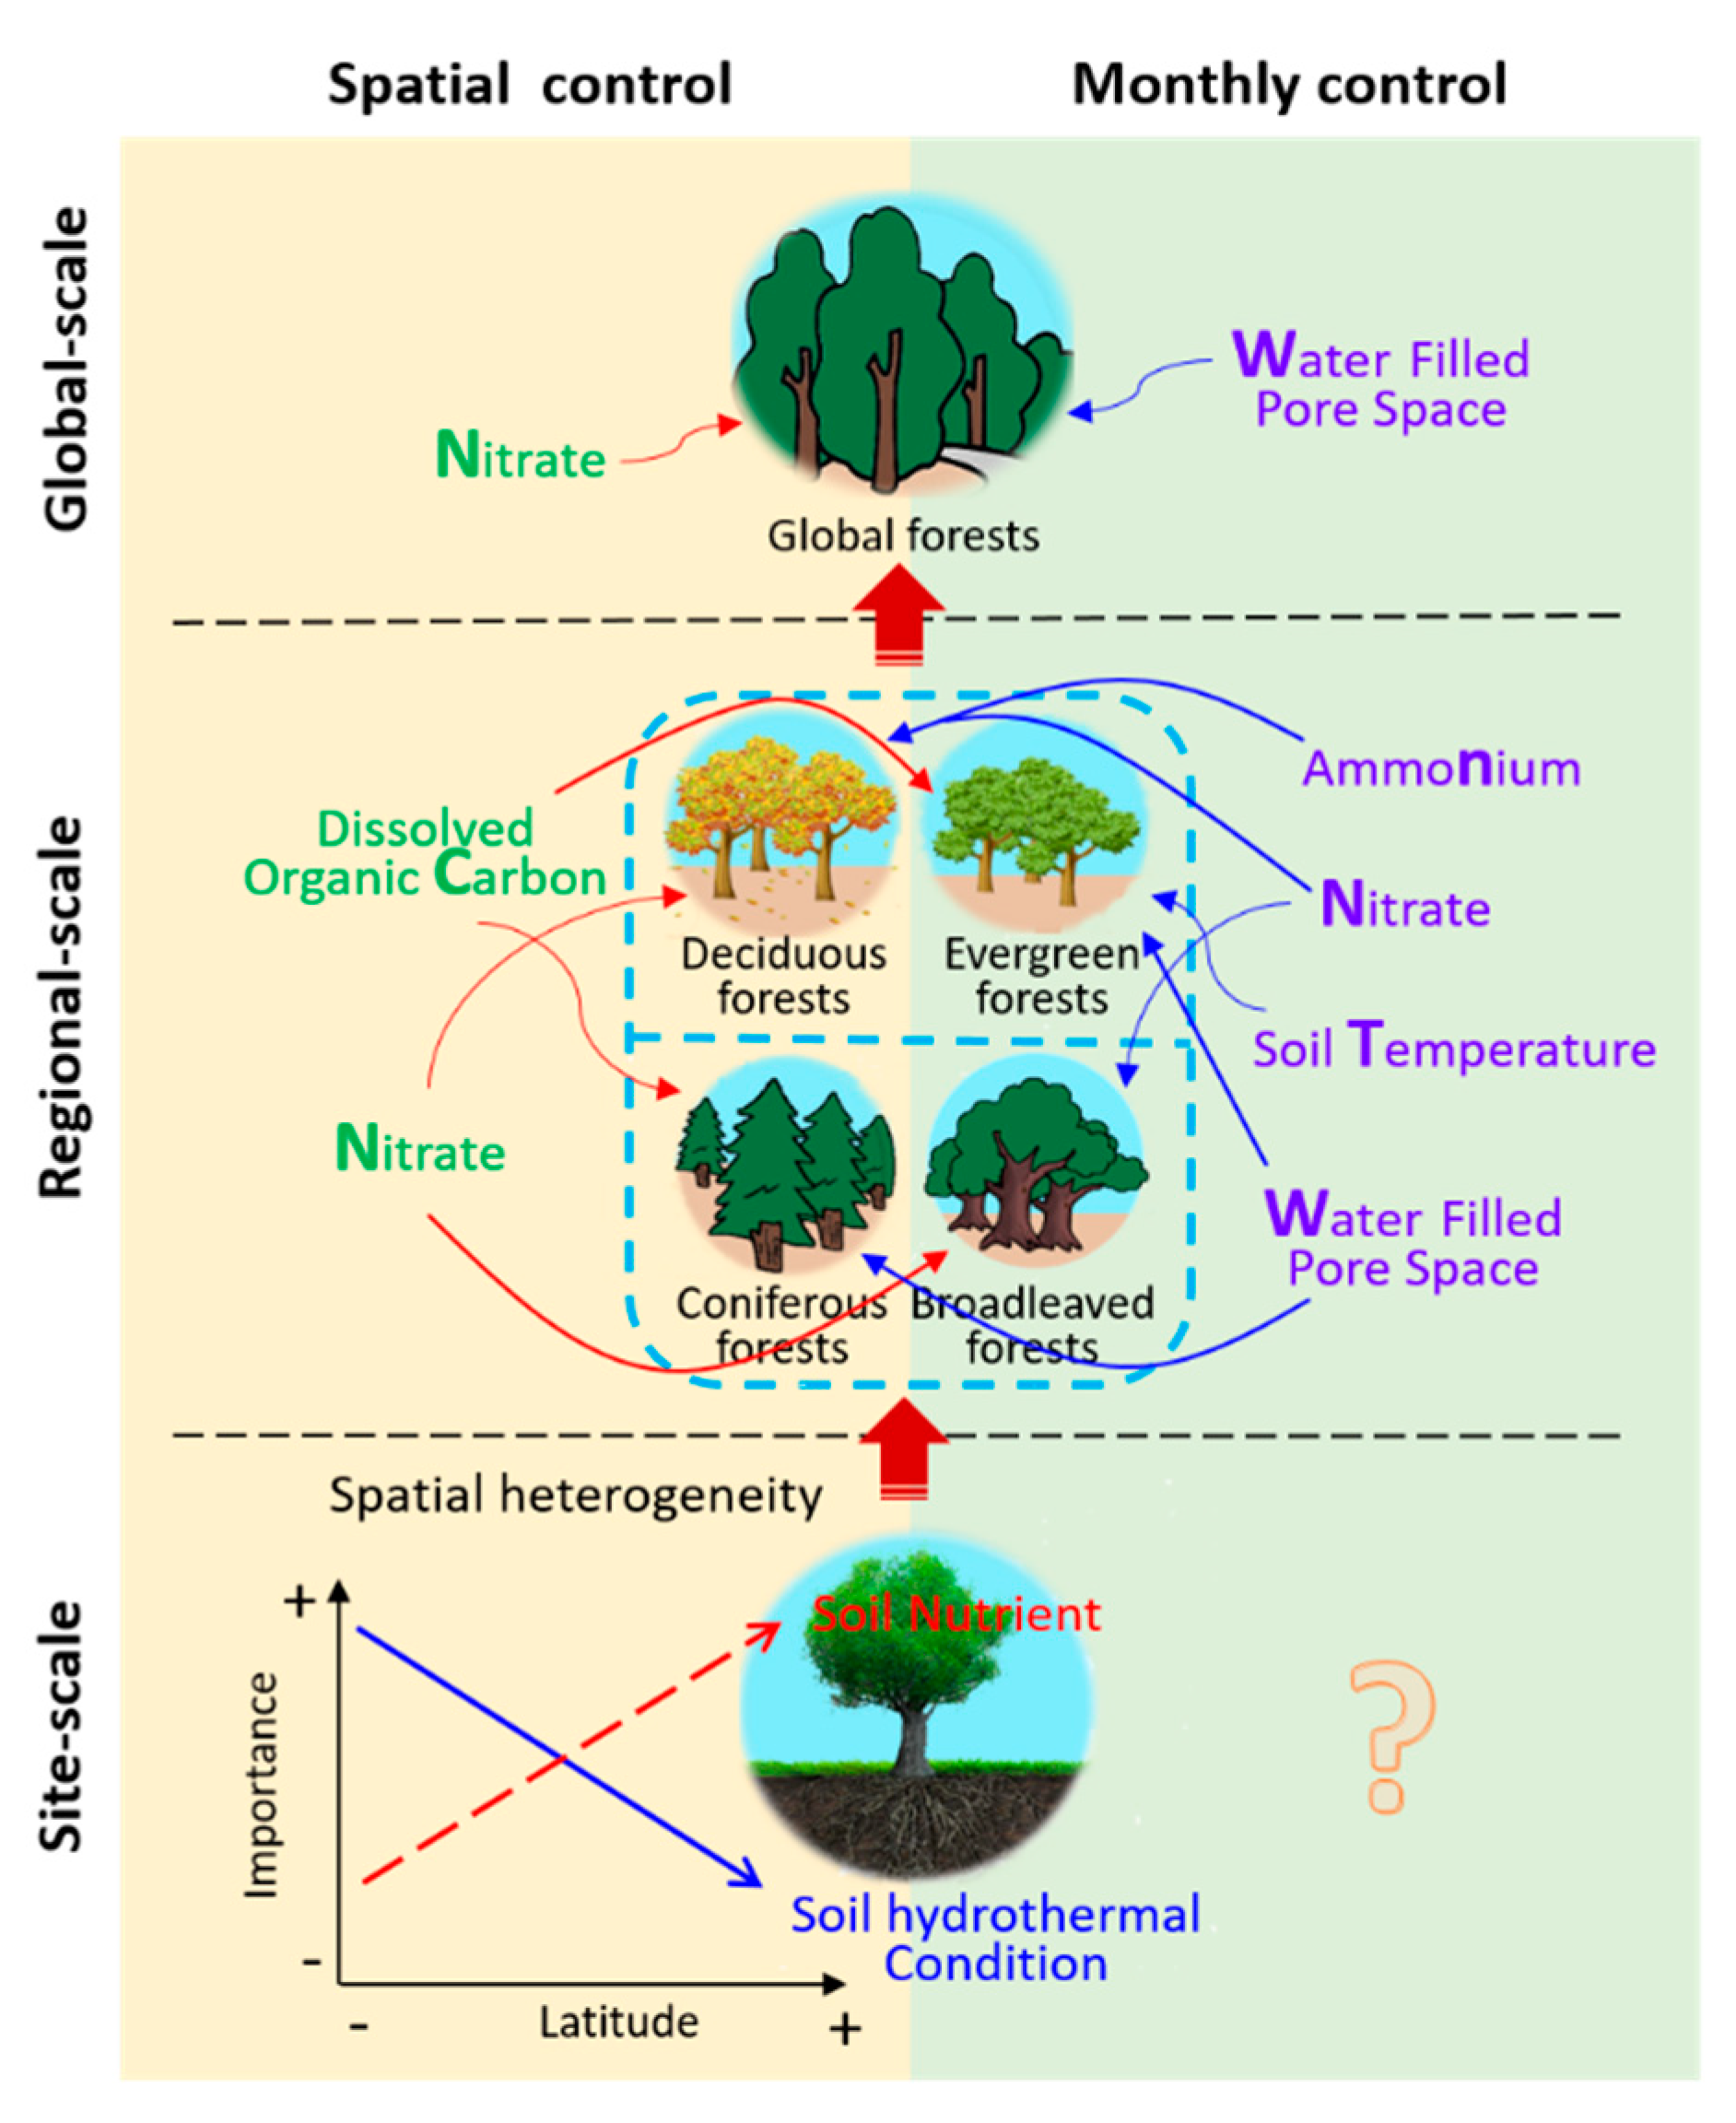
4.3. Comparison among Edaphic Factors Involved in Controlling N2O Fluxes on Different Scales

4.3.1. The Explanatory Power of Five Edaphic Factors for N2O Flux Varied among the Different Scales

With an increasing scale (from the site scale to the regional scale to the global scale), the explanatory power of the five edaphic factors to N2O flux decreased gradually. The type of factors that could explain the spatial variation of N2O flux differed among different scales. For example, studies under global or regional scale showed that the interaction of climatic, biotic, and edaphic factors accounted for significant portions of the variations in a variable [36,37,38]. Based on this, we speculated that such a phenomenon might be caused by the comprehensive and complicated influence of climatic or biotic factors on N2O flux, in a larger scale, which would potentially obscure the true role of edaphic effects. That is, the edaphic factors present a higher correlation to N2O flux in a site scale, which can be attributed to consistent external biological and climatic factors, resulting in more prominent influence of edaphic factors. For example, Pilegaard et al. [12] mentioned that rather clear relationships between N2O emission and soil moisture and soil temperature can be found within a single locality when studying short-term variations, whereas using the same parameters when comparing annual values from different localities within a large region as in this study, does not necessarily reveal comparable relationships, since other factors such as soil properties, stand age, and site hydrological conditions interfere.

4.3.2. Key Spatial Controls Vary at Different Scales

According to the results, soil hydrothermal condition (WFPS and soil temperature) might not be the main spatial regulation for N2O fluxes, whereas soil nutrient factors (particularly NO3 concentration) could contribute more N2O flux spatial variations in both global and regional scale (Figure 9). WFPS is of great importance for the occurrence of anaerobic conditions, which could represent the O2 supply and thereby control whether aerobic processes, such as nitrification, or anaerobic processes, such as denitrification, dominate within the soil. In addition, the soil temperature could influence the activity of micro-organisms [39,40], the rates of enzymatic processes [41], the oxygen consumption by micro-organisms, roots, and mycorrhizae, and thereby, reduce the oxygen concentration in the soil under hypoxic conditions [42]. Thus, some studies believe that the two factors soil moisture and soil temperature often explain most of the N2O flux regional variation constituting the main drivers of nitrification and denitrification [11,12]. However, the meta-analysis of Pärn et al. [43] was proved that soil NO3 was the strongest predictor of N2O flux at a global scale, explaining 60% of the variation in N2O flux. Similarly, Veber et al. [44] showed that emissions of N2O were most affected by environmental conditions related to soil NO3 concentration (43.4%), as because NO3 concentration favors denitrification, potentially favoring N2O production [45].
There are high spatial heterogeneities of main N2O controls, in site scale. Forests with different tree species and biome regions differ substantially in edaphic character and patterns of nutrient cycling [46,47]. The results of site-control analysis demonstrated that N2O fluxes from low latitude forests are more likely associated with soil WFPS and temperature. We speculated that when plants grow for long periods of time under certain constraints, long-term natural selection might allow them to adapt to such constraints [48], so that within a certain range they might be insensitive to changes in such constraints. On the contrary, once the "good" state created by unrestricted factors was broken, it might cause even greater changes.

4.3.3. The Trend of Spatial Controls Response to N2O Fluxes Vary at Different Scales

N2O fluxes from forests at regional and global scales showed linear increase of WFPS, whereas at the site scale, it showed a quadratic correlation between WFPS and N2O fluxes from the majority of forest sites. Many laboratory studies have also proved that nitrification was in favor of a high O2 concentration and intermediate WFPS level (~30%–70%), while denitrification is prone to producing nitrous oxide under the condition of a low O2 concentration and high WFPS level (~55%–100%) [9,49,50,51]. Nitrification and denitrification both have an optimum moisture range, which might lead to a threshold WFPS for N2O production. In addition, moisture also affected microbial activity, transcription, and composition; as soils became wetter, the diversity and evenness increased significantly between 60% and 80% WFPS, but decreased significantly at 100% [52]. Therefore, microbial activity fluctuation would be another reason for the decrease in N2O fluxes when WFPS reached a high level. Such quadratic response of N2O fluxes under high WFPS level would be more visible when the scale becomes finer. Furthermore, we found soil temperature was linear correlated to N2O fluxes at both global and regional scales and was more likely quadratically correlated to N2O fluxes at the site scale. Whereas, some laboratory experiment generally report the exponential correlation between soil temperature and N2O fluxes, which could derive the temperature sensitivity coefficients (Q10) for N2O fluxes [53]. Such exponential correlation might be associated with anaerobic soil volume usually increasing exponentially with soil temperature [54].
The response curve of N2O flux to soil nutrient factors was diversified, which mainly showed that N2O flux increased with the increase of nutrient level when the nutrient level was relatively low; however, when the nutrient level was high, the N2O flux tended to gradually increase or decrease or remained almost constant. There was much evidence for a positive relationship between C-substrate and mineral nitrogen compounds (NH4+ and NO3) and N2O emission reported in experimental studies [55,56,57]. This suggest that DOC, NH4+, and NO3 were the primary drivers for the increasing of N2O emission rates, which might be due to the lack of organic carbon/mineral nitrogen compound availability for use by microorganisms, thus, limiting denitrification and nitrification, which has been reported in response to DOC amendments [58,59,60,61] and nitrogen addition (e.g., fertilization or deposition) experiments [62,63]. However, N2O fluxes got deceleration/acceleration/constant with DOC, NH4+, or NO3 concentration increase to a high value. The reasoning of such phenomenon between the DOC concentration or NO3 concentration and N2O fluxes might be the carbon–nitrogen coupling effect on N2O fluxes. For example, the effect of C availability substrates on N2O fluxes was reported to be determined by the NO3 concentration level in the soil [45,61]. Experiments by Senbayram et al. [61] showed that only an increase in soil organic matter at low nitrogen levels might reduce the ratio of N2O to N2+N2O. However, when the treatment was ≥10 mM NO3, the available C content did not much affect the product ratio of N2O to N2+N2O of denitrification [61], and it also reported that a high concentration of soil NO3 concentration led to a decrease in the denitrification rate. Therefore, sufficient C availability and NO3 concentration might both promote the completion of the denitrification process, enhance N2 release, and limit N2O production [45,64].
In addition to regional scales, the reasoning of differences in the sensitivity of N2O emissions to NO3 concentration among biotic forest groups might be related to the different contribution of nitrification and denitrification. For example, the research of Cheng et al. [32] suggested that there is an approximately equal contribution of nitrification and denitrification to N2O emissions in broadleaved forest soil, while denitrification is the dominant process for N2O emissions competing with nitrification in coniferous forests.

4.3.4. Monthly Controls Vary at Different Scales

The main control factors of N2O flux in different months were also different, especially in evergreen forest and deciduous forest. For evergreen forest, soil WFPS and temperature were the main control factors of N2O flux for most months, while for deciduous forest, the content of mineral nitrogen was the main control factors. This might have resulted from the differences in soil nutrient turnover rate of forests with different leaf habits. Generally, the rate of nutrient turnover in evergreen forest was generally much slower than that in deciduous forest, as this fraction determines the turnover rate and is the reciprocal of mean leaf lifespan in years, i.e., the longer the leaves stay, the smaller the turnover rate [65,66]. Therefore, deciduous forests with fast soil nutrient turnover rate could be more sensitive to the variation of nutrients, whereas, N2O flux from evergreen forests might be more sensitive to the elevation of soil temperature and moisture, resulting in the acceleration of the nutrient turnover rate [67].

5. Perspectives

This study not only examined the magnitude of N2O fluxes, but also identified the main edaphic factors regulating N2O fluxes across global forests, at different scales, which would increase the awareness of N2O variation for forests. However, due to limitations of the data, there are some aspects that need deep consideration for future studies. First, it has been reported that phosphorus (P) addition would increase the N2O emissions, since soil microbial activities are also limited by P, thus, influencing the nitrification and denitrification in the soil [68]. Therefore, future studies should focus on the mechanism behind soil P variability and the effect on N2O production. Secondly, compared with leaf traits and leaf habits, other characteristics, such as tree age, stand structure (e.g., understory), and species composition, would also be important biotic factors to examine when discussing the N2O flux controllers. For example, Qin et al. [69] reported that tree species have a greater effect on N2O fluxes than seasonal changes by changing the community composition and environmental factors rather than the abundance of nitrifiers/denitrifiers. Finally, the control factors between different months at the site scale were not well analyzed due to the lack of data in this study, therefore, it is also important and necessary to conduct further research.

Supplementary Materials

The following are available online at https://0-www-mdpi-com.brum.beds.ac.uk/1999-4907/11/3/251/s1, Supplementary data: The whole data and basic information of selected sites (available at https://0-doi-org.brum.beds.ac.uk/10.5281/zenodo.3678393), Table S1: The mean annual nitrous oxide (N2O) fluxes, the number of samples (N), area, and total N2O emission of different leaf habit, leaf trait and total global forests, Table S2: The coefficient of determination (R2) of relationships between N2O fluxes and edaphic factors (soil temperature (ST), WFPS, NH4 (NH4+ concentration), NO3 (NO3- concentration), and DOC (DOC concentration)) for each forest site, Table S3: The clay fraction (Clay), sand fraction (Sand), mean annual temperature (MAT), mean annual precipitation (MAP), pH, dissolved organic carbon content (DOC, %), water filled pore space (WFPS), soil temperature (ST, °C, ammonium concentration (NH4+, mg/kg), and nitrate concentration (NO3-, mg/kg ) for different classification groups (mean ± standard deviation (count)).

Author Contributions

Conceptualization, K.Z. and M.L.; data curation and writing—original draft preparation, K.Z.; methodology, Z.Y., J.W., and X.Z.; formal analysis and visualization, H.W., L.Y., and Y.L.; writing—review and editing, X.K. All authors have read and agreed to the published version of the manuscript.

Funding

This research was funded by the National Nonprofit Institute Research Grant, grant number (CAFYBB2019SY038) and (CAFYBB2017QB009), by the National Key Research and Development Program of China, grand number (2016YFC0501804), and by the National Natural Science Foundation of China, grand number (41701113), (41877421) and (31770511).

Acknowledgments

This paper was supported by the National Nonprofit Institute Research Grant (No. CAFYBB2019SY038, CAFYBB2017QB009), the National Key Research and Development Program of China (No. 2016YFC0501804), and the National Natural Science Foundation of China (No. 41701113, 41877421, 31770511).

Conflicts of Interest

The authors declare no conflict of interest.

References

  1. Knohl, A.; Veldkamp, E. Indirect feedbacks to rising CO2. Nature 2011, 475, 177. [Google Scholar] [CrossRef]
  2. Ravishankara, A.R.; Daniel, J.S.; Portmann, R.W. Nitrous Oxide (N2O): The Dominant Ozone-Depleting Substance Emitted in the 21st Century. Science 2009, 326, 123–125. [Google Scholar] [CrossRef] [PubMed] [Green Version]
  3. Ciais, P.; Chris, S.; Govindasamy, B.; Bopp, L.; Brovkin, V.; Canadell, J.; Chhabra, A.; Defries, R.; Galloway, J.; Heimann, M. Carbon and Other Biogeochemical Cycles. In Climate Change 2013: The Physical Science Basis. Contribution of Working Group I to the Fifth Assessment Report of the Intergovernmental Panel on Climate Change; Stocker, T.F., Qin, D., et al., Eds.; Cambridge University Press: Cambridge, UK ; New York, NY, USA, 2013; pp. 465–570. [Google Scholar]
  4. Tian, H.; Lu, C.; Ciais, P.; Michalak, A.M.; Canadell, J.G.; Saikawa, E.; Huntzinger, D.N.; Gurney, K.R.; Sitch, S.; Zhang, B.; et al. The terrestrial biosphere as a net source of greenhouse gases to the atmosphere. Nature 2016, 531, 225. [Google Scholar] [CrossRef] [PubMed] [Green Version]
  5. Prentice, I.C. Terrestrial nitrogen cycle simulation with a dynamic global vegetation model. Glob. Chang. Biol. 2008, 14, 1745–1764. [Google Scholar] [CrossRef]
  6. Zhang, K.; Zhu, Q.; Liu, J.; Wang, M.; Zhou, X.; Li, M.; Wang, K.; Ding, J.; Peng, C. Spatial and temporal variations of N2O emissions from global forest and grassland ecosystems. Agric. For. Meteorol. 2019, 266–267, 129–139. [Google Scholar] [CrossRef]
  7. Zhuang, Q.; Lu, Y.; Chen, M. An inventory of global N2O emissions from the soils of natural terrestrial ecosystems. Atmos. Environ. 2012, 47, 66–75. [Google Scholar] [CrossRef]
  8. Baggs, E.M. Soil microbial sources of nitrous oxide: Recent advances in knowledge, emerging challenges and future direction. Curr. Opin. Environ. Sustain. 2011, 3, 321–327. [Google Scholar] [CrossRef]
  9. Machefert, S.E.; Dise, N.B.; Goulding, K.W.T.; Whitehead, P.G. Nitrous oxide emission from a range of land uses across Europe. Hydrol. Earth Syst. Sci. Discuss. 2002, 6, 325–338. [Google Scholar] [CrossRef] [Green Version]
  10. Zerva, A.; Mencuccini, M. Short-term effects of clearfelling on soil CO2, CH4, and N2O fluxes in a Sitka spruce plantation. Soil Biol. Biochem. 2005, 37, 2025–2036. [Google Scholar] [CrossRef]
  11. Butterbach-Bahl, K.; Baggs, E.M.; Dannenmann, M.; Kiese, R.; Zechmeister-Boltenstern, S. Nitrous oxide emissions from soils: How well do we understand the processes and their controls? Philos. Trans. R. Soc. B Biol. Sci. 2013, 368, 20130122. [Google Scholar] [CrossRef]
  12. Pilegaard, K.; Skiba, U.; Ambus, P.; Beier, C.; Pihlatie, M.; Vesala, T. Factors controlling regional differences in forest soil emission of nitrogen oxides (NO and N2O). Biogeosciences 2006, 3, 651–661. [Google Scholar] [CrossRef] [Green Version]
  13. Huang, D.; Allen, G.; Dekate, C.; Kaiser, H.; Lei, Z.; Maclaren, J. getdata: A Grid Enabled Data Client for Coastal Modeling. Simul. Ser. 2006, 38, 187. [Google Scholar]
  14. He, Z.; Huo, S.; Ma, C.; Zhang, H.; An, D.; Xi, B.; Xu, Q.; Xia, X.; Wu, F. The Contributions of Climate Changes and Human Activities to Long-Term Variations in Lake Sediments Based on Results from Generalized Additive Models. Water Resour. Manag. 2019, 33, 1069–1085. [Google Scholar] [CrossRef]
  15. R Development Core Team. R: A Language and Environment for Statistical Computing; R Foundation for Statistical Computing: Vienna, Austria, 2012; Available online: http://www.Rproject.org/bin/windows/base/old/2.2.1/ (accessed on 20 December 2010).
  16. Li, W.; Ciais, P.; MacBean, N.; Peng, S.; Defourny, P.; Bontemps, S. Major forest changes and land cover transitions based on plant functional types derived from the ESA CCI Land Cover product. Int. J. Appl. Earth Obs. Geoinf. 2016, 47, 30–39. [Google Scholar] [CrossRef]
  17. Raich, J.W.; Potter, C.S.; Bhagawati, D. Interannual variability in global soil respiration, 1980–1994. Glob. Chang. Biol. 2002, 8, 800–812. [Google Scholar] [CrossRef]
  18. Xu, X.; Tian, H.; Hui, D. Convergence in the relationship of CO2 and N2O exchanges between soil and atmosphere within terrestrial ecosystems. Glob. Chang. Biol. 2008, 14, 1651–1660. [Google Scholar] [CrossRef]
  19. Tian, H.; Chen, G.; Lu, C.; Xu, X.; Ren, W.; Banger, K.; Zhang, B.; Tao, B.; Pan, S.; Liu, M. Global land-atmosphere exchange of methane and nitrous oxide: Magnitude and spatiotemporal patterns. Biogeosci. Discuss. 2013, 10, 19811–19865. [Google Scholar] [CrossRef] [Green Version]
  20. Tian, H.; Xu, X.; Liu, M.; Ren, W.; Zhang, C.; Chen, G.; Lu, C. Spatial and temporal patterns of CH4 and N2O fluxes in terrestrial ecosystems of North America during 1979–2008: Application of a global biogeochemistry model. Biogeosciences 2010, 7, 2673–2694. [Google Scholar] [CrossRef] [Green Version]
  21. Zhang, K.; Peng, C.; Wang, M.; Zhou, X.; Li, M.; Wang, K.; Ding, J.; Zhu, Q. Process-based TRIPLEX-GHG model for simulating N2O emissions from global forests and grasslands: M odel development and evaluation. J. Adv. Modeling Earth Syst. 2017, 9, 2079–2102. [Google Scholar] [CrossRef]
  22. Augusto, L.; De Schrijver, A.; Vesterdal, L.; Smolander, A.; Prescott, C.; Ranger, J. Influences of evergreen gymnosperm and deciduous angiosperm tree species on the functioning of temperate and boreal forests. Biol. Rev. 2015, 90, 444–466. [Google Scholar] [CrossRef]
  23. Binkley, D.; Giardina, C. Why do tree species affect soils? The Warp and Woof of tree-soil interactions. In Plant-Induced Soil Changes: Processes and Feedbacks; Van Breemen, N., Ed.; Springer: Dordrecht, The Netherlands, 1998; pp. 89–106. [Google Scholar] [CrossRef]
  24. Orwin, K.H.; Buckland, S.M.; Johnson, D.; Turner, B.L.; Smart, S.; Oakley, S.; Bardgett, R.D. Linkages of plant traits to soil properties and the functioning of temperate grassland. J. Ecol. 2010, 98, 1074–1083. [Google Scholar] [CrossRef] [Green Version]
  25. Fyles, J.W.; Fyles, I.H. Interaction of Douglas-fir with red alder and salal foliage litter during decomposition. Can. J. For. Res. 1993, 23, 358–361. [Google Scholar] [CrossRef]
  26. McTiernan, K.B.; Ineson, P.; Coward, P.A. Respiration and Nutrient Release from Tree Leaf Litter Mixtures. Oikos 1997, 78, 527–538. [Google Scholar] [CrossRef]
  27. Salamanca, E.F.; Kaneko, N.; Katagiri, S. Effects of leaf litter mixtures on the decomposition of Quercus serrata and Pinus densiflora using field and laboratory microcosm methods. Ecol. Eng. 1998, 10, 53–73. [Google Scholar] [CrossRef]
  28. Laughlin, D.C.; Leppert, J.J.; Moore, M.M.; Sieg, C.H. A multi-trait test of the leaf-height-seed plant strategy scheme with 133 species from a pine forest flora. Funct. Ecol. 2010, 24, 493–501. [Google Scholar] [CrossRef]
  29. Cornwell, W.K.; Cornelissen, J.H.C.; Amatangelo, K.; Dorrepaal, E.; Eviner, V.T.; Godoy, O.; Hobbie, S.E.; Hoorens, B.; Kurokawa, H.; Pérez-Harguindeguy, N.; et al. Plant species traits are the predominant control on litter decomposition rates within biomes worldwide. Ecol. Lett. 2008, 11, 1065–1071. [Google Scholar] [CrossRef]
  30. Quested, H.; Eriksson, O.; Fortunel, C.; Garnier, E. Plant traits relate to whole-community litter quality and decomposition following land use change. Funct. Ecol. 2007, 21, 1016–1026. [Google Scholar] [CrossRef]
  31. Zhang, W.; Yang, K.; Lyu, Z.; Zhu, J. Microbial groups and their functions control the decomposition of coniferous litter: A comparison with broadleaved tree litters. Soil Biol. Biochem. 2019, 133, 196–207. [Google Scholar] [CrossRef]
  32. Cheng, Y.; Wang, J.; Wang, S.; Cai, Z.; Wang, L. Effects of temperature change and tree species composition on N2O and NO emissions in acidic forest soils of subtropical China. J. Environ. Sci. 2014, 26, 617–625. [Google Scholar] [CrossRef]
  33. Rivallan, M.; Ricchiardi, G.; Bordiga, S.; Zecchina, A. Adsorption and reactivity of nitrogen oxides (NO2, NO, N2O) on Fe–zeolites. J. Catal. 2009, 264, 104–116. [Google Scholar] [CrossRef]
  34. Wang, S.; Ruan, H.; Han, Y. Effects of microclimate, litter type, and mesh size on leaf litter decomposition along an elevation gradient in the Wuyi Mountains, China. Ecol. Res. 2010, 25, 1113–1120. [Google Scholar] [CrossRef]
  35. Ellsworth, P.V.; Sternberg, L.S.L. Biochemical effects of salinity on oxygen isotope fractionation during cellulose synthesis. New Phytol. 2014, 202, 784–789. [Google Scholar] [CrossRef] [PubMed]
  36. Ge, J.; Berg, B.; Xie, Z. Leaf habit of tree species does not strongly predict leaf litter decomposition but alters climate-decomposition relationships. Plant Soil 2017, 419, 363–376. [Google Scholar] [CrossRef]
  37. Han, W.X.; Fang, J.Y.; Reich, P.B.; Ian Woodward, F.; Wang, Z.H. Biogeography and variability of eleven mineral elements in plant leaves across gradients of climate, soil and plant functional type in China. Ecol. Lett. 2011, 14, 788–796. [Google Scholar] [CrossRef]
  38. Li, Y.; Wu, H.; Wang, J.; Cui, L.; Tian, D.; Wang, J.; Zhang, X.; Yan, L.; Yan, Z.; Zhang, K. Plant biomass and soil organic carbon are main factors influencing dry-season ecosystem carbon rates in the coastal zone of the Yellow River Delta. PLoS ONE 2019, 14, e0210768. [Google Scholar] [CrossRef]
  39. Szukics, U.; Abell, G.C.J.; Hödl, V.; Mitter, B.; Sessitsch, A.; Hackl, E.; Zechmeister-Boltenstern, S. Nitrifiers and denitrifiers respond rapidly to changed moisture and increasing temperature in a pristine forest soil. FEMS Microbiol. Ecol. 2010, 72, 395–406. [Google Scholar] [CrossRef]
  40. Xue, K.; Yuan, M.M.; Shi, Z.J.; Qin, Y.; Deng, Y.; Cheng, L.; Wu, L.; He, Z.; Van Nostrand, J.D.; Bracho, R.; et al. Tundra soil carbon is vulnerable to rapid microbial decomposition under climate warming. Nat. Clim. Chang. 2016, 6, 595–600. [Google Scholar] [CrossRef] [Green Version]
  41. Taylor, A.E.; Myrold, D.D.; Bottomley, P.J. Temperature affects the kinetics of nitrite oxidation and nitrification coupling in four agricultural soils. Soil Biol. Biochem. 2019, 136, 107523. [Google Scholar] [CrossRef]
  42. Saggar, S.; Jha, N.; Deslippe, J.; Bolan, N.S.; Luo, J.; Giltrap, D.L.; Kim, D.G.; Zaman, M.; Tillman, R.W. Denitrification and N2O:N2 production in temperate grasslands: Processes, measurements, modelling and mitigating negative impacts. Sci. Total Environ. 2013, 465, 173–195. [Google Scholar] [CrossRef]
  43. Pärn, J.; Verhoeven, J.T.A.; Butterbach-Bahl, K.; Dise, N.B.; Ullah, S.; Aasa, A.; Egorov, S.; Espenberg, M.; Järveoja, J.; Jauhiainen, J.; et al. Nitrogen-rich organic soils under warm well-drained conditions are global nitrous oxide emission hotspots. Nat. Commun. 2018, 9, 1135. [Google Scholar] [CrossRef] [Green Version]
  44. Veber, G.; Kull, A.; Villa, J.A.; Maddison, M.; Paal, J.; Oja, T.; Iturraspe, R.; Pärn, J.; Teemusk, A.; Mander, Ü. Greenhouse gas emissions in natural and managed peatlands of America: Case studies along a latitudinal gradient. Ecol. Eng. 2018, 114, 34–45. [Google Scholar] [CrossRef]
  45. Firestone, M.K.; Davidson, E.A. Microbiological basis of NO and N2O production and consumption in soil. Exch. Trace Gases Terr. Ecosyst. Atmos. 1989, 47, 7–21. [Google Scholar]
  46. Lovett, G.M.; Weathers, K.C.; Arthur, M.A.; Schultz, J.C. Nitrogen cycling in a northern hardwood forest: Do species matter? Biogeochemistry 2004, 67, 289–308. [Google Scholar] [CrossRef]
  47. Näsholm, T.; Kielland, K.; Ganeteg, U. Uptake of organic nitrogen by plants. New Phytol. 2009, 182, 31–48. [Google Scholar] [CrossRef]
  48. Mukai, M.; Sawada, Y.; Kitayama, K.; Aiba, S.-I. Productivity and morphological traits of fine roots in forest ecosystems along an elevation gradient of Yakushima Island. J. For. Res. 2019, 24, 35–41. [Google Scholar] [CrossRef]
  49. Hu, H.; Chen, D.; He, J.-Z. Microbial Regulation of Terrestrial Nitrous Oxide Formation: Understanding the Biological Pathways for Prediction of Emission Rates. FEMS Microbiol. Rev. 2015, 39, 729–749. [Google Scholar] [CrossRef]
  50. Ruser, R.; Flessa, H.; Russow, R.; Schmidt, G.; Buegger, F.; Munch, J.C. Emission of N2O, N2 and CO2 from soil fertilized with nitrate: Effect of compaction, soil moisture and rewetting. Soil Biol. Biochem. 2006, 38, 263–274. [Google Scholar] [CrossRef]
  51. Wrage, N.; Velthof, G.L.; Laanbroek, H.J.; Oenema, O. Nitrous oxide production in grassland soils: Assessing the contribution of nitrifier denitrification. Soil Biol. Biochem. 2004, 36, 229–236. [Google Scholar] [CrossRef]
  52. Banerjee, S.; Helgason, B.; Wang, L.; Winsley, T.; Ferrari, B.C.; Siciliano, S.D. Legacy effects of soil moisture on microbial community structure and N2O emissions. Soil Biol. Biochem. 2016, 95, 40–50. [Google Scholar] [CrossRef]
  53. Phillips, R.; McMillan, A.; Palmada, T.; Dando, J.; Giltrap, D. Temperature effects on N2O and N2 denitrification end-products for a New Zealand pasture soil. N. Z. J. Agric. Res. 2015, 58, 89–95. [Google Scholar] [CrossRef]
  54. Brumme, R.; Borken, W. N2O Emission from Temperate Beech Forest Soils. In Functioning and Management of European Beech Ecosystems; Brumme, R., Khanna, P.K., Eds.; Springer: Berlin/Heidelberg, Germany, 2009; pp. 353–367. [Google Scholar] [CrossRef]
  55. Keller, M.; Kaplan, W.A.; Wofsy, S.C.; Da Costa, J.M. Emissions of N2O from tropical forest soils: Response to fertilization with NH4+, NO3, and PO43−. J. Geophys. Res. Atmos. 1988, 93, 1600–1604. [Google Scholar] [CrossRef]
  56. Li, C.; Frolking, S.; Butterbach-Bahl, K. Carbon Sequestration in Arable Soils is Likely to Increase Nitrous Oxide Emissions, Offsetting Reductions in Climate Radiative Forcing. Clim. Chang. 2005, 72, 321–338. [Google Scholar] [CrossRef]
  57. Robertson, K.; Klemedtsson, L. Assessment of denitrification in organogenic forest soil by regulating factors. Plant Soil 1996, 178, 49–57. [Google Scholar] [CrossRef]
  58. Chen, S.; Wang, F.; Zhang, Y.; Qin, S.; Wei, S.; Wang, S.; Hu, C.; Liu, B. Organic carbon availability limiting microbial denitrification in the deep vadose zone. Environ. Microbiol. 2018, 20, 980–992. [Google Scholar] [CrossRef] [Green Version]
  59. McCarty, G.W.; Bremner, J.M. Availability of organic carbon for denitrification of nitrate in subsoils. Biol. Fertil. Soils 1992, 14, 219–222. [Google Scholar] [CrossRef]
  60. Peterson, M.E.; Curtin, D.; Thomas, S.; Clough, T.J.; Meenken, E.D. Denitrification in vadose zone material amended with dissolved organic matter from topsoil and subsoil. Soil Biol. Biochem. 2013, 61, 96–104. [Google Scholar] [CrossRef]
  61. Senbayram, M.; Chen, R.; Budai, A.; Bakken, L.; Dittert, K. N2O emission and the N2O/(N2O+N2) product ratio of denitrification as controlled by available carbon substrates and nitrate concentrations. Agric. Ecosyst. Environ. 2012, 147, 4–12. [Google Scholar] [CrossRef]
  62. Peng, Y.; Wang, G.; Li, F.; Zhou, G.; Yang, G.; Fang, K.; Liu, L.; Qin, S.; Zhang, D.; Yang, Y. Soil Temperature Dynamics Modulate N2O Flux Response to Multiple Nitrogen Additions in an Alpine Steppe. J. Geophys. Res. Biogeosci. 2018, 123, 3308–3319. [Google Scholar] [CrossRef]
  63. Davidson, E.; Keller, M.; Erickson, H.; Verchot, L.; Veldkamp, E. Testing a Conceptual Model of Soil Emissions of Nitrous and Nitric Oxides. Biosciences 2000, 50, 667–680. [Google Scholar] [CrossRef]
  64. Reddy, N.; Crohn, D.M. Effects of soil salinity and carbon availability from organic amendments on nitrous oxide emissions. Geoderma 2014, 235–236, 363–371. [Google Scholar] [CrossRef]
  65. Wang, R.; Chen, J.M.; Luo, X.; Black, A.; Arain, A. Seasonality of leaf area index and photosynthetic capacity for better estimation of carbon and water fluxes in evergreen conifer forests. Agric. For. Meteorol. 2019, 279, 107708. [Google Scholar] [CrossRef]
  66. Rapp, M.; Santa Regina, I.; Rico, M.; Gallego, H.A. Biomass, nutrient content, litterfall and nutrient return to the soil in Mediterranean oak forests. For. Ecol. Manag. 1999, 119, 39–49. [Google Scholar] [CrossRef]
  67. Yuan, Z.Y.; Chen, H.Y.H. Fine Root Biomass, Production, Turnover Rates, and Nutrient Contents in Boreal Forest Ecosystems in Relation to Species, Climate, Fertility, and Stand Age: Literature Review and Meta-Analyses. Crit. Rev. Plant Sci. 2010, 29, 204–221. [Google Scholar] [CrossRef]
  68. Mori, T.; Lu, X.; Aoyagi, R.; Mo, J. Reconsidering the phosphorus limitation of soil microbial activity in tropical forests. Funct. Ecol. 2018, 32, 1145–1154. [Google Scholar] [CrossRef] [Green Version]
  69. Qin, H.; Xing, X.; Tang, Y.; Hou, H.; Yang, J.; Shen, R.; Zhang, W.; Liu, Y.; Wei, W. Linking soil N2O emissions with soil microbial community abundance and structure related to nitrogen cycle in two acid forest soils. Plant Soil 2019, 435, 95–109. [Google Scholar] [CrossRef]
Figure 1. Geographic locations and vegetation types of study sites. The figure in the top right corner shows the relative frequency histogram of nitrous oxide (N2O) fluxes. DBF—deciduous broadleaved forests; EBF—evergreen broadleaved forests; ECF—evergreen coniferous forests.
Forests 11 00251 g001
Figure 2. Comparisons of mean annual nitrous oxide (N2O) fluxes of different leaf habits (LH), leaf traits (LT), and total global forests. Black lines show the mean of the N2O fluxes. * Represents statistically significant differences (p < 0.05) among different groups.
Forests 11 00251 g002
Figure 3. Comparisons of mean monthly nitrous oxide (N2O) fluxes of (a) global forests, (b) leaf habits (LH), and (c) leaf traits (LT) for each month. * Represents statistically significant differences (p < 0.05) among different groups. The error bar represents the standard error (SE).
Forests 11 00251 g003
Figure 4. Comparison of coefficients of determination (R2) of relationships between the edaphic factors (DOC—DOC concentration, %; NO3—NO3 concentration, mg kg−1; NH4—NH4+ concentration, mg kg−1; WFPS—water filled pore space, %; and ST—soil temperature, °C) and N2O fluxes from coniferous, broadleaved, evergreen, deciduous, and global forest groups on different scales. * Represents significant relationship (p < 0.05).
Forests 11 00251 g004
Figure 5. Heat map of the coefficients of determination (R2) of linear regression (L), quadratic regression (Q), logarithmic regression (G) or exponential regression (E) between N2O fluxes and soil temperature (ST), WFPS, NH4 (NH4+ concentration), NO3 (NO3- concentration), and DOC (DOC concentration) for global forests of each month. * Represents the significant relationship; +L and –L represent the positive and negative linear correlations, respectively.
Forests 11 00251 g005
Figure 6. Heat map of the coefficients of determination (R2) of linear regression (L), quadratic regression (Q), logarithmic regression (G) or exponential regression (E) between N2O fluxes and soil temperature (ST), WFPS, NH4 (NH4+ concentration), NO3 (NO3- concentration), and DOC (DOC concentration) for (a) broadleaved forests, (b) coniferous forests, (c) deciduous forests, and (d) evergreen forests of each month. * Represents the significant relationship; +L and –L represent the positive and negative linear correlations, respectively.
Forests 11 00251 g006
Figure 7. (a) Biogeographic patterns of the coefficient of determination (R2) of linear regression (L), quadratic regression (Q), logarithmic regression (G) or exponential regression (E) between N2O fluxes and soil temperature and WFPS (R2_ST and R2_WFPS, respectively); (b) the relationship between R2_WFPS and latitude (Total: y = 0.46 − 0.006x, R2 = 0.27, p < 0.01, n = 33; DF: p > 0.05, n = 11; EF: y = 0.56 − 0.008x, R2 = 0.39, p < 0.01, n = 22; BF: y = 0.45 − 0.008x, R 2= 0.35, p < 0.01, N = 16; CF: p > 0.05, n = 17) for total forests or forest groups with different leaf habit or leaf traits; (c) the relationship between R2_ST and latitude (Total: p > 0.05, n = 52; DF: p > 0.05, n = 17; EF: y = 0.54 − 0.004x, R2 = 0.05, p < 0.01, n = 35; BF: y = 0.40 − 0.001x, R2 = 0.01, p < 0.01, n = 24; CF: p > 0.05, n = 28) for total forests or forest groups with different leaf habit or leaf traits. The gray bands represent 95% prediction intervals of the fitting line of all points.
Forests 11 00251 g007
Figure 8. The coefficients of determination (R2) of relationships between N2O fluxes and NH4+ concentration (blue, R2_NH4), NO3- concentration (red, R2_NO3), and DOC concentration (green, R2_DOC), along the latitude gradient. The blue, red, and green dashed line represent the linear regression between R2_NH4 (p > 0.05, n = 20), R2_NO3 (p > 0.05, n = 15), R2_DOC (p > 0.05, n = 5) and latitudes, respectively.
Forests 11 00251 g008
Figure 9. Comparison of key edaphic factors involved in controlling N2O fluxes on global, regional, and site scales.
Forests 11 00251 g009
Table 1. Comparison of total forest N2O budget with previous studies.
Estimated MethodPeriodGlobal Budget (Tg N)Reference
Empirical climate driven soil respiration model2000–20086.99[18]
Artificial neural network20001.3[7]
Process-based model (DLEM)1981–20104.28[19]
Process-based model (TRIPLEX-GHG)1992–20153.62[6]
Literature survey20004.45–4.69This study

