Leaf Photosynthetic Capacity of Sunlit and Shaded Mature Leaves in a Deciduous Forest


1
Graduate School of Science and Technology, Shizuoka University, Shizuoka 422-8529, Japan
2
Faculty of Agriculture, Shizuoka University, Shizuoka 422-8529, Japan
3
Research Institute of Green Science and Technology, Shizuoka University, Shizuoka 422-8529, Japan
*
Author to whom correspondence should be addressed.
Forests 2020, 11(3), 318; https://0-doi-org.brum.beds.ac.uk/10.3390/f11030318
Submission received: 10 February 2020
/
Revised: 12 March 2020
/
Accepted: 12 March 2020
/
Published: 13 March 2020
(This article belongs to the Section Forest Ecophysiology and Biology)
Abstract
:A clear understanding of the dynamics of photosynthetic capacity is crucial for accurate modeling of ecosystem carbon uptake. However, such dynamical information is hardly available and has dramatically impeded our understanding of carbon cycles. Although tremendous efforts have been made in coupling the dynamic information of photosynthetic capacity into models, using “proxies” rooted from the close relationships between photosynthetic capacity and other available leaf parameters remains the popular selection. Unfortunately, no consensus has yet been reached on such “proxies”, leading them only applicable to limited cases. In this study, we aim to identify if there are close relationships between the photosynthetic capacity (represented by the maximum carboxylation rate, Vcmax) and leaf traits for mature broadleaves within a cold temperature deciduous forest. This is based on a long-term in situ dataset including leaf chlorophyll content (Chl), leaf nitrogen concentration (Narea, Nmass), leaf carbon concentration (Carea, Cmass), equivalent water thickness (EWT), leaf mass per area (LMA), and leaf gas exchange measurements from which Vcmax was derived, for both sunlit and shaded leaves during leaf mature periods from 2014 to 2019. The results show that the Vcmax values of sunlit and shaded leaves were relatively stable during these periods, and no statistically significant interannual variations occurred (p > 0.05). However, this is not applicable to specific species. Path analysis revealed that Narea was the major contributor to Vcmax for sunlit leaves (0.502), while LMA had the greatest direct relationship with Vcmax for shaded leaves (0.625). The LMA has further been confirmed as a primary proxy if no leaf type information is available. These findings provide a promising way to better understand photosynthesis and to predict carbon and water cycles in temperate deciduous forests.
1. Introduction
Photosynthesis is one of the main drivers of the carbon flux and plays a critical role in climate models across various scales from individual to global [1,2,3]. Currently, carbon uptake is popularly estimated using a well-established biochemical model of photosynthesis developed by Farquhar et al. [4,5], requiring leaf photosynthetic capacity parameters as key inputs. Hence, a clear understanding of leaf photosynthetic capacity is indispensable for predicting responses of carbon flow in ecosystems to climate change [6] and for modeling biosphere-atmosphere interactions at local and regional scales [7,8]. Leaf photosynthetic capacity is often described by the maximum rate of carboxylation (Vcmax), determined by the amount, activity, and kinetics of the enzyme ribulose 1,5-bisphosphate carboxylase/oxygenase (Rubisco) [4].
The model-simulated photosynthetic rate of terrestrial biosphere models is highly sensitive to Vcmax [3,9], which has been traditionally treated as a constant. However, Vcmax in general varies widely across species, plant functional types, and environmental conditions [10,11,12,13,14]. In addition, seasonal variations of it are also apparent [15,16,17], further complicating the situation and suggesting that the constant-treatment of the parameter in the models is inadequate. Unfortunately, the traditional approach of inferring Vcmax by model inversion from photosynthesis measurements [18,19] is so time-consuming and cannot provide highly frequent dynamical information of the parameter required by models.
Tremendous efforts have hence been made to provide spatiotemporal dynamics of the parameter. Searching potential correlations between leaf photosynthetic capacity and other easily measurable quantitative parameters has become a popular practice in recent years, e.g., using nitrogen (N) content on an area basis [20,21] or a mass basis [22], or chlorophyll [23], as “proxies” for providing spatiotemporal dynamics of the parameter, and is getting particularly important for parameterizing terrestrial biosphere models [5,24,25].
However, it is vital to explore the mechanistic relationships between Vcmax and leaf parameters, e.g., leaf mass per area (LMA), nitrogen concentration, or chlorophyll content, before this approach can be widely applied. It has been well documented that Vcmax is highly correlated with leaf nitrogen concentration either expressed on an area basis [20,21] or a mass basis [22], and it can therefore be estimated using existing Vcmax-N relationships. Such associations have widely been used in scaling estimates of leaf photosynthesis to canopy level [26]. A possible reason for the association is that nitrogen is the main component of Rubisco, accounting for a large proportion of the photosynthetic machinery [27,28]. On the other hand, however, the use of the relationship has been criticized because there is a wide range of Vcmax for a given value of Narea among different studies, and leaf ontogeny or drought may have additional effects on the relationship, which in turn lead to substantial errors [18]. More critically, this relationship is still a subject of debate [28]. No strong relationship could have ever been observed in several studies, e.g., van de Weg et al. [29] and Dusenge et al. [30], whereas more studies claimed that the relationship is relatively stable and robust among different species [31] or under different environmental conditions [27,32,33].
Comparatively, much fewer works have ever focused on using other leaf biochemical properties such as chlorophyll content, or other leaf structural traits to derive Vcmax. The leaf chlorophyll content is a key parameter directly linked to photosynthetic potential or primary production and may thus provide valuable information on the physiological status [34,35]. Since the leaf chlorophyll content may be derived from satellite data over different spatial and temporal scales [23], it may therefore provide another promising potential proxy for Vcmax. Researches show that leaf chlorophyll distribution is strongly correlated with leaf nitrogen content [36] because a large amount of leaf nitrogen is distributed in chlorophyll pigments [37], suggesting a potential linkage between them. A previous study by Niinemets et al. [38] has reported that the decline in leaf chlorophyll content would have resulted in similar decreases in leaf photosynthetic capacity. Unfortunately, the variation of Vcmax in response to the chlorophyll content has been poorly documented up to date, limiting its usefulness as a “proxy” for Vcmax.
Previous researches have also shown that most of the variation in Vcmax could be explained by the variation in leaf structural traits, usually quantified using LMA [39,40], although the effect of leaf structure on Vcmax could be rather complex [41,42,43,44]. The LMA determines several leaf-scale processes, including nitrogen and water use efficiency, integrates leaf morphology and composition, and is critical for carbon sequestration and productivity [45]. Furthermore, LMA is a key parameter for plant growth and an important indicator of plant strategies, although it has been used less so in plant physiology [42]. Unfortunately, the controlling function of LMA on photosynthetic capacity remains unclear [25].
Previous studies have further proved that the canopy-level flux is an integrated response in which both sunlit and shaded leaf groups are involved, which respond differently to climate change [46,47]. As a result, most models have optimized the estimation of fluxes in carbon dioxide and water vapor by separating the canopy structure into sunlit and shaded leaf groups [48,49,50,51,52]. Unfortunately, most models focused much more on sunlit leaves, ignoring the fact that most of the leaves within the canopy are in the shade and that the shaded leaves have their specific photosynthetic characteristics. A recent study by He et al. [47] clearly indicated that the shaded leaf group is particularly important in estimating gross primary production and is not vulnerable to the effects of climate change, suggesting the importance of including the dynamics of leaf photosynthetic capacity for this group in models. Consequently, searching close relationships for providing dynamic information of leaf photosynthetic capacity for shaded leaves is an inevitable step towards improving flux estimations further.
In this study, we focused on identifying the closest relationships for both sunlit and shaded leaves of a typical temperature deciduous forest by assessing the relationships of photosynthetic capacity with various biochemical and structural parameters. This is based on a long-term field-measured dataset including both leaf photosynthetic capacity and associated biochemical and structural parameters for the two leaf groups. The main objectives are: (1) to provide an overview of long-term (interannual) and short-term (within leaf mature periods) variations in leaf photosynthetic capacity for both leaf groups; (2) to explore potential close relationships between photosynthetic capacity and leaf biochemical and structural parameters in different leaf groups.
2. Materials and Methods
2.1. Study Site
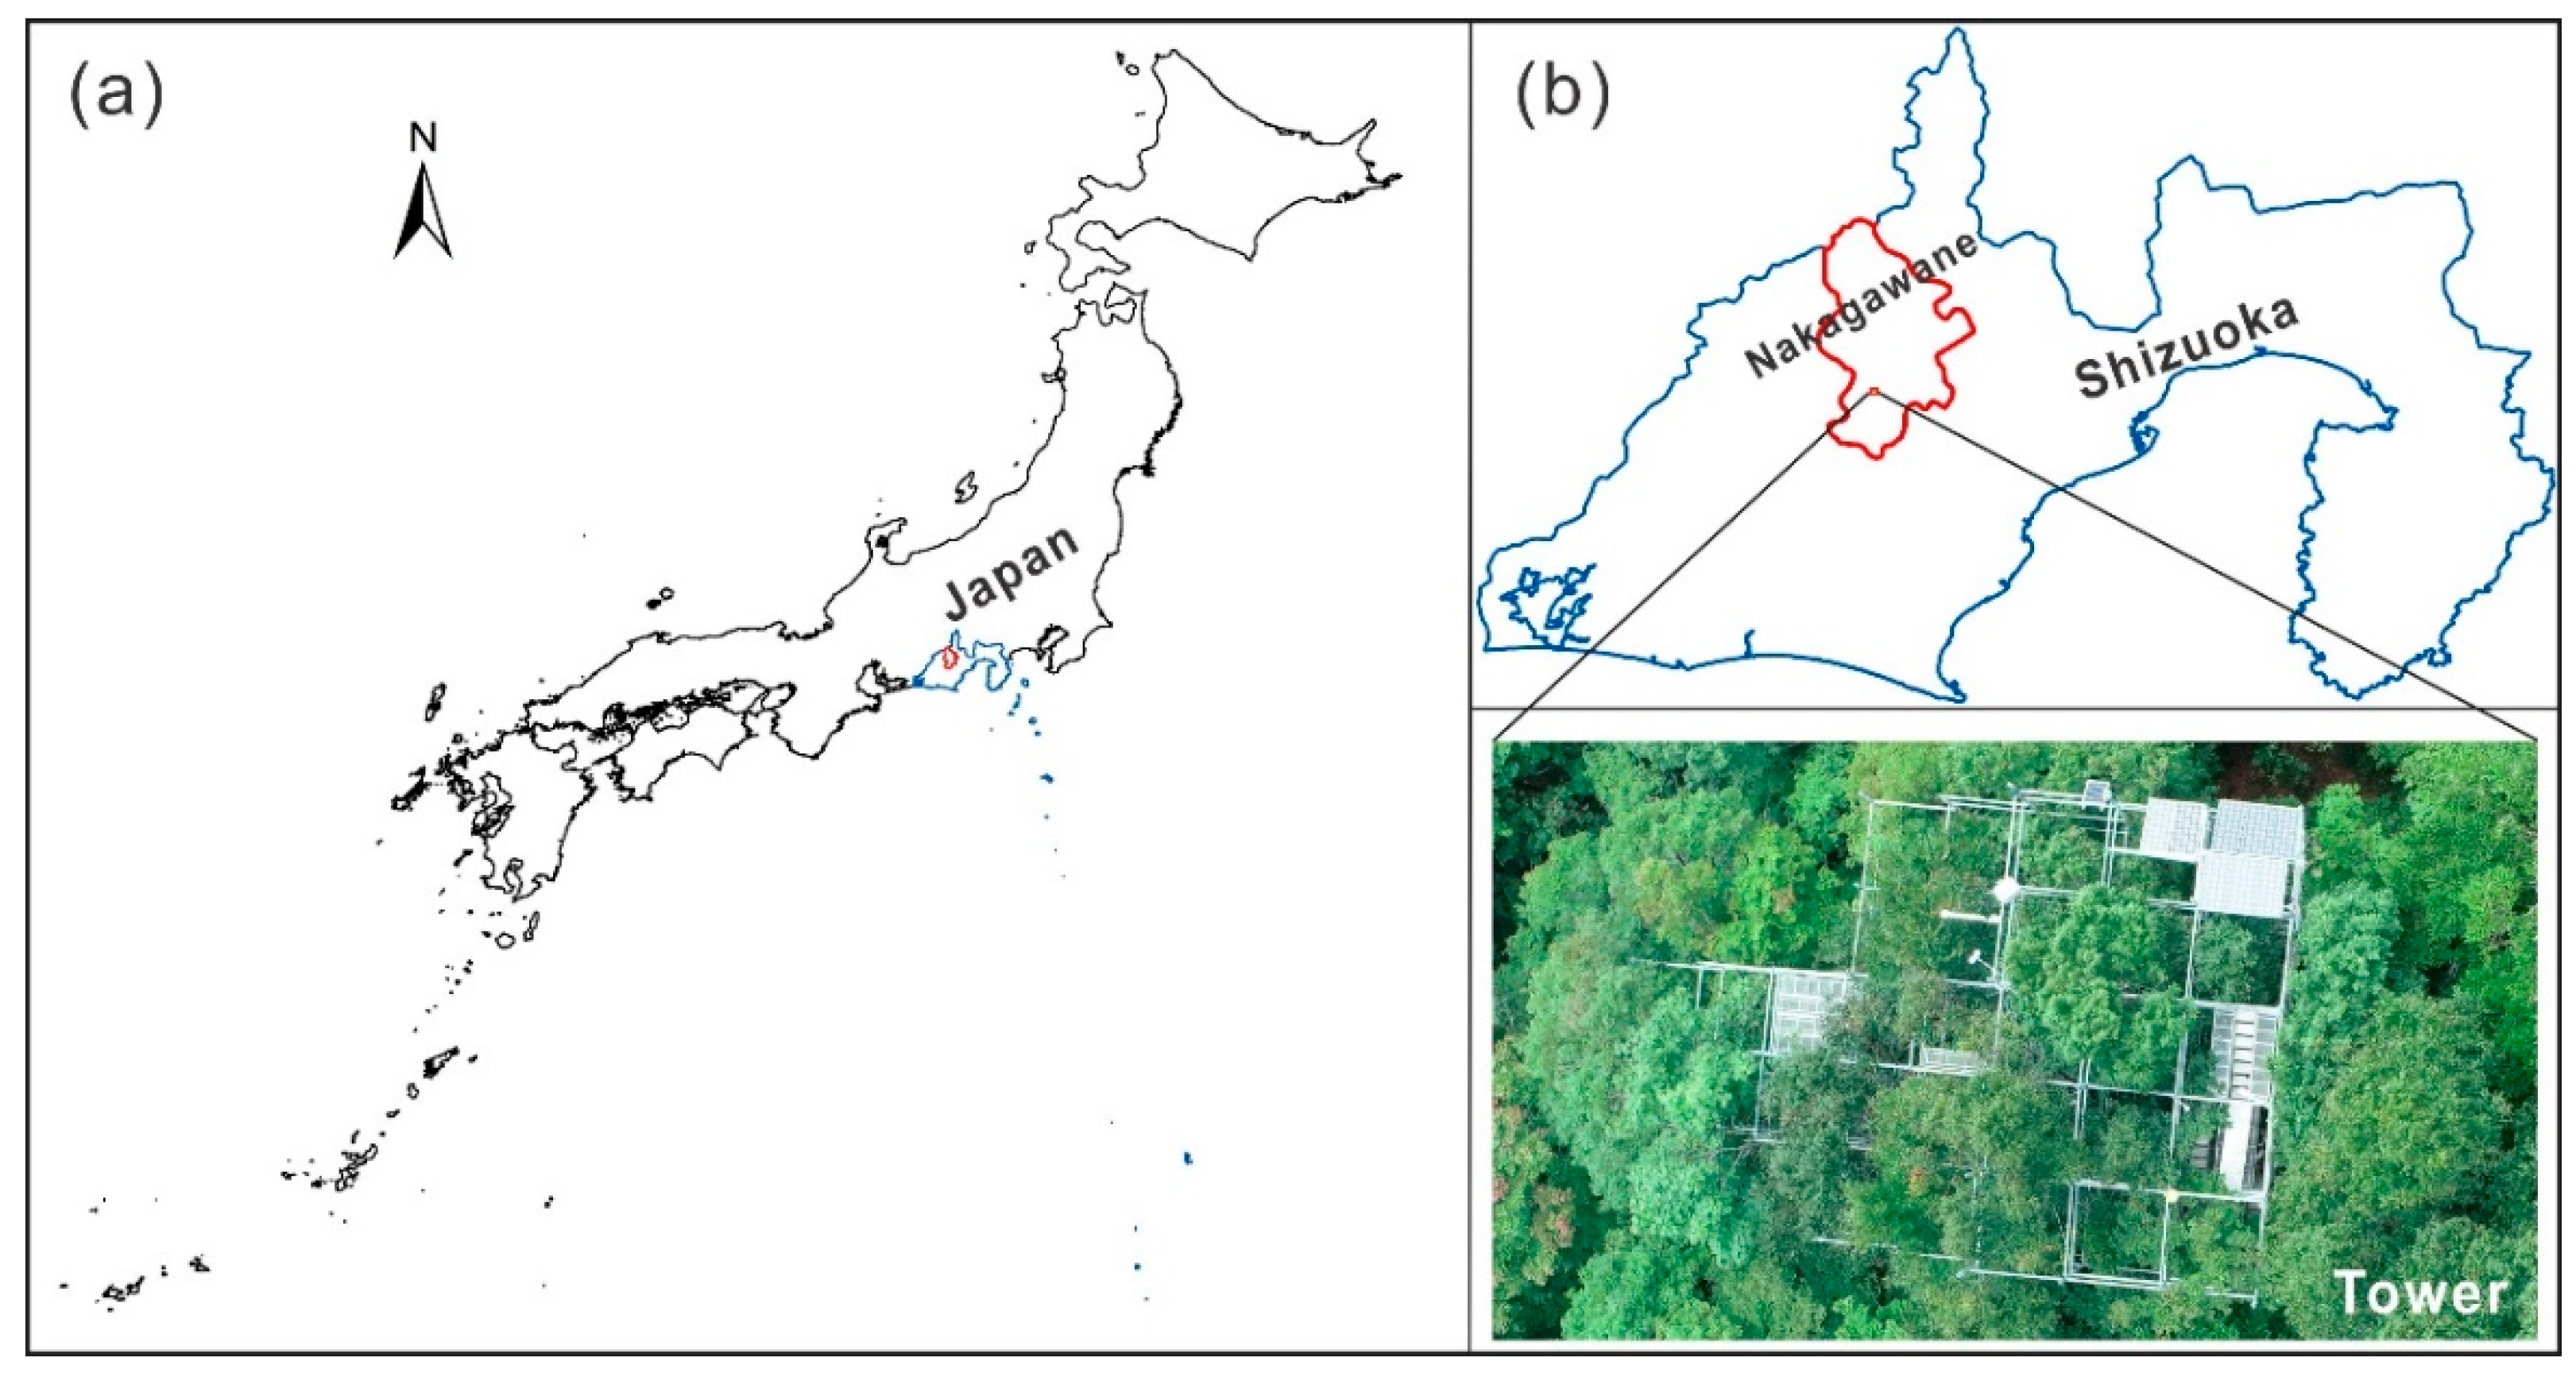
The study site is located at Nakagawane forest (138o06′ E, 35o04′ N) (Figure 1), one of the research forests of Shizuoka University, Japan [53]. This research site has a typical alpine cold-temperate climate with a mean annual air temperature of 16°C and a mean annual precipitation of approximately 2500 mm [54], and an elevation from 390 to 1560 m.
2.2. Sample collection
Leaf gas exchange, as well as leaf biochemical and structural properties were measured for all species accessible from the tower at the study site, consisting mainly of Fagus crenata, Betula grossa, Carpinus tschonoskii, Stewartia monadelpha, and Acer shirasawanum. The tree canopies were separated into the top layer of sunlit leaves and the bottom layer of shaded leaves as well as the middle layer with both sunlit and shaded leaves. However, the samples taken from the middle layer were not included in the analysis in order to avoid possible miscategorization of leaf groups. All samples were taken following the detached branch method [5] inside the tower of different directions at each layer. Three fully expanded and apparent non-senescing leaves attached to the cut branches from each direction were selected for each round of measurement. They were cut predawn and were immediately recut under water for reestablishing the xylem water column [16,29,40]. After that, the sampled branches were sealed in polyethylene boxes under dark and humid conditions and transported to the laboratory for further determination. Samples were collected from mid-June to mid-September (DOY (Day of Year) 168 to DOY 258) in 2015, 2017, and 2018, while in mid-September (DOY 258) in 2014, and mid-August (DOY 222) for both 2016 and 2019.
2.3. Leaf Gas Exchange Measurements
Leaf gas exchange was measured using the LI-6400 portable photosynthesis system (Li-Cor 6400, Li-Cor, Lincoln, NE, USA) during the maturation periods of 2014–2019 for sunlit leaves and 2014–2018 for shaded leaves. The chamber temperature was set to 25 °C, and the net photosynthetic rate (A)–intercellular CO2 concentrations (Ci) (A-Ci) curves of light-saturated photosynthesis (at 1000 μmol·m−2·s−1) were obtained. Leaf photosynthetic capacity (maximum carboxylation rate–Vcmax) on a leaf area basis was then inferred from the A-Ci curves using the R package “plantecophys” [55].
2.4. Leaf Biochemistry and Structure Measurements
Leaf discs for chlorophyll content were punched on the same leaf samples after gas exchange measurements and then were kept at 4 °C refrigerator prior to extraction with N, N-Dimethylformamide (DMF) for 24 h. A dual-beam scanning ultraviolet-visible spectrophotometer (Ultrospec 3300 pro, Amersham Biosciences, Piscataway, NJ, USA) was used to record absorption at different wavelengths, while the Porra’s method was applied to calculate chlorophyll content (Chl) [56]. Leaf areas were measured using digital photographs taken by a high-resolution scanner (EPSON GT-S600; EPSON, Jakarta, Indonesia). Fresh weights of the same leaves were also taken before they were oven-dried for 48 h at 70 °C to constant weight for calculating equivalent water thickness (EWT) and leaf mass per area (LMA). However, there were no EWT and LMA data available for 2015. Finally, the oven-dried leaves were milled to a fine powder, from which leaf nitrogen concentration per unit area (Narea) and per unit mass (Nmass), as well as carbon concentration per unit area (Carea) and per unit mass (Cmass) were determined with a gas chromatograph (Sumigraph NC-95A, Shimadzu, Kyoto, Japan) (only for the samples from 2017–2018).
2.5. Statistical Analysis
All photosynthetic, biochemical, and structural parameters were log10-transformed prior to statistical analysis. Repeated measure analysis of variance (ANOVA) was performed to determine the variations among the months and years (p < 0.05). The relationships of photosynthetic capacity with biochemical and leaf structural parameters were analyzed by Pearson’s correlation, with the possible direct and indirect effects of each parameter on the photosynthetic capacity being further identified by path analysis [57,58,59]. Data analysis was conducted using the packages “plantecophys” and “agricolae” in R 3.5.3.
3. Results
3.1. Long-term and Short-term Variations in Vcmax
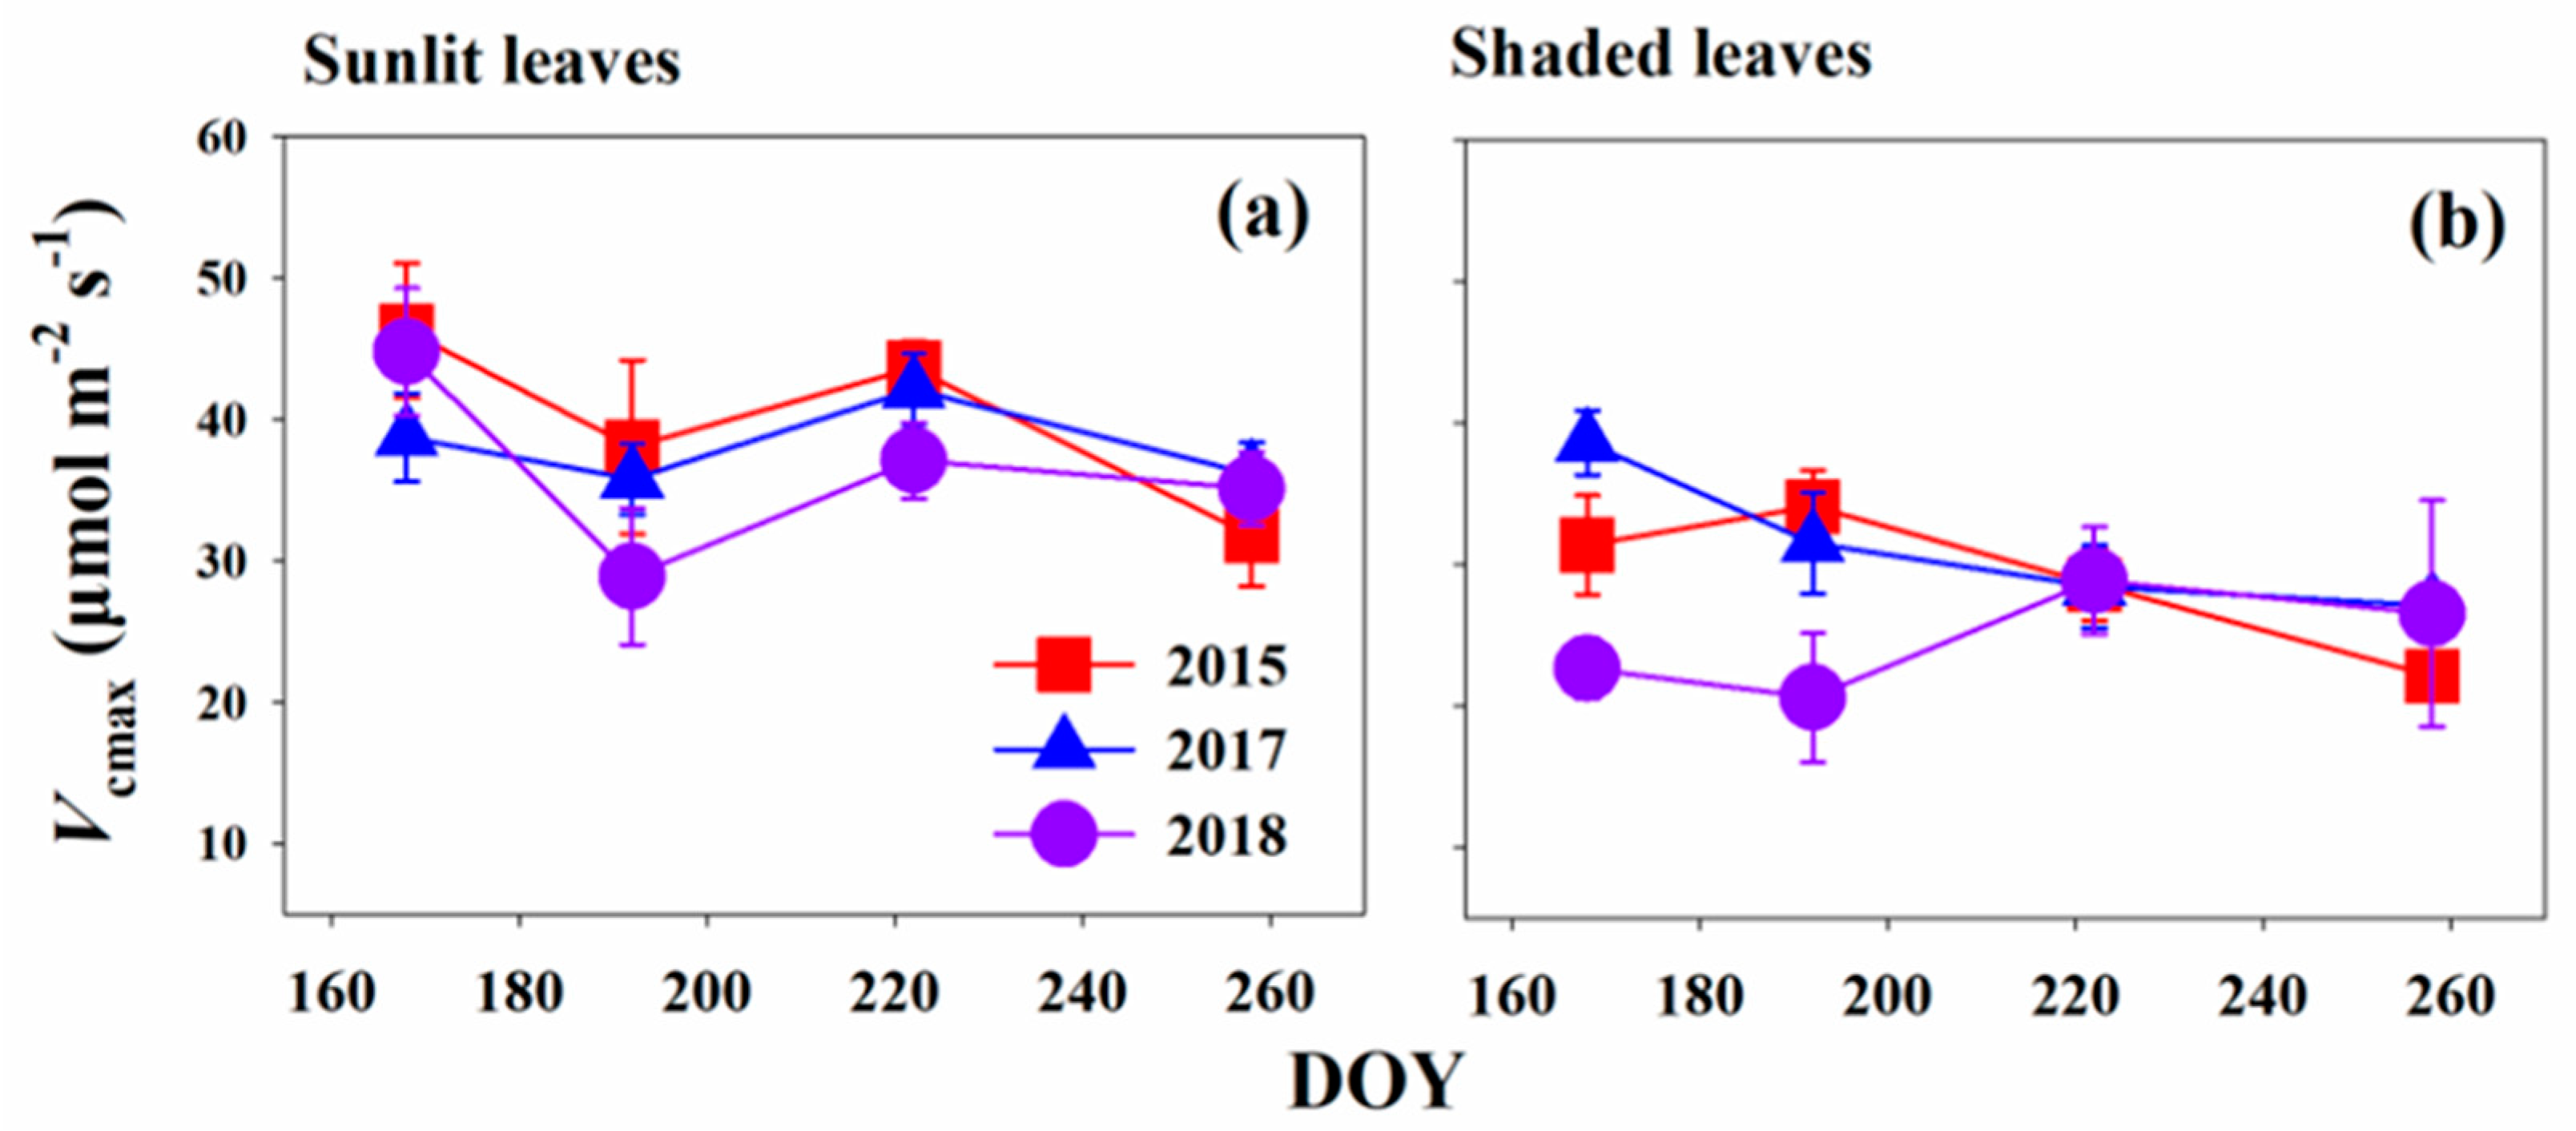
Figure 2 shows the temporal variations of Vcmax in the leaf mature periods for both sunlit and shaded leaves (from DOY 168 to DOY 258) for 2015, 2017, and 2018, respectively. For sunlit leaves, Vcmax values in these 3 years slightly decreased from mid-June to July but rebound slowly until mid-August (DOY 222) before they slightly declined towards mid-September (Figure 2a). However, statistical results revealed that there were no significant changes during the months (p > 0.5). Similarly, Vcmax also tended to be stable within these months for shaded leaves (p > 0.5, Figure 2b).
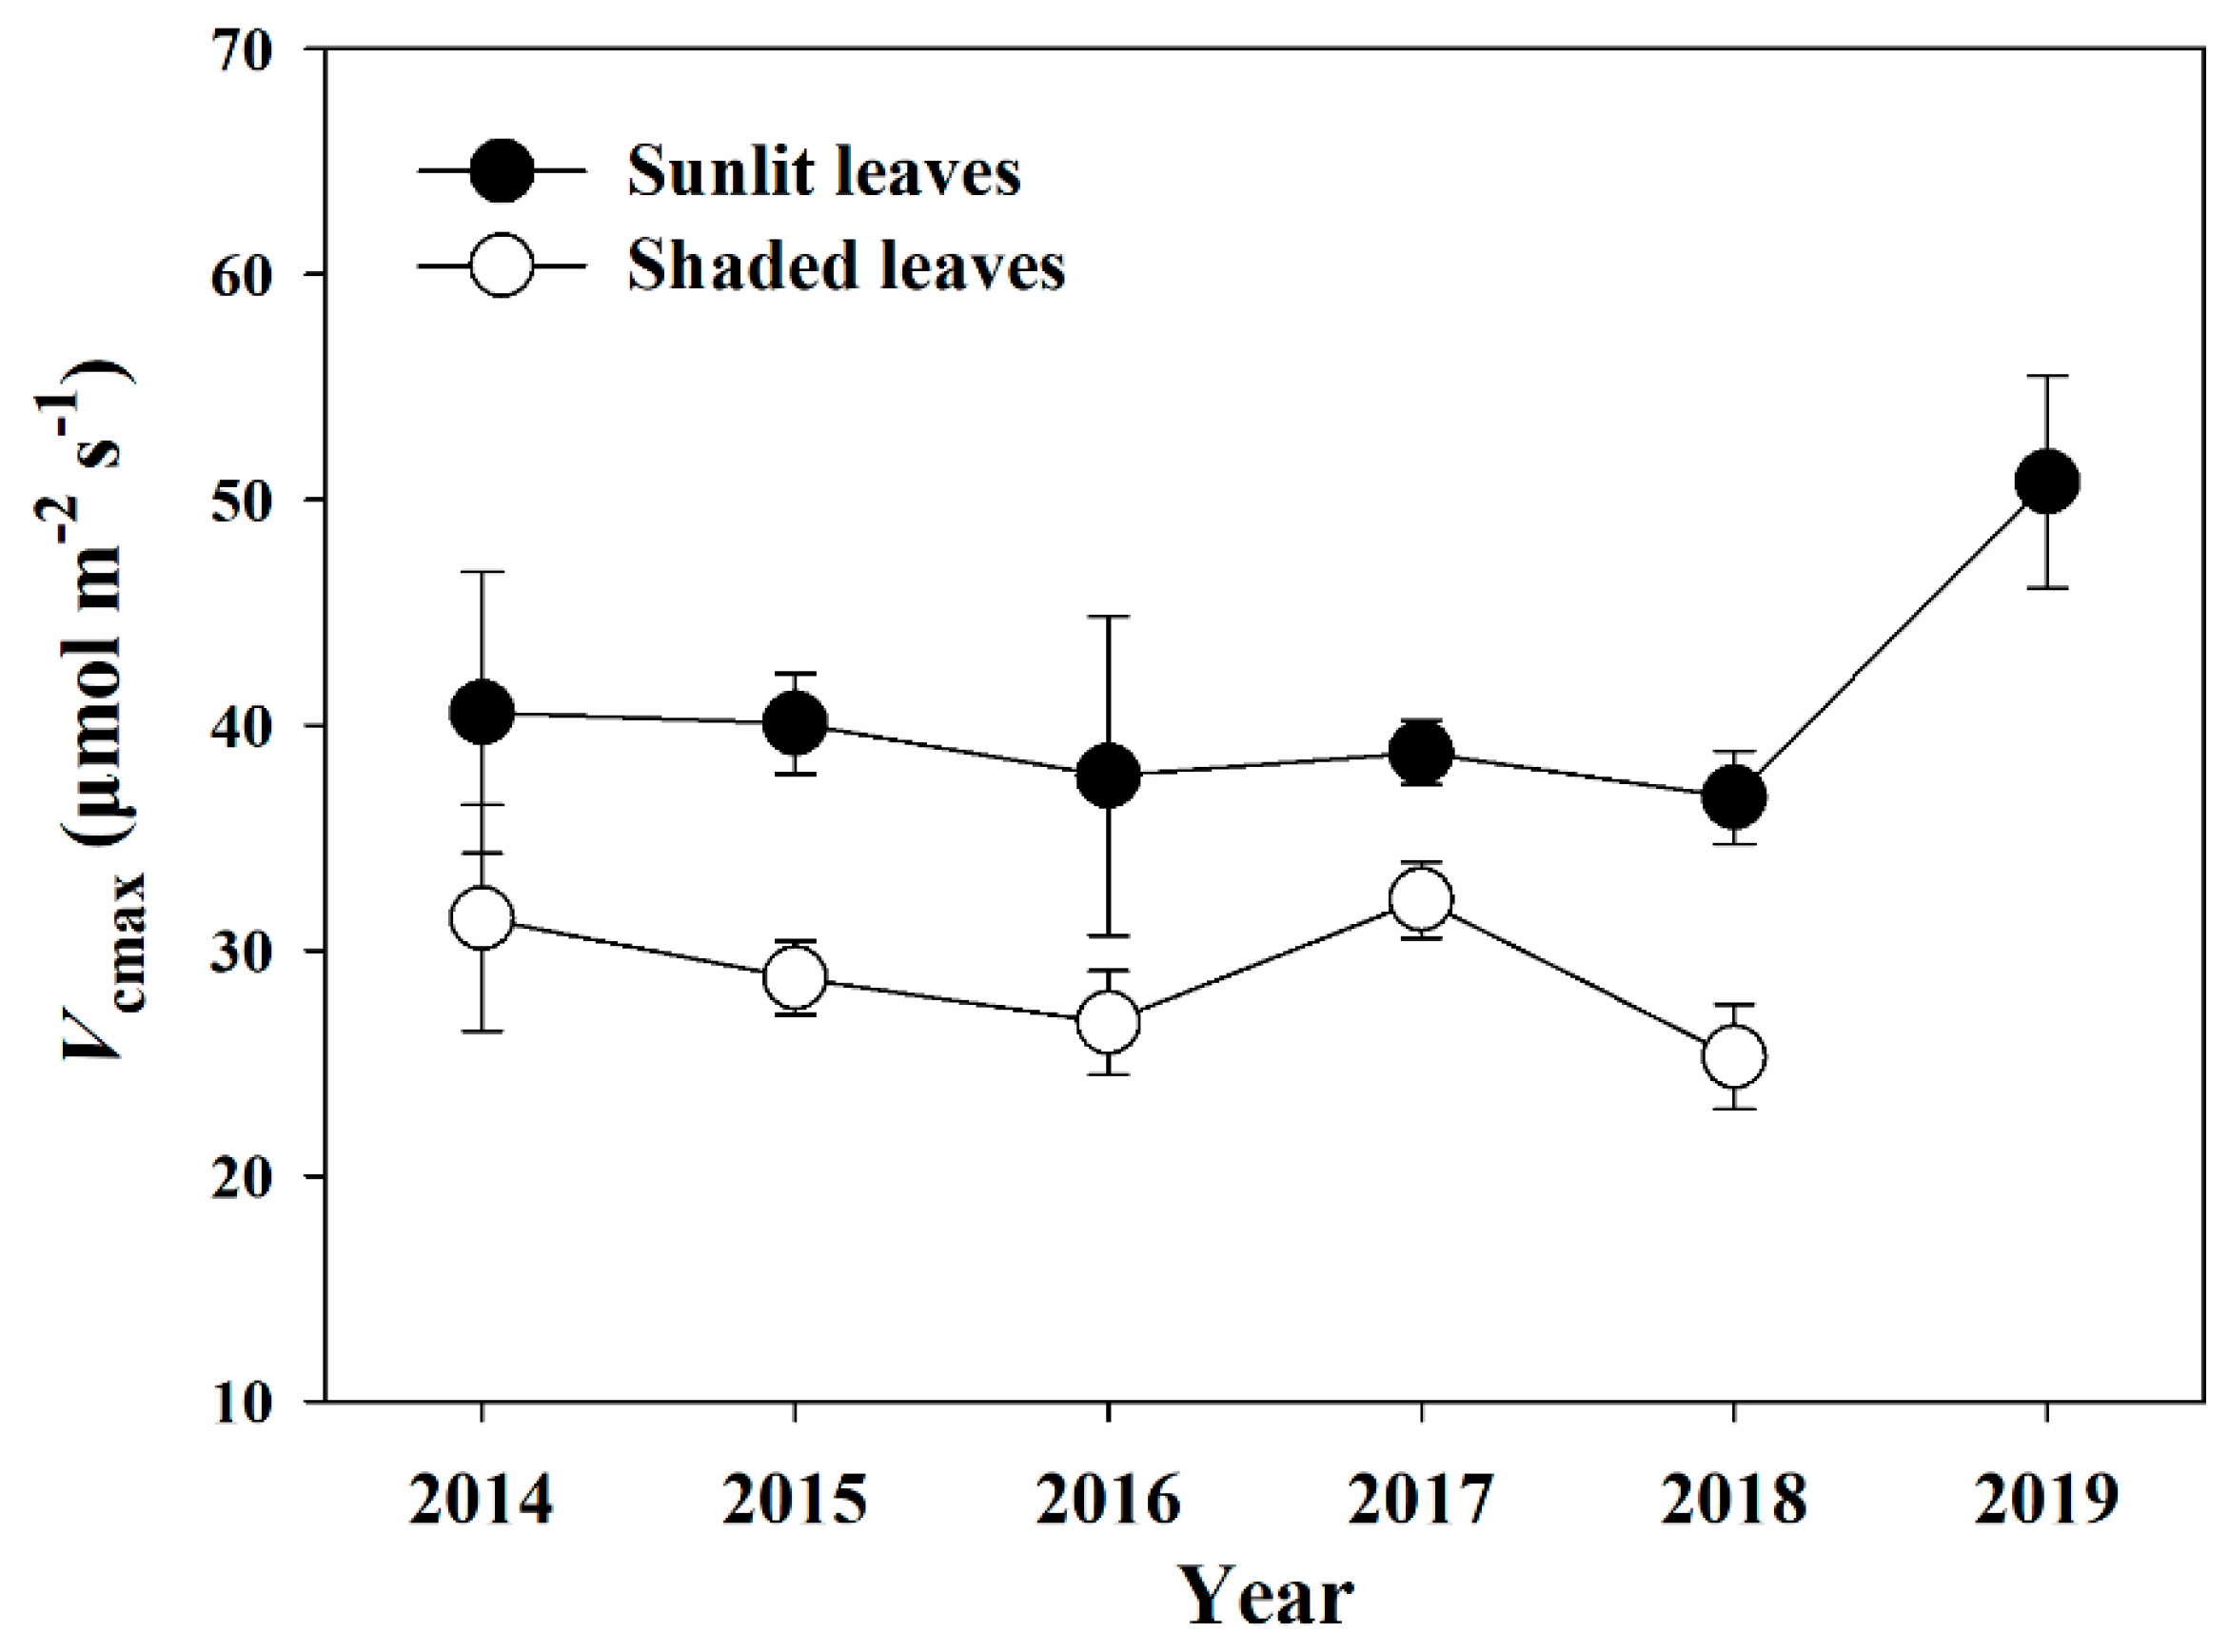
The mean Vcmax values of sunlit leaves from 2014 to 2019 and of shaded leaves from 2014 to 2018 were used to reveal their interannual variations (Figure 3). As shown in Figure 3, the mean Vcmax values varied from 36.80 to 50.79 μmol m−2 s−1 in the sunlit leaves and from 25.28 to 32.26 μmol m−2 s−1 in the shaded leaves. The highest mean value of Vcmax of sunlit leaves was found for 2019 and of shaded leaves was found for 2017 (50.79 and 32.26 μmol m−2 s−1, respectively). However, there was no significant yearly variation in both sunlit and shaded leaves (p > 0.05).
Species-specific temporal variations in Vcmax have also been examined. Two common species, Fagus crenata and Acer shirasawanum were selected because their relatively large and continuous sample numbers met with the statistical requirement. Contrary to canopy scale behaviors, significant interannual variations in both sunlit and shaded leaves were identified for Fagus crenata. Its Vcmax in 2014 was significantly higher than in 2017 and 2018 for sunlit leaves (p < 0.001), and was significantly higher than the other three years (2016–2018) for shaded leaves (p < 0.01). In contrast, there were no statistically significant interannual variations in Vcmax for both sunlit and shaded leaves of Acer shirasawanum (p > 0.05) from 2014 to 2016, suggesting the behaviors can be very different among different species.
3.2. Relationships of Vcmax with Leaf Biochemical and Structural Traits
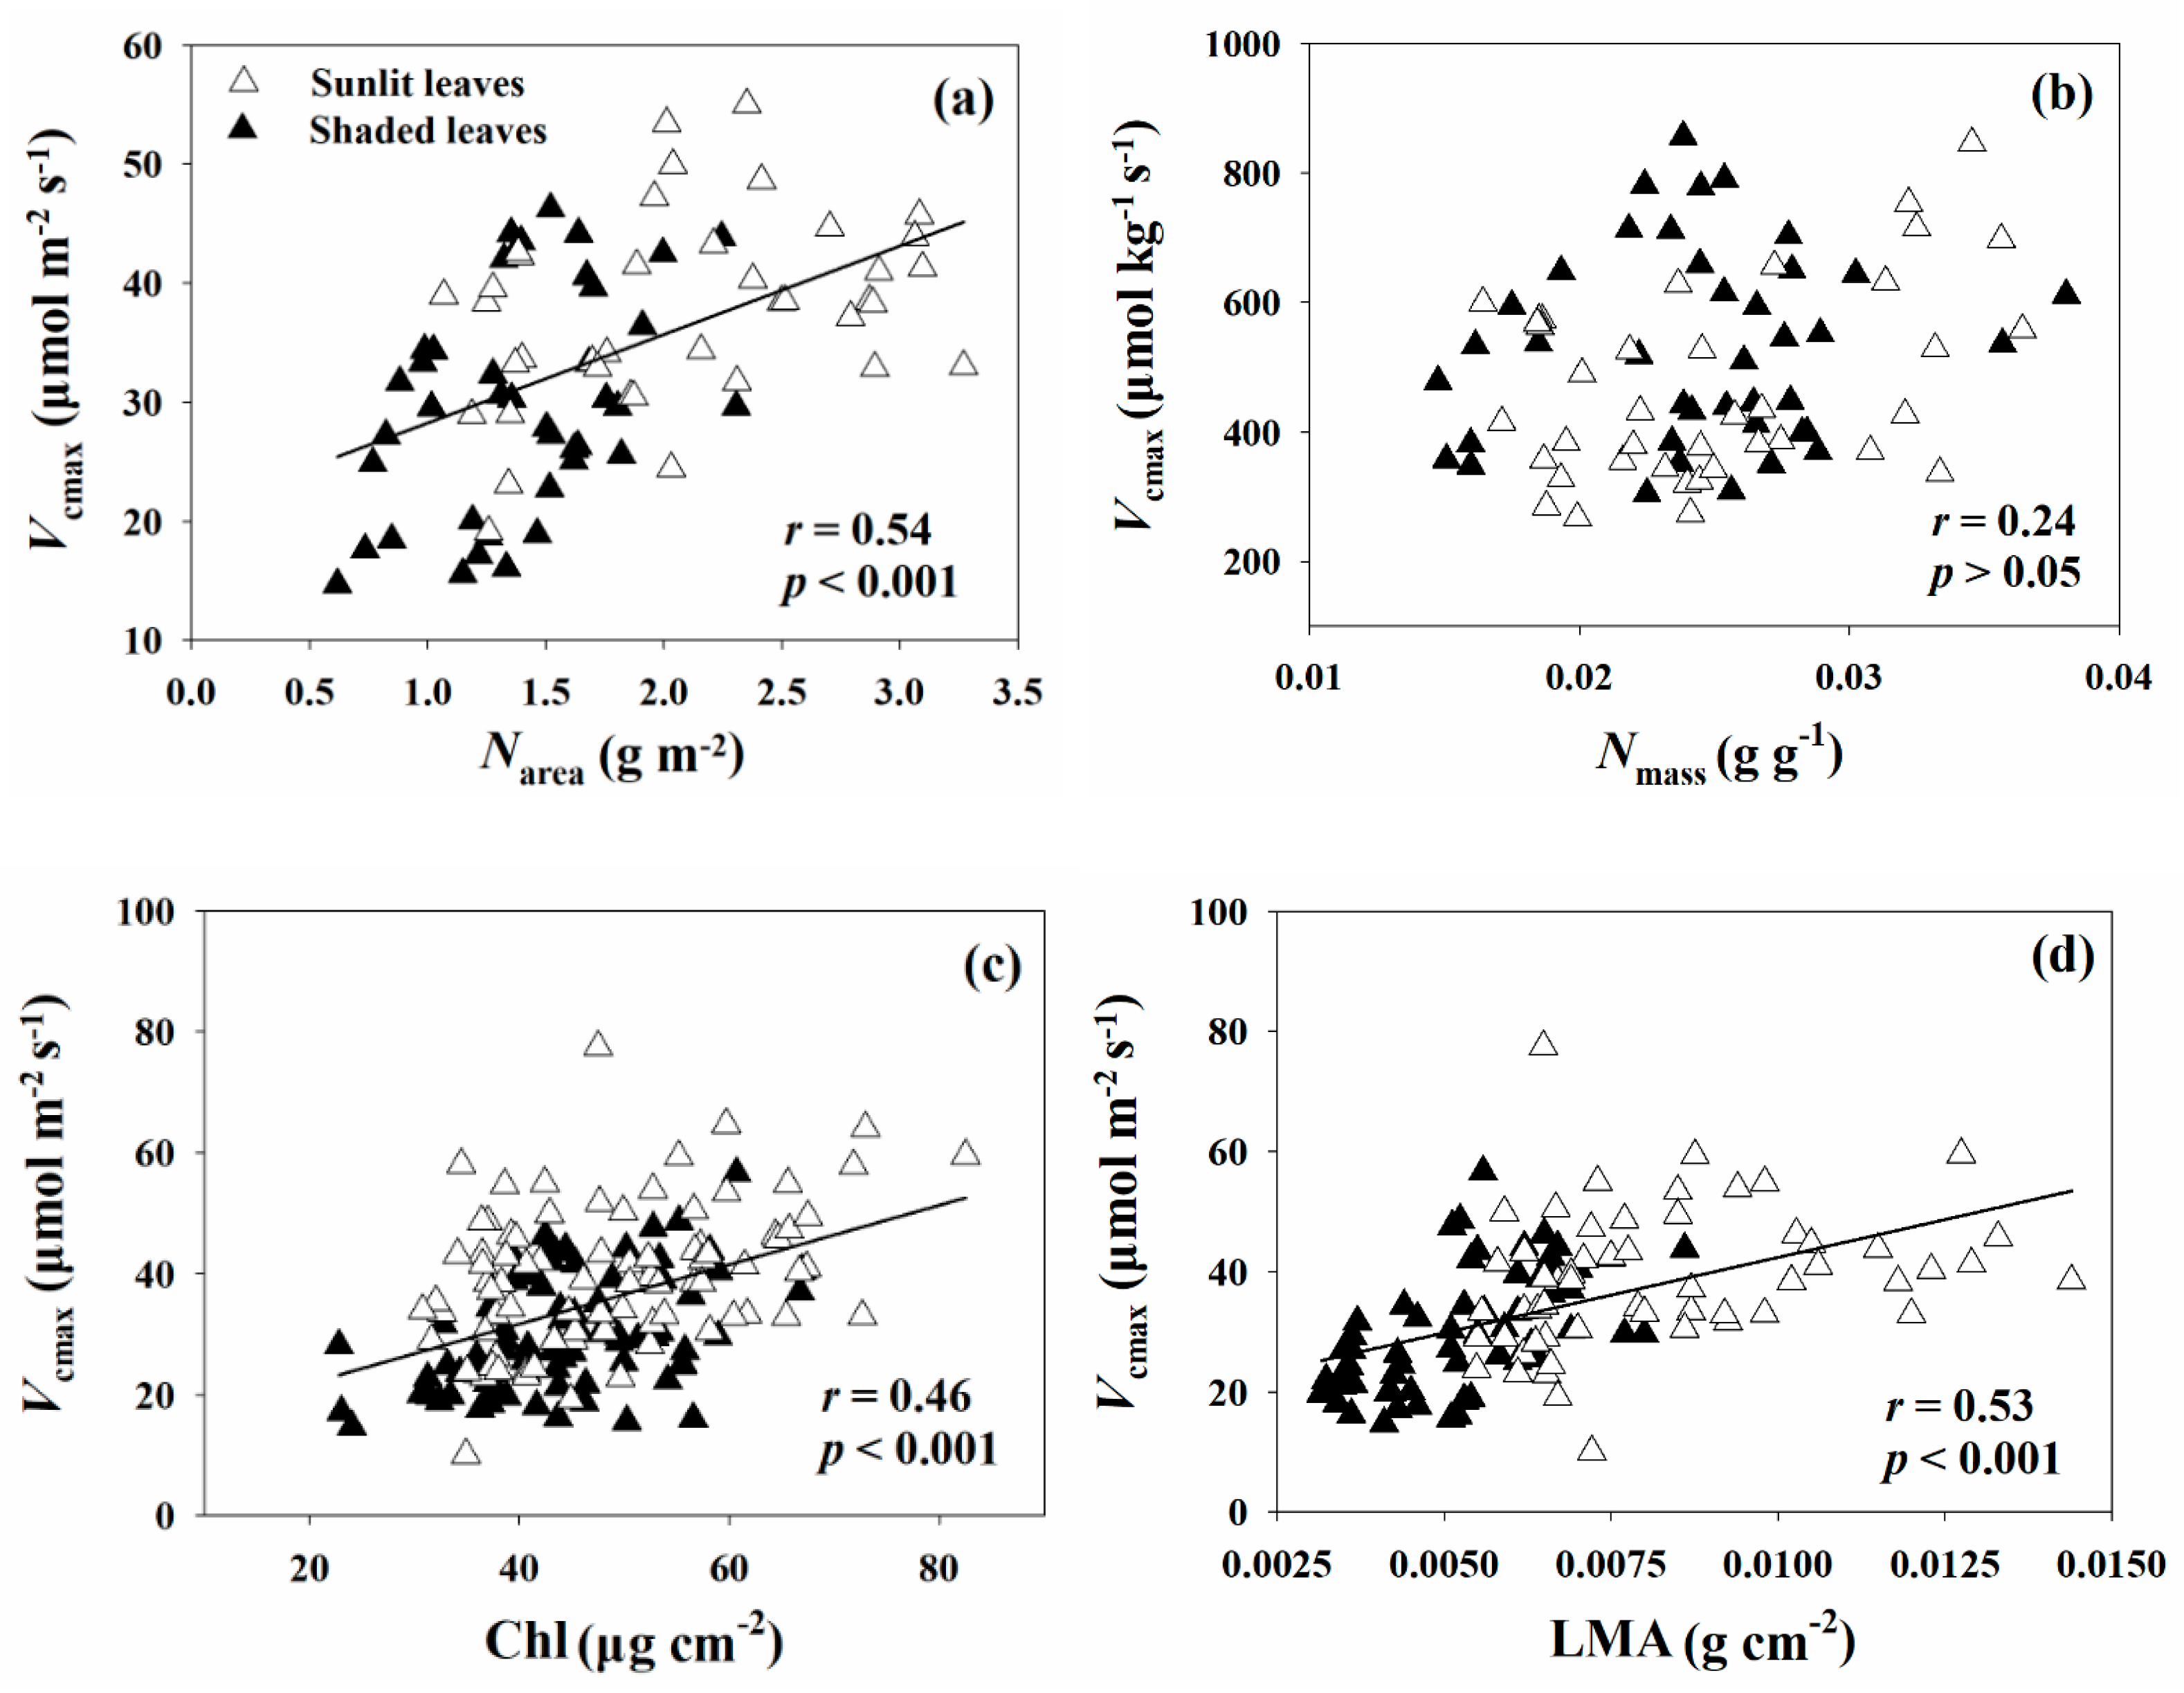
Significant relationships of Vcmax with leaf biochemical and structural traits were detected in all leaf samples (Figure 4). Variations in Vcmax were positively correlated with leaf biochemistry (represented by nitrogen concentration and chlorophyll content in this study), showing a relatively stronger relationship with Narea (r = 0.54, p < 0.001, Figure 4a) than with Chl (r = 0.46, p < 0.001, Figure 4c). However, additional analysis revealed that there was no significant pairwise relationship between Vcmax and Nmass (p > 0.05, Figure 4b) in terms of a mass base. On the other hand, besides leaf biochemical properties, Vcmax was significantly correlated with leaf structural traits (represented by LMA in this study) across all leaves (r = 0.53, p < 0.001, Figure 4d).
Further analysis based on a mass basis revealed that there were no significant correlations between Vcmax and other leaf biochemical and structural traits, including Chl, Narea, and LMA (p > 0.05), for both sunlit and shaded leaves.
Depending on the different leaf groups, Vcmax exhibited significant relationships with both Narea and Chl (r = 0.38 vs. r = 0.37, p < 0.001), while a weak relationship with LMA (r = 0.30, p < 0.05) was found for the sunlit leaves. On the contrary, the correlation between Vcmax and LMA proved to be stronger (r = 0.56, p < 0.001) than that with Chl (r = 0.47, p < 0.001) and Narea (r = 0.45, p < 0.01) for shaded leaves. Collectively, Vcmax was correlated less strongly with leaf biochemical and structural traits in sunlit leaves than in shaded leaves (Figure 4).
3.3. Direct and Indirect Effects of Leaf Biochemical and Structural Traits on Vcmax
Path analysis (Vcmax as the response variable and leaf biochemical and structural parameters as the independent variables) was carried out to reveal the direct and indirect effects of leaf traits on Vcmax. The results based on all samples and on different leaf groups are presented in Table 1.
Among the examined variables, Chl, Narea, and LMA had positive effects on Vcmax in all leaves. The variable that influenced Vcmax most significantly was LMA (0.361), followed by Narea (0.356).
For the sunlit leaves, path analysis showed that the maximum positive direct effect was from Narea (0.502), followed by Chl (0.379) and LMA (0.053). Although LMA was strongly correlated with Vcmax (r = 0.3, p < 0.05), its direct effect was surprisingly low (0.053, less than 0.100). However, LMA exhibited an impressive positive indirect effect via Narea (0.366).
For the shaded leaves, LMA was the only variable that strongly correlated with Vcmax if considering the direct effect. It exhibited a significant positive correlation (r = 0.56, p < 0.001) and an ever-higher direct path coefficient value (0.625) with Vcmax. Although correlation analysis suggested that Chl, Narea, and Carea also had high and significant relationships (r = 0.47, 0.45, and 0.51, respectively) with Vcmax, their direct effects on Vcmax, however, were relatively low (path coefficient = 0.208, 0.099, and −0.213, respectively). Nonetheless, high indirect effects on Vcmax were detected for each of them through LMA, following the order Carea (0.544), Narea (0.469), and Chl (0.363).
4. Discussion
4.1. Intra-annual and Interannual Variations in Vcmax
Similar to Niinemets et al. [38], the result obtained in this study confirmed that no statistically significant variation can be distinguished for Vcmax during the leaf maturity period, irrespective of the leaf group. The Vcmax stabilized from the middle of June (around DOY 168) to the middle of September (around DOY 258), suggesting there is a platform of Vcmax values surrounding the peak values, termed as “leaf maturity period”. However, such values should be used with caution, since they were obtained from canopy-layer-scale statistics rather than from specific species. There are apparent seasonal variations of leaf photosynthetic capacity beyond this period [16,32,60,61]. Up to now, most eco-physiological studies mainly focus on mature leaves and show that the photosynthetic apparatus is essentially constant in the mature period (e.g., Niinemets et al. [38]). Such adaptationconstancy of photosynthetic mechanism on one hand greatly simplifies the estimation of the carbon balance, while on the other hand, unfortunately, it dramatically increases simulation deviation, as previous researches proved that only emphasizing on measuring mature leaves ignores the demographics of the leaves [17], leading to an overestimation of the photosynthetic productivity [62,63]. Furthermore, Vcmax also varies across species and locations [3]. Consequently, the traditional treatment of constant Vcmax in gas exchange models might be applicable only to the leaf maturity period.
Our results indicate that the mean values of Vcmax in the time of leaf maturation did not vary significantly among years, leading to no interannual variations in the context of statistics. This finding is rather inconsistent with those observed in previous studies [16,18,64,65]. Again, our canopy-layer approach of statistics has explained the discrepancy, since a further species-specific examination revealed that there existed statistically significant interannual variations in different species within the canopy. Furthermore, according to [18], the interannual variations of Vcmax are primarily caused by water stress. Whereas no water stress has been confirmed in our research site and may have further explained the discrepancy.
Taken together, the results obtained in this study should be interpreted with caution since they were rooted in canopy scale statistics. Even so, our results indicated that there were relatively constant Vcmax within leaf mature periods across years and may thus provide a feasible modeling approach from leaf functional types, rather than from distinctive species, for understanding canopy scale performance.
4.2. Relationships of Vcmax with Leaf Biochemical and Structural Traits for Both Leaf Groups
In general, Vcmax is proportional to leaf nitrogen concentration when expressed on an area basis (Narea) and has been confirmed for a wide range of species or plant functional types around the world [8,39,66,67]. The results obtained in this study again indicate that there are stronger relationships for the area-based than the mass-based approaches, but all relationships were strongly affected by LMA. This confirms that the functional interpretation of the Vcmax-Narea relationship requires the analysis of the parallel variation of LMA [68]. More directly, a significant correlation between Vcmax and LMA was found during leaf maturation for all leaves, similar to those reported by other studies [16,18,39,40]. However, our results suggest that LMA is positively correlated with Vcmax, inconsistent with previous claims that thick leaves should have low photosynthetic rates [66]. Such discrepancy reminds us that the relationship between photosynthesis and LMA could be rather complex and requires a detailed understanding of how this physiological process relates to plant strategy or environmental conditions case by case. Even so, our results at least suggest that both LMA and Narea are useful parameters for estimating photosynthetic capacity, as claimed by Han et al. [69].
Since the relationship determined only by simple correlation analysis may limit the prediction of selection responses, it is therefore of necessity to partition direct and indirect cause-and-effect [70] in order to identify more accurate and robust relationships.
Path analysis demonstrated the importance of Narea as the primary indicator of Vcmax in the sunlit leaves, with Chl and LMA being less important. A stronger direct effect of Narea than of Chl with Vcmax in this leaf group suggests that leaf Narea is of greater importance in controlling Vcmax than Chl, which is in disagreement with Croft et al. [35], in which chlorophyll exerted a strong influence over Vcmax and the use of chlorophyll as a proxy to model Vcmax was recommended. Our finding, nevertheless, was in accordance with the results of Wright et al. [66] and Han et al. [69], where indicated that leaf nitrogen concentration was most suitable to predict photosynthetic capacity. Clearly, the strong correlation between Vcmax and Narea has a physiological basis, which can be explained by the high proportion of nitrogen in leaves stored in Rubisco [71], and the proportion is largely constant [72]. The results again suggest that Narea, rather than Chl, is more closely related to Vcmax, at least for sunlit leaves. This finding, thus, should have important implications for canopy integration schemes when used to calculate photosynthesis in gas exchange models.
On the other hand, path analysis clearly indicated that LMA was the single factor that directly affected Vcmax most in the shaded leaves. Even though significant positive correlations of Vcmax with Chl and Narea were also obtained, they were attributed preliminarily to the indirect effects of the parameters through LMA. Previous studies have shown that the growth of shaded leaves is mainly restricted by carbohydrate supply [73], leading to a significant positive relationship between photosynthetic capacity and LMA, which is commonly reported for shaded leaves (e.g., Poorter et al. [42]). It is clear that LMA is associated with resource investment in structural components [74], while leaf photosynthetic capacity is related to biomass investment, making LMA the main driver of the photosynthetic capacity in the shaded leaves. Further, variations in LMA can be attributed to light acclimation, which in turn drives leaf photosynthetic capacity in response to the light environment [75]. The importance of exploring the relationship between Vcmax and LMA has also been pointed out by Grassi and Bagnaresi [68] by providing a functional interpretation of acclimation and elucidating the role of physiological plasticity. The results obtained in this study indicate the importance of leaf structure in determining photosynthetic capacity during leaf maturation, which is critical information that needs to be included in gas exchange models.
4.3. Implications for Understanding Gas Exchange and for Climate Models
Our results demonstrate that Vcmax is closely correlated with Narea, at least for sunlit leaves, challenging the results reported by Croft et al. [35], in which reported chlorophyll instead of Narea should be used as a reliable proxy to model photosynthetic capacity. Theoretically, the strong correlation between photosynthetic capacity and nitrogen concentration in the leaves can integrate the influence of differences in the light environment during the growth process [76] and has been implemented in physiologically-based gas exchange or carbon cycle models. We confirm the robustness of the relationship and suggest that Narea can be used for estimating Vcmax. Since the reliable ways to estimate leaf nitrogen concentration from remote sensing data are supported by the relationships between vegetative indices and nitrogen concentration [77,78,79,80] even at a large scale, we predict that Vcmax may be retrieved from remote sensing information via the bridge of Narea.
On the other hand, an increasing number of studies have indicated that the shaded leaves account for half the total increase in gross primary production and hence play a critical role in global carbon and water cycling [47], calling the attention to the contributions from shaded leaves. Previous studies also concluded that differently shaded portions might have altered the relationships between remote sensing indices (e.g., photochemical reflectance index and light use efficiency) [81]. As a result, future gas exchange models should have the ability to encompass both sunlit and shaded leaves, with the later much less been studied yet. Our results clearly indicate that the photosynthesis of shaded leaves is mainly determined by structural properties rather than by biochemical constraints. Accordingly, LMA, rather than Narea or Chl, should be used for retrieving Vcmax for this group of leaves. Hence, leaf structure therefore not only plays a major role in optical properties but also may serve as an easily measured accurate index for photosynthetic capacity and productivity. For this reason, it should be incorporated into models to better understand carbon dynamics in terrestrial ecosystems.
Although statistically significant, moderate correlations of LMA with Vcmax nevertheless prevent the recommendation of using it as a sole proxy, suggesting further studies on this topic are required. There is increasing evidence that leaf phosphorus content plays a role in determining photosynthetic capacity, as significant positive relationships were observed [5,40,44,82]. Even so, identifying potential close relationships between leaf traits and photosynthetic capacity should be a promising step for including dynamic information of it to gas exchange models.
5. Conclusions
Our results reveal that leaf nitrogen concentration and LMA are more closely related to photosynthetic capacity in the sunlit leaves and shaded leaves, respectively, based on long-term field-measured data in a typical cold temperature deciduous forest. The results are important for understanding carbon uptake across a wide range of environmental conditions, carbon, or climate models, and deserve close attention. In the future, gas exchange models should be coupled with the dynamic information of Vcmax for different leaf groups, and their spatiotemporal variations should be provided by the respective proxies.
Author Contributions
Q.W.; Concept the study and review the manuscript, G.S.; data analysis and write the draft, J.J.; data curation and review the manuscript. All authors have read and agreed to the published version of the manuscript.
Funding
This study was supported by the JSPS projects (Grant No. 16H04933 and Grant No. 16KK0170). The members of the Macroecology Laboratory, Shizuoka University are acknowledged for their support of both field works and laboratory analyses.
Conflicts of Interest
The authors declare no conflict of interest.
References
- Sitch, S.; Smith, B.; Prentice, I.C.; Arneth, A.; Bondeau, A.; Cramer, W.; Kaplan, J.O.; Levis, S.; Lucht, W.; Sykes, M.T.; et al. Evaluation of ecosystem dynamics, plant geography and terrestrial carbon cycling in the LPJ dynamic global vegetation model. Glob. Chang. Biol. 2003, 9, 161–185. [Google Scholar] [CrossRef]
- Canadell, J.G.; Le Quéré, C.; Raupach, M.R.; Field, C.B.; Buitenhuis, E.T.; Ciais, P.; Conway, T.J.; Gillett, N.P.; Houghton, R.A.; Marland, G. Contributions to accelerating atmospheric CO2 growth from economic activity, carbon intensity, and efficiency of natural sinks. Proc. Natl. Acad. Sci. USA 2007, 104, 18866–18870. [Google Scholar] [CrossRef] [Green Version]
- Bonan, G.B.; Lawrence, P.J.; Oleson, K.W.; Levis, S.; Jung, M.; Reichstein, M.; Lawrence, D.M.; Swenson, S.C. Improving canopy processes in the Community Land Model version 4 (CLM4) using global flux fields empirically inferred from FLUXNET data. J. Geophys. Res. 2011, 116, 1–22. [Google Scholar] [CrossRef] [Green Version]
- Farquhar, G.D.; von Caemmerer, S.; Berry, J.A. A biochemical model of photosynthetic CO2 assimilation in leaves of C3 species. Planta 1980, 149, 78–90. [Google Scholar] [CrossRef] [Green Version]
- Domingues, T.F.; Meir, P.; Feldpausch, T.R.; Saiz, G.; Veenendaal, E.M.; Schrodt, F.; Bird, M.; Djagbletey, G.; Hien, F.; Compaore, H.; et al. Co-limitation of photosynthetic capacity by nitrogen and phosphorus in West Africa woodlands. Plant Cell Environ. 2010, 33, 959–980. [Google Scholar] [CrossRef]
- Hikosaka, K.; Nabeshima, E.; Hiura, T. Seasonal changes in the temperature response of photosynthesis in canopy leaves of Quercus crispula in a cool-temperate forest. Tree Physiol. 2007, 27, 1035–1041. [Google Scholar] [CrossRef] [PubMed]
- Santiago, L.S.; Mulkey, S.S. A test of gas exchange measurements on excised canopy branches of ten tropical tree species. Photosynthetica 2003, 41, 343–347. [Google Scholar] [CrossRef]
- Kattge, J.; Knorr, W.; Raddatz, T.; Wirth, C. Quantifying photosynthetic capacity and its relationship to leaf nitrogen content for global-scale terrestrial biosphere models. Glob. Chang. Biol. 2009, 15, 976–991. [Google Scholar] [CrossRef]
- Verheijen, L.M.; Brovkin, V.; Aerts, R.; Bönisch, G.; Cornelissen, J.H.C.; Kattge, J.; Reich, P.B.; Wright, I.J.; Van Bodegom, P.M. Impacts of trait variation through observed trait-climate relationships on performance of an Earth system model: A conceptual analysis. Biogeosciences 2013, 10, 5497–5515. [Google Scholar] [CrossRef] [Green Version]
- Kattge, J.; Knorr, W. Temperature acclimation in a biochemical model of photosynthesis: A reanalysis of data from 36 species. Plant Cell Environ. 2007, 30, 1176–1190. [Google Scholar] [CrossRef] [PubMed]
- Rogers, A. The use and misuse of V c,max in Earth System Models. Photosynth. Res. 2014, 119, 15–29. [Google Scholar] [CrossRef] [PubMed]
- De Kauwe, M.G.; Lin, Y.S.; Wright, I.J.; Medlyn, B.E.; Crous, K.Y.; Ellsworth, D.S.; Maire, V.; Prentice, I.C.; Atkin, O.K.; Rogers, A.; et al. A test of the “one-point method” for estimating maximum carboxylation capacity from field-measured, light-saturated photosynthesis. New Phytol. 2016, 210, 1130–1144. [Google Scholar] [CrossRef] [PubMed] [Green Version]
- Wang, H.; Prentice, I.C.; Cornwell, W.K.; Keenan, T.F.; Davis, T.W.; Ian, J.; Evans, B.J.; Peng, C.; Ryde, N.; Impacts, C.; et al. A universal model for carbon dioxide uptake by plants 2. Nat. Plants 2017. [Google Scholar] [CrossRef] [PubMed] [Green Version]
- Bloomfield, K.J.; Prentice, I.C.; Cernusak, L.A.; Eamus, D.; Medlyn, B.E.; Rumman, R.; Wright, I.J.; Boer, M.M.; Cale, P.; Cleverly, J.; et al. The validity of optimal leaf traits modelled on environmental conditions. New Phytol. 2019, 221, 1409–1423. [Google Scholar] [CrossRef]
- Wilson, K.B.; Baldocchi, D.D.; Hanson, P.J. Leaf age affects the seasonal pattern of photosynthetic capacity and net ecosystem exchange of carbon in a deciduous forest. Plant Cell Environ. 2001, 24, 571–583. [Google Scholar] [CrossRef]
- Wang, Q.; Ho, A.; Tenhunen, J.; Kakubari, Y. Annual and seasonal variations in photosynthetic capacity of Fagus crenata along an elevation gradient in the Naeba Mountains, Japan. Tree Physiol. 2008, 28, 277–285. [Google Scholar] [CrossRef] [Green Version]
- Albert, L.P.; Wu, J.; Prohaska, N.; de Camargo, P.B.; Huxman, T.E.; Tribuzy, E.S.; Ivanov, V.Y.; Oliveira, R.S.; Garcia, S.; Smith, M.N.; et al. Age-dependent leaf physiology and consequences for crown-scale carbon uptake during the dry season in an Amazon evergreen forest. New Phytol. 2018, 219, 870–884. [Google Scholar] [CrossRef] [Green Version]
- Grassi, G.; Vicinelli, E.; Ponti, F.; Cantoni, L.; Magnani, F. Seasonal and interannual variability of photosynthetic capacity in relation to leaf nitrogen in a deciduous forest plantation in northern Italy. Tree Physiol. 2005, 25, 349–360. [Google Scholar] [CrossRef]
- Zheng, T.; Chen, J.; He, L.; Arain, M.A.; Thomas, S.C.; Murphy, J.G.; Geddes, J.A.; Black, T.A. Inverting the maximum carboxylation rate (Vcmax) from the sunlit leaf photosynthesis rate derived from measured light response curves at tower flux sites. Agric. For. Meteorol. 2017, 236, 48–66. [Google Scholar] [CrossRef]
- Walcroft, A.; Le Roux, X.; Diaz-Espejo, A.; Dones, N.; Sinoquet, H. Effects of crown development on leaf irradiance, leaf morphology and photosynthetic capacity in a peach tree. Tree Physiol. 2002, 22, 929–938. [Google Scholar] [CrossRef] [Green Version]
- Meir, P.; Levy, P.E.; Grace, J.; Jarvis, P.G. Photosynthetic parameters from two contrasting woody vegetation types in West Africa. Plant Ecol. 2007, 192, 277–287. [Google Scholar] [CrossRef]
- Vårhammar, A.; Wallin, G.; Mclean, C.M.; Dusenge, M.E.; Medlyn, B.E.; Hasper, T.B.; Nsabimana, D.; Uddling, J. Photosynthetic temperature responses of tree species in Rwanda: Evidence of pronounced negative effects of high temperature in montane rainforest climax species. New Phytol. 2015, 206, 1000–1012. [Google Scholar] [CrossRef] [PubMed]
- Croft, H.; Chen, J.M.; Zhang, Y.; Simic, A. Modelling leaf chlorophyll content in broadleaf and needle leaf canopies from ground, CASI, Landsat TM 5 and MERIS reflectance data. Remote Sens. Environ. 2013, 133, 128–140. [Google Scholar] [CrossRef]
- Reich, P.B.; Hobbie, S.E.; Lee, T.; Ellsworth, D.S.; West, J.B.; Tilman, D.; Knops, J.M.H.; Naeem, S.; Trost, J. Nitrogen limitation constrains sustainability of ecosystem response to CO2. Nature 2006, 440, 922–925. [Google Scholar] [CrossRef] [PubMed]
- Cernusak, L.A.; Hutley, L.B.; Beringer, J.; Holtum, J.A.M.; Turner, B.L. Photosynthetic physiology of eucalypts along a sub-continental rainfall gradient in northern Australia. Agric. For. Meteorol. 2011, 151, 1462–1470. [Google Scholar] [CrossRef]
- Baldocchi, D.D.; Harley, P.C. Scaling carbon dioxide and water vapour exchange from leaf to canopy in a deciduous forest. II. Model testing and application. Plant Cell Environ. 1995, 18, 1157–1173. [Google Scholar] [CrossRef]
- Meir, P.; Kruijt, B.; Broadmeadow, M.; Barbosa, E.; Kull, O.; Carswell, F.; Nobre, A.; Jarvis, P.G. Acclimation of photosynthetic capacity to irradiance in tree canopies in relation to leaf nitrogen concentration and leaf mass per unit area. Plant Cell Environ. 2002, 25, 343–357. [Google Scholar] [CrossRef]
- Domingues, T.F.; Berry, J.A.; Martinelli, L.A.; Ometto, J.P.H.B.; Ehleringer, J.R. Parameterization of canopy structure and leaf-level gas exchange for an Eastern Amazonian tropical rain forest (Tapajós national forest, Pará, Brazil). Earth Interact. 2005, 9. [Google Scholar] [CrossRef] [Green Version]
- van de Weg, M.J.; Meir, P.; Grace, J.; Ramos, G.D. Photosynthetic parameters, dark respiration and leaf traits in the canopy of a Peruvian tropical montane cloud forest. Oecologia 2012, 168, 23–34. [Google Scholar] [CrossRef]
- Dusenge, M.E.; Wallin, G.; Gårdesten, J.; Niyonzima, F.; Adolfsson, L.; Nsabimana, D.; Uddling, J. Photosynthetic capacity of tropical montane tree species in relation to leaf nutrients, successional strategy and growth temperature. Oecologia 2015, 177, 1183–1194. [Google Scholar] [CrossRef]
- Ellsworth, D.S.; Reich, P.B.; Naumburg, E.S.; Koch, G.W.; Kubiske, M.E.; Smith, S.D. Photosynthesis, carboxylation and leaf nitrogen responses of 16 species to elevated pCO2 across four free-air CO2 enrichment experiments in forest, grassland and desert. Glob. Chang. Biol. 2004, 10, 2121–2138. [Google Scholar] [CrossRef] [Green Version]
- Misson, L.; Tu, K.; Boniello, R.A.; Goldstein, A.H. Seasonally of photosynthetic parameters in a multi-specific and vertically complex forest ecosystem in the Sierra Nevada of California. Tree Physiol. 2006, 26, 729–741. [Google Scholar] [CrossRef] [PubMed]
- Braune, H.; Müller, J.; Diepenbrock, W. Integrating effects of leaf nitrogen, age, rank, and growth temperature into the photosynthesis-stomatal conductance model LEAFC3-N parameterised for barley (Hordeum vulgare L.). Ecol. Model. 2009, 220, 1599–1612. [Google Scholar] [CrossRef]
- Riccardi, M.; Mele, G.; Pulvento, C.; Lavini, A.; D’Andria, R.; Jacobsen, S.E. Non-destructive evaluation of chlorophyll content in quinoa and amaranth leaves by simple and multiple regression analysis of RGB image components. Photosynth. Res. 2014, 120, 263–272. [Google Scholar] [CrossRef] [PubMed]
- Croft, H.; Chen, J.M.; Luo, X.; Bartlett, P.; Chen, B.; Staebler, R.M. Leaf chlorophyll content as a proxy for leaf photosynthetic capacity. Glob. Chang. Biol. 2017, 23, 3513–3524. [Google Scholar] [CrossRef] [PubMed]
- Daughtry, C.S.T.; Walthall, C.L.; Kim, M.S.; De Colstoun, E.B.; McMurtrey Iii, J.E. Estimating Corn Leaf Chlorophyll Concentration from Leaf and Canopy Reflectance. Remote Sens. Environ. 2000, 74, 229–239. [Google Scholar] [CrossRef]
- Filella, I.; Serrano, L.; Serra, J.; Peñuelas, J. Evaluating Wheat Nitrogen Status with Canopy Reflectance Indices and Discriminant Analysis. Crop Sci. 1995, 35, 1400–1450. [Google Scholar] [CrossRef]
- Niinemets, Ü.; Kull, O.; Tenhunen, J.D. Within-canopy variation in the rate of development of photosynthetic capacity is proportional to integrated quantum flux density in temperate deciduous trees. Plant Cell Environ. 2004, 27, 293–313. [Google Scholar] [CrossRef]
- Díaz-Espejo, A.; Walcroft, A.S.; Fernández, J.E.; Hafidi, B.; Palomo, M.J.; Girón, I.F. Modeling photosynthesis in olive leaves under drought conditions. Tree Physiol. 2006, 26, 1445–1456. [Google Scholar] [CrossRef] [Green Version]
- Bloomfield, K.J.; Domingues, T.F.; Saiz, G.; Bird, M.I.; Crayn, D.M.; Ford, A.; Metcalfe, D.J.; Farquhar, G.D.; Lloyd, J. Contrasting photosynthetic characteristics of forest vs. savanna species (Far North Queensland, Australia). Biogeosciences 2014, 11, 7331–7347. [Google Scholar] [CrossRef] [Green Version]
- Aranda, X.; Agustí, C.; Joffre, R.; Fleck, I. Photosynthesis, growth and structural characteristics of holm oak resprouts originated from plants grown under elevated CO2. Physiol. Plant. 2006, 128, 302–312. [Google Scholar] [CrossRef]
- Poorter, H.; Niinemets, Ü.; Poorter, L.; Wright, I.J.; Villar, R. Causes and consequences of variation in leaf mass per area (LMA): A meta-analysis. New Phytol. 2009, 182, 565–588. [Google Scholar] [CrossRef] [PubMed]
- Walker, A.P.; Beckerman, A.P.; Gu, L.; Kattge, J.; Cernusak, L.A.; Domingues, T.F.; Scales, J.C.; Wohlfahrt, G.; Wullschleger, S.D.; Woodward, F.I. The relationship of leaf photosynthetic traits—Vcmax and Jmax—to leaf nitrogen, leaf phosphorus, and specific leaf area: A meta-analysis and modeling study. Ecol. Evol. 2014, 4, 3218–3235. [Google Scholar] [CrossRef] [PubMed] [Green Version]
- Bahar, N.H.A.; Ishida, F.Y.; Weerasinghe, L.K.; Guerrieri, R.; O’Sullivan, O.S.; Bloomfield, K.J.; Asner, G.P.; Martin, R.E.; Lloyd, J.; Malhi, Y.; et al. Leaf-level photosynthetic capacity in lowland Amazonian and high-elevation Andean tropical moist forests of Peru. New Phytol. 2017, 214, 1002–1018. [Google Scholar] [CrossRef] [PubMed]
- Duursma, R.A.; Marshall, J.D.; Nippert, J.B.; Chambers, C.C.; Robinson, A.P. Estimating leaf-level parameters for ecosystem process models: A study in mixed conifer canopies on complex terrain. Tree Physiol. 2005, 25, 1347–1359. [Google Scholar] [CrossRef] [PubMed] [Green Version]
- Keenan, T.F.; Niinemets, Ü. Global leaf trait estimates biased due to plasticity in the shade. Nat. Plants 2016, 3, 1–6. [Google Scholar] [CrossRef] [Green Version]
- He, L.; Chen, J.M.; Gonsamo, A.; Luo, X.; Wang, R.; Liu, Y.; Liu, R. Changes in the Shadow: The Shifting Role of Shaded Leaves in Global Carbon and Water Cycles Under Climate Change. Geophys. Res. Lett. 2018, 45, 5052–5061. [Google Scholar] [CrossRef] [Green Version]
- Chen, J.; Liu, J.; Cihlar, J.; Goulden, M. Daily canopy photosynthesis model through temporal and spatial scaling for remote sensing applications. Ecol. Model. 1999, 124, 99–119. [Google Scholar] [CrossRef] [Green Version]
- Chen, J.M.; Mo, G.; Pisek, J.; Liu, J.; Deng, F.; Ishizawa, M.; Chan, D. Effects of foliage clumping on the estimation of global terrestrial gross primary productivity. Global Biogeochem. Cycles 2012, 26, 1–18. [Google Scholar] [CrossRef]
- Chen, J.M.; Croft, H.; Zheng, T. Exploring the feasibility of global mapping of the leaf carboxylation rate. Int. Geosci. Remote Sens. Symp. 2016, 2016, 1703–1706. [Google Scholar]
- Dai, Y.; Dickinson, R.E.; Wang, Y.P. A two-big-leaf model for canopy temperature, photosynthesis, and stomatal conductance. J. Clim. 2004, 17, 2281–2299. [Google Scholar] [CrossRef]
- Luo, X.; Chen, J.M.; Liu, J.; Black, T.A.; Croft, H.; Staebler, R.; He, L.; Arain, M.A.; Chen, B.; Mo, G.; et al. Comparison of Big-Leaf, Two-Big-Leaf, and Two-Leaf Upscaling Schemes for Evapotranspiration Estimation Using Coupled Carbon-Water Modeling. J. Geophys. Res. Biogeosci. 2018, 123, 207–225. [Google Scholar] [CrossRef]
- Sonobe, R.; Wang, Q. Assessing hyperspectral indices for tracing chlorophyll fluorescence parameters in deciduous forests. J. Environ. Manag. 2018, 227, 172–180. [Google Scholar] [CrossRef] [PubMed]
- Sonobe, R.; Wang, Q. Towards a universal hyperspectral index to assess chlorophyll content in deciduous forests. Remote Sens. 2017, 9, 191. [Google Scholar] [CrossRef] [Green Version]
- Duursma, R.A. Plantecophys—An R package for analysing and modelling leaf gas exchange data. PLoS ONE 2015, 10, e0143346. [Google Scholar] [CrossRef]
- Porra, R.J. Recent progress in porphyrin and chlorophyll biosynthesis. Photochem. Photobiol. 1997, 65, 492–516. [Google Scholar] [CrossRef]
- Tadesse, T.; Singh, H.; Weyessa, B. Correlation and path coefficient analysis among seed yield traits and oil content in Ethiopian linseed germplasm. Int. J. Sustain. Crop Prod. 2009, 4, 8–16. [Google Scholar]
- Akohoue, F.; Achigan-Dako, E.G.; Coulibaly, M.; Sibiya, J. Correlations, path coefficient analysis and phenotypic diversity of a West African germplasm of Kersting’s groundnut [Macrotyloma geocarpum (Harms) Maréchal & Baudet]. Genet. Resour. Crop Evol. 2019, 66, 1825–1842. [Google Scholar]
- Ramos, J.C.; Bertol, I.; Bandeira, D.H.; Barbosa, F.T.; Zangiski, F. Path coefficient analysis, a different approach to identify soil quality indicators. Rev. Bras. Eng. Agric. e Ambient. 2019, 23, 545–551. [Google Scholar] [CrossRef] [Green Version]
- Wilson, K.B.; Baldocchi, D.D.; Hanson, P.J. Spatial and seasonal variability of photosynthetic parameters and their relationship to leaf nitrogen in a deciduous forest. Tree Physiol. 2000, 20, 565–578. [Google Scholar] [CrossRef] [Green Version]
- Wang, Q.; Tenhunen, J.; Falge, E.; Bernhofer, C.H.; Granier, A.; Vesala, T. Simulation and scaling of temporal variation in gross primary production for coniferous and deciduous temperate forests. Glob. Chang. Biol. 2004, 10, 37–51. [Google Scholar] [CrossRef]
- Xu, L.; Baldocchi, D.D. Seasonal trends in photosynthetic parameters and stomatal conductance of blue oak (Quercus douglasii) under prolonged summer drought and high temperature. Tree Physiol. 2003, 23, 865–877. [Google Scholar] [CrossRef] [PubMed] [Green Version]
- Muraoka, H.; Koizumi, H. Photosynthetic and structural characteristics of canopy and shrub trees in a cool-temperate deciduous broadleaved forest: Implication to the ecosystem carbon gain. Agric. For. Meteorol. 2005, 134, 39–59. [Google Scholar] [CrossRef]
- Noda, H.M.; Muraoka, H.; Nasahara, K.N.; Saigusa, N.; Murayama, S.; Koizumi, H. Phenology of leaf morphological, photosynthetic, and nitrogen use characteristics of canopy trees in a cool-temperate deciduous broadleaf forest at Takayama, central Japan. Ecol. Res. 2015, 30, 247–266. [Google Scholar] [CrossRef]
- Coste, S.; Roggy, J.C.; Imbert, P.; Born, C.; Bonal, D.; Dreyer, E. Leaf photosynthetic traits of 14 tropical rain forest species in relation to leaf nitrogen concentration and shade tolerance. Tree Physiol. 2005, 25, 1127–1137. [Google Scholar] [CrossRef] [Green Version]
- Wright, I.J.; Westoby, M.; Baruch, Z.; Bongers, F.; Cavender-Bares, J.; Chapin, T.; Diemer, M.; Reich, P.B.; Ackerly, D.D.; Flexas, J.; et al. The worldwide leaf economics spectrum. Nature 2004, 428, 821–827. [Google Scholar] [CrossRef]
- Hikosaka, K. Interspecific difference in the photosynthesis–nitrogen relationship: Patterns, physiological causes, and ecological importance. J. Plant Res. 2004, 117, 481–494. [Google Scholar] [CrossRef]
- Grassi, G.; Bagnaresi, U. Foliar morphological and physiological plasticity in Picea abies and Abies alba saplings along a natural light gradient. Tree Physiol. 2001, 21, 959–967. [Google Scholar] [CrossRef] [Green Version]
- Han, Q.; Kawasaki, T.; Nakano, T.; Chiba, Y. Leaf-age effects on seasonal variability in photosynthetic parameters and its relationships with leaf mass per area and leaf nitrogen concentration within a Pinus densiflora crown. Tree Physiol. 2008, 28, 551–558. [Google Scholar] [CrossRef] [Green Version]
- Mashilo, J.; Shimelis, H.; Odindo, A. Correlation and path coefficient analyses of qualitative and quantitative traits in selected bottle gourd landraces. Acta Agric. Scand. Sect. B Soil Plant Sci. 2016, 66, 558–569. [Google Scholar] [CrossRef]
- Whitehead, D.; Walcroft, A.S.; Scott, N.A.; Townsend, J.A.; Trotter, C.M.; Rogers, G.N.D. Characteristics of photosynthesis and stomatal conductance in the shrubland species mānuka (Leptospermum scoparium) and kānuka (Kunzea ericoides) for the estimation of annual canopy carbon uptake. Tree Physiol. 2004, 24, 795–804. [Google Scholar] [CrossRef] [PubMed] [Green Version]
- Evans, J.R.; Seemann, J.R. The allocation of protein nitrogen in the photosynthetic apparatus: Costs, consequences, and control. Photosynthesis 1989, 8, 183–205. [Google Scholar]
- Anteb, N.P.R.; Hernandez, R.; Medina, E.M. The Photosynthetic Capacity and Leaf Nitrogen Concentration as Related to Light Regime in Shade Leaves of a Montane Tropical Forest Tree, Tetrochidium rubrivenium. Funct. Ecol. 1996, 10, 491. [Google Scholar] [CrossRef]
- Novriyanti, E.; Watanabe, M.; Makoto, K.; Takeda, T.; Hashidoko, Y.; Koike, T. Photosynthetic nitrogen and water use efficiency of acacia and eucalypt seedlings as afforestation species. Photosynthetica 2012, 50, 273–281. [Google Scholar] [CrossRef] [Green Version]
- Prieto, J.A.; Louarn, G.; Perez Peña, J.; Ojeda, H.; Simonneau, T.; Lebon, E. A leaf gas exchange model that accounts for intra-canopy variability by considering leaf nitrogen content and local acclimation to radiation in grapevine (Vitis vinifera L.). Plant Cell Environ. 2012, 35, 1313–1328. [Google Scholar] [CrossRef]
- Schultz, H.R. Extension of a Farquhar model for limitations of leaf photosynthesis induced by light environment, phenology and leaf age in grapevines (Vitis vinifera L. cvv. White Riesling and Zinfandel). Funct. Plant Biol. 2003, 30, 673–687. [Google Scholar] [CrossRef]
- Ollinger, S.V.; Reich, P.B.; Frolking, S.; Lepine, L.C.; Hollinger, D.Y.; Richardson, A.D. Nitrogen cycling, forest canopy reflectance, and emergent properties of ecosystems. Proc. Natl. Acad. Sci. USA 2013, 110, E2437. [Google Scholar] [CrossRef] [Green Version]
- Knyazikhin, Y.; Schull, M.A.; Stenberg, P.; Mõttus, M.; Rautiainen, M.; Yang, Y.; Marshak, A.; Carmona, P.L.; Kaufmann, R.K.; Lewis, P.; et al. Hyperspectral remote sensing of foliar nitrogen content. Proc. Natl. Acad. Sci. USA 2013, 110, E185–E192. [Google Scholar] [CrossRef] [Green Version]
- Townsend, P.A.; Serbin, S.P.; Kruger, E.L.; Gamon, J.A. Disentangling the contribution of biological and physical properties of leaves and canopies in imaging spectroscopy data. Proc. Natl. Acad. Sci. USA 2013, 110, E1074. [Google Scholar] [CrossRef] [Green Version]
- Yang, H.; Yang, X.; Heskel, M.; Sun, S.; Tang, J. Seasonal variations of leaf and canopy properties tracked by ground-based NDVI imagery in a temperate forest. Sci. Rep. 2017, 7, 1–10. [Google Scholar] [CrossRef]
- Mõttus, M.; Takala, T.L.H.; Stenberg, P.; Knyazikhin, Y.; Yang, B.; Nilson, T. Diffuse sky radiation influences the relationship between canopy PRI and shadow fraction. ISPRS J. Photogramm. Remote Sens. 2015, 105, 54–60. [Google Scholar] [CrossRef] [Green Version]
- Domingues, T.F.; Martinelli, L.A.; Ehleringer, J.R. Ecophysiological traits of plant functional groups in forest and pasture ecosystems from eastern Amazônia, Brazil. Plant Ecol. 2007, 193, 101–112. [Google Scholar] [CrossRef]
Figure 1.
The location of the tower site used in this study: (a) inside Japan; (b) inside Shizuoka Prefecture, Japan. (Boundary file was obtained from GADM - https://gadm.org/index.html).
Figure 1.
The location of the tower site used in this study: (a) inside Japan; (b) inside Shizuoka Prefecture, Japan. (Boundary file was obtained from GADM - https://gadm.org/index.html).

Figure 2.
Changes in Vcmax of sunlit (a) and shaded (b) leaves from DOY (Day of Year) 168 to DOY 258 in 2015, 2017, and 2018.
Figure 2.
Changes in Vcmax of sunlit (a) and shaded (b) leaves from DOY (Day of Year) 168 to DOY 258 in 2015, 2017, and 2018.

Figure 3.
Interannual variations in the maximum carboxylation rate (Vcmax) at the study site for sunlit leaves from 2014 to 2019 and for shaded leaves from 2014 to 2018. Mean values and standard errors were used to show the trends.
Figure 3.
Interannual variations in the maximum carboxylation rate (Vcmax) at the study site for sunlit leaves from 2014 to 2019 and for shaded leaves from 2014 to 2018. Mean values and standard errors were used to show the trends.

Figure 4.
Relationships of Vcmax with Narea (a), Nmass (b), Chl (c), and LMA (d) for sunlit leaves (hollow triangles) and shaded leaves (solid triangles). Vcmax, maximum carboxylation rate; Narea, leaf nitrogen concentration per unit area; Nmas, leaf nitrogen concentration per unit mass; Chl, chlorophyll content; LMA, leaf mass per area. Solid lines indicate significant results.

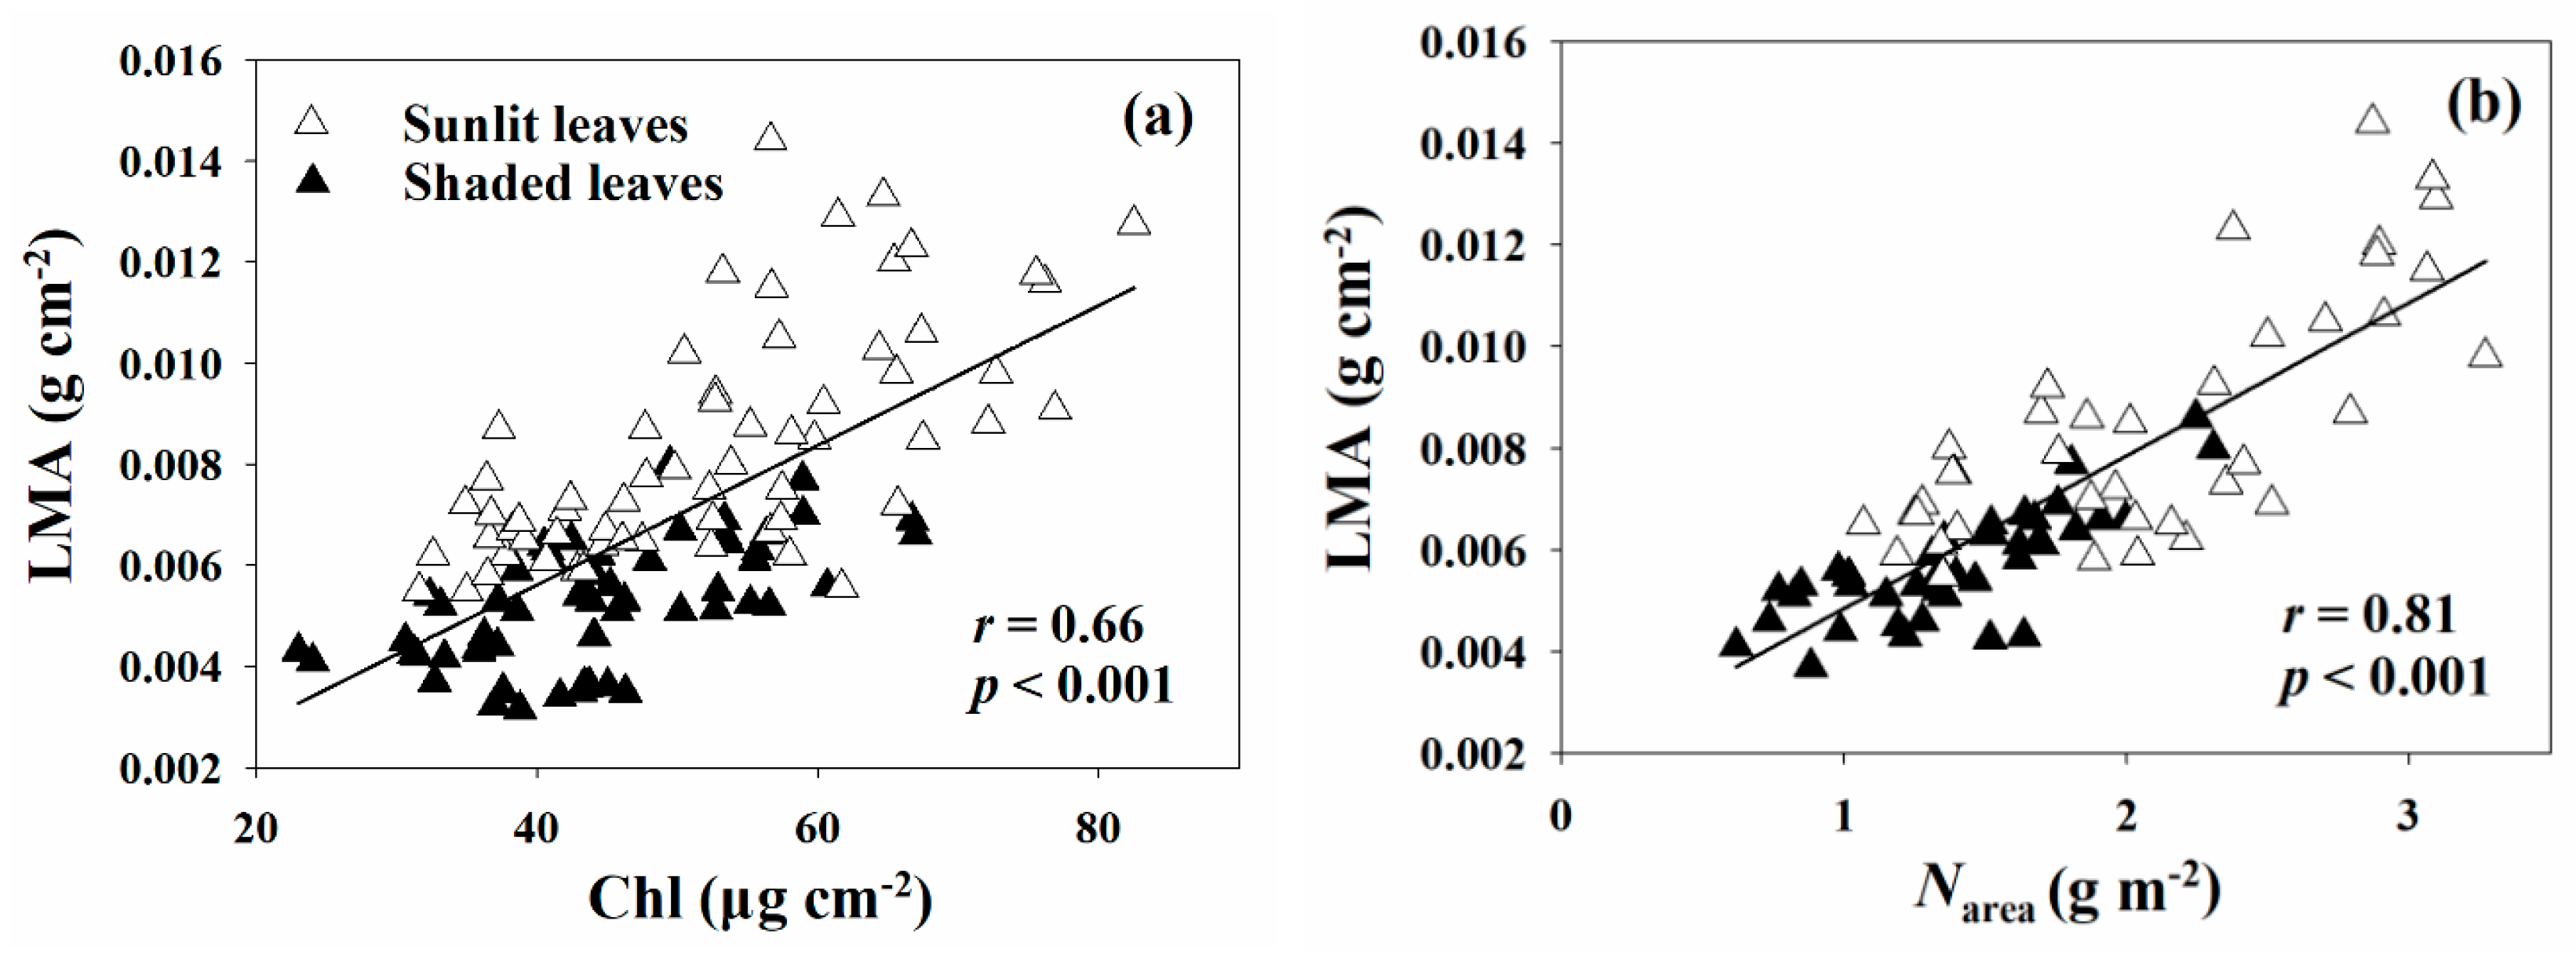
Figure 5.
Relationships of LMA with Chl (a) and Narea (b) for sunlit and shaded leaves. LMA, leaf mass per area; Chl, chlorophyll content; Narea, leaf nitrogen concentration per unit area. Solid lines indicate significant results.
Figure 5.
Relationships of LMA with Chl (a) and Narea (b) for sunlit and shaded leaves. LMA, leaf mass per area; Chl, chlorophyll content; Narea, leaf nitrogen concentration per unit area. Solid lines indicate significant results.


Table 1.
Direct and indirect effects of leaf biochemistry and structure on Vcmax in sunlit and shaded leaves.
Table 1.
Direct and indirect effects of leaf biochemistry and structure on Vcmax in sunlit and shaded leaves.
| EWT | Chl | Narea | Carea | LMA | n | |
|---|---|---|---|---|---|---|
| EWT-total | −0.164 | 0.073 | 0.221 | −0.077 | 0.267 | 124 |
| EWT-sun | −0.037 | 0.182 | 0.331 | −0.274 | 0.038 | 63 |
| EWT-sh | −0.197 | 0.019 | 0.026 | −0.045 | 0.238 | 61 |
| Chl-total | −0.072 | 0.167 | 0.206 | −0.079 | 0.238 | 170 |
| Chl-sun | −0.018 | 0.379 | 0.226 | −0.252 | 0.035 | 88 |
| Chl-sh | −0.018 | 0.208 | 0.055 | −0.138 | 0.363 | 82 |
| Narea-total | −0.102 | 0.097 | 0.356 | −0.103 | 0.293 | 79 |
| Narea-sun | −0.024 | 0.170 | 0.502 | −0.307 | 0.039 | 39 |
| Narea-sh | −0.051 | 0.117 | 0.099 | −0.183 | 0.469 | 40 |
| Carea-total | −0.110 | 0.115 | 0.320 | −0.115 | 0.339 | 79 |
| Carea-sun | −0.028 | 0.261 | 0.422 | −0.365 | 0.050 | 39 |
| Carea-sh | −0.041 | 0.135 | 0.085 | −0.213 | 0.544 | 40 |
| LMA-total | −0.122 | 0.110 | 0.288 | −0.108 | 0.361 | 124 |
| LMA-sun | −0.026 | 0.250 | 0.366 | −0.343 | 0.053 | 63 |
| LMA-sh | −0.075 | 0.121 | 0.074 | −0.185 | 0.625 | 61 |
EWT, equivalent water thickness; Chl, chlorophyll content; Narea, leaf nitrogen concentration per unit area; Carea, leaf carbon concentration per unit area; LMA, leaf mass per area; Vcmax, maximum carboxylation rate. Bold diagonal values indicate direct effects; n is the number of leaf samples.
© 2020 by the authors. Licensee MDPI, Basel, Switzerland. This article is an open access article distributed under the terms and conditions of the Creative Commons Attribution (CC BY) license (http://creativecommons.org/licenses/by/4.0/).
Share and Cite
MDPI and ACS Style
Song, G.; Wang, Q.; Jin, J. Leaf Photosynthetic Capacity of Sunlit and Shaded Mature Leaves in a Deciduous Forest. Forests 2020, 11, 318. https://0-doi-org.brum.beds.ac.uk/10.3390/f11030318
AMA Style
Song G, Wang Q, Jin J. Leaf Photosynthetic Capacity of Sunlit and Shaded Mature Leaves in a Deciduous Forest. Forests. 2020; 11(3):318. https://0-doi-org.brum.beds.ac.uk/10.3390/f11030318
Chicago/Turabian StyleSong, Guangman, Quan Wang, and Jia Jin. 2020. "Leaf Photosynthetic Capacity of Sunlit and Shaded Mature Leaves in a Deciduous Forest" Forests 11, no. 3: 318. https://0-doi-org.brum.beds.ac.uk/10.3390/f11030318
Note that from the first issue of 2016, this journal uses article numbers instead of page numbers. See further details here.