Article

Climatic, Edaphic and Biotic Controls over Soil δ13C and δ15N in Temperate Grasslands

1
University of Chinese Academy of Sciences, Beijing 100049, China
2
Key Laboratory of Ecosystem Network Observation and Modeling, Institute of Geographic Sciences and Natural Resources Research, Chinese Academy of Sciences, 11A, Datun Road, Chaoyang District, Beijing 100101, China
3
CAS Center for Excellence in Tibetan Plateau Earth Sciences, Chinese Academy of Sciences, Beijing 100101, China
4
Department of Environmental Chemistry, University of Kassel, Nordbahnhofstrasse 1a, 37213 Witzenhausen, Germany
5
Institute of International Rivers and Eco-Security, Yunnan University, Kunming 650500, China
6
Ministry of Education Key Laboratory for Biodiversity Science and Ecological Engineering, Coastal Ecosystems Research Station of the Yangtze River Estuary, Shanghai Institute of Eco-Chongming, School of Life Sciences, Fudan University, 2005 Songhu Road, Shanghai 200438, China
7
Yanshan Eco-Environmental Observatory, Chinese Academy of Sciences, Beijing 101408, China
*
Authors to whom correspondence should be addressed.
Submission received: 17 March 2020 / Revised: 6 April 2020 / Accepted: 8 April 2020 / Published: 10 April 2020
(This article belongs to the Special Issue Spatial Heterogeneity of Forest-Steppes)

Abstract

:
Soils δ13C and δ15N are now regarded as useful indicators of nitrogen (N) status and dynamics of soil organic carbon (SOC). Numerous studies have explored the effects of various factors on soils δ13C and δ15N in terrestrial ecosystems on different scales, but it remains unclear how co-varying climatic, edaphic and biotic factors independently contribute to the variation in soil δ13C and δ15N in temperate grasslands on a large scale. To answer the above question, a large-scale soil collection was carried out along a vegetation transect across the temperate grasslands of Inner Mongolia. We found that mean annual precipitation (MAP) and mean annual temperature (MAT) do not correlate with soil δ15N along the transect, while soil δ13C linearly decreased with MAP and MAT. Soil δ15N logarithmically increased with concentrations of SOC, total N and total P. By comparison, soil δ13C linearly decreased with SOC, total N and total P. Soil δ15N logarithmically increased with microbial biomass C and microbial biomass N, while soil δ13C linearly decreased with microbial biomass C and microbial biomass N. Plant belowground biomass linearly increased with soil δ15N but decreased with soil δ13C. Soil δ15N decreased with soil δ13C along the transect. Multiple linear regressions showed that biotic and edaphic factors such as microbial biomass C and total N exert more effect on soil δ15N, whereas climatic and edaphic factors such as MAT and total P have more impact on soil δ13C. These findings show that soil C and N cycles in temperate grasslands are, to some extent, decoupled and dominantly controlled by different factors. Further investigations should focus on those ecological processes leading to decoupling of C and N cycles in temperate grassland soils.

1. Introduction

Soil organic matter (SOM) consists of a heterogeneous mixture of substances in various stages of decay, mainly including plant and animal residues, microbial necromass, and new substances synthesized and released by microbes into the soil [1,2]. The global SOM pool in the surface meter stores approximately 1500 Pg carbon (C) [3] and 95 Pg nitrogen (N) [4] as well as other essential elements for plants and microbes. Therefore, SOM is critical for soil quality and ecosystem dynamics [5,6]. At the same time, SOM plays an important role in global climate change because soils could act as a potential sink for C [7,8]. Therefore, a large number of studies have investigated the effects of various climatic, edaphic and biotic factors on the dynamics of C and N in soils to better understand their turnover and SOM destabilization as well as their role in climate change [9,10,11,12,13].
It is difficult to explore the dynamics of SOM by direct measurement of the change in C and N stocks due to their large size [14]. With the rapid development of isotope ratio mass spectrometry [15], the analysis of stable isotope composition of soil C (δ13C) and N (δ15N) has become a powerful tool to explore the stability and dynamics of SOM [12,16,17,18] and soil development [12,19]. Soils δ13C and δ15N are ideally suited to provide wider insights into C and N cycles in soil ecosystems because they are primarily based on either an isotopic fractionation during microbial degradation and transformation (e.g., ammonification, nitrification and denitrification) or the preferential decomposition of the substrates depleted in 13C and 15N [20]. Generally, older and more microbially-processed SOM is enriched in 13C and 15N compared to less-decomposed substrates [18,21].
Additionally, variation in δ13C and δ15N content of SOM in natural ecosystems is largely controlled by the input of new plant residues and overall isotopic fractionation during microbial decomposition [18]. The signature of δ13C and δ15N in SOM is closely related to vegetation changes and microbial decomposition as well as anthropogenic N input [22,23,24]. Moreover, climatic and edaphic factors, including temperature, precipitation, pH, and contents of soil C, N and phosphorus (P) as well as soil texture, greatly impact δ13C and δ15N content of SOM [13,25,26]. As a result, the signature of 13C and 15N in SOM can be used as a valid proxy for SOM dynamics and provide integrated information about the ecosystem N cycling [9,27,28,29,30,31,32].
To understand the factors controlling δ13C and δ15N in SOM, numerous studies have investigated the patterns of soil δ13C and δ15N on regional and global scales [9,10,11,14,31,33,34]. It has been shown that climate controls forest soil δ13C in the southern Appalachian Mountains [13]. Climate can likewise have an effect on soil δ15N, with values increasing in response to rain events, which enhance the processes that cause the loss of N but discriminate against 15N loss [35]. Further evidence shows that aridity can nonlinearly alter soil δ15N values in arid and semi-arid grasslands [34]. Consequently, soil δ15N values along precipitation gradients can reflect the pattern of N losses relative to turnover [36,37,38]. On a global scale, soil δ15N converges across climate and latitudinal gradients [11]. In addition to climatic factors, substrate age, soil texture and litter input as well as land-use change also can affect soil δ13C and δ15N [25,31,39,40]. Nonetheless, the controls on C and N isotope ratios in soil still remain unclear [27].
Grasslands are an interesting ecosystem to study in this context because they store large amounts of C and N in soil [41,42] and have great potential to affect CO2 concentrations in the atmosphere. Additionally, grasslands are widely distributed over the world and account for 26% of the ice-free land [43]. As a result, grassland soils play an important role in the context of global climate change and regulate biogeochemical cycles [44]. Among the various types, temperate grasslands are widely distributed across the Eurasian continent and form the Eurasian steppe [45]. Recent studies of temperate grasslands showed that climatic variables control approximately 50% of the variation in soil δ15N along an east–west transect in Northern China. Soil δ15N was found to decrease with increasing mean annual precipitation (MAP) and mean annual temperature (MAT) [10]. Further studies demonstrated that the aridity can nonlinearly alter soil δ15N values [34]. Nonetheless, it remains unclear how co-varying climatic, edaphic and biotic factors control soil δ13C and δ15N in such temperate grasslands. We hypothesize that distinct factors control the soil δ13C versus δ15N signature: (1) biotic factors such as microbial biomass C (MBC) and N (MBN) as well as plant belowground biomass could exert more impact on soil 15N than edaphic and climatic factors since 15N fractionation is largely controlled by biological processes [11]; and (2) climatic and edaphic factors have more effects on soil δ13C than biological factors because water can strongly affect 13C in plant tissues [46]. To test the above hypotheses, we collected soil and plant samples from temperate meadow steppes, temperate steppes and temperate deserts along a vegetation transect in Inner Mongolia.

2. Materials and Methods

2.1. Study Sites

This study was conducted along a 1280 km transect across Inner Mongolia from west to east in northern China (Table 1). The longitude of the transect ranged from 107°15′ to 122°17′ and the latitude ranged from 38°44′ to 50°12′. The region was characterized predominantly by an arid and semi-arid continental climate. MAP ranged from 154 to 517 mm and MAT ranged from 1 to 4 °C. The MAP and MAT of each sampling site were calculated from the NMIC (China National Meteorological Information Center). The main vegetation types across this transect were temperate meadow steppe, temperate steppe, and temperate desert. All the soils were classified as chestnut soil, corresponding to Calcicorthic Aridisol according to USDA Soil Taxonomy [47].
In 2014, a field campaign was conducted to collect soil and plant samples along this transect. In total, 22 sampling sites including six temperate meadow steppes, nine temperate steppes and seven temperate deserts were selected. At each site, four plots (1 m × 1 m) were randomly selected for soil and plant sampling. The aboveground plant parts were harvested for the estimation of aboveground net primary production (ANPP). Additionally, five soil cores (2.5 cm diameter, 5 cm depth) were collected randomly using a soil corer from each plot and mixed thoroughly as one composite sample. Living roots were carefully collected from the soil and washed by water and then dried for the estimation of belowground biomass. Soil samples were sieved through a 2.0 mm sieve and then separated into two parts: one was stored in a plastic bag and frozen at −20 °C for measurement of soil moisture, MBC and MBN, and the other was air-dried for measurements under natural conditions.

2.2. Analysis of Soil δ13C and δ15N

Dried soil samples were ground into powder using a ball mill (Retsch MM2; Retsch, Haan, Germany). Approximately 1 g soil was put into 5 mL centrifuge tube. To remove carbonate, 3 mL of 0.5 M HCl was added to the tubes overnight. Afterwards, samples were freeze-dried and washed with H2O until a pH of 7.0 was reached. The soil was weighed into tin capsules for analysis of total N (Nt), soil organic C (SOC), δ13C and δ15N by continuous flow gas isotope ratio mass spectrometry (isoprime precisION, Elementar, Germany). The isotope results of soil C or N were calculated as follows: δ13C/δ15N (‰) = (Rsample/Rstandard − 1) * 1000, where Rsample and Rstandard are the ratios of 13C/12C or 15N/14N in the sample and standard. The standards for δ13C and δ15N are Pee Dee Belemnite and atmospheric molecular N, respectively. The standard deviation of repeated measurements of laboratory standards was ±0.15‰ for these isotope analyses.

2.3. Analysis of Soil Properties and Microbial Biomass

Total phosphorus (Pt) in the soil was measured using optical emission spectrometry (Optima 5300DV; PerkinElmer, Shelton, USA) after nitric-perchloric acid digestion [48,49]. Soil pH was measured by a dry soil-water ratio of 1:2. Soil MBC and MBN were determined using the chloroform fumigation–extraction method [50,51]. Briefly, 10 g fresh soil was extracted with 24 mL of 0.5 M K2SO4. An additional 10 g soil was fumigated with ethanol-free chloroform for 24 h and then extracted again in the same manner. All extracts were shaken for 1 h and filtered through 5895 paper. Total organic C and N concentrations in the K2SO4 extracts were measured with a Dimatec-100 TOC/TIC analyzer (Liqui TOCII, Elementar, Germany).

2.4. Calculations and Statistics

MBC and MBN were calculated as the difference between the total C or total N content in fumigated and non-fumigated soils, divided by a kEC factor of 0.45 [52] and a kEN factor of 0.54, respectively [50,51].
The standard errors of means are presented in figures and tables as a variability parameter. The normality of soil δ15N and δ13C, as well as, other edaphic and biological data were tested. A one-way analysis of variance was performed with SPSS 21.0 (SPSS Inc., Chicago, IL, USA) to evaluate the effects of grassland type on soil δ15N and δ13C values. Correlations between soil δ15N and δ13C and climatic (MAP, MAT), edaphic (SOC, Nt, Pt) and biotic factors (MBC, MBN and belowground biomass) were analyzed with SPSS 21.0 (SPSS Inc., Chicago, IL, USA). To identify how all the factors affect soils δ15N and δ13C, we conducted a data analysis in two steps using R version 3.5.2 (R Development Core Team 2019). The first step was to generate a series of all possible multiple linear models based on the information-theoretic method. To avoid overfitting our models, a Pearson correlation test was conducted to identify and remove highly correlated factors (r > 0.6 or < −0.6, Table 2) within one model. The second step was to calculate estimates and the relative importance of predictors considering changes to the models’ Akaike’s information criterion (AIC) changes of less than 2 (model.avg function in MuMIn package) with the model averaging method [53]. Information-theoretic AIC corrected for small samples sizes (AICc), ΔAIC (difference between AICc of one model and the model with the lowest AICc), and AICc weight (wAICc) were calculated for model ranking. All differences were tested for significance (P < 0.05).

3. Results

3.1. Climatic, Edaphic and Biotic Factors along the Transect

Along the transect, MAT ranged from 1.2 to 4.5 °C with a mean of 2.6 °C and MAP ranged from 155 to 518 mm with a mean of 308 mm (Table 1). SOC across 22 sites varied from 1.97 to 53.36 g kg−1, with the lowest value in temperate desert and the highest value in the temperate meadow steppe (Table 1). Nt ranged from 0.17 to 4.69 g kg−1, while Pt varied from 0.1 to 0.9 g kg−1. Soil C:N ratios were between 9.0 and 13.0. Soil pH varied from 7.1 to 8.3 (Table 1). MBC ranged from 71.8 to 660.5 mg kg−1 and MBN varied from 46.5 to 392.4 mg kg−1 (Table 1). Aboveground biomass was in the range of 11.6 to 146.6 g dry weight (d.w.) m−2, while belowground biomass varied from 50.9 to 785.6 g d.w. m−2 (Table 1). All observed parameters decreased from temperate meadow steppe to temperate steppe to temperate desert along the transect.

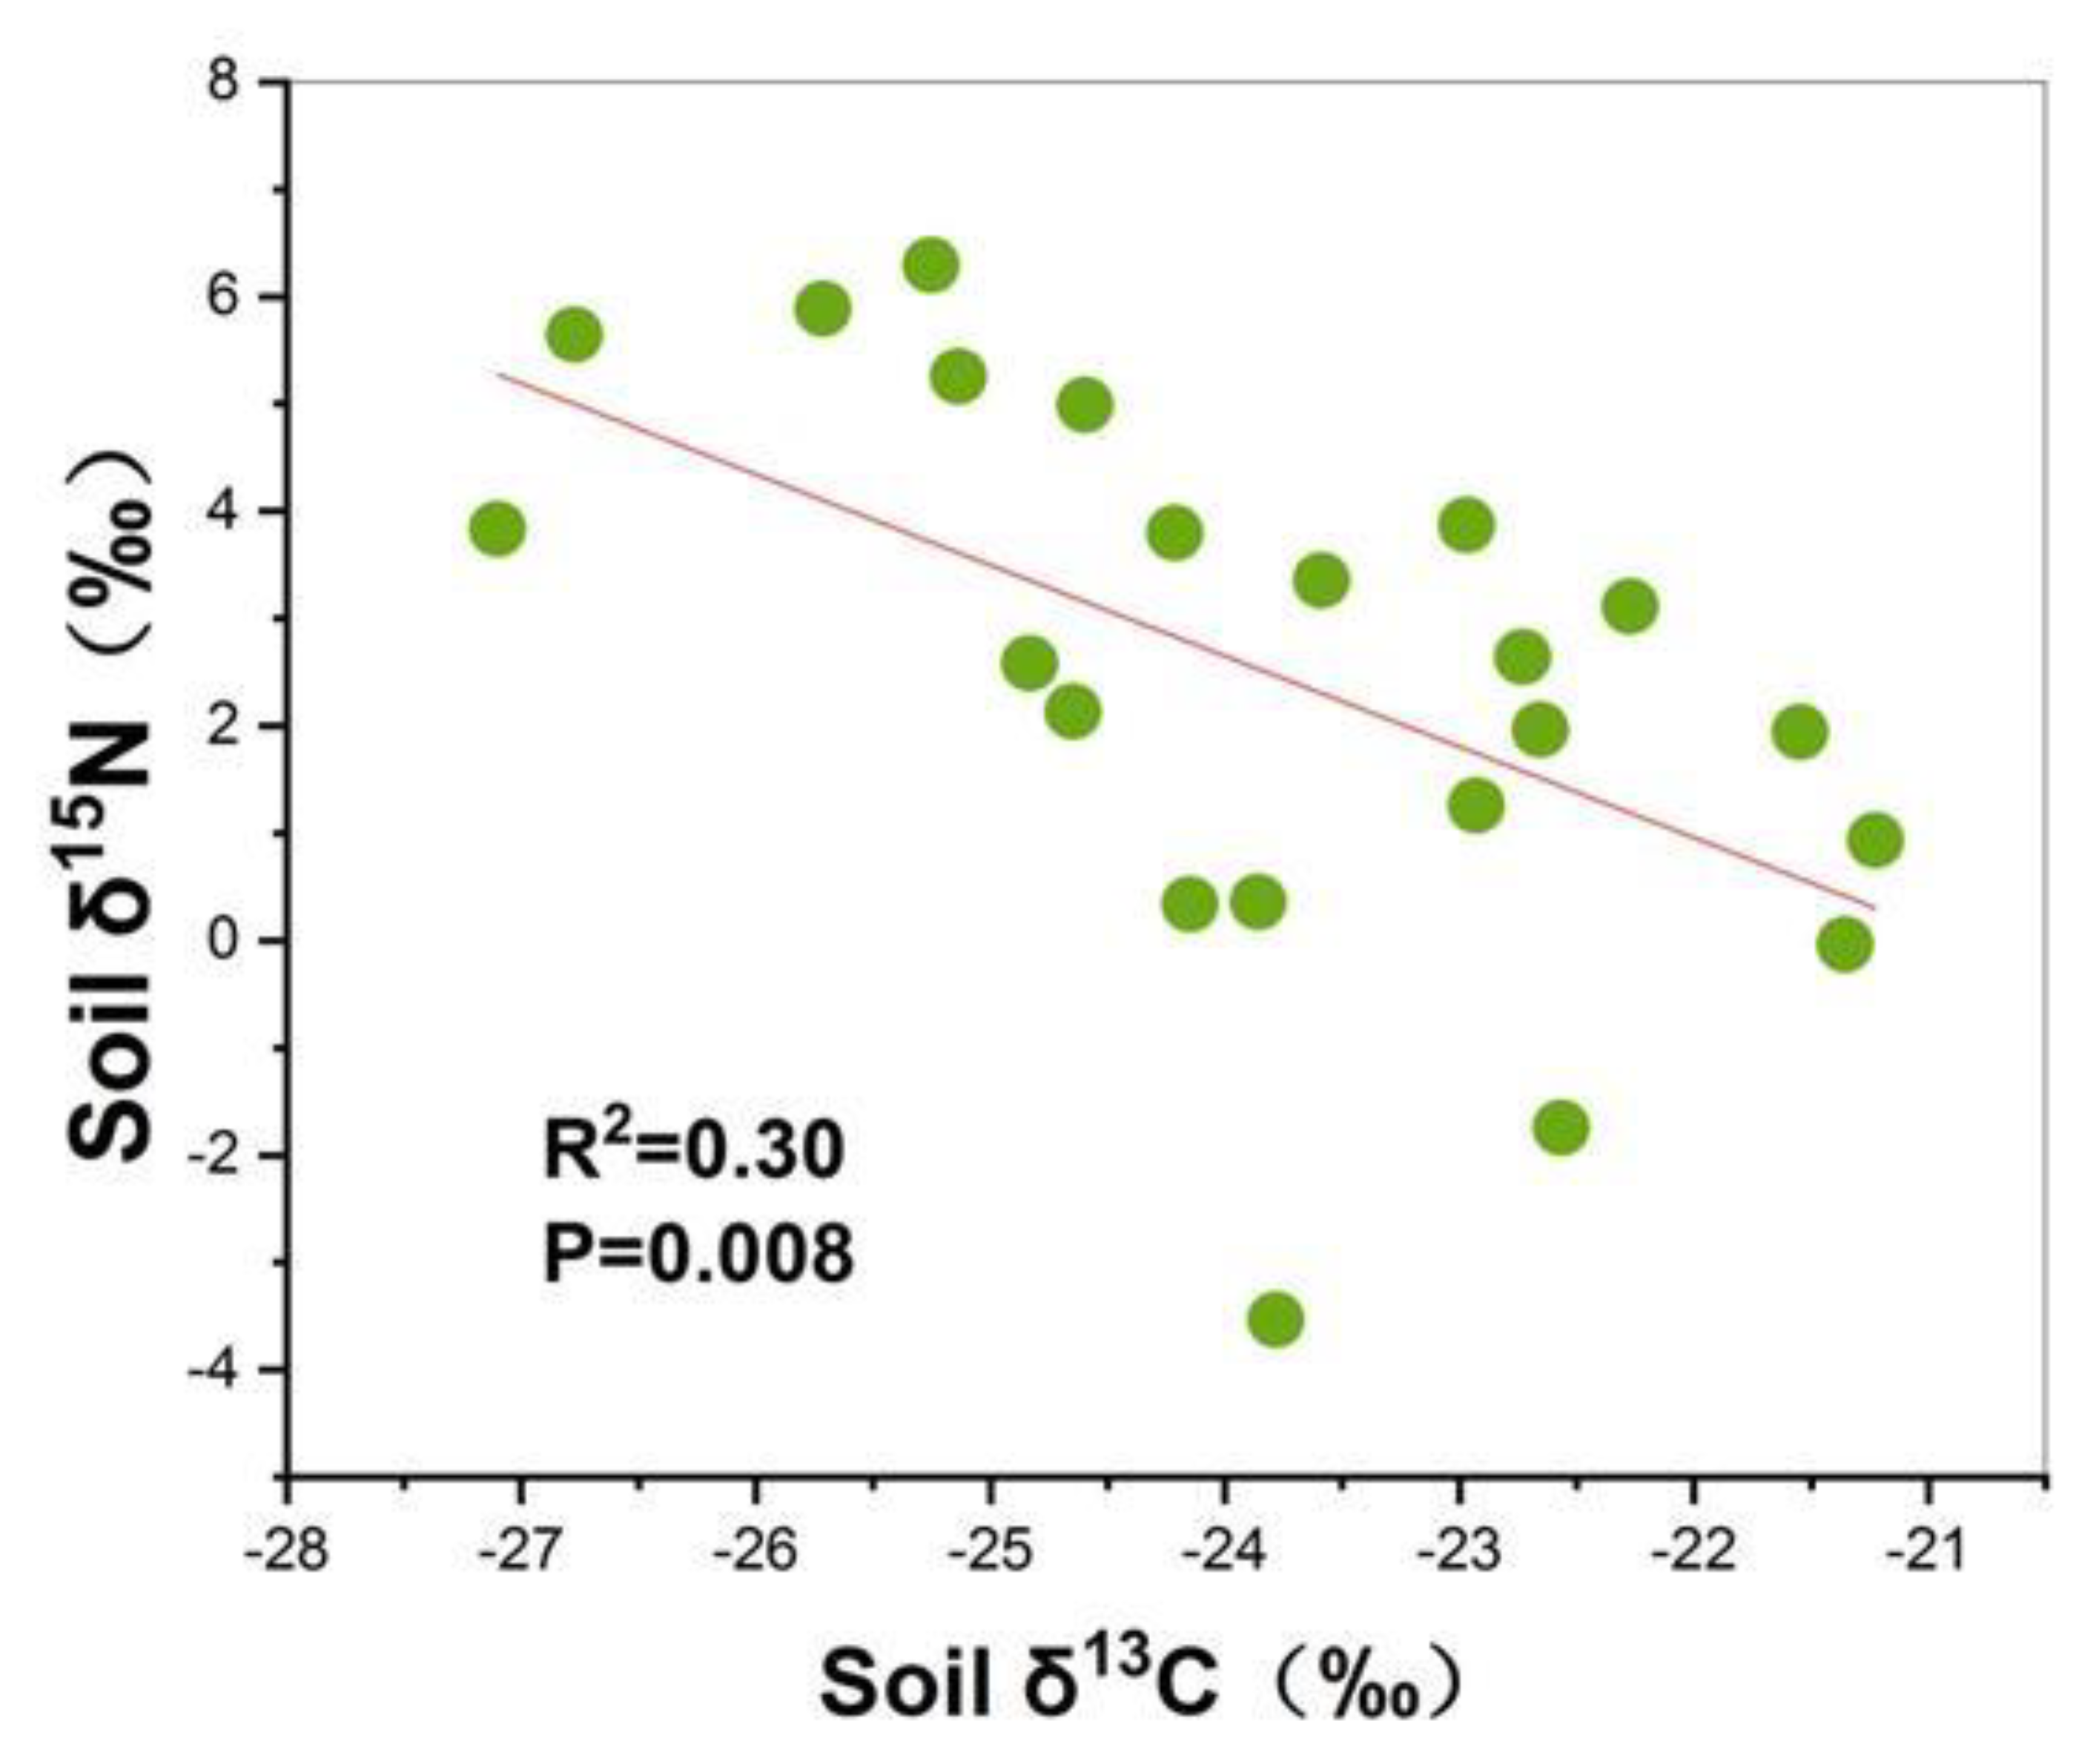
3.2. Soil δ15N and δ13C

Soil δ15N cross 22 sites along this transect varied from −3.53‰ to 5.88‰ (Table 1). All seven temperate meadow steppe sites had positive δ15N values while some temperate steppe and temperate desert sites had negative δ15N values. Soil δ15N in temperate meadow steppes (5.12‰) were higher than those in temperate steppes and temperate deserts (P < 0.05). By comparison, soil δ13C cross the grassland transect ranged from −27.1‰ to −21.2‰ (Table 1). Soil δ13C values in temperate meadow steppes (−25.7‰) were lower than those in temperate steppes and temperate deserts (P < 0.05).

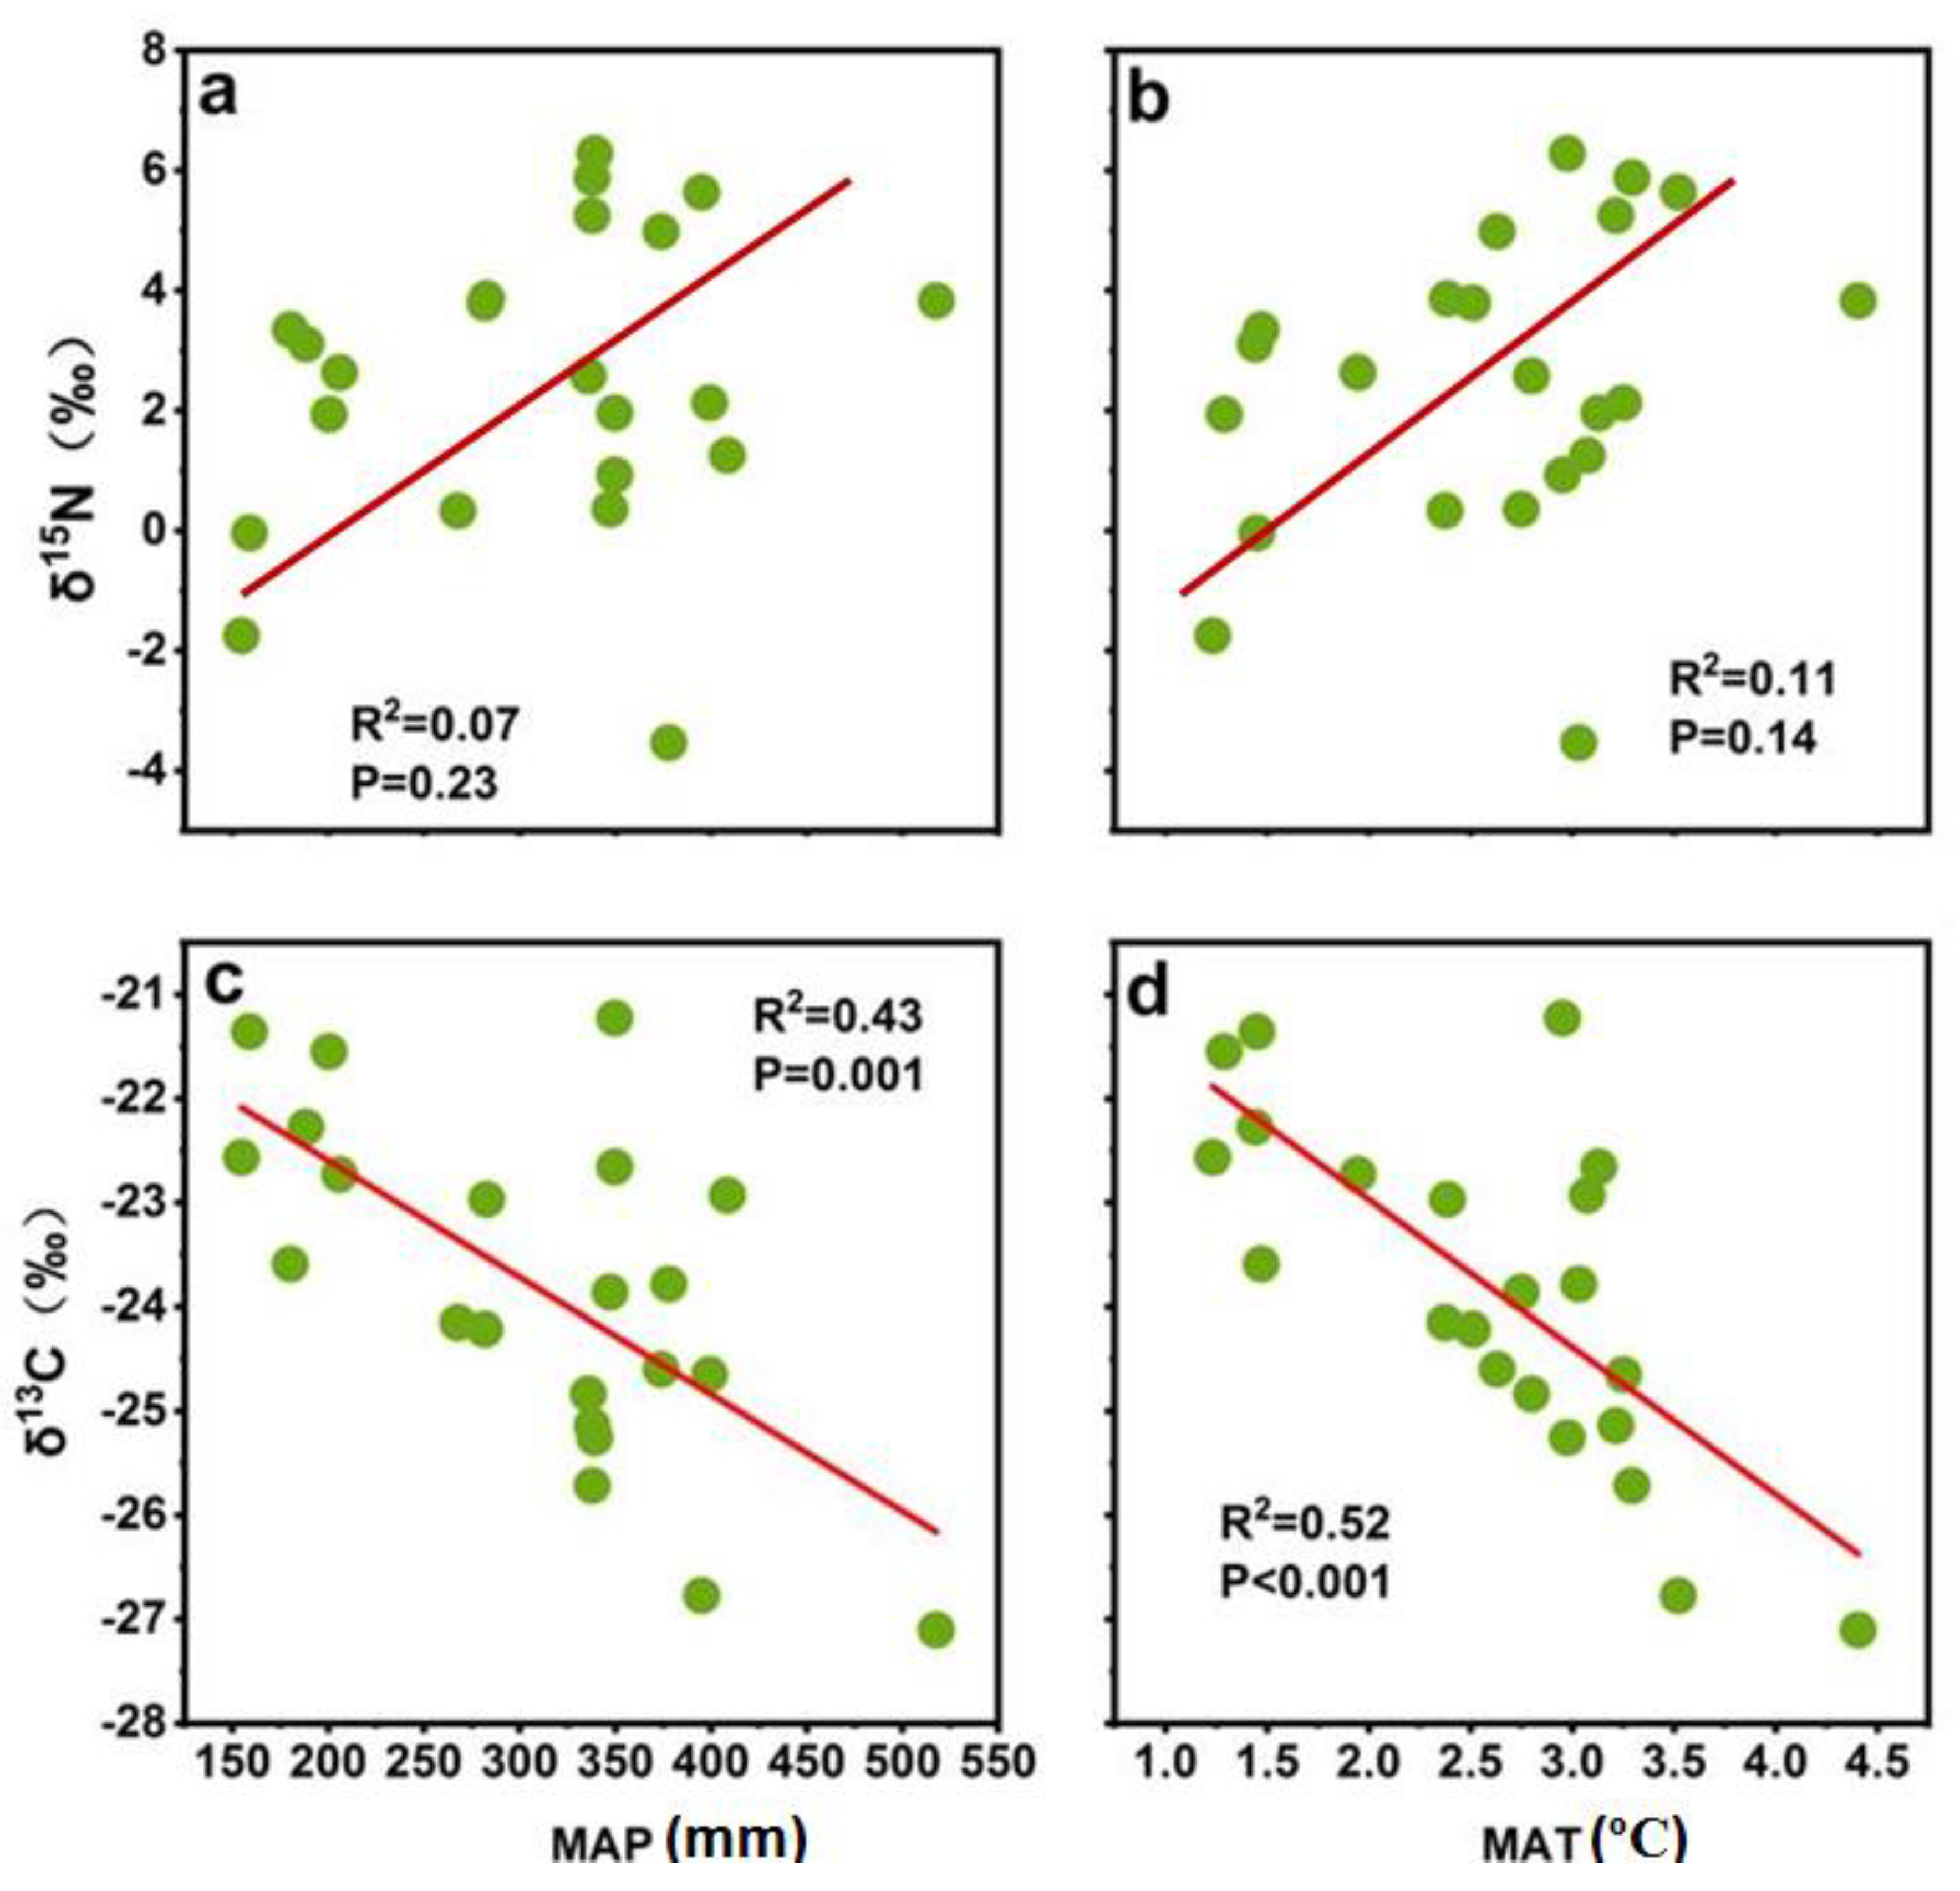
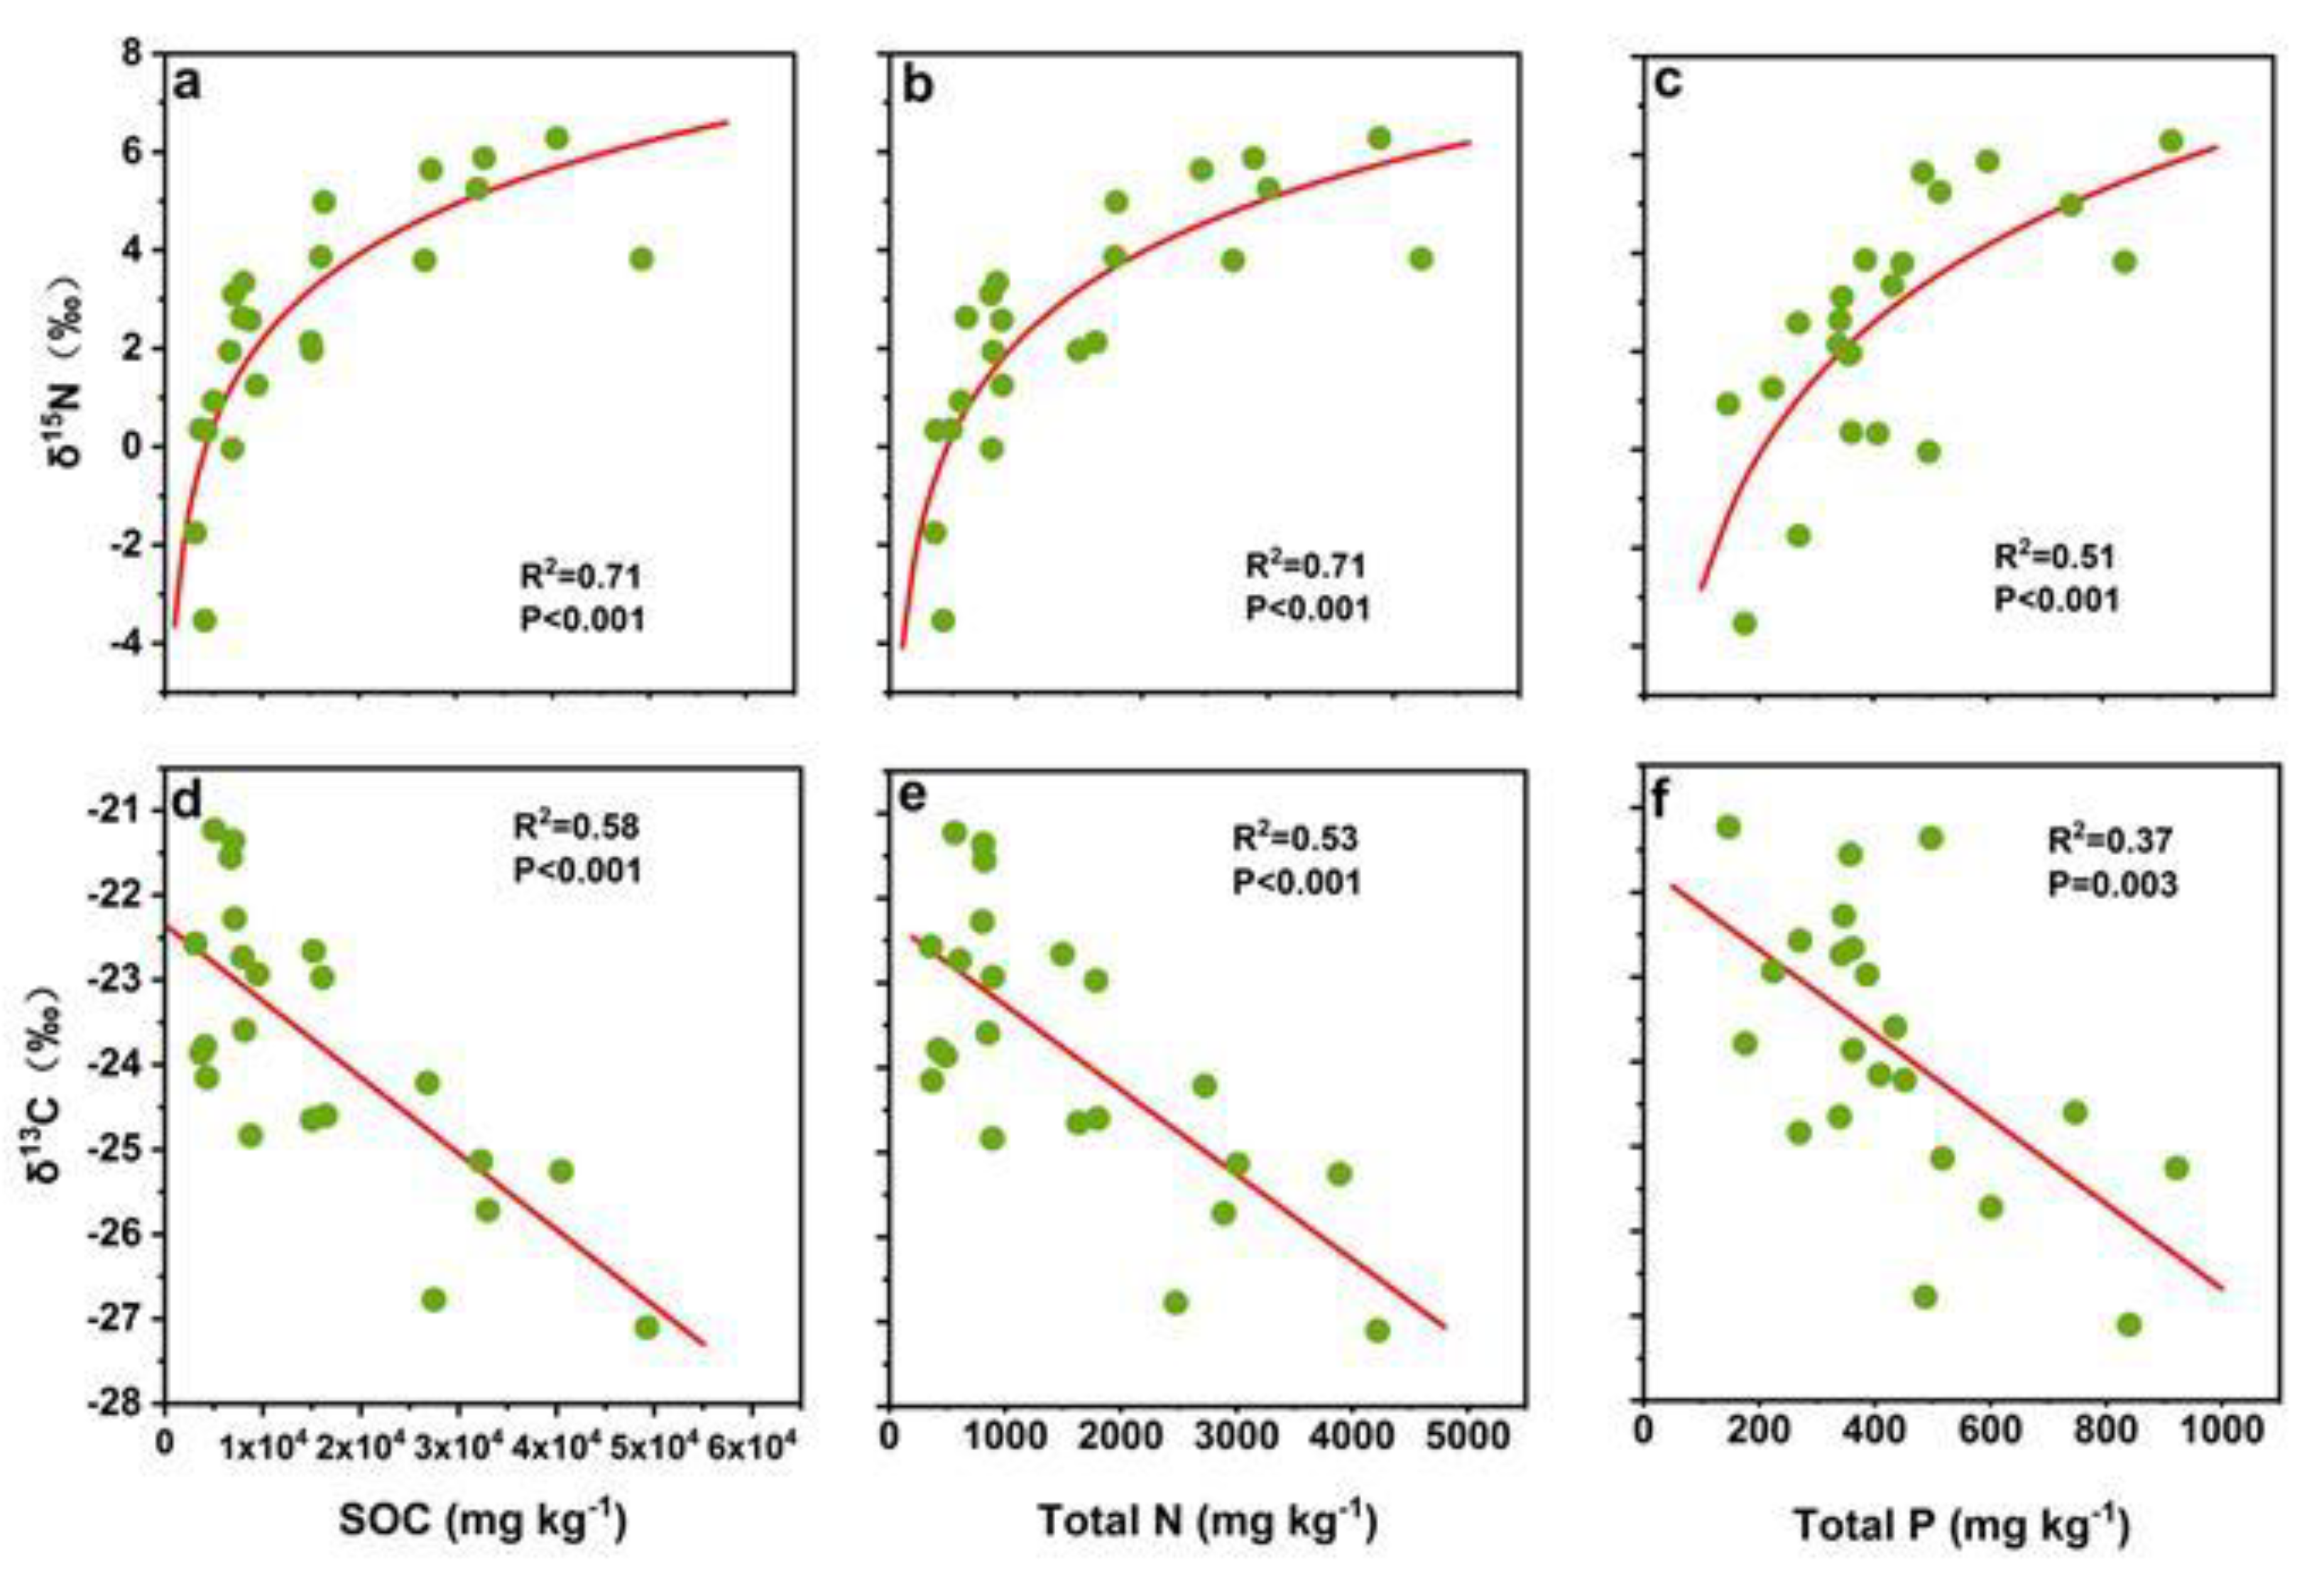
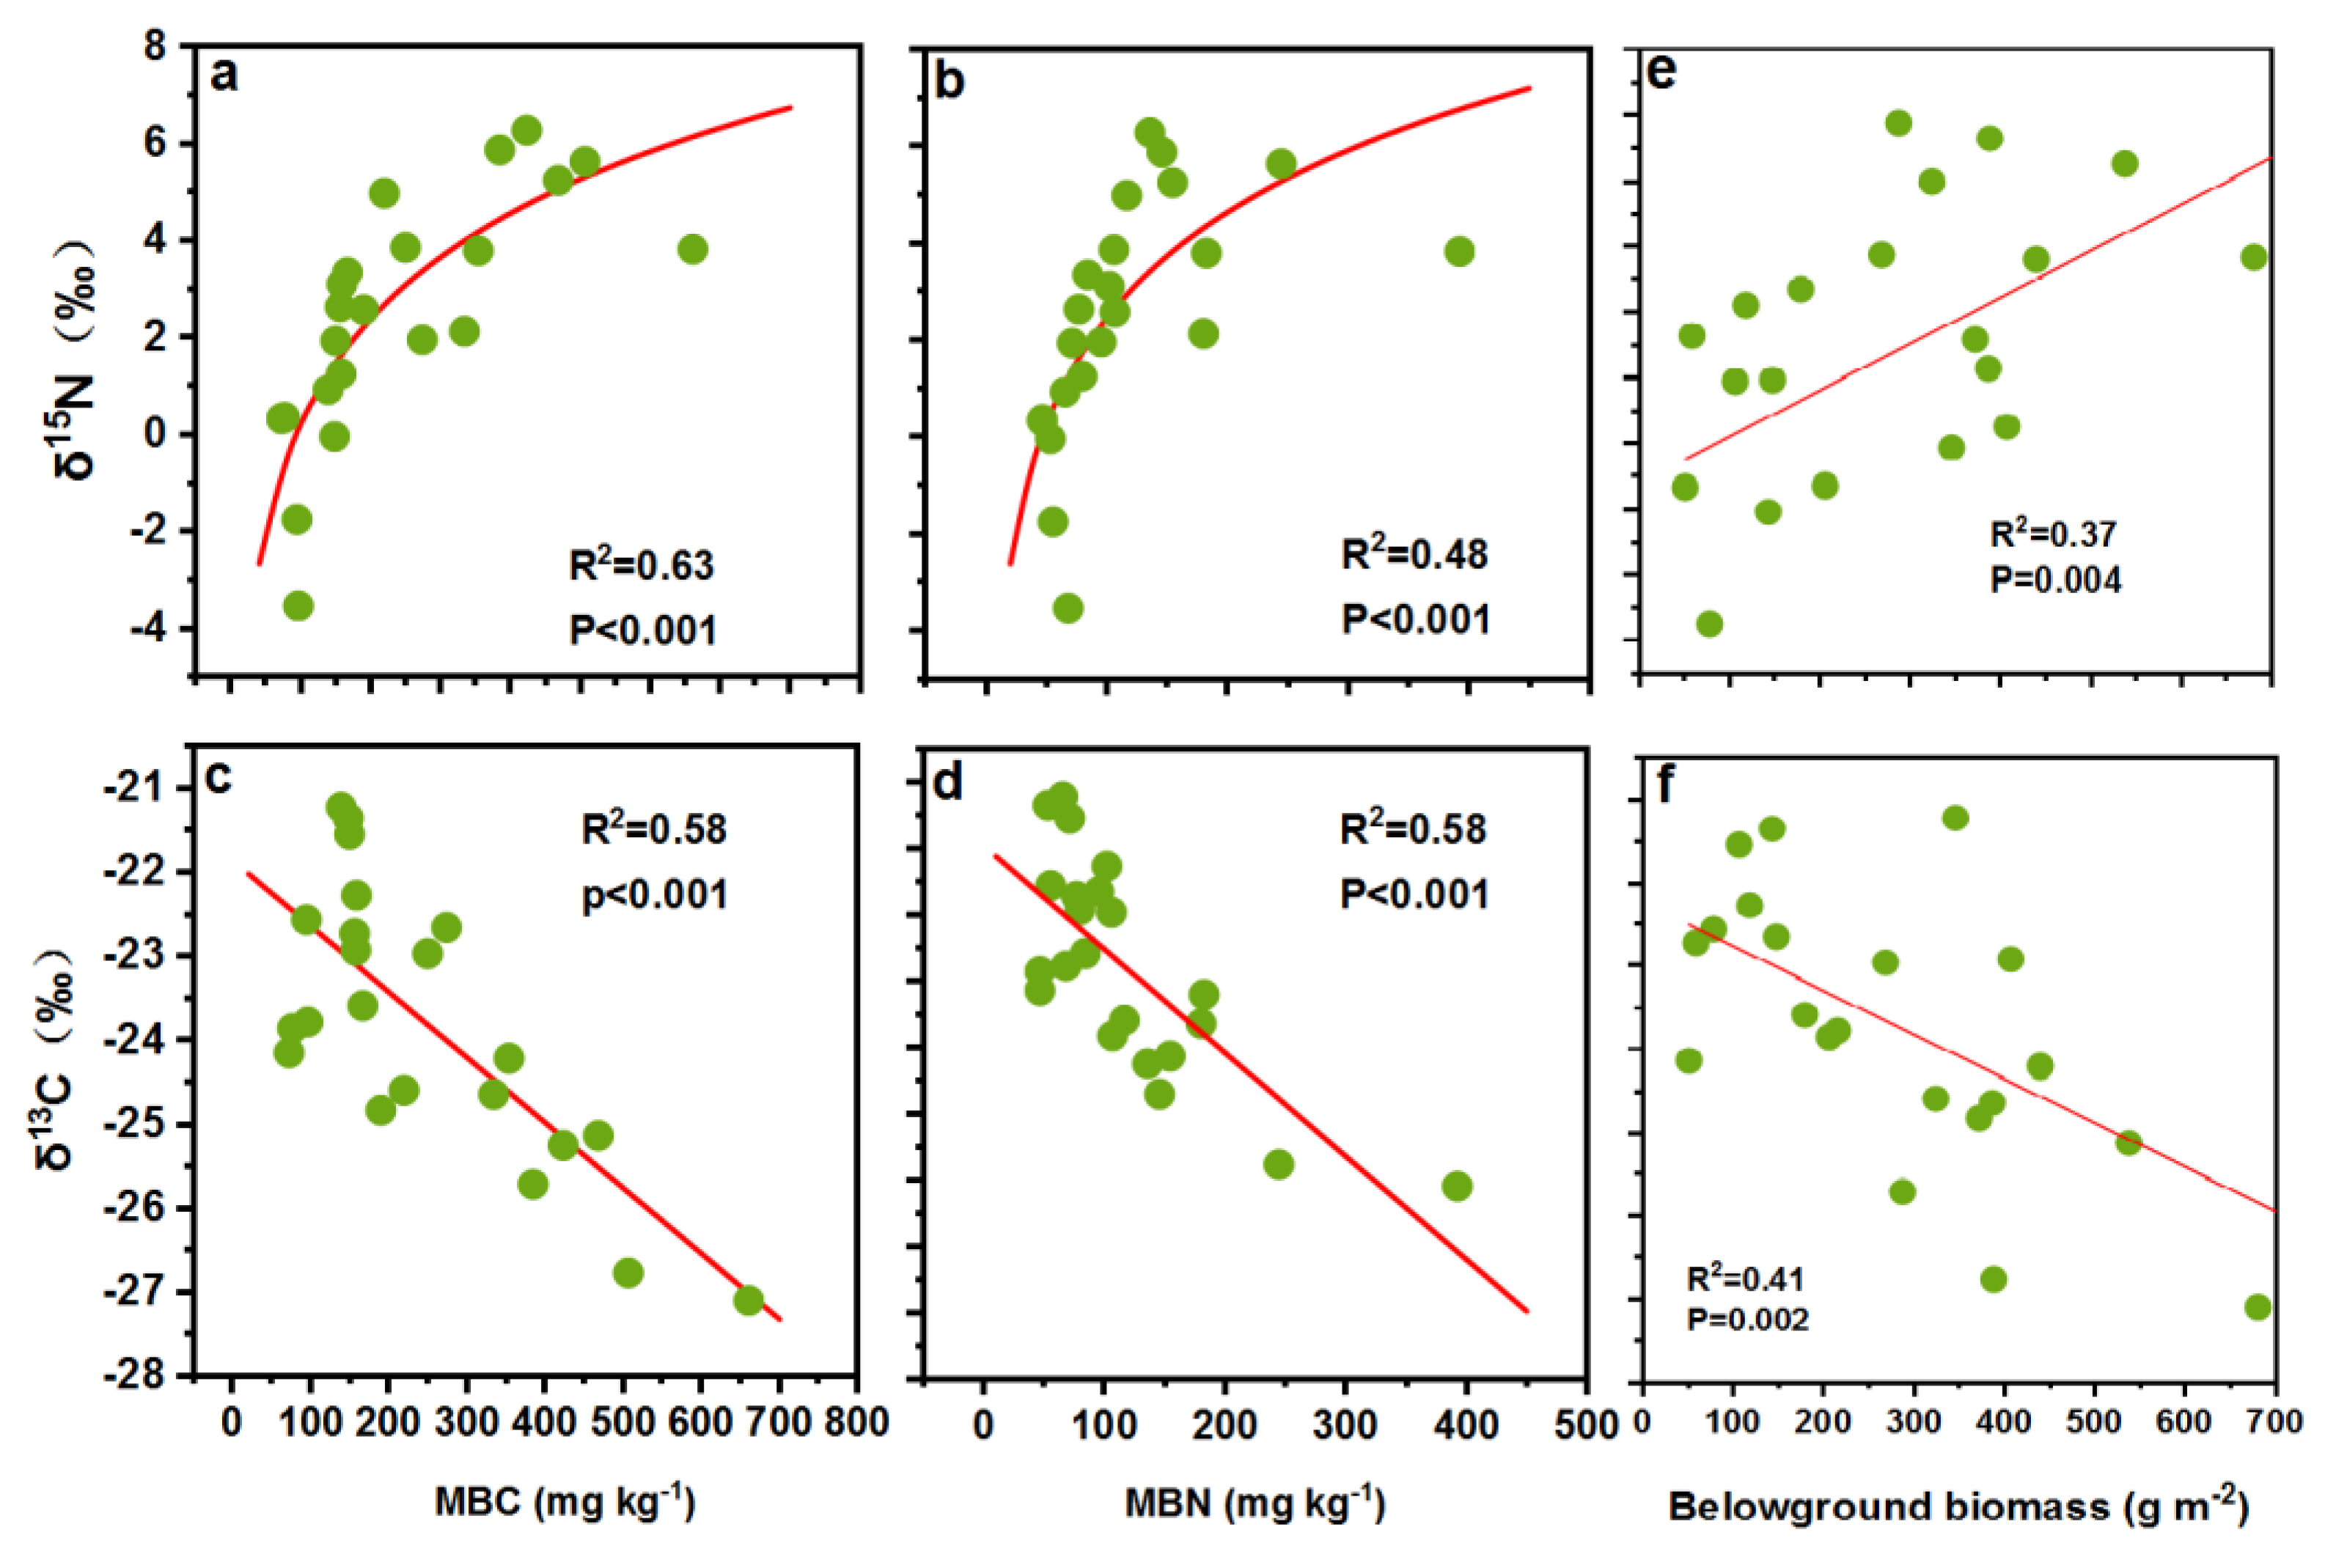
3.3. Correlation Climatic, Edaphic and Biotic Factors with Soil δ15N and δ13C

Along the transect, soil δ15N were not correlated with MAP (Figure 1a) and MAT (Figure 1b). However, soil δ13C linearly decreased with MAP (R2 = 0.43, P < 0.001, Figure 1c) and MAT (R2 = 0.52, P < 0.001, Figure 1d).
Soil δ15N logarithmically increased with concentrations of SOC (R2 = 0.71, P < 0.001, Figure 2a), Nt (R2 = 0.71, P < 0.001, Figure 2b) and Pt (R2 = 0.51, P < 0.001, Figure 2c). By comparison, soil δ13C linearly decreased with SOC (R2 = 0.58, P < 0.001, Figure 2d), Nt (R2 = 0.53, P < 0.001, Figure 2e) and Pt (R2 = 0.37, P < 0.003, Figure 2f).
Similarly to SOC and Nt, soil δ15N logarithmically increased with concentrations of MBC (R2 = 0.63, P < 0.001, Figure 3a) and MBN (R2 = 0.48, P < 0.001, Figure 3b). Soil δ13C linearly decreased with MBC (R2 = 0.58, P < 0.001, Figure 3c) and MBN (R2 = 0.58, P < 0.001, Figure 3d). Plant belowground biomass linearly increased with Soil δ15N (R2 = 0.37, P = 0.004, Figure 3e), but decreased with soil δ13C (R2 = 0.41, P = 0.002, Figure 3f). Soil δ15N decreased with soil δ13C along the transect (R2 = 0.30, P = 0.008, Figure 4).
The result of model averaging approach after model selection showed that MBC, total N, total P and SOC significantly positive related with soil δ15N. Microbial C, total P, and MAT were three most important factors which significantly negatively affected soil δ13C (Table 3).

4. Discussion

Numerous studies have explored the effects of various factors on soils δ13C and δ15N in terrestrial ecosystems on different scales [9,11,18,27,29,54]. However, it is still unclear how co-varying climatic, edaphic and biotic factors control soils δ13C and δ15N in temperate grasslands on a large scale. To answer the above question, a large-scale soil collection across temperate grasslands was carried out along a vegetation transect in Inner Mongolia. We found that biological and edaphic factors such as MBC and total N exert more effects on soil δ15N whereas climatic and edaphic factors such as MAT and total P have more impacts on soil δ13C.
Other studies have found that variations in soil δ15N values largely depend on isotopic signatures of inputs and outputs, the input–output balance, N transformation and their specific isotope effects [29]. The factors affecting the above-mentioned processes can impact soil δ13C and δ15N signatures. In the current study, soil 15N values across the transect had positive values, with the exception of two sites. Higher soil δ15N values in drier ecosystems reflects a larger loss of mineral N through strongly 15N-discriminating processes, e.g., higher gaseous N losses caused by N-cycling microbes [34,55] and increased N mineralization and nitrification [56]. Numerous studies have suggested that climatic factors control δ15N in soil [10,11,34,57]. In contrast to previous studies, the current study did not demonstrate a clear relationship between δ15N and MAT or MAP [10,11,34]. These different findings could be ascribed to two reasons: (1) The length of our transect (i.e., the scale) was much short than those in both previous studies in the same region [10,34]. (2) As an indicator that integrates many processes affecting the N cycle, controls on soil δ15N are very complicated, including various climatic, edaphic and biological factors [29,32]. Consistently with a previous study on the Chinese Loess Plateau [58], edaphic factors such as SOC, Nt and Pt strongly influenced soil δ15N across our transect. Previous studies demonstrated that soil δ15N increased or decreased with Nt contents [10,11], but we observed a significant positive logarithmic relationship between soil δ15N and Nt along the transect. Among the various factors, MBC, i.e., a biotic factor, played a more important role in controlling the soil 15N signature than climatic and edaphic factors (Table 2). This reflects that microbial processes are responsible for soil 15N dynamics across the investigated temperate grassland, supporting our first hypothesis.
Previous studies have shown that soil δ13C signature corresponds similarly to biotic factors, such as plant residue input from litterfall and rhizodeposition, including root mortality and root exudation [59,60]. Over time, dynamics of soil δ13C are therefore largely controlled by C inputs from vegetation and subsequent microbial decomposition [13,18,61]. However, we found that climate and edaphic properties exerted greater control on soil 13C in the investigated temperate grasslands (Table 2), which is consistent with previous studies demonstrating the importance of climate on soil δ13C [13,62]. Additionally, a previous study also showed that the spatial variation of soil δ13C was related to soil texture in a subtropical lowland woodland [25]. Considering that δ13C can be regarded as an indicator of SOC dynamics, our results suggest that SOC dynamics in temperate grasslands are largely controlled by climatic and edaphic factors since MAP and Pt most dominantly affected soil 13C values. Therefore, our results confirm our second hypothesis that climatic and edaphic factors have a higher effect on soil δ13C than biological factors. This could be because water is a critical factor limiting growth of plants and microorganisms in these arid and semi-arid temperate grasslands [63,64]. Additionally, P is a key nutrient in temperate grasslands and, together with N, co-limits plant net primary production and microbial activities [65,66]. Therefore, both precipitation and Pt affect soil 13C values by altering C input and microbial decomposition. These findings indicate that climatic and edaphic factors should be taken into account in order to better understand SOC dynamics, especially focusing on their roles in the microbial decomposition of plant residues and SOC.

5. Conclusions

In summary, a large-scale soil collection was carried out in temperate grasslands along a vegetation transect in Inner Mongolia to examine how climatic, edaphic and biological factors affect the soil δ13C or δ15N signature. Along the transect, soil δ15N was not correlated with MAP and MAT, while soil δ13C linearly decreased with MAP and MAT. Soil δ15N logarithmically increased with concentrations of SOC, Nt and Pt, but soil δ13C linearly decreased with concentrations of SOC, Nt and Pt. Similarly, soil δ15N logarithmically increased with MBC and MBN, while soil δ13C linearly decreased with MBC and MBN. Soil δ15N linearly increased with plant belowground biomass, but soil δ13C decreased with plant belowground biomass. Multiple linear regressions showed that MBC especially, but also Nt to a lesser extent, affect soil δ15N, while MAT and Pt have more impact on soil δ13C. Thus, biotic factors controlled soil 15N signature most dominantly while climatic and edaphic factors exerted greater control on soil δ13C signature. These results indicate that soil C and N cycles are to some extent decoupled in these temperate grasslands. Further investigations should focus on those ecological processes leading to decoupling of C and N cycles in temperate grassland soils for a better understanding of SOC dynamics [12].

Author Contributions

X.C. and X.X. conceived and designed the experiments; X.Z. and F.W. performed the experiments; X.Z., M.L. and L.Z. analyzed the data; X.C. contributed reagents/materials/analysis tools; X.Z. wrote the paper; X.C., X.X., R.C. and I.G. contributed to interpret the results and improve the manuscript. All authors have read and agreed to the published version of the manuscript.

Funding

This research was funded by the National Key Research and Development Program of China (2016YFC0501802; 2017YFA0604802) and by the National Natural Science Foundation of China (41877089).

Acknowledgments

This study was supported by the National Key Research and Development Program of China (Grant No. 2016YFC0501802; 2017YFA0604802).

Conflicts of Interest

The authors declare no conflict of interest.

References

  1. Miltner, A.; Bombach, P.; Schmidt-Bruecken, B.; Kaestner, M. SOM genesis: Microbial biomass as a significant source. Biogeochemistry 2012, 111, 41–55. [Google Scholar] [CrossRef]
  2. Schnitzer, M. A lifetime perspective on the chemistry of soil organic matter. Adv. Agron. 1999, 68, 1–58. [Google Scholar] [CrossRef]
  3. Batjes, N.H. Total carbon and nitrogen in the soils of the world. Eur. J. Soil Sci. 1996, 47, 151–163. [Google Scholar] [CrossRef]
  4. Post, W.M.; Pastor, J.; Zinke, P.J.; Stangenberger, A.G. Global patterns of soil nitrogen storage. Nature 1985, 317, 613–616. [Google Scholar] [CrossRef]
  5. Janzen, H.H.; Campbell, C.A.; Ellert, B.H.; Bremer, E. Soil organic matter dynamics and their relationship to soil quality. Dev. Soil Sci. 1997, 25, 277–291. [Google Scholar] [CrossRef]
  6. Schmidt, M.W.I.; Torn, M.S.; Abiven, S.; Dittmar, T.; Guggenberger, G.; Janssens, I.A.; Kleber, M.; Kögel-Knabner, I.; Lehmann, J.; Manning, D.A.C.; et al. Persistence of soil organic matter as an ecosystem property. Nature 2011, 478, 49–56. [Google Scholar] [CrossRef] [Green Version]
  7. Goh, K.M. Carbon sequestration and stabilization in soils: Implications for soil productivity and climate change. Soil Sci. Plant Nutr. 2004, 50, 467–476. [Google Scholar] [CrossRef] [Green Version]
  8. Lal, R. Managing soils and ecosystems for mitigating anthropogenic carbon emissions and advancing global food Security. Bioscience 2010, 60, 708–721. [Google Scholar] [CrossRef]
  9. Amundson, R.; Austin, A.T.; Schuur, E.A.G.; Yoo, K.; Matzek, V.; Kendall, C.; Uebersax, A.; Brenner, D.L.; Baisden, W.T. Global patterns of the isotopic composition of soil and plant nitrogen. Glob. Biogeochem. Cycles 2003, 17, 1031. [Google Scholar] [CrossRef]
  10. Cheng, W.X.; Chen, Q.S.; Xu, Y.Q.; Han, X.G.; Li, L.H. Climate and ecosystem 15N natural abundance along a transect of Inner Mongolian grasslands: Contrasting regional patterns and global patterns. Glob. Biogeochem. Cycles 2009, 23, GB2005. [Google Scholar] [CrossRef]
  11. Craine, J.M.; Elmore, A.J.; Wang, L.; Augusto, L.; Baisden, W.T.; Brookshire, E.N.J.; Cramer, M.D.; Hasselquist, N.J.; Hobbie, E.A.; Kahmen, A.; et al. Convergence of soil nitrogen isotopes across global climate gradients. Sci. Rep. 2015, 5, 8280. [Google Scholar] [CrossRef] [Green Version]
  12. Ehleringer, J.R.; Buchmann, N.; Flanagan, L.B. Carbon isotope ratios in belowground carbon cycle processes. Ecol. Appl. 2000, 10, 412–422. [Google Scholar] [CrossRef]
  13. Garten, C.T.; Cooper, L.W.; Post, W.M.; Hanson, P.J. Climate controls on forest soil C isotope ratios in the southern appalachian mountains. Ecology 2000, 81, 1108–1119. [Google Scholar] [CrossRef]
  14. Wang, C.; Houlton, B.Z.; Liu, D.; Hou, J.; Cheng, W.; Bai, E. Stable isotopic constraints on global soil organic carbon turnover. Biogeosciences 2018, 15, 987–995. [Google Scholar] [CrossRef] [Green Version]
  15. Stable Isotopes in Ecology and Environmental Science, 2nd ed.; Michener, R.H.; Lajtha, K. (Eds.) Blackwell Publishing Ltd.: Oxford, UK, 2007; ISBN 978-1-4051-2680-9. [Google Scholar]
  16. Bernoux, M.; Cerri, C.C.; Neill, C.; de Moraes, J.F.L. The use of stable carbon isotopes for estimating soil organic matter turnover rates. Geoderma 1998, 82, 43–58. [Google Scholar] [CrossRef]
  17. Conen, F.; Zimmermann, M.; Leifeld, J.; Seth, B.; Alewell, C. Relative stability of soil carbon revealed by shifts in δ15N and C:N ratio. Biogeosciences 2008, 5, 123–128. [Google Scholar] [CrossRef] [Green Version]
  18. Natelhoffer, K.J.; Fry, B. Controls on natural 15N and 13C abundances in forest soil organic matter. Soil Sci. Soc. Am. J. 1988, 52, 1633–1640. [Google Scholar] [CrossRef]
  19. Bai, E.; Boutton, T.W.; Liu, F.; Wu, X.B.; Archer, S.R. Spatial patterns of soil δ13C reveal grassland-to-woodland successional processes. Org. Geochem. 2012, 42, 1512–1518. [Google Scholar] [CrossRef]
  20. Balesdent, J.; Mariotti, A. Measurement of soil organic matter turnover using 13C natural abundance. In Mass Spectrometry of Soil; Boutton, T.W., Yamasaki, S.I., Eds.; Marcel Dekker, Inc.: New York, NY, USA, 1996; pp. 83–111. ISBN 0-8247-9699-3. [Google Scholar]
  21. Kramer, M.G.; Sollins, P.; Sletten, R.S.; Swart, P.K. N isotope fractionation and measures of organic matter alteration during decomposition. Ecology 2003, 84, 2021–2025. [Google Scholar] [CrossRef] [Green Version]
  22. Biedenbender, S.H.; McClaran, M.P.; Quade, J.; Weltz, M.A. Landscape patterns of vegetation change indicated by soil carbon isotope composition. Geoderma 2004, 119, 69–83. [Google Scholar] [CrossRef]
  23. Mayor, J.R.; Wright, S.J.; Schuur, E.A.; Brooks, M.E.; Turner, B.L. Stable nitrogen isotope patterns of trees and soils altered by long-term nitrogen and phosphorus addition to a lowland tropical rainforest. Biogeochemistry 2014, 119, 293–306. [Google Scholar] [CrossRef] [Green Version]
  24. Stevenson, B.A.; Parfitt, R.L.; Schipper, L.A.; Baisden, W.T.; Mudge, P. Relationship between soil δ15N, C/N and N losses across land uses in New Zealand. Agric. Ecosyst. Environ. 2010, 139, 736–741. [Google Scholar] [CrossRef]
  25. Bai, E.; Boutton, T.W.; Liu, F.; Ben Wu, X.; Hallmark, C.T.; Archer, S.R. Spatial variation of soil δ13C and its relation to carbon input and soil texture in a subtropical lowland woodland. Soil Biol. Biochem. 2012, 44, 102–112. [Google Scholar] [CrossRef]
  26. Wynn, J.G.; Bird, M.I. Environmental controls on the stable carbon isotopic composition of soil organic carbon: Implications for modelling the distribution of C3 and C4 plants, Australia. Tellus 2008, 60, 604–621. [Google Scholar] [CrossRef] [Green Version]
  27. Craine, J.M.; Brookshire, E.N.J.; Cramer, M.D.; Hasselquist, N.J.; Koba, K.; Marin-Spiotta, E.; Wang, L. Ecological interpretations of nitrogen isotope ratios of terrestrial plants and soils. Plant Soil 2015, 396, 1–26. [Google Scholar] [CrossRef] [Green Version]
  28. Dawson, T.E.; Mambelli, S.; Plamboeck, A.H.; Templer, P.H.; Tu, K.P. Stable isotopes in plant ecology. Annu. Rev. Ecol. Syst. 2002, 33, 507–559. [Google Scholar] [CrossRef]
  29. Högberg, P. 15N natural abundance in soil-plant systems. New Phytol. 1997, 137, 179–203. [Google Scholar] [CrossRef]
  30. Makarov, M.I. The nitrogen isotopic composition in soils and plants: Its use in environmental studies (a review). Eurasian Soil Sci. 2009, 42, 1335–1347. [Google Scholar] [CrossRef]
  31. Pardo, L.H.; Nadelhoffer, K.J. Using nitrogen isotope ratios to assess terrestrial ecosystems at regional and global scales. In Isoscapes: Understanding Movement, Pattern, and Process on Earth through Isotope Mapping; West, J.B., Bowen, G.J., Dawson, T.E., Tu, K.P., Eds.; Springer: New York, NY, USA, 2010; pp. 221–249. ISBN 978-90-481-3353-6. [Google Scholar]
  32. Robinson, D. δ15N as an integrator of the nitrogen cycle. Trends Ecol. Evol. 2001, 16, 153–162. [Google Scholar] [CrossRef]
  33. Powers, J.S.; Veldkamp, E. Regional variation in soil carbon and δ13C in forests and pastures of northeastern Costa Rica. Biogeochemistry 2005, 72, 315–336. [Google Scholar] [CrossRef]
  34. Wang, C.; Wang, X.; Liu, D.; Wu, H.; Lu, X.; Fang, Y.; Cheng, W.; Luo, W.; Jiang, P.; Shi, J.; et al. Aridity threshold in controlling ecosystem nitrogen cycling in arid and semi-arid grasslands. Nat. Commun. 2014, 5, 4799. [Google Scholar] [CrossRef] [Green Version]
  35. Handley, L.L.; Raven, J.A. The use of natural abundance of nitrogen isotopes in plant physiology and ecology. Plant Cell Environ. 1992, 15, 965–985. [Google Scholar] [CrossRef]
  36. Aranibar, J.N.; Otter, L.; Macko, S.A.; Feral, C.J.W.; Epstein, H.E.; Dowty, P.R.; Eckardt, F.; Shugart, H.H.; Swap, R.J. Nitrogen cycling in the soil-plant system along a precipitation gradient in the Kalahari sands. Glob. Chang. Biol. 2004, 10, 359–373. [Google Scholar] [CrossRef]
  37. Austin, A.T.; Vitousek, P.M. Nutrient dynamics on a precipitation gradient in Hawai’i. Oecologia 1998, 113, 519–529. [Google Scholar] [CrossRef]
  38. Handley, L.L.; Austin, A.T.; Robinson, D.; Scrimgeour, C.M.; Raven, J.A.; Heaton, T.H.E.; Schmidt, S.; Stewart, G.R. The 15N natural abundance (δ15N) of ecosystem samples reflects measures of water availability. Aust. J. Plant Physiol. 1999, 26, 185–199. [Google Scholar] [CrossRef]
  39. Qiao, N.; Xu, X.; Cao, G.; Ouyang, H.; Kuzyakov, Y. Land use change decreases soil carbon stocks in Tibetan grasslands. Plant Soil 2015, 395, 231–241. [Google Scholar] [CrossRef] [Green Version]
  40. Wang, L.; D’Odorico, P.; Ries, L.; Macko, S.A. Patterns and implications of plant-soil δ13C and δ15N values in African savanna ecosystems. Quat. Res. 2010, 73, 77–83. [Google Scholar] [CrossRef]
  41. Conant, R.T.; Cerri, C.E.P.; Osborne, B.B.; Paustian, K. Grassland management impacts on soil carbon stocks: A new synthesis. Ecol. Appl. 2017, 27, 662–668. [Google Scholar] [CrossRef] [Green Version]
  42. Ramankutty, N.; Evan, A.T.; Monfreda, C.; Foley, J.A. Farming the planet: 1. Geographic distribution of global agricultural lands in the year 2000. Glob. Biogeochem. Cycles 2008, 22, GB1003. [Google Scholar] [CrossRef]
  43. Foley, J.A.; Ramankutty, N.; Brauman, K.A.; Cassidy, E.S.; Gerber, J.S.; Johnston, M.; Mueller, N.D.; O’Connell, C.; Ray, D.K.; West, P.C.; et al. Solutions for a cultivated planet. Nature 2011, 478, 337–342. [Google Scholar] [CrossRef] [Green Version]
  44. Climate Change 2014: Synthesis Report. Contribution of Working Groups I, II and III to the Fifth Assessment Report of the Intergovernmental Panel on Climate Change; Core Writing Team, Pachauri, R.K., Meyer, L.A., Eds.; IPCC: Geneva, Switzerland, 2014; ISBN 978-92-9169-143-2. [Google Scholar]
  45. Bredenkamp, G.J.; Spada, F.; Kazmierczak, E. On the origin of northern and southern hemisphere grasslands. Plant Ecol. 2002, 163, 209–229. [Google Scholar] [CrossRef]
  46. Farquhar, G.D.; Richards, R.A. Isotopic composition of plant carbon correlates with water use efficiency of wheat genotypes. Aust. J. Plant Physiol. 1984, 11, 539–552. [Google Scholar] [CrossRef]
  47. Soil Survey Staff. Keys to Soil Taxonomy, 9th ed.; USDA-Natural Resources Conservation Service: Washington, DC, USA, 2003.
  48. Grimshaw, H.M. The determination of total phosphorus in soils by acid digestion. In Chemical Analysis in Environmental Research; Rowland, A.P., Ed.; NERC/ITE: Abbots Ripton, UK, 1987; pp. 92–95. ISBN 0-904282-98-8. [Google Scholar]
  49. Parkinson, J.A.; Allen, S.E. A wet oxidation procedure suitable for the determination of nitrogen and mineral nutrients in biological material. Commun. Soil Sci. Plant Anal. 1975, 6, 1–11. [Google Scholar] [CrossRef]
  50. Brookes, P.C.; Landman, A.; Pruden, G.; Jenkinson, D.S. Chloroform fumigation and the release of soil nitrogen: A rapid direct extraction method to measure microbial biomass nitrogen in soil. Soil Biol. Biochem. 1985, 17, 837–842. [Google Scholar] [CrossRef]
  51. Vance, E.D.; Brookes, P.C.; Jenkinson, D.S. An extraction method for measuring soil microbial biomass C. Soil Biol. Biochem. 1987, 19, 703–707. [Google Scholar] [CrossRef]
  52. Wu, J.S.; Joergensen, R.G.; Pommerening, B.; Chaussod, R.; Brookes, P.C. Measurement of soil microbial biomass C by fumigation extraction—An automated procedure. Soil Biol. Biochem. 1990, 22, 1167–1169. [Google Scholar] [CrossRef]
  53. Burnham, K.P.; Anderson, D.R.; Huyvaert, K.P. AIC model selection and multimodel inference in behavioral ecology: Some background, observations, and comparisons. Behav. Ecol. Sociobiol. 2011, 65, 23–35. [Google Scholar] [CrossRef]
  54. Cheng, S.L.; Fang, H.J.; Yu, G.R.; Zhu, T.H.; Zheng, J.J. Foliar and soil 15N natural abundances provide field evidence on nitrogen dynamics in temperate and boreal forest ecosystems. Plant Soil 2010, 337, 285–297. [Google Scholar] [CrossRef]
  55. Xu, Y.; He, J.; Cheng, W.; Xing, X.; Li, L. Natural 15N abundance in soils and plants in relation to N cycling in a rangeland in Inner Mongolia. J. Plant Ecol. 2010, 3, 201–207. [Google Scholar] [CrossRef]
  56. Kahmen, A.; Wanek, W.; Buchmann, N. Foliar δ15N values characterize soil N cycling and reflect nitrate or ammonium preference of plants along a temperate grassland gradient. Oecologia 2008, 156, 861–870. [Google Scholar] [CrossRef] [Green Version]
  57. Weintraub, S.R.; Cole, R.J.; Schmitt, C.G.; All, J.D. Climatic controls on the isotopic composition and availability of soil nitrogen across mountainous tropical forest. Ecosphere 2016, 7, e01412. [Google Scholar] [CrossRef]
  58. Shan, Y.; Huang, M.; Suo, L.; Zhao, X.; Wu, L. Composition and variation of soil δ15N stable isotope in natural ecosystems. Catena 2019, 183, 104236. [Google Scholar] [CrossRef]
  59. Nissenbaum, A.; Schallinger, K.M. The distribution of stable carbon isotope (13C/12C) in fractions of soil organic matter. Geoderma 1974, 11, 137–145. [Google Scholar] [CrossRef]
  60. Vankessel, C.; Farrell, R.E.; Pennock, D.J. 13C and 15N natural abundance in crop residues and soil organic matter. Soil Sci. Soc. Am. J. 1994, 58, 382–389. [Google Scholar] [CrossRef]
  61. Santruckova, H.; Bird, M.I.; Lloyd, J. Microbial processes and carbon-isotope fractionation in tropical and temperate grassland soils. Funct. Ecol. 2000, 14, 108–114. [Google Scholar] [CrossRef]
  62. Du, B.; Liu, C.; Kang, H.; Zhu, P.; Yin, S.; Shen, G.; Hou, J.; Ilvesniemi, H. Climatic control on plant and soil delta C-13 along an altitudinal transect of Lushan mountain in subtropical China: Characteristics and interpretation of soil carbon dynamics. PLoS ONE 2014, 9, e86440. [Google Scholar] [CrossRef] [Green Version]
  63. Guo, Q.; Hu, Z.; Li, S.; Li, X.; Sun, X.; Yu, G. Spatial variations in aboveground net primary productivity along a climate gradient in Eurasian temperate grassland: Effects of mean annual precipitation and its seasonal distribution. Glob. Chang. Biol. 2012, 18, 3624–3631. [Google Scholar] [CrossRef]
  64. Jiao, C.; Yu, G.; He, N.; Ma, A.; Ge, J.; Hu, Z. Spatial pattern of grassland aboveground biomass and its environmental controls in the Eurasian steppe. J. Geogr. Sci. 2017, 27, 3–22. [Google Scholar] [CrossRef]
  65. Bai, X.; Cheng, J.; Zheng, S.; Zhan, S.; Bai, Y. Ecophysiological responses of Leymus chinensis to nitrogen and phosphorus additions in a typical steppe. Chin. J. Plant Ecol. 2014, 38, 103–115. [Google Scholar] [CrossRef]
  66. Dong, C.; Wang, W.; Liu, H.; Xu, X.; Zeng, H. Temperate grassland shifted from nitrogen to phosphorus limitation induced by degradation and nitrogen deposition: Evidence from soil extracellular enzyme stoichiometry. Ecol. Indic. 2019, 101, 453–464. [Google Scholar] [CrossRef]
Figure 1. Relationships between soil δ15N and δ13C in the upper 5 cm with mean annual precipitation (MAP, a, c) and mean annual temperature (MAT, b, d) at 22 sites along the vegetation transect across Inner Mongolian temperate grasslands.
Forests 11 00433 g001
Figure 2. Relationships between soil δ15N and δ13C in the upper 5 cm with soil organic carbon (SOC, a, d), total nitrogen (N, b, e) and total phosphorus (P, c, f) at 22 sites along the vegetation transect across Inner Mongolian temperate grasslands.
Forests 11 00433 g002
Figure 3. Relationships between soil δ15N and δ13C in the upper 5 cm with microbial biomass carbon (MBC, a, c) and microbial biomass nitrogen (MBN, b, d) as well as with plant belowground biomass (e, f) at 22 sites along the vegetation transect across Inner Mongolian temperate grasslands.
Forests 11 00433 g003
Figure 4. Relationships between soil δ15N and δ13C in the upper 5 cm at 22 sites along a vegetation transect across Inner Mongolian temperate grasslands.
Forests 11 00433 g004
Table 1. Detailed information about climatic, edaphic and biotic factors at 22 sampling sites along the vegetation transect across Inner Mongolian temperate grasslands.
SitetypelatitudelongitudeAltitude (m)MAP (mm)MAT (°C)g kg−1mg kg−1Biomass (g m−2)
SOCTotal NTotal PMBCMBNsoil pHAbovegroundBelowgroundδ13Cδ15N
1Temperate meadow steppe50°12′119°43′550339.13.0 36.10 ± 0.793.36 ± 0.080.9 422.9 ± 89.0135.7 ± 29.76.9 26.9 ± 3.4785.6 ± 64.8-25.3 ± 0.16.3 ± 0.6
2Temperate meadow steppe49°12′120°22′590394.93.5 31.30 ± 1.162.82 ± 0.130.5 506.2 ± 56.8244.5 ± 115.97.3 55.7 ± 15.5388.2 ± 20.2-26.8 ± 0.15.6 ± 0.2
3Temperate meadow steppe49°17′119°56′590337.73.2 29.77 ± 0.122.76 ± 0.110.5 467.8 ± 41.7154.4 ± 21.137.4 ± 22.9537.7 ± 92.9-25.1 ± 0.25.3 ± 0.4
4Temperate meadow steppe49°9′119°50′500337.73.3 34.64 ± 0.892.96 ± 0.090.6 384.3 ± 52.9145.7 ± 20.57.1 42.6 ± 52.0287.3 ± 97.1-25.7 ± 0.05.9 ± 0.2
5Temperate meadow steppe49°33′″117°19′683281.72.5 17.84 ± 1.551.88 ± 0.150.5 353.4 ± 47.7182.5 ± 51.58.0 146.6 ± 42.0439.6 ± 117.8-24.2 ± 0.33.8 ± 0.3
6Temperate meadow steppe48°22′122°17′450517.54.4 53.36 ± 0.664.69 ± 0.100.8 660.7 ± 50.2392.4 ± 63.77.2 66.7 ± 14.0680.7 ± 170.6-27.1 ± 0.13.8 ± 0.6
7Temperate steppe43°96′115°86′1000282.62.4 12.60 ± 0.321.37 ± 0.030.4 249.4 ± 57.3105.8 ± 14.37.5 125.9 ± 63.7268.4 ± 183.3-23.0 ± 0.43.9 ± 0.6
8Temperate steppe43°52′119°22′644349.53.1 19.57 ± 0.991.90 ± 0.110.4 273.4 ± 19.695.4 ± 14.07.3 20.0 ± 0.9147.6 ± 72.0-22.7 ± 0.42.0 ± 0.5
9Temperate steppe43°15′118°09′749377.83.0 2.48 ± 0.450.27 ± 0.040.2 95.9 ± 63.068.1 ± 50.47.3 70.0 ± 16.0215.3 ± 168.3-23.8 ± 0.6-3.5 ± 3.7
10Temperate steppe43°15′117°11′1296399.13.3 18.06 ± 1.301.85 ± 0.110.3 333.7 ± 55.2180.1 ± 21.77.2 62.2 ± 12.5386.5 ± 71.6-24.6 ± 0.62.1 ± 0.7
11Temperate steppe43°43′112°50′993158.81.5 3.21 ± 0.190.36 ± 0.030.5 147.7 ± 10.565.4 ± 16.48.1 25.4 ± 4.0143.0 ± 132.0-21.4 ± 0.70.0 ± 2.1
12Temperate steppe43°12′116°09′1298335.72.8 7.64 ± 0.540.72 ± 0.030.3 189.4 ± 13.679.5 ± 10.67.8 31.8 ± 5.1372.0 ± 62.2-24.8 ± 0.62.6 ± 1.3
13Temperate steppe43°19′119°35′453349.53.0 6.12 ± 0.090.73 ± 0.030.1 138.5 ± 35.0116.5 ± 24.88.1 11.0 ± 2.3345.8 ± 196.8-21.2 ± 0.30.9 ± 0.9
14Temperate steppe42°32′118°53′794408.33.1 9.23 ± 0.911.02 ± 0.090.2 157.1 ± 40.153.2 ± 12.07.9 77.2 ± 46.3407.1 ± 206.4-22.9 ± 0.61.3 ± 0.7
15Temperate steppe41°20′112°51′1760373.72.6 10.21 ± 0.501.07 ± 0.040.7 218.9 ± 54.7106.7 ± 20.18.1 35.5 ± 9.1324.1 ± 38.5-24.6 ± 0.35.0 ± 1.4
16Temperate desert43°21′111°52′960154.51.2 1.78 ± 0.120.20 ± 0.020.3 94.0 ± 26.355.4 ± 26.78.1 7.8 ± 3.578.0 ± 37.9-22.6 ± 0.7-1.7 ± 2.4
17Temperate desert42°56′110°50′1071200.31.3 4.03 ± 0.400.55 ± 0.050.4 149.4 ± 22.571.2 ± 13.58.1 6.5 ± 5.7106.4 ± 95.5-21.5 ± 0.81.9 ± 1.8
18Temperate desert42°25′109°49′1158188.21.4 3.95 ± 0.580.56 ± 0.070.3 158.1 ± 10.8102.0 ± 52.38.3 19.6 ± 8.8118.1 ± 64.8-22.3 ± 0.43.1 ± 1.1
19Temperate desert41°54′108°42′1533180.11.5 5.65 ± 0.240.67 ± 0.040.4 166.2 ± 15.484.1 ± 13.48.0 11.6 ± 3.2179.0 ± 187.0-23.6 ± 0.33.4 ± 1.5
20Temperate desert40°01′110°03′1339347.12.8 2.88 ± 0.100.26 ± 0.020.4 76.2 ± 13.846.5 ± 16.08.3 31.5 ± 9.2205.8 ± 92.0-23.9 ± 0.60.4 ± 1.7
21Temperate desert39°14′107°16′1281205.82.0 5.62 ± 0.550.51 ± 0.040.3 155.7 ± 14.376.8 ± 18.28.1 22.6 ± 5.458.5 ± 27.3-22.7 ± 0.22.6 ± 0.9
22Temperate desert38°44′107°45′1345267.62.4 1.97 ± 0.160.17 ± 0.020.4 71.8 ± 22.646.5 ± 24.88.7 87.4 ± 85.150.9 ± 44.9-24.1 ± 0.60.3 ± 3.4
The values are means ± standard errors of 4 replicates. MAP = mean annual precipitation, MAT = mean annual temperature, SOC = soil organic carbon, N = nitrogen, P = phosphorous, MBC = microbial biomass C, MBN = microbial biomass N.
Table 2. Pearson’s correlation matrix for raw input variables in explaining change in soil 15N and 13C along the vegetation transect across Inner Mongolian temperate grasslands. The asterisks indicate a significant relationship between variables at P < 0.05.
MAPMATSOCTotal NTotal PpHMBCMBNBB
MAP1.000
MAT0.959 *1.000
SOC0.629 *0.742 *1.000
Total N0.627 *0.732 *0.996 *1.000
Total P0.2730.3200.721 *0.716 *1.000
pH−0.584 *−0.676 *−0.780 *−0.788−0.4021.000
MBC0.580 *0.688 *0.966 *0.973 *0.677 *−0.742 *1.000
MBN0.626 *0.675 *0.867 *0.870 *0.575 *−0.579 *0.919 *1.000
BB0.677 *0.697 *0.781 *0.802 *0.602 *−0.670 *0.771 *0.677 *1.000
MAP = mean annual precipitation, MAT = mean annual temperature, SOC = soil organic carbon, N = nitrogen, P = phosphorous, MBC = microbial biomass C, MBN = microbial biomass N, BB = belowground biomass.
Table 3. Relative importance and regression coefficients (given in parenthesis) of microbial biomass carbon (MBC), total nitrogen (N), mean annual precipitation (MAP), total phosphorous (P), soil organic carbon (SOC), and mean annual temperature (MAT) for determining soil 15N and 13C values. Values were derived through a model averaging approach. Factors with parameter values highlighted in bold significantly affected soil 15N and 13C (P < 0.05).
MBCTotal NMAPTotal PSOCMAT
Soil 15N0.52 (0.012)0.21 (1.398)0.20 (−0.007)0.16 (8.559)0.12 (0.119)
Soil 13C0.29 (−0.006)0.29 (−0.005)0.71 (−3.420)0.71 (−1.152)

